
Large Stress-Gradient Creep Tests and Model Establishment for Red Sandstone Treated at High Temperatures

Abstract
:1. Introduction
2. Materials and Test Methods
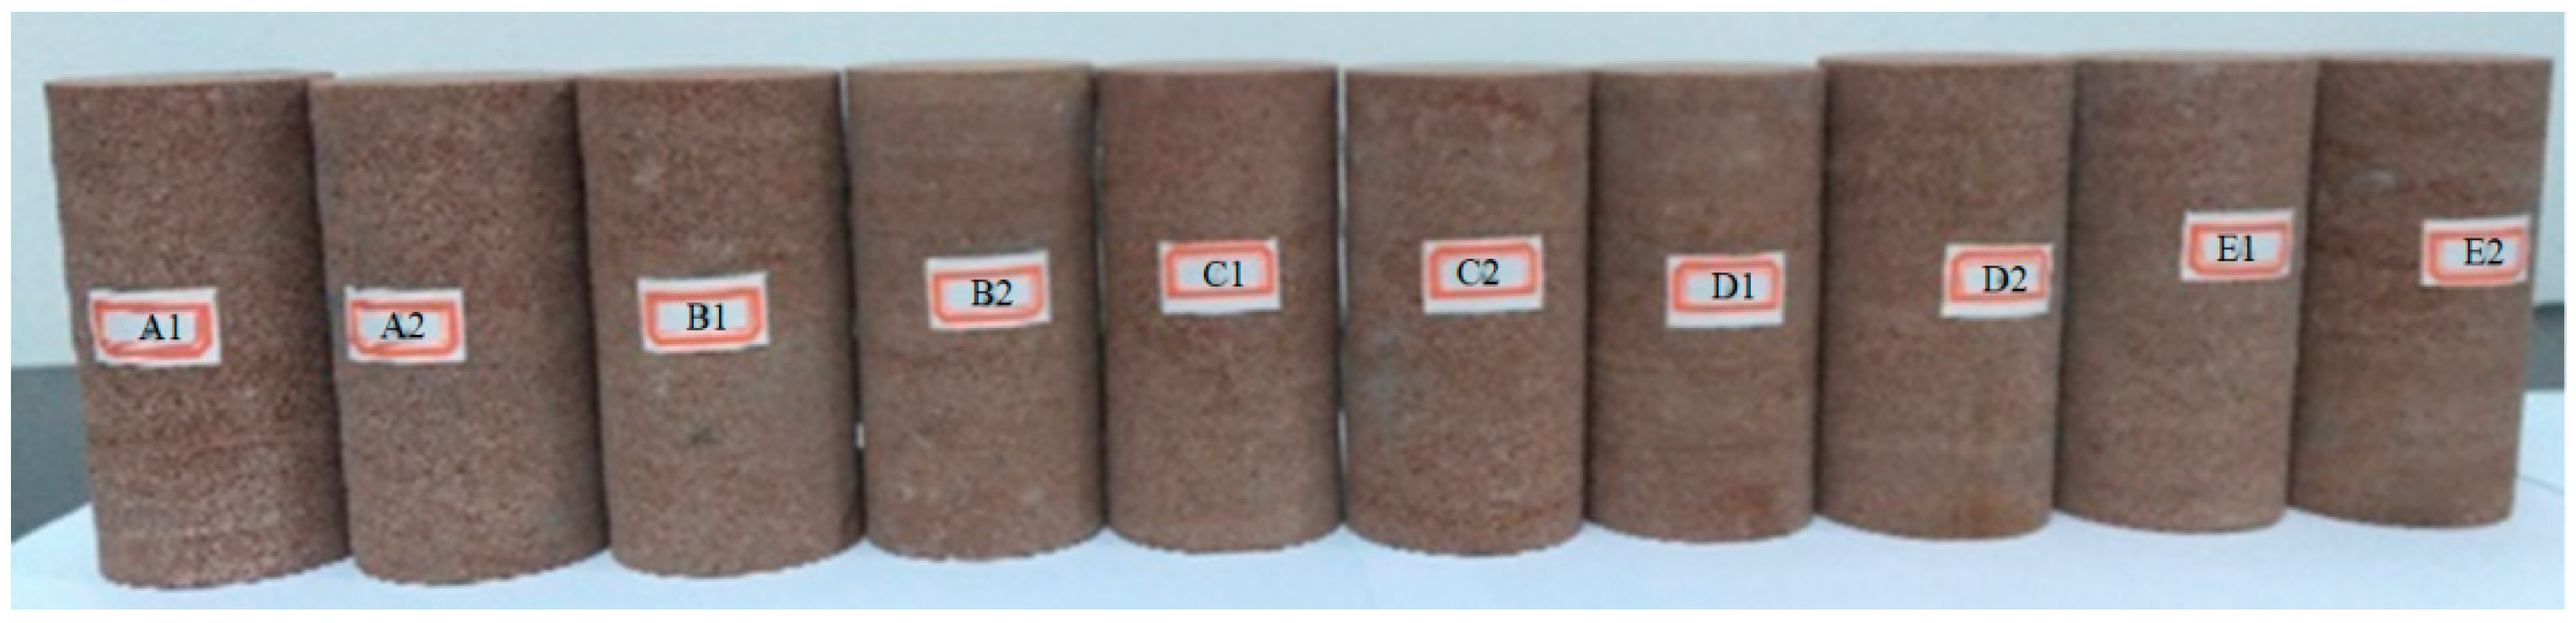
2.1. Sample Preparation
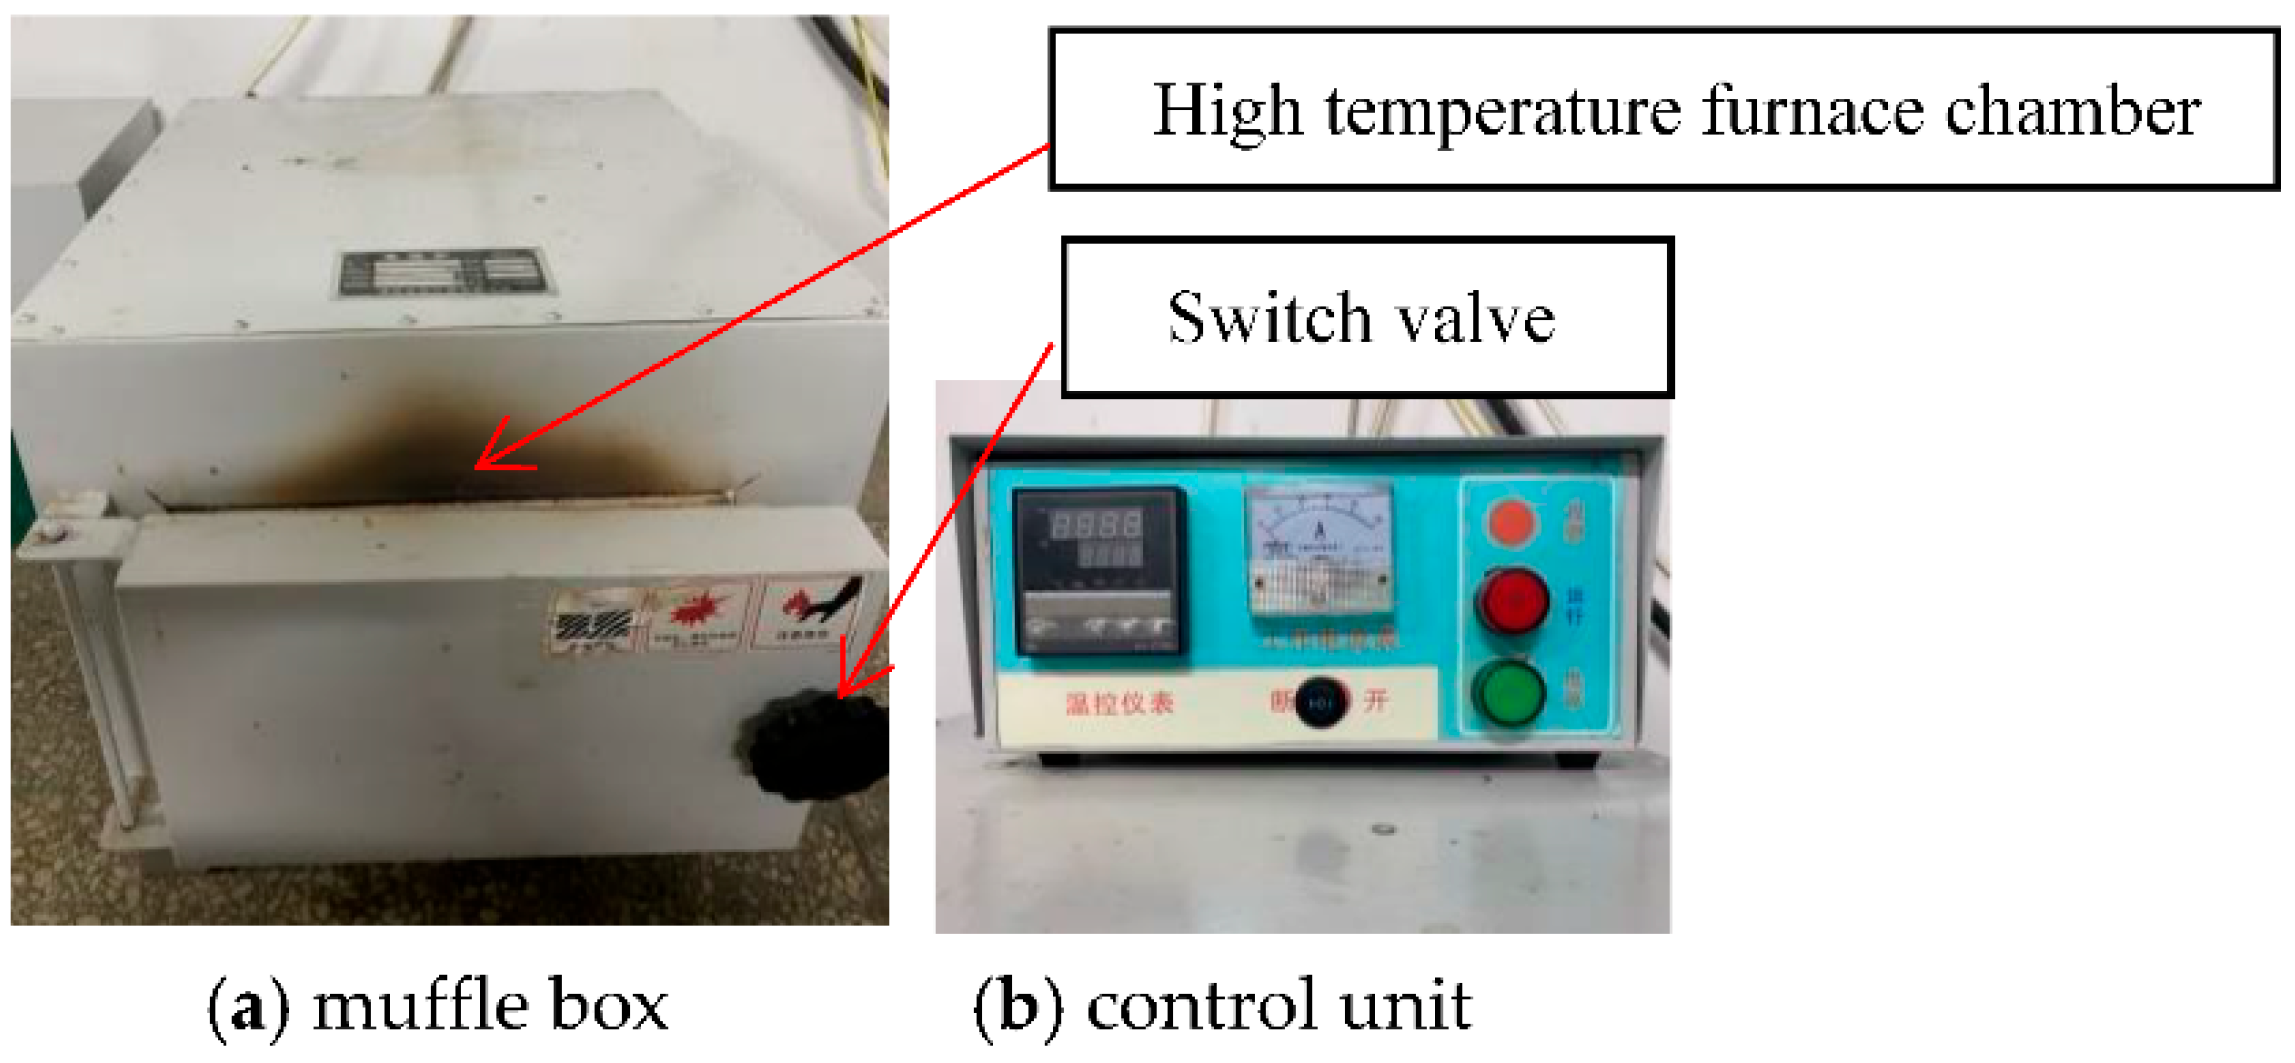
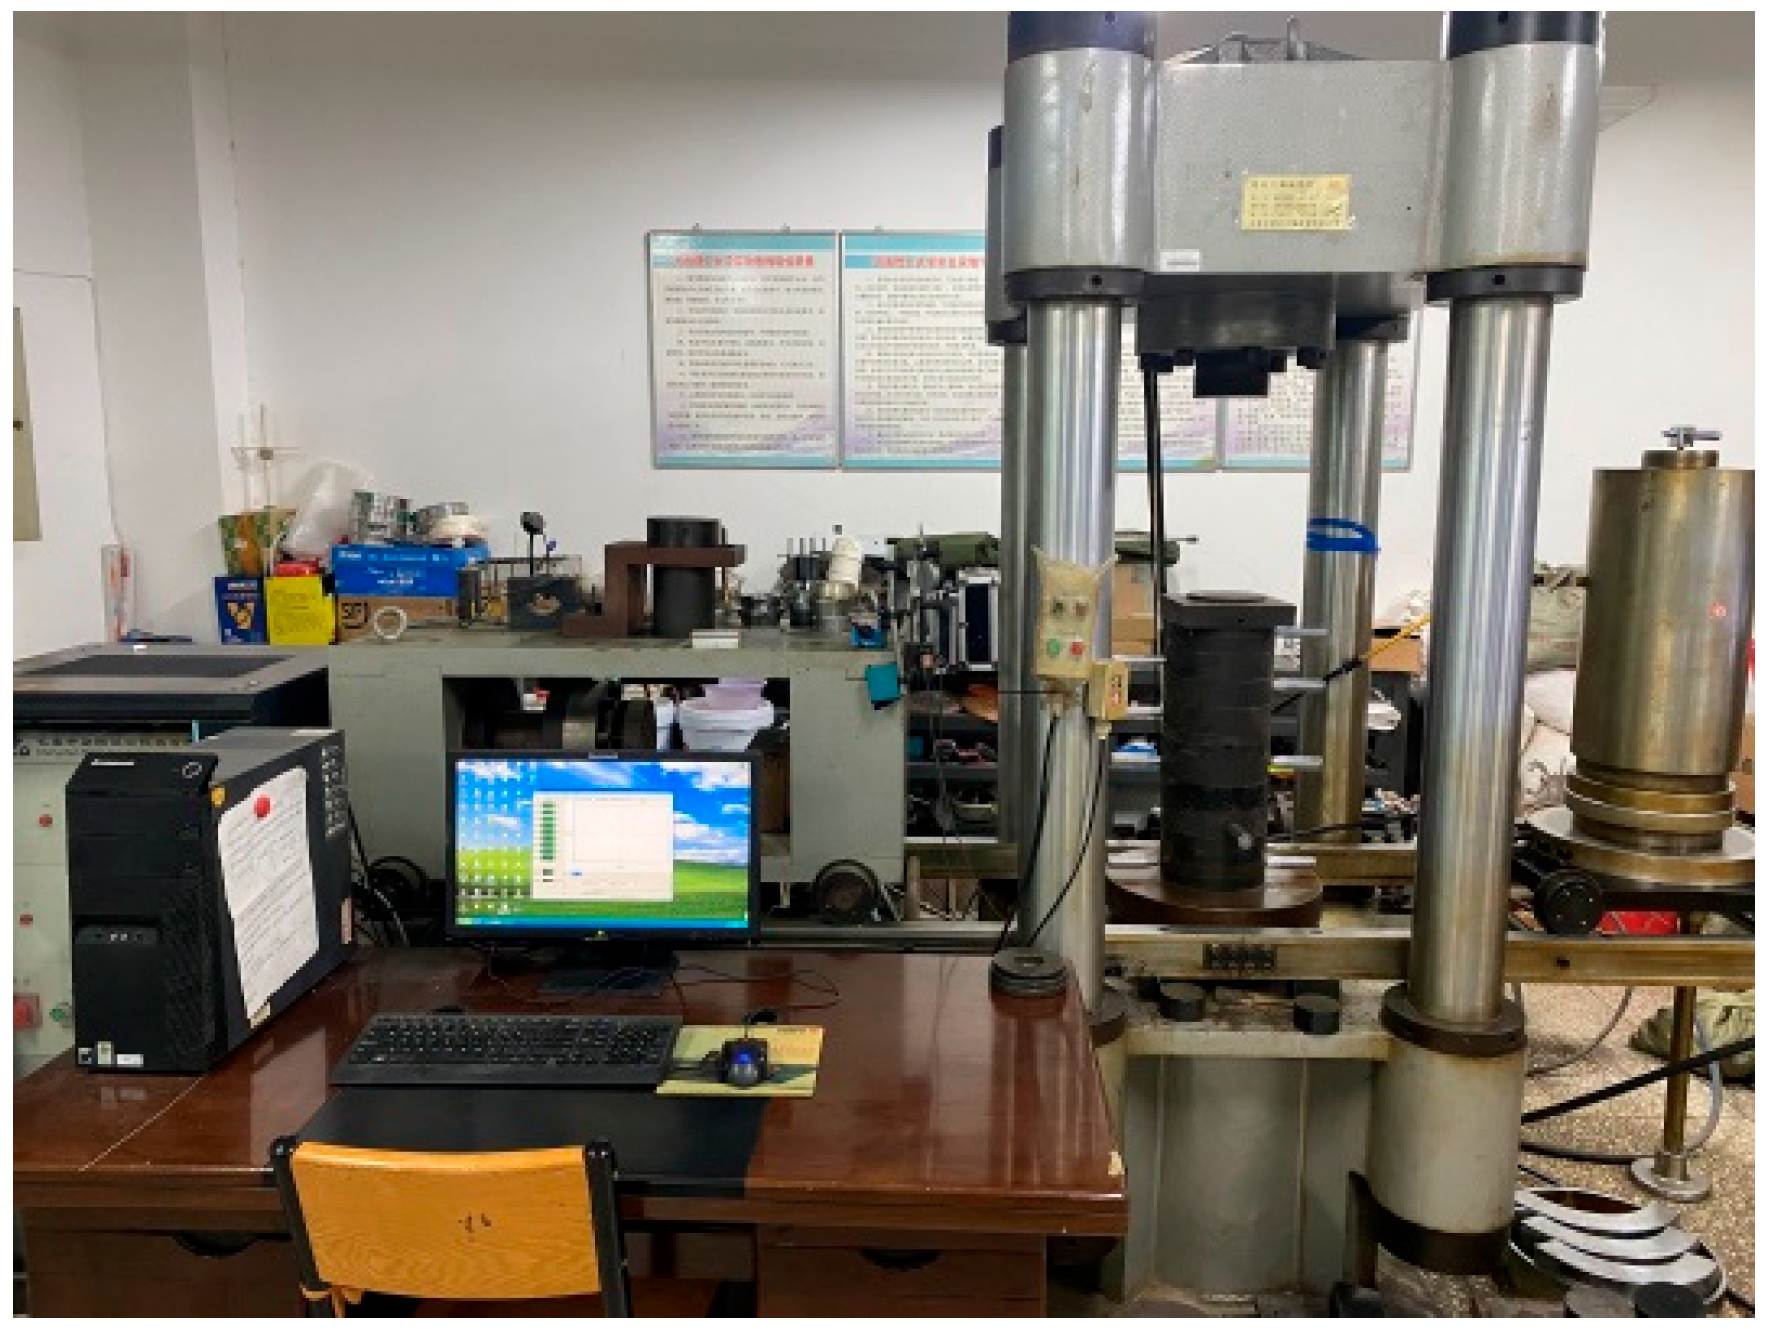
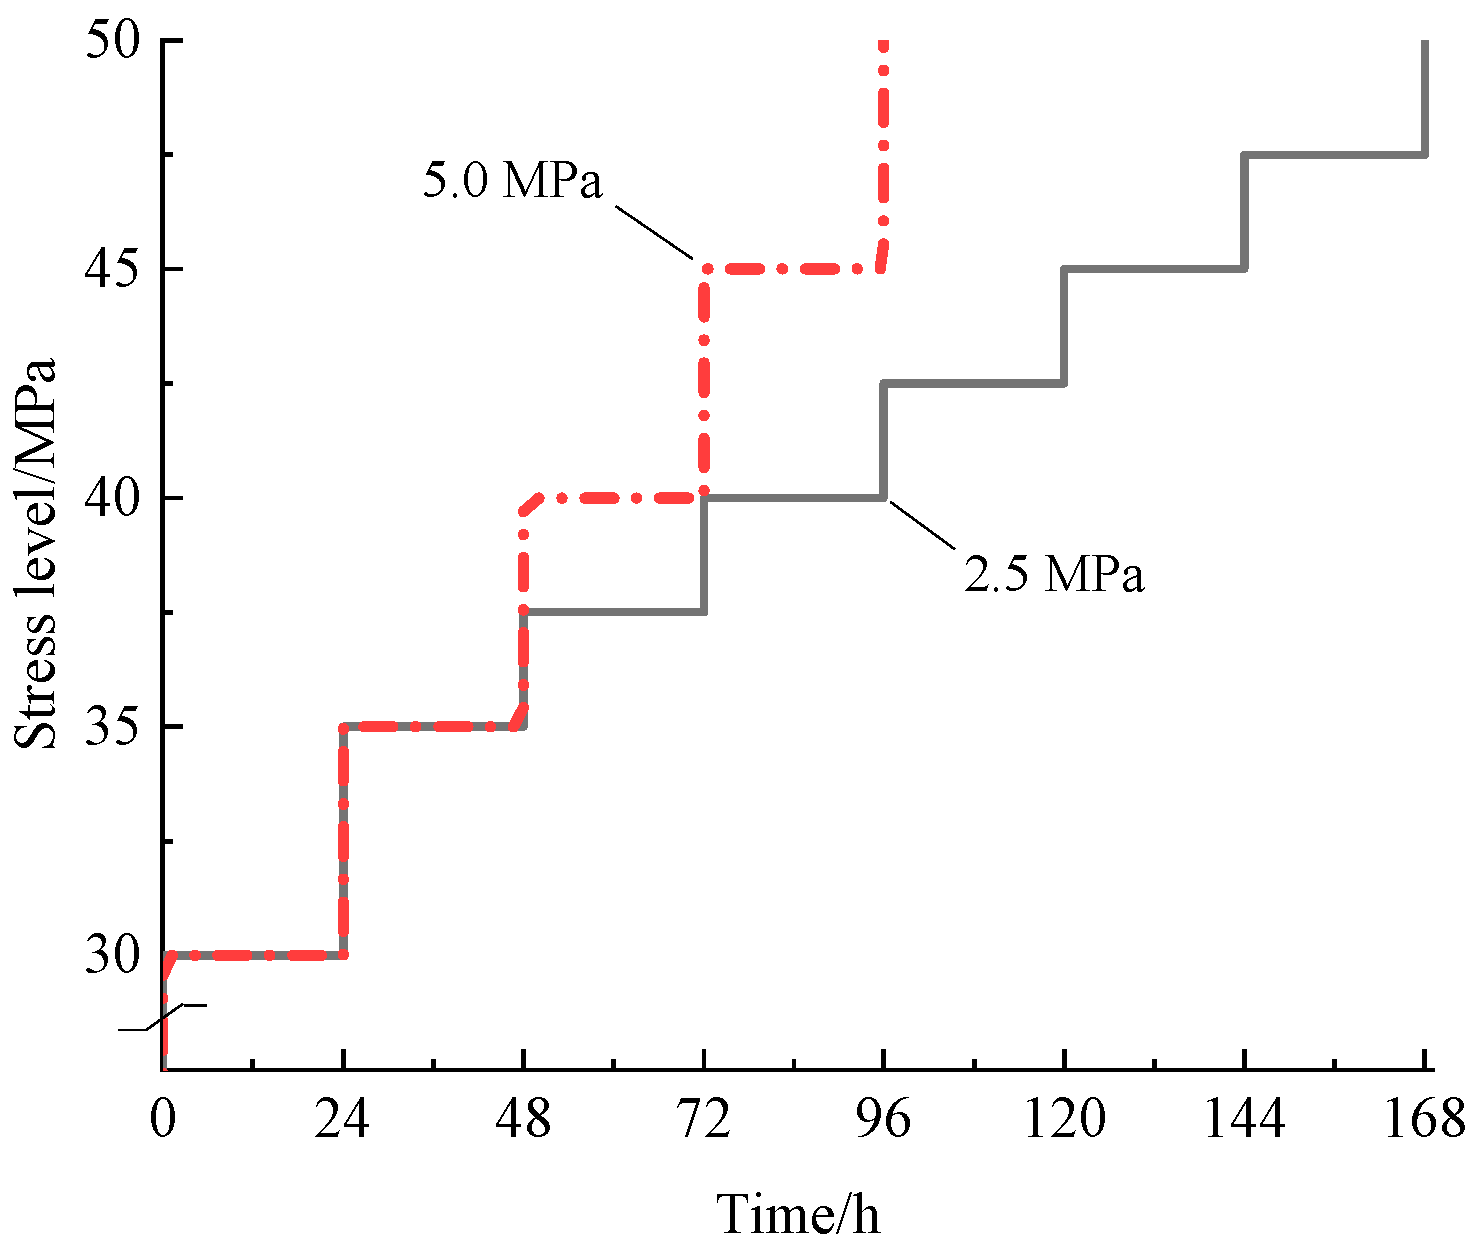
2.2. Test Methods
3. Results and Discussion
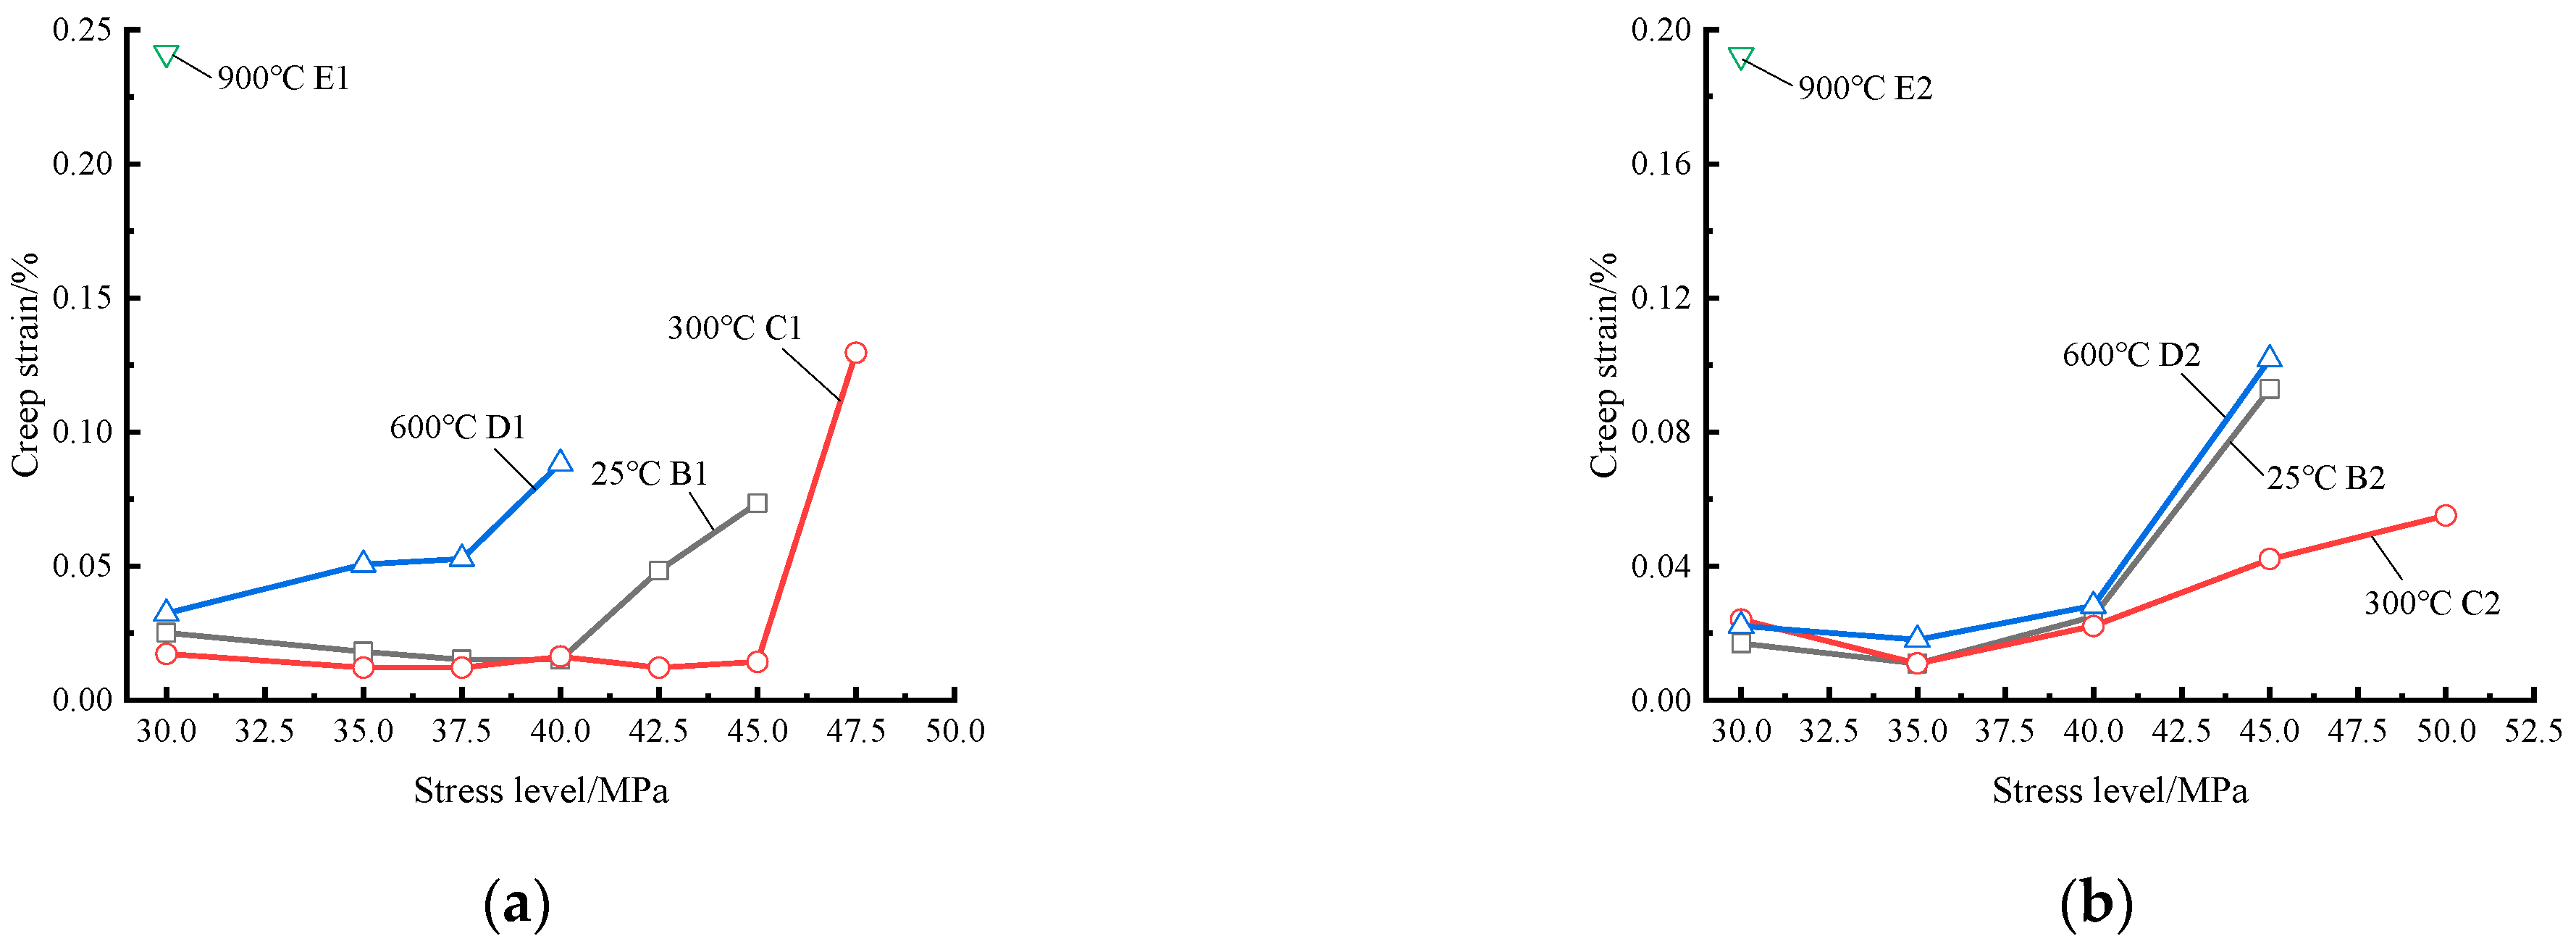
3.1. Relationships of the Stress with the Instantaneous Strain and Creep Strain
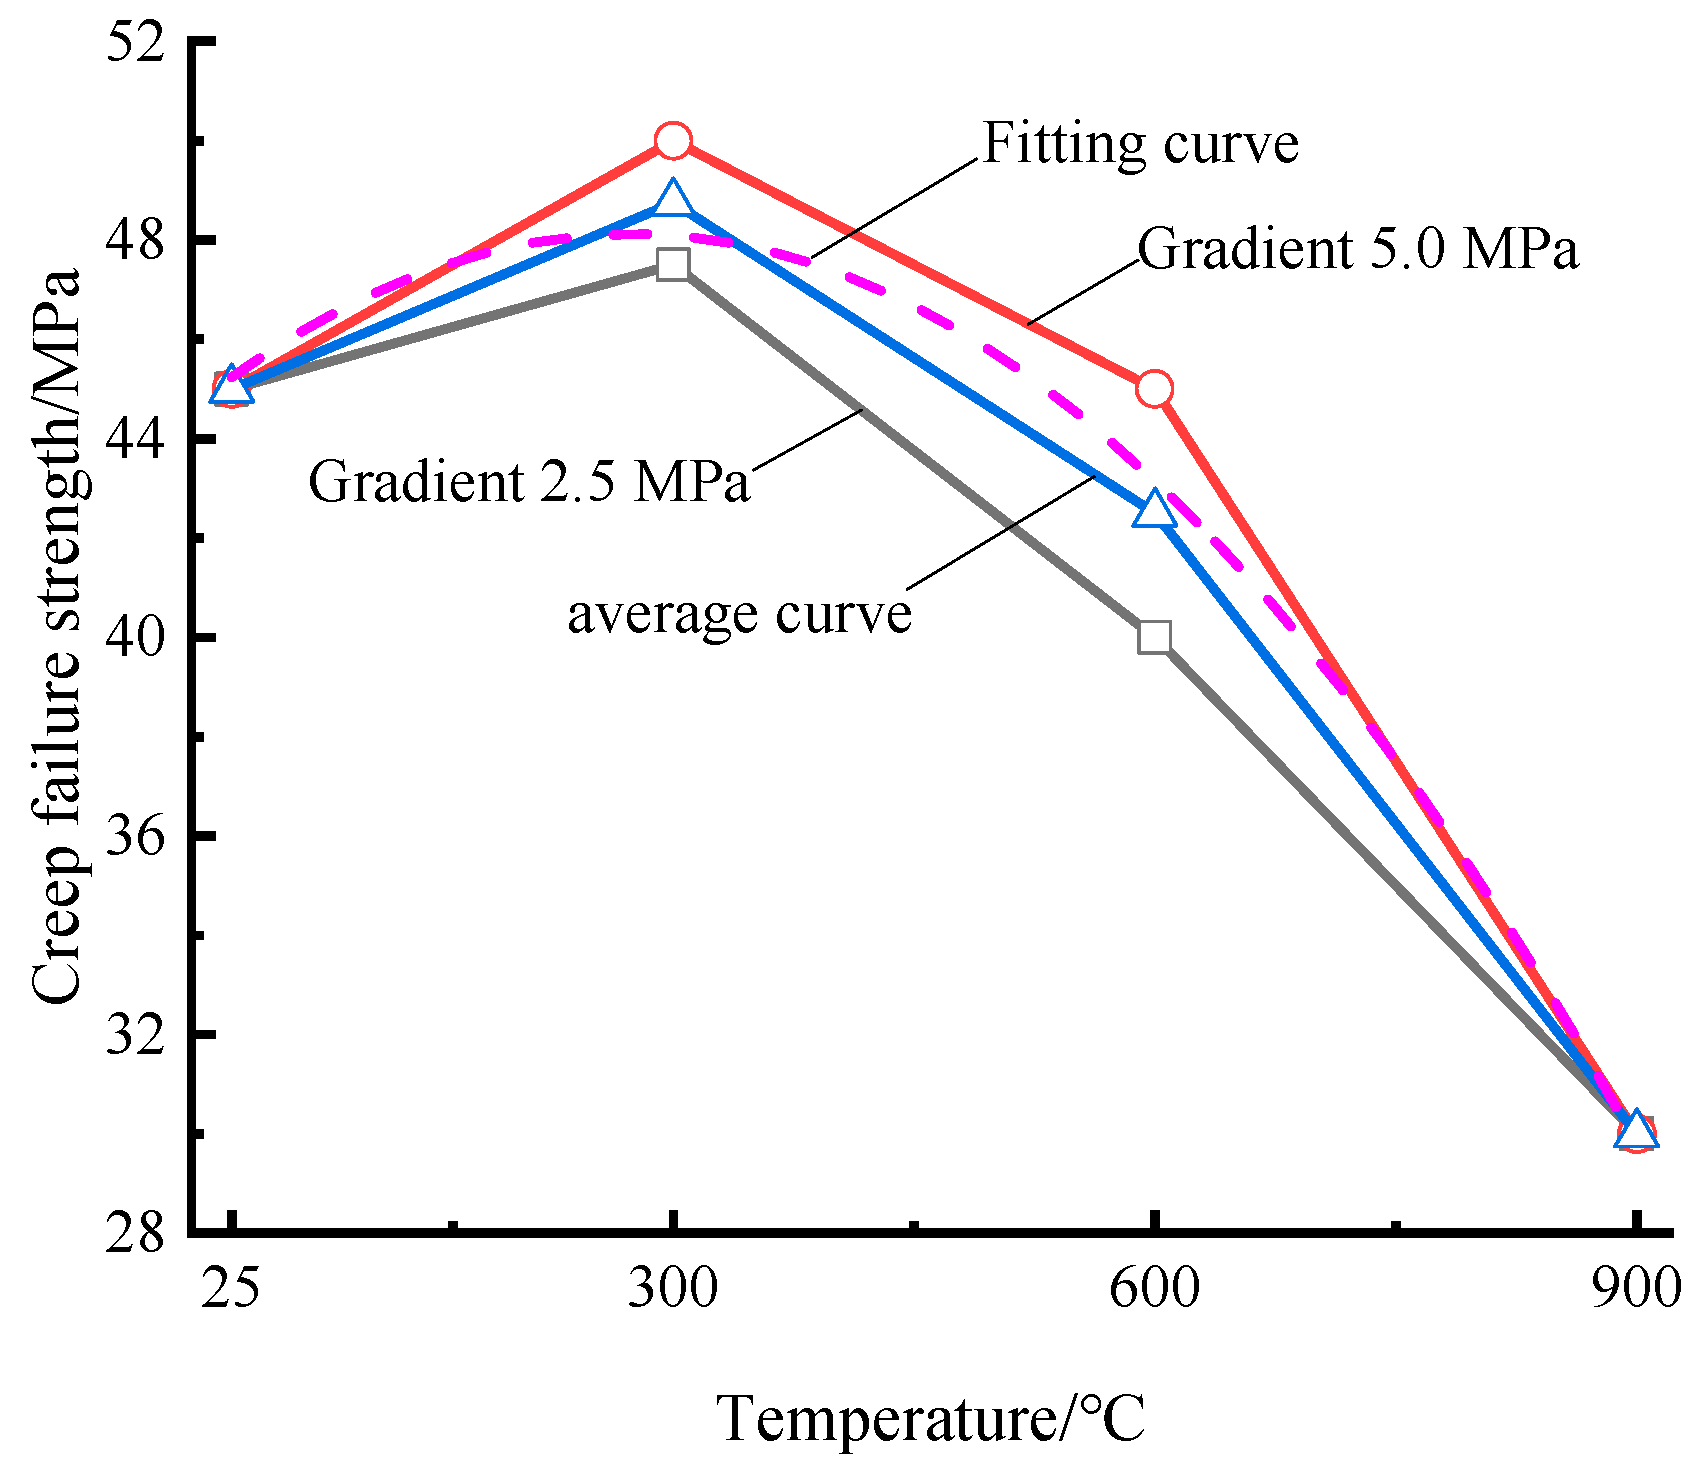
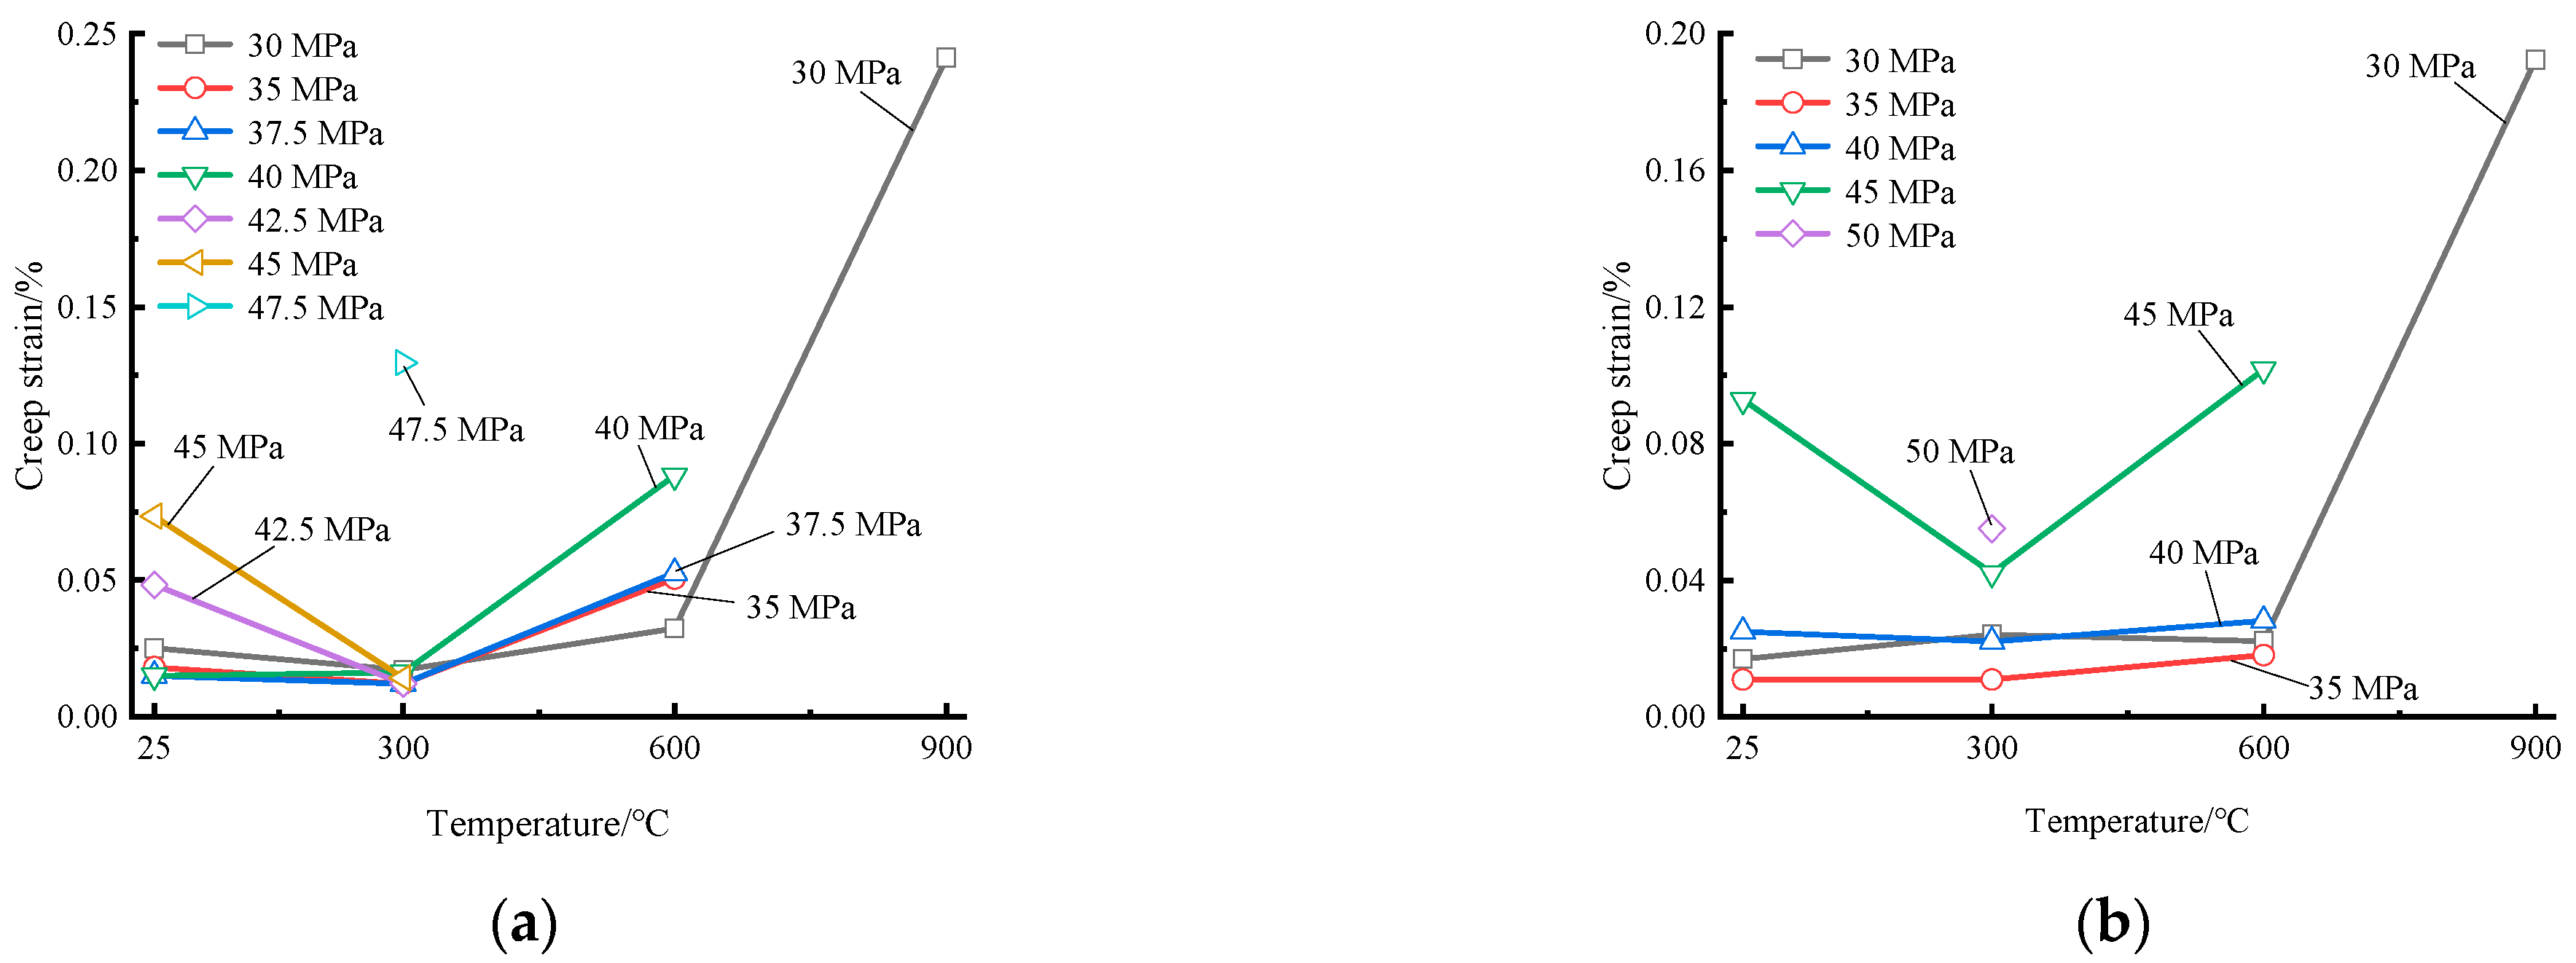
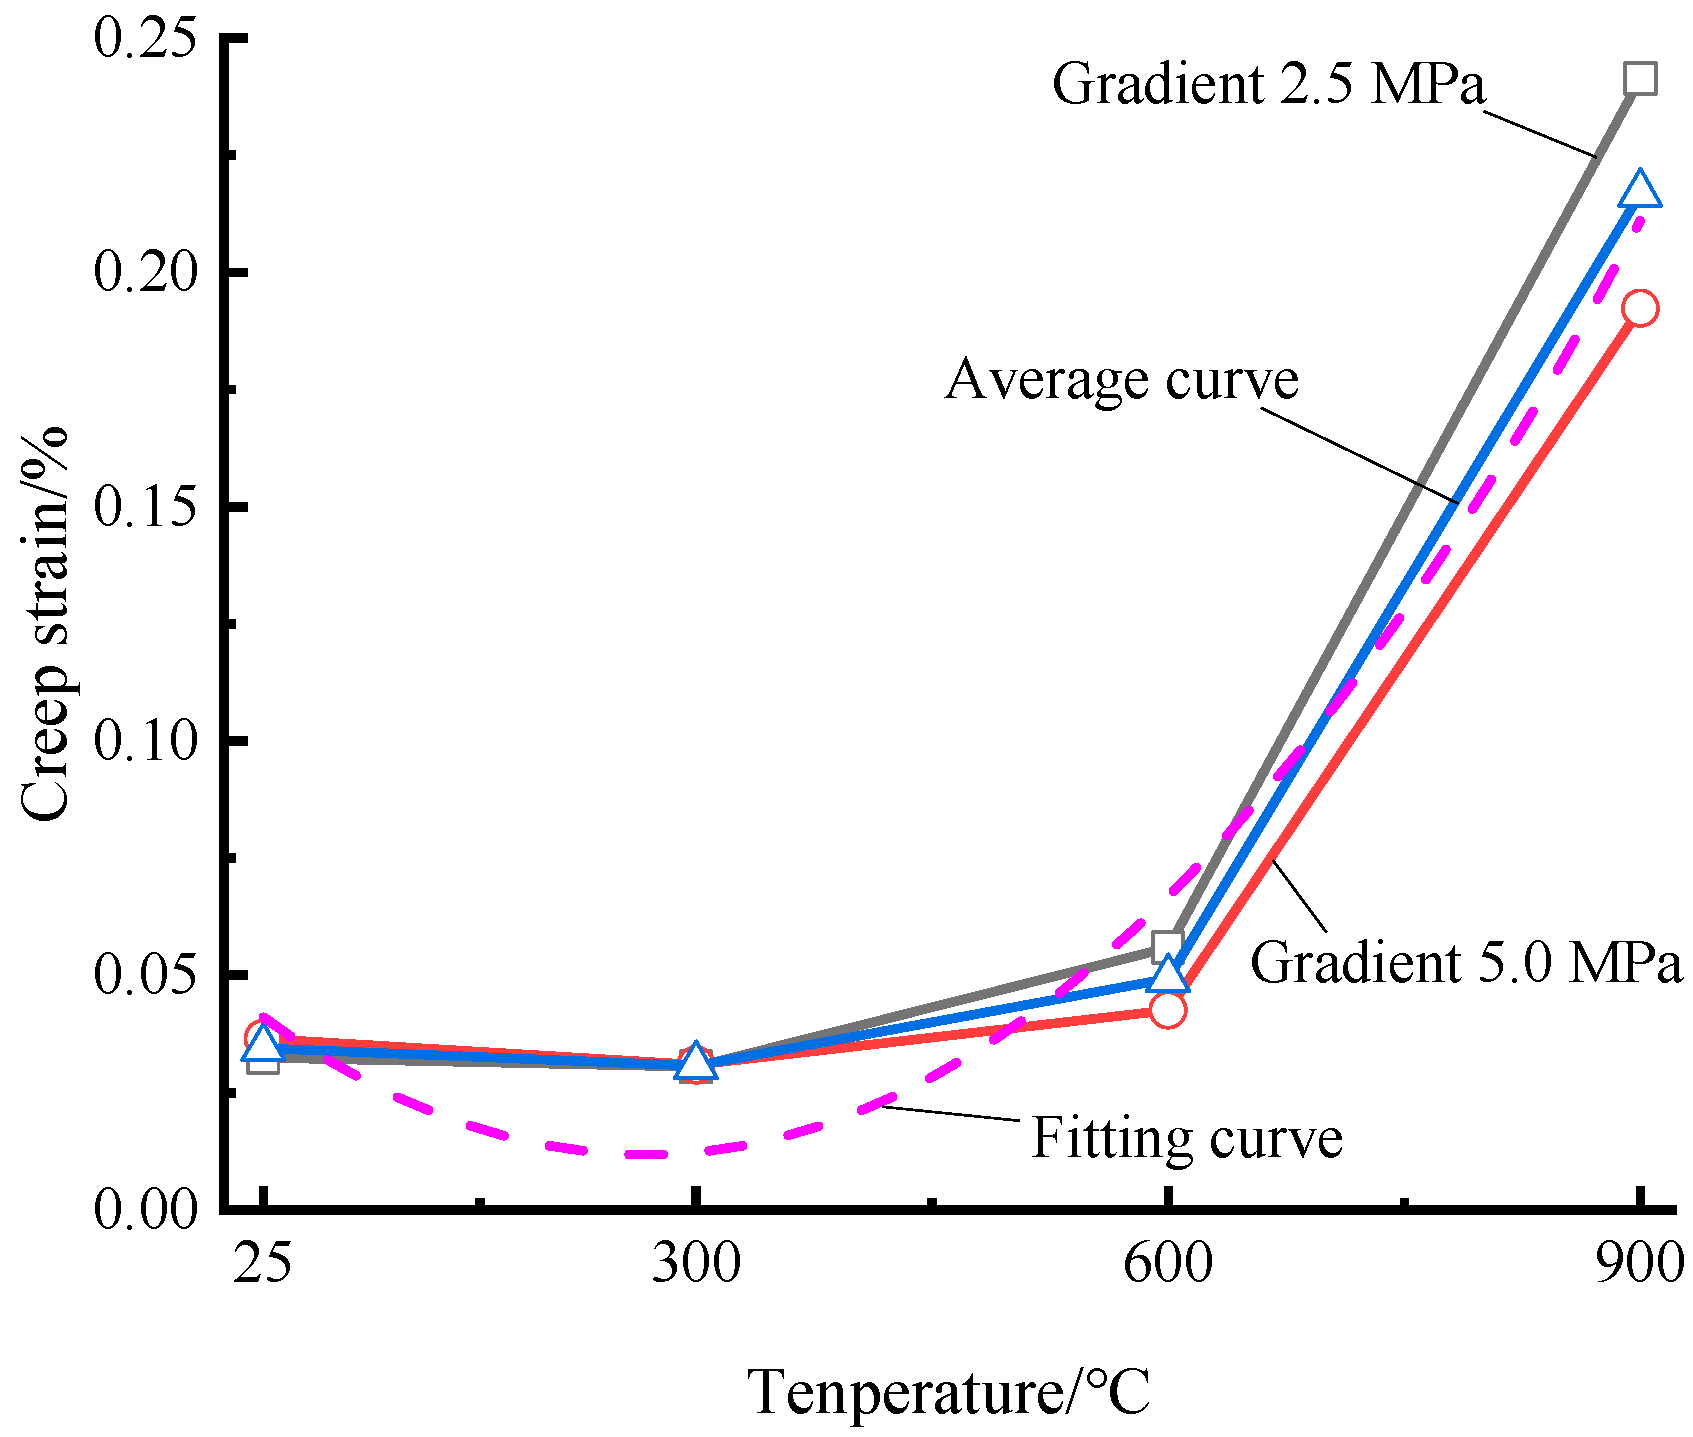
3.2. Relationships of Temperature with Creep Failure Strength and Creep Strain
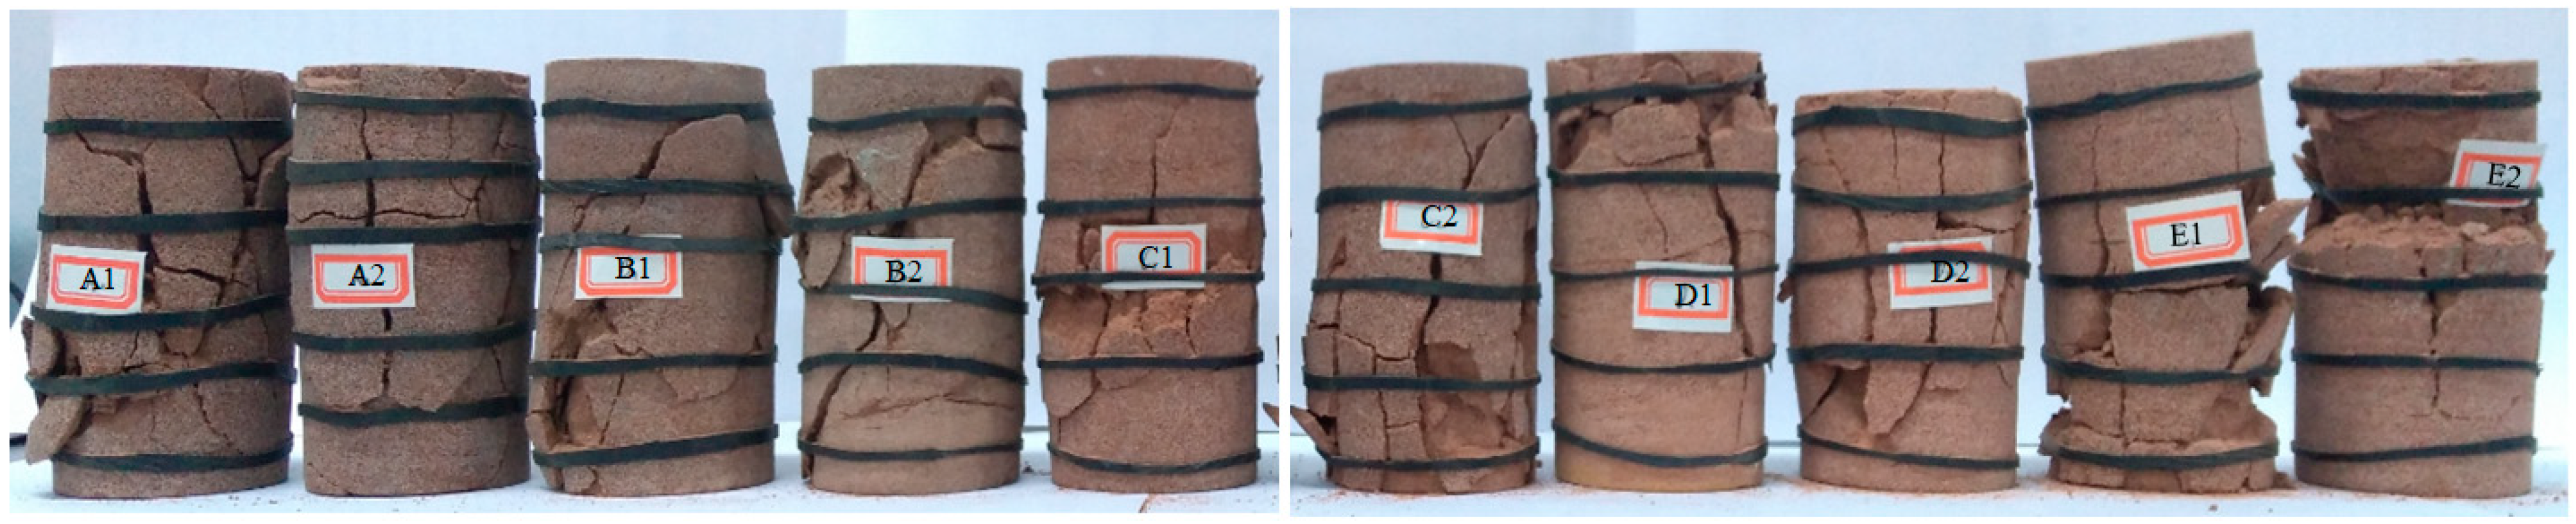
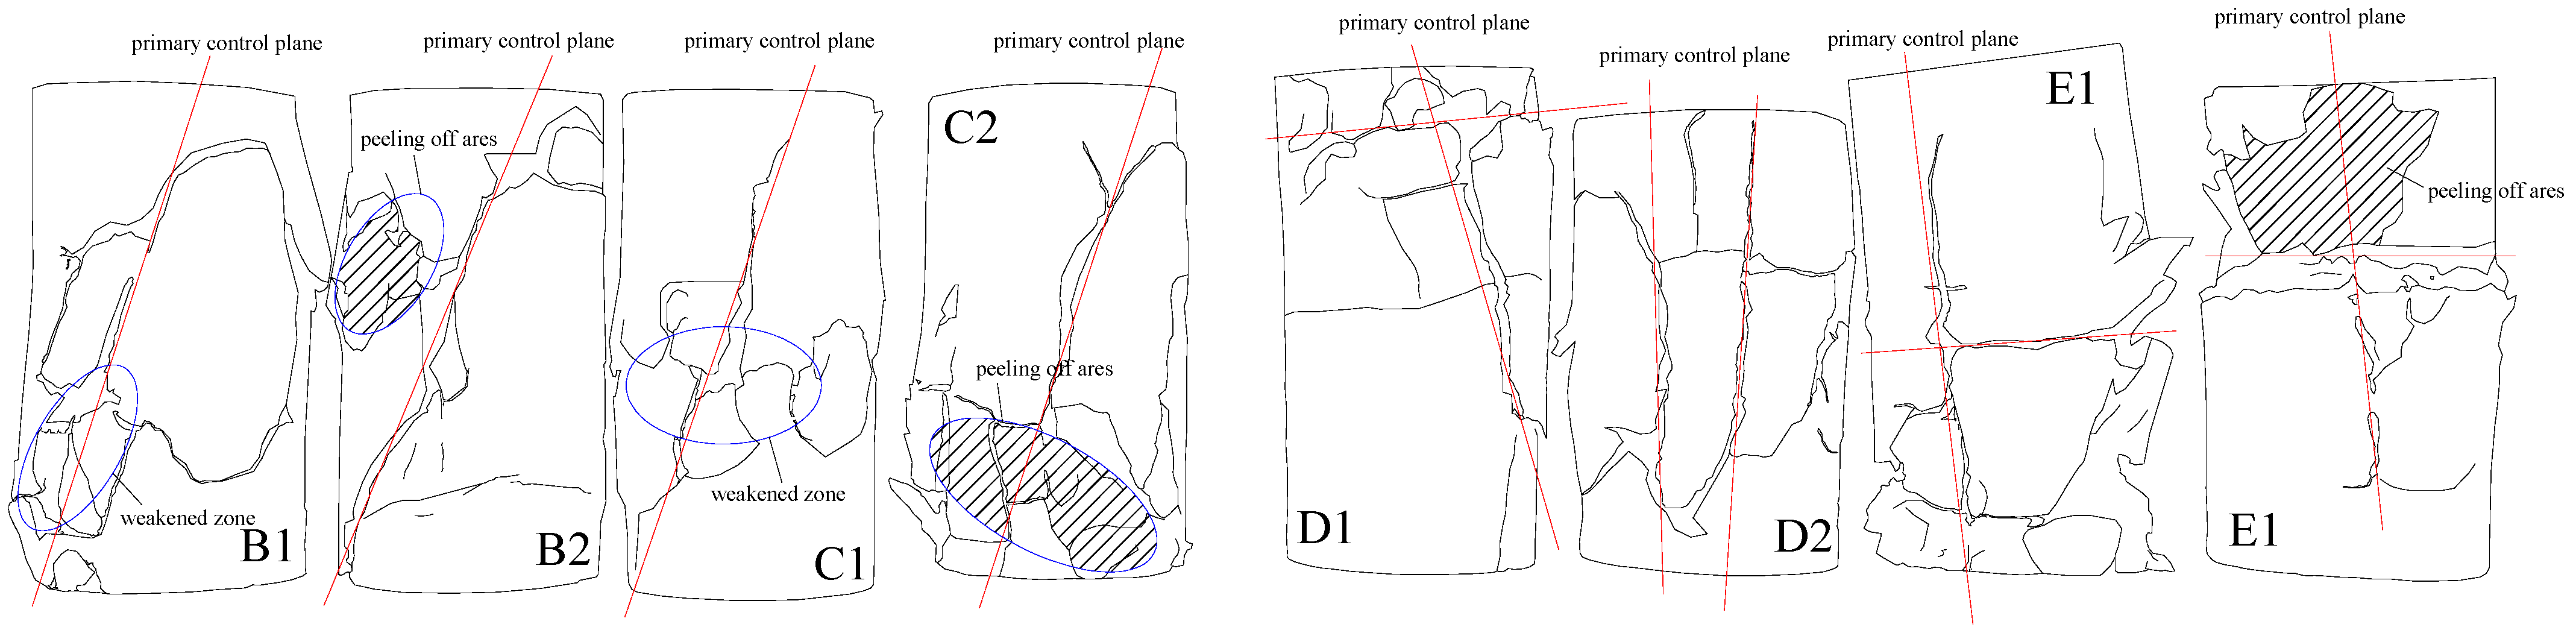
3.3. Creep Failure Patterns
4. Failure Mechanism and Constitutive Model
4.1. Creep Failure Mode and Mechanism
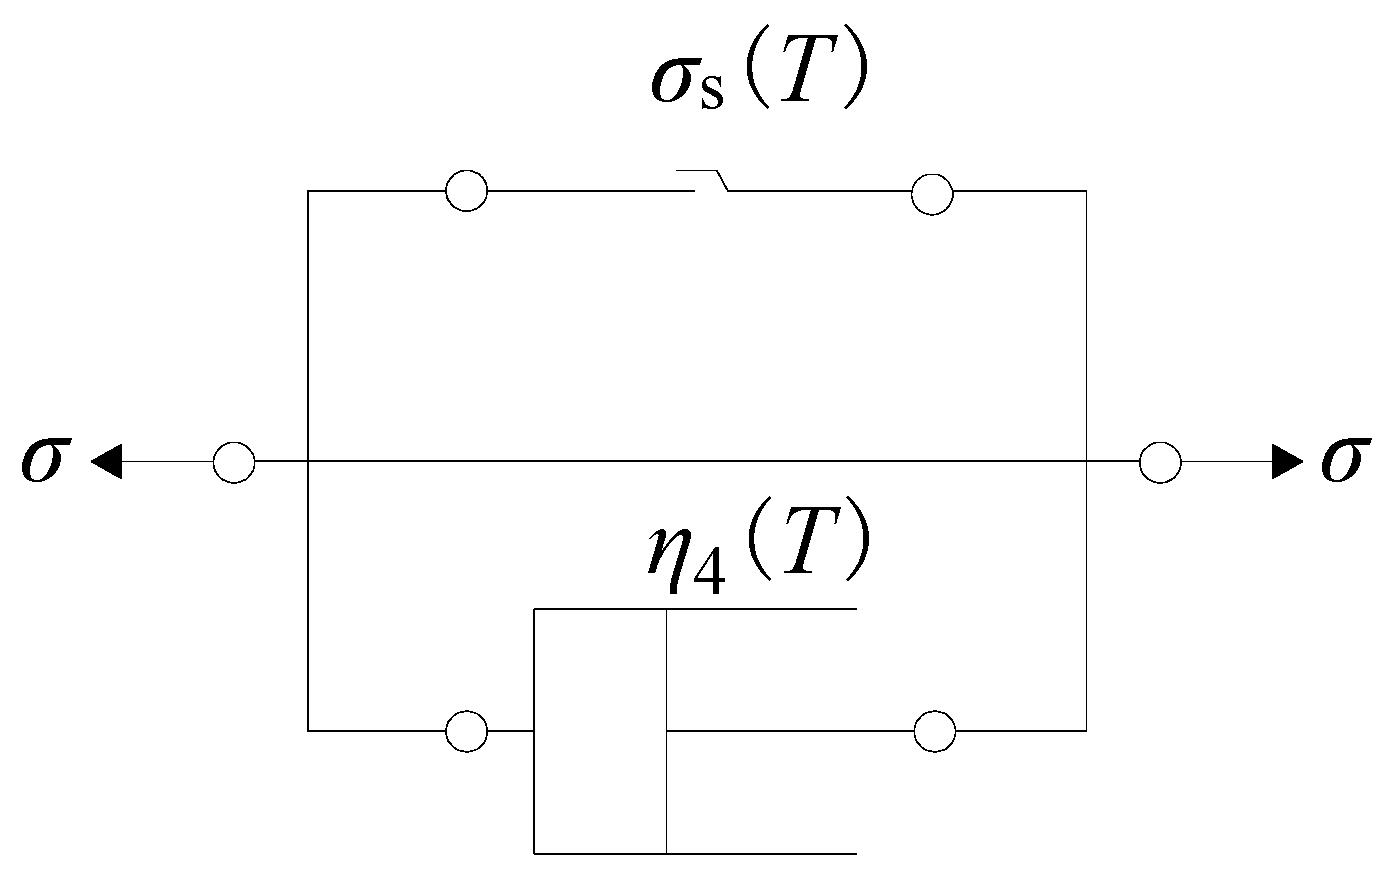
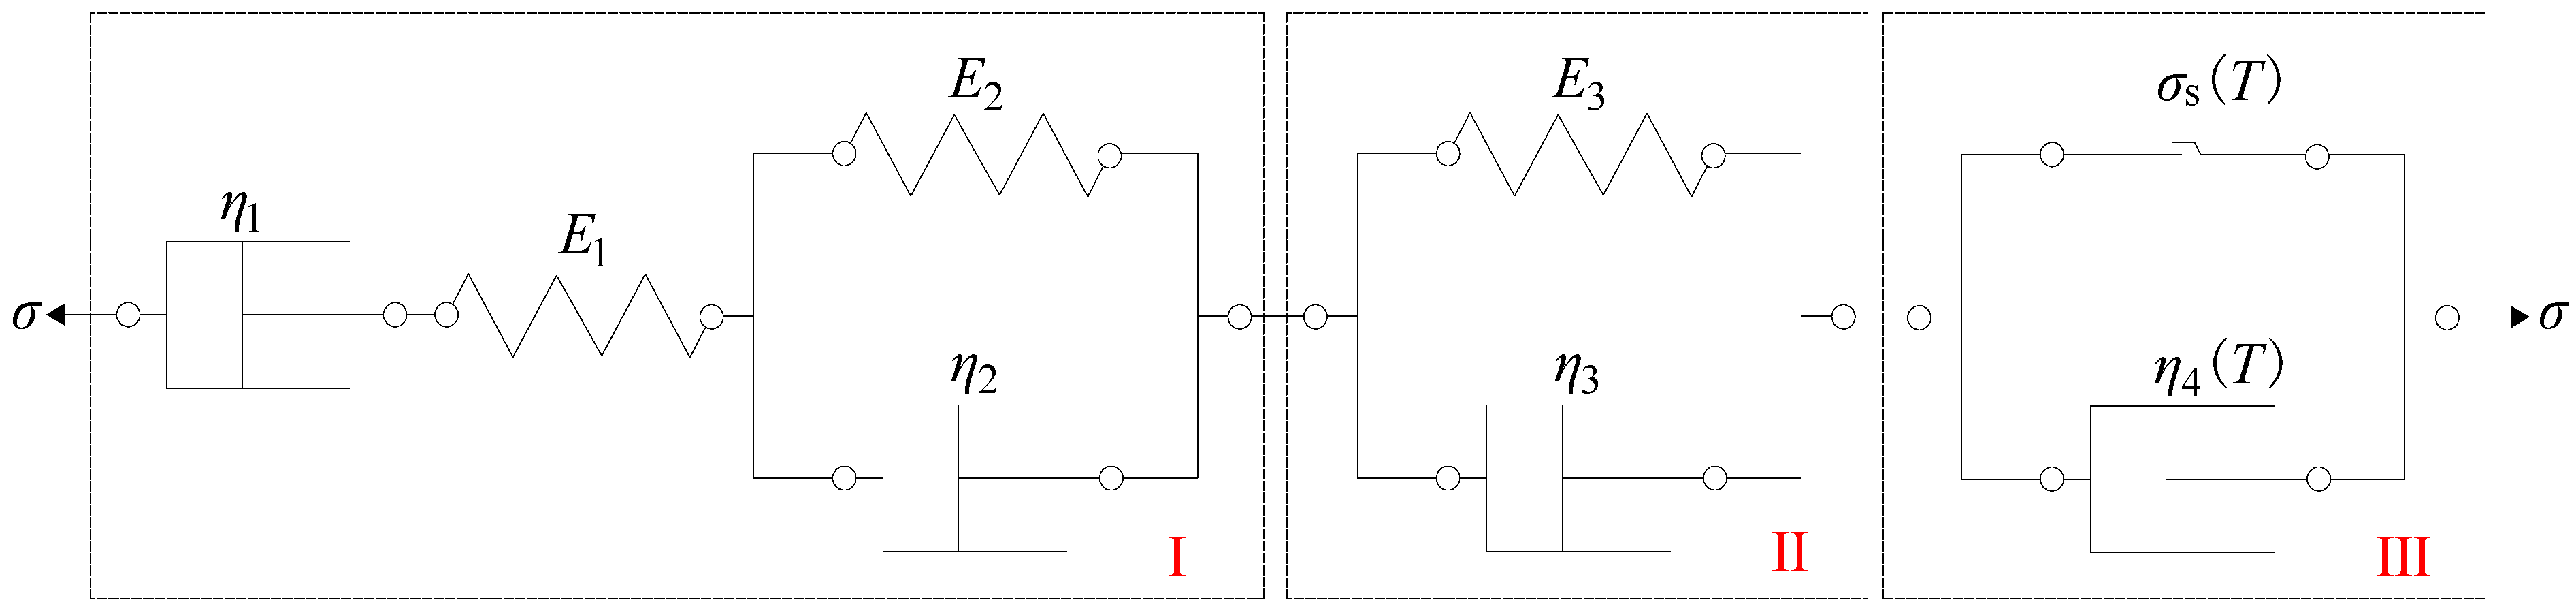
4.2. Elements with Creep Damage Considering the Temperature Effect
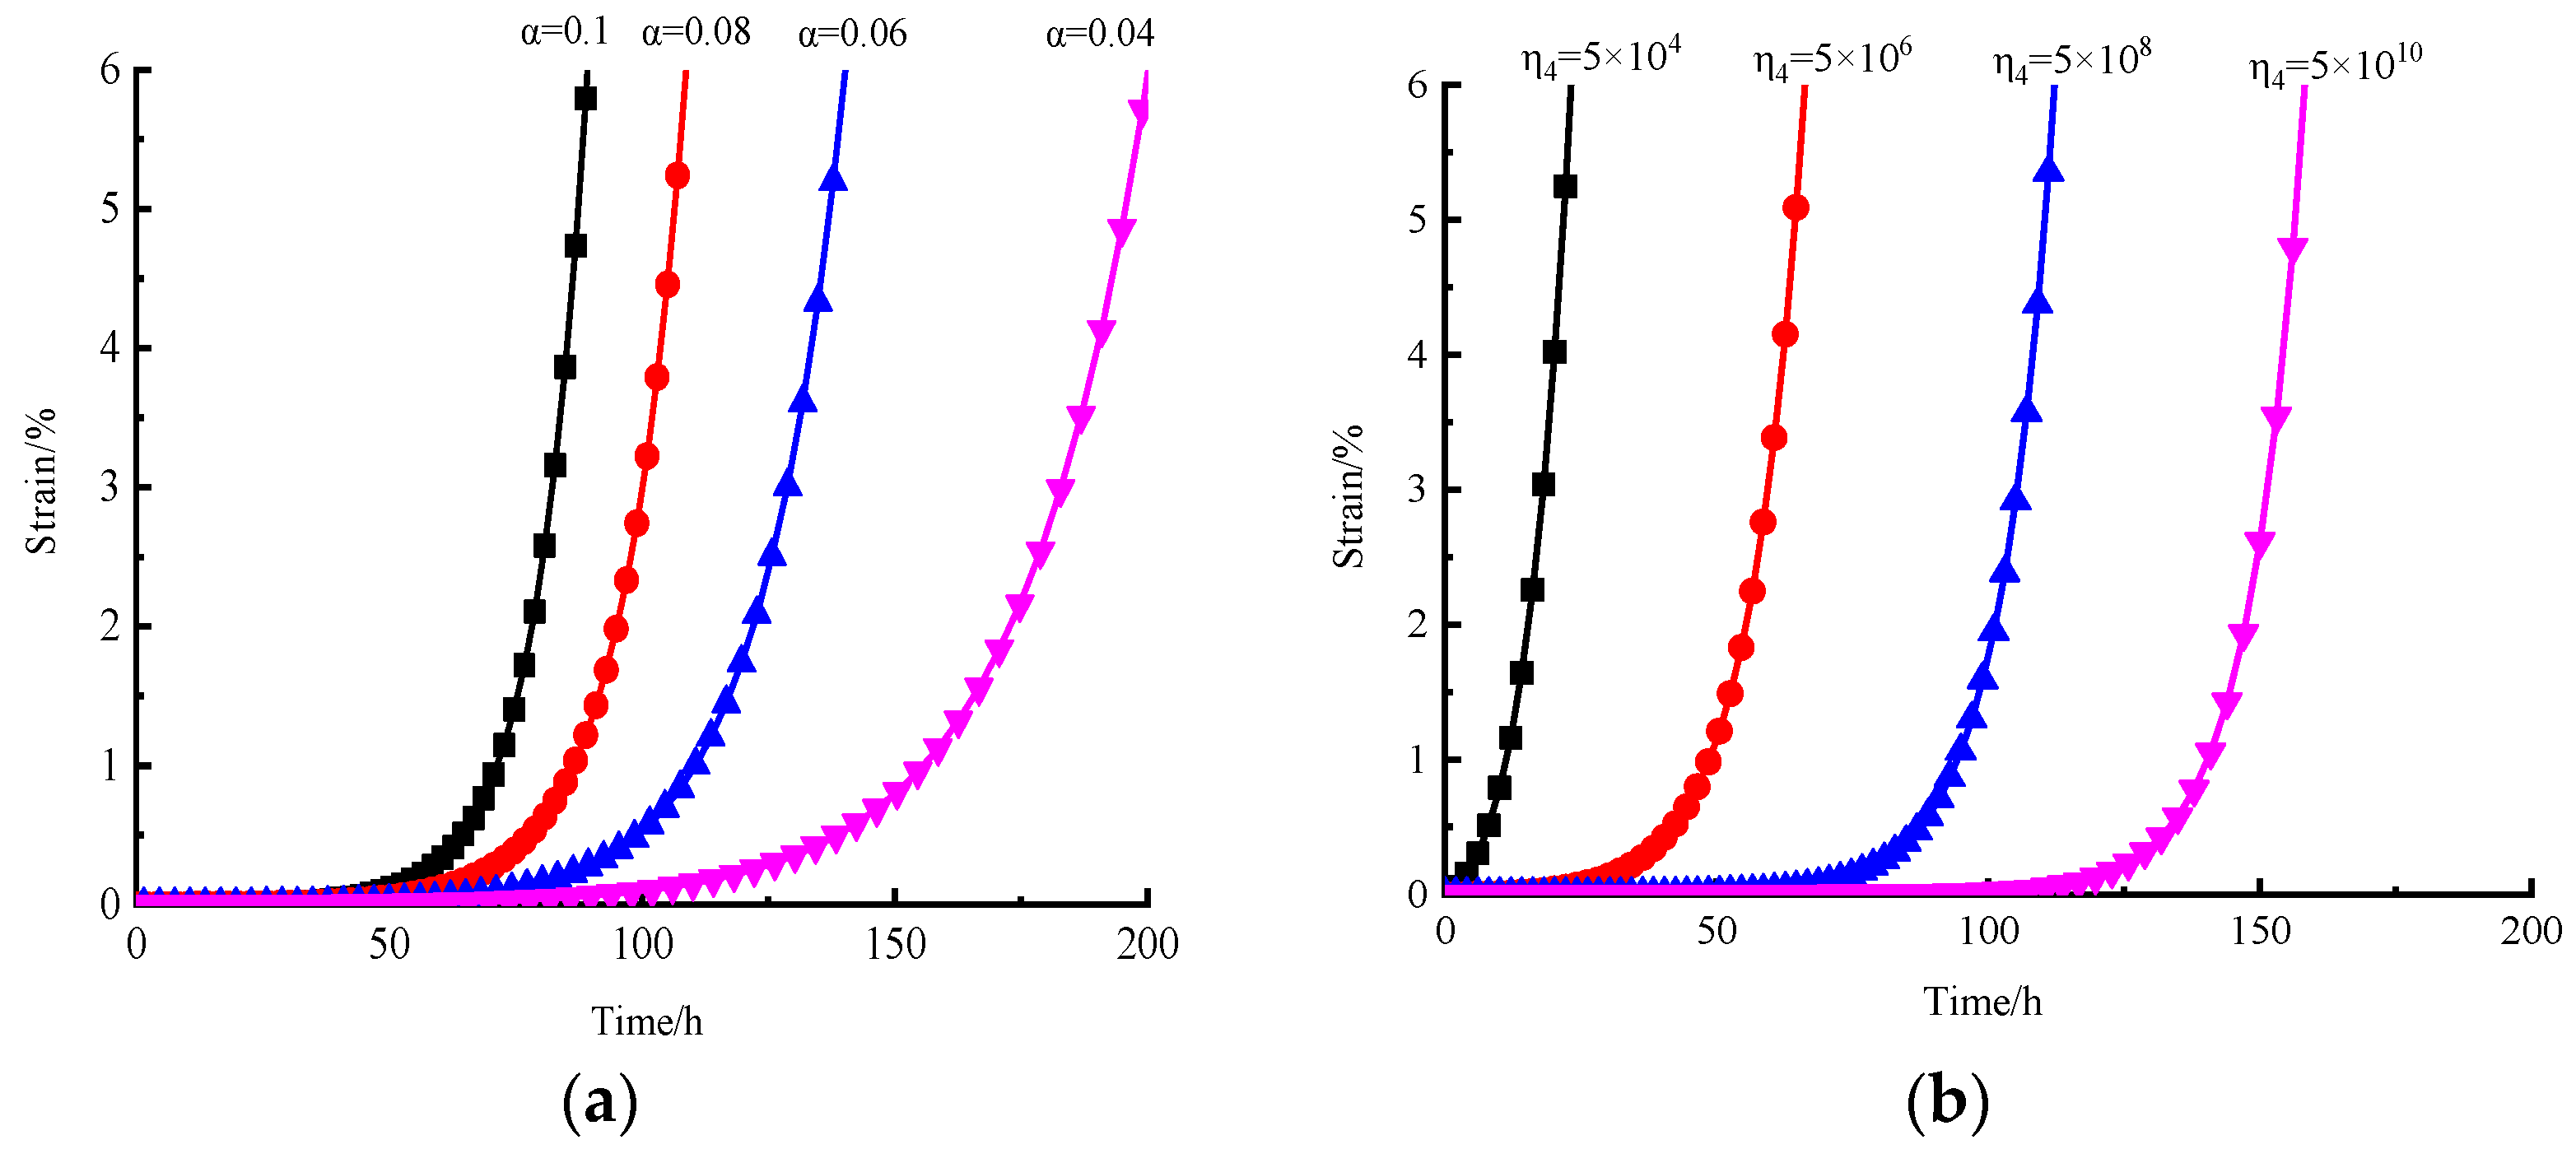
4.3. High-Temperature Creep Constitutive Model
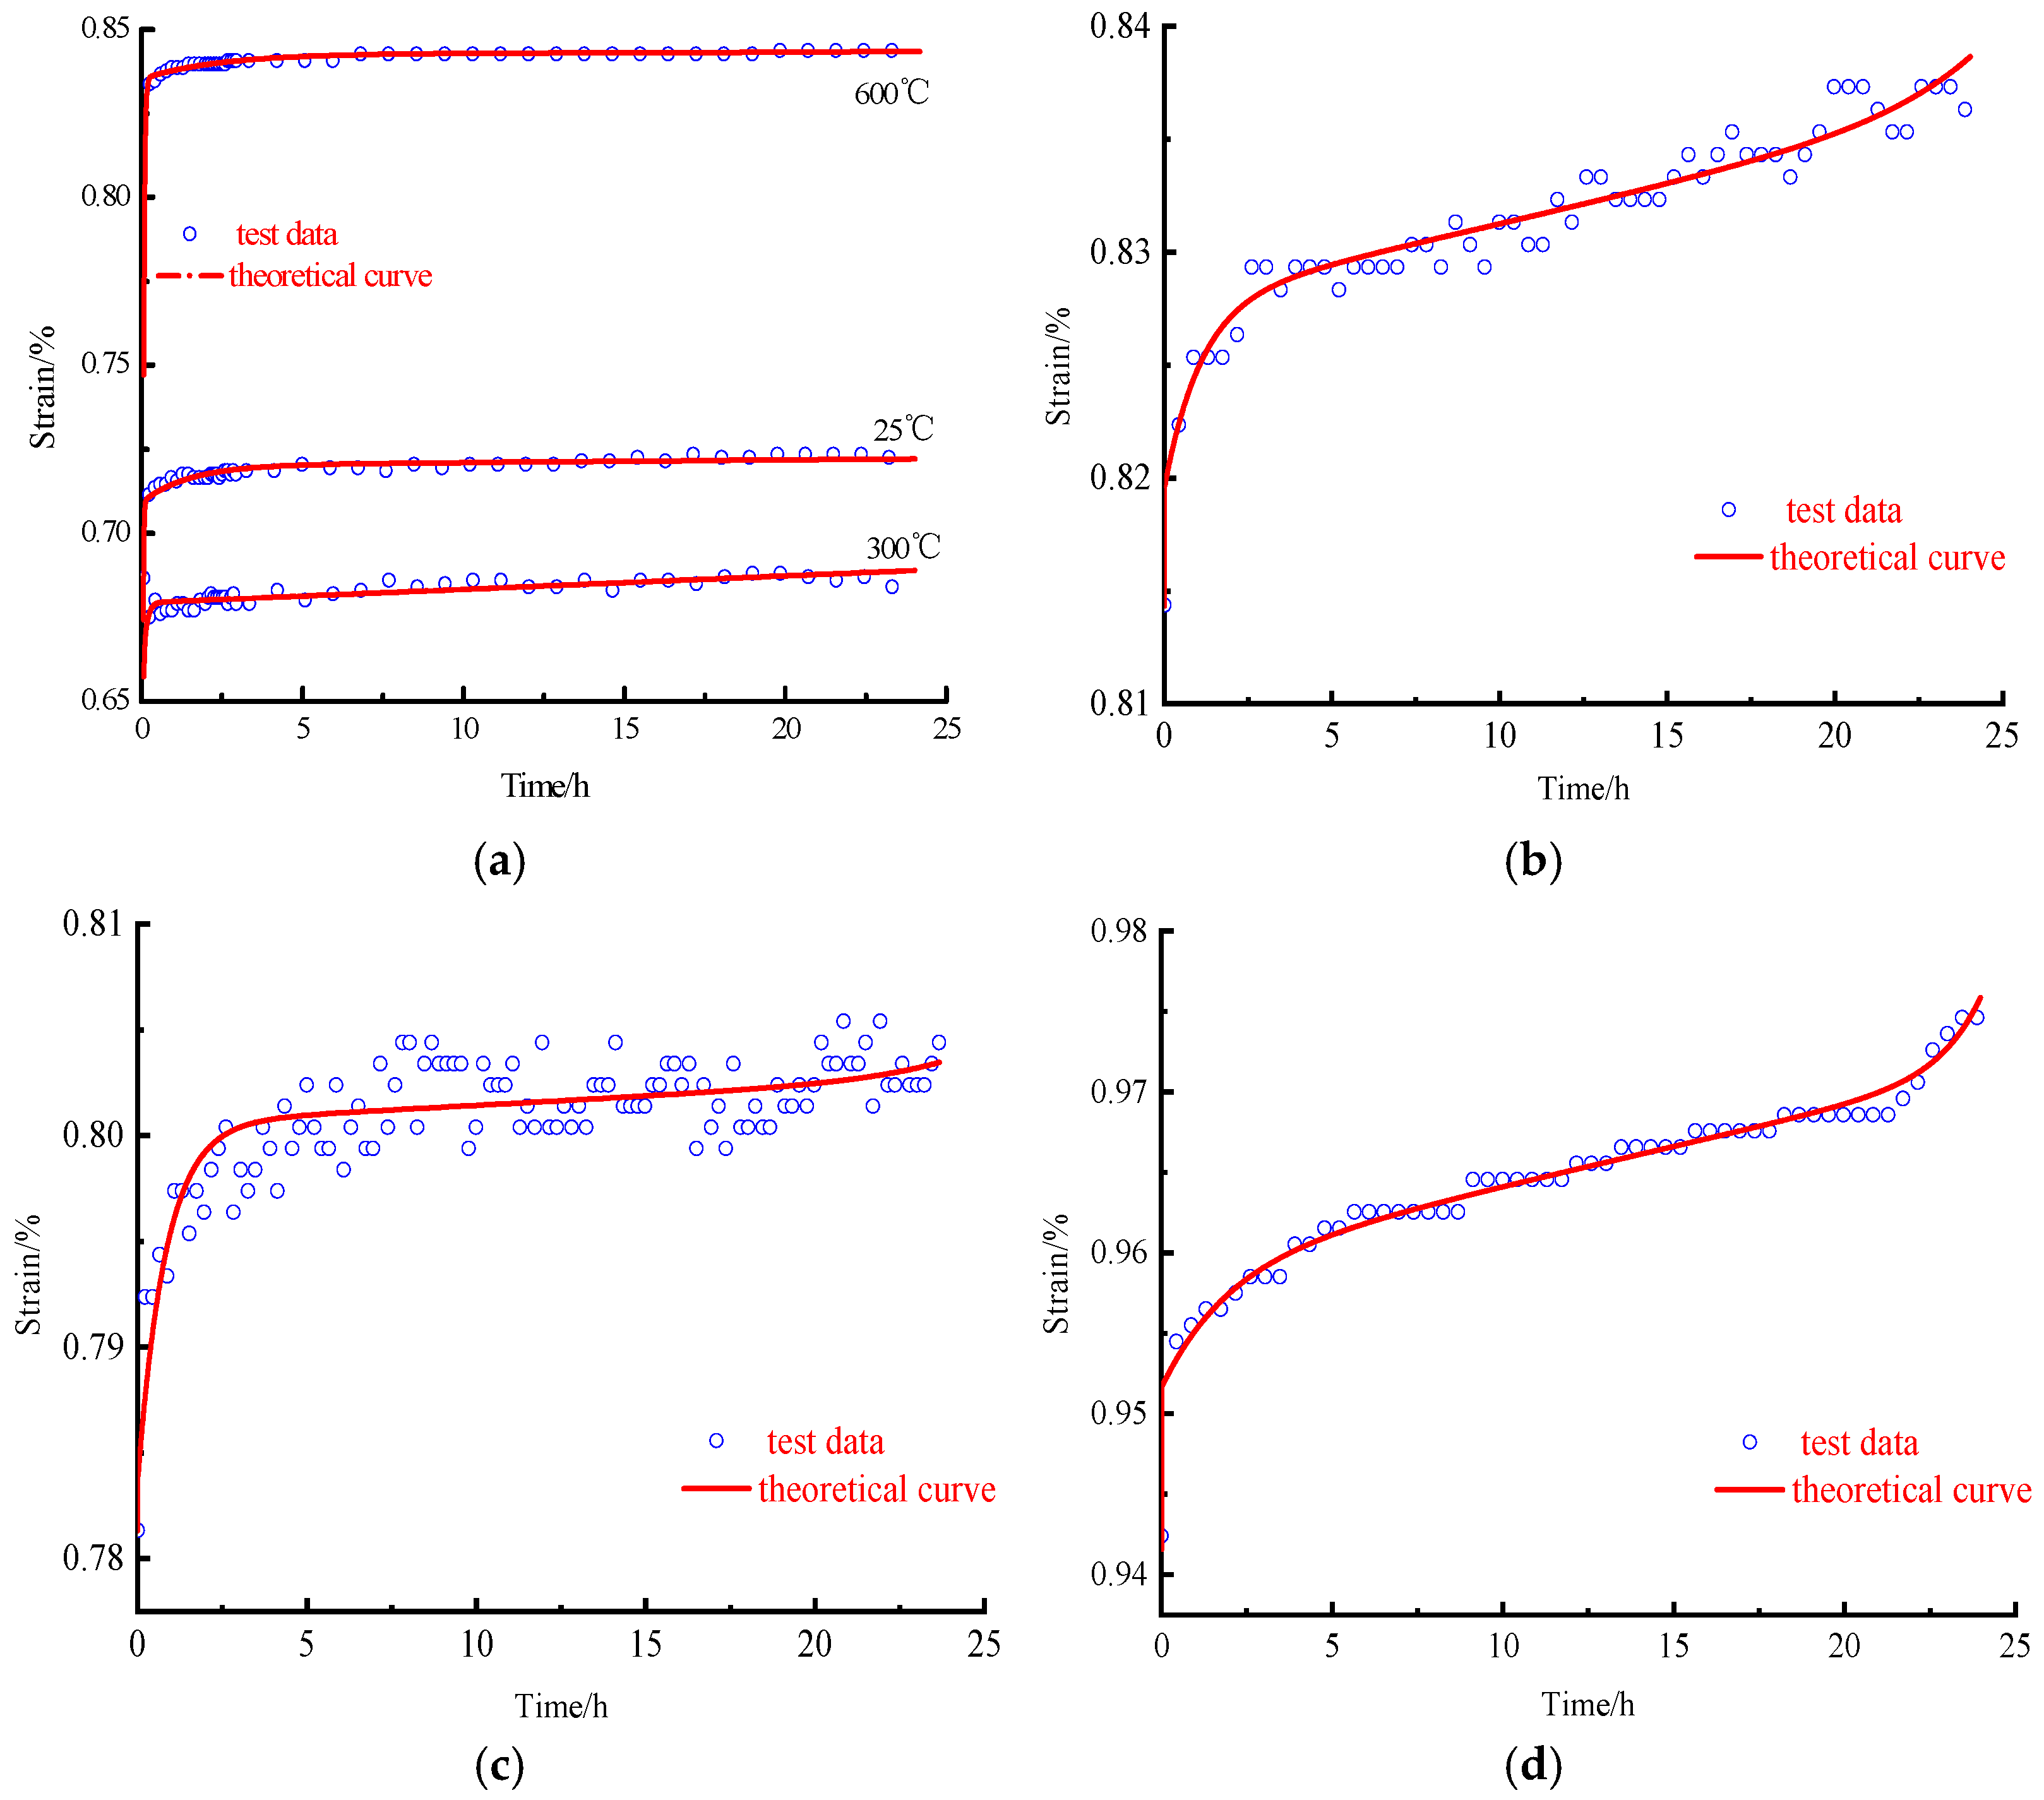
4.4. Verification of the High-Temperature Creep Model
5. Conclusions
Author Contributions
Funding
Data Availability Statement
Acknowledgments
Conflicts of Interest
References
- Zhu, Z.N.; Jiang, G.S.; Tian, H.; Wu, W.B.; Liang, R.Z.; Dou, B. Study on statistical thermal damage constitutive model of rock based on normal distribution. J. Cent. South Univ. 2019, 50, 1411–1418. (In Chinese) [Google Scholar]
- Wang, M.N.; Hu, Y.P.; Tong, J.J.; Wang, Q.L.; Wang, Y.C.; Dong, C.Y. Experimental study on shear mechanical properties and thermal damage model of shotcrete-rock interfaces under variable high temperatures. Chin. J. Rock Mech. Eng. 2019, 38, 63–75. (In Chinese) [Google Scholar]
- Zhao, Y.Y.; Wei, K.; Zhou, J.Q.; Li, X.; Chen, Y.F. Laboratory study and micromechanical analysis of mechanical behaviors of three thermally damaged rocks. Chin. J. Rock Mech. Eng. 2017, 36, 142–151. (In Chinese) [Google Scholar]
- Li, J.G.; Wang, Y.Y. Experimental analysis of temperature effect in creep of soft rock. J. China Coal Soc. 2012, 37, 81–85. (In Chinese) [Google Scholar]
- Hou, D.; Peng, J. Triaxial mechanical behavior and strength model for thermally-damaged marble. Chin. J. Rock Mech. Eng. 2019, 38, 2603–2613. (In Chinese) [Google Scholar]
- Yang, S.Q.; Hu, B.; Ranjith, P.G.; Xu, P. Multi-step loading creep behavior of red sandstone after thermal treatments and a creep damage model. Energies 2018, 11, 212. [Google Scholar] [CrossRef] [Green Version]
- Yang, S.Q.; Hu, B. Creep and long-term permeability of a red sandstone subjected to cyclic loading after thermal treatments. Rock Mech. Rock Eng. 2018, 51, 2981–3004. [Google Scholar] [CrossRef]
- Zhang, W.Q.; Sun, Q.; Zhu, Y.M.; Guo, W.H. Experimental study on response characteristics of micro–macroscopic performance of red sandstone after high-temperature treatment. J. Therm. Anal. Calorim. 2019, 136, 1935–1945. [Google Scholar] [CrossRef]
- Xu, C.B.; Zhou, H.S. Test investigation of triaxial compressive strength of coarse sandstone after high temperature. Chin. J. Rock Mech. Eng. 2016, 35, 2811–2818. (In Chinese) [Google Scholar]
- Chen, L.; Wang, C.P.; Liu, J.F.; Liu, Y.M.; Liu, J.; Su, R.; Wang, J. A damage-mechanism-based creep model considering temperature effect in granite. Mech. Res. Commun. 2014, 56, 76–82. [Google Scholar] [CrossRef]
- Xu, T.; Zhou, G.L.; Heap, M.J.; Zhu, W.C.; Chen, C.F.; Baud, P. The influence of temperature on time-dependent deformation and failure in granite: A mesoscale modeling approach. Rock Mech. Rock Eng. 2017, 50, 2345–2364. [Google Scholar] [CrossRef]
- Su, C.D.; Wei, S.J.; Yang, Y.S.; Qin, B.D. Analysis of strength and conventional triaxial compression deformation characters of coarse sandstone after high temperature. Chin. J. Rock Mech. Eng. 2015, 34, 2792–2800. (In Chinese) [Google Scholar]
- Xu, X.L.; Gao, F.; Zhang, Z.Z.; Chen, L. Experimental study of the effect of loading rates on mechanical properties of granite at real-time high temperature. Rock Soil Mech. 2015, 36, 2184–2192. (In Chinese) [Google Scholar]
- Qin, B.D.; Luo, Y.J.; Men, Y.M.; Chen, L.J. Experimental research on swelling properties of limestone and sandstone at high temperature. Rock Soil Mech. 2011, 32, 417–422+473. (In Chinese) [Google Scholar]
- Wang, Y.Y.; Wang, H.W.; Shi, X. Creep investigation on shale-like material with preexisting fissure under coupling temperatures and confining pressures. Adv. Civ. Eng. 2019, 9, 7861305. [Google Scholar] [CrossRef]
- Ye, G.L.; Nishimura, T.; Zhang, F. Experimental study on shear and creep behaviour of green tuff at high temperatures. Int. J. Rock Mech. Min. Sci. 2015, 79, 19–28. [Google Scholar] [CrossRef]
- Pan, X.K.; Berto, F.; Zhou, X.P. Creep damage behaviors of red sandstone subjected to uniaxial compression after high-temperature heat treatment using acoustic emission technology. Fatigue Fract. Eng. Mater. Struct. 2022, 45, 302–322. [Google Scholar] [CrossRef]
- Xin, Y.J.; An, D.C.; Li, M.Y.; Hao, H.C. Creep and strength characteristics of post-peak stage loading in high strength red-sandstone. J. China Coal Soc. 2017, 42, 1714–1723. (In Chinese) [Google Scholar]
- Hu, B.; Yang, S.Q.; Tian, W.L. Creep-permeability behavior of sandstone considering thermal-damage. Geomech. Eng. 2019, 18, 71–83. [Google Scholar] [CrossRef]
- Yang, S.Q.; Tang, J.Z.; Elsworth, D. Creep rupture and permeability evolution in high temperature heat-treated sandstone containing pre-existing twin flaws. Energies 2021, 14, 6362. [Google Scholar] [CrossRef]
- Sha, S.; Rong, G.; Tan, J.; He, R.H.; Li, B.W. Tensile strength and brittleness of sandstone and granite after high-temperature treatment: A review. Arab. J. Geosci. 2020, 13, 598. [Google Scholar] [CrossRef]
- Sharma, P.; Prakash, R.; Abedi, S. Effect of temperature on nano- and microscale creep properties of organic-rich shales. J. Pet. Sci. Eng. 2019, 175, 375–388. [Google Scholar] [CrossRef]
- Shibata, K.; Tani, K.; Okada, T. Creep behavior of tuffaceous rock at high temperature observed in unconfined compression test. Soils Found. 2007, 47, 1–10. [Google Scholar] [CrossRef] [Green Version]
- Li, W.J.; Zhu, C.; Yang, C.H.; Duan, K.; Hu, W.R. Experimental and DEM investigations of temperature effect on pure and interbedded rock salt. J. Nat. Gas Sci. Eng. 2018, 56, 29–41. [Google Scholar] [CrossRef]
- Li, W.J.; Han, Y.H.; Wang, T.; Ma, J.W. DEM micromechanical modeling and laboratory experiment on creep behavior of salt rock. J. Nat. Gas Sci. Eng. 2017, 46, 38–46. [Google Scholar] [CrossRef]
- Zhang, L.; Zhou, H.W.; Wang, X.Y.; Wang, L.; Su, T.; Wei, Q.; Deng, T.F. A triaxial creep model for deep coal considering temperature effect based on fractional derivative. Acta Geotech. 2022, 17, 1739–1751. [Google Scholar] [CrossRef]
- Chen, L.; Liu, J.F.; Wang, C.P.; Liu, J.; Wang, J. Experimental investigation on the creep behaviour of beishan granite under different temperature and stress conditions. Eur. J. Environ. Civ. Eng. 2015, 19, s43–s53. [Google Scholar] [CrossRef]
- Liu, S.; Xu, J.Y. An experimental study on the physico-mechanical properties of two post-high-temperature rocks. Eng. Geol. 2015, 185, 63–70. [Google Scholar] [CrossRef]
- Zhang, H.M.; Meng, X.Z.; Peng, C.; Yang, G.S.; Ye, W.J.; Shen, Y.J.; Liu, H. Rock damage constitutive model based on residual intensity characteristics under freeze-thaw and load. J. China Coal Soc. 2019, 44, 3404–3411. (In Chinese) [Google Scholar]
- Song, Y.J.; Zhang, L.T.; Ren, J.X.; Chen, J.X.; Che, Y.X.; Yang, H.M.; Bi, R. Creep property and model of red sandstone under low temperature environment. J. China Coal Soc. 2020, 45, 2795–2803. (In Chinese) [Google Scholar]
- Zhang, Q.Y.; Zhang, L.Y.; Xiang, W.; Jiang, L.Y.; Ding, Y.Z. Triaxial creep test of gneissic granite considering thermal effect. Rock Soil Mech. 2017, 38, 2507–2514. (In Chinese) [Google Scholar]
- Zhou, C.B.; Wan, Z.J.; Zhang, Y.; Liu, Y.; Zhang, B. Creep characteristics and constitutive model of gas coal mass under high temperature and triaxial stress. J. China Coal Soc. 2012, 37, 2020–2025. (In Chinese) [Google Scholar]
- Wang, C.P.; Chen, L.; Liang, J.W.; Liu, J.; Liu, Y.M.; Liu, J.F.; Wang, J.; Zhou, H.W. Creep constitutive model for full creep process of granite considering thermal effect. Rock Soil Mech. 2014, 35, 2493–2500+2506. (In Chinese) [Google Scholar]
- Xue, D.J.; Lu, L.L.; Yi, H.Y.; Wu, Z.D.; Zhang, Q.S.; Zhang, Z.P. A fractional Burgers model for uniaxial and triaxial creep of damaged salt-rock considering temperature and volume-stress. Chin. J. Rock Mech. Eng. 2021, 40, 315–329. (In Chinese) [Google Scholar]
- Zhou, G.L.; Xu, T.; Zhu, W.C.; Chen, C.F.; Yang, T.H. A time-dependent thermo-mechanical creep model of rock. Eng. Mech. 2017, 34, 1–9+25. (In Chinese) [Google Scholar] [CrossRef]
- Xi, B.P.; Zhao, Y.S.; Wan, Z.J.; Zhao, J.C.; Wang, Y. Study of constitutive equation of granite rheological model with thermo-mechanical coupling effects. Chin. J. Rock Mech. Eng. 2009, 28, 956–967. (In Chinese) [Google Scholar]
- Shan, R.L.; Bai, Y.; Sun, P.F.; Sui, S.M.; Huang, Y.L.; Chen, J.L. Study of triaxial creep mechanical properties and constitutive model of frozen stratified red sandstone. J. China Univ. Min. Technol. 2019, 48, 12–22. (In Chinese) [Google Scholar]
- Wu, G.; Zhai, S.T.; Wang, Y. Research on characteristics of mesostructure and acoustic emission of granite under high temperature. Rock Soil Mech. 2015, 36, 351–356. (In Chinese) [Google Scholar]


| Group | No. | Diameter/mm | Height/mm | Weight/g | Density/g/cm3 | Height–Diameter Ratio |
|---|---|---|---|---|---|---|
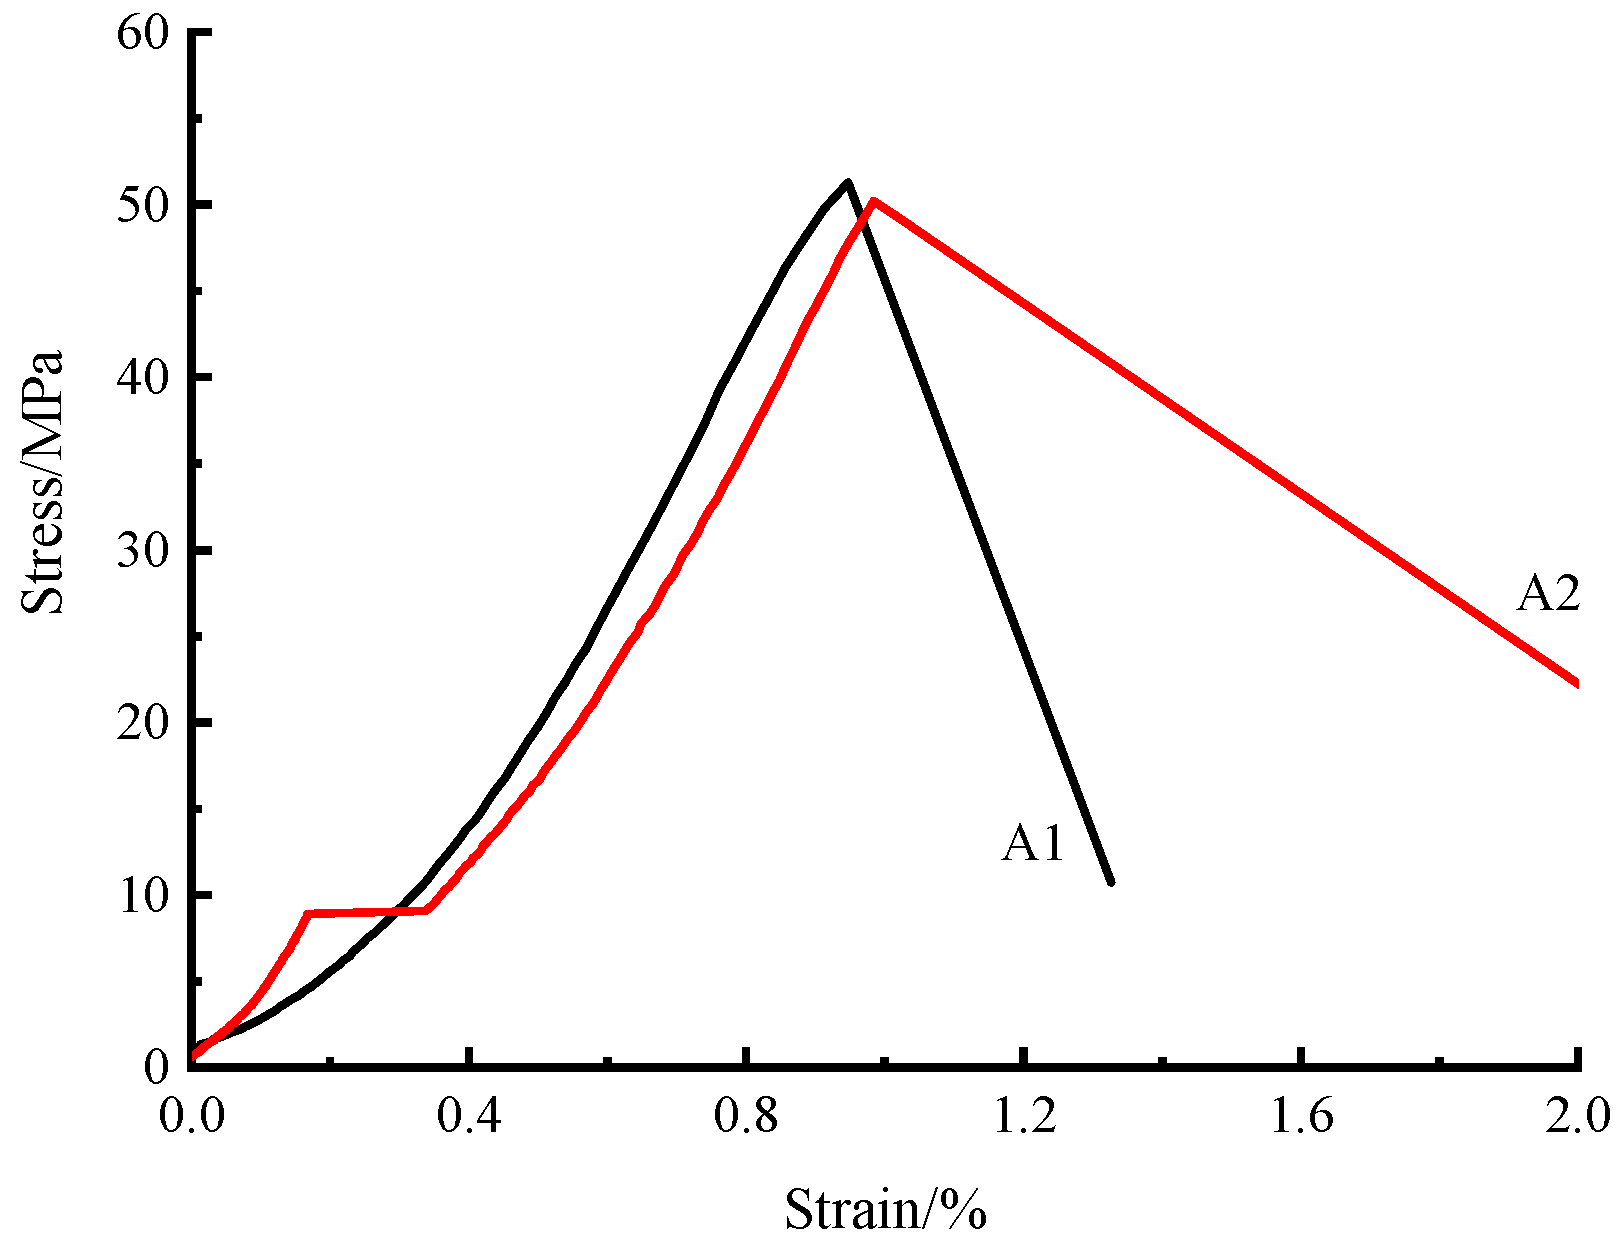
| Uniaxial compression | A1 | 49.72 | 99.34 | 405.79 | 2.10 | 2.00 |
| A2 | 49.62 | 98.86 | 404.94 | 2.12 | 1.99 | |
| Creep (25 °C) | B1 | 49.62 | 99.42 | 425.06 | 2.21 | 2.00 |
| B2 | 49.72 | 100.20 | 411.89 | 2.12 | 2.02 | |
| Creep (300 °C) | C1 | 49.74 | 99.70 | 401.88 | 2.07 | 2.00 |
| C2 | 49.62 | 98.84 | 400.76 | 2.10 | 1.99 | |
| Creep (600 °C) | D1 | 49.92 | 99.32 | 424.02 | 2.18 | 1.99 |
| D2 | 49.94 | 92.90 | 375.63 | 2.06 | 1.86 | |
| Creep (900 °C) | E1 | 50.06 | 100.26 | 402.76 | 2.04 | 2.00 |
| E2 | 50.02 | 99.86 | 398.17 | 2.03 | 2.00 |
| Temperature/°C | Group | Loading Rate/mm/s | Test Way | ||||
|---|---|---|---|---|---|---|---|
| Uniaxial Compression | Incremental Load Creep | ||||||
| No. | Initial Stress/MPa | Creep Time/h | Gradient Level/MPa | ||||
| 25 | A | 0.05 | A1/A2 | / | / | 2.5 (Group 1) | 5.0 (Group 2) |
| B | 0.05 | / | 30 | 24 | B1 | B2 | |
| 300 | C | C1 | C2 | ||||
| 600 | D | D1 | D2 | ||||
| 900 | E | E1 | E2 | ||||
| Group | No. | Stress/MPa | Load/kN | Strain before Creep/% | Strain after Creep/% | Instantaneous Strain% | Creep Strain/% | Creep Time/h | Creep Failure Strength/MPa |
|---|---|---|---|---|---|---|---|---|---|
| Creep (25 °C) | B1 | 30 | 58.01 | 0.6437 | 0.6689 | 0.6437 | 0.0251 | 24.6006 | 45 |
| 35 | 67.68 | 0.7121 | 0.7302 | 0.0433 | 0.0181 | 23.8029 | |||
| 37.5 | 72.52 | 0.7463 | 0.7614 | 0.0161 | 0.0151 | 23.9566 | |||
| 40 | 77.35 | 0.7785 | 0.7936 | 0.0171 | 0.0151 | 24.1217 | |||
| 42.5 | 82.18 | 0.8097 | 0.8580 | 0.0161 | 0.0483 | 24.0806 | |||
| 45 | 87.02 | 0.8821 | 0.9555 | 0.0241 | 0.0734 | 0.2809 | |||
| B2 | 30 | 58.25 | 0.7066 | 0.7236 | 0.7066 | 0.0170 | 24.0259 | 45 | |
| 35 | 67.95 | 0.7675 | 0.7784 | 0.0439 | 0.0110 | 24.5313 | |||
| 40 | 77.66 | 0.8124 | 0.8373 | 0.0339 | 0.0250 | 24.0273 | |||
| 45 | 87.37 | 0.8802 | 0.9731 | 0.0429 | 0.0928 | 1.0157 | |||
| Creep (300 °C) | C1 | 30 | 58.01 | 0.7234 | 0.7406 | 0.7234 | 0.0172 | 24.3455 | 47.5 |
| 35 | 67.68 | 0.7811 | 0.7932 | 0.0405 | 0.0121 | 23.6529 | |||
| 37.5 | 72.52 | 0.8134 | 0.8256 | 0.0202 | 0.0121 | 24.0547 | |||
| 40 | 77.35 | 0.8458 | 0.8620 | 0.0202 | 0.0162 | 24.5314 | |||
| 42.5 | 82.18 | 0.8812 | 0.8934 | 0.0192 | 0.0121 | 23.7301 | |||
| 45 | 87.02 | 0.9126 | 0.9268 | 0.0192 | 0.0142 | 24.0281 | |||
| 47.5 | 91.85 | 0.9439 | 1.0735 | 0.0172 | 0.1296 | 10.6067 | |||
| C2 | 30 | 58.29 | 0.6630 | 0.6871 | 0.6630 | 0.0241 | 24.0191 | 50 | |
| 35 | 68.01 | 0.7252 | 0.7362 | 0.0381 | 0.0110 | 24.0208 | |||
| 40 | 77.73 | 0.7813 | 0.8034 | 0.0451 | 0.0221 | 23.6617 | |||
| 45 | 87.44 | 0.8405 | 0.8826 | 0.0371 | 0.0421 | 24.3511 | |||
| 50 | 97.16 | 0.9308 | 0.9859 | 0.0481 | 0.0551 | 0.0306 | |||
| Creep (600 °C) | D1 | 30 | 58.76 | 0.8633 | 0.8956 | 0.8633 | 0.0323 | 24.0521 | 40 |
| 35 | 68.56 | 0.9408 | 0.9914 | 0.0452 | 0.0506 | 24.0364 | |||
| 37.5 | 73.45 | 1.0194 | 1.0721 | 0.0280 | 0.0527 | 23.9193 | |||
| 40 | 78.35 | 1.0936 | 1.1819 | 0.0215 | 0.0883 | 1.2440 | |||
| D2 | 30 | 58.72 | 0.8226 | 0.8447 | 0.8226 | 0.0222 | 24.1718 | 45 | |
| 35 | 68.5 | 0.8860 | 0.9041 | 0.0413 | 0.0181 | 24.1737 | |||
| 40 | 78.29 | 0.9464 | 0.9746 | 0.0423 | 0.0282 | 24.0783 | |||
| 45 | 88.07 | 1.0089 | 1.1106 | 0.0342 | 0.1017 | 10.4171 | |||
| Creep (900 °C) | E1 | 30 | 59.05 | 1.0513 | 1.2926 | 1.0513 | 0.2413 | 4.6029 | 30 |
| E2 | 30 | 58.95 | 1.0925 | 1.2848 | 1.0925 | 0.1923 | 0.3394 | 30 |
| Temperature/°C | 25 | 300 | 600 | 900 | |
|---|---|---|---|---|---|
| Creep strain/% | Group 1 | 0.0325 | 0.0305 | 0.0560 | 0.2413 |
| Group 2 | 0.0365 | 0.0309 | 0.0426 | 0.1923 | |
| Mean value of sum | 0.0345 | 0.0307 | 0.0493 | 0.2168 | |
| Differences | −0.0040 | −0.0004 | 0.0134 | 0.0490 | |
| Stress Level/MPa | Temperature/°C | E1/GPa | E2/GPa | E3/GPa | η1/103 GPa·h−1 | η2/MPa·h−1 | η3/GPa·h−1 | η4/GPa·h−1 | α |
|---|---|---|---|---|---|---|---|---|---|
| 30 | 25 | 4.32 × 10⁶ | 313.202 | 4.246 | 8.320 | 3.89 × 10⁴ | 0.085 | ||
| 300 | 1.93 × 10⁸ | 4.516 | 203.792 | 6.874 | 98.552 | 27.272 | |||
| 600 | 7.28 × 10⁴ | 3.592 | 488.488 | 26.822 | 120.028 | 813.594 | |||
| 40 | 25 | 1.43 × 10⁵ | 4.881 | 483.040 | 11.653 | 4.192 | 529.763 | 3.09 × 10⁷ | 0.371 |
| 300 | 12.903 | 8.446 | 235.748 | 46.848 | 6.921 | 194.849 | 2.16 × 10⁸ | 0.418 | |
| 600 | 4.96 | 525.640 | 3.591 | 27.553 | 1.01 × 10⁶ | 0.044 | 3.99 × 10¹¹ | 0.826 |
Publisher’s Note: MDPI stays neutral with regard to jurisdictional claims in published maps and institutional affiliations. |
© 2022 by the authors. Licensee MDPI, Basel, Switzerland. This article is an open access article distributed under the terms and conditions of the Creative Commons Attribution (CC BY) license (https://creativecommons.org/licenses/by/4.0/).
Share and Cite
Ren, X.; Xin, Y.; Jia, B.; Gao, K.; Li, X.; Wang, Y. Large Stress-Gradient Creep Tests and Model Establishment for Red Sandstone Treated at High Temperatures. Energies 2022, 15, 7786. https://doi.org/10.3390/en15207786
Ren X, Xin Y, Jia B, Gao K, Li X, Wang Y. Large Stress-Gradient Creep Tests and Model Establishment for Red Sandstone Treated at High Temperatures. Energies. 2022; 15(20):7786. https://doi.org/10.3390/en15207786
Chicago/Turabian StyleRen, Xiaopeng, Yajun Xin, Baoshan Jia, Kun Gao, Xuping Li, and Yu Wang. 2022. "Large Stress-Gradient Creep Tests and Model Establishment for Red Sandstone Treated at High Temperatures" Energies 15, no. 20: 7786. https://doi.org/10.3390/en15207786