Article

Tourism Development, Carbon Emission Intensity and Urban Green Economic Efficiency from the Perspective of Spatial Effects

1
Tourism College, Hunan Normal University, Changsha 410081, China
2
College of Humanities and Arts, Hunan University of Finance and Economics, Changsha 410205, China
*
Authors to whom correspondence should be addressed.
Energies 2022, 15(20), 7729; https://doi.org/10.3390/en15207729
Submission received: 16 September 2022 / Revised: 15 October 2022 / Accepted: 17 October 2022 / Published: 19 October 2022
(This article belongs to the Special Issue Available Energy and Environmental Economics)

Abstract

:
In recent years, China has increasingly emphasized green development. Therefore, it is of theoretical and practical significance to study the green economic effect and carbon reduction effect of tourism development for the transformation of economic development. Using the superefficient EBM to measure the green economic efficiency of 280 cities from 2007–2019, we rely on the spatial Durbin model to explore the spatial spillover utility and nonlinear characteristic relationship of tourism development on green economic efficiency and carbon emission intensity and test the mediating effect of carbon emission intensity. The findings are as follows: (1) Under the exogenous shock test of the “low-carbon city” pilot policy, the spatial spillover effect of tourism development on urban green economic efficiency and carbon emission intensity is robust to spatial heterogeneity. (2) The spatial spillover effects of tourism development on the green economic efficiency and carbon emission intensity of cities show a nonlinear characteristic relationship of “U” and “M” shapes. After tourism development reaches a certain high level, the green economy effect and carbon emission reduction effect are significantly increased. (3) Carbon emission intensity has a significant mediating effect on the impact of tourism development on urban green economic efficiency.

1. Introduction

Anthropogenic activities such as deforestation and burning of fossil fuels produce a large amount of greenhouse gases, and the continued increase in carbon dioxide emissions is expected to have a catastrophic impact on the global climate system. Therefore, it has become the consensus of various countries around the world to mitigate the negative impacts of climate change and ensure sustainable development by continuously reducing carbon emissions [1]. The United Nations Environment Programme (UNEP) proposed in 2011 that a green economy can improve human well-being and social justice and that it can serve as a pattern for building a resource-efficient and environmentally friendly society. It is also an important way to promote sustainable development and aid in poverty eradication. Since its reform and opening up, China’s economy has grown at a rapid rate of 9.7% per year [2], rapidly becoming the world’s second largest economy, ranking among the upper middle-income countries and lifting 800 million people out of poverty [3]. However, China’s economic development still has serious problems due to the widespread use of energy that exploits the environment to promote economic growth. According to the World Bank, China has become the world’s largest energy consumer. China accounts for 27.6% of the world’s CO2 emissions [4], and the Chinese government has committed to ensure that carbon emissions peak by 2030. Thus, the Chinese government has recognized that current and potential environmental degradation poses a serious threat to China’s sustainable development and that the previous aggressive development model is no longer appropriate. Solving China’s problems will not only benefit the quality of China’s economic development but also provide a model in balancing economic growth and the environment that could be used by other developing countries around the world. However, based on economic stability, ensuring the achievement of this goal is an important challenge for the Chinese government, and improving economic efficiency is certainly an effective way of achieving it [5]. For European countries, tourism, as a key sector of the European economy, is an important source of income and employment in Europe [6]. However, carbon intensity in Europe is growing steadily. Therefore, these countries must also mitigate carbon emissions through tourism reforms [6]. It can be seen that both developing and developed countries are actively seeking a balance between energy consumption and economic growth, exploring the carbon reduction effect of the tourism industry, the green economy effect and its interaction, so that the research results can become a guide to the reality of the dilemma between tourism and environmental protection.
In the economic sense, economic efficiency usually refers to how to obtain as much output of economic goods from as few factor inputs as possible, mainly considering the input–output ratio of labor and capital inputs [7]. In 2010, Yang and Hu first proposed green economic efficiency as a key indicator to measure the level of the green economy, and green economic efficiency further addresses the issues of energy constraints and undesired output [8]. Therefore, green economic efficiency can be defined as an economic production system that can achieve greater economic output or less environmental pollution with constant or reduced factor inputs, taking into account the constraints of resources and the environment [5,9,10]. For studies of green economy efficiency, data envelopment analysis (DEA) is a common method used by most scholars [11,12,13,14,15,16]. However, DEA is either input- or output-oriented and cannot consider both output and input, which is a limitation of the DEA measurement method. To avoid such problems, some scholars use the slack-based measurement (SBM) method to measure green economic efficiency [5,17,18,19,20,21,22,23]. Although the SBM model achieves a balance of inputs and outputs, it also ensures different proportional changes in inputs and outputs, which are closer to the true values [5]. However, the SBM model cannot solve the problem of undesired outputs. In recent years, the EBM method has been increasingly used by scholars to study energy efficiency or environmental efficiency [24,25,26,27,28]. Therefore, this paper adopts the EBM model to measure the green economy efficiency level of 280 prefecture-level cities in China.
It is widely acknowledged that the tourism industry makes a significant contribution to economic development in terms of income generation, tax revenue and employment [29]. After reform and opening up, tourism has developed along with China’s economic take-off, and it has become a pillar industry of China’s economy. According to data from the China Tourism Research Institute, the number of domestic tourists rose from 2.13 billion to 6.006 billion from 2010 to 2019, and the total revenue from tourism rose from 1.57 trillion RMB to 6.63 trillion RMB. This rise in tourism is not only the case in China; the tourism industry is also a key sector of the European economy, prioritized by the EU as an important source of income, employment and economic growth [6]. As the contribution of tourism agglomeration increases, scholars are increasingly looking at the relationship between tourism development and economic growth [6]. During the continuous development of tourism, the carbon emissions generated by the activities of tourism itself, such as transportation, accommodation and catering [30], as well as tourism-related industries [31], have gradually increased. For countries or regions with large populations or developed tourism industries, the relationship between tourism and carbon emissions has received much attention [32], for example, in China [33], the European Union [6] and Southeast Asia [32].
Compared with other industries, tourism is less polluting, less ecologically damaging and less energy-consuming, which are hallmarks of a typical green industry and demonstrate that it contributes to the development of the green economy in cities [34]. Therefore, based on the uniqueness of tourism, the relationship between tourism development, carbon emissions and economic growth has been a hot topic of research [6,32,35,36,37,38,39,40,41,42]. After the introduction of the concept of the green economy, what is the relationship between tourism as a green industry and carbon emissions and the green economy? Is there a necessary link between tourism development, carbon emissions and a green economy? As cities become more frequently and closely connected, the development of neighboring cities is mutually linked and influenced, so it is necessary and important to consider spatial effects. Furthermore, with the global advocacy for green development, it is crucial to understand the relationship between urban tourism development, carbon emission intensity and green economic efficiency. This is not only important for China to achieve the goal of reducing carbon emissions but also has important practical significance for the global exploration of green economic development paths.
The contribution of this paper may be as follows. First, the article defines the relationship among tourism development, carbon emission intensity and green economic efficiency. Supported by the data of 280 prefecture-level cities in China from 2007–2019, this paper confirms that urban tourism development has a significant positive effect on the reduction in carbon emission intensity and the improvement of green economic efficiency. Meanwhile, it confirms that carbon emission intensity plays a significant mediating role in the promotion of urban green economic efficiency by tourism development. Second, this paper compares the spatial relationship between tourism development on carbon emission intensity and green economic efficiency. By using the spatial Durbin model and introducing spatial effects, this paper confirms that tourism development has a significant spatial spillover effect on the mitigation of carbon emission intensity and the improvement of green economic efficiency. On this basis, this paper tests the robustness of the spatial spillover effect of tourism development on carbon emission intensity and green economic efficiency by introducing the “low carbon city” pilot policy as an exogenous shock. Third, the paper compares the nonlinear characteristic relationship of tourism development on carbon emission intensity and green economic efficiency. Based on the previous influence relationship, this paper further explores the nonlinear characteristic relationship of tourism development on the reduction in carbon emission intensity and the improvement of green economic efficiency and elaborates the influence of tourism development on carbon emission intensity and green economic efficiency.
In order to introduce the research of this paper more clearly, the main contents of each chapter are introduced in the form of flowcharts in the order of the research catalog of this paper, as shown in Figure 1. The literature review and research hypotheses are given in the next section. The econometric methodology and model utilized in this study are provided in section three. Section four addresses the empirical results, and the last section provides a discussion of the findings together with policy implications.

2. Theoretical Foundations and Research Hypotheses

Although there is no unified academic definition of the green economy, scholars have recognized that achieving a positive interaction between economic growth and the ecological environment is the core connotation of green economic development [14,43]. The tourism industry is inextricably linked to the regional economy, both in terms of GDP contribution and employment contribution [6,36], and plays an important role in promoting economic development. In addition, the tourism industry is both dependent on the destination’s ecological environment and protective of it. A good ecological environment improves the quality of the elements of tourism development, while tourism development further protects the local ecological environment and realizes the sustainable development of the regional ecology. From the core connotation of the green economy, the impact of tourism development on the green economy is mainly reflected in two aspects [44,45]: ecological and environmental effects and economic growth effects.
In the process of tourism development, it will have direct and indirect effects on the local economy and environment, which will affect the level of local green economic efficiency. As shown in Figure 2, tourism development and environmental pollution have an “EKC” effect, i.e., the environmental Kuznets curve is introduced into tourism development, and the two are found to have an “inverted U” curve relationship [32]. At the same time, tourism development has both positive and negative environmental externalities. The positive environmental externality refers to tourism as a friendly industry that does not involve industrial pollution [46] and has a significant carbon reduction effect [6]. The negative environmental externality, on the contrary, refers to the high-carbon nature of the tourism industry, which is a major contributor to greenhouse gas emissions [47]. Although it is recognized that the tourism industry itself has significant economic driving power [6], Corden et al. found that tourism development has a “Dutch disease” effect, i.e., tourism development promotes economic growth in the short term, but depresses the economy in the long term [48]. Based on the “Dutch disease” effect, scholars have shown that tourism development has a non-linear effect. More specifically, different levels of tourism specialization can have differential effects on economic growth [49]. These studies demonstrate that tourism development has a direct effect on economic efficiency and thus on green economic efficiency.
In addition to the direct impact, tourism development can also indirectly affect the efficiency of the green economy by influencing environmental and economic factors. Tourism development can optimize the ecological environment, industry linkage and integration, technological innovation and industrial structure. Tourism needs an excellent natural environment, so the development of tourism will inevitably require the relocation and withdrawal of highly polluting enterprises, performing a passive adjustment of industrial structure. In conclusion, environmental friendliness and economic growth are the core concepts of the green economy, tourism development in the process directly and indirectly affecting the local ecological environment and economic growth, with practical benefits and results to illustrate the existence of overlap between tourism development and green economic efficiency.
In terms of environmental benefits, the “environmental Kuznets” effect of tourism development is obvious [50], as the tourism industry produces environmental pollution such as waste gas and wastewater in the process of development, causing certain negative impacts on the ecological environment, but the economic growth effect brought by tourism development directly “compensates” by allowing environmental protection. In terms of indirect effects, tourism development can force the original industrial structure to be adjusted and optimized through the “crowding-out effect”. In addition, the “dependency” of the local economy on the tourism industry raises the environmental awareness of the government and residents, creating formal and informal monitoring of the ecological environment and further optimizing the development environment. At the same time, tourism development also brings economic growth. For example, tourism development can directly lead to increased GDP and employment in cities and contribute to poverty alleviation in the destination. Moreover, the increasing integration of tourism with other industries not only facilitates the innovation and transfer of technology but also has a positive impact on the optimization of the industrial structure and market environment [21].
Hypothesis H1:
The impact of tourism development on the green economic efficiency of cities has a spillover effect.
Hypothesis H2:
The impact of tourism development on urban green economic efficiency has a nonlinear relationship.
The impact of tourism development on urban carbon emission intensity is mainly studied from the perspective of tourism industry agglomeration, and the environmental effect of tourism carbon emission reduction is mainly realized through externalities, which is a proven consensus [6,31,32,51]. The research on the relationship between tourism development and carbon emissions is mainly based on the environmental Kuznets curve hypothesis (EKC) proposed by American economists Grossman and Krueger. This hypothesis suggests that environmental quality deteriorates and then improves as the level of economic development increases, and there is an inverted “U” shaped relationship between environmental quality and economic development. The environmental effect brought by the development of the tourism industry is mainly studied from the two perspectives of the tourism economy and industrial agglomeration. On the one hand, the growth of the tourism economy follows the environmental Kuznets curve hypothesis, with a nonlinear characteristic relationship between the two [32], but at the same time, some scholars question this and test the relationship between the tourism economy and the decoupling of carbon emissions [33]. On the other hand, in the early stage of tourism industry agglomeration, the industry development method is relatively crude, and large-scale enterprises may be concentrated in the same area. Although this increases the regional GDP, as a process with fierce competition, it can also easily waste resources and energy and lead to a negative impact on the ecological environment [52]. As the level of agglomeration increases, the agglomeration of the tourism industry brings about a reduction in the cost of raw material transportation and transaction, a saving in energy and resources, and the agglomeration of enterprises with backward and forward linkage makes the exchange of knowledge and technology more convenient. The exchange and cooperation between tourism and other industries are likely to collide with new technologies, expand knowledge and technology spillover effects, and achieve synergistic innovation in technology, which in turn have a suppressive effect on carbon emissions and improve environmental pollution [6].
Hypothesis H3:
The impact of tourism development on urban carbon emission intensity has a spillover effect.
Hypothesis H4:
The impact of tourism development on urban carbon emission intensity has a nonlinear relationship.
Tourism development must both reduce carbon emissions and increase the GDP: on the one hand, tourism development needs to pay attention to reducing carbon dioxide emissions, both from tourism itself and from the manufacturing sector. According to existing research, tourism is not only highly correlated with manufacturing but also has a certain “crowding-out effect” on regional manufacturing [46]. Therefore, while developing tourism, clean energy should be used to reduce air pollution, thus attracting more tourists and generating more tourism revenue. This is also a mutually reinforcing process, as the development of tourism to a certain extent squeezes out the high-pollution manufacturing industry, which also alleviates regional carbon intensity. The ability of cities to reduce carbon emissions in turn directly affects the development of the urban green economy, and carbon emission intensity has a direct negative impact on the improvement of the urban green economy efficiency level [5,53,54]. Tourism development tends to consider the effect of its carbon emissions while influencing the efficiency of the urban green economy, which shows that carbon emissions have a very important role in the green development of tourism.
Hypothesis H5:
Carbon emission intensity has a mediating effect on the relationship between tourism development and urban green economic efficiency.

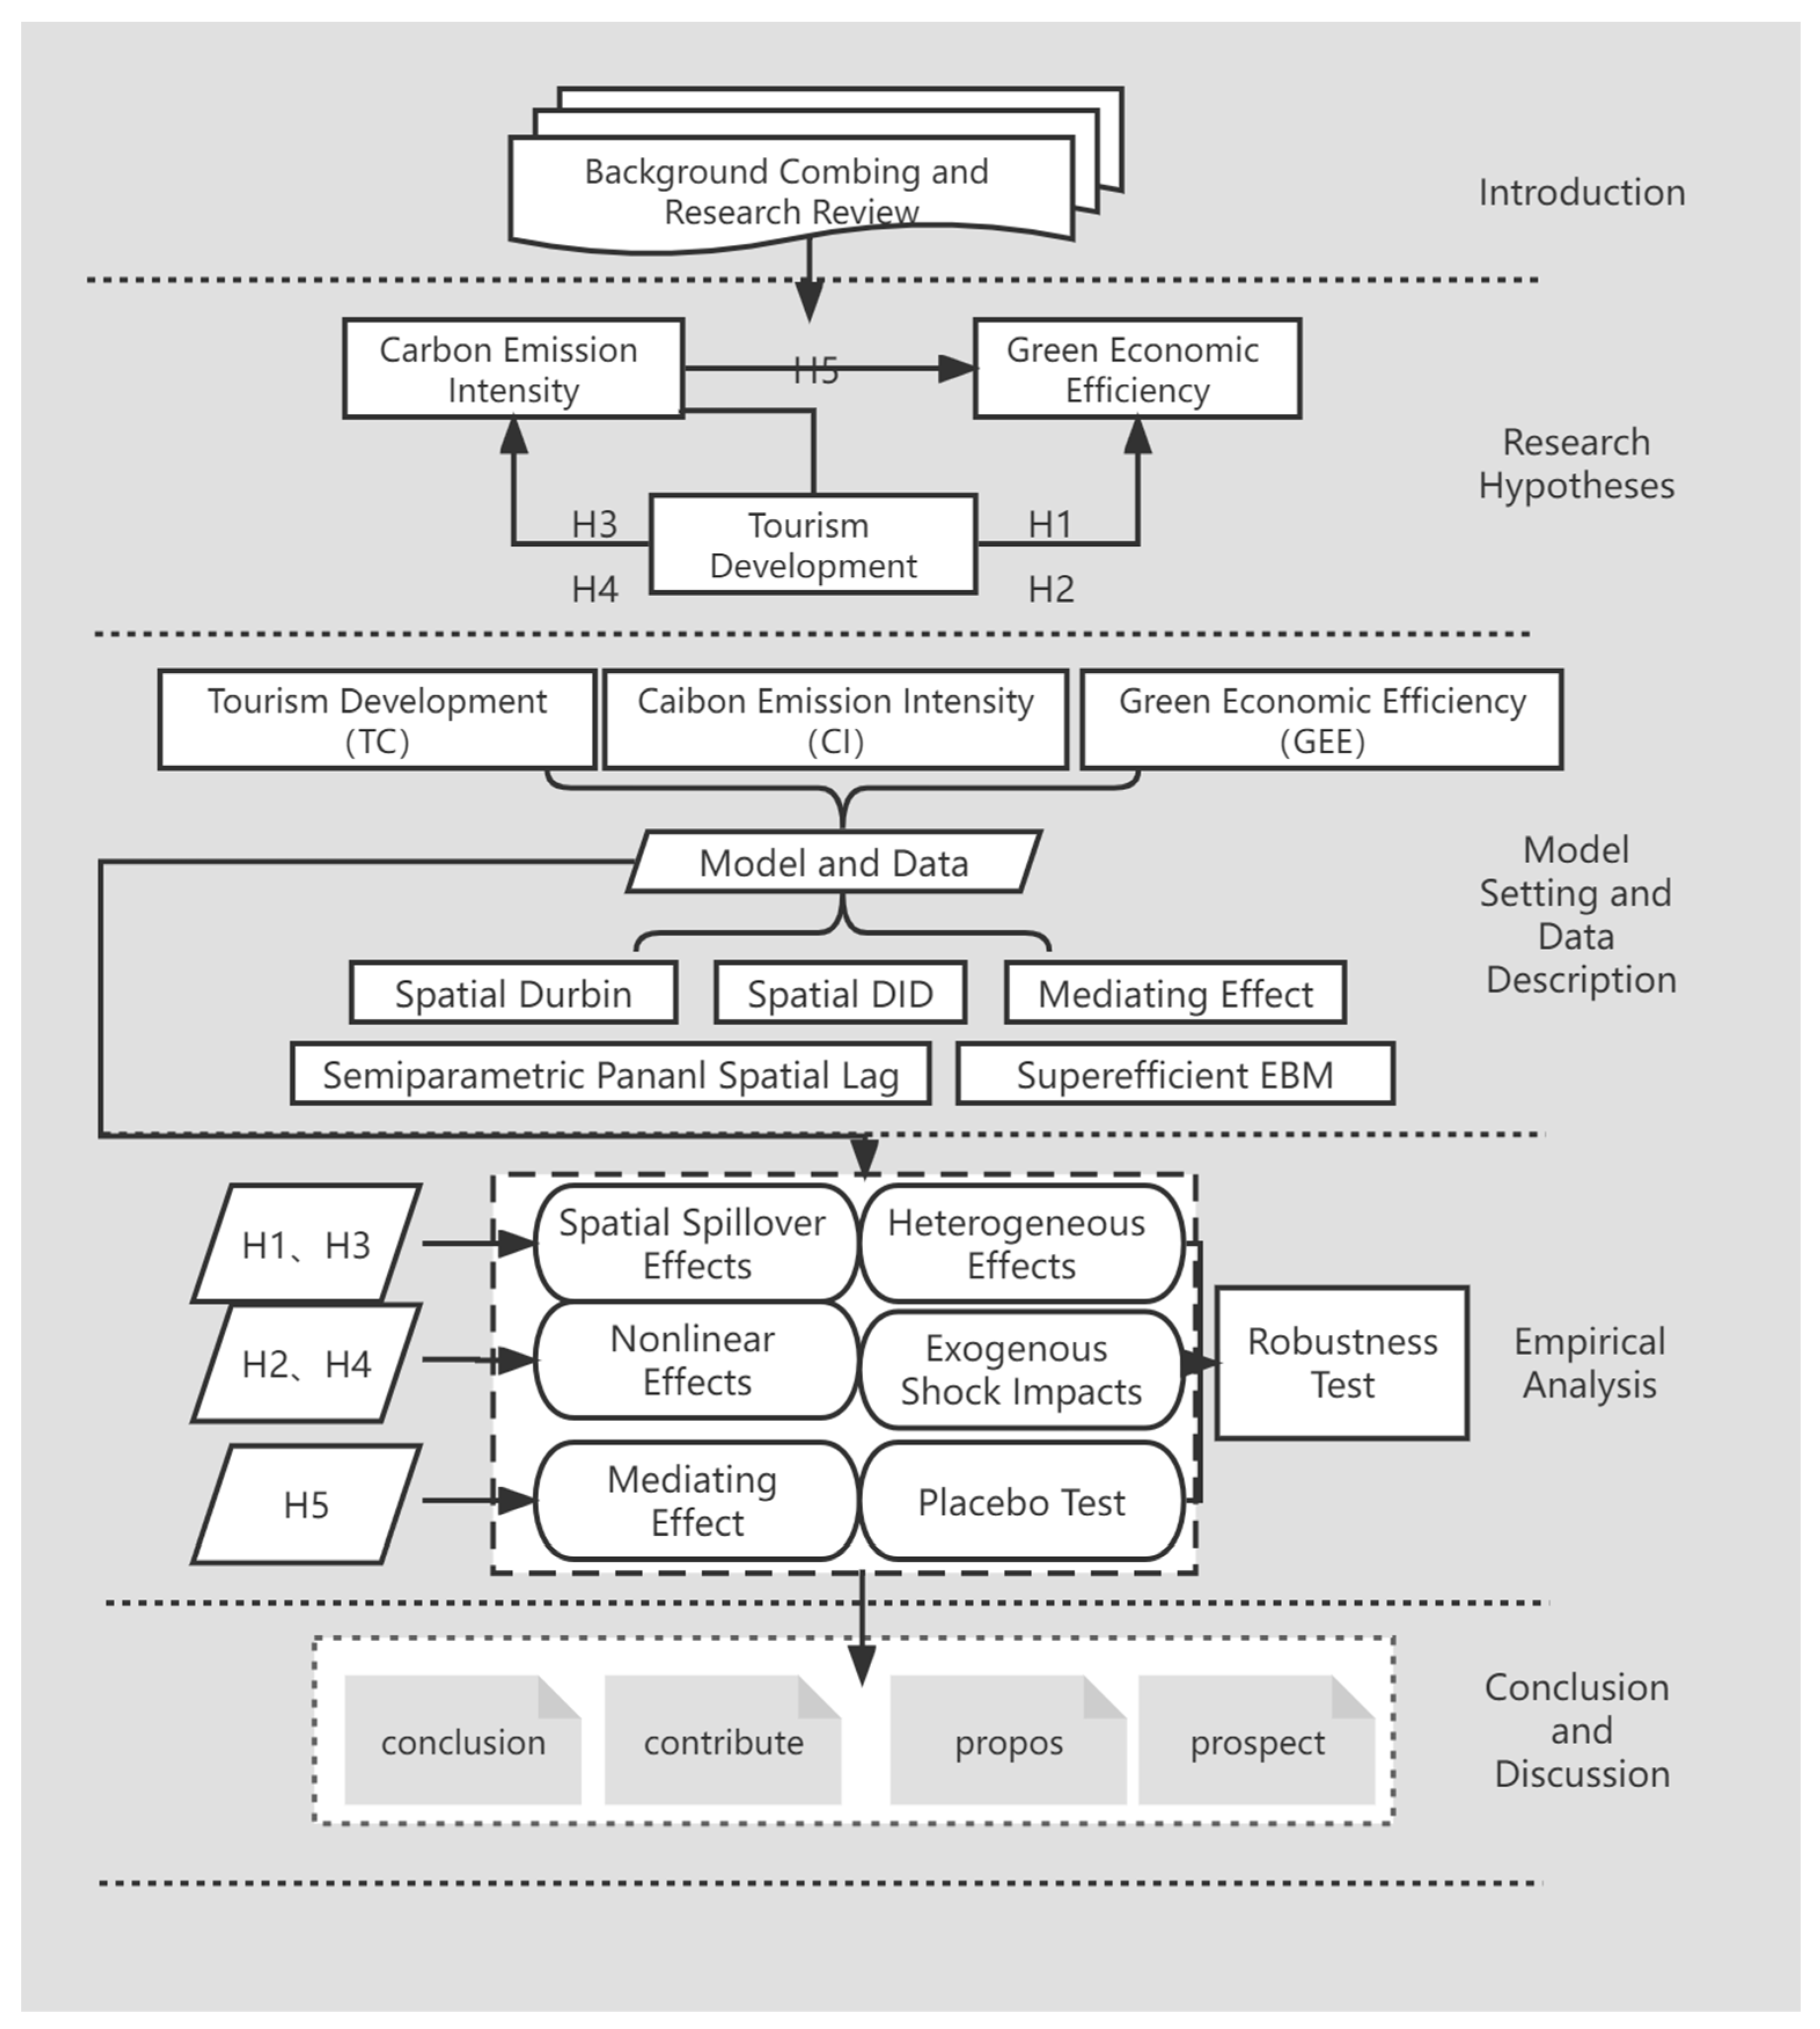
3. Model Setting and Data Description

3.1. Model Construction

3.1.1. Superefficient EBM Model

The hybrid distance function model (EBM) can be compatible with the radial ratio of input frontier values to actual values and realize the effective combination of radial and nonradial methods in data envelopment analysis. The model makes up for the deficiencies of DEA and SBM, giving more consideration to the efficiency level [24,25,26,27,28]. The following superefficient EBM model with undesired outputs and nondirectional and constant payoffs of scale is used to measure the green economic efficiency of 280 cities across China, and the obtained combined efficiency value (GEE) is used as the core explanatory variable of the spatial econometric model.
r * = min θ ε x i = 1 m w i s i / x i 0 φ + ε y r = 1 s w r + s r + / y r 0 + ε z p = 1 q w p   z s p   z / z p 0 s . t . j n x ij λ j + s i = θ x i 0   i = 1 , 2 , , m j = 1 n y rj λ j s r + = φ y r 0   r = 1 , 2 , , s j = 1 n z pj λ j + s p = φ z p 0   p = 1 , 2 , , q λ j 0 , s i , Sr + , s p 0
Regarding the specific meaning of these variables, r* denotes the combined efficiency value, and x, y and z denote the input, desired output and undesired output elements, respectively. m, s and q denote their quantities. λ denotes the relative importance of the reference unit, ε is the core parameter representing the importance of the nonradial component, and θ is the efficiency value in the radial condition. wi, wr and wp denote the i-th input, r-th desired output and p-th nonweights of the expected output indicators.

3.1.2. Spatial Durbin Model

This study adopts the spatial Durbin model (SDM) to test the spatial spillover effect of the tourism development level on urban green economic efficiency and carbon emission intensity and explores the nonlinear characteristic relationship on this basis. The acceleration of regional economic integration makes it possible for green economic efficiency to interact spatially among different cities. The spatial econometric model makes up for the deficiency that traditional measurement cannot introduce spatial factors, the spatial Durbin model contains the spatial dependence of both dependent and independent variables [14,20,21], and models (1)–(4) are as follows:
lnGEE it = ρ WlnGEE + β 1 lnTC it + β 2 lnCON it + θ 1 WlnTC it + θ 2 WlnCON it + δ i + μ t + ε it lnGEE it = ρ WlnGEE it + β 1 lnTC it + β 2 ln 2 TC it + β 3 lnCON it + θ 1 WlnTC it + θ 2 Wln 2 TC it + θ 3 WlnCON it + δ i + μ t + ε it lnCI it = ρ WlnCI it + β 1 lnTC it + β 2 lnCON it + θ 1 WlnTC it + θ 2 WlnCON it + δ i + μ t + ε it lnCI it = ρ WlnCI it + β 1 lnTC it + β 2 ln 2 TC it + β 3 lnCON it + θ 1 WlnTC + θ 2 Wln 2 TC it + θ 3 WlnCON it + δ i + μ t + ε it
where i and t denote region and time, respectively, W represents the spatial weight matrix, and βi and θi are the parameter vectors to be estimated and the spatial regression coefficients of the tourism development level. “Green economic efficiency” is GEE, CI is “carbon emission intensity”, TC is “tourism development”, CON is the control variable, and ρ is the spatial regression coefficient. “Tourism development” is TC, CON is the control variable, and ρ is the spatial regression coefficient. δi is the individual fixed effect, μt is the time fixed effect, and εit is the random error term.

3.1.3. Semiparametric Panel Spatial Lag Model

The semiparametric panel spatial lag model not only analyzes the influence of spatial factors but can also test the spatial nonlinear relationship between variables. To further analyze the spatial nonlinear effects of tourism development on urban green economic efficiency and carbon emission intensity, this paper draws on the related research [55] to further construct a semiparametric panel spatial lag model.
lnGEE it = α i + ρ WlnGEE it + β 1 lnCON it + θ 1 WlnCON it + G lnTC it + ε it lnCI it = α i + ρ WlnCI it + β 1 lnCON it + θ 1 WlnCON it + G lnTC it + u it
where G lnTC it represents the nonparametric part of the unknown function, α i represents the individual effect, ε it and u it represent the random perturbation term.

3.1.4. Mediating Effect Model

To test whether tourism development affects urban green economic efficiency through carbon emission intensity, a mediating effect model is constructed by drawing on the related research [14,21].
lnGEE it = α 0 + α 1 lnTC it + j = 2 n α j lnCON it + η i + ε it lnCI it = β 0 + β 1 lnTC it + j = 2 n β j lnCON it + η i + ε it lnGEE it = δ 0 + δ 1 lnTC it + δ 2 lnCI it + j = 3 n δ j lnCON it + η i + ε it
ηi is the individual fixed effect.

3.1.5. Exogenous Shock Testing Model of the Low-Carbon City Pilot Policy

  • Endogenous Relationship between Low-carbon Cities and Tourism Development
Low-carbon cities achieve green development by adjusting the industrial structure, reducing disposable energy use, using renewable resources as much as possible, and developing low-carbon transportation systems. Tourism can influence industrial optimization, clean energy use and low-carbon transportation. Under the “double carbon” strategy, low-carbon tourism is undoubtedly one of the paths for low-carbon city reform, and in addition to the low consumption of tourism itself and the low carbonization of the tourism process, the strong correlation of tourism itself with a reduction in carbon emissions can lead to the low-carbon transformation of more industries. Tourism development is in line with the essence and connotation of low-carbon city development, and low-carbon tourism can also be an effective path for green economic development in low-carbon cities [45]. Therefore, this paper uses the exogenous shock of low-carbon city pilots to evaluate the existing model and test the robustness of the spillover effect of tourism development on the green economic efficiency and carbon emission intensity of cities.
2.
Model Setting and Testing
The dummy variable is constructed as to whether the city is a “low-carbon city” pilot or not, and takes the value of 1 if the city is already a “low-carbon city” pilot at the end of the year and 0 otherwise [56].
Based on the spatial Durbin model, a multitemporal spatial DID expansion estimation was constructed based on relevant studies [56], and the coefficients of the variables were estimated by randomly selecting cities and any year as the sample size and rerunning the model test. Comparing whether there is a significant difference between the true value and the estimated interval can indicate whether the model estimation is biased by omitting city-time-level variables.

3.2. Description of Variables

3.2.1. Tourism Development

Compared with a single indicator, this paper adopts tourism development indicators [57], including the tourism economy and tourism scale, to measure the level of tourism development more comprehensively. Based on the domestic tourism income and number of people, inbound tourism income and the number of people under the city scale, the entropy weight TOPSIS method is used to obtain the tourism development level (TC) of 280 cities nationwide, which is used as the core explanatory variable of this spatial econometric model.

3.2.2. Carbon Emission Intensity

Urban carbon emissions include carbon emissions from direct energy consumption as well as carbon emissions from electric energy and thermal energy consumption. Drawing on the related research [58], carbon emissions from liquefied petroleum gas, transportation, electric energy and thermal energy consumption are summed to obtain the total urban carbon emissions. The ratio of the total carbon emissions of a city to its GDP is used to measure the intensity of carbon emissions of the city.

3.2.3. Green Economy Efficiency

The green economy is an economic development model that maximizes resource utilization by improving development efficiency and reducing environmental pressure. According to the current situation of social, environmental and resource problems, taking into account the availability and consistency of data, the green economy efficiency index system of cities is constructed from the perspective of resource input-economic output-pollution output regarding relevant research. Based on the existing studies [14,20,21,22,59], we add “the number of industrial enterprises above the scale” to the labor factor level and change the previous consideration from the number of employees to the number of employees and enterprises to improve the index system. Table 1 shows the green economy efficiency measurement indicators.

3.2.4. Control Variables

Based on previous studies, such as Tong Yun [60], the current studies mostly analyze the effects of the economic level, environmental regulation, technological innovation and foreign investment on urban green economic efficiency and carbon emission intensity, while variables such as industrial structure, government intervention and financial development are gradually added as the research progresses. To reduce the estimation bias, the following control variables are chosen in this paper: industrial structure (is), using the share of secondary industry value added in GDP as a proxy variable [21,61]; economic development (eco), using the GDP per capita representation [59]; foreign investment (fdi), using the share of foreign direct investment in urban GDP as a proxy variable [14]; technological innovation (ino), using the share of science and technology expenditure in urban GDP [14]; environmental regulation (env), characterized by the comprehensive utilization rate of the industrial fixed waste [25].

3.3. Data Description

Two hundred and eighty prefecture-level cities in China are the subject of the data in this paper, which involve a total of 21 variables in the fields of energy, tourism, environment, and economy; the data collection was challenging; most city statistics were not updated in a timely manner, leading to a significant amount of missing data in 2020; and artificially completing the data would interfere with the validity of the research findings. Likewise, the pace of China’s tourism development has slowed down dramatically as a result of the new crown pandemic, taking into account that force majeure circumstances will compromise the validity of the findings and have a negative influence on tourism’s contribution to the green economy. Given the aforementioned justifications, based on the availability and consistency of data, this paper selects the relevant data of 280 cities in 30 provinces from 2007 to 2019, excluding the data of Tibet, Hong Kong, Macao and Taiwan. Due to the long period and the change in some city data, this paper takes 2019 prefecture-level cities as the benchmark, excludes the data of merged cities, and retains the data related to the removal of counties and promotion of cities. The relevant data are obtained from The China City Statistical Yearbook, China City Construction Statistical Yearbook, China Energy Statistical Yearbook and Tourism Statistical Yearbook of each city. Carbon emission data were calculated based on county-level data from the literature. The list of pilot low-carbon cities is based on the list announced by the National Development and Reform Commission. To avoid the interference of multicollinearity and pseudo-regression, the VIF test and unit variance test were conducted on the panel data, and the results showed that the variance inflation factor of the panel data was less than three, and they all passed the LLC test and Fisher-ADF test at the 1% significance level, so there was no multicollinearity problem, and the data were smooth. In addition, the effect of heteroskedasticity was eliminated by taking the logarithms of all variables.

4. Results

4.1. Spatial Autocorrelation Test and Spatial Econometric Model Selection

Urban carbon emission intensity and green economic efficiency are spatially correlated, which is a prerequisite for spatial econometric modeling [60]. Stata.23 is used to calculate the global Moran index to explore the spatial agglomeration characteristics. As shown in Table 2, the GEE Moran index is positive for all the years from 2007 to 2019, and the spatial agglomeration strengthens year by year except for 2013–2015, all of which pass the 1% significance level test. During the observation period, the Moran index of Carin is positive in all cases, and the degree of spatial agglomeration increases in fluctuation. Overall, both urban green economic efficiency and carbon emission intensity have significant spatial agglomeration characteristics.
Based on passing Moran’s I test, the spatial effect econometric model can be selected. Additionally, to measure the nonlinear characteristics of tourism development on urban carbon emission intensity and green economic efficiency, models (3) and (4) containing quadratic terms of tourism development variables were introduced. First, the LM test, LR test and Wald test were performed to identify the spatial econometric models. Both the LM spatial lag test and LM spatial error test showed high significance, so both the SAR model and SEM were suitable for this study, and we chose the SDM model that combined both. Then, the LR test and Wald test were applied to further determine whether the SDM could be degraded to the SAR model or SEM. The comprehensive test results showed that the SDM was better than the SAR and SEM, so the SDM was selected as the baseline regression model in this paper. Based on the SDM model [62], all matrices passed the Hausman test at a 1% significance level except for model (1), which had a negative value, so the fixed-effects model was selected. As shown in Table 3, the overall R2 of the individual fixed-effects model is significantly better than that of the time-point fixed-effects and double fixed-effects models. Finally, the individual fixed-effects spatial Durbin model is chosen to analyze the impact of tourism development on urban carbon emission intensity and green economic efficiency.

4.2. Spatial Spillover Effects of Tourism Development on Urban Carbon Emission Intensity and Green Economic Efficiency

The spatial spillover effect can be decomposed into the direct effect, indirect effect and total effect. Among them, the direct effect includes the direct effect of tourism development on the explained variables and the feedback effect caused by tourism development affecting the explained variables in adjacent areas. The indirect effect represents the spatial spillover effect of tourism development, including the influence of tourism development in neighboring areas on the explained variables in the region and the influence of tourism development in neighboring areas on their own explained variables, which in turn has an impact on the explained variables in the region. The total effect, on the other hand, is the sum of the direct and indirect effects, reflecting the average effect of tourism development on the explanatory variables.
As seen from Table 4, the total effect coefficient (lnTC) of the impact of tourism development on urban green economic efficiency is significantly positive, indicating that the development of tourism is conducive to enhancing urban green economic efficiency. On the one hand, tourism is a resource-dependent industry, and good ecological and environmental conditions are the basis of its development, so tourism investment involves financial support for the ecological and environmental restoration of tourism destinations. On the other hand, tourism development produces change in the industrial structure of destinations, forcing enterprises to conduct energy restructuring, and especially has a crowding-out effect on industries, but due to market demand, tourism development can have a significant impact on the service sector. However, tourism development can optimize the service and manufacturing industries due to market demand and technology spillover, reduce their pollution emissions, and thus improve the efficiency of the destination’s green economy. The direct effect of tourism development is not significant. Tourism itself has low pollution emissions, and tourism development does not act directly on green economic efficiency but indirectly enhances urban green economic efficiency by forcing local industrial structure optimization and other forms through high correlation with other industries. For example, for every 1% increase in the tourism development level, the green economic efficiency of neighboring areas is indirectly enhanced by 0.442%, i.e., the promotion effect of tourism development on urban green economic efficiency is mainly manifested as an indirect effect, i.e., spillover effect [60]. Therefore, hypothesis H1 is verified.
As seen from Table 4, the total effect coefficient of the impact of tourism development on the intensity of urban carbon emissions is significantly negative, indicating that tourism development can mitigate urban carbon emissions and achieve urban emission reduction. On the one hand, because tourism itself is a low-consumption and low-carbon industry, its development is based on the ecological environment. On the other hand, the tourism development model is constantly updated, and green development has been a basic requirement, especially the development of the digital economy in recent years, which provides the basis for the creation of a digital tourism model and, to a large extent, relieves the pressure of urban carbon emission reduction. As tourism development affects the green economic efficiency of cities, the urban carbon reduction effect of tourism development also shows a significant spillover effect, with each 1% increase in the tourism development level indirectly reducing the carbon emission intensity of neighboring areas by 1.336%. The development of tourism is one of the main paths for carbon reduction in cities [32]. Therefore, hypothesis H3 is verified.
From the control variables, the effect of industrial structure on green economic efficiency mainly works as a direct effect, and the effect on carbon emission intensity mainly works as an indirect effect. Tourism development leads to an increase in factor costs, which makes the maximum use of energy structure through reasonable resource allocation and reduces the redundancy of resource inputs and pollution emissions such as carbon dioxide. The results of the effect of economic level on green economy efficiency are not significant, indicating that economic development and green economy development are not equivalent. Meanwhile, the effect of the economic level on carbon emission intensity shows a significant positive direction, which integrally indicates that most of China’s cities are still trying to eliminate the severe development model, and are still sacrificing resources and the environment for the improvement of the economic level, which does not correspond to the development of the green economy. To a certain extent, the enhancement of the city’s reputation and the brand effect, in addition to the management experience provided by foreign investment, improved production processes, technological innovation and improvement of the business environment caused by the growth of tourism development promote the city’s carbon emission reduction and green economy development [6]. The direct and indirect effects of technological innovation on the efficiency of the green economy are significantly positive, and innovation has been an important variable that has helped green economic development to reach a turning point. Under the stimulation of the policy of cultural tourism integration, “tourism +” continues to push out new ideas and become richer in industries, but “tourism + technology” still has serious deficiencies that inhibit economic growth and green development, but the development of the technology level is not enough to significantly reduce carbon emission intensity in most cities at present [63]. The spillover effect of environmental regulation variables is significant [64]; environmental regulation is necessary due to pollution externalities; in the short term, it is inhibitory to economic development, and the direct effect is not obvious. Tourism development causes the agglomeration of the tourism industry, which not only promotes the improvement of the carbon emission efficiency of tourism but also promotes the expansion of the service industry and the development of manufacturing services by forcing the optimization of industrial structure, bringing the “innovation compensation” effect and ultimately achieving a Porter “win-win” [64]. Through the interaction and correlation with foreign investment and environmental regulations, tourism development drives technological innovation and industrial structure optimization, reduces the intensity of urban carbon emissions, and enhances the efficiency of the green economy.

4.3. Heterogeneous Effects of Tourism Development on Urban Carbon Intensity and Green Economic Efficiency in Different Regions

Considering the possible spatial heterogeneity of the impact of tourism development on urban green economic efficiency and carbon emission intensity, this paper divides regions and urban agglomerations, and the criteria for making these divisions are shown in relevant documents (For regional division standards, see the National Bureau of Statistics’ “Methods for the Division of East, West, Central and Northeast Regions”) and the literature [65]. The region is divided into four parts, eastern, central, western and northeastern, and cities are categorized into two groups, urban agglomeration and non-urban agglomeration, to test the regional heterogeneity of tourism development on urban green economic efficiency and carbon emission intensity. Table 5 and Table 6 show the spatial heterogeneity impact of tourism development on green economy efficiency and carbon emission intensity, respectively.
In the eastern region, tourism development makes a significant contribution to local and neighboring green economic efficiency, and the effect is inferior compared with the western and northeastern regions, which may be due to the weakening of the marginal effect of tourism development on urban green economic efficiency as the economic level increases, and the economic level implies to a certain extent that technological innovation and industrial structure optimization are also higher in the eastern region due to the developed tourism industry. Green economic development tends to be flat growth. The effect of tourism development in the eastern region on urban carbon emission intensity is not significant, probably because the industrial structure of cities in the eastern region is no longer dominated by the severe secondary industry development model, and tourism development no longer has the extrusion effect on the high carbon emission secondary industry. The local effect of tourism development in the central region is not significant, and the effect of tourism development in the central region on the green economic efficiency and carbon emission intensity of neighboring cities is significant. On the one hand, the level of tourism development in the central region is low, and the promotion effect is not obvious. On the other hand, in the context of integrated development of the central city cluster, many factors can interact with one another, which leads to the obvious spillover effect of tourism development. Tourism development in the western region can not only improve the efficiency of the local green economy but also promote the development of the green economy in neighboring areas, and the urban carbon emission reduction effect of tourism development is mainly local. That is, tourism development in the western region still has an optimization effect on the industrial structure of the local cities but the “resource curse”, and the “Dutch disease effect”, which inhibit green economic efficiency and carbon emission reduction in cities, are also evident [48]. The effect of tourism development in Northeast China on the green economic efficiency of cities is significant, but the spillover effect on carbon emission reduction is not obvious, which indicates that the development of tourism in Northeast China, as a heavy industrial base, helps to alleviate local pollution emissions and is beneficial to the development of the urban green economy. From the city cluster heterogeneity, the local effect of tourism development on green economic efficiency both inside and outside the city cluster is not significant, and the spatial spillover effect on neighboring cities is significant. There is no significant effect on urban carbon emission reduction, partly because the development of city clusters is not synergistic, and city clusters do not bring due opportunities to specific cities. In summary, there is no “siphon effect” in urban agglomerations, with significant differences between the eastern, central, western and northeastern regions, and again, the spatial spillover effect of tourism development on urban green economic efficiency is more significant than the direct effect.

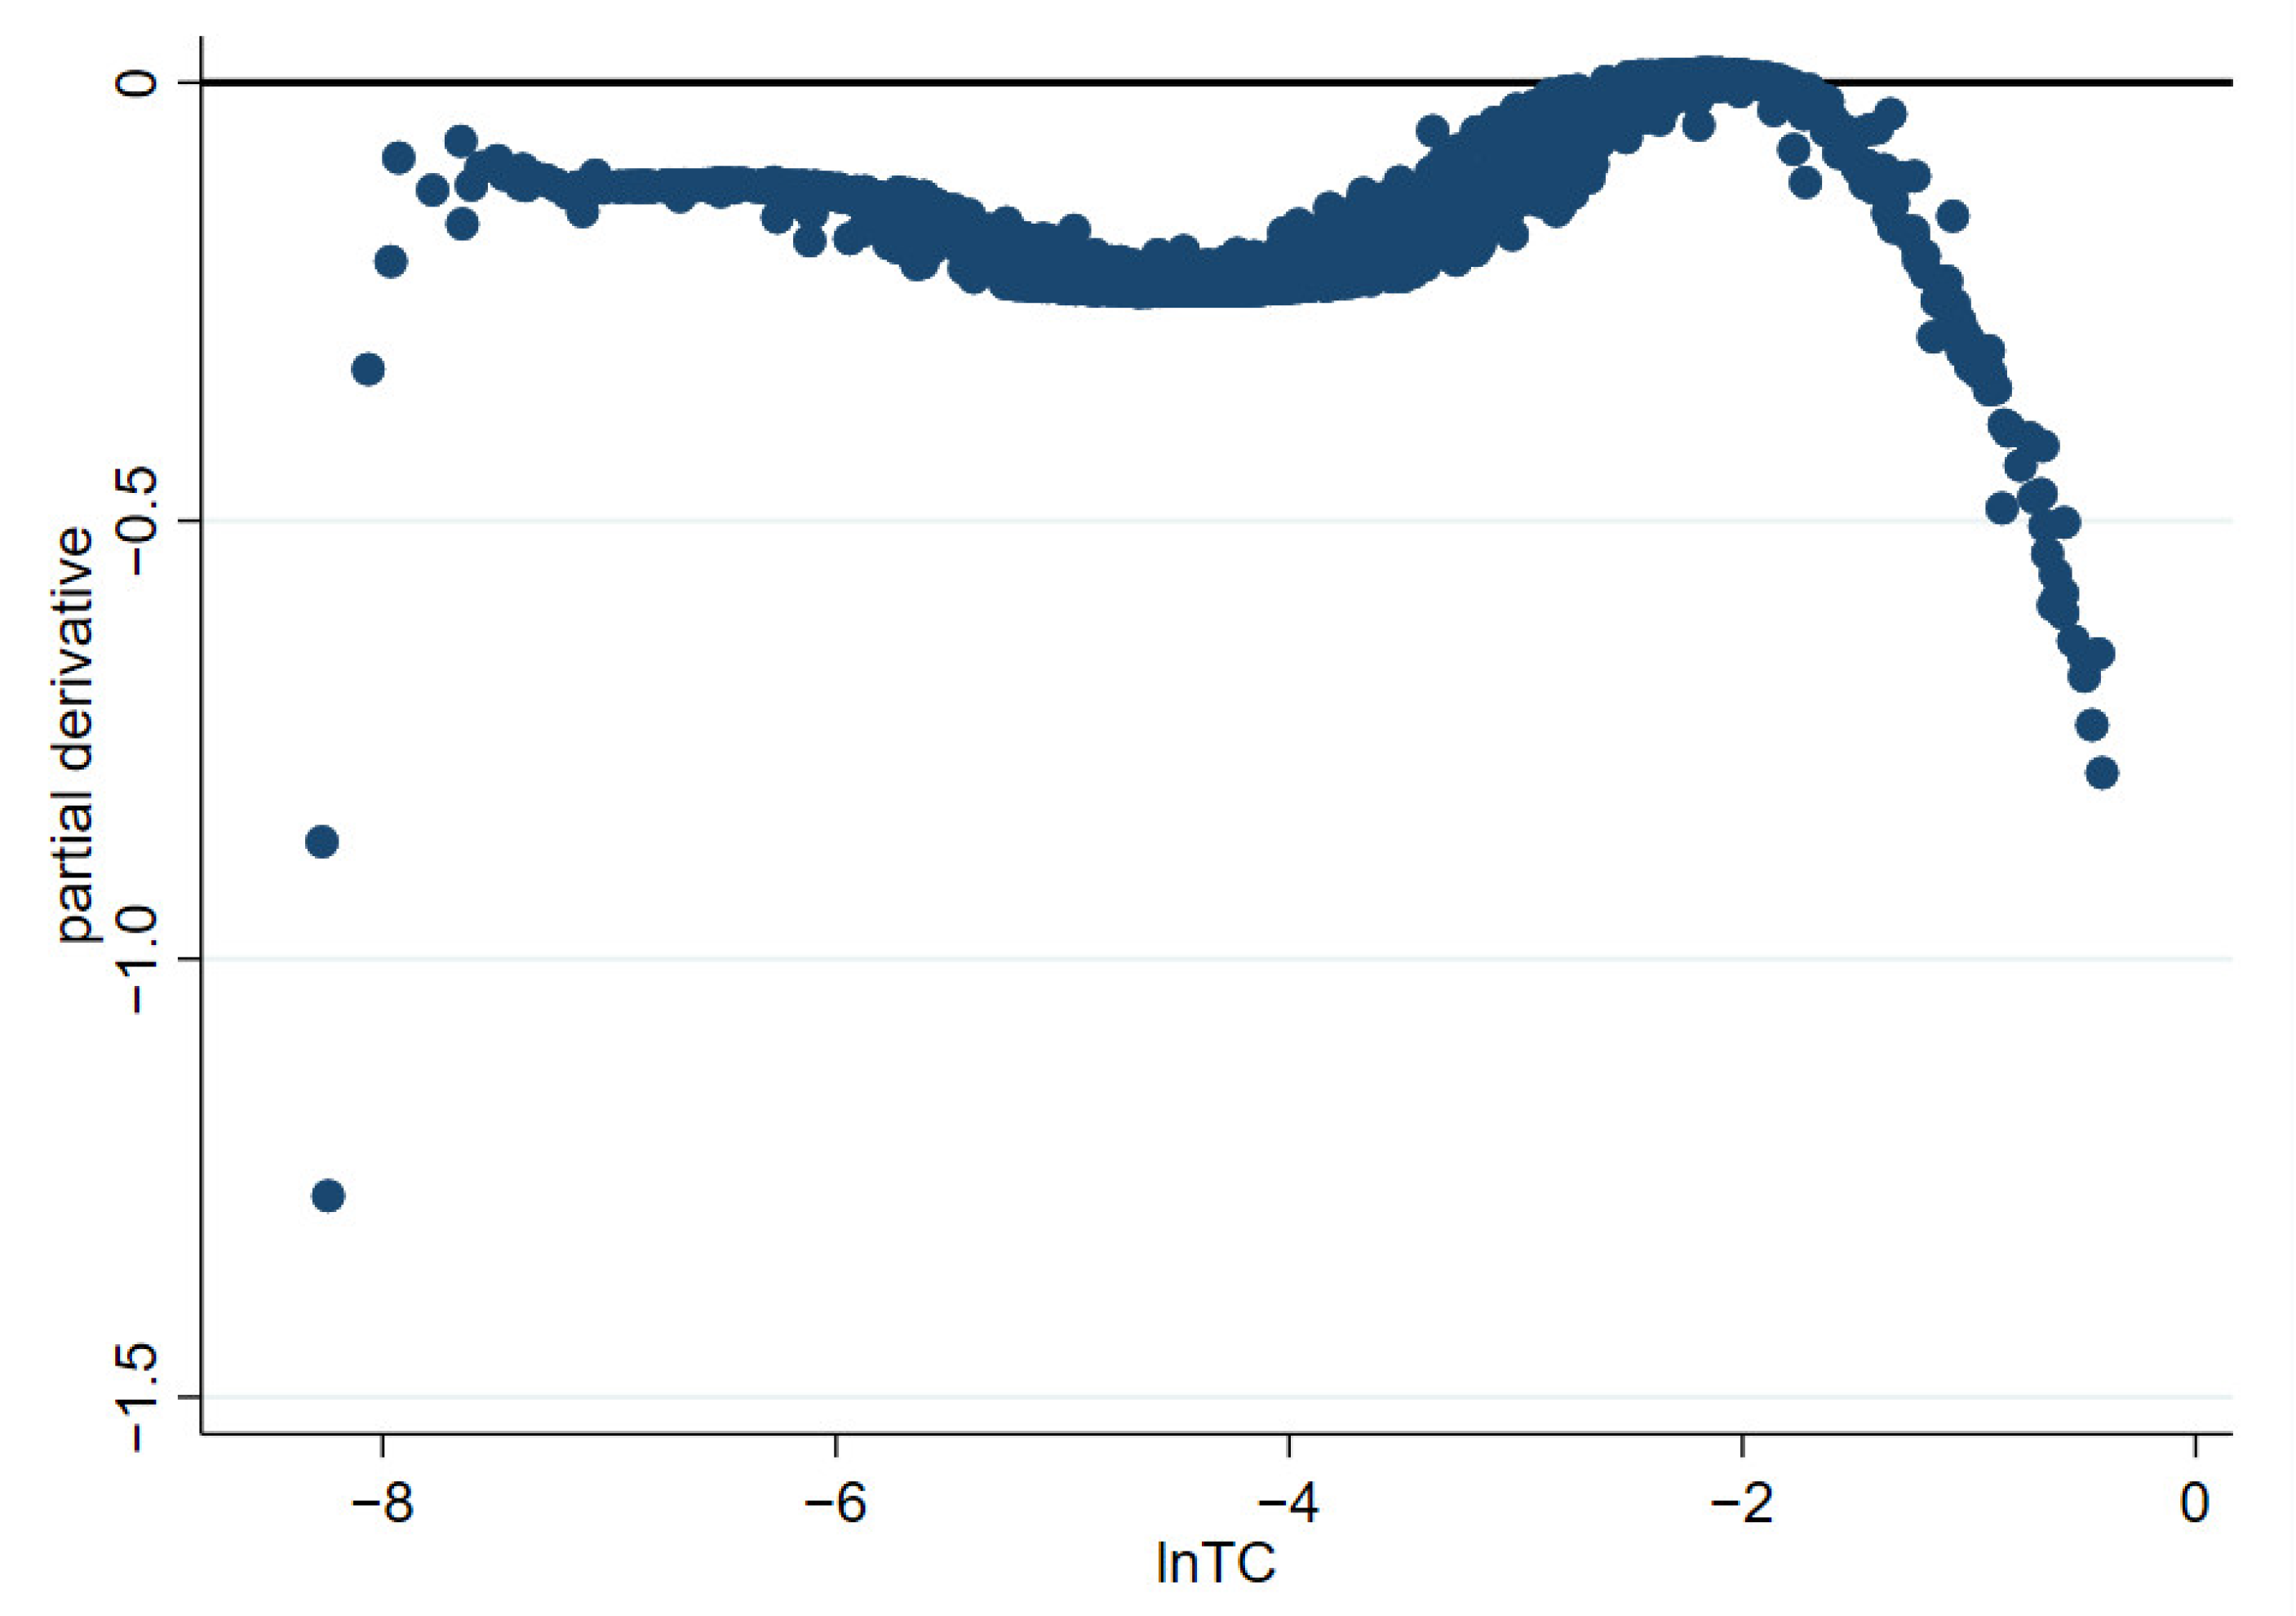
4.4. Nonlinear Effects of Tourism Development on Carbon Emission Intensity and Urban Green Economic Efficiency

To investigate whether there is a similar phenomenon of tourism development on urban green economic efficiency and carbon emission intensity [64], this paper introduces a quadratic term of the logarithm of tourism development level based on the spatial Durbin econometric model to test the nonlinear characteristic relationship between tourism development and carbon emission intensity and urban green economic efficiency. The results are shown in Table 7. The positive coefficient of the quadratic term of tourism development on urban green economic efficiency indicates that there is a positive U-shaped nonlinear characteristic relationship between tourism development and urban green economic efficiency, and similarly, there is an inverse U-shaped nonlinear characteristic relationship between tourism development and urban carbon emission intensity [32]. Similarly, there is an inverse U-shaped nonlinear relationship between tourism development and urban carbon emission intensity. Furthermore, to accurately measure the degree of nonlinear effects, a semiparametric spatial lag model is introduced, and the nonlinear relationship between tourism development and urban green economic efficiency and carbon emission intensity can be visually observed by drawing the partial derivatives of G(lnTC) in the model, as shown in Figure 3 and Figure 4, where the horizontal coordinates indicate the level of tourism development and the vertical coordinates indicate the marginal effects.
From Figure 3, it can be seen that tourism development has a positive “U” shaped nonlinear effect on urban green economic efficiency, but the curve is always above 0, which means that the marginal effect of tourism development on urban green economic efficiency is always positive, i.e., it always shows a facilitating effect. The curve in Figure 3 shows that although the tourism industry has always had a positive effect on the green economic efficiency of the city, there are roughly three stages. The first stage is lnTC between −8 and −7, with decreasing marginal effects, which indicates that the development of tourism does produce certain pollution in the initial stage or will attract a large number of manufacturing industries to gather in the tourist destination, thus causing some suppression of the marginal effect of tourism development on green economic efficiency. This causes a certain suppression of lnTC from −7 to −2. The second stage is between lnTC from −7 to −2, and the positive marginal effect of tourism development in this stage grows slowly and represents the exploration stage of the green tourism development model. The third stage is the stage after lnTC-2, which fully demonstrates the positive effect of tourism development on urban green economic efficiency. Therefore, hypothesis H2 is verified.
Figure 4 shows that tourism development has an “M” shape on urban carbon intensity, which is different from the inverted “U” shape obtained in the previous paper, and the “U” shape may only be part of the “M” shape. In contrast, the marginal effect of tourism development on urban carbon intensity is overwhelmingly below 0, indicating that tourism development is beneficial for cities to reduce carbon emissions. Similarly, it can be seen that the mitigation effect of tourism development on urban carbon emission intensity is relatively stable until lnTC is −3, with a brief rise in the curve between −3 and −2. The marginal effect ushers in a rapid decline after −2. As with the marginal effect of green economic efficiency, tourism development, after a certain point, has a positive impact. Therefore, hypothesis H4 is verified.

4.5. Mediating Effect of Urban Carbon Emission Intensity on the Role of Tourism Development on Green Economic Efficiency

To examine whether urban carbon emission intensity has mediating utility in the effect of tourism development on urban green economic efficiency, the mediating utility model is used, and a second test is conducted by bootstrapping to ensure the robustness of the test results. Tourism development has a significant positive impact on urban green economic efficiency, which is consistent with the previous results, while urban carbon emission intensity has a significant negative impact on urban green economic efficiency, and urban carbon emissions have an inhibitory effect on the improvement of green economic efficiency, which also confirms the robustness of the mediated utility model. The test result of model (7) shows that urban carbon emission intensity has a significant mediating effect on the influence of tourism development on urban green economic efficiency (Table 8); meanwhile, the result of the bootstrap test shows that the upper and lower bounds of BC do not contain 0 between them, and the test is passed, which proves the mediating utility of urban carbon emission intensity. Therefore, hypothesis H5 is verified.

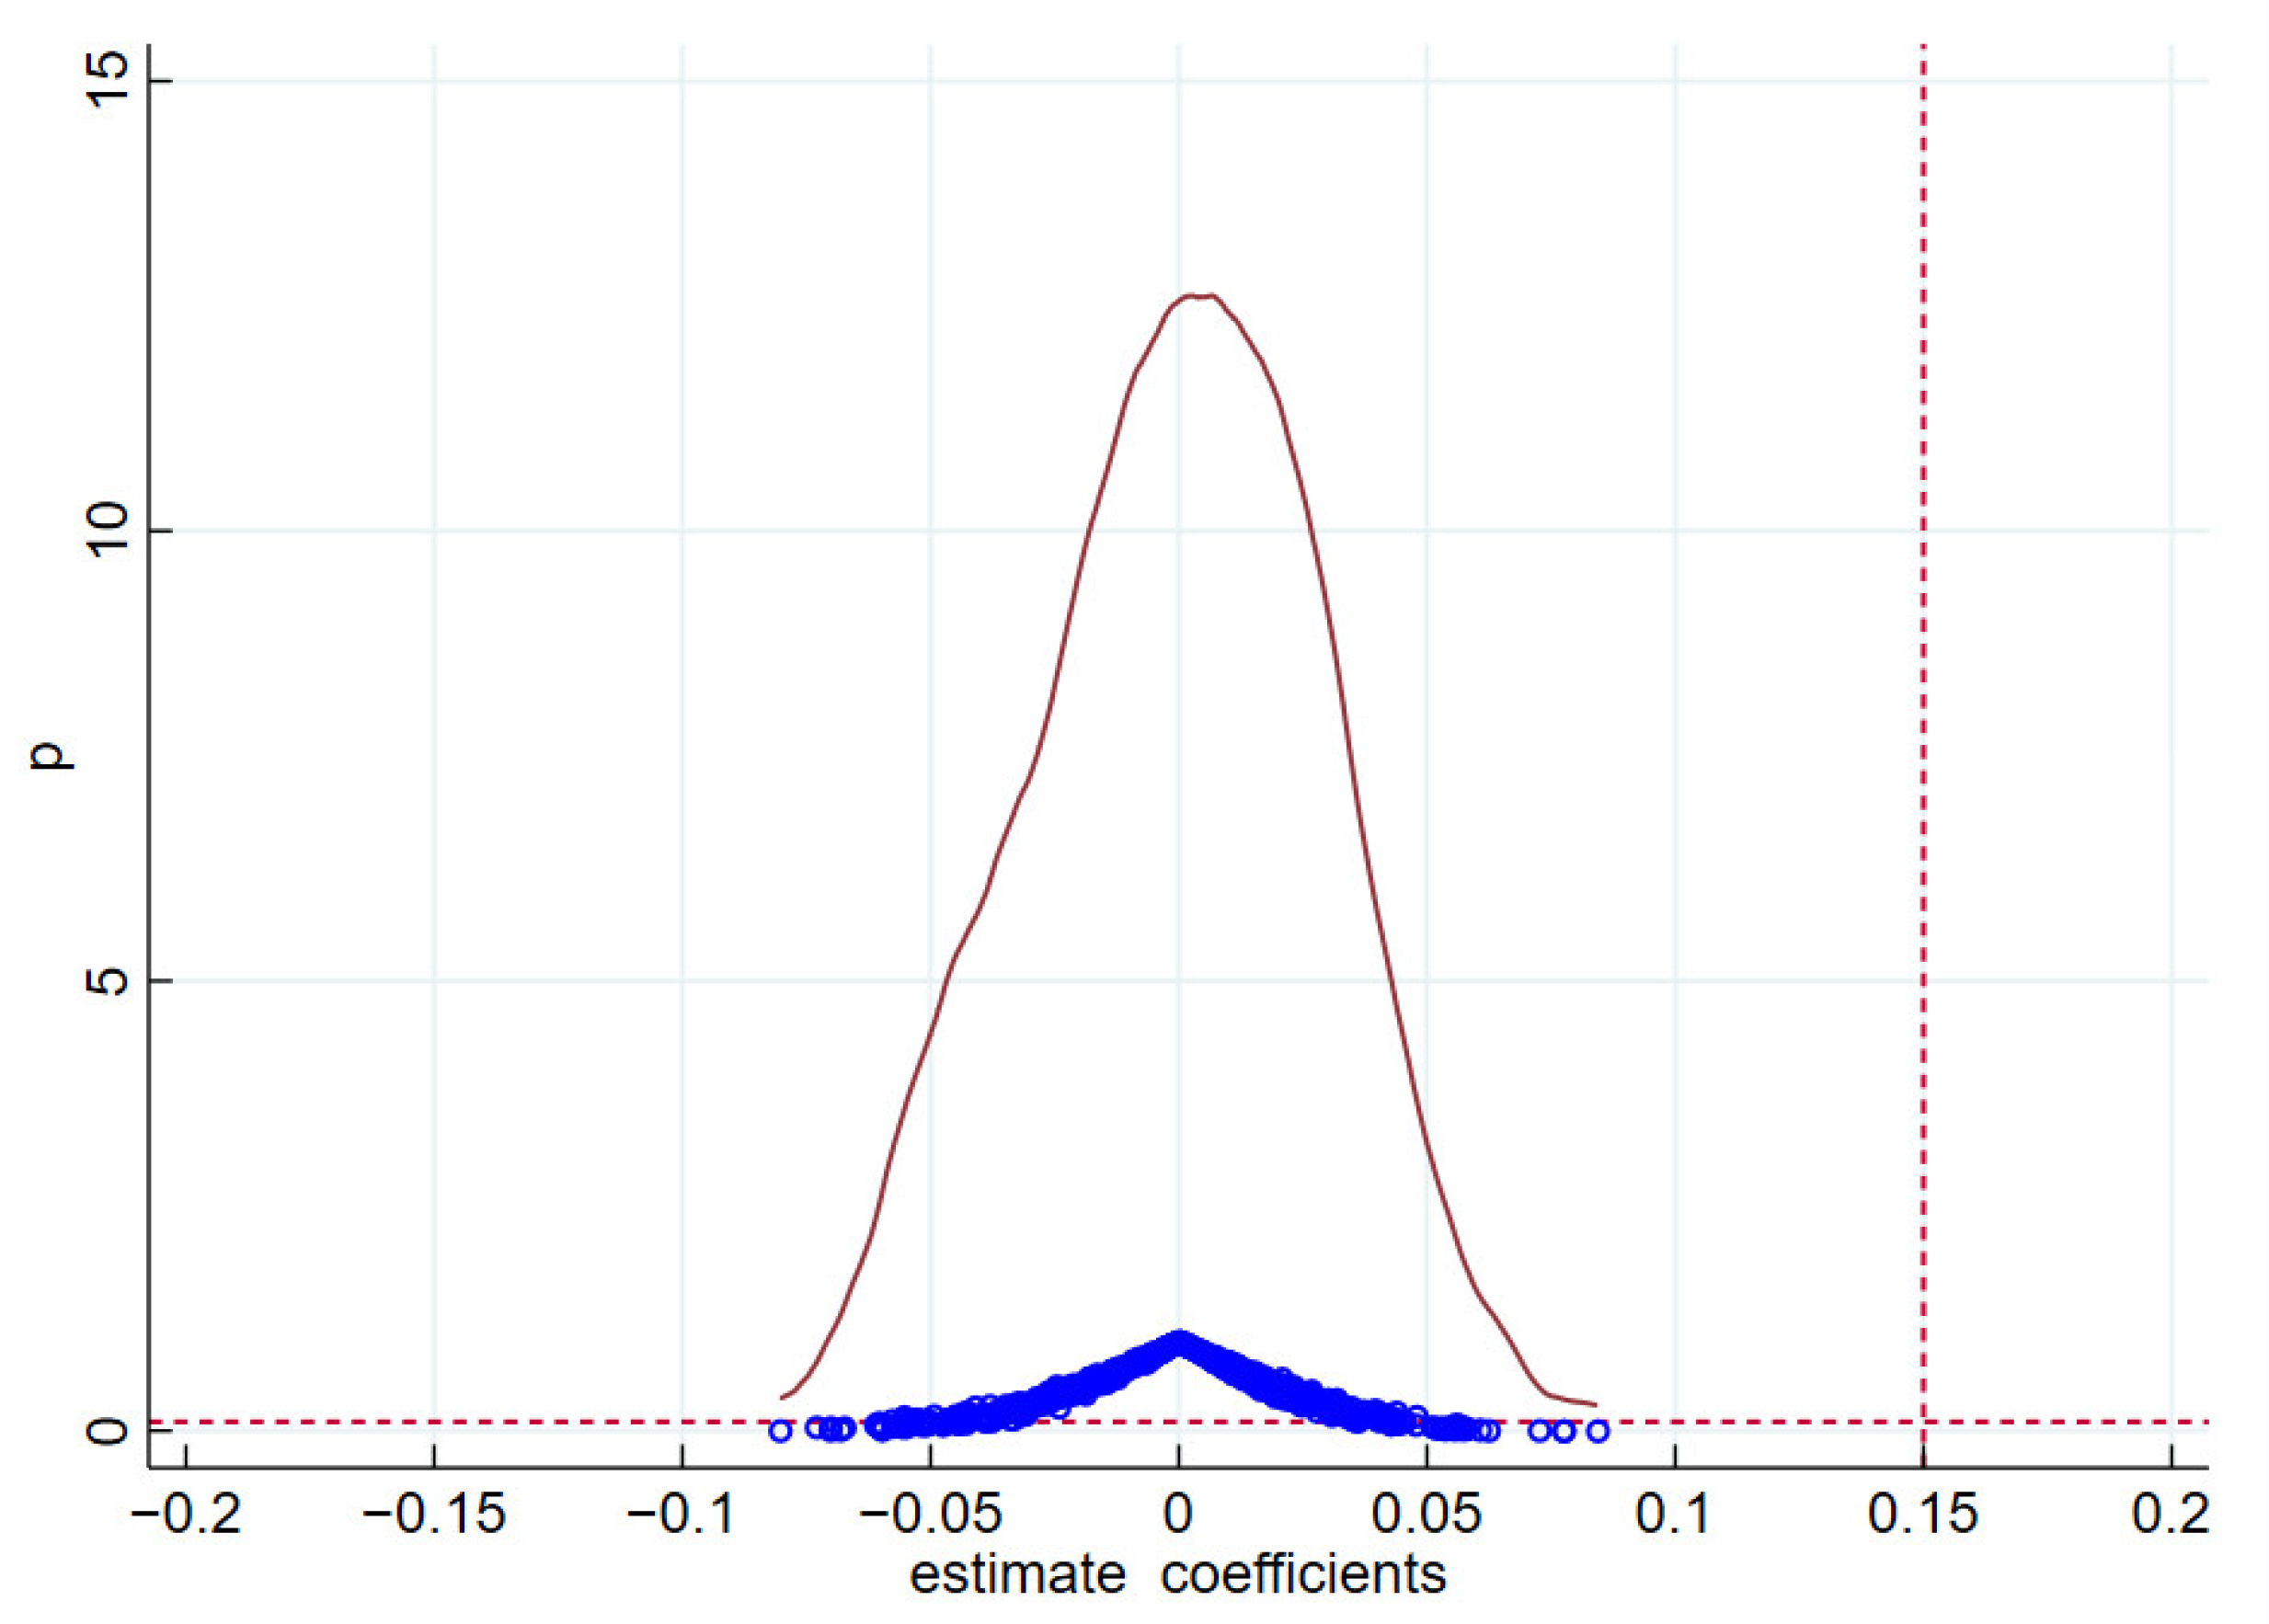
4.6. Exogenous Shock Impacts of Low-Carbon City Pilot Policies

The parallel trend test allows the use of multiperiod DID for policy assessment analysis. In this paper, the low-carbon city pilots enacted in China in 2010 and afterward are used as dummy variables, which are low-carbon city pilots recorded as 1 and 0 otherwise. First, the traditional multiperiod DID is used for estimation, as shown in Table 9. The traditional DID results show that with or without control variables, the exogenous shock of the low-carbon city pilot policy has a significant positive effect on city green economic efficiency and carbon emission intensity, and under the spatial DID model, the low-carbon pilot city policy shock on both city green economic efficiency and carbon emission intensity shows a significant spillover effect. As shown in Figure 5 and Figure 6, the kernel density distribution of the estimated coefficients by 1000 randomly generated treatment groups shows that the red curves are all above the horizontal line of 0.1, and the blue curves have p values of mostly approximately 0. The values of the true coefficients are shown as red dashed lines, which are significantly different from the red curves on the left, and the placebo test indicates that the estimation results are not biased. The low-carbon city pilot reflects the realistic path of tourism development to adjust the industrial structure, and tourism development promotes green economic efficiency and reduces the carbon emission intensity of the city in the construction of the low-carbon pilot city, so the exogenous test in this study further verifies the robustness of the effect of tourism development on urban green economic efficiency and urban carbon emission intensity.

5. Conclusions and Discussion

5.1. Conclusions

In this paper, based on the mechanism of the influence of tourism development on urban green economic efficiency and carbon emission intensity, we measured the levels of tourism development and urban green economic efficiency and carbon emission intensity of 280 prefecture-level cities from 2007 to 2019 using entropy TOPSIS and superefficiency EBM and tested the spatial spillover effect of tourism development on urban green economic efficiency and carbon emission intensity using the spatial Durbin model. The spatial heterogeneity and nonlinear characteristics of the spillover effects from cities are further analyzed. Finally, the mediating role of urban carbon emission intensity in the impact of tourism development on urban green economic efficiency is examined.
Tourism development has a significant enhancing effect on urban green economic efficiency and carbon emission intensity mitigation, and it also decomposes the role effect. It is found that the green economic effect and carbon emission reduction effect of tourism development are mainly manifested as spillover effects. From the perspective of regional heterogeneity, it is found that the green economic effect and carbon emission reduction effect of tourism development are much less effective in the eastern region than in the central, western and northeastern regions. The results show that the green economic effect and carbon emission reduction effect of tourism development are not affected by urban agglomeration [60], which is basically consistent with Tong Yun’s conclusion.
The green economic effect and carbon emission reduction effect of tourism development are nonlinear, with a positive “U” shape and an “M” shape, respectively. It is found that although tourism development has a certain degree of negative impact on green economic efficiency and carbon emission intensity at the early stage, the overall impact is positive. At the same time, the green economic effect and carbon emission reduction effect of tourism development significantly increase after the level of tourism development reaches 0.135 or above, and by calculation, only 13% of the cities have reached this level in 2019.
The results of the intermediary effect show that carbon emission intensity has a significant intermediary effect in the influence of tourism development on the green economic efficiency of cities. Tourism development can achieve a green economic effect through its carbon emission reduction effect. Moreover, the low-carbon city policy not only verifies the positive effect of the policy on carbon emission reduction and the green economic development of cities but also proves that the green economic effect and carbon emission reduction effect of tourism development are robust.

5.2. Discussion

This study complements and enriches the impact and spillover effects of tourism development on urban green economic efficiency and carbon emission intensity. It also examines the spatial heterogeneity of urban clusters and different regions and demonstrates the nonlinear characteristic relationship between tourism development and urban green economic efficiency and carbon emission intensity strength.
The possible marginal contributions of this study are as follows: this study is supported by the data of 280 prefecture-level cities in China from 2010 to 2019 and uses the “low-carbon city pilot” as an exogenous shock to test the spatial spillover effects of tourism development on urban green economic efficiency and carbon emission intensity. At the same time, this study measures the development of the tourism industry in terms of both tourism scale and tourism economy, and the results are more representative. This study explores the nonlinear characteristic relationship between tourism development on urban green economic efficiency and carbon emission intensity, further improving and enriching the study of the spillover effect of tourism development on urban green economic efficiency. Moreover, this paper confirms the mediating role of carbon emission intensity in tourism development for urban green economic efficiency spillover.
Meanwhile, the following policy insights are obtained from this paper. First, the spillover effect of tourism development on urban green economic efficiency and carbon emission intensity has significant spatial heterogeneity, and different regions should develop differentiated strategies according to their development conditions [66]. The marginal spillover effect of tourism development in the eastern region is weakened, and tourism development should be shifted to high-end and low-carbon sectors, strengthening the linkage and integration with other industries, encouraging technological innovation, and providing technical support for resource-saving development models. Second, there is regional heterogeneity in the spillover effects of tourism development on urban green economic efficiency and carbon emission intensity, which highlights the importance of mutual coordination and cooperation within strategic alliances for regional tourism cooperation [67]. On the premise of breaking down administrative barriers, we actively promote the rational matching of resource elements between regions. Third, to promote the green development of cities, it is necessary to focus on both the green economic effects of tourism development and to explore the mode of green development of tourism itself. It is important to focus on the negative impact of tourism development on the environment, and to focus on the sustainable development of tourism at a reasonable pace [60].
In the future, the green economy effect and carbon emission reduction effect of tourism development will be more prominent, but the intermediary role of carbon emission intensity in the impact of tourism development on green economy efficiency may not be clear. On the one hand, global enthusiasm and efforts in carbon reduction will be maintained, and the green transformation of industries is a trend. Meanwhile, the tourism industry, contributing to the implementation of carbon emission reduction in several regions and countries, has outstanding green economy attributes. On the other hand, in many more backward developing regions, tourism is a rough economic pattern due to the lack of experience in tourism development and late development history. Although these countries or regions attract a large number of tourists by virtue of their unique tourism resources, they cause more damage to the ecological environment than before development. Likewise, the issue of carbon emissions is not taken into account in the process of tourism development, resulting in a potentially unsatisfactory relationship between tourism development and green economic effects and carbon reduction effects. In addition, as the COVID-19 epidemic continues to impact the tourism industry, new forms of tourism are emerging. Many real tourism activities are shifted to virtual tourism activities, in which case the negative environmental externalities of the tourism industry itself may be weakened, as well as the EKC effect, positive environmental externality effect and indirect effect of tourism development.
Compared with previous studies, this paper refines the traditional subject of “tourism, carbon dioxide and economic growth” [6] to “tourism, carbon emissions and green economic efficiency”, and further confirms Tong’s conclusion on the green economic effect of tourism [60]. On the basis of this paper, we further find that the green economy effect of tourism has a positive “U” nonlinear characteristic, which is one of the important points of innovation in this paper. This paper also confirms that tourism development has a significant carbon reduction effect [6,32], and also finds that there is an “M” type nonlinear relationship between tourism development and carbon emission intensity, which is different from the “inverted U” type relationship obtained by Reza et al. [32]. To be more precise, the same “inverted U” type was found in this paper, but after the accurate measurement of the nonlinear effect by the semi-parametric spatial lag model, it was found that the “inverted U” type is only a vague form of the “M”. The “inverted U” shape is only a fuzzy form of the “M” shape. In order to further confirm whether the carbon emission reduction of tourism affects the green economy effect of tourism, this paper innovatively uses carbon emission intensity as a mediating variable and concludes that tourism development affects green economy efficiency through carbon emission reduction. Although the article has conducted a detailed study on the relationship between tourism development, carbon emission intensity and green economic efficiency, there are also the following shortcomings. First, the article takes 280 prefecture-level cities in China as examples, but the tourism development of these cities is uneven, which may cause some interference in the results. Subsequent research can further discuss the formation mechanism among the three factors. Second, the impact mechanism is not thoroughly explored in this paper, which leaves room for further discussion of the formation mechanisms between the three. Instead, this paper only discusses the relationship between tourism development, carbon emission intensity and green economy efficiency in detail.

Author Contributions

Conceptualization, X.H. and H.X.; methodology, J.S. and X.H.; validation, X.H.; formal analysis, J.S. and C.C.; investigation, J.S. and X.H.; resources, J.S. and C.C.; writing—original draft preparation, J.S. and X.H.; writing—review and editing, X.H. and J.S.; supervision, Q.H.; funding acquisition, X.H. All authors have read and agreed to the published version of the manuscript.

Funding

This research was funded by the National Social Science Foundation, grant number 21FGLB070, and Natural Science Foundation of Hunan Province, grant number 2022JJ30387.

Institutional Review Board Statement

Ethical review and approval were waived for this study. The national law “Regulations for Ethical Review of Biomedical Research Involving Humans” does not require the full review process for data collection from adults who have adequate decision-making capacity to agree to participate.

Informed Consent Statement

Informed consent was obtained from all subjects involved in the study.

Conflicts of Interest

The authors declare no conflict of interest.

References

  1. Raihan, A.; Tuspekova, A. The nexus between economic growth, energy use, urbanization, tourism, and carbon dioxide emissions: New insights from Singapore. Sustain. Anal. Model. 2022, 2, 100009. [Google Scholar] [CrossRef]
  2. Feng, H.; Xie, R.; Fang, J. Urban Agglomeration Economies and Industrial Energy Efficiency. Energy 2018, 162, 45–59. [Google Scholar]
  3. Li, M.; Patiño-Echeverri, D.; Zhang, J.J. Policies to promote energy efficiency and air emissions reductions in China’s electric power generation sector during the 11th and 12th five-year plan periods: Achievements, remaining challenges, and opportunities. Energy Policy 2019, 125, 429–444. [Google Scholar] [CrossRef]
  4. Huang, J.B.; Luo, Y.M.; Feng, C. An overview of carbon dioxide emissions from China’s ferrous metal industry: 1991–2030. Resour. Policy 2019, 62, 541–549. [Google Scholar] [CrossRef]
  5. Tao, X.; Wang, P.; Zhu, B.J. Provincial green economic efficiency of China: A non-separable input–output SBM approach. Appl. Energy 2016, 171, 58–66. [Google Scholar] [CrossRef]
  6. Lee, J.W.; Brahmasrene, T.J. Investigating the influence of tourism on economic growth and carbon emissions: Evidence from panel analysis of the European Union. Tour. Manag. 2013, 38, 69–76. [Google Scholar] [CrossRef]
  7. Walker, N.L.; Williams, A.P.; Styles, D. Key performance indicators to explain energy & economic efficiency across water utilities, and identifying suitable proxies. J. Environ. Manag. 2020, 269, 110810. [Google Scholar]
  8. Amigues, J.-P.; Moreaux, M. Competing land uses and fossil fuel, and optimal energy conversion rates during the transition toward a green economy under a pollution stock constraint. J. Environ. Econ. Manag. 2019, 97, 92–115. [Google Scholar] [CrossRef]
  9. Chen, S.; Golley, J. ‘Green’productivity growth in China’s industrial economy. Energy Econ. 2014, 44, 89–98. [Google Scholar] [CrossRef]
  10. Qian, Z.; Liu, X.C. Regional differences in China’s green economic efficiency and their determinants. Resour. Environ. 2013, 23, 104–109. [Google Scholar]
  11. Sueyoshi, T.; Goto, M.J. DEA radial measurement for environmental assessment: A comparative study between Japanese chemical and pharmaceutical firms. Appl. Energy 2014, 115, 502–513. [Google Scholar] [CrossRef]
  12. Cui, Q.; Li, Y.J. An empirical study on the influencing factors of transportation carbon efficiency: Evidences from fifteen countries. Appl. Energy 2015, 141, 209–217. [Google Scholar] [CrossRef]
  13. Wang, Q.; Zhao, Z.; Zhou, P.; Zhou, D.J. Energy efficiency and production technology heterogeneity in China: A meta-frontier DEA approach. Econ. Model. 2013, 35, 283–289. [Google Scholar] [CrossRef]
  14. Liu, Y.; Dong, F.J. How technological innovation impacts urban green economy efficiency in emerging economies: A case study of 278 Chinese cities. Resour. Conserv. Recycl. 2021, 169, 105534. [Google Scholar] [CrossRef]
  15. Honma, S.; Hu, J.-L. Industry-level total-factor energy efficiency in developed countries: A Japan-centered analysis. Appl. Energy 2014, 119, 67–78. [Google Scholar] [CrossRef]
  16. Mousavi-Avval, S.H.; Rafiee, S.; Jafari, A.; Mohammadi, A.J. Optimization of energy consumption for soybean production using Data Envelopment Analysis (DEA) approach. Appl. Energy 2011, 88, 3765–3772. [Google Scholar] [CrossRef]
  17. Song, M.-L.; Zhang, L.-L.; Liu, W.; Fisher, R.J. Bootstrap-DEA analysis of BRICS’energy efficiency based on small sample data. Appl. Energy 2013, 112, 1049–1055. [Google Scholar] [CrossRef]
  18. Hu, J.L. Ecological total-factor energy efficiency of regions in China. Energy Policy 2012, 46, 9. [Google Scholar]
  19. Gómez-Calvet, R.; Conesa, D.; Gómez-Calvet, A.R.; Tortosa-Ausina, E.J. Energy efficiency in the European Union: What can be learned from the joint application of directional distance functions and slacks-based measures? Appl. Energy 2014, 132, 137–154. [Google Scholar] [CrossRef]
  20. Pjz, A.; Lez, A.; Hyla, B.; Yang, Z.C.; Hyh, A.; Xyw, D.J. Green economic efficiency and its influencing factors in China from 2008 to 2017: Based on the super-SBM model with undesirable outputs and spatial Dubin model. Sci. Total Environ. 2020, 741, 1. [Google Scholar]
  21. Yuan, H.; Feng, Y.; Lee, C.C.; Cen, Y. How does manufacturing agglomeration affect green economic efficiency? Energy Econ. 2020, 92, 104944. [Google Scholar] [CrossRef]
  22. Li, D.; Shangguan, Z.; Huang, M.; Zhang, X.; Tang, L.J. Impacts of urban development on regional green development efficiency—A case of the Yangtze River Delta in China. Energies 2022, 15, 4785. [Google Scholar] [CrossRef]
  23. Wang, Z.; Feng, C.J. A performance evaluation of the energy, environmental, and economic efficiency and productivity in China: An application of global data envelopment analysis. Appl. Energy 2015, 147, 617–626. [Google Scholar] [CrossRef]
  24. Haisheng, C.; Dingqing, N.; Shuiping, Z.; Ying, Y.; Manhong, S. Does the National Credit Demonstration Policy Affect Urban Green Economy Efficiency? Evidence from the Yangtze River Delta Region of China %J International Journal of Environmental Research and Public Health. Int. J. Environ. Res. Public Health 2022, 19, 1. [Google Scholar]
  25. Wu, D.; Wang, Y.; Qian, W. Efficiency evaluation and dynamic evolution of China’s regional green economy: A method based on the Super-PEBM model and DEA window analysis. J. Clean. Prod. 2020, 264, 121630. [Google Scholar] [CrossRef]
  26. Tone, K.; Tsutsui, M. An epsilon-based measure of efficiency in DEA—A third pole of technical efficiency. Eur. J. Oper. Res. 2010, 207, 10. [Google Scholar] [CrossRef]
  27. Shuguang, L.; Lei, S.; Yue, H. Measurement and Convergence Test of Green Economic Efficiency of the Yangtze River Economic Belt Under Different Spatial Network Correlation. Front. Environ. Sci. 2022. [Google Scholar] [CrossRef]
  28. NaiGang, C.; Lin, Z.; XiaoTong, G. Spatio-temporal evolution and driving mechanism of green economic efficiency at county level in the Yellow River Delta, China. Ying Yong Sheng Tai Xue Bao = J. Appl. Ecol. 2021, 32, 12. [Google Scholar]
  29. Manzoor, F.; Wei, L.; Asif, M.; Haq, M.Z.; Rehman, H. The contribution of sustainable tourism to economic growth and employment in Pakistan. Int. J. Environ. Res. Public Health 2019, 16, 3785. [Google Scholar] [CrossRef] [PubMed] [Green Version]
  30. Peeters, P.; Dubois, G.J. Tourism travel under climate change mitigation constraints. J. Transp. Geogr. 2010, 18, 447–457. [Google Scholar] [CrossRef]
  31. Satrovic, E.; Muslija, A.J. The empirical evidence on tourism-urbanization-CO2 emissions nexus. Adv. Hosp. Tour. Res. 2019, 7, 85–105. [Google Scholar] [CrossRef]
  32. Sherafatian-Jahromi, R.; Othman, M.S.; Law, S.H.; Ismail, N.W. Development; Sustainability, Tourism and CO2 emissions nexus in Southeast Asia: New evidence from panel estimation. Environ. Dev. Sustain. 2017, 19, 1407–1423. [Google Scholar] [CrossRef]
  33. Jianping, C.; Jiaquan, D.; Keji, L.; Qiao, Y.; Zhijian, Z. A study on the decoupling state of tourism growth from carbon emissions and its drivers: A new decoupling analytical framework. J. Tour. 2022, 37, 13–24. [Google Scholar]
  34. Toubes, D.R.; Araújo-Vila, N.J. A Review Research on Tourism in the Green Economy. Economies 2022, 10, 137. [Google Scholar] [CrossRef]
  35. Wang, S.; Zhou, C.; Li, G.; Feng, K.J. CO2, economic growth, and energy consumption in China’s provinces: Investigating the spatiotemporal and econometric characteristics of China’s CO2 emissions. Ecol. Indic. 2016, 69, 184–195. [Google Scholar] [CrossRef]
  36. Ben Jebli, M.; Ben Youssef, S.; Apergis, N.J. The dynamic linkage between renewable energy, tourism, CO2 emissions, economic growth, foreign direct investment, and trade. Lat. Am. Econ. Rev. 2019, 28, 2. [Google Scholar] [CrossRef] [Green Version]
  37. Litavcová, E.; Chovancová, J.J. Economic Development, CO2 Emissions and Energy Use Nexus-Evidence from the Danube Region Countries. Energies 2021, 14, 3165. [Google Scholar] [CrossRef]
  38. Dogan, E.; Aslan, A.J. Exploring the relationship among CO2 emissions, real GDP, energy consumption and tourism in the EU and candidate countries: Evidence from panel models robust to heterogeneity and cross-sectional dependence. Renew. Sustain. Energy Rev. 2017, 77, 239–245. [Google Scholar] [CrossRef]
  39. Khan, A.; Chenggang, Y.; Hussain, J.; Bano, S.; Nawaz, A.J. Natural resources, tourism development, and energy-growth-CO2 emission nexus: A simultaneity modeling analysis of BRI countries. Resour. Policy 2020, 68, 101751. [Google Scholar] [CrossRef]
  40. Agyeman, F.O.; Zhiqiang, M.; Li, M.; Sampene, A.K.; Dapaah, M.F.; Kedjanyi, E.A.; Buabeng, P.; Li, Y.; Hakro, S.; Heydari, M.J. Probing the Effect of Governance of Tourism Development, Economic Growth, and Foreign Direct Investment on Carbon Dioxide Emissions in Africa: The African Experience. Energies 2022, 15, 4530. [Google Scholar] [CrossRef]
  41. Yıldırım, S.; Yıldırım, D.Ç.; Aydın, K.; Erdoğan, F.J. Regime-dependent effect of tourism on carbon emissions in the Mediterranean countries. Environ. Sci. Pollut. Res. 2021, 28, 54766–54780. [Google Scholar] [CrossRef] [PubMed]
  42. Zhang, J.; Zhang, Y.J. Tourism, economic growth, energy consumption, and CO2 emissions in China. Tour. Econ. 2021, 27, 1060–1080. [Google Scholar] [CrossRef]
  43. Mikhno, I.; Koval, V.; Shvets, G.; Garmatiuk, O.; Tamošiūnienė, R.J. Green economy in sustainable development and improvement of resource efficiency. Cent. Eur. Bus. Rev. 2021, 10, 99–113. [Google Scholar] [CrossRef]
  44. Brel, O.; Zaytseva, A.; Kaizer, P. Contribution of tourism to diversification and development of a green economy. E3S Web Conf. 2020, 217, 9. [Google Scholar] [CrossRef]
  45. Marsiglio, S.J. Economic growth and environment: Tourism as a trigger for green growth. Tour. Econ. 2015, 21, 183–204. [Google Scholar] [CrossRef] [Green Version]
  46. Goffi, G.; Cucculelli, M.; Masiero, L. Fostering tourism destination competitiveness in developing countries: The role of sustainability. J. Clean. Prod. 2019, 209, 101–115. [Google Scholar] [CrossRef]
  47. Gossling, S.; Hall, C.M. Swedish Tourism and Climate Change Mitigation: An Emerging Conflict? Scand. J. Hosp. Tour. 2008, 8, 141–158. [Google Scholar] [CrossRef]
  48. Corden, W.M.; Neary, J.P. Booming sector and de-industrialisation in a small open economy. Econ. J. 1982, 92, 825–848. [Google Scholar] [CrossRef]
  49. Gunduz, L.; Hatemi, J.A. Is the tourism-led growth hypothesis valid for Turkey? Appl. Econ. Lett. 2005, 12, 499–504. [Google Scholar] [CrossRef]
  50. Davies, T.; Cahill, S. Environmental Implications of the Tourism Industry; Ageconsearch: Saint Paul, MN, USA, 2000; p. 14. [Google Scholar]
  51. Han, L.; Li, L.J. Engineering, Sustainable development of tourism under the background of low-carbon and green economy. Adv. Mater. Sci. Eng. 2021, 2021, 8587024. [Google Scholar] [CrossRef]
  52. Liu, G.; Shi, P.; Hai, F.; Zhang, Y.; Li, X.J. Study on measurement of green productivity of tourism in the Yangtze River Economic Zone, China. Sustainability 2018, 10, 2786. [Google Scholar] [CrossRef] [Green Version]
  53. Dzikuć, M.; Piwowar, A.J. Economic Aspects of Low Carbon Development. In Multidisciplinary Digital Publishing Institute. Energies 2022, 15, 5228. [Google Scholar] [CrossRef]
  54. Jian, L.; Sohail, M.T.; Ullah, S.; Majeed, M.T. Examining the role of non-economic factors in energy consumption and CO2 emissions in China: Policy options for the green economy. Environ. Sci. Pollut. Res. Int. 2021, 28, 67667–67676. [Google Scholar] [CrossRef]
  55. Pan, S.-Y.; Gao, M.; Kim, H.; Shah, K.J.; Pei, S.-L.; Chiang, P.-C. Advances and challenges in sustainable tourism toward a green economy. Sci. Total Environ. 2018, 635, 452–469. [Google Scholar] [CrossRef] [PubMed]
  56. Weixiang, X.; Jianping, Z.; Chengjun, L. The spatial effects of the development of the digital economy on urban carbon emissions. Geogr. Stud. 2022, 41, 111–129. [Google Scholar]
  57. Yuhua, Z.; Jun, C. Heterogeneity impact of high-speed rail opening on tourism development of station cities: A study based on double difference method. Tour. Sci. 2018, 32, 79–92. [Google Scholar]
  58. Sun, Y.-Y. Decomposition of tourism greenhouse gas emissions: Revealing the dynamics between tourism economic growth, technological efficiency, and carbon emissions. Tour. Manag. 2016, 55, 326–336. [Google Scholar] [CrossRef]
  59. Shuai, S.; Fan, Z.J. Modeling the role of environmental regulations in regional green economy efficiency of China: Empirical evidence from super efficiency DEA-Tobit model. J. Environ. Manag. 2020, 261, 110227. [Google Scholar] [CrossRef] [PubMed]
  60. Yun, T.; Haimeng, L.; Yong, M.; Jun, L.; Rui, Z. The impact of China’s tourism economy on urban green development and spatial spillover effects. Geogr. Stud. 2021, 76, 2504–2521. [Google Scholar]
  61. Fan, J.; Zhou, L.J. Three-dimensional intergovernmental competition and urban sprawl: Evidence from Chinese prefectural-level cities. Land Use Policy 2019, 87, 104035. [Google Scholar] [CrossRef]
  62. Yujun, L.; Wenda, W.; Rucai, Y. Monte Carlo simulation of Hausman’s test of the validity of statistics. Math. Stat. Manag. 2014, 33, 830–841. [Google Scholar]
  63. Xixi, T.; Qing, X.; Fei, C. Research on the Impact of Tourism Development and Technological Innovation on Economic Growth: Based on the analysis of provincial spatial panel data. East China Econ. Manag. 2020, 34, 48–55. [Google Scholar]
  64. Mingkang, W.; Yanping, L.; Tao, L. The differential impact of tourism industry agglomeration on environmental pollution: 287 prefecture-level cities. Reform 2019, 02, 102–114. [Google Scholar]
  65. Fan, Z.; Yuemin, N.; Xiyang, L. The competitiveness of China’s urban agglomerations and their impact on regional disparities. Geogr. Stud. 2019, 38, 1664–1677. [Google Scholar]
  66. Hongbing, Z.; Jing, Z.; Lei, Z.; Shenglang, J. Low carbon transition and sustainable development path of tourism industry. In IOP Conference Series: Earth and Environmental Science; IOP Publishing: Bristol, UK, 2017; Volume 64. [Google Scholar]
  67. Lei, Z.; Fang, F.; Xiangming, W. Tourism Development, Spatial Spillover and Economic Growth: Empirical Evidence from China. J. Tour. 2014, 29, 16–30. [Google Scholar]
Figure 1. Flow chart.
Energies 15 07729 g001
Figure 2. The mechanism of the impact of tourism development on green economy efficiency.
Energies 15 07729 g002
Figure 3. Partial derivative of tourism development on urban green economic efficiency.
Energies 15 07729 g003
Figure 4. Partial derivative of tourism development on urban carbon emission intensity.
Energies 15 07729 g004
Figure 5. Placebo test of the impact of low-carbon city pilot policies on urban green economic efficiency.
Energies 15 07729 g005
Figure 6. Placebo test of the impact of low-carbon city pilot policies on urban carbon emission intensity.
Energies 15 07729 g006
Table 1. Urban green economy efficiency measurement index system.
Guideline LayerIndicator LayerGuideline LayerIndicator Layer
Input metricsLaborThe number of employees in the city at the end of the yearOutput indicatorsExpected outputUrban green area
Number of industrial enterprises above designated sizeReal GDP
CapitalLocal financial expenditure on science and technologyTotal retail consumption per capita
Investment in fixed assetsUndesirable outputIndustrial wastewater discharge
Area of urban construction landIndustrial sulfur dioxide emissions
EnergyTotal air supplyIndustrial soot emissions
Total water supply
Total electricity consumption
Table 2. Global Moran Index test results for green economy efficiency and carbon emission intensity.
YearGEECI
20070.011 ***0.043 ***
20080.007 **0.041 ***
20090.010 ***0.039 ***
20100.014 ***0.045 ***
20110.013 ***0.041 ***
20120.017 ***0.039 ***
20130.016 ***0.042 ***
20140.012 ***0.045 ***
20150.014 ***0.057 ***
20160.020 ***0.071 ***
20170.021 ***0.074 ***
20180.034 ***0.092 ***
20190.035 ***0.083 ***
Note: ****, **, and * represent significance levels of 1%, 5%, and 10%, respectively.
Table 3. Spatial econometric model selection.
StatisticsModel (1)Model (2)Model (3)Model (4)
GEECIGEECI
LM Spatial Lag450.385 ***37.215 ***426.884 ***21.279 ***
Robust LM Spatial Lag84.494 ***84.324 ***79.038 ***55.872 ***
LM Spatial Error1692.191 ***1814.403 ***1612.687 ***1702.513 ***
Robust LM Spatial Error1326.301 ***1861.513 ***1264.841 ***1737.106 ***
Compare SDM with SARLR
Inspection
89.18 ***26.86 ***75.61 ***30.43 ***
Wald
Inspection
89.01 ***26.65 ***75.99 ***30.17 ***
Compare SDM with SEMLR
Inspection
65.77 ***42.60 ***63.78 ***44.58 ***
Wald
Inspection
42.35 ***31.01 ***39.89 ***31.67 ***
Hausman Inspection−2.24404.17 ***40.01 ***403.47 ***
Time fixation effect R-squre0.21890.18650.05600.0339
Individual fixation effect R-squre0.26600.28490.27890.2404
Double fixed effect R-squre0.02900.27110.01240.2009
Note: ****, **, and * represent significance levels of 1%, 5%, and 10%, respectively.
Table 4. Benchmark regression results on the impact of tourism development on urban carbon emissions and green economic efficiency.
VariableGEECI
Direct EffectsIndirect EffectsTotal EffectDirect EffectsIndirect EffectsTotal Effect
lnTC0.0100.442 ***0.452 ***0.028−1.336 ***−1.307 ***
lnis−0.034 ***−0.055−0.09−0.022−2.95 ***−2.972 ***
lneco0.026 *−0.193−0.167−0.0681.235 **1.168 **
lnfdi−0.003−0.231 **−0.234 **−0.004 ***−0.021−0.024
lnino0.113 ***0.0110.125 ***−0.0060.0920.086
lnenv0.0050.0620.0570.045 ***−1.026 **−0.981 **
R-squared0.2530.1548
Log-likelihood885.249−446.1593
Observations36403640
City FEYESYES
Year FENONO
Note: ****, **, and * represent significance levels of 1%, 5%, and 10%, respectively.
Table 5. Regional heterogeneity of the impact of tourism development on urban green economic efficiency.
VariableEastern RegionCentral RegionWestern RegionNortheast RegionUrban AgglomerationNon-Urban Agglomerations
lnTC0.043 * (1.800)0.015 (0.560)0.047 * (1.700)0.113 *** (3.54)0.024 (1.380)−0.005 (−0.240)
W×lnTC0.182 * (1.760)0.330 *** (2.580)0.184 ** (2.010)0.245 *** (2.78)0.183 ** (2.060)0.413 *** (4.640)
R-squared0.3080.2560.1790.22100.2920.204
log-likelihood456.936446.48950.027113.5438574.890311.798
Observations11181040104044221581482
City FEYESYESYESYESYESYES
Year FENONONONONONO
Note: ****, **, and * represent significance levels of 1%, 5%, and 10%, respectively.
Table 6. Regional heterogeneity of the impact of tourism development on urban carbon emission intensity.
VariableEastern RegionCentral RegionWestern RegionNortheast RegionUrban AgglomerationNon-Urban Agglomerations
lnTC0.047 (0.57)0.104 (0.98)0.149 ** (2.03)−0.224 ** (−1.95)0.014 (0.24)0.018 (0.29)
W × lnTC0.121 (0.39)−0.849 *** (−2.79)0.095 (0.44)0.263 (0.91)−0.034 (−0.17)−0.030 (−0.15)
R-squared0.02810.07390.02250.07780.01440.0535
log-likelihood−1007.2842−986.6959−945.4118−455.7187−1983.2718−1442.5192
Observations11181040104044221581482
City FEYESYESYESYESYESYES
Year FENONONONONONO
Note: ****, **, and * represent significance levels of 1%, 5%, and 10%, respectively.
Table 7. Nonlinear effects of tourism development on urban carbon intensity and green economic efficiency.
VariableGEECI
xW × xxW × x
lnTC0.124 ***0.424 ***−0.086 **−0.458 **
lnTC20.011 ***0.034 **−0.011 ***−0.016 *
lnis−0.031 ***0.116−0.012−0.805 ***
lneco0.023 *−0.064−0.071 ***0.349 ***
lnfdi−0.003−0.07 **−0.004−0.023
lnino−0.12 *0.065 ***0.0030.015
lnenv0.0060.0540.047 ***−0.372 ***
rho0.544 ***0.728 ***
R-squared0.27480.1386
Log-likelihood903.8068−438.8832
Observations36403640
City FEYESYES
Year FENONO
Note: ****, **, and * represent significance levels of 1%, 5%, and 10%, respectively.
Table 8. Results of the mediating effect test of urban carbon emission intensity.
VariablesModel (5)Model (6)Model (7)
TC0.603 ***
(−14.36)
0.510 ***
(−11.69)
CI −0.723 ***
(−18.75)
−0.128 ***
(−7.13)
Constant0.0874
(−1.31)
−1.799 ***
(−29.45)
−0.143
(−1.94)
Bootstrap Inspection
(Direct effects)
0.51045561
(BC: 0.4023555, 0.6608595)
Bootstrap Inspection
(Indirect effects)
0.09251758
(BC: 0.0558356, 0.1304556)
Control YESYESYES
Individual fixation effectYESYESYES
Time fixation effectNONONO
N364036403640
R20.62940.15780.6345
F1031.22114.65903.31
Note: ****, **, and * represent significance levels of 1%, 5%, and 10%, respectively.
Table 9. Exogenous impacts of low-carbon city pilot policies.
VariablesDIDSpatial DID
GEEGEECICIGEECI
LC0.245 *** (11.17)0.176 *** (8.58)−0.477 ***
(−12.80)
−0.078 ***
(−2.71)
0.049 *** (2.72)0.001
(0.02)
W×LC////0.906 *** (8.08)−0.574 ***
(−3.88)
ControlNOYESNOYESYESYES
R-squared0.4760.5750.72800.85060.2340.1688
Observations364036403640364036403640
City FEYESYESYESYESYESYES
Year FENONONONONONO
Note: ****, **, and * represent significance levels of 1%, 5%, and 10%, respectively.
Publisher’s Note: MDPI stays neutral with regard to jurisdictional claims in published maps and institutional affiliations.

