Article

An Optimal Allocation Method of Distributed PV and Energy Storage Considering Moderate Curtailment Measure

1
School of Electrical and Information Engineering, Tianjin University, Tianjin 300072, China
2
State Grid Tianjin Electric Power Co., Ltd., Tianjin 300300, China
*
Author to whom correspondence should be addressed.
Energies 2022, 15(20), 7690; https://doi.org/10.3390/en15207690
Submission received: 19 September 2022 / Revised: 12 October 2022 / Accepted: 15 October 2022 / Published: 18 October 2022
(This article belongs to the Special Issue Volume II: Situation Awareness for Smart Distribution Systems)

Abstract

:
Increasing distributed generations (DGs) are integrated into the distribution network. The risk of not satisfying operation constraints caused by the uncertainty of renewable energy output is increasing. The energy storage (ES) could stabilize the fluctuation of renewable energy generation output. Therefore, it can promote the consumption of renewable energy. A distributed photovoltaic (PV) and ES optimal allocation method based on the security region is proposed. Firstly, a bi-level optimal allocation model of PV and ES is established. The outer layer is a nonlinear optimization model, taking the maximum power supply benefit as the objective function. The inner layer is a day-ahead economic dispatching model. Then, a quick model solving method based on the steady-state security region is proposed. An initial allocation scheme of PV and ES is determined with the redundancy capacity. In addition, the linear hyperplane coefficient of the security region is used to convert the nonlinear day-ahead economic dispatching model into a linear one. Finally, the proposed method is used to analyze the improved IEEE 33-node system. It is found that a moderate curtailment measure of distributed PV peak output and the allocation of energy storage have a significant effect on the power supply benefit of the distribution system. The optimal quota capacity of DG exceeds the sum of the maximum load and the branch capacity. In addition, the optimal allocation scheme is closely related to the cost and technical parameters of distributed PV and ES. Dynamic allocation schemes should be formulated for distribution network.

1. Introduction

China is committed to adopting more effective policies and measures to reach the peak emission of CO2 by 2030 and achieve carbon neutralization by 2060 [1]. However, due to the output uncertainty of distributed generation (DG), the risk of node voltage exceedance and branch power flow overload increases with the improvement of renewable energy capacity. The safe and stable operation of the distribution network faces many challenges [2,3].
The main factors restricting the consumption of renewable energy can be summarized as insufficient flexibility resources of the system, including the available regulation capacity, voltage stability, frequency stability, power grid transmission capacity, etc. Energy storage (ES) allocation is an important measure used to cope with renewable energy output fluctuation. “Renewable energy + ES” will be actively developed in the future to ensure the system operation is stable while the permeability of renewable energy gradually increases [4,5]. The sequential characteristics of renewable energy and load should be fully considered during the installation of distributed ES. As the cost of ES is still very high, it is urgent to put forward an optimal allocation method based on power supply benefit to guide the collaborative planning of DG and ES.
Much research has been carried out in terms of renewable energy planning. The objective functions of optimal allocation models are various. A photovoltaic (PV) and ES systems optimal allocation model is established in ref. [6] to minimize the operating cost of an isolated island microgrid. It is found that the installed capacity of ES is closely related to the seasonal characteristics of PV output. A rolling optimization strategy is adopted to minimize the comprehensive cost in ref. [7]. With the rolling optimization strategy, multi-time scale optimization results could be achieved. The results show that installing moderate ES can improve the power supply benefit of the system and reduce the load loss. In order to cope with the technical, environmental, and economic effects, a multi-objective optimization model is proposed in refs. [8,9] to obtain the optimal capacity of ES for hybrid wind and PV system. A battery energy storage system can be used for a standby power supply and provide various distributed auxiliary services. Active power loss and equipment investment cost of the distribution system is taken as the objective function in ref. [10] to obtain the allocation scheme of DG, battery energy storage systems and switchable parallel capacitor banks. Considering the operation constraints of different ES and DG, minimizing system cost and load loss rate, and maximizing the renewable energy utilization rate are taken as the objective function for off grid systems in ref. [11]. The impact of the ES system on the power supply cost is analyzed under both off-grid and on-grid conditions. However, the promotion effect of the PV peak output curtailment measure on electricity consumption has not been analyzed in most existing research.
For a distribution network with DG integration, node voltage, and branch power flow, constraints are necessary in an optimal allocation model [12,13]. Since these constraints are nonlinear, the model is difficult to solve; two genetic algorithms, a basis genetic algorithm, and a segmented genetic algorithm are used in ref. [14]. Segmented genetic algorithm can provided a better solution, which is seen as an appropriate approach for solving real life cases. The model to optimize energy storage and distribution network is made in ref. [15]. The hybrid improved the gravitational search algorithm, and dual-stage optimization method is used to realize the coordinated planning of the power grid and energy storage. It can reduce the investment cost by 0.248% comparatively. A comprehensive generation and transmission expansion planning model is established in ref. [16], and the mixed scheme of the Runge Kutta optimizer and optimizer based gradient index is used for model solving. A combined method using the arithmetic optimization algorithm and the sine cosine method is proposed to realize optimization in ref. [17]. The simulation results indicate that the proposed method has advantages in determining the optimal capacity of DG. A multi-objective interval decision and two-level optimization method based on the D-S evidence theory and genetic algorithm is proposed to obtain optimal allocation of DG in ref. [18]. The optimal sizes and locations of distributed generation for a distribution system are taken as the objective function in ref. [19]. A new method using Harmony Search algorithm is used to solve the model quickly. In addition, the data-driven kernel extreme learning machine method [20], analytical target cascading method [21], Archimedes optimization algorithm [22], manta ray foraging optimization algorithm [23], and other algorithms have also been widely used to solve the optimal allocation model of DG. However, many infeasible populations are often generated in the solving process by various intelligent algorithms. Even if new population generation rules are modified, the solution process easily falls into a local optimal solution. Furthermore, the power flow calculation is required to be repeated, which will require too much time to be spent on the calculation. Moreover, the ES system is with sequential characteristics, which makes the optimization variable increase in geometric multiples.
There are many applications for an ES system in the distribution network. Considering the capability to stabilize renewable power fluctuation, a two-layer nested distributed ES planning model is made in ref. [24]. The ES system is used to improve the voltage quality and an optimization allocation method of distributed energy system with multi-ES is proposed in ref. [25]. It provides a solution for studying the system structure, operation optimization and performance index under the scenario of a near zero energy community. In order to improve the electricity penetration of distributed generation for distribution networks, a joint planning for distributed generations and energy storage is carried out for an active distribution network by using a bi-level programming approach in ref. [26]. The proposed method can reduce the planning deviation caused by the uncertainty of output, and significantly improve the voltage distribution and operation economy of the distribution system. A novel distributed energy system combining solar energy utilization with hybrid energy storage technology is introduced in ref. [27]. 12 nearly zero energy community scenarios are set considering different community types and scales. It is found that the co-optimization method improves the primary energy saving rate by 24.0%. However, there are two key parameters for ES, i.e., maximum charging/discharging power and rated electricity capacity. The discussion on how the two parameters impact the allocation scheme of DG and ES is usually ignored.
Moreover, the processing method of load demand and renewable power uncertainty will have an obvious effect on the allocation scheme. Optimal allocation theories and methods based on deterministic models may lead to a relatively large error. At present, there are four methods to deal with the uncertainty of renewable energy output: (1) Increasing spinning reserve [28,29]. It is applicable to power systems with traditional high- thermal-power units. For power systems with a high permeability of renewable energy, it is difficult to scientifically determine the spinning reserve capacity; (2) The robust optimization method [30,31]. It can transform the output uncertainty of DG into an uncertain solution set. The research is usually carried out under the worst scenario, and the dispatching scheme is often conservative; (3) The chance-constrained programming method [32,33]. It is difficult to obtain an analytical expression for large power systems and objectively determine the confidence level; (4) The stochastic optimization method based on scenario set [34,35]. Although the uncertainty of the DG output can be taken into account, a high number of scenarios to be optimized will be generated because of the strong uncertainty of distributed power generation output. The scene reduction method requires sacrificing calculation accuracy. However, renewable power has seasonal characteristics, and time-series operation simulation could better reflect the real consumption of DG.
Therefore, in order to cope with the fluctuation of increasing DG, ES is required to be allocated and a moderate curtailment measure should also be considered. There are still some deficiencies in the rapid formulation of renewable power consumption scheme and the optimal allocation of DG and ES. In the paper, an optimal allocation method based on security region method is proposed. The main contributions of the paper are as follows:
(1)
A bi-level optimal allocation model of distributed PV and ES is established for a distribution network. The outer layer is a nonlinear optimization model, and the inner layer is a day-ahead economic dispatching model.
(2)
Based on the steady-state security region method, initial allocation scheme of DG and ES can be determined for the outer layer model and the inner layer model is converted into a linear one.
(3)
Based on the principle of equal curtailment ratio, the optimal allocation scheme of DG and ES is formulated. Sensitivity analyses are conducted for several key parameters.
The remaining paper is organized as follows. Section 2 describes the bi-level optimal allocation model for distributed PV and ES. Section 3 describes the fast-solving method based on security region method. Section 4 provides the optimal allocation schemes of DG and ES with the proposed method, and gives a detailed discussion of the results. Finally, the conclusions are provided.

2. Bi-Level Optimal Allocation Model for Distributed PV and ES

For a distribution network with DG and ES, the load demand is firstly supplied by the local power of DG and ES, and insufficient electricity is purchased from the higher voltage power grid. When the active power of DG exceeds the load demand, surplus power will be charged into the ES or sold to the higher voltage power grid. In daily operation, the PV output should be consumed as much as possible. However, the PV output is obviously seasonal and intermittent. For DG and ES optimal allocation, the annual renewable electricity penetration can be improved by moderate curtailment measure. Schematic diagram of DG and ES optimization allocation is shown in Figure 1.

2.1. The Allocation Target of Distributed PV and ES

For a distribution network with N nodes, the installed capacity of distributed PV and ES on the ith node in the distribution network is denoted as P i PV and E i ES , respectively. The installed capacity vector of the PV and ES system, denoted as P = [ P 1 PV , E 1 ES , P 2 PV , E 2 ES , , P N PV , E N ES ] , is taken as the optimization variable. The investment cost of PV and ES is denoted as C1, and the difference of power selling income and power purchasing cost between the distribution network and higher voltage power grid is the benefit, denoted as C2. The allocation target is to maximize the annual power supply benefit, C2-C1.
(1)
Investment cost of the system
C1 includes the investment cost and operation and maintenance cost of PV and ES equipment. The equipment investment cost is calculated by equal annual value method in the paper. The equal annual value coefficient is calculated as follows.
c = r ( 1 + r ) y ( 1 + r ) y 1
where r denotes the bank discount rate, and it is a constant. y denotes the operating life of the used equipment in the system. The operation and maintenance cost can be considered by a fixed proportion of the equipment investment cost. C1 can be calculated as follows.
C 1 = c ES + c om _ ES C un _ ES P ES + c PV + c om _ PV C un _ PV P PV
where CES and CPV denote equal annual value coefficients of ES and PV equipment investment costs, respectively, which can be calculated by Formula (1). com_ES and com_PV denote the operation and maintenance ratio of ES and PV equipment, respectively. Cun_ES and Cun_PV denote the capacity investment cost per kWh of ES and per kW of PV, respectively. During the optimal allocation of DG, reactive power is balanced locally, and only the effect of active power is considered.
(2)
Benefit from power selling and purchasing
The distribution system is connected to the higher voltage power grid through a transformer. C2 can be calculated by the following formula.
C 2 = t = 1 T p sell , t P sell , t line t = 1 T p buy , t P buy , t line
where psell,t and pbuy,t denotes the real-time price of selling electricity to a higher voltage power grid and purchasing electricity from higher voltage power grid, respectively. P sell , t line and P buy , t line denote the power sold to the higher voltage power grid and purchased from the higher voltage power grid, respectively.
The outer layer model is to determine the optimal integrated capacity and location of the distributed PV and ES according to the power supply benefit. The allocation target can be expressed as follows.
max P C = max P C 2 P buy , t line , P sell , t line C 1 P
where maximizing the consumption of renewable energy electricity, C2 is the minimum. Therefore, the power supply cost and the electricity penetration rate of renewable energy are both considered. The electricity penetration rate of renewable energy can be calculated by the following formula.
R DG = E DG E load
where EDG and Eload denote the electricity generated by renewable energy and electricity consumed by the users in the optimization period.
In order to achieve an accurate value of C2, it is necessary to determine the sequential purchasing and selling power scheme of the tie line. Therefore, the day-ahead economic dispatching model should be established.

2.2. Day-Ahead Economic Dispatching Model

In order to calculate the actual output of DG on the premise of meeting operation constraints, it is necessary to carry out sequential simulation based on the day-ahead economic dispatching as follows.
(1)
Objective function
Maximizing the power supply benefit is regarded as the economic dispatching target during the optimization period T.
max F = max t = 1 T p sell , t P sell , t line t = 1 T p buy , t P buy , t line i = 1 N t = 1 T s ES P i , t Dis
where sES denotes the cost of discharging 1 kWh electricity of ES equipment. P i , t Dis denotes the ES discharging power on the ith node at tth time.
(2)
Operation constraints
Power balance constraint is required to be satisfied.
P i , t L P i , t ren , 2 P i , t Dis + P i , t Cha = U i , t j H i U j , t ( G i j cos θ i j , t + B i j sin θ i j , t )
where P i , t L denotes the active power of the ith node at tth time. P i , t ren , 2 denotes the actual output of renewable energy on the ith node at tth time. P i , t Cha denotes the charging power of the ES of the ith node at tth time. Ui,t denotes the voltage amplitude of the ith node at tth time. θij,t denotes the difference of phase between the ith node and the jth node at tth time. Gij denotes the conductance between the ith node and the jth node. Bij denotes the susceptance between the ith node and the jth node. Hi denotes a node set connected to the ith node.
There are the upper and lower limit constraints on node voltage amplitude in the distribution network. In order to ensure the stable operation, there are upper limit constraints on the branch power flow.
U i , min U i , t U i , max i 1 , N , t [ 1 ,   T ]
| P i j , t | P i j , max i , j 1 , N , t [ 1 ,   T ]
where Ui,min and Ui,max denote the lower limit and upper limit on the node voltage amplitude, respectively. Pij,t and Pij,max denote the real-time power and the rated capacity of the line between the ith node and jth node, respectively.
Limited by the transmission capacity of the tie-line, there is an upper limit for the interactive power on the tie line.
P sell , t line P line max P buy , t line P line max
where P line max denotes the upper limit of transmission capacity for the tie-line.
In order to reduce the dispatching pressure of the higher voltage power grid, it is required that the power of the tie line cannot change too much from the tth time to the t + 1th time. The climbing rate constraint for the transmission power of the tie line is given below.
P cli _ line max P buy , t line P buy , t 1 line P cli _ line max P cli _ line max P sell , t line P sell , t 1 line P cli _ line max t [ 2 ,   T ]
where P cli _ line max denotes the upper limit of the climbing rate.
The maximum output of DG is determined by natural resources, such as wind energy and solar radiation intensity. When electricity curtailment measure is taken, there is following constraint.
P i , t ren , 2 P i , t ren , 1 i 1 , N , t [ 1 ,   T ]
where P i , t ren , 1 denotes the maximum output of renewable energy, which is obtained from the meteorological forecast data, the output characteristics of the wind, and PV equipment.
During the dispatching period T, the remaining electricity of ES at the beginning and end remains unchanged. The constraint between the remaining electricity and the charging and discharging power for ES is shown as follows.
E i , 1 = E i , T E i , t = E i , t 1 P i , t Dis + P i , t Cha i 1 , N , t [ 2 ,   T ]
where Ei,t denotes the ES remaining electricity on the ith node at tth time. There are upper limit and lower limit constraints for ES remaining electricity.
k 1 E i max E i , t k 2 E i max i 1 , N , t [ 1 ,   T ]
where k1 and k2 denote the minimum and the maximum ES states of charge, respectively. The maximum charging or discharging power of ES equipment is as follows.
0 P i , t Dis λ E i max 0 P i , t Cha λ E i max
where λ is constant coefficient related to the selected ES.
Charging and discharging is not allowed at the same time and there is the following constraint.
P i , t Dis P i , t Cha = 0
Similarly, purchasing and selling power between the distribution network and higher voltage power grid is not allowed at the same time.
P buy , t line P sell , t line = 0
The day-ahead economic dispatching model is nonlinear because of the constraints of node voltage and branch power flow. Usually, heuristic algorithms are used to solve the model and a repeated power flow calculation is required. Moreover, the sequential characteristic of ES equipment increases the difficulty of model solving.

3. Fast Solving Method Based on the Security Region

The operation constraints of the distribution network can be denoted by steady-state security region method in the form of linear hyperplane [36,37], such as the upper and lower limits of the node voltage amplitude, and the branch power flow. For a given network topology and root node voltage, the security region of the distribution network is uniquely determined and does not change with the node injected power. The constraint can be expressed using the following formula.
Ω SSSR x β i = 1 N ( α M j , i P i + β M j , i Q i ) 1 i = 1 N ( α m j , i P i + β m j , i Q i ) 1 1 i = 1 N ( α I j , i P i + β I j , i Q i ) 1 P i m P i P i M Q i m Q i Q i M
where xβ denotes the vector of the nodal injection power. Pi and Qi denote the active and reactive power of the ith node, respectively. P i m and P i M denote the minimum and maximum active power of the ith node, respectively. Q i m and Q i M denote the minimum and maximum reactive power of the ith node, respectively. α M j , i , β M j , i , α m j , i , β m j , i , α I j , i and β I j , i are all constant coefficients. The detailed calculation process refers to ref. [36,37]. The nonlinear constraints (8) and (9) can be equivalently denoted by the linear constraint Formula (18). In addition, the nonlinear constraint conditions (16) and (17) can be converted into the following formula.
0 P i , t Dis M β 1 0 P i , t Cha M β 2 β 1 + β 2 1
0 P buy , t line M α 1 0 P sell , t line M α 2 α 1 + α 2 1
where M is a huge positive number, α 1 and α 2 are the 0–1 indicating variables that denote the status of power purchasing and selling, respectively, and β 1 and β 2 are the 0–1 indicating variables and denote the charging and discharging state of the ES, respectively. So far, the day-ahead economic dispatching model of the active distribution network can be transformed into a linear programming model, which can be quickly solved by commercial software such as CPLEX. The purchasing and selling power schemes can be obtained quickly.
The dimension of vector P is large. To speed up the solving process, it is necessary to formulate a better initial solution with some heuristic information. Assuming there is no renewable power curtailment, the maximum installed DG capacity on each node can be calculated by the security region hyperplane expression.
Taking the upper voltage amplitude constraint as an example, the maximum DG installed capacity on the ith node that ensures the 1st node does not exceed the upper voltage limit can be calculated by the following formula.
Δ P i 1 , M = 1   i = 1 N ( α M 1 , i P i + β M 1 , i Q i ) α M 1 , i i f α M 1 , i > 0 + i f α M 1 , i < 0
For the same reason, to ensure all the N nodes do not exceed both the upper and lower voltage limits, 2N maximum installed capacity values of the ith node can be obtained, i.e., Δ P 1 i , M , Δ P 1 i , m , Δ P 2 i , M , Δ P 2 i , m ,…, Δ P N i , M , Δ P N i , m . Therefore, the maximum DG installed capacity of the ith node considering the voltage amplitude constraint should select the minimum value.
Δ P i V = min Δ P i 1 , M , Δ P i 1 , m , Δ P i 2 , M , Δ P i 2 , m , , Δ P i N , M , Δ P i N , m
Similarly, considering the branch flow constraints of all branches, the maximum DG installed capacity of the ith node, denoted as Δ P i I , can be obtained after. Therefore, the maximum installed capacity of the ith node, denoted as Δ P i , should be calculated by the following formula.
Δ P i = min Δ P i V , Δ P i I
Then, the maximum DG installed capacity set Δ P 1 , Δ P 2 , , Δ P i , , Δ P N can be achieved. If only one node is selected as the DG integration point, as long as the installed capacity is less than ∆Pi, the renewable power could be consumed completely. When several nodes are selected as DG integration points, the total quota capacity should be allocated among them according to the evaluated ∆Pi. Taking into account feasibility and other factors, M integration points could be selected by the priority of Δ P i from large to small. For a selected DG integration node numbered by x, the DG installed capacity in the initial scheme can be denoted as follows.
Δ P x = Δ P x P max cap i = 1 M Δ P i
Since the fluctuation of PV output can be smoothed by ES, the ∆Pi achieved above could be improved furtherly. Day-ahead pre-dispatching model is established with the objective function of minimizing the peak valley difference in every day as follows.
min t = 1 T ( P i , t ren , 2 1 T t = 1 T P i , t ren , 2 ) 2 s . t . ( 13 - 16 )
With the help of ES, the maximum active power output of DG and ES in every day, denoted as P i , d a y ren , M , could be obtained.
P i , d a y ren , M = max P i , t ren , 2 + P i , t Dis P i , t Cha t 1 , T
Furthermore, the annual maximum active power output of DG, denoted as P i ren , M , could be obtained.
P i ren , M = max P i , d a y ren , M d a y 1,365
Increase the value of ∆Pi gradually until P i ren , M is equal to Δ P i . At this moment, the integrated capacity of distributed PV is recorded as Δ P i . Replace the value of ∆Pi in Formula (24) with the updated Δ P i , the initial allocation scheme could be achieved.
It should be noted that the curtailment measure of the DG peak output is considered in the paper. Therefore, the final planning scheme of the DG is different from the Formula (24). According to the principle of marginal effect, when all renewable power integration nodes have the same curtailment ratio, the DG output can be best consumed, and the optimal allocation scheme could be achieved.

4. Case Study

4.1. Evaluation Parameters

DG optimal allocation is optimized for the improved IEEE 33-node distribution network system [38]. The topology is shown in Figure 2. The distribution network can be seen as a uniform network and the maximum transmitted capacity of each branch is 4 MW, bigger than the total load of the system. The root node voltage is kept at 1.0 p.u., and the upper limit and lower limit of node voltage are 1.05 p.u. and 0.95 p.u., respectively. During the operation simulation, the typical daily load curve [39] and PV output curve [40,41] are shown in Figure A1 of the Appendix A. The electricity price of a city in northern China is used as the price of purchasing electricity from higher voltage power grid [42]. As the electricity generated by distributed PV must be delivered by the distribution network, the price of selling electricity to higher voltage power grid is slightly lower than the purchasing price and they are given in Figure 3.

4.2. Effect Analysis of Steady-State Security Region

4.2.1. Initial Allocation Scheme Formulation

According to the calculation method of the distributed PV initial allocation scheme in Section 3, the maximum installed capacity of DG with and without ES on each node can be calculated according to the redundancy information of the system. The maximum installed capacity of DG corresponding to each node is evaluated with the node injection power of the first hour. When the allocation proportion of ES, the maximum charging or discharging power, is 20% of the installed capacity of distributed PV and the discharge duration of ES is set to be 1 h, 2 h, 3 h, and 4 h, respectively, the maximum installed capacity evaluation results are shown in Figure 4. It can be seen that the installed capacity of distributed power generation has a positive correlation to the distance between the node and the higher voltage power grid. It is obvious that the promotion effect gradually declines with the increase of ES capacity. Taking the first node as an example, the increased proportion of DG capacity is 26.38%, 33.74%, 41.10%, and 44.79% to the DG maximum installed capacity without ES.
Combined with other constraints, only the 11th, 19th, 24th, and 29th nodes are selected as the integration locations of distributed PV in the paper later. When the allocation proportion of ES is 20% and the discharge duration is 4 h, the maximum capacities of DG are 1.18 MW, 4.00 MW, 3.42 MW, and 1.49 MW, respectively. The capacity proportion coefficient of each node can be obtained: 0.117, 0.396, 0.339, and 0.148.

4.2.2. Day-Ahead Economic Dispatching Scheme Formulation

When the quota capacity is 30 MW, the distributed PV capacity of each node can be divided into 3.51 MW, 11.89 MW, 10.16 MW, and 4.44 MW by the above capacity proportion coefficient. If the electricity generated by PV is consumed completely, the node voltage will exceed the upper limit as shown in Figure 5a. In order to ensure the safe operation of the distribution network, some peak output of PV equipment should be curtailed. The linear day-ahead economic dispatching method in the paper is used to formulate the optimal dispatching scheme of each node. After day-ahead dispatching, the node voltage distribution is shown in Figure 5b. The actual output of the distributed PV at each node is shown in Figure 6a, and the curtailment ratio of PV electricity is 13.42%, 17.07%, 31.21%, and 10.08%, respectively. As the operation margin of each node is different and electricity curtailment is allowed, the consumption of PV electricity on each node is different. The dispatching curve of the ES on each node is shown in Figure 6b. It can be found that when the output of PV is large, the output will be curtailed due to the operating constraints. The ES is not fully charged during the period of 0:00–7:00, which reserve some ES capacity to be charged during the period of large PV output. The consumption of PV electricity can be improved.

4.3. Analysis of the Optimal Allocation Scheme of Distributed PV and ES

4.3.1. PV Allocation Scheme with Equal Curtailment Ratio

According to the distributed PV initial planning scheme in Section 4.2, the sequential operation simulation based on the day-ahead economic dispatching is carried out. The PV electricity curtailment ratios of each node and the overall system can be calculated. According to the optimal allocation process in Section 3, the distributed PV integrated capacity on each node is gradually adjusted with the PV electricity curtailment ratios of the overall system. The simulation results when P max cap is 24.0 MW can be obtained are shown in Table 1. Under the principle of equal PV electricity curtailment ratio, the distributed PV installed capacity on each node is 3.29 MW, 9.72 MW, 6.58 MW, and 4.42 MW. At this time, the PV electricity curtailment ratio of the system is 3.29%.
The allocation criterion is important. If the equal capacity installation principle is applied, the installed capacity of distributed PV on each node will be 6 MW. The evaluation results are shown in Table 2. It is not difficult to find that equal capacity installation principle will lead to an increase in the PV curtailment ratio, and the power supply benefit of the system will decrease by 6.63%.
When P max cap increases from 20 MW to 30 MW, the optimal allocation schemes can be obtained as shown in Table 3. According to the optimal allocation schemes, the capacity proportion coefficients for all P max cap values are almost the same. Moreover, they are very close to the initial allocation scheme determined by Formula (24) proposed in the paper, as shown in Figure 7. This suggests that the method proposed is robust for formulating allocation schemes of DG in distribution network, and can save a lot of calculation time.
Based on the allocation results in Table 3, the optimal installed capacity of distributed PV can be obtained according to the power supply benefit. The current investment cost of PV system is about 4,000,000 yuan/MW~6,000,000 yuan/MW in China. The cost range of PV system in the paper is 2,000,000 yuan/MW~8,000,000 yuan/MW, of which 8,000,000 yuan/MW denotes the PV system in some regions with high installation difficulty, high labor cost, and complex operation and maintenance. The investment cost of PV system will be decreased by 5% every year in ref. [2]. We have adopted the value of 2,000,000 yuan/MW to analyze the PV development trend in the future. Along with the decrease of PV equipment cost, dynamic optimal allocation is carried out. The optimal planning results are shown in Table 4 by fitting the power supply benefit curves with a quadratic function. It is not difficult to find that the optimal allocation capacity of a distribution network is not constant.

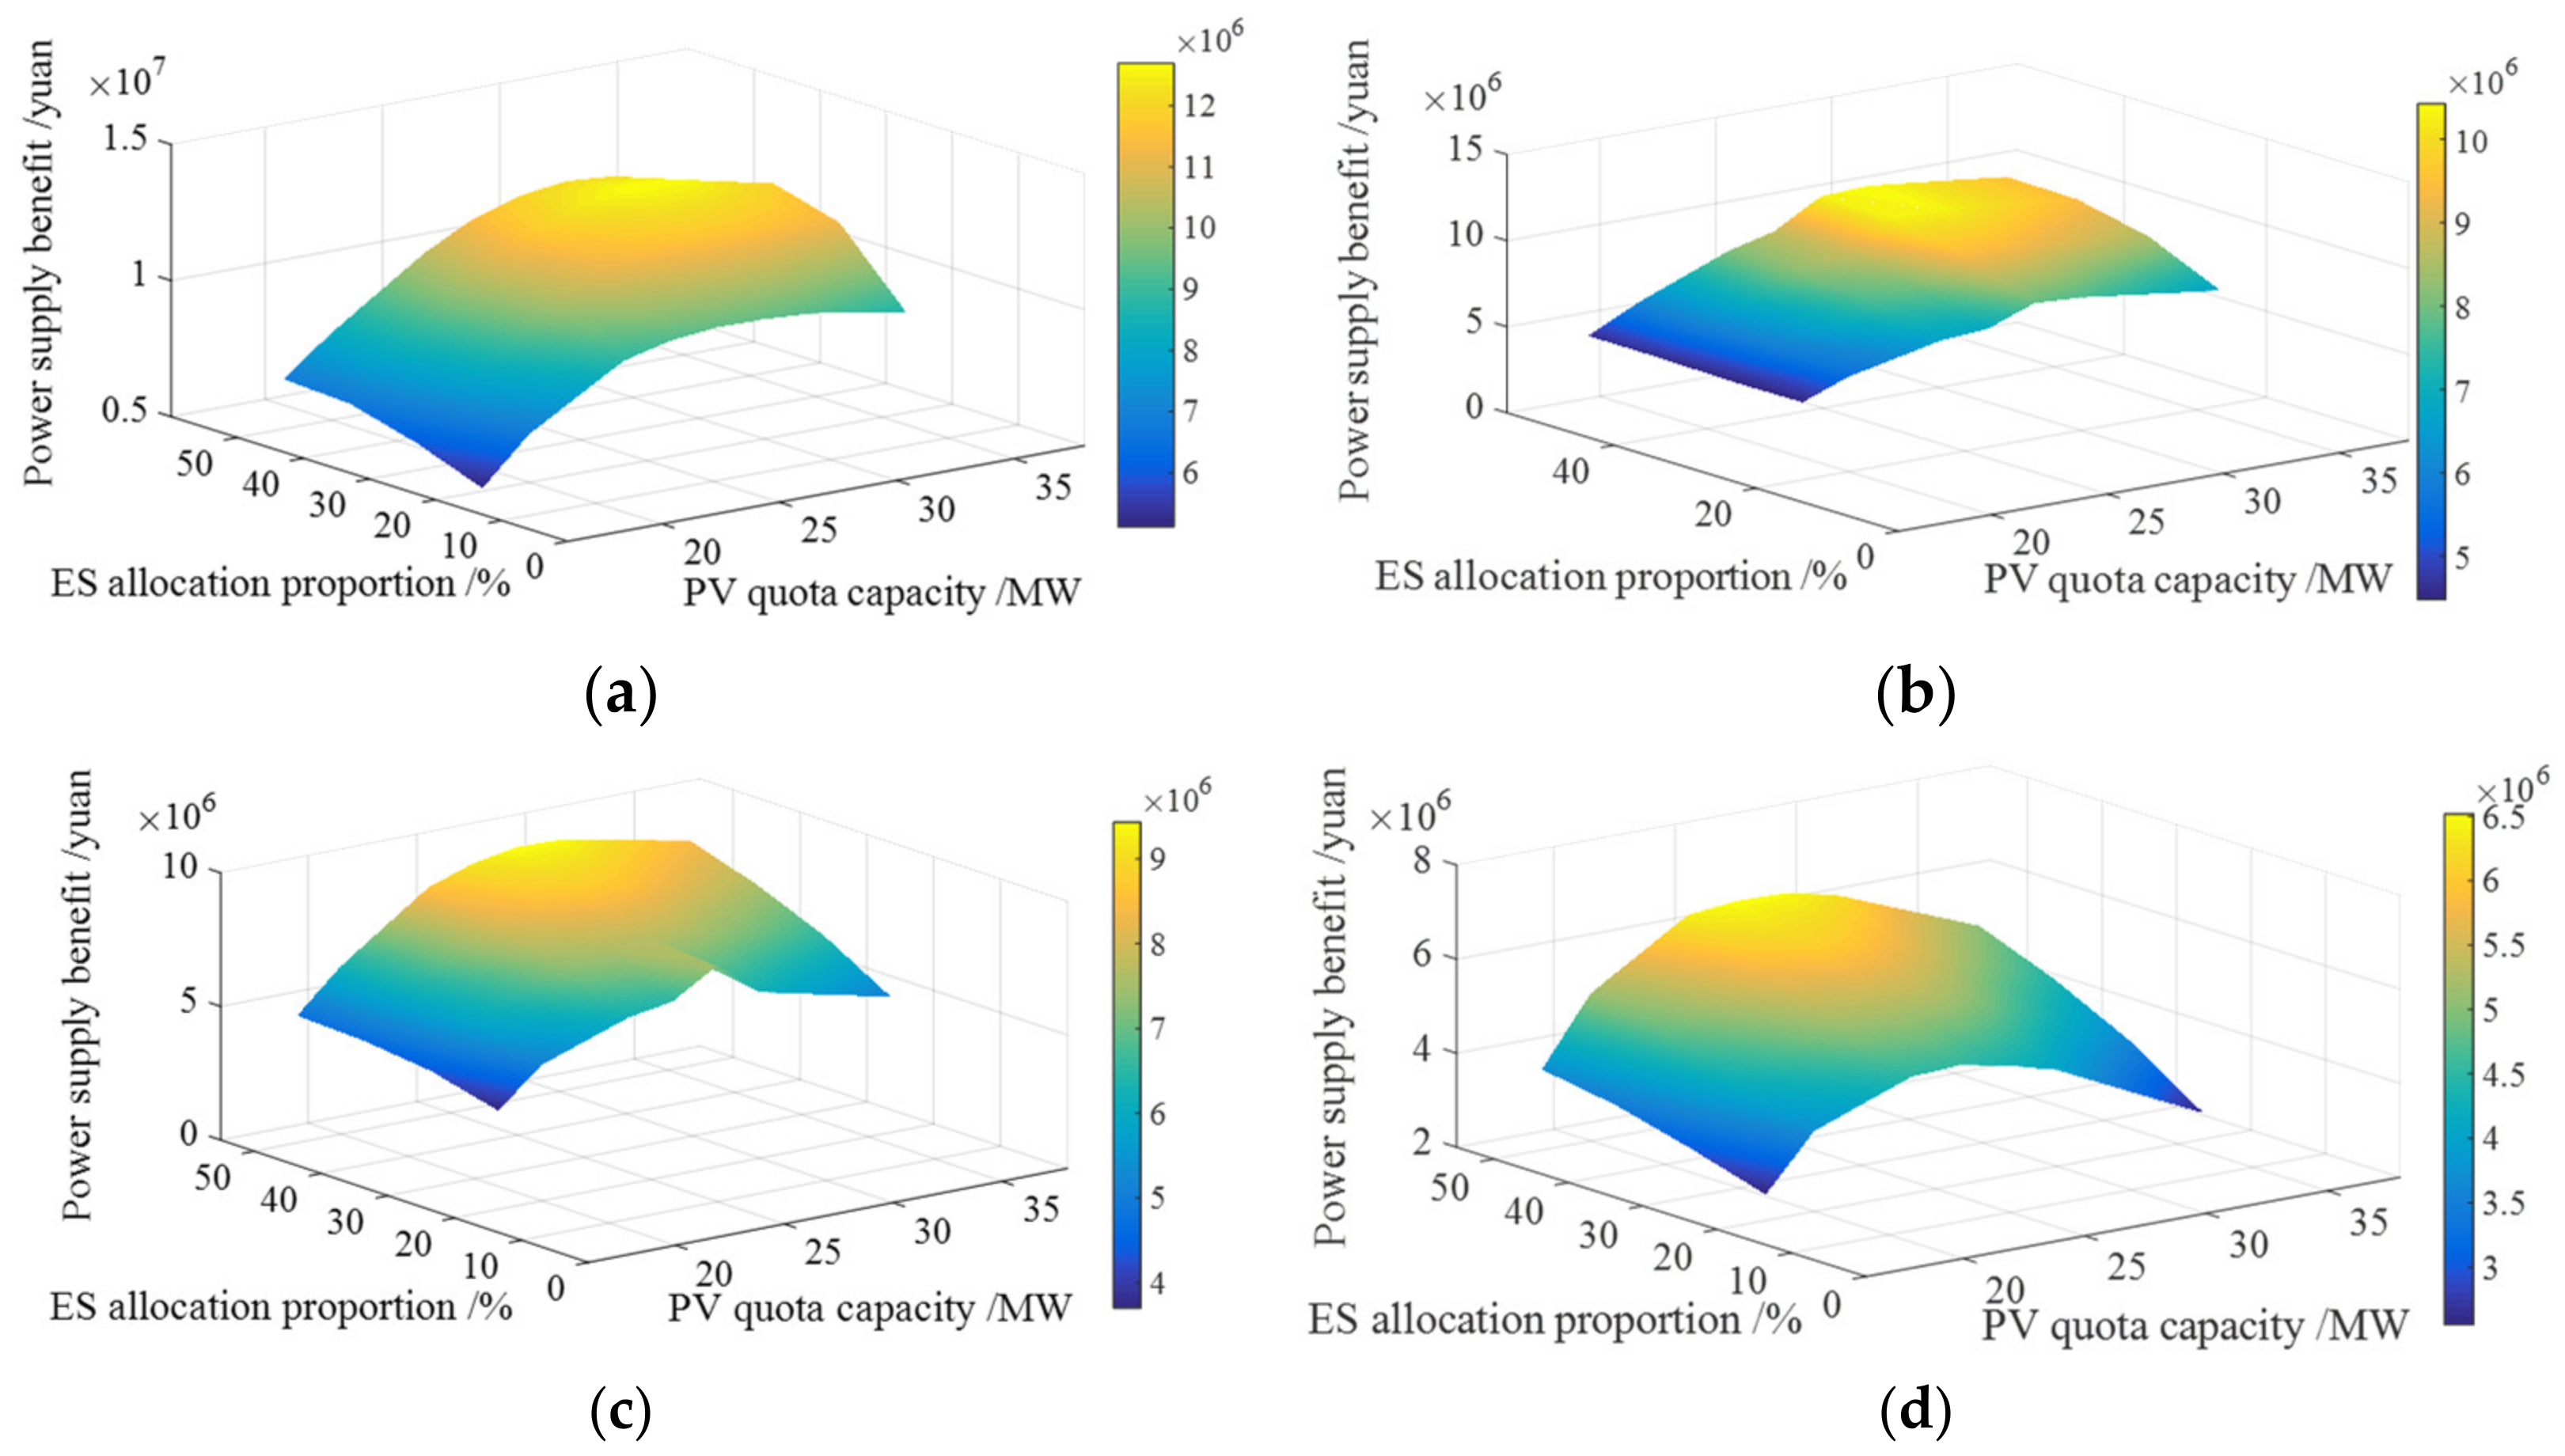
4.3.2. Optimal Allocation Scheme of ES

When the quota capacity is 26 MW and the discharging duration is kept as 4 h, an increase in the allocation proportion of ES and the evaluation results in Table 5 can be achieved. With the increase of ES, the curtailment ratio of PV power decreases greatly and the PV electricity penetration increases gradually. However, there is an inflection point of power supply benefit along with the increase in allocation proportion. Quadratic function is used to fit the power supply benefit curves as shown in Figure 8. When the investment cost of ES decreases from 1.0 yuan/Wh to 0.2 yuan/Wh, the optimal allocation proportion of ES is 31.79%, 35.38%, 38.96%, 42.54%, and 46.12%, respectively. The results suggest that the allocation of ES should be dynamically determined.
When the value of P max cap and the allocation proportion of ES change at the same time, a three-dimensional allocation results can be achieved as shown in Figure 9a by interpolation fitting for the obtained power supply benefits. Here, the discharge duration of ES is until 4 h. When the installed capacity of PV and ES is relatively small, the power supply benefit of the distribution network increases gradually. With the continuous increase of the installed capacity of PV and ES, there is a global optimal solution. The quota capacity of PV with the highest power supply benefit is 30 MW, and the optimal capacity of ES is 48 MWh. If the installed capacity of PV and ES continues to increase, the ES will be redundant with low utilization. Therefore, it is necessary to optimize the PV and ES allocation scheme under the guidance of power supply benefit.
Furtherly, when discharge duration of ES is 3 h, 2 h, and 1 h, the sequential simulation is carried out. The three-dimensional evaluation results are shown in Figure 9b–d. The optimal quota capacity of PV in the distribution network is 30 MW, 28 MW, and 28 MW, respectively. The optimal allocation capacity of ES is 45 MWh, 28 MWh, and 14 MWh, respectively. Obviously, when the discharge durations of ES are different, the optimal allocation schemes of PV and ES are also different.

5. Discussion

A bi-level optimal allocation model is established to formulate the allocation scheme of distributed PV and ES in distribution network. The nonlinear optimal model could be solved by intelligent algorithms, e.g., genetic algorithm [14] and particle swarm algorithm [19]. However, numerous samples have to be generated during the solving process of intelligent algorithm and repeated power flow calculations have to be carried out accordingly. The steady-state security region algorithm is introduced into the optimal allocation of distributed PV and ES in the paper. Initial allocation scheme, which is very close to the last solution, can be achieved skillfully and the nonlinear day-ahead dispatching model can be converted into a linear one. The optimal allocation model can be solved quickly.
The time-series simulation method is adopted to formulate allocation method of distributed PV and ES. Compared to robust optimization [30] or chance-constrained optimization [32], the fluctuation of renewable power output and load demand in different time scales can be considered expediently. Therefore, the allocation scheme is closer to the truth. Moderate curtailment measures have been considered, and sensitivity analyses of key parameters affecting allocation scheme have been conducted. The results suggest that dynamic allocation of distributed PV and ES is necessary. The 33-node system is used in the case study of the paper, but the proposed method is universal for all radial distribution networks.
Increasing DG is integrated into distribution network. Besides ES and moderate curtailment, the flexibility of distribution network topology will be considered in the future. For example, soft switch can realize flexible regulation of power flow and the penetration rate of distributed renewable power can be further improved. In addition, distribution network forms are becoming more and more abundant, and new forms of power grids, such as DC distribution networks, offshore micro grids, and AC/DC hybrid power grids, are gradually emerging. For example, flexible DC equipment can significantly improve the power flow distribution of the distribution network. In the next step, all flexible resources from source-network-load-storage will be taken into account for DG allocation in various forms of distribution network.

6. Conclusions

A distributed PV and ES optimal allocation method based on the steady-state security region is proposed in the paper. A bi-level optimal allocation model of DG and ES has been established considering curtailment measures, and a quick model-solving method is proposed. By the linear hyperplane coefficient of security region in power injection space, initial allocation scheme of distributed PV and ES could be determined with the redundancy information of the system and the day-ahead economic dispatching model is transformed into a linear model. Therefore, the optimal allocation model can be solved by the proposed method quickly.
The improved IEEE 33-node system is analyzed using the proposed method. The distributed PV capacity could be integrated into each node is greatly different. The maximum PV capacities of the 11th, 19th, 24th, and 29th nodes, selected as the integration locations, are 1.18 MW, 4.00 MW, 3.42 MW, and 1.49 MW, respectively, when the allocation proportion of ES is 20% and the discharge duration is 4 h. By conducting time series operation simulations, the optimal quota capacity of PV can be determined according to the power supply income of the distribution network. When the PV cost decreases from 8,000,000 yuan/MW to 2,000,000 yuan/MW, the optimal PV quota capacity gradually increases from 27.4 MW to 35.5 MW. The cost and technical parameters of ES equipment will affect the optimal PV quota capacity. When the investment cost of ES decreases from 1.0 yuan/Wh to 0.2 yuan/Wh, and the discharging duration is set as 4 h, the optimal allocation proportion of ES is from 31.79% to 46.12%. When discharge duration of ES is 4 h, 3 h, 2 h, and 1 h, the optimal quota capacity of PV is 30 MW, 30 MW, 28 MW, and 28 MW respectively. According to the evaluation results, it is found that:
(1)
With ES and PV peak output curtailment measure, the permeability of renewable energy and the power supply benefit in the distribution network can be improved greatly.
(2)
The cost and technical parameters of distributed PV and ES is closely related to the optimal allocation scheme. Dynamic allocation schemes should be formulated for the distribution network.
(3)
Under reasonable allocation scheme, the optimal quota capacity of DG exceeds the sum of the maximum load and the branch capacity. In addition, the annual renewable power generation exceeds the total load demand of the distribution network.

Author Contributions

Conceptualization, G.L. and B.S.; methodology, G.L.; software, Y.Z.; validation, L.G., Y.L. and Y.W.; formal analysis, B.S.; investigation, G.L.; resources, G.L.; data curation, G.L.; writing—original draft preparation, B.S.; writing—review and editing, Y.Z.; visualization, L.G.; supervision, Y.W.; project administration, Y.L.; funding acquisition, B.S. All authors have read and agreed to the published version of the manuscript.

Funding

This research was funded by “the State Grid science and technology project, grant number (SGTYHT/21-JS-223)”, “the National Natural Science Foundation of China, grant number (No.52277118 and No.52177106)”, “the Tianjin Science and technology planning project, grant number (22ZLGCGX00050)”.

Data Availability Statement

Not applicable.

Acknowledgments

This research was supported by the State Grid science and technology project (SGTYHT/21-JS-223), the National Natural Science Foundation of China (No.52277118 and No.52177106), the Tianjin Science and technology planning project (22ZLGCGX00050) and the 67th postdoctoral fund.

Conflicts of Interest

The authors declare no conflict of interest.

Nomenclature

Bijthe susceptance between the ith node and the jth node
C1the investment cost of PV and ES
C2the difference of power selling income and power purchasing cost
CESequal annual value coefficients of ES
CPVequal annual value coefficients of PV
com_ ESthe operation and maintenance ratio of ES equipment
com_ PVthe operation and maintenance ratio of PV equipment
Ei,tthe ES remaining electricity on the ith node at tth time
E i ES the installed capacity of distributed ES
Gijthe conductance between the ith node and the jth node
Hithe node set connected with the ith node
k1, k2the minimum and the maximum ES states of charge
P i PV the installed capacity of distributed PV
P i , t Dis the ES discharging power on the ith node at tth time
P i , t L the active power of the ith node at tth time
P i , t ren , 2 the actual output of renewable energy on the ith node at tth time
P i , t Cha the charging power of the ES of the ith node at tth time
Pij,tthe line real-time power between the ith node and jth node
Pij,maxthe line rated capacity between the ith node and jth node
P line max the upper limit of transmission capacity for tie-line
P cli _ line max the upper limit of climbing rate
P i , t ren , 1 the maximum output of renewable energy
Pithe active power of the ith node
P i m the minimum active power of the ith node
P i M the maximum active power of the ith node
Qithe reactive power of the ith node
Q i m the minimum reactive power of the ith node
Q i M the maximum reactive power of the ith node
rthe bank discount rate
sESthe cost of discharging 1 kWh electricity of ES equipment
Ui,tthe voltage amplitude of the ith node at tth time
Ui,minthe lower limits of the node voltage amplitude
Ui,maxthe upper limits of the node voltage amplitude
xβthe vector of the nodal injection power
ythe operating life of the equipment
α M j , i ,   β M j , i ,   α m j , i ,   β m j , i ,   α I j , i ,   β I j , i the constant coefficients of steady-state security region
α 1 ,   α 2 the 0–1 indicating viables and denote the status of power purchasing and selling
β 1 ,   β 2 the 0–1 indicating variables and denote the charging and discharging state of the ES
Pithe maximum DG installed capacity without ES
Δ P i the maximum DG installed capacity with ES
θij,tthe phase difference between the ith node and the jth node at tth time
λ constant coefficient related to the selected ES

Appendix A

Figure A1. The time series curve of load demand and PV output on the 15th day of each month: (a) daily time series load demand curve; (b) daily time series PV output curve.
Energies 15 07690 g0a1aEnergies 15 07690 g0a1b

References

  1. Zhao, H.; Xu, J.; Xu, K.; Sun, J.; Wang, Y. Optimal Allocation Method of Source and Storage Capacity of PV-Hydrogen Zero Carbon Emission Microgrid Considering the Usage Cost of Energy Storage Equipment. Energies 2022, 15, 4916. [Google Scholar] [CrossRef]
  2. Yixin, Y. Distributed generation. In Basic Concepts and Key Technologies of Smart Grid, 1st ed.; Yunnian, F., Ed.; Science Press: Beijing, China, 2019; pp. 17–31. [Google Scholar]
  3. Sun, B.; Li, Y.; Zeng, Y.; Li, C.; Shi, J.; Ma, X. Distribution transformer cluster flexible dispatching method based on discrete monkey algorithm. Energy Rep. 2021, 7, 1930–1942. [Google Scholar] [CrossRef]
  4. Pearre, N.; Swan, L. Combining wind, solar, and in-stream tidal electricity generation with energy storage using a load-perturbation control strategy. Energy 2020, 203, 117898. [Google Scholar] [CrossRef]
  5. Yan, Z.; Zhang, Y.; Liang, R.; Jin, W. An allocative method of hybrid electrical and thermal energy storage capacity for load shifting based on seasonal difference in district energy planning. Energy 2020, 207, 118139. [Google Scholar] [CrossRef]
  6. Cao, Y.; Liu, C.; Huang, Y.; Wang, T.; Sun, C.; Yuan, Y.; Zhang, X.; Wu, S. Parallel algorithms for islanded microgrid with photovoltaic and energy storage systems planning optimization problem: Material selection and quantity demand optimization. Comput. Phys. Commun. 2017, 211, 45–53. [Google Scholar] [CrossRef]
  7. Guan, H.; Feng, Y.; Yang, X.; Du, Y.; Feng, D.; Zhou, Y. Optimization strategy of combined thermal-storage-photovoltaic economic operation considering deep peak load regulation demand. Energy Rep. 2022, 8, 112–120. [Google Scholar] [CrossRef]
  8. Rocha, L.C.; Junior, P.R.; Aquila, G.; Maheri, A. Multiobjective optimization of hybrid wind-photovoltaic plants with battery energy storage system: Current situation and possible regulatory changes. J. Energy Storage 2022, 51, 104467. [Google Scholar] [CrossRef]
  9. Wang, Z.; Cai, W.; Tao, H.; Wu, D.; Meng, J. Research on capacity and strategy optimization of combined cooling, heating and power systems with solar photovoltaic and multiple energy storage. Energy Convers. Manag. 2022, 268, 115965. [Google Scholar] [CrossRef]
  10. Kasturi, K.; Nayak, C.K.; Patnaik, S.; Nayak, M.R. Strategic integration of photovoltaic, battery energy storage and switchable capacitor for multi-objective optimization of low voltage electricity grid: Assessing grid benefits. Renew. Energy Focus 2022, 41, 104–117. [Google Scholar] [CrossRef]
  11. Zhang, Y.; Sun, H.; Tan, J.; Li, Z.; Hou, W.; Guo, Y. Capacity configuration optimization of multi-energy system integrating wind turbine/photovoltaic/hydrogen/battery. Energy 2022, 252, 124046. [Google Scholar] [CrossRef]
  12. Peng, C.; Xiong, Z.; Zhang, Y.; Zheng, C. Multi objective robust optimization allocation for energy storage using a novel confidence gap decision method. Int. J. Electr. Power Energy Syst. 2022, 138, 107902. [Google Scholar] [CrossRef]
  13. Popović, D.H.; Greatbanks, J.A.; Begović, M.; Pregelj, A. Placement of distributed generators and reclosers for distribution network security and reliability. Int. J. Electr. Power Energy Syst. 2005, 27, 398–408. [Google Scholar] [CrossRef]
  14. Cortés, P.; Muñuzuri, J.; Domínguez, I. Genetic algorithms to optimize the operating costs of electricity and heating networks in buildings considering distributed energy generation and storage. Comput. Oper. Res. 2018, 96, 157–172. [Google Scholar] [CrossRef]
  15. Nazir, M.S.; Abdalla, A.N.; Zhao, H.; Chu, Z.; Nazir, H.M.; Bhutta, M.S.; Javed, M.S.; Sanjeevikumar, P. Optimized economic operation of energy storage integration using improved gravitational search algorithm and dual stage optimization. J. Energy Storage 2022, 50, 104591. [Google Scholar] [CrossRef]
  16. Rawa, M.; AlKubaisy, Z.M.; Alghamdi, S.; Refaat, M.M.; Ali, Z.M.; Aleem, S.H. A techno-economic planning model for integrated generation and transmission expansion in modern power systems with renewables and energy storage using hybrid Runge Kutta-gradient-based optimization algorithm. Energy Rep. 2022, 8, 6457–6479. [Google Scholar] [CrossRef]
  17. Hussein, A.; Ahmed, F.; Salah, K. An effective hybrid approach based on arithmetic optimization algorithm and sine cosine algorithm for integrating battery energy storage system into distribution networks. J. Energy Storage 2022, 49, 104154. [Google Scholar]
  18. Hung, D.Q.; Mithulananthan, N.; Bansal, R.C. Integration of PV and BES units in commercial distribution systems considering energy loss and voltage stability. Appl. Energy 2014, 113, 1162–1170. [Google Scholar] [CrossRef]
  19. Nekooei, K.; Farsangi, M.M.; Nezamabadi-Pour, H.; Lee, K.Y. An Improved Multi-Objective Harmony Search for Optimal Placement of DGs in Distribution Systems. IEEE Trans. Smart Grid 2013, 4, 557–567. [Google Scholar] [CrossRef]
  20. Tu, J.; Xu, Y.; Yin, Z. Data-Driven Kernel Extreme Learning Machine Method for the Location and Capacity Planning of Distributed Generation. Energies 2018, 12, 109. [Google Scholar] [CrossRef] [Green Version]
  21. Pan, H.; Ding, M.; Bi, R.; Sun, L. Research on cooperative planning of distributed generation access to AC/DC distribution (Micro) grids based on analytical target cascading. Energies 2019, 12, 1847. [Google Scholar] [CrossRef] [Green Version]
  22. Ali, Z.M.; Diaaeldin, I.M.; El-Rafei, A.; Hasanien, H.M.; Aleem, S.H.; Abdelaziz, A.Y. A novel distributed generation planning algorithm via graphically-based network reconfiguration and soft open points placement using Archimedes optimization algorithm. Ain Shams Eng. J. 2021, 12, 1923–1941. [Google Scholar] [CrossRef]
  23. Zahedi Vahid, M.; Ali, Z.M.; Seifi Najmi, E.; Ahmadi, A.; Gandoman, F.H.; Aleem, S.H. Optimal allocation and planning of distributed power generation resources in a smart distribution network using the manta ray foraging optimization algorithm. Energies 2021, 14, 4856. [Google Scholar] [CrossRef]
  24. Wang, C.; Zhang, L.; Zhang, K.; Song, S.; Liu, Y. Distributed energy storage planning considering reactive power output of energy storage and photovoltaic. Energy Rep. 2022, 8, 562–569. [Google Scholar] [CrossRef]
  25. Guo, J.; Liu, Z.; Wu, X.; Wu, D.; Zhang, S.; Yang, X.; Ge, H.; Zhang, P. Two-layer co-optimization method for a distributed energy system combining multiple energy storages. Appl. Energy 2022, 322, 119486. [Google Scholar] [CrossRef]
  26. Li, Y.; Feng, B.; Wang, B.; Sun, S. Joint planning of distributed generations and energy storage in active distribution networks: A Bi-Level programming approach. Energy 2022, 245, 123226. [Google Scholar] [CrossRef]
  27. Liu, Z.; Li, Y.; Fan, G.; Wu, D.; Guo, J.; Jin, G.; Zhang, S.; Yang, X. Co-optimization of a novel distributed energy system integrated with hybrid energy storage in different nearly zero energy community scenarios. Energy 2022, 247, 123553. [Google Scholar] [CrossRef]
  28. Wu, J.; Zhang, B.; Deng, W.; Zhang, K. Application of Cost-CVaR model in determining optimal spinning reserve for wind power penetrated system. Int. J. Electr. Power Energy Syst. 2014, 66, 110–115. [Google Scholar] [CrossRef]
  29. Shi, L.; Hao, J.; Zhou, J.; Xu, G. Ant colony optimization algorithm with random perturbation behavior to the problem of optimal unit commitment with probabilistic spinning reserve determination. Electr. Power Syst. Res. 2004, 69, 295–303. [Google Scholar] [CrossRef]
  30. Zhao, B.; Qian, T.; Tang, W.; Liang, Q. A data-enhanced distributionally robust optimization method for economic dispatch of integrated electricity and natural gas systems with wind uncertainty. Energy 2022, 243, 123113. [Google Scholar] [CrossRef]
  31. Rehman, U.U.; Riaz, M.; Wani, M.Y. A robust optimization method for optimizing day-ahead operation of the electric vehicles aggregator. Int. J. Electr. Power Energy Syst. 2021, 132, 107179. [Google Scholar] [CrossRef]
  32. Rahman, A.; Hassan, B.; Ahmad, G. A chance-constrained optimization framework for transmission congestion management and frequency regulation in the presence of wind farms and energy storage systems. Electr. Power Syst. Res. 2022, 213, 108712. [Google Scholar]
  33. Tan, J.; Wu, Q.; Zhang, M.; Wei, W.; Liu, F.; Pan, B. Chance-constrained energy and multi-type reserves scheduling exploiting flexibility from combined power and heat units and heat pumps. Energy 2021, 233, 121176. [Google Scholar] [CrossRef]
  34. Du, E.; Zhang, N.; Kang, C.; Xia, Q. Scenario map based stochastic unit commitment. IEEE Trans. Power Syst. 2018, 33, 4694–4705. [Google Scholar] [CrossRef]
  35. Lee, D.; Baldick, R. Load and Wind Power Scenario Generation Through the Generalized Dynamic Factor Model. IEEE Trans. Power Syst. 2017, 32, 400–410. [Google Scholar] [CrossRef]
  36. Yang, T.; Yu, Y. Static voltage security region-based coordinated voltage control in smart distribution grids. IEEE Trans. Smart Grid 2018, 9, 5494–5502. [Google Scholar] [CrossRef]
  37. Yang, T.; Yu, Y. Steady-state security region-based voltage/var optimization considering power injection uncertainties in distribution grids. IEEE Trans. Smart Grid 2019, 10, 2904–2911. [Google Scholar] [CrossRef]
  38. Wang, C.; Cheng, H.Z. Optimization of Network Configuration in Large Distribution Systems Using Plant Growth Simulation Algorithm. IEEE Trans. Power Syst. 2008, 23, 119–126. [Google Scholar] [CrossRef]
  39. Reliability Test System Task Force of the Application of Probability Methods Subcommittee. IEEE Trans. Power Appar. Syst. 1979, PAS-98, 2047–2054.
  40. NASA Prediction of Worldwide Energy Resources. Power Data Access Viewer. Available online: https://power.larc.nasa.gov/ (accessed on 15 June 2022).
  41. Xu, R.; Ni, K.; Hu, Y.; Si, J.; Wen, H.; Yu, D. Analysis of the optimum tilt angle for a soiled PV panel. Energy Convers. Manag. 2017, 148, 100–109. [Google Scholar] [CrossRef]
  42. Polaris Energy Storage Network. Summary of the Largest Peak Valley Electricity Price Difference in China in July 2022! Available online: https://news.bjx.com.cn/html/20220628/1236774.shtml (accessed on 28 June 2022).
Figure 1. Schematic diagram of DG and ES optimization allocation.
Energies 15 07690 g001
Figure 2. The structure of improved IEEE 33-node system.
Energies 15 07690 g002
Figure 3. Time of use price information.
Energies 15 07690 g003
Figure 4. Maximum installed capacity of each node with and without ES.
Energies 15 07690 g004
Figure 5. Node voltage distribution diagram without and with PV electricity curtailment. (a) Node voltage distribution diagram without PV electricity curtailment; (b) node voltage distribution diagram considering PV electricity curtailment.
Energies 15 07690 g005
Figure 6. Dispatching scheme of PV and ES system at each node; (a) actual output curve of PV; (b) dispatching scheme of ES.
Energies 15 07690 g006
Figure 7. Capacity proportion comparison between initial and final allocation schemes: (a) initial DG capacity proportion; (b) final DG capacity proportion.
Energies 15 07690 g007
Figure 8. Power supply benefit curve under different ES investment costs.
Energies 15 07690 g008
Figure 9. Power supply benefit when discharge duration of ES is 4 h, 3 h, 2 h, and 1 h: (a) benefit when discharge duration is 4 h; (b) benefit when discharge duration is 3 h; (c) benefit when discharge duration is 2 h; (d) benefit when discharge duration is 1 h.
Energies 15 07690 g009
Table 1. Curtailment ratio of PV power under different ratios.
The Number of EvaluationsFirstSecondThirdFourthFifthSixthSeventh
Whole systemCurtailment ratio/%5.515.494.43.543.393.33.29
The 11th nodeProportion coefficient0.1170.1520.1460.1410.1380.1370.137
Curtailment ratio/%0.197.255.754.473.693.393.35
The 19th nodeProportion coefficient0.3960.3230.3270.380.3940.4030.405
Curtailment ratio/%2.9100.21.532.332.983.12
The 24th nodeProportion coefficient0.3390.3140.3040.2880.2810.2750.274
Curtailment ratio/%12.768.577.235.24.393.663.49
The 29th nodeProportion coefficient0.1480.2090.2010,1900.1870.1850.184
Curtailment ratio/%08.046.384.383.913.383.34
Table 2. Result comparison of different allocation principles.
PV Electricity Penetration/%Curtailment Ratio/%Power Supply Benefit/Yuan
Equal PV electricity curtailment ratio158.103.298,918,746
Equal capacity installation145.1511.218,363,915
Table 3. Allocation schemes under different quota capacities.
P max cap / MW The 11th Node/MWThe 19th Node/MWThe 24th Node/MWThe 29th Node/MW
202.718.095.543.65
243.299.726.584.42
253.3810.116.934.57
263.5210.517.214.75
283.7911.327.765.12
304.0612.138.315.48
Table 4. Optimal planning results of distributed PV.
Investment Cost of PV (Yuan/MW)Optimal Installed Capacity
(MW)
Power Supply Benefit (Yuan)
8,000,00027.47,338,476
6,000,00030.113,201,881
4,000,00032.819,614,340
2,000,00035.526,573,804
Table 5. Power supply benefit under different ratios of ES power.
Allocation Proportion of ES/%PV electricity Penetration/%PV Electricity Curtailment Ratio/%Power Supply Benefit (Yuan)
20199.436.1611,404,753
30207.302.4613,055,808
40211.460.513,453,462
50212.53012,795,417
Publisher’s Note: MDPI stays neutral with regard to jurisdictional claims in published maps and institutional affiliations.

