1. Introduction
For centuries, animal manure has been a traditional source of nutrients in agriculture. However, due to an increase in the concentration of animal production in a limited geographic region, disposing of animal dung has recently become an issue for the environment [
1].
Manure management (in particular open storage) contributes significantly to greenhouse gas emissions from agriculture, mostly in the form of methane and ammonia emissions [
2].
From a technical and financial standpoint, using slurry, manure and beddings from cattle, pigs, horses, chickens and other animal breeds in combination with energy-rich substrates like crops and other organic resources, such as biogas substrates, presents an intriguing possibility. Other resources appropriate for anaerobic digestion include different agricultural wastes (crops and vegetables), residues from the food processing sector, and energy crops (maize silage, grass and similar materials) [
3].
High-potential food waste can also be successfully digested anaerobically for the creation of biogas [
4].
Anaerobic co-digestion is the digestion of two or more complementary substrates at the same time. This process speeds up the decomposition of organic matter and, as a result, increases the yield of biogas and methane, producing a greater specific yield and higher quality organic fertilizer [
5].
The first stage in determining whether biogas-based power plants are feasible is to properly estimate the biogas potential. The primary feedstock’s accessibility is crucial to this procedure. The quantity of livestock and poultry in a region, as well as the density of farms—which may be dispersed widely or clustered in small areas—determine the availability of manure feedstock in that region. In order to determine the regional availability of biogas feedstock, it is essential to have information on the geographical distribution of livestock and poultry [
6].
Micro-biogas plants on small farms can offer a very effective solution for eliminating problems with organic waste, effectively prevent the leakage of greenhouse gases into the atmosphere and, at the same time, bring many other benefits to the investor. With proper placement in the environment and appropriate handling, such projects do not have negative impacts on the environment and people [
7].
In the 27-nation European Union, the biogas-based primary energy output is increasing. Production increased in 2019 (by 2.1% compared to 2018) and 2020 (by 4% year on year), recovering after a modest decline in 2018 (by 0.3% between 2017 and 2018), to reach 14,716.1 ktoe in 2020. The majority of this output (80.2%) is methanation biogas made from nonhazardous waste or unprocessed plant matter, which is higher than landfill biogas (11.2%), sewage sludge gas (7.8%) and thermal biogas (0.8%). The output rise between 2019 and 2020 is the biggest since 2014, coming in at 569 ktoe. When compared to the preceding 12-month period, France (160.5 ktoe), Germany (151 ktoe), Denmark (115.5 ktoe), the Netherlands (59.5 ktoe) and Spain (32.4 ktoe) saw the largest gains. With the exception of Germany (2%), all of these nations had a double-digit increase (29.2% for Denmark, 16.7% for the Netherlands, 16.5% for France, and 11.1% for Spain). Germany will account for more than half of the biogas produced in the EU (7744.8 ktoe in 2020), which explains why its output growth rate was lower. Methanation biogas from non-hazardous waste and raw plant matter (the “other biogas” category), rather than landfill biogas (which increased by 140.8 ktoe) and sewage sludge biogas (which increased by 21.1 ktoe), continues to be the major contributor to the 427.1 ktoe increase in biogas production across the European Union between 2019 and 2020 [
8].
Until 2000, the production of biogas in Slovenia was mainly limited to landfill gas and biogas from sewage sludge. After 2002, when the Regulation for the purchase of electricity from qualified electricity producers [
9] was adopted, the situation changed and the number of biogas plants began to increase. The concept of building large biogas plants (more than 1 MW) soon proved to be completely wrong due to the lack of input substrates. It was based on large quantities of input substrates, mainly in the form of corn, which grew on the best agricultural land which was not intended for human or animal consumption. Biogas production has decreased due to the financial collapse of larger biogas plants. In recent years, interest in biogas production has been slowly increasing. Despite this, the trend of biogas production from agricultural and other non-hazardous waste has been declining in recent years [
10].
Fragmentation, the small average size of Slovenian agricultural holdings and the relatively small amount of land suitable for agricultural production are factors that must play a decisive role in deciding on the location of biogas plants in such an environment. In this context, the only reasonable size of biogas plants appears to be micro (<50 kW) or small biogas plants (50 kW–1 MW) on a farm or in a community of several farms. This is also supported by the new Act on promoting the use of renewable energy sources [
11] which very explicitly supports self-supply with electricity from renewable sources. Special emphasis is placed on self-sufficient communities, which could significantly increase the use of renewable energy sources and the variety of energy sources.
Numerous studies have evaluated the possibilities of biomass using GIS. Additionally, the location of biomass has been located and the local economic costs of biomass usage and bioenergy production have been assessed using GIS-based tools. The use and manipulation of a significant amount of statistical data and geographically linked information is typically necessary for resource mapping and analysis using GIS technologies [
12,
13].
This paper presents a model to support decision-making about the most suitable location for setting up a micro-biogas plant in the Gorenjska region. With the GIS tools, we combined and intersected various spatial and quantitative data into a final display of the most suitable locations according to various input parameters. We evaluated the locations with economic indicators and tested several scenarios that would allow investment in less suitable locations.
Our goal and main purpose was to create a model that can be adapted for use in other regions of Slovenia by changing the input data and criteria. In addition to the specificity of local agricultural production in a certain area, an important role is also played by the local policy of organic waste management because waste should end its journey as close as possible to the place of its origin.
The usefulness of the model is primarily due to the fact that, with input data and criteria, it can be adapted to all indirect and direct external factors that are related to the amount of organic waste suitable for the input substrate of a biogas plant. With the additions in the model, we can add various new spatial data, which are connected to the amount of organic substrates or agricultural land whose byproducts can represent one of the input substrates for anaerobic decomposition into biogas.
This paper is composed as follows: first, we present the methodology (input data and their combination into groups of interest). This is followed by the development of a GIS-based model resulting in suitable locations for micro-biogas plant establishment. Finally, the locations are evaluated with economic indicators (net present value, internal rate of return and discounted payback period). Different scenarios are presented relating to investment costs, energy price and substrate mixture. The main findings and suggestions for further research conclude this article.
2. Materials and Methods
The interactivity of the model allows for the changing of the input parameters as well as the degree of importance of each criterion. This ensures applicability also in other areas and regions with new input data, which in our case is mainly related to the number of LU (Livestock unit) and their secretions, the amount of organic waste and waste oils from food establishments.
In our model, organic waste from food establishments is one of the most important substrates for anaerobic digestion, so selecting them for input data was based on past experience with large biogas plants and the environmental problem of collecting and transporting organic waste in smaller regions of Slovenia. The fact is, that silage corn, in addition to manure, cannot be the main co-substrate for anaerobic digestion. The average size of Slovenian farms is 7 ha, so the arable land must be primarily intended for food production. Silage corn would only be considered in smaller quantities, where it would significantly increase the biogas production potential of the biogas plant in the input mixture, but only on farms where there would be surplus crops or areas that could be used for energy crops.
To find and select optimal locations, we used quantitative data related to the geographical distribution and spatial density of input substrates for biogas production. The input data sets for the model are:
- -
Spatial: locations of farms with the number of LU and locations of food establishments with amounts of organic waste and waste food fats.
- -
Energy: biogas potential of input substrates, produced amount of electricity and heat, market price of electricity and heat.
- -
Economic: net present value, internal rate of return.
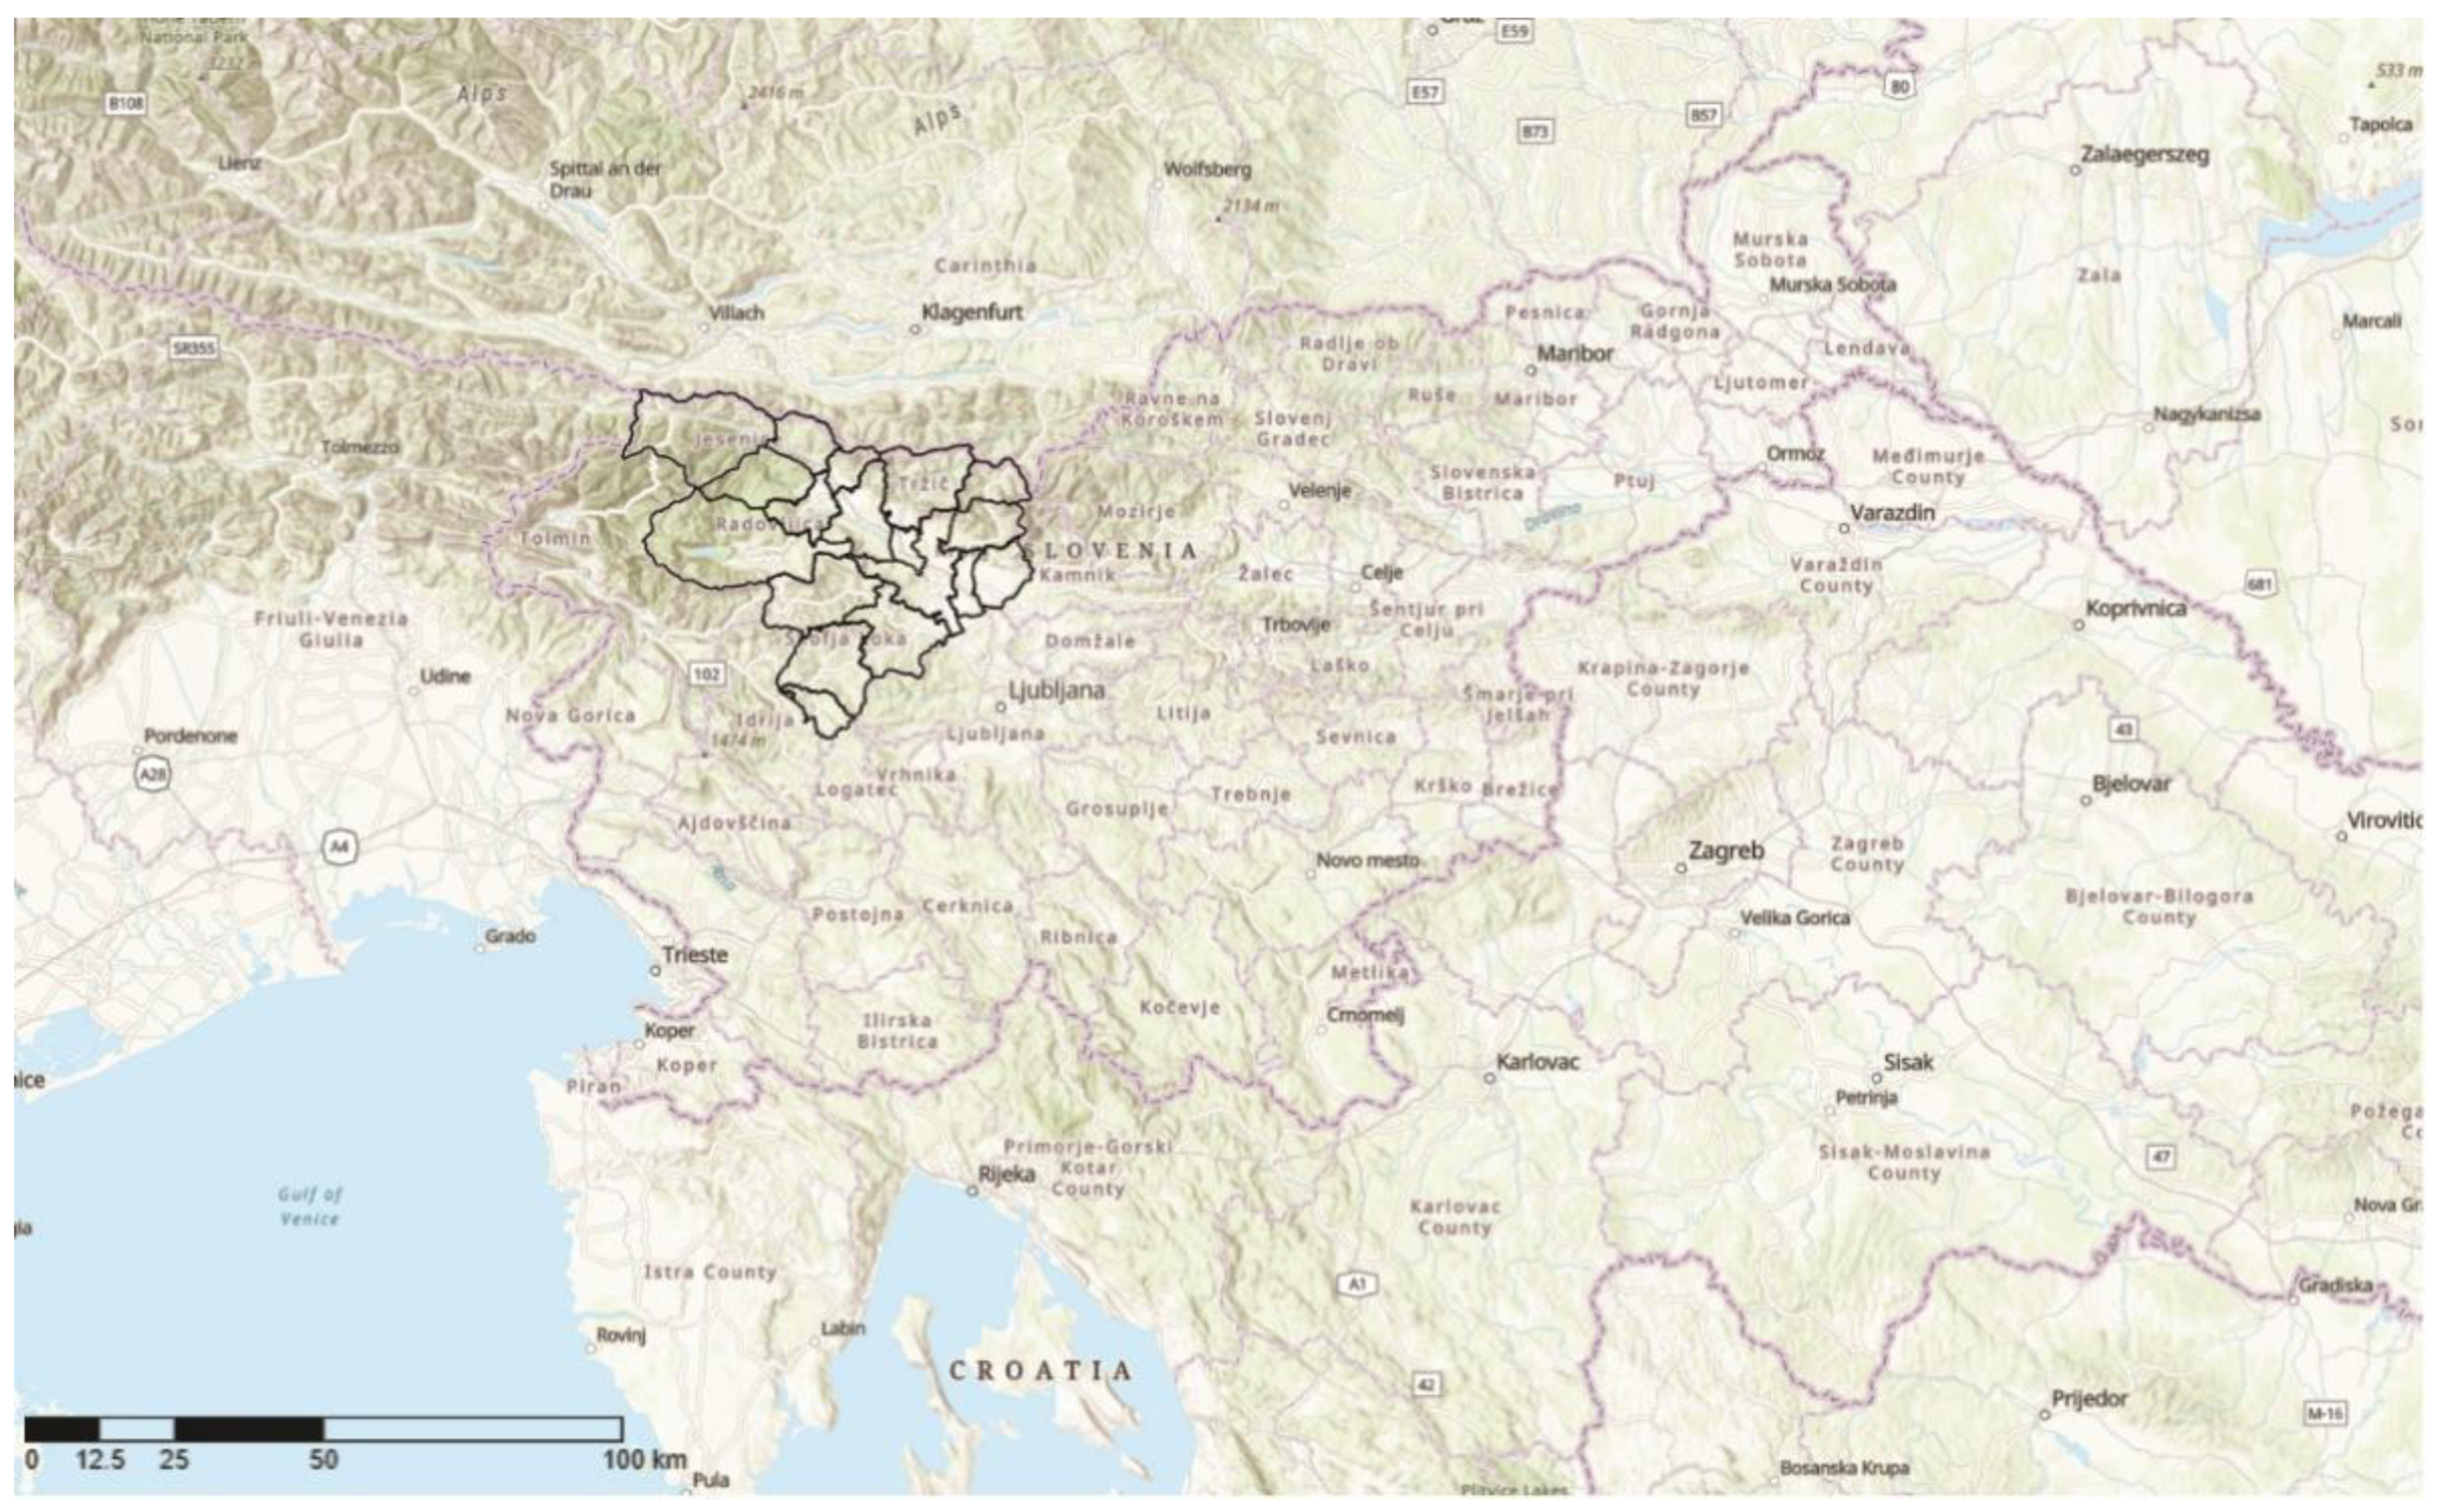
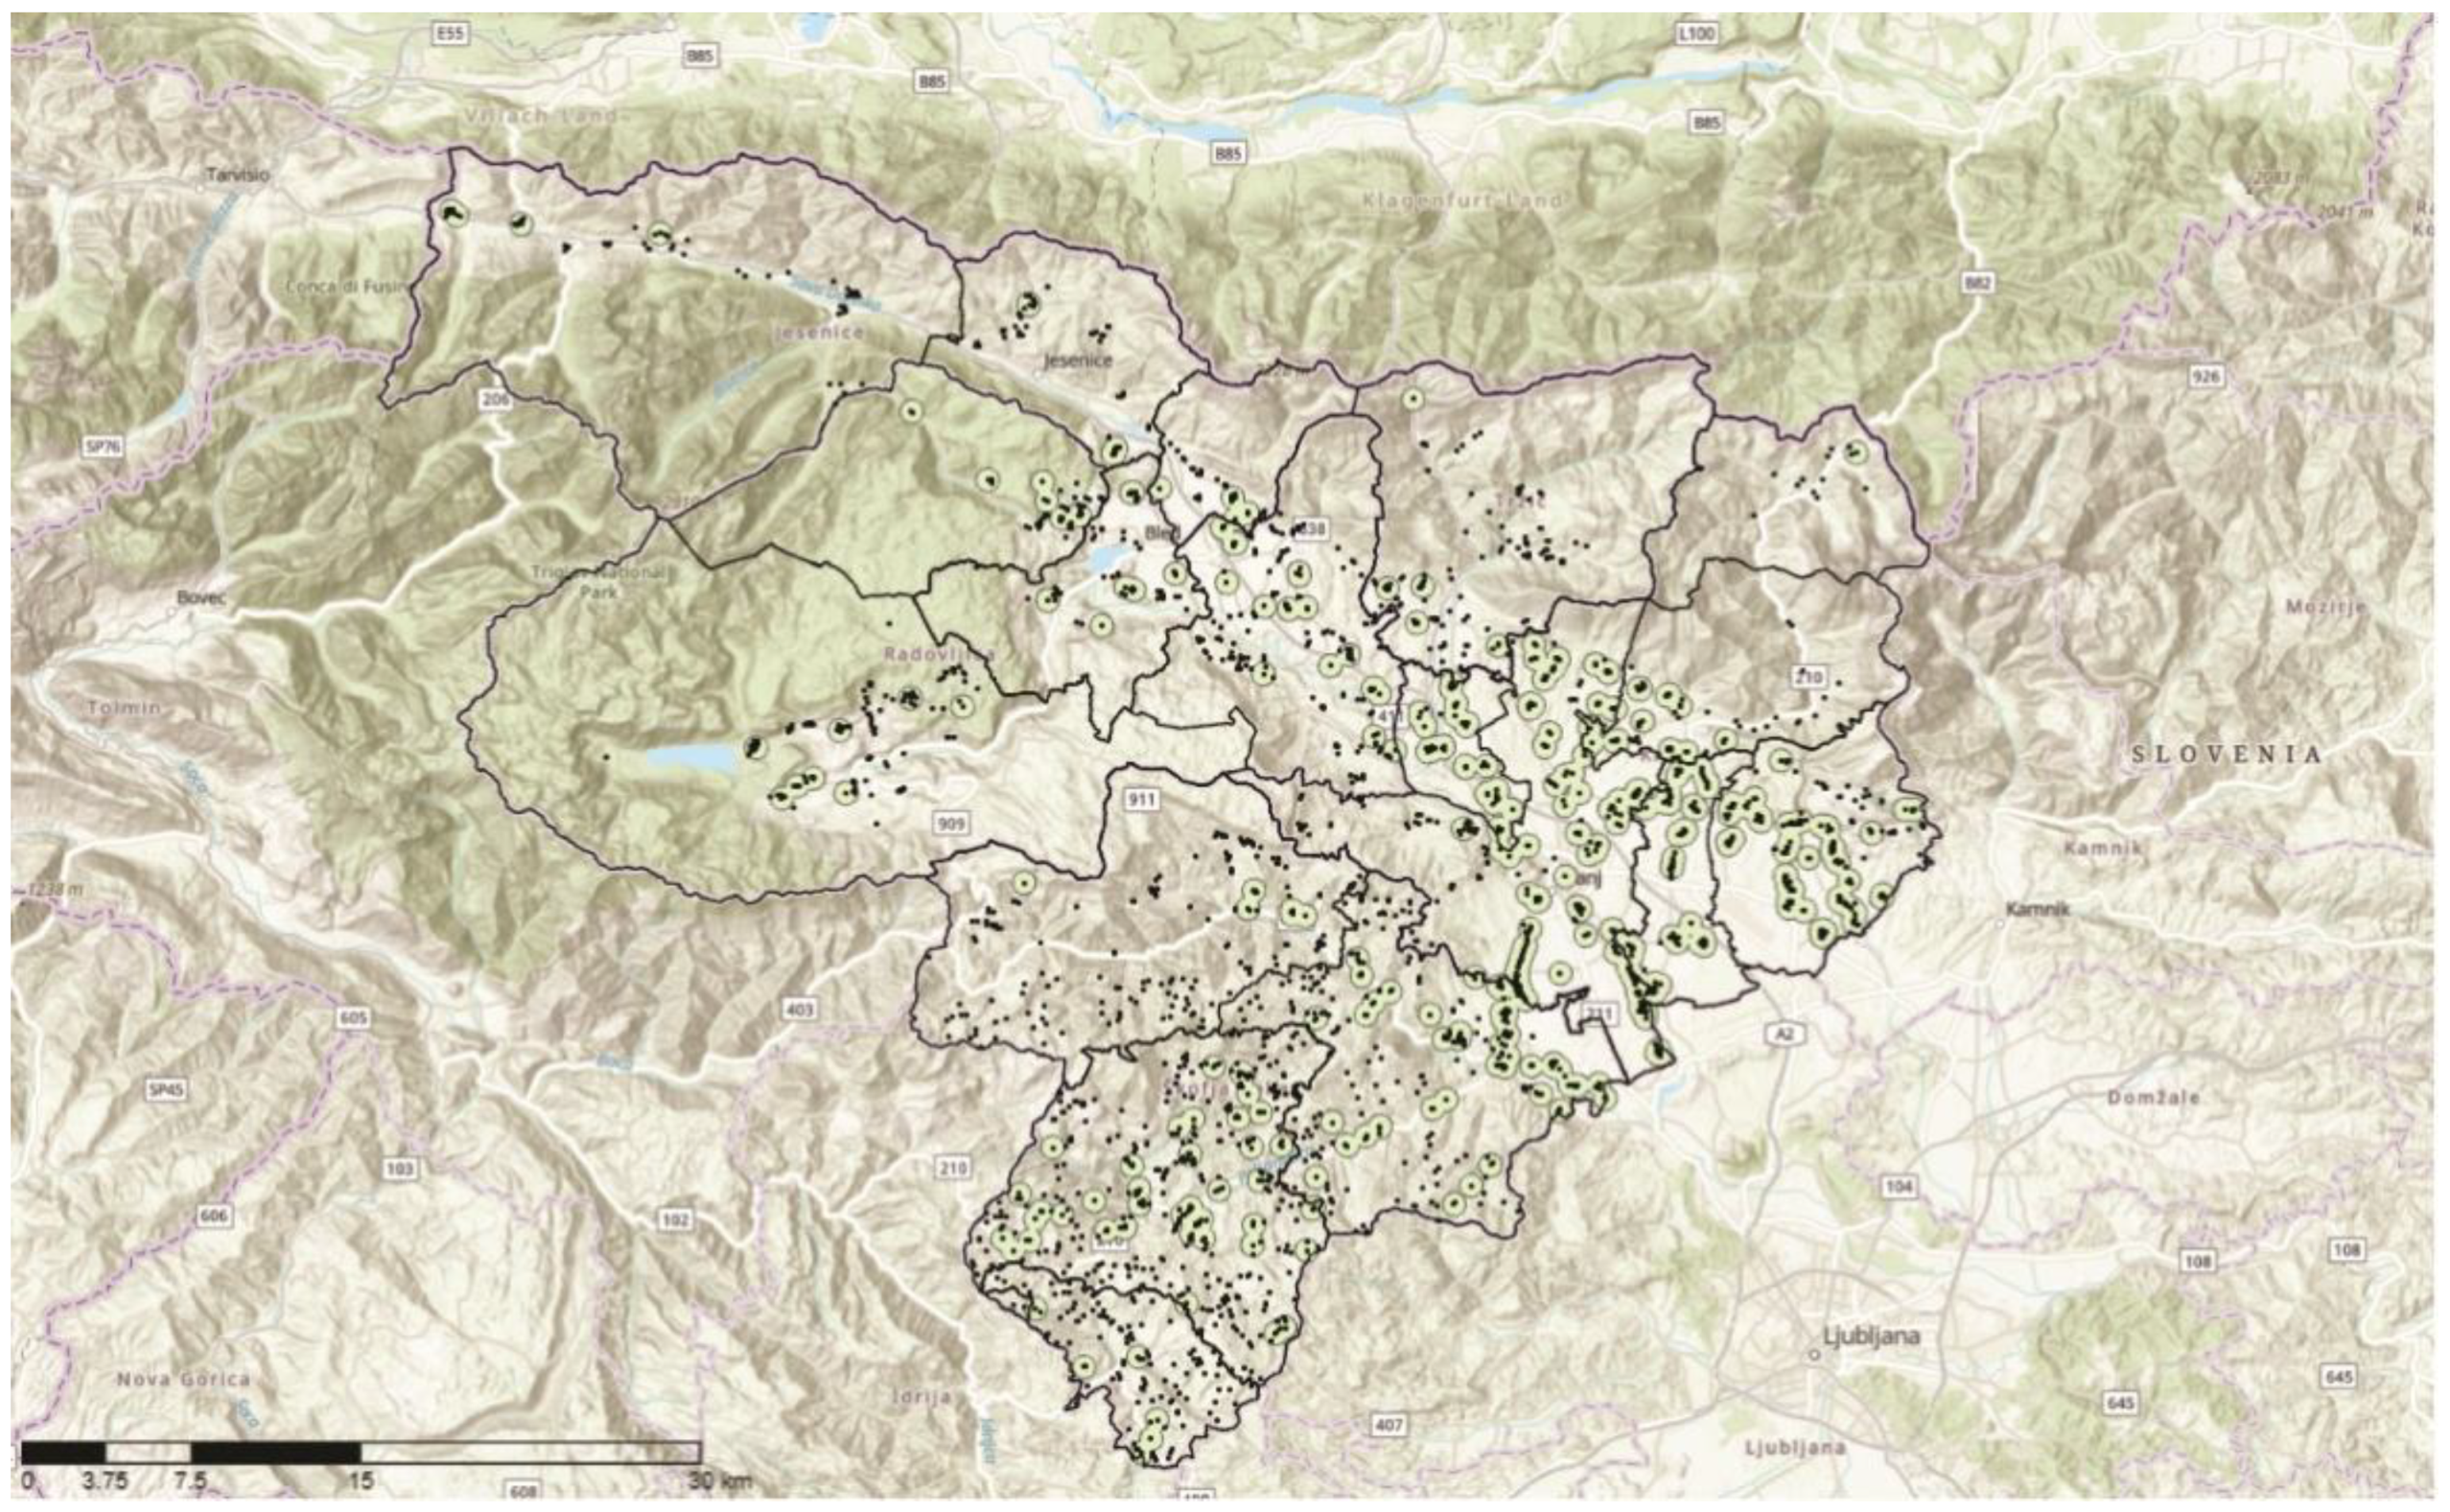
All data are from 2019 and refer to the Gorenjska region (
Figure 1).
2.1. Spatial Data and Biogas Potential of Input Substrates
The Gorenjska region is largely hilly and has many areas that are less suitable or completely unsuitable for agriculture.
The share of agricultural land in Slovenia is 7.6 percent. According to the data we obtained for 2019, there were 33.821 LU, 2546 tons of organic waste from food plants and 339 tons of waste oils and fats from food plants in the Gorenjska region [
14]. The distribution of these amounts by the municipality is very different, and in terms of the number of LU and agricultural areas, it is mainly related to the altitude of the farms, which affects their size. Thus, the available plain agricultural areas are mainly located in the central part of Gorenjska around Kranj and then south towards the municipality of Cerklje na Gorenjskem and Šenčur. In the north, the plain stretches towards the municipalities of Naklo and Radovljica. Areas with a higher concentration of organic waste are connected to tourist centers and larger towns, where the population is higher and, consequently, there are also more food establishments (
Table 1).
For the spatial input data in the model, we chose:
- -
Locations of livestock farms with a number of LU, which represent a source of slurry and manure as the basic substrate for the biogas plant. Goats and sheep are exempt because they spend most of their time in pastures. We obtained the data from the Agency for Agricultural Markets and Rural Development, where they have a database of submitted summary applications for 2019 [
15,
16].
- -
Locations of food processing plants and their submitted amounts of food waste, oils and fats for 2019. We obtained the data from the Slovenian Environment Agency [
16].
- -
Layers of agricultural plants from collective applications (KMRS). We obtained the data on the portal of the Ministry of Agriculture, Forestry and Food [
17].
- -
Graphic display of municipal boundaries in the Gorenjska region. We obtained the data on the site of the Ministry of the Environment and Spatial Planning [
18].
The calorific value of biogas with an average methane value of 70% is 20 MJ/m
3. The value depends on the composition of the biogas and the amount of methane, and ranges from 20 to 25 MJ/m
3, the energy value of methane is 35.8 MJ/m
3 [
19].
Theoretically, approximately 473,382 m3 of biogas could be obtained from the total amount of food waste and fats from the Gorenjska region, which means approximately 789 MWh of electricity. If we add to this the total amount of animal excrement, this would mean about 29 GWh of electricity at 35% efficiency and 5% deduction to cover the needs of the digester and about 32 GWh of net thermal energy at 65% efficiency and 35% deduction for sanitizing and heating the fermenter. Of course, the actual situation in nature is completely different. It is clear from the data that there is relatively little food waste in the entire area of Gorenjska region and it is geographically very dispersed in relation to tourist centers and population. The situation is no different with regard to livestock farming and the distribution of farms. Most of the Gorenjska region area is hilly and suitable only for grazing. There are many very small farms with a few head of livestock, which are quite dispersed and without sources of additional waste in the vicinity. In some municipalities (Bled, Bohinj, Kranjska Gora), due to increased tourist visits, there are more food establishments (restaurants, hotels), and thus, more organic waste, but there are not enough farms with a sufficient number of livestock in the vicinity or no farms at all.
Due to all the particularities, we decided to use the Qgis software, with which we created a model for finding suitable clusters of farms with a sufficiently large number of LU and food establishments in a small enough radius that the transportation of waste does not represent a significant cost.
2.2. Livestock Unit, Food Waste, Waste Oils
The head of large livestock (LU) is a standard unit of measurement that enables the grouping of different categories of animals to compare data from individual years and data from individual countries. The starting point for calculating the coefficients is 500 kg of live weight of the animal [
20].
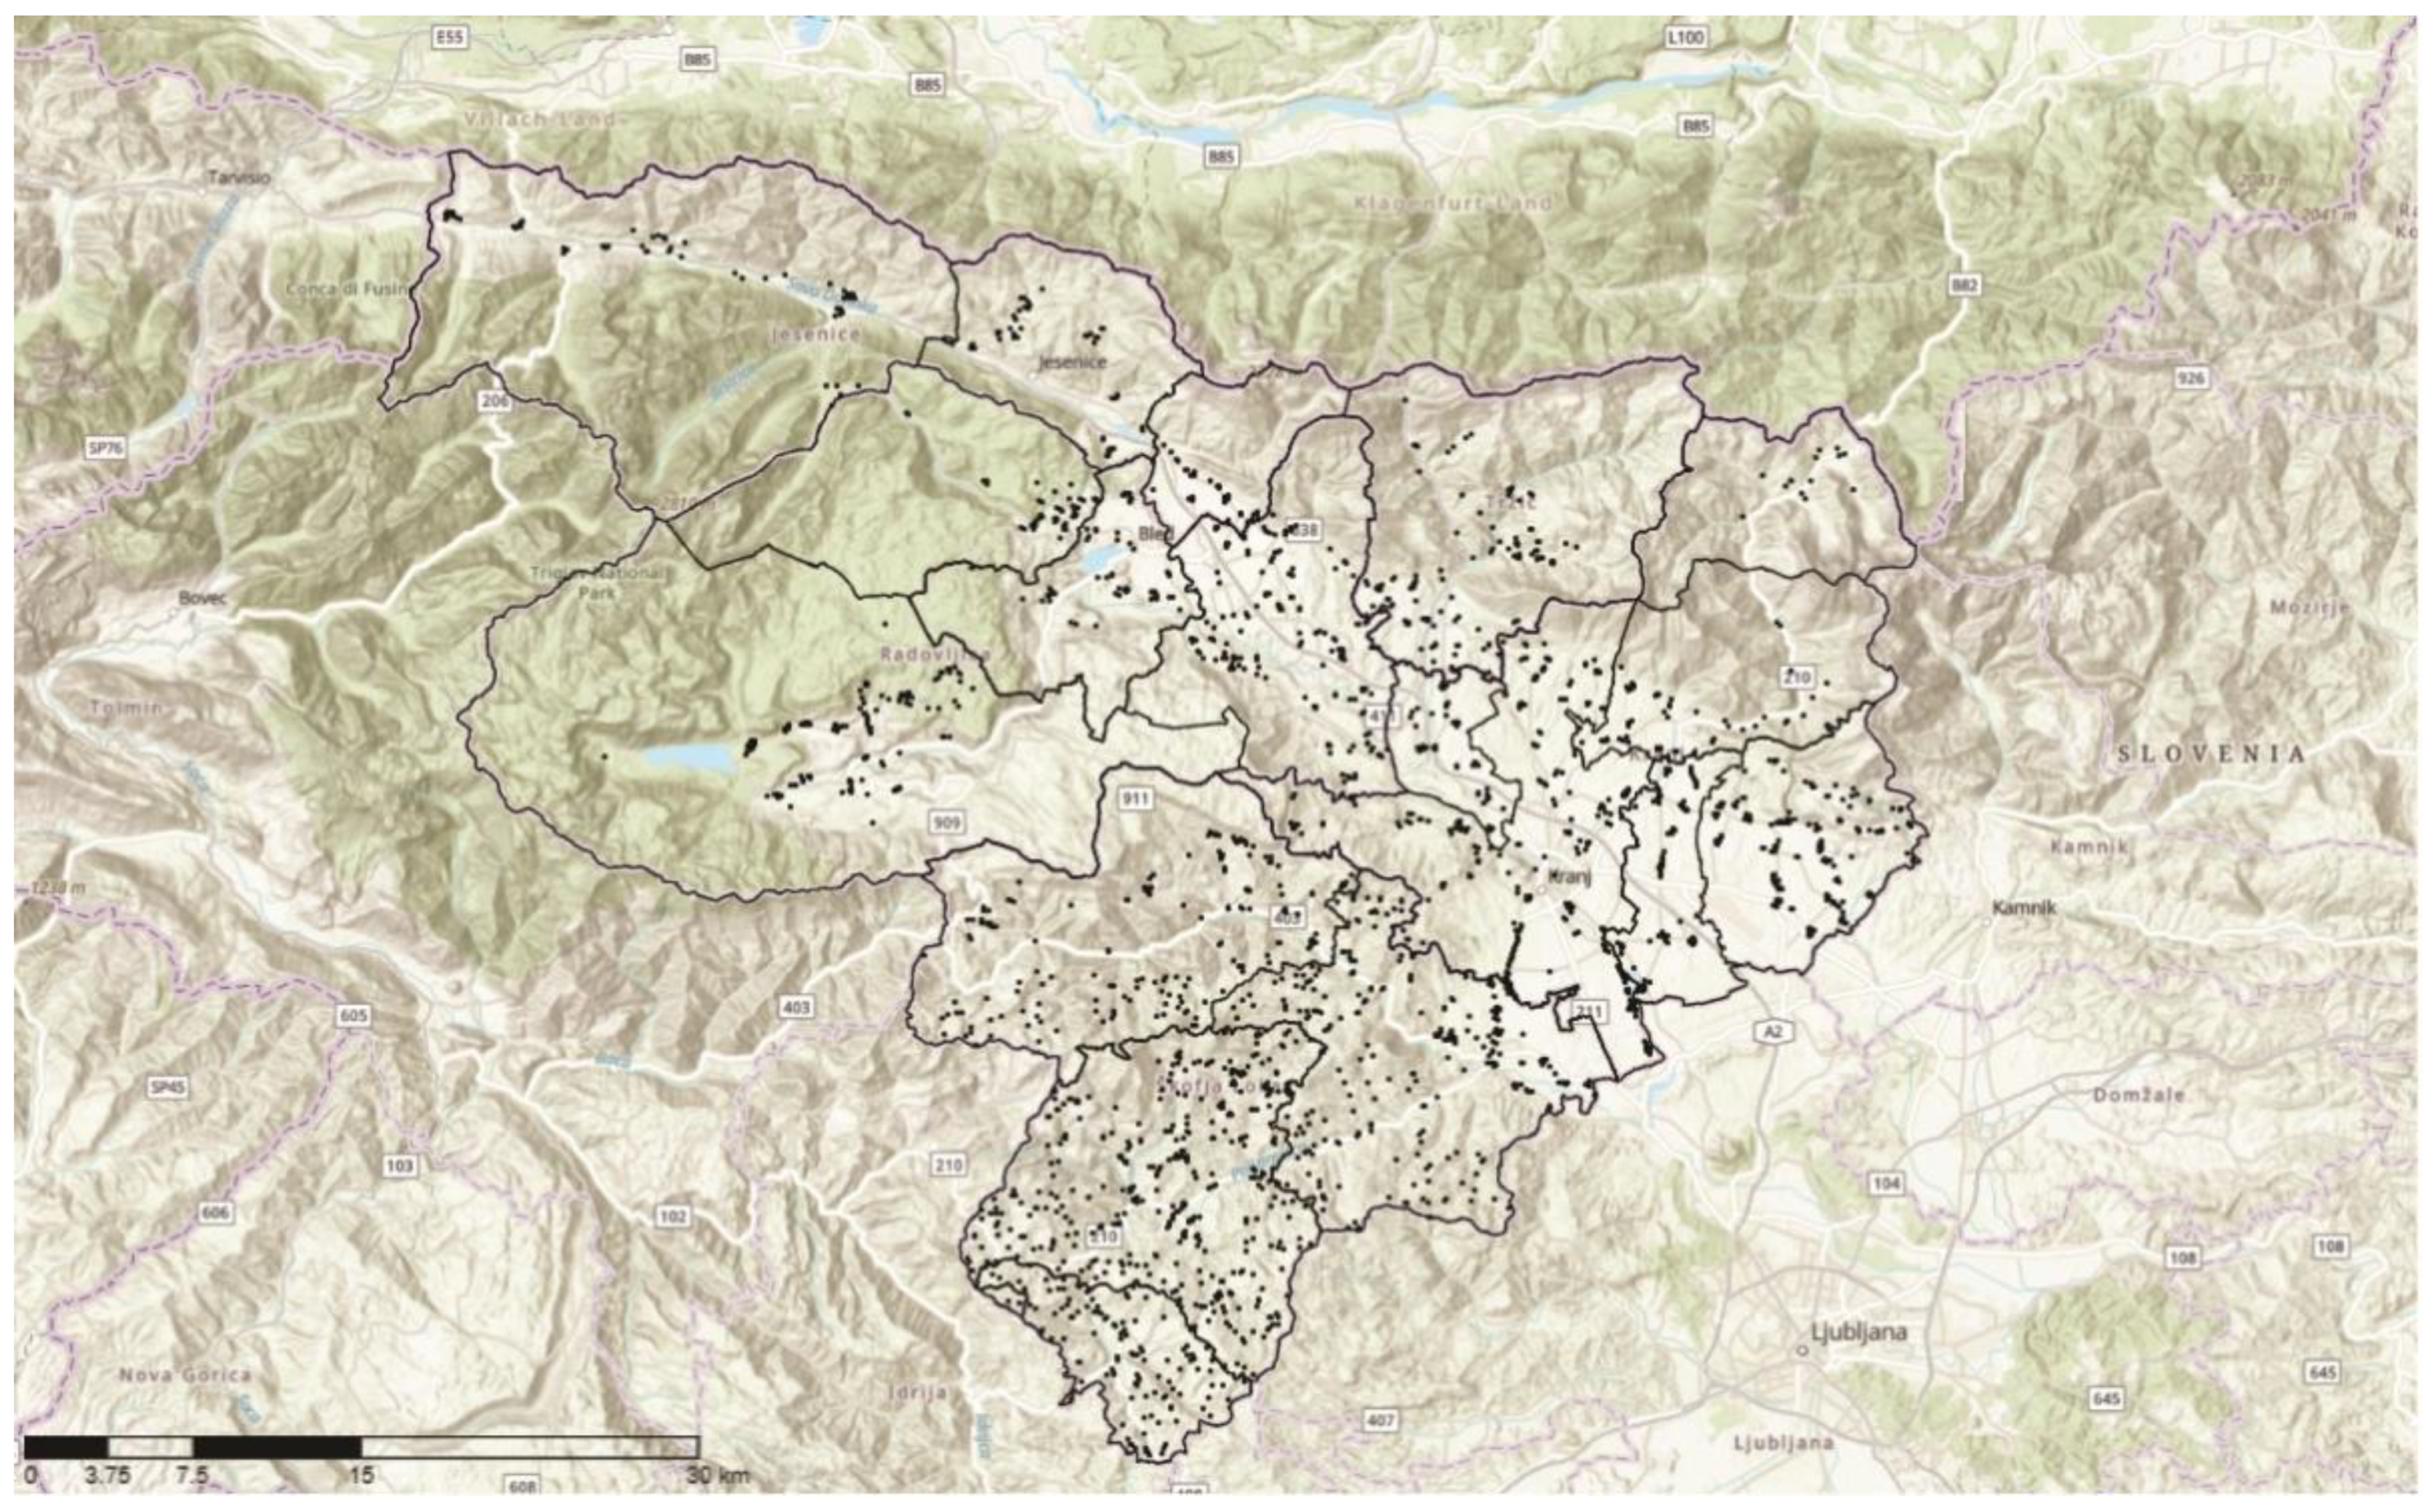
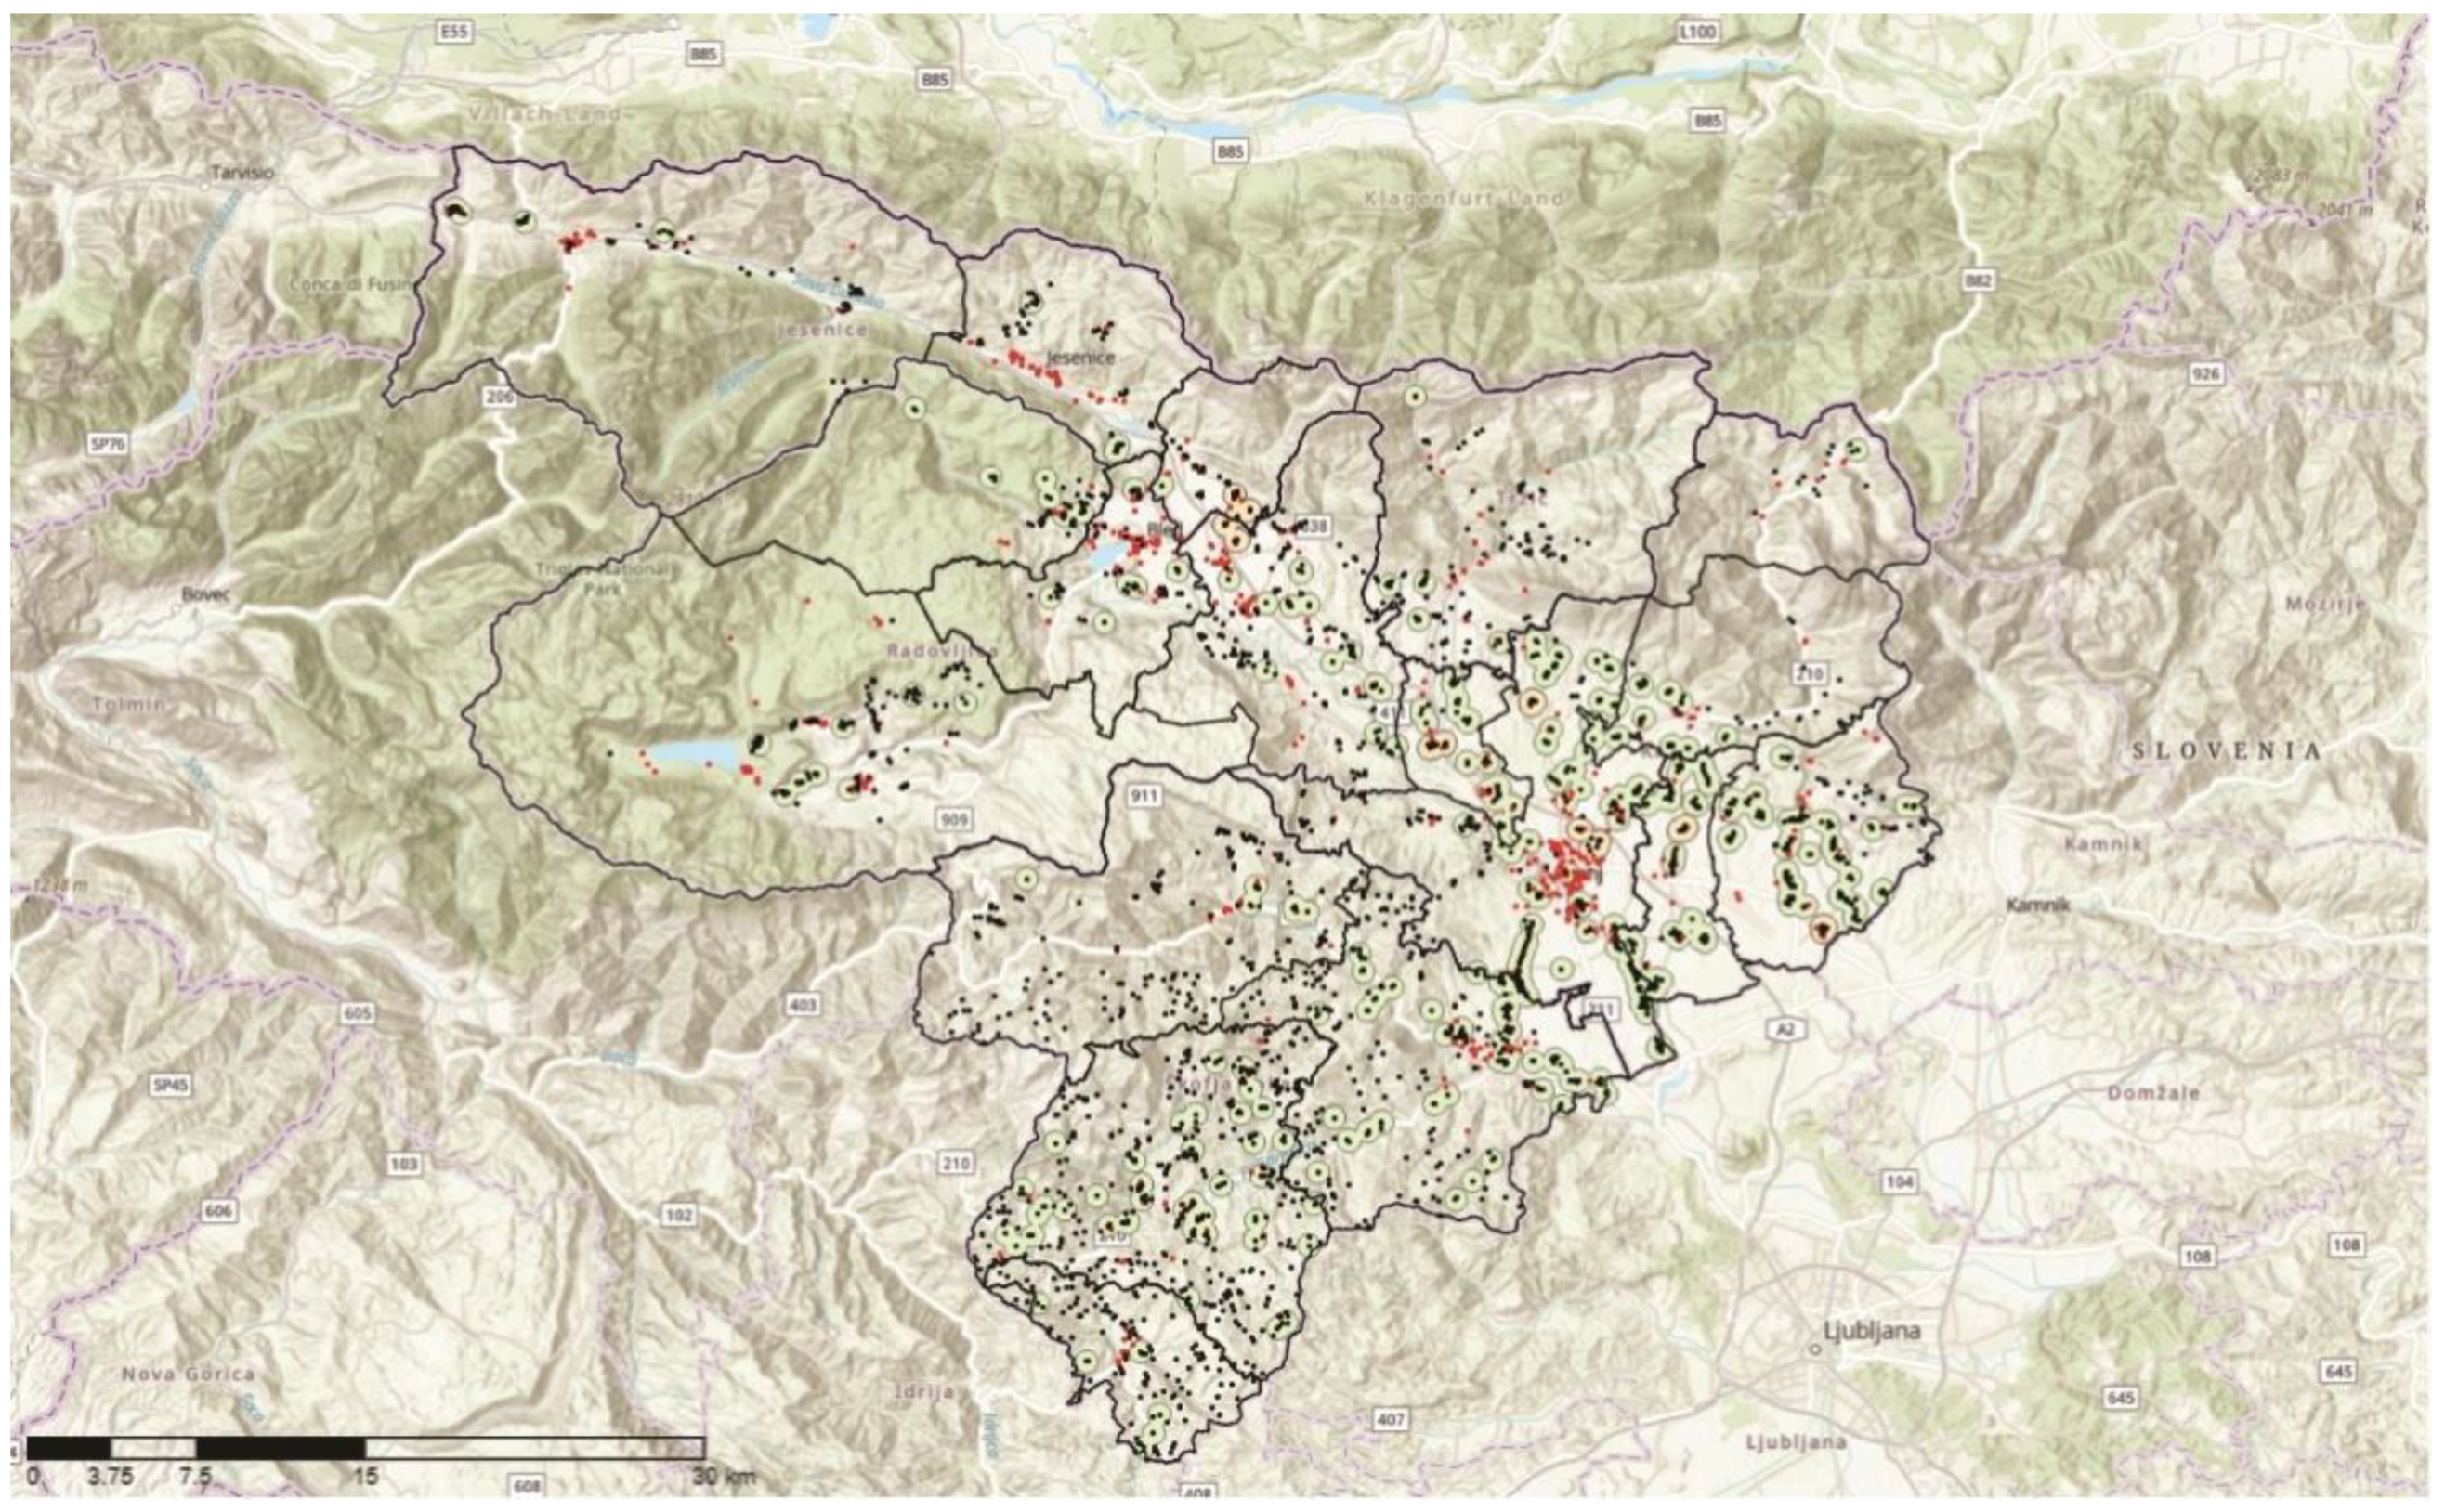
According to the data of the Agency for Agricultural Markets and Rural Areas, in 2019 there were 2482 farms in Gorenjska region with 33,821 LU (
Figure 2), of which 326 LU were pigs and 204 LU were poultry. These are mostly cattle farms for the production of milk and meat. In the calculations, we focused mainly on cattle, because the other farmed animals (pigs and poultry) are negligible, so their number does not affect the final calculations. We also did not consider sheep and goats because they spend most of the year in pastures. For the total number of LU, we took into account the coefficients for calculating LU for different animal ages and livestock methods [
20]. We planned the entire amount of manure and slurry for the biogas production because the digestate is a suitable fertilizer for agricultural land and therefore the amount of fertilizers on the farm did not decrease.
The amount of excrement that farmed animals excrete daily can be very different depending on the age of the animal and the method of livestock. As a result, different authors give different values. Zareei [
21] states for a cow 35 kg of excrement per day, while the authors [
6] state a quantity of 53 kg/day for a dairy cow and 25 kg/day for other cattle. The authors [
22] state 37 kg/day for dairy cows and 22 kg/day for beef cattle. The authors [
23] state that cattle defecate 10–15 times a day, which means up to 50 kg of secretions per day, or the amount depending on the intensity of livestock farming.
We used an average value of 37 kg/day in the calculations.
The biogas potential of cattle excrement is according to [
24] 40 L of biogas/day and between 23 and 40 L/kg of feces. The authors [
25] state 45 L of biogas per 1 kg of cow manure.
For the calculations, we used the value of 40 L of biogas per kg of cow excrement.
The biogas potential of organic food waste can vary greatly depending on its composition. In the calculations, we took the value of 70 L of biogas per 1 kg of waste, which is stated by [
26] although [
25] gives a value of 100 L per 1 kg and [
4] gives a value of 36.7 L of biogas per 1 kg of waste. On the substrate list of the Agricultural Institute of Slovenia, 130 L of biogas per 1 kg of waste and 870 L of biogas per kg of fats from kitchens are stated for household waste [
27].
The amount of electricity that can be obtained from biogas is highly dependent on the efficiency of the engine, which is around 35% and even more on the methane content in the biogas. From 1 m
3 of biogas, depending on the efficiency, it is possible to obtain from 1.6 to 1.9 kWh of electricity. The specific consumption of biogas with 60% methane content in internal combustion engines is around 0.65 m
3/kWh [
27]. The authors [
28] state similarly in their research namely 0.6 m
3 of biogas for 1 kWh of electricity. In the calculation, we used the value of 600 L of biogas for 1 kWh of electricity. The equations we used to convert biogas into electrical and thermal energy [
29]:
Eelec—amount of electricity in kWh
Qbio—amount of biogas in liters
felec—conversion factor, amount of biogas to produce 1 kWh of electricity
fproc—conversion factor, the amount of electricity returned to the process
Qbio—the total amount of biogas in liters
QLU—amount of biogas in liters per year from excrement
Qwaste—amount of biogas in liters per year from food waste
Qoil—amount of biogas in liters per year from waste food oils
Nwaste—amount of food waste in kilograms
fwaste—conversion factor, amount of liters of biogas from 1 kg of food waste
Noil—amount of food waste fat and oils in kilograms
foil—conversion factor, amount of liters of biogas from 1 kg of food waste fat and oils
In the process of converting biogas into electrical and thermal energy, we get approximately one-third of electrical energy and two-thirds of thermal energy [
27]. We used the following formula for the conversion into thermal energy:
Eheat—amount of thermal energy in kWh
feff—conversion factor, the share of thermal energy in the total amount of energy produced.
2.3. Investment and Economic Indicators
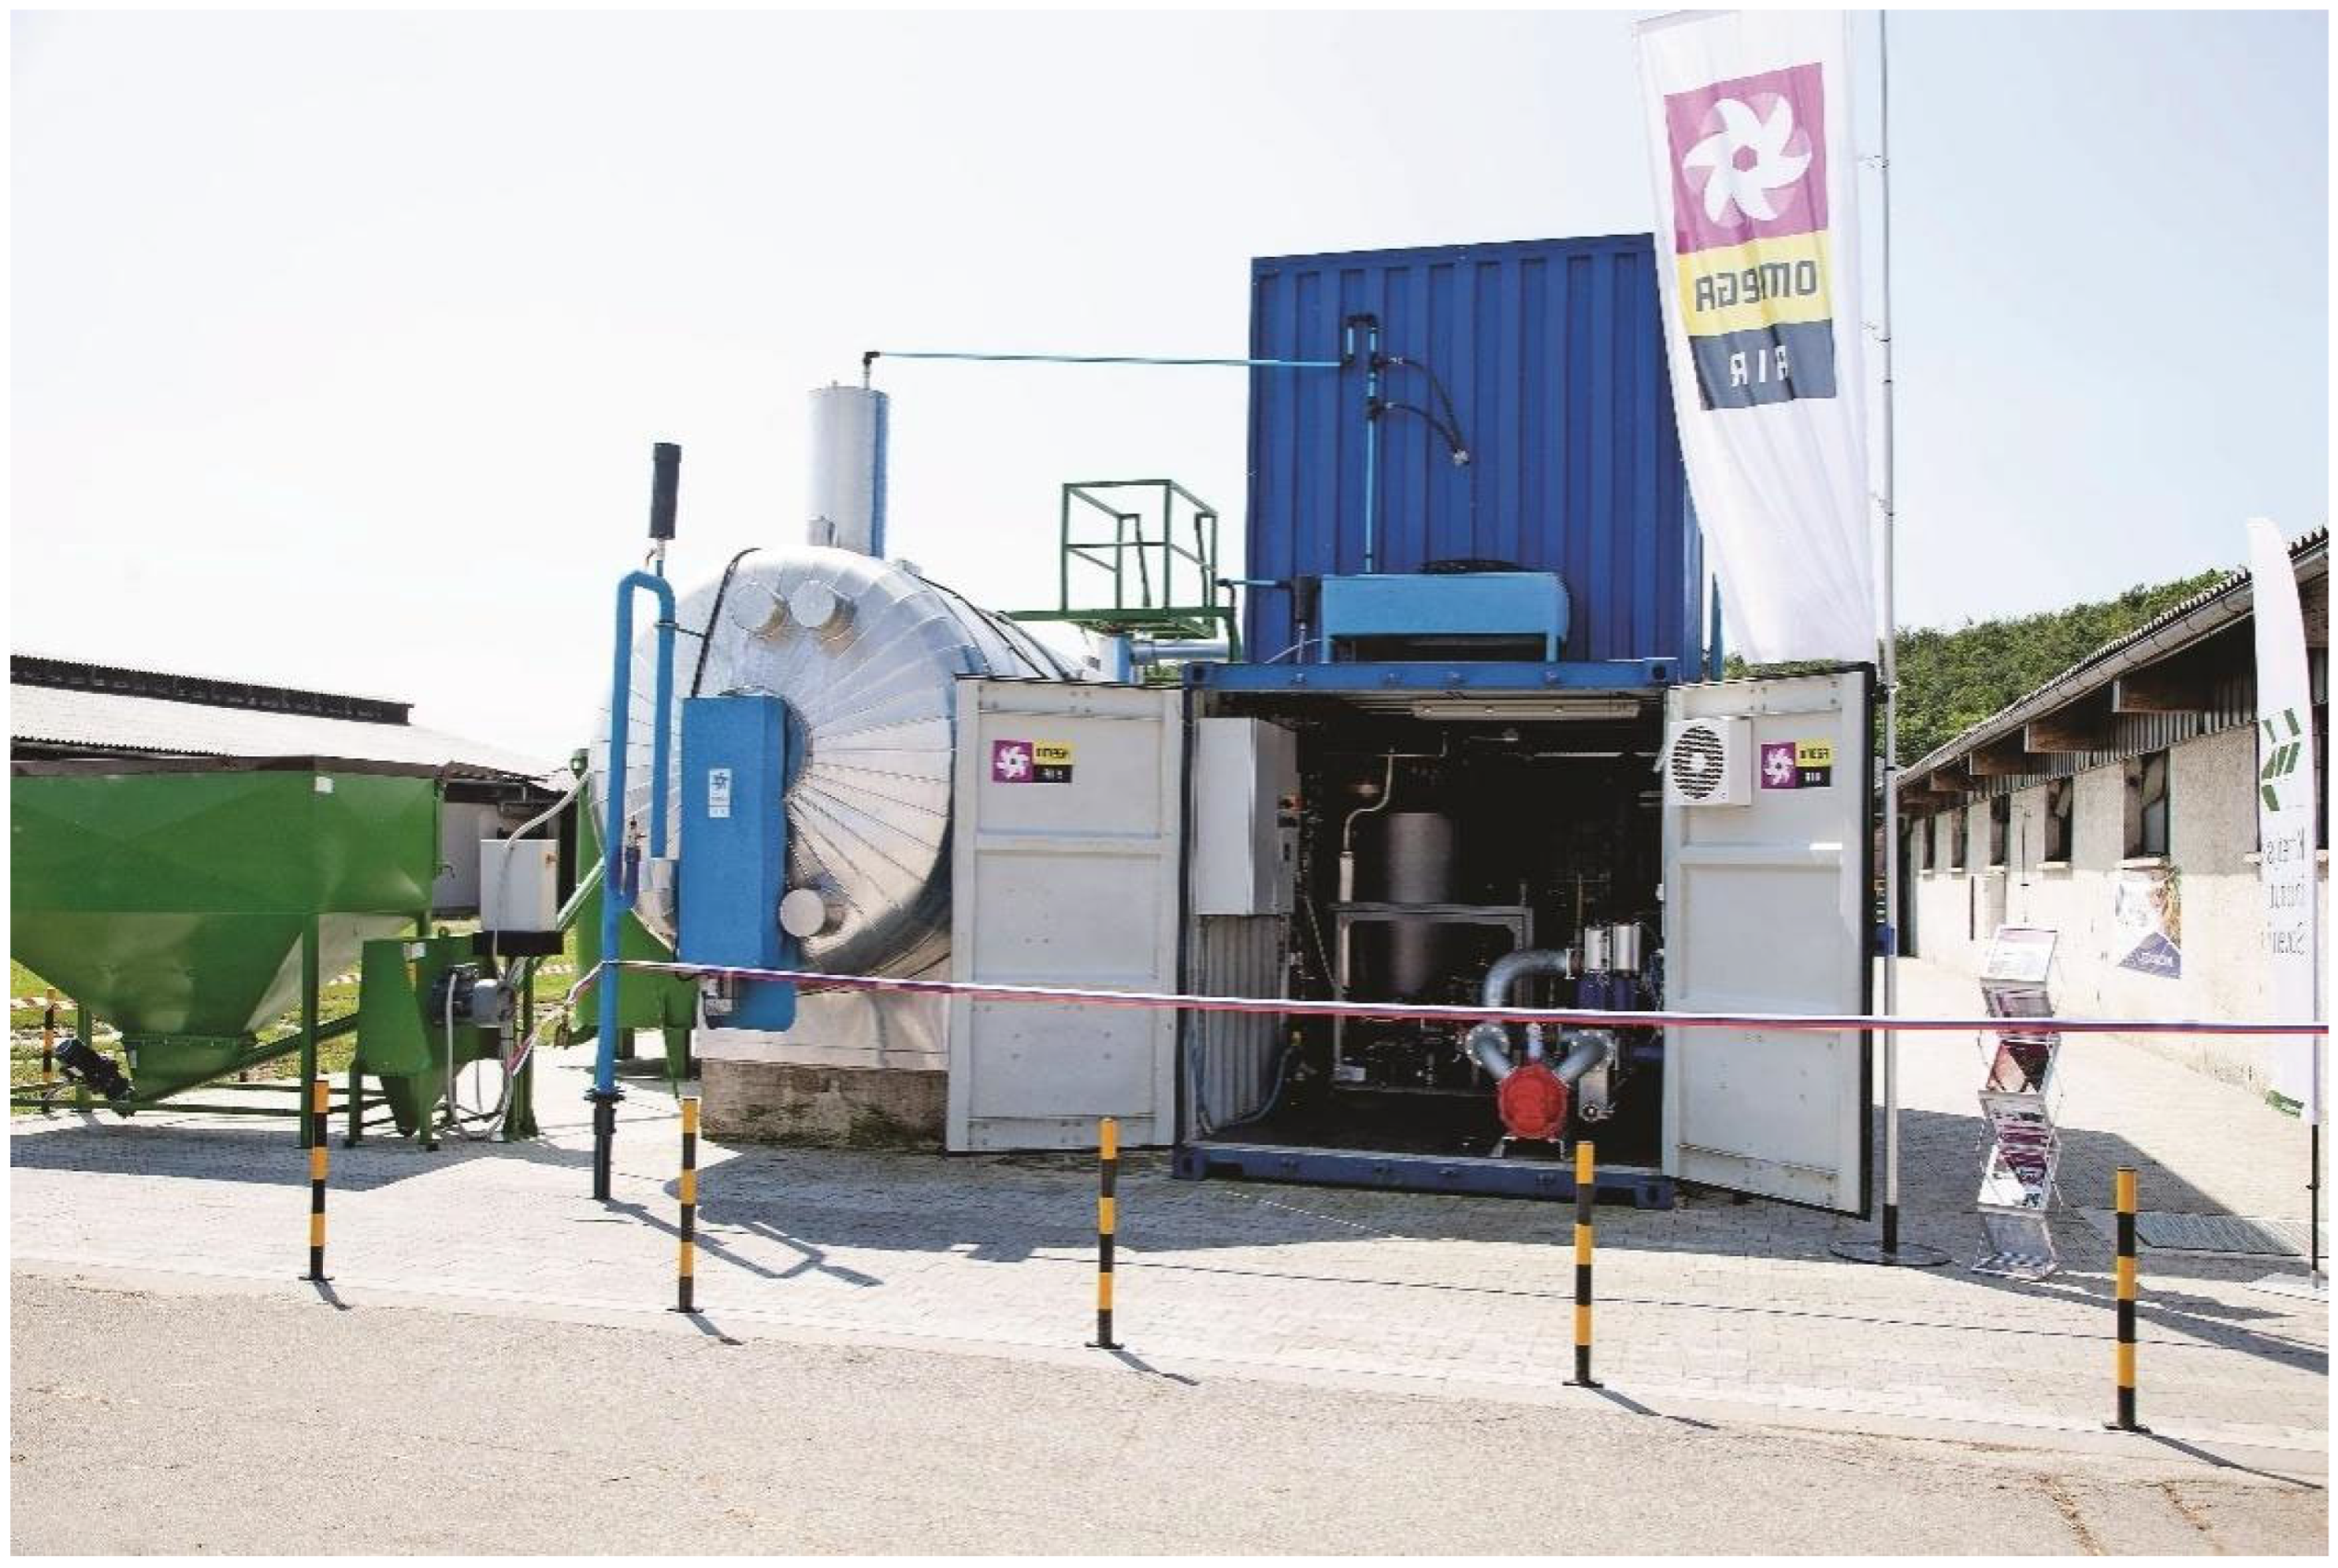
The list of components of the micro-biogas plant, and especially their capacities in relation to the amount of input substrates and prices, which were used to calculate the economic indicators, were obtained from the company Omega air [
30], which is the only provider and manufacturer of micro modular biogas plants in Slovenia. In 2016, the company installed a 7 kW teaching demonstration biogas unit at the Agricultural Institute of Slovenia (
Figure 3).
As a starting point, we took four sizes of biogas plants, namely 20 kW, 30 kW, 40 kW and 50 kW. The price of a 20 kW biogas unit including VAT is 260,000.00 €, 30 kW 325,000.00 €, 40 kW 364,000.00 € and 50 kW 404,000.00 € [
31]. The life of the project is planned for a period of 25 years, when technological obsolescence of the technology should occur. We have planned 8000 operating hours per year for the biogas plants.
The basis for the electricity purchase price is the 2019 price of 64.01 €/MWh, which is prepared annually by The Energy Agency in the Slovenian energy market [
32].
To the base price was added 82.9 € of operating support, 8.29 € of additional support for the use of 15% of the heat share in the biogas input, 8.29 € (10%) for the use of more than 30% of manure and slurry and an additional 16.58 € (20%) as operating support for all installations up to 200 kW. Thus, we got a guaranteed purchase price of 180.07 €/MWh (
Table 2) [
33].
For the price of heat, we took into account the market price determined by The Energy Agency in the Slovenian energy market, which for 2019 amounted to 105.42 €/MWh of heat [
34].
We used the following indicators for the economic assessment of the investment:
- -
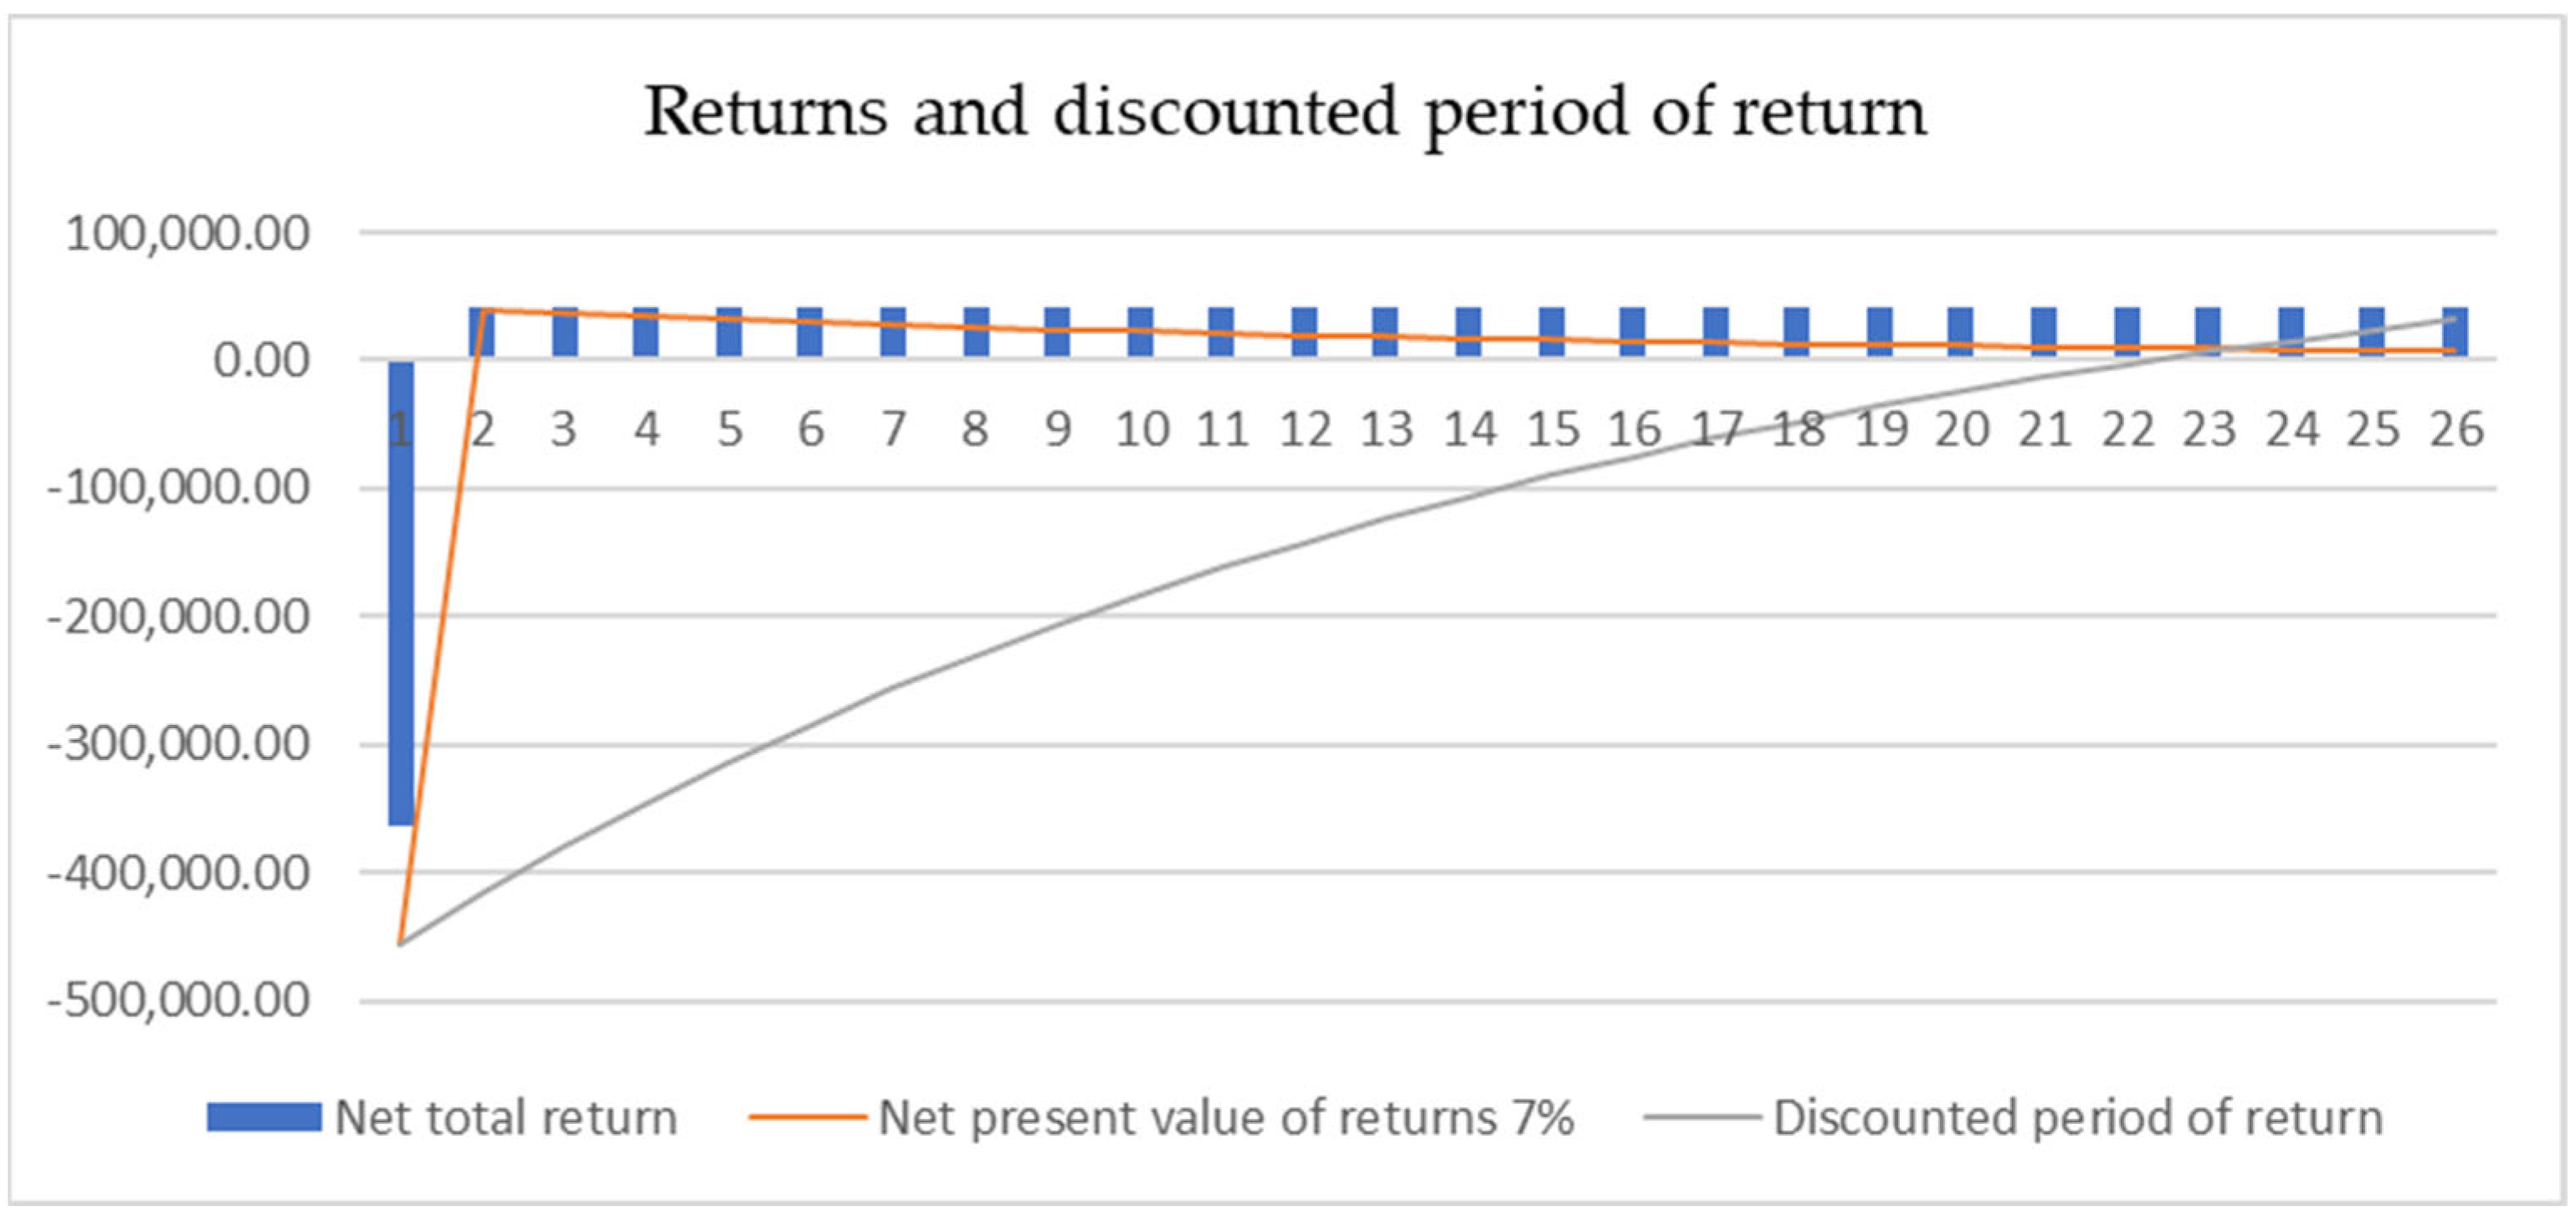
Discounted Payback Period (DPP):
When opposed to a standard payback period, a discounted payback period also considers the dynamics of the repayment and the value of money. To account for the discounting process, the cash flows are decreased by their present value component. Future discounted cash flows are net against the initial outflow when a sizable capital outflow to start the project is assumed. When inflows and outflows are equal, the discounted payback period is calculated [
35].
y = the period before the time that total cash flow becomes positive
p = discounted value of the cash flow during the time in which total cash flows are => 0
abs(n) = the absolute value of cumulative discounted cash flows during period y
- -
Discount Cash Flow (DCF):
CF1 = The cash flow for year one
CF2 = The cash flow for year two
CFn = The cash flow in individual years
r = The discount rate
- -
Net present value (NPV):
The difference between the total discounted net cash flows throughout the course of the project’s life is known as the net present value (NPV), and it serves as the fundamental criterion for financial decision-making in general [
36].
CF = Net cash inflow–outflows during a single period t
i = Discount rate or return that could be earned in alternative investments
t = Number of time periods
I = investment
- -
Internal rate of return (IRR):
The IRR, or internal rate of return, is the discount rate that lowers the project’s net cash flows to the investment’s value during the course of the project’s implementation. It is the pace at which an investment in the project is profitable [
36].
T = total number of time periods
t = time period
Ct = net cash inflow-outflows during a single period t
C0 = baseline cash inflow-outflows
r = discount rate
- -
Sensitivity Analysis
The goal of the sensitivity analysis is to identify the critical factors that influence project costs, investigate the effects of likely negative changes in these critical factors, determine whether negative changes will have an impact on project decisions and identify potential mitigation strategies [
37].
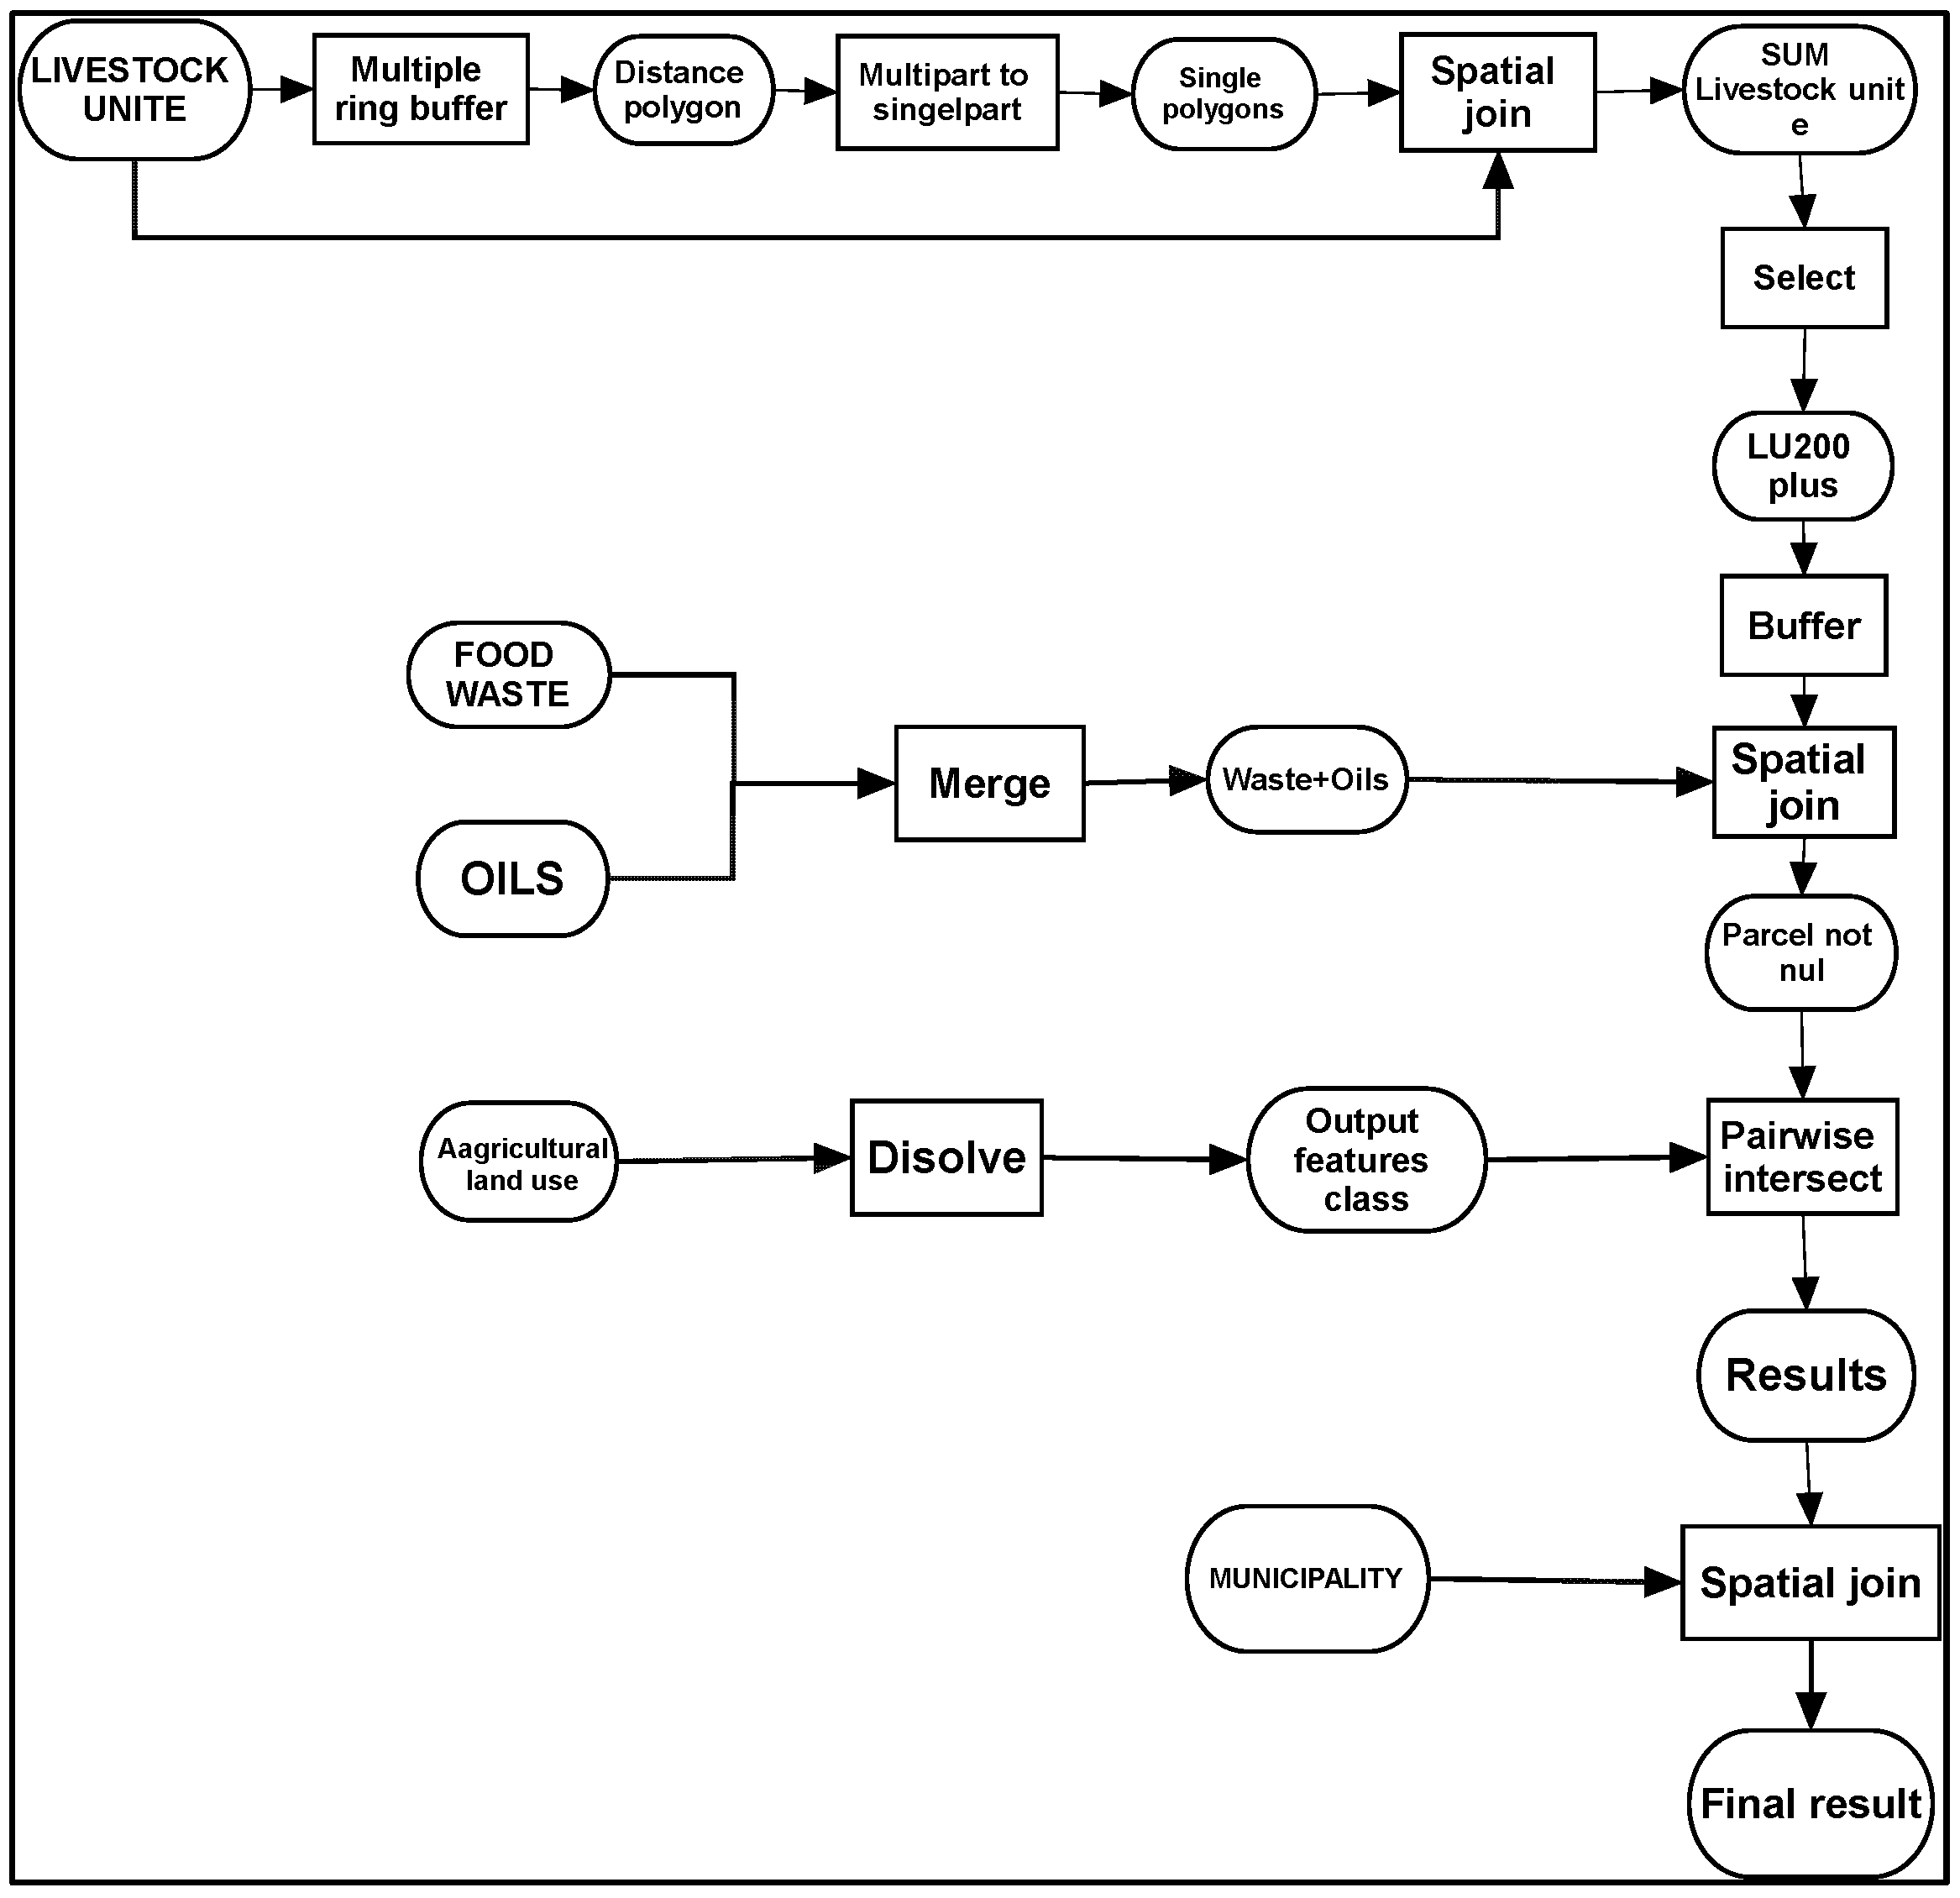
2.4. Model
The values of the input parameters affecting the size, number and location of clusters of farms and food plants with different biogas potentials can be changed arbitrarily in the model according to the amount of available substrates. The model was created using the open-source application Qgis (
Figure 4).
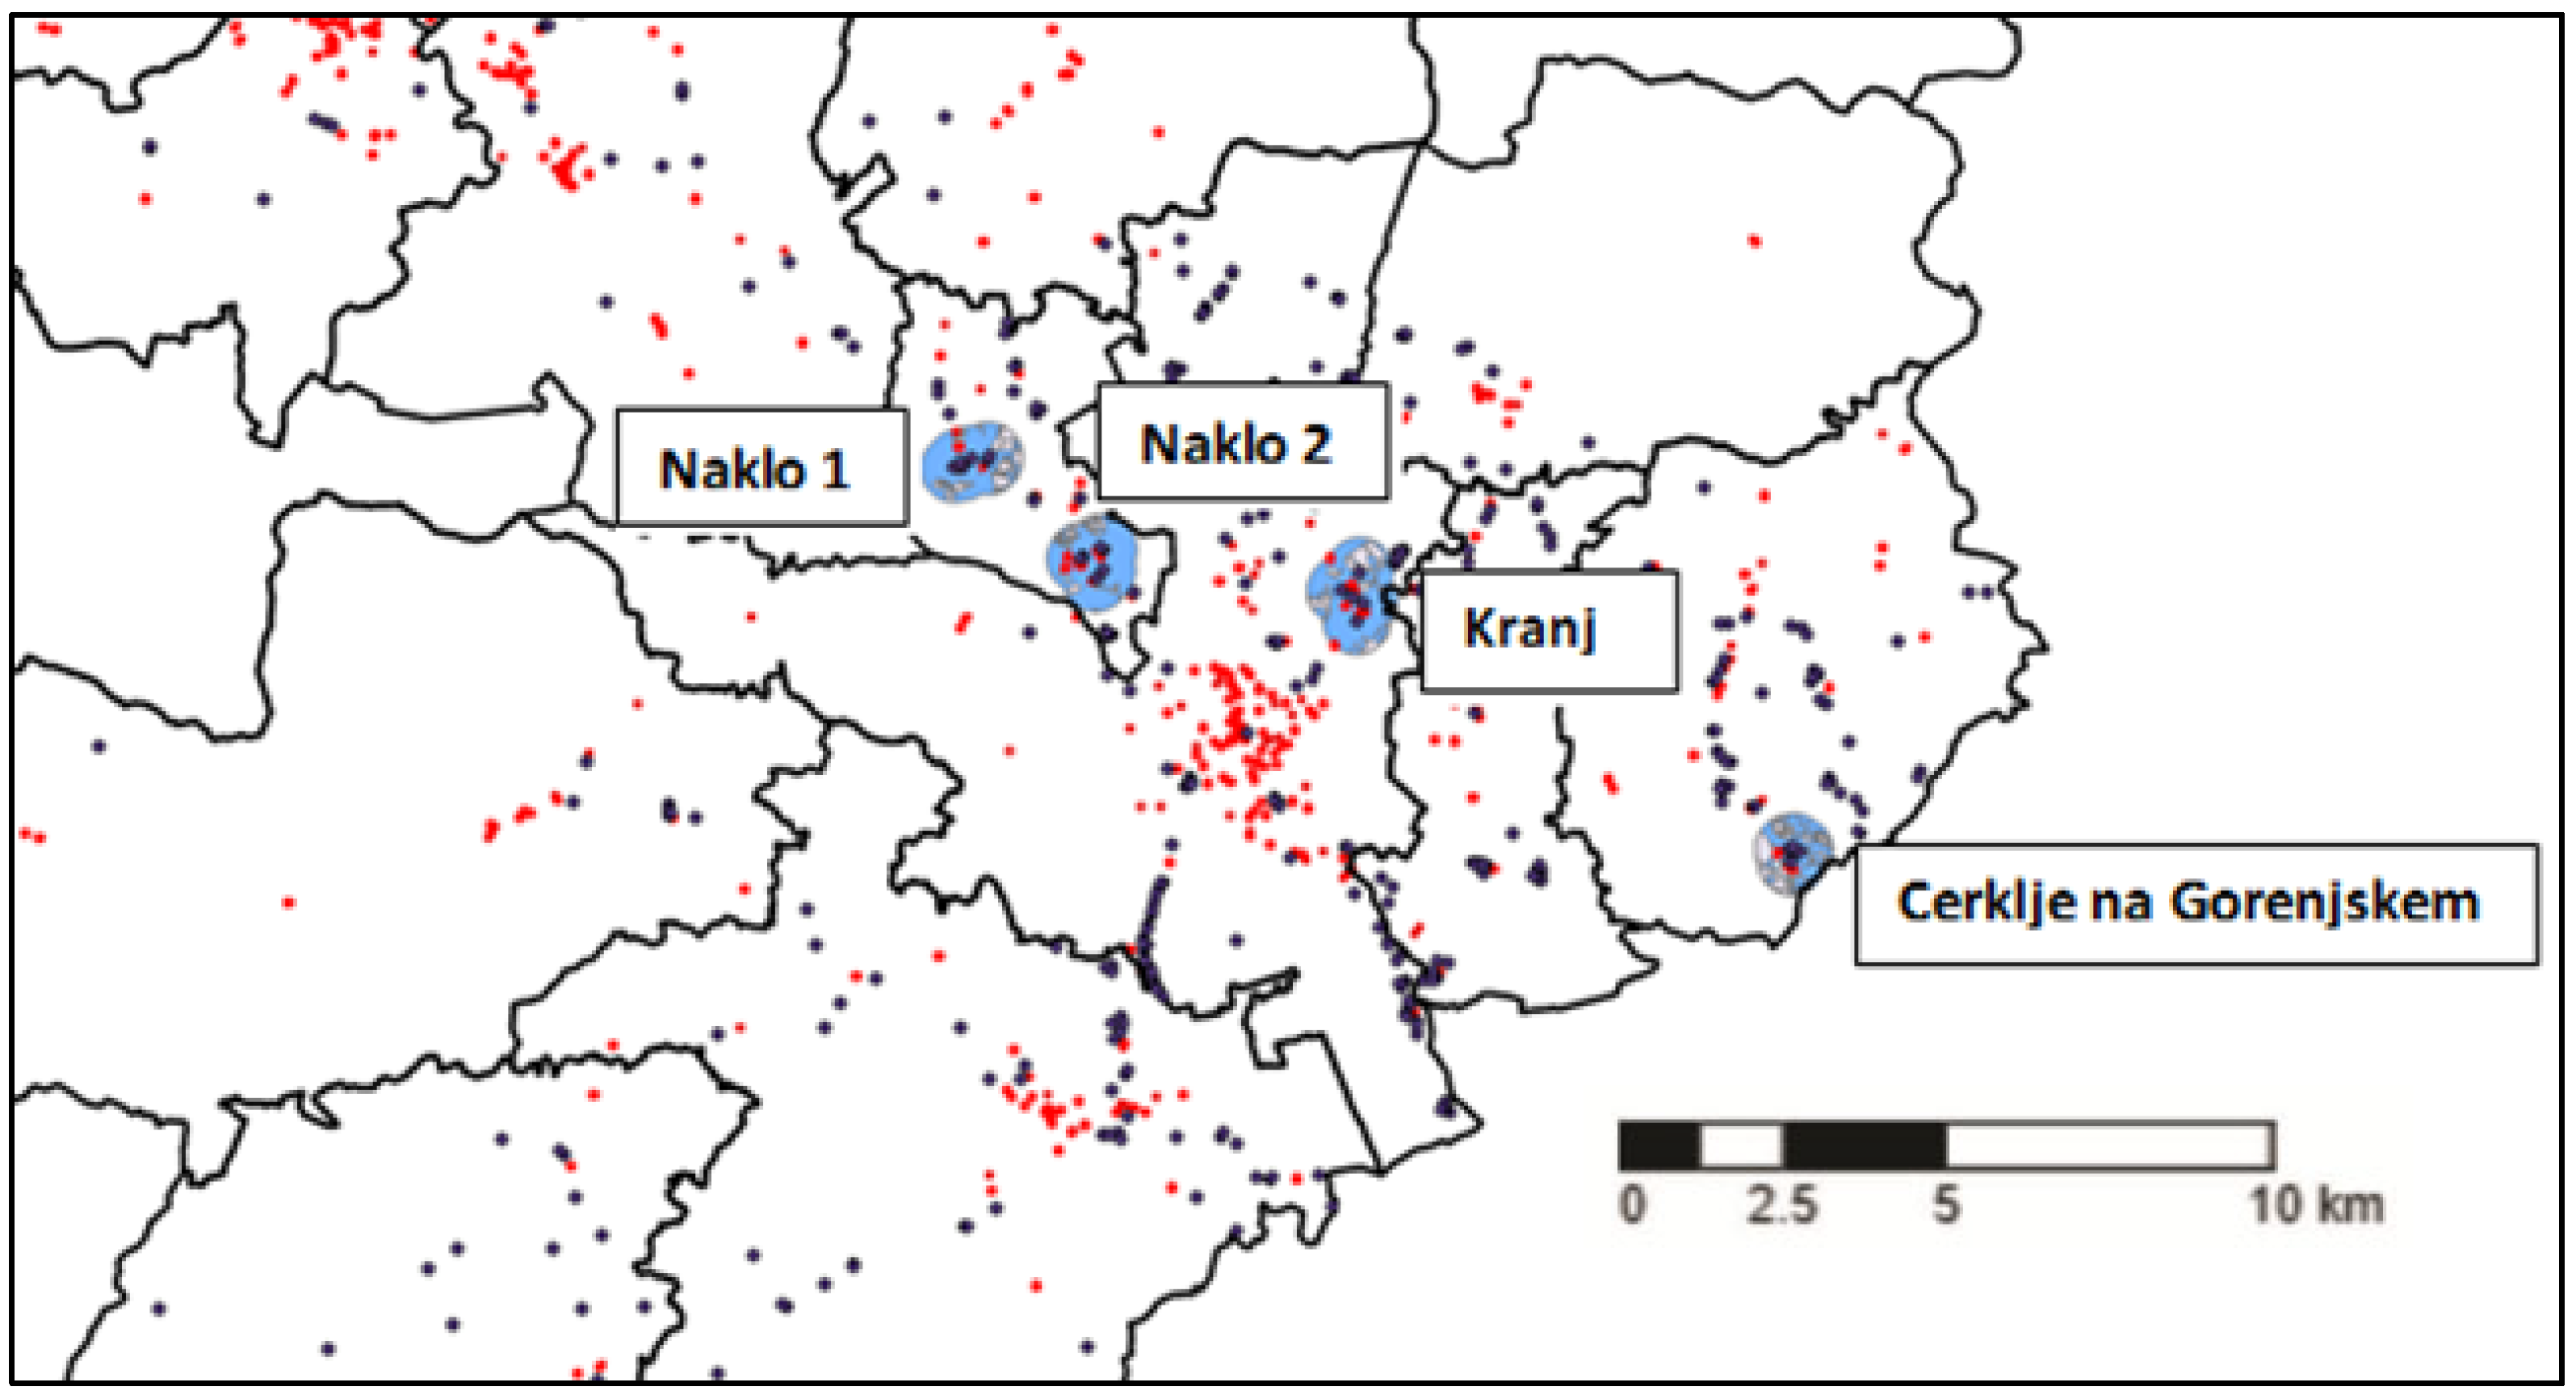
We have added the locations and quantities of collected food waste and waste food oils to the LU clusters as suitable locations for micro-biogas plants (
Figure 4).
By determining the influence zone around suitable LU aggregates, which in our case was 350 m (
Figure 5), we eliminated all aggregate locations that are free of waste or waste oils, and for the rest, we obtained the total amount of all input substrates in the aggregate (
Figure 6).
The weights we chose for the potential locations searched in our case are:
- -
There are farms in the locations that have more than 20 LU.
- -
The maximum number of farms in each location is 7.
- -
The total number of LU at the location is between 300 and 500.
- -
The distance between the farms on the location is up to 350 m.
- -
The influential zone for food plants around the location is 350 m.
4. Discussion
EU countries are committed to solving climate change problems with very bold goals by 2030 [
39]. The main purpose is, of course, the reduction in greenhouse emissions in all areas. A lot of attention is paid to promoting the use of renewable energy sources in order to achieve a significant reduction in the use of fossil fuels. In Slovenia, among other things, in 2021, we adopted the Act on the Promotion of the Use of Renewable Energy Sources (RES). It is very clearly defined that the share of RES must increase above the current 25% share, and what is very important, the production of electricity, gas and heat from renewable energy sources, as well as the construction and acquisition of buildings and land, which are necessary for this, are in a public benefit [
40].
The fact is, that the climate goals will not be achieved only with generally established technologies, but it is also necessary to solve energy challenges with less widespread technologies, which mainly solve environmental problems on a micro level and do not always bring enormous and quick profits. This category definitely includes micro-biogas plants, which are, by far, the most useful technology for the Slovenian environment for solving the problem of large dispersion of organic waste and livestock farms. Agriculture and the modern way of life are areas with a large amount of organic waste, which represent a problem that all countries face. Due to its geographical position, rugged terrain, numerous protected areas and relatively small farms, Slovenia is specific in terms of agriculture.
The Act on the promoting of the use of renewable energy sources [
40] very clearly defines biomass as biodegradable parts of products, waste and residues of biological origin from agriculture, which can be the basis for the production of biogas. In addition, several articles encourage self-sufficient energy communities and reduce administrative requirements for their establishment and operation.
The model that we have developed directly addresses this topic, as it allows a very precise selection of suitable locations for the creation of energy communities with the installation of micro-biogas plants, based on the characteristics of a certain environment, the availability of input substrates, and especially local environmental policy. At the same time, the model also offers a good solution for food waste, which, as the input substrate of a micro-biogas plant, ends its journey near its origin.
The Act on the Ordinance on the Management of Biodegradable Kitchen Waste and Green Garden Waste [
41] and the Act on the Management of Waste Edible Oils and Fats [
42] mandate the mandatory removal of organic waste from food establishments, where they regularly prepare more than 10 meals a day [
43] and the removal of waste cooking oils and fats that are produced in kitchens during their food activities. Removal is carried out by companies authorized by the Ministry of the Environment and Spatial Planning. Since it is a commercial market activity, the competition between authorized companies is relatively high, so food plants choose the company to take away their food waste based on the prices and offers. The environmental aspect is completely neglected because this waste is transported by various companies to completely different parts of Slovenia or even transported and sold abroad [
44]. The carbon and environmental footprint of such behavior are large and unacceptable in the long term. Sooner or later, the state will have to regulate such practices in such a way that organic waste is processed as close as possible to the place of its origin. The model we present effectively solves this problem, as it assumes that most of the regional organic waste ends up in regional micro-biogas plants, in which the main input substrate is still manure and slurry from livestock farms. The model can help decision-makers in the field of environmental policy and the placement of biogas plants in local communities.
At the same time, it should be noted that today GIS-mapping methods are often used to assess the energy or biogas potential of a certain area due to very powerful GIS applications. Due to the specificity of different countries and input data, researchers’ approaches are very different. Several studies examined the possibilities for biogas at various scales and geographies using GIS techniques. A GIS-based tool has been created by Monforti et al. [
45] to examine the spatial distribution of agricultural residue potential and to estimate prospective locations for bioenergy plant locations in the European Union. Two key computational procedures formed the basis of the evaluation. Using a number of auxiliary geospatial layers that describe land cover, expected biomass productivity derived from soil parameters, climatic zones and topographical conditions, the amount of crop residues resulting from statistical assessment have been spatially allocated on the EU-27 territory in the first step. The second phase involved estimating the number of model power plants using two distinct allocation algorithms, each of which implied a different level of optimization. The findings indicate that the EU-27’s anticipated crop residual resources could fuel around 850 plants. In the Canadian province of Alberta, Sultana and Kumar [
46] devised a system for determining the appropriate sites, ideal sizes and number of biomass-based facilities as well as the price of wood pellet production, taking into account the road network and various environmental restrictions. To create a land suitability model, several restrictions and environmental conditions for situating biomass-based facilities are studied. Thirteen plants could be built in the province of Alberta, according to the location–allocation model. In order to estimate the biogas potential of livestock manure at the national and regional levels in Greece, Batzias et al. [
47] created a GIS-based tool. All significant stock-raising animal species (cattle, pigs, sheep/goats, poultry, etc.) had their livestock leftovers examined for their energy and biogas potential. The computations were made using geographic and temporal information about Greece. The population of animal groupings, byproduct variables, availability factors, and energy considerations were typical examples of input data. Manure production, energy availability, and the amount of biogas were all outputs. Additionally, based on previous and present trends, the application can predict all sorts of outputs throughout time.
Ma et al. GIS model [
48] for assessing the feasibility of land for future energy systems that include anaerobic digesters combined with an energy generator was proposed. In order to find the best locations for deploying these devices, a number of environmental, social and economic limitations are included in the model. Then, as a case study for the model’s demonstration, Tompkins County, New York is used. To pinpoint the regions best suited for distributed bioenergy systems employing dairy manure, a siting suitability map was created. The findings demonstrated that this GIS-based model was able to provide a broad-scale and multidimensional view of the possible growth of bioenergy systems in the area of research while also taking into account social and environmental limits in addition to economic concerns. The model can be adjusted to assess different biomass resources. Thompson et al. [
49] identified prospective sites for anaerobic digestion plants using dairy manure in a county in Vermont, the US, and developed ideal sites for a number of biogas plants. In the Kujawsko-Pomorskie Voivodeship of Poland, Sliz-Szkliniarz and Vogt [
50] utilized a GIS model to identify the best locations for anaerobic digestion facilities using a combination of energy crops and animal manure from cattle and pigs. The authors also conducted a techno-economic analysis of the possibilities for injecting biogas into the current gas grid network as well as the production of power and biomethane.
Lovrak et al. [
51] used GIS mapping to assess Croatia’s biogas potential by taking into account the seasonal amount of agricultural production residues and municipal waste. The assessment of the biogas potential of plant residues, which have a distinctly seasonal character due to crop rotation, would also come into consideration in our model in further research. In the model, we overlaid the map of the model locations with data on the use of agricultural land and obtained a map of agricultural plants and their areas in the model locations for that season. The originality of our model is in the limitations resulting from environmental (protected areas), geographical (hilliness, fragmentation), social (small communities, traditional livestock production on corn silage, tourism) and spatial (population and fragmentation of local communities) characteristics of Slovenia. The model is limited by:
- -
the size of the biogas plant, which does not exceed 50 kW, which is related to the fragmentation and size of agricultural holdings and agricultural areas;
- -
a small number of farms in the area of the model locations, which is associated with a lower burden on the environment, negligible transport costs and a minimal carbon footprint;
- -
the number of food plants in the area of the model locations, which is related to population, development and tourism in a certain area;
- -
input substrates that meet the environmental requirements for spreading digestate on agricultural land [
52].
As demonstrated in the presented case studies, small biogas plants can be economically feasible under assumed technological and economic parameters. Furthermore, with the use of the model, they can be setup in areas with sufficient quantities of raw material and this way avoid problems that some of the larger biogas plants experienced due to insufficient quantities of input materials [
53].
Further research should also include the impact of climate change on agriculture. In 2014, the Agricultural Institute of Slovenia produced a regionalization map of Slovenia [
54] with detailed defined areas intended for the cultivation of corn, which are and will be subject to permanent and increasingly destructive droughts. Since corn in Slovenia is primarily intended for feeding livestock, regionalization resulted in precisely defined areas where livestock farming will be endangered in the future. This will be very important information for our model, as these areas will be less suitable for biogas plants in the future due to the reduction in the amount of input substrates.
On the basis of European environmental directives, the government adopts laws but operationally they are realized and implemented by municipal administrations with their decisions in the local environment. The model will be of great help to decision-makers. It will support the local municipal administrations in the adoption of local environmental policy, which must, among other things, encourage energy self-sufficiency and the establishment of energy communities. The selection of suitable locations for micro-biogas plants in rural communities is a sensitive topic that also affects the field of spatial planning, and we believe that the model will be able to facilitate many decisions. Furthermore, micro-biogas plants can play an important role in the coming energy crisis and they can also contribute to the area of waste management and reduce livestock methane emission. They can also play heating as the thermal energy is their product besides methane and can be used for heating farm facilities or even smaller local communities [
55,
56]. Based on the findings that micro-biogas plants can be economically feasible and due to the problems with larger plants in the area of source material, we propose the following policy recommendations: (1) planning and implementation of micro-biogas plants should be done on the basis of detailed analysis of source material availability and (2) they should be supported in the context of public policy since they contribute to solving of environmental (manure and waste) as well as energy problems.
5. Conclusions
The paper presents a model for finding and evaluating suitable locations for setting up a micro-biogas plant with a power of up to 50 kW. The model is based on the GIS mapping of various quantitative data of livestock farms and food plants in the Gorenjska region. In terms of input substrates, we focused on waste from agriculture and food plants, which, in the form of digestate, are suitable for spreading on agricultural land. We limited the search for locations by the number of farms and food plants in a 350 m zone around the location. With this, we indirectly covered flat areas that are more suitable for agricultural activity and areas with greater population and development, which are reflected in a higher density of food plants. There are quite a few tourist centres in Gorenjska region (Bled, Kranjska Gora), which are frequently visited and have many restaurants and accommodation facilities, in which quite a lot of food waste is produced. Nevertheless, they were not reflected in the model because of the fragmentation and the size of farms in these areas. However, by adjusting the restriction criteria, we could reach locations in these areas as well but with different characteristics that affect the economics of the location. We checked the operation of the model and its selection of locations with different scenarios and economic calculations. We take into account some unexpected events such as an increase in the price of the investment or a decrease in the price of energy. The calculations showed that locations with the right combination of the density of livestock farms and food plants are suitable for investing in micro-biogas plants. For less suitable locations with too low biogas potential, we played out different scenarios of adding corn silage in different proportions, which showed the necessary amounts of substrates and the breaking points at which investments in the installation would pay off. The usefulness of the model also lies in the fact that in the future we can add new input data in the form of substrates, such as plant residues from agricultural production and various energy plants or spatial and infrastructural data, which play an important role in spatial planning. By changing the input data, we also indirectly change the economic indicators for an individual location, which enables the optimization of the selection.


