
Flow Boiling Heat Transfer of R134a in a Horizontal Smooth Tube: Experimental Results, Flow Patterns, and Assessment of Correlations
Abstract
:1. Introduction
2. Experimental Setup and Procedure
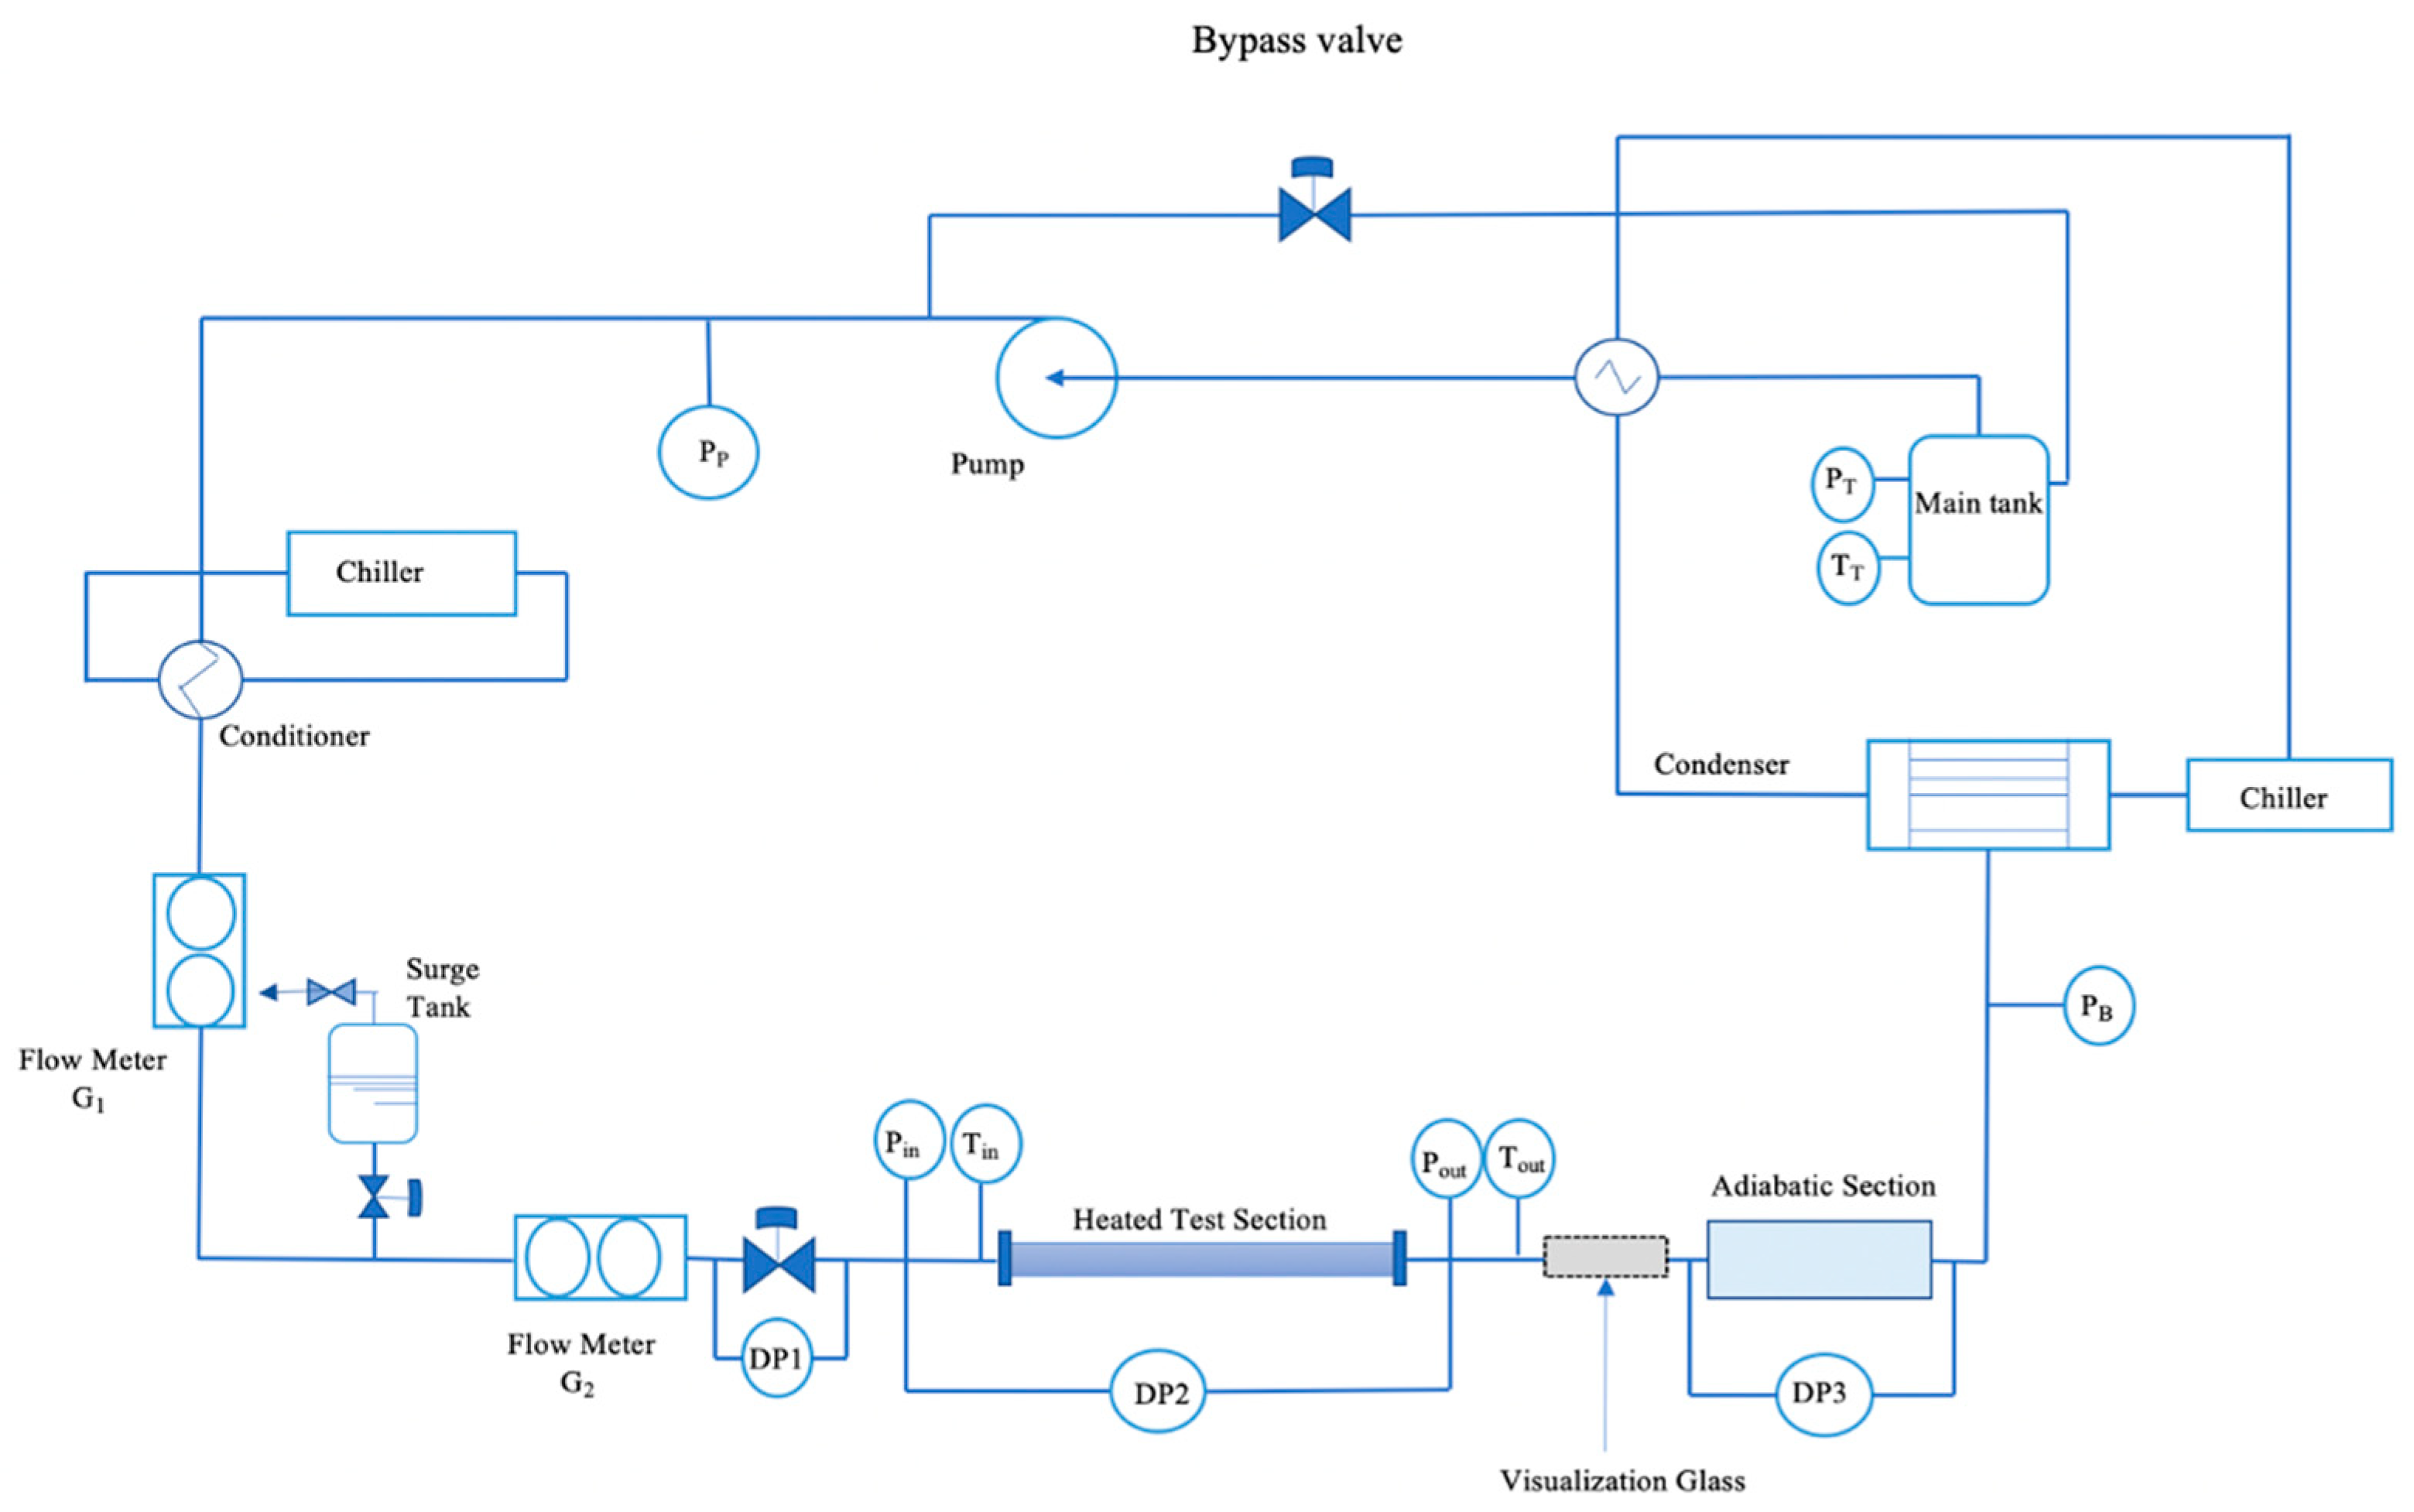
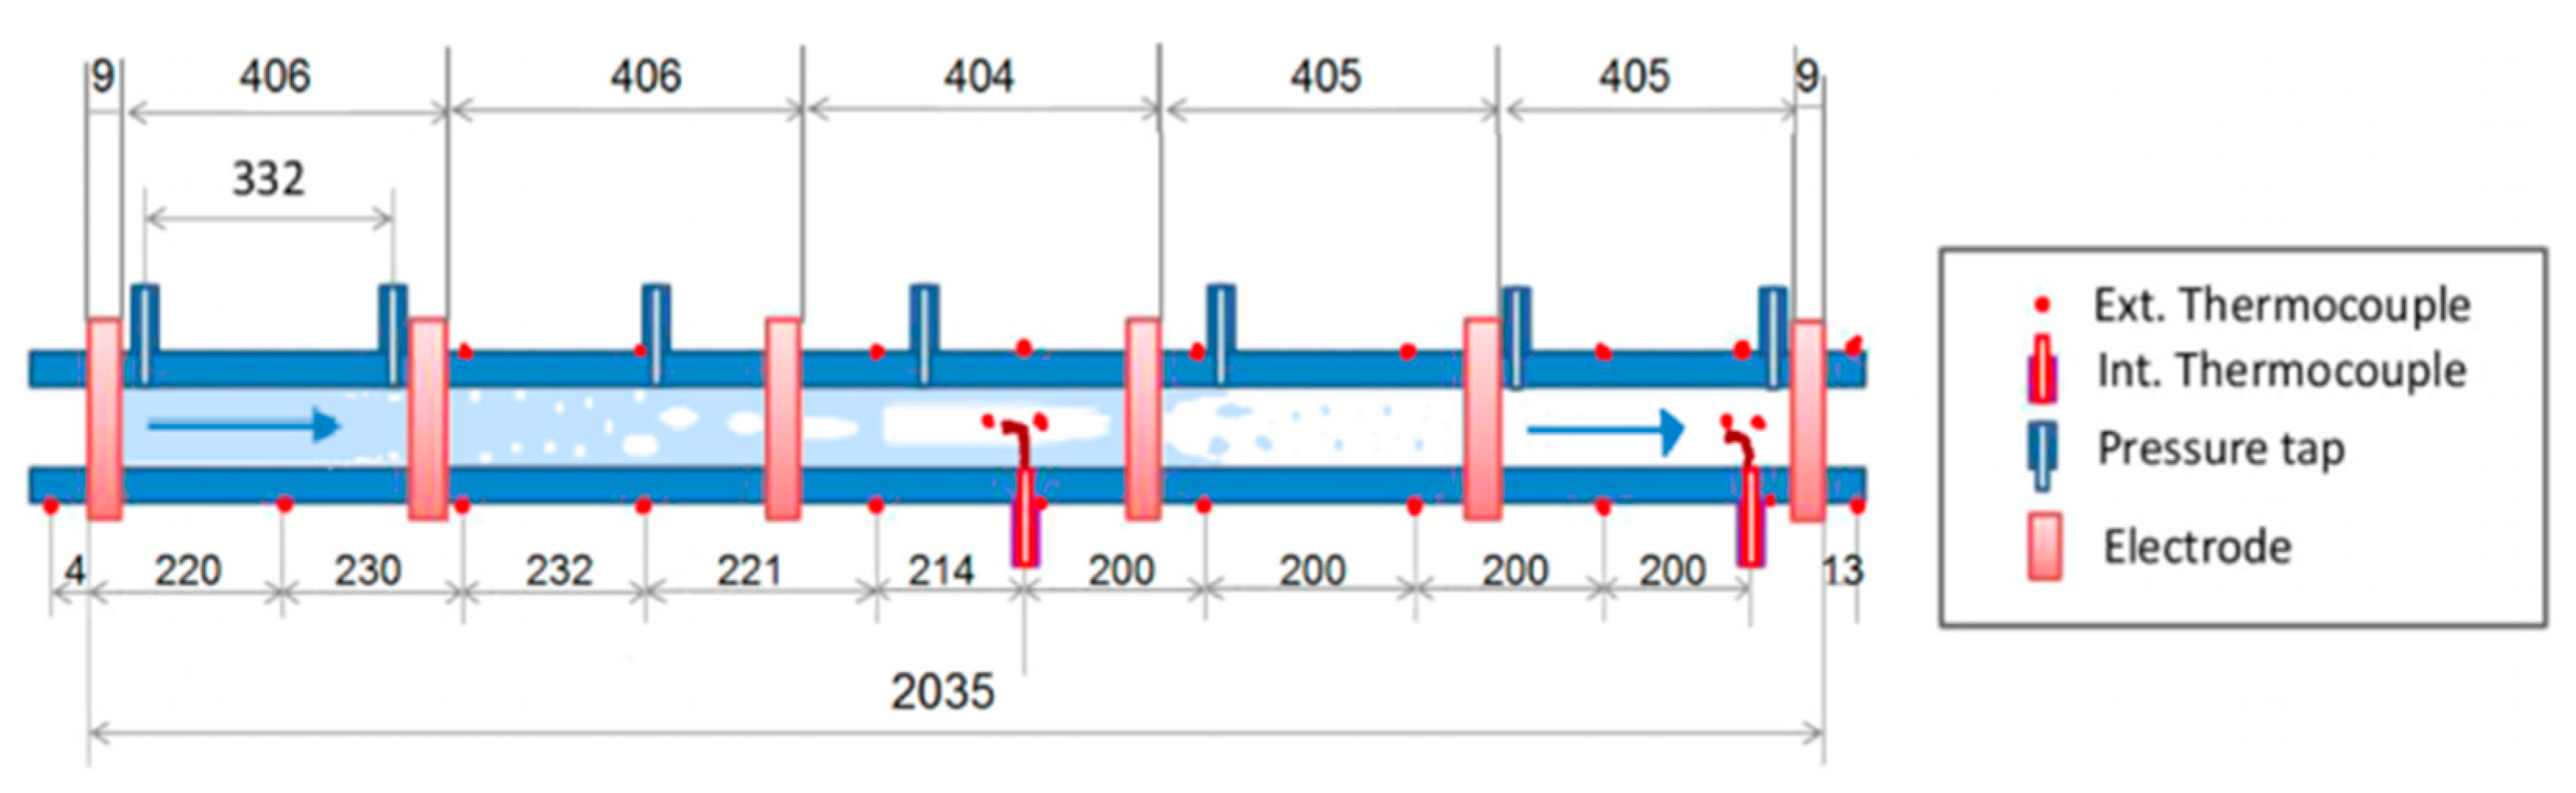
2.1. Experimental Setup
- The facility was first heated up with the highest proposed power in the heated test section.
- The pressure at the outlet of the heated test section was maintained constant.
- The experimental data for each point were collected only after steady-state condition was reached. Steady-state condition for the experiment was said to be reached when the time variation in the mass flux, pressure, and inlet temperature was less than 6% for about 200 s.
- After reaching the highest proposed power, the supplied heat was decreased systematically. By decreasing the supplied heat, each measurement point was obtained.
- Each experimental data was recorded for 100 s and this corresponded to 1000 points. The process of first heating up to the planned power before reducing the power for each point helps to avoid an abrupt rise in the wall temperature when onset of nucleate boiling occurs or changes occur in the flow pattern. This also helps in the repeatability of the experiment.
2.2. Accuracy of Measurement
2.3. Data Reduction
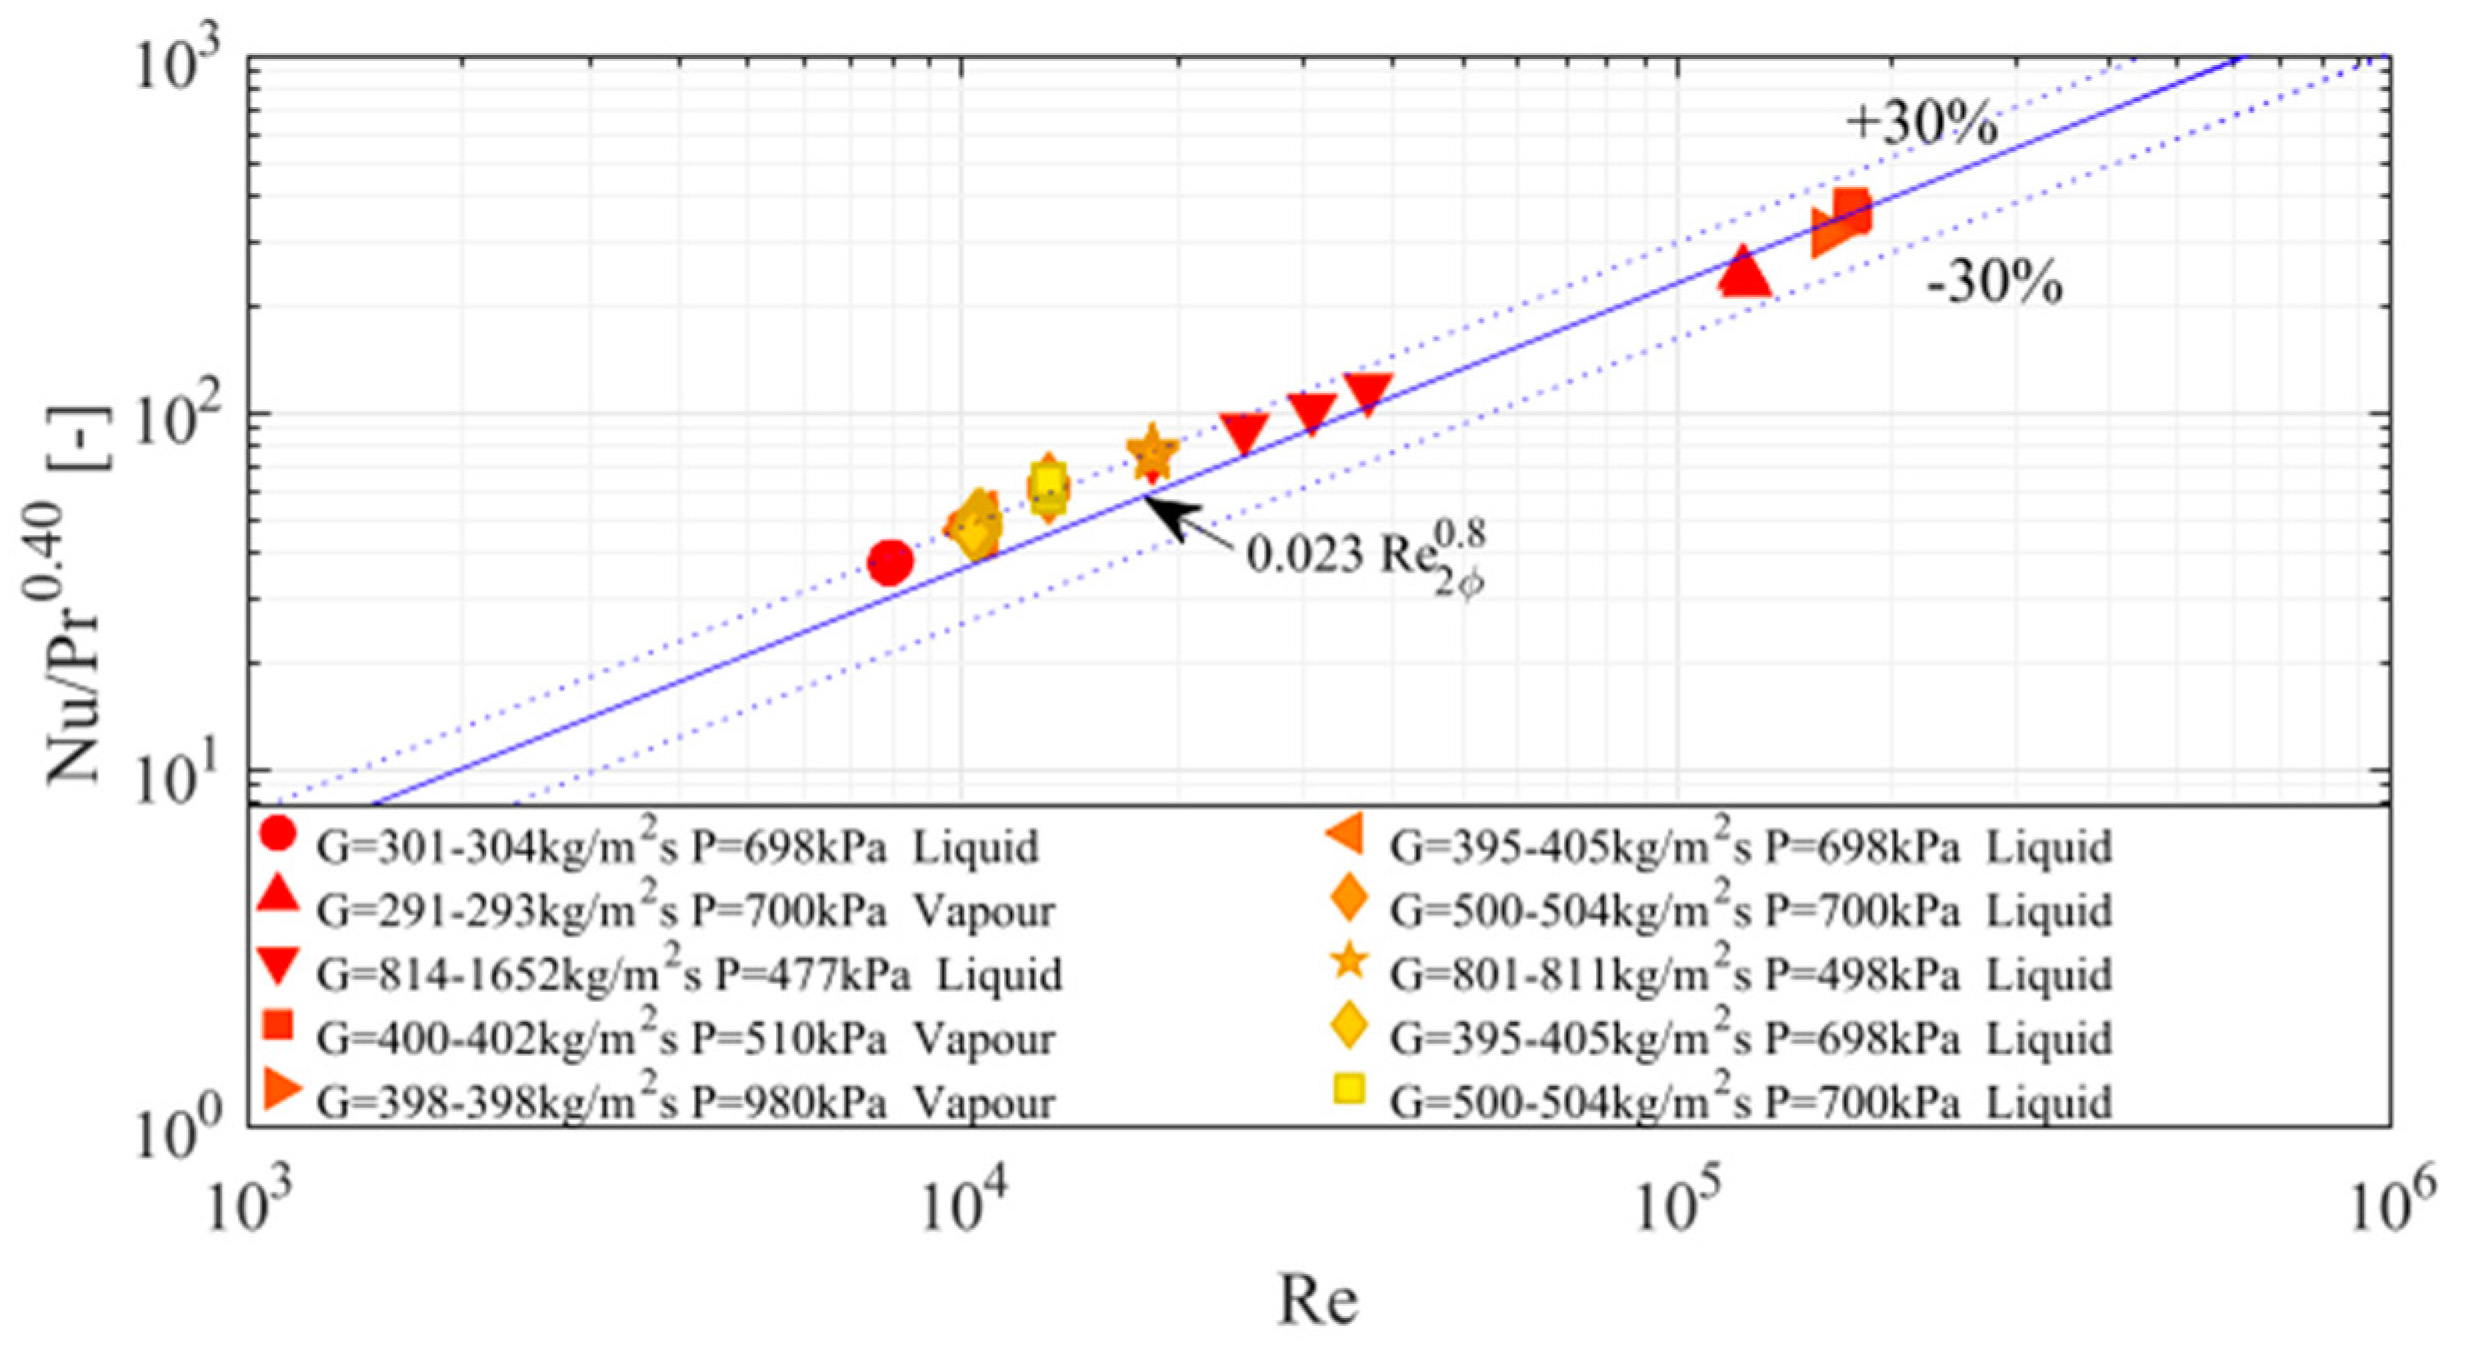
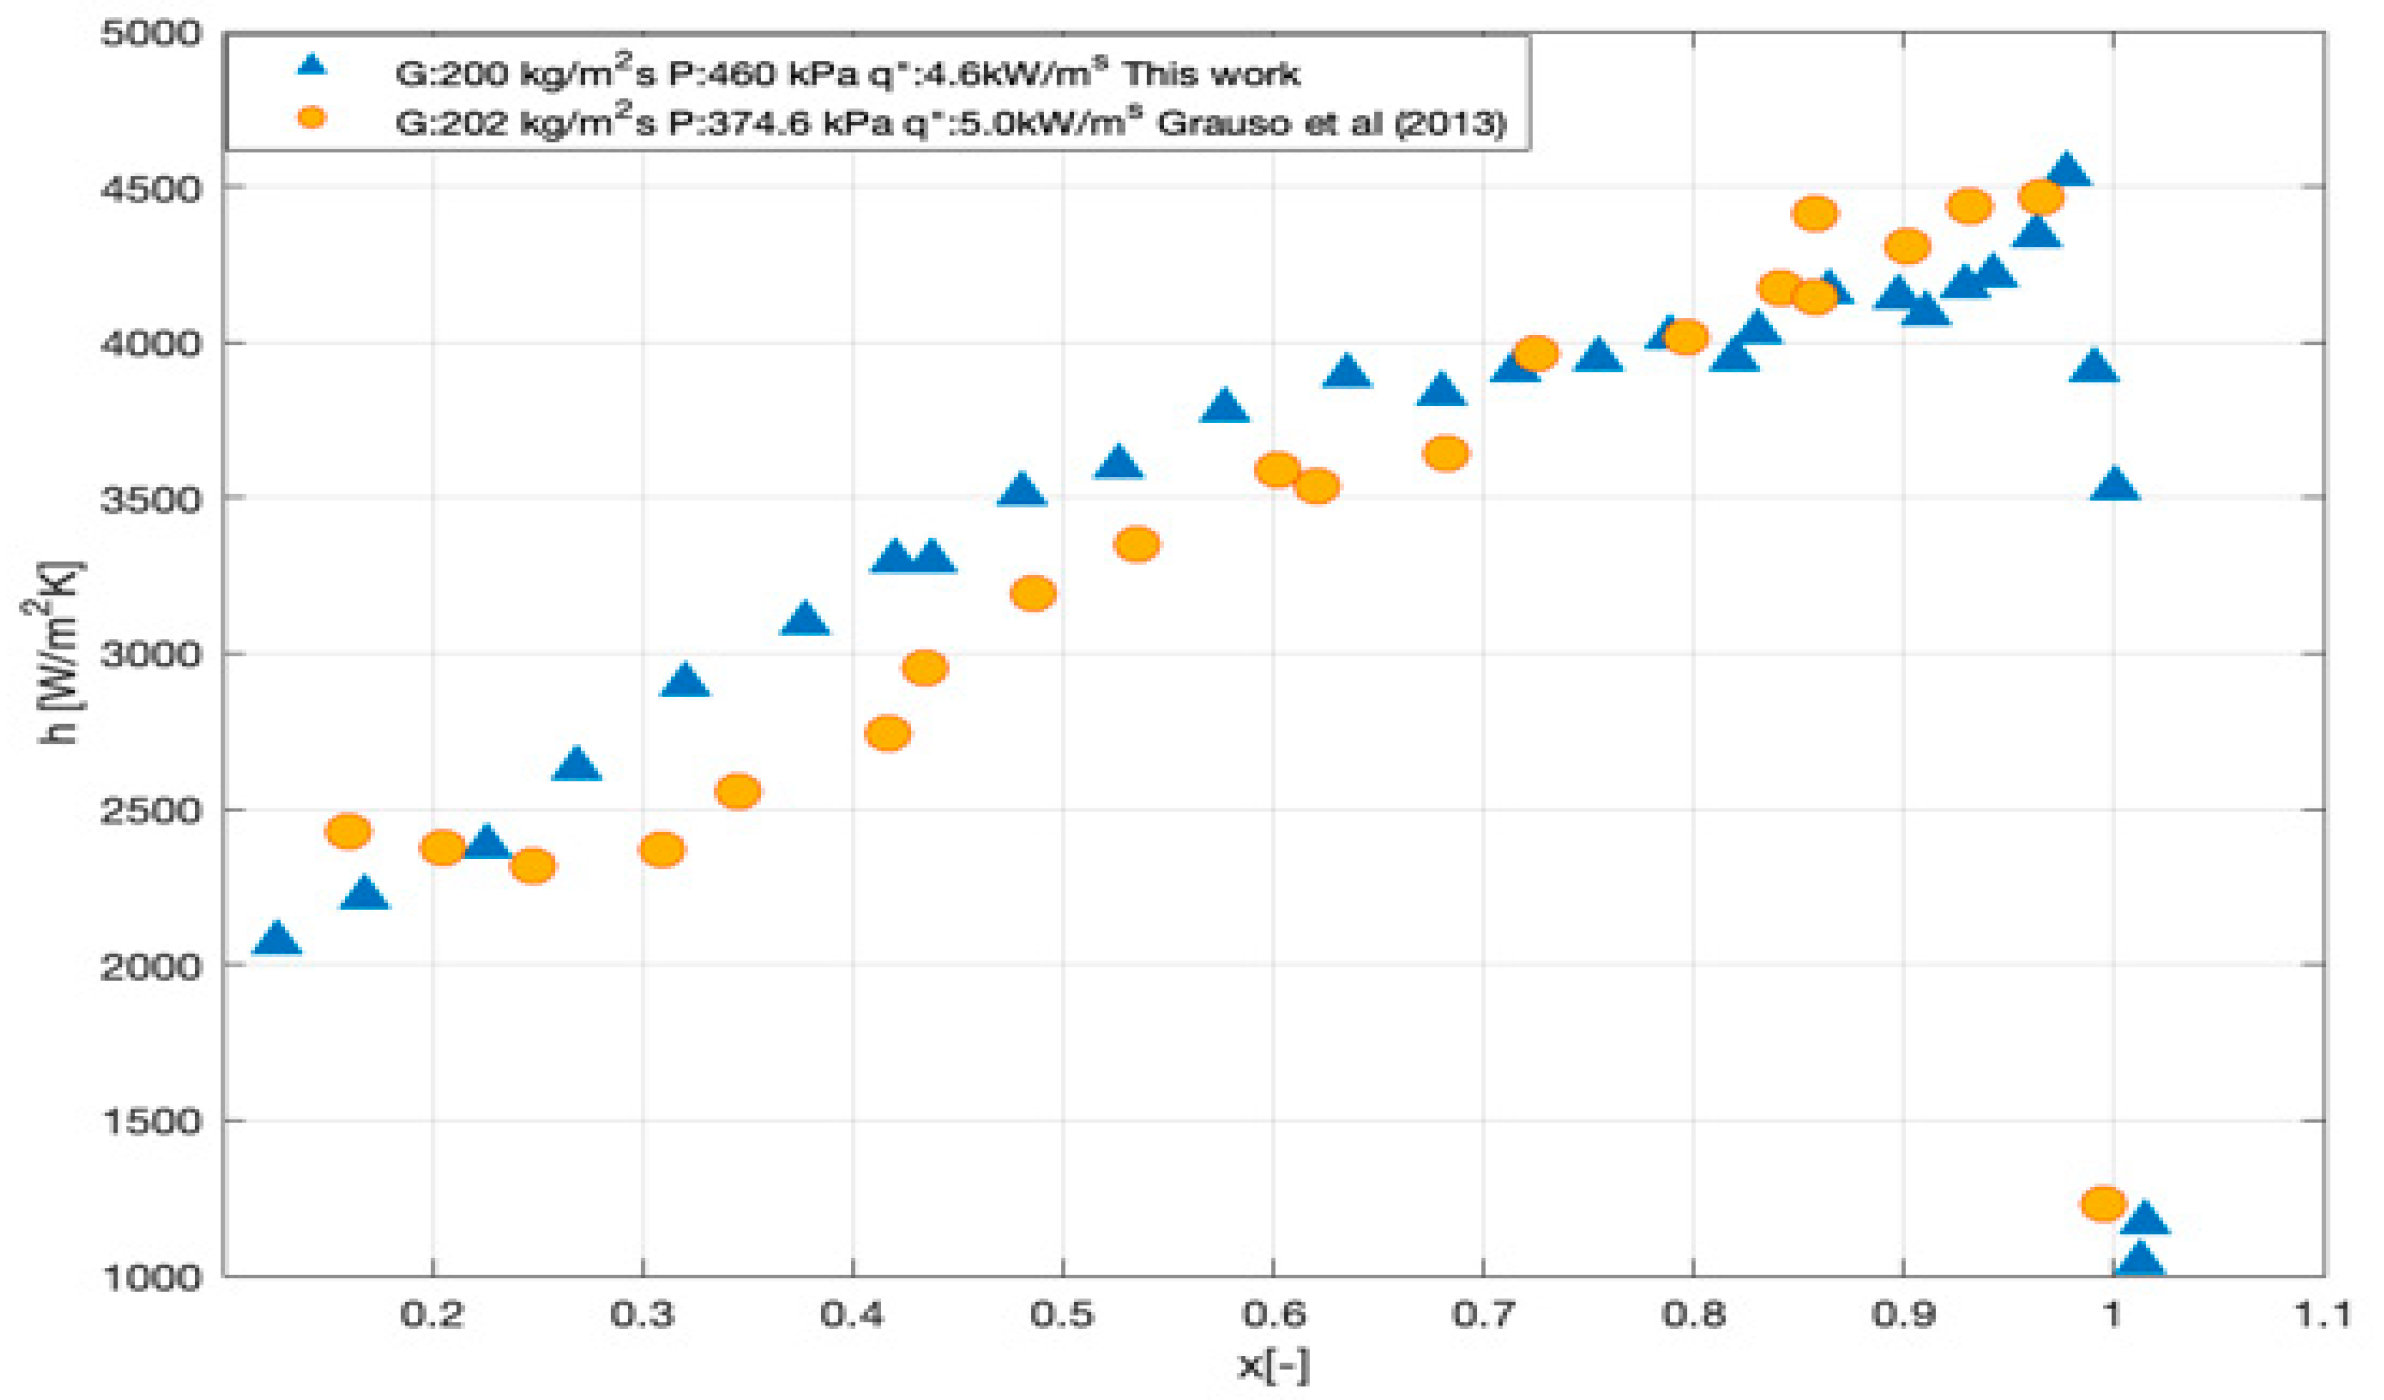
2.4. Validation
3. Results and Discussion
3.1. Flow Boiling Heat Transfer Coefficient
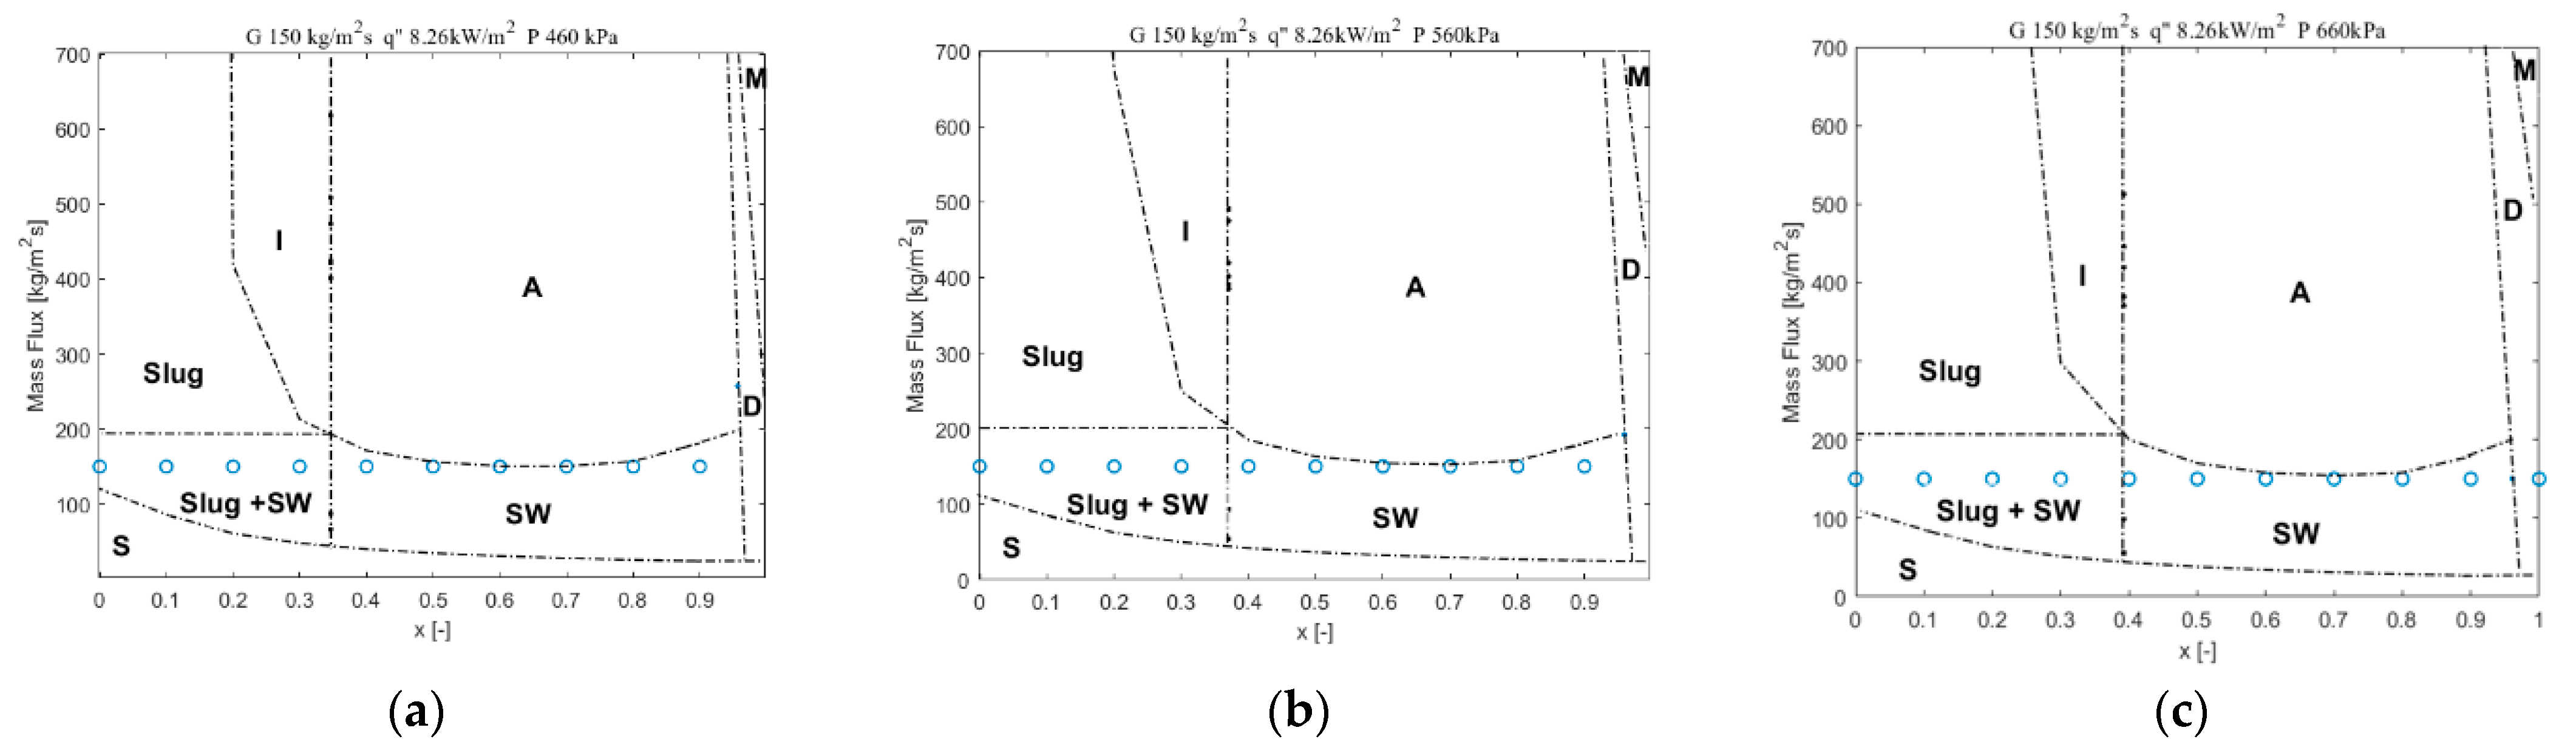
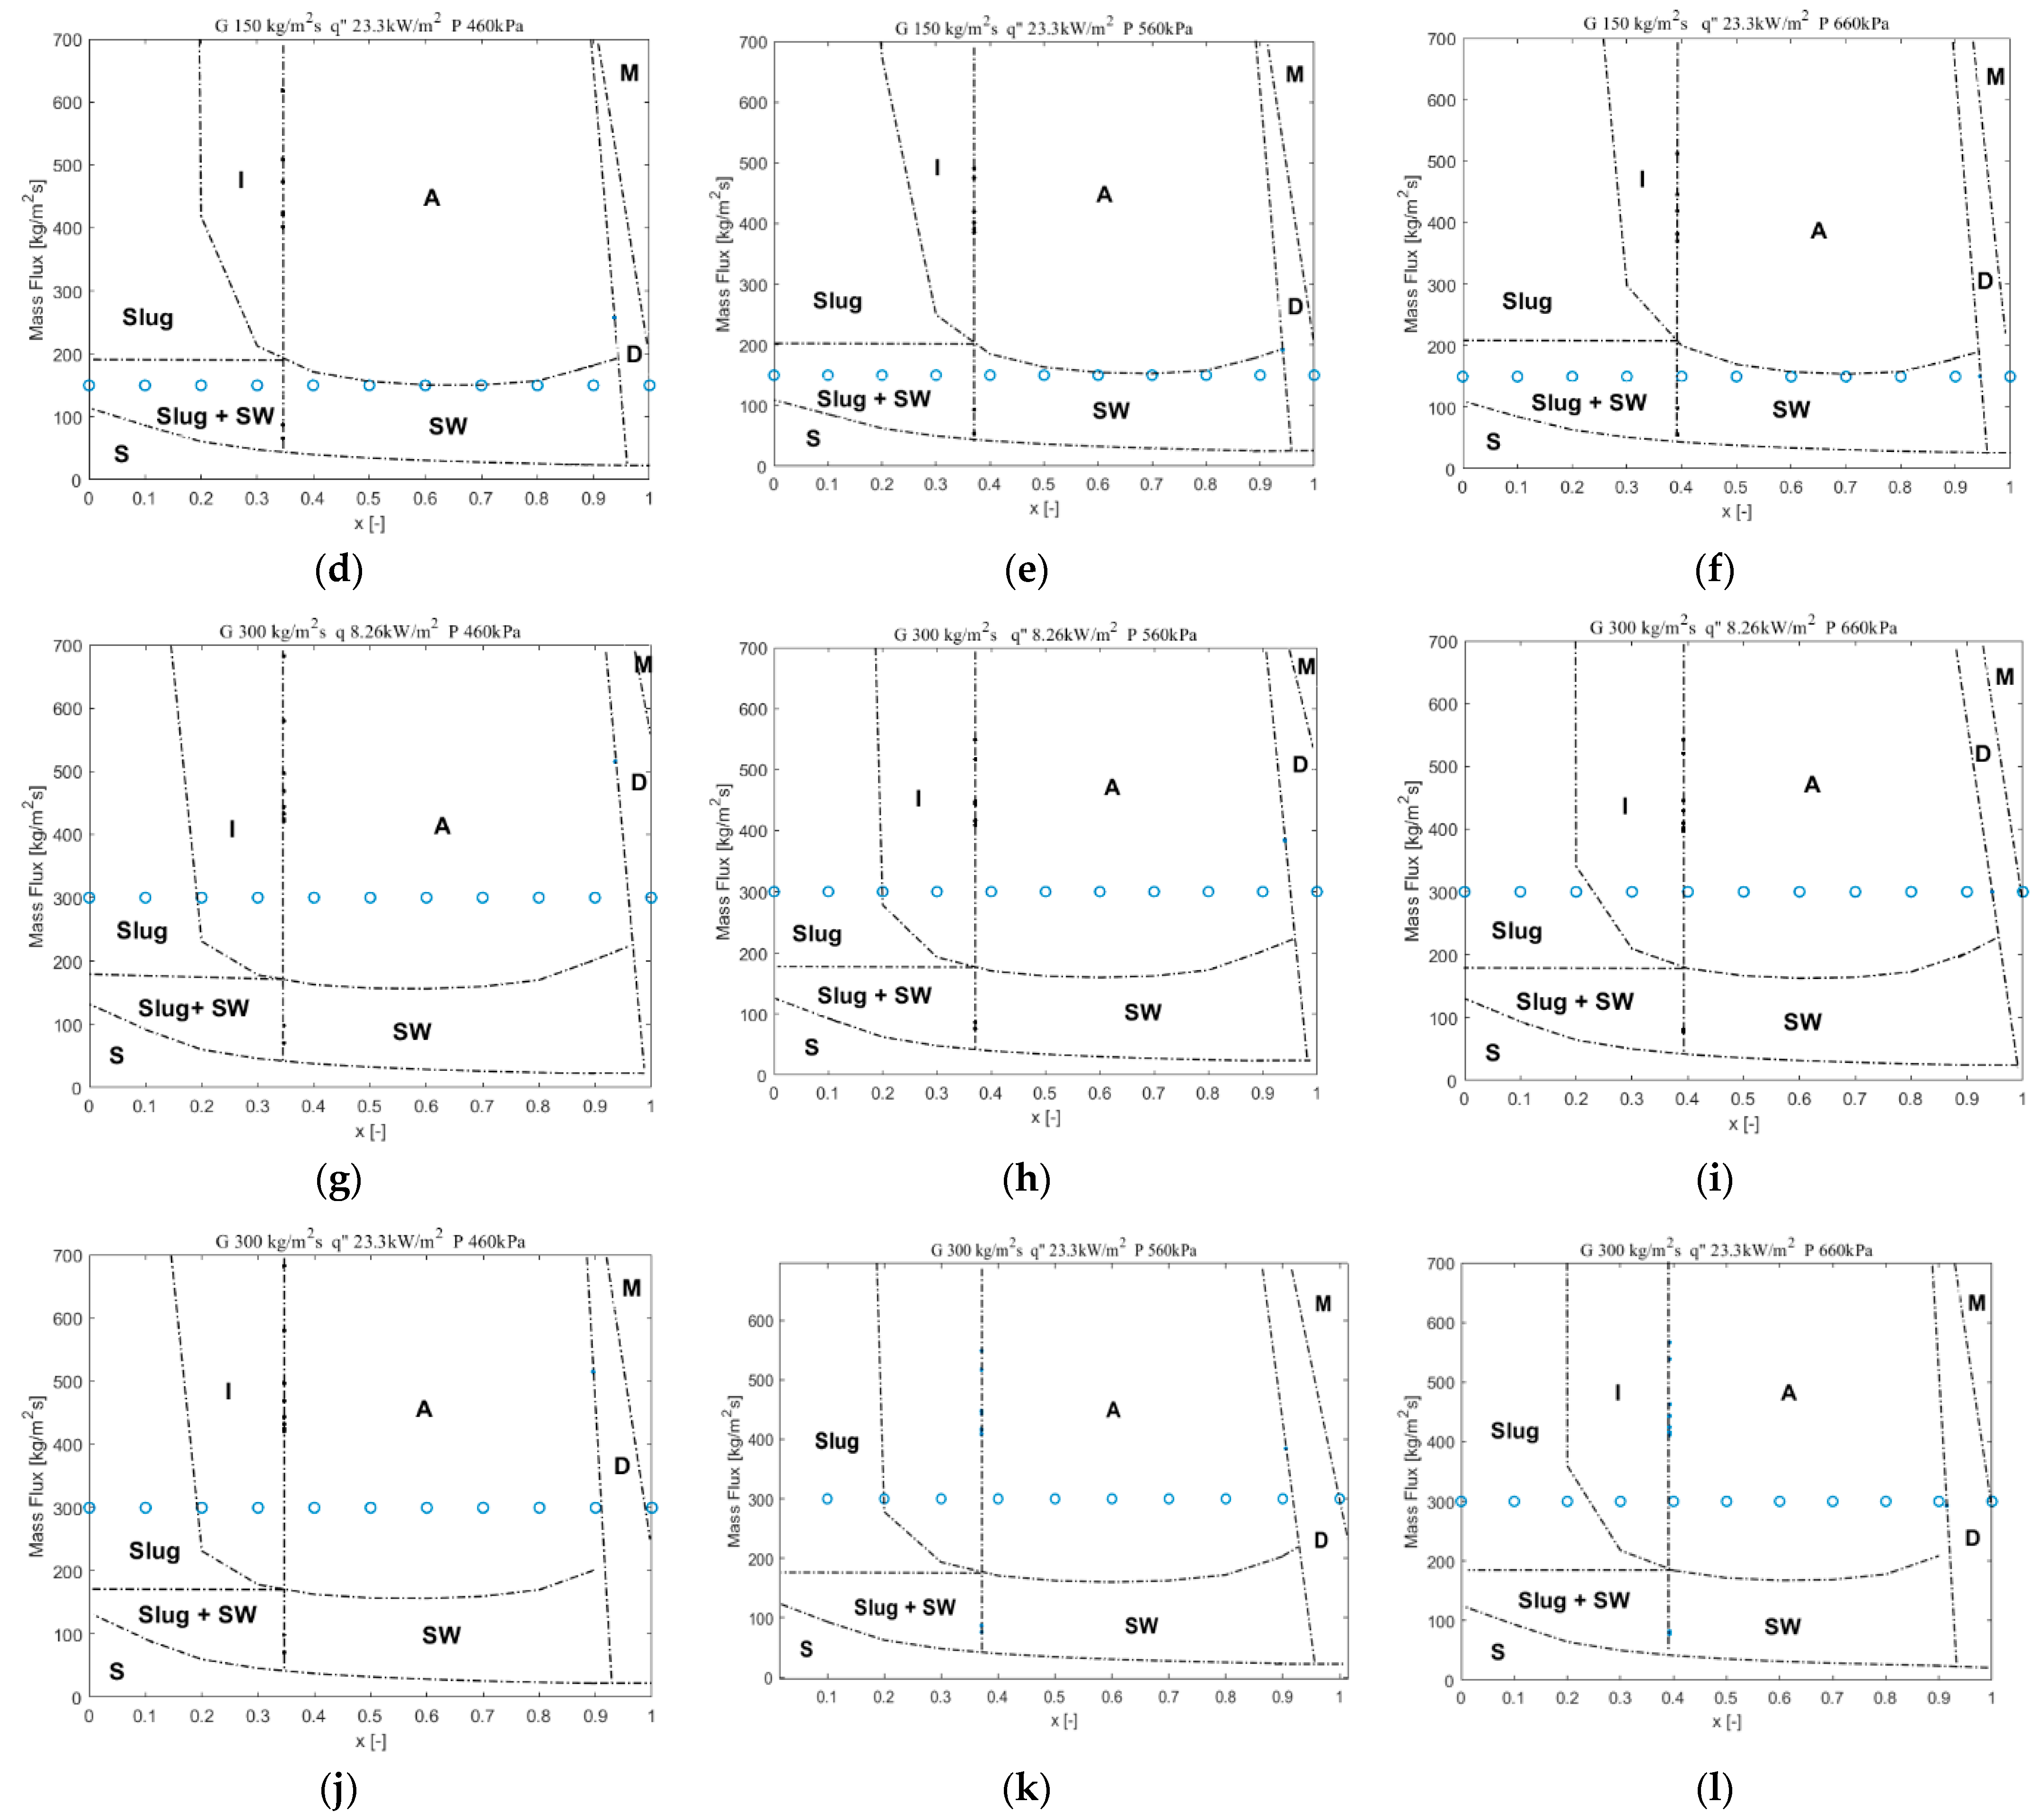
3.2. Flow Patterns
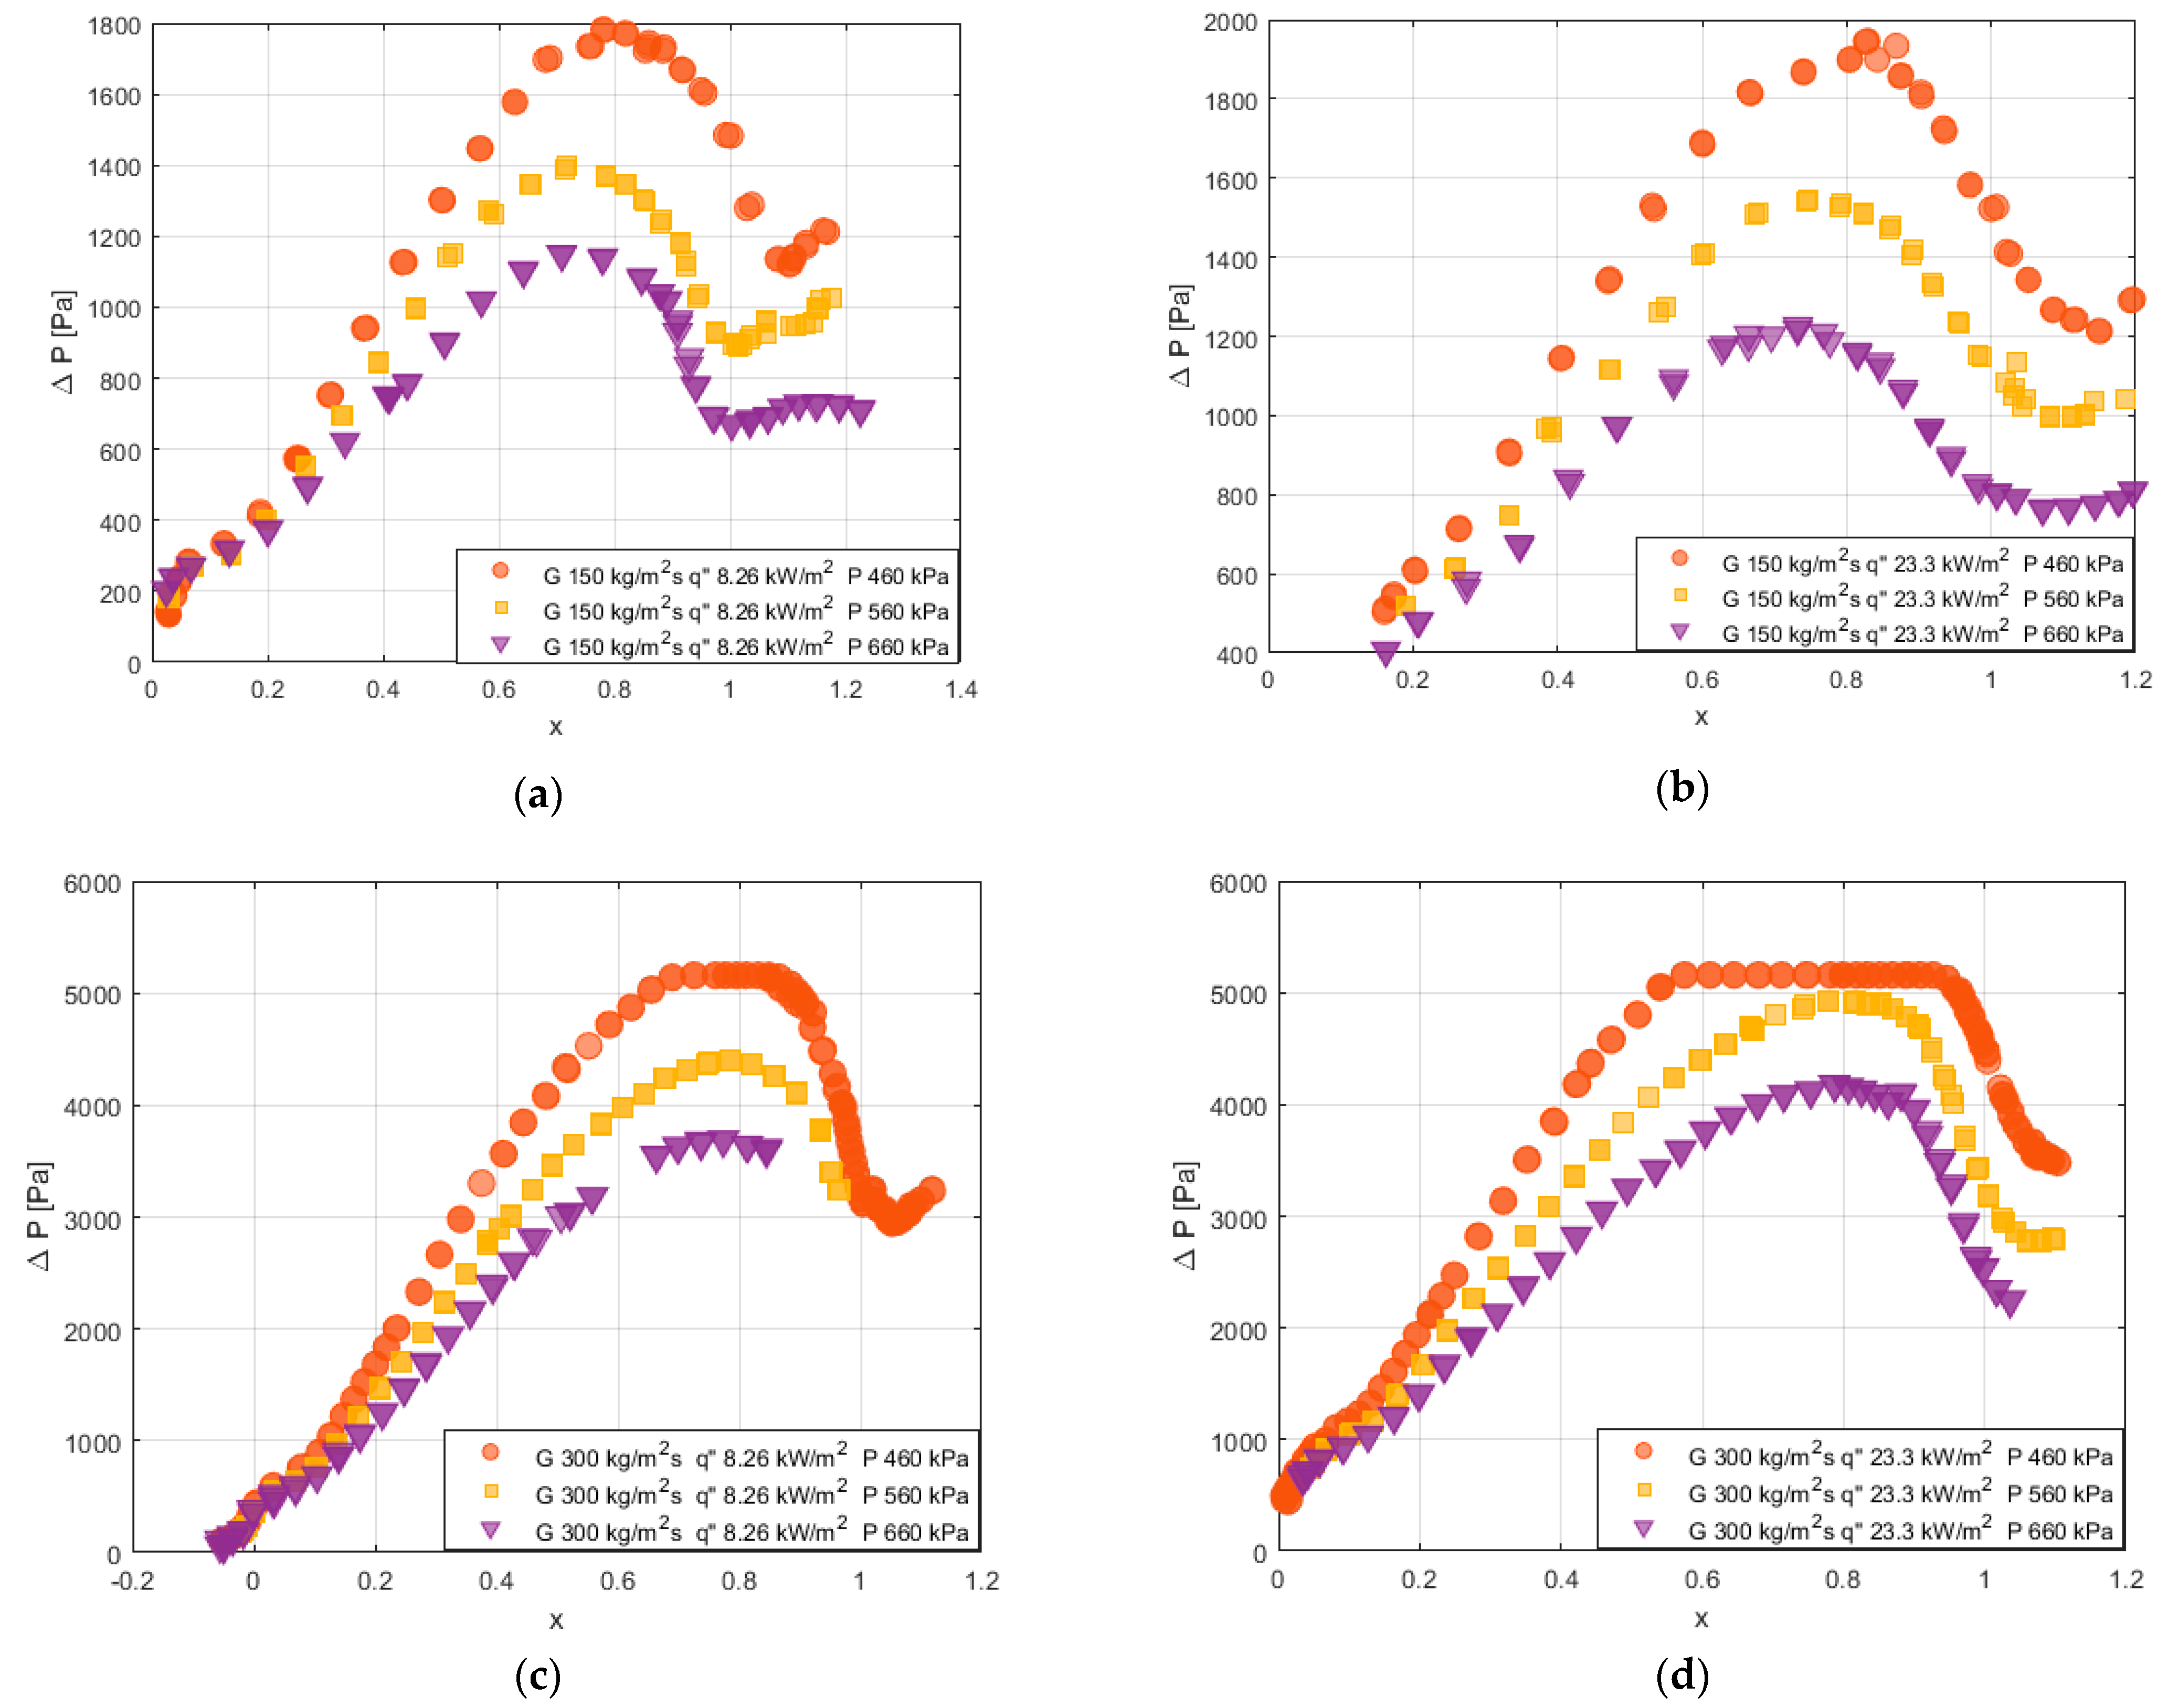
3.3. Frictional Pressure Drop
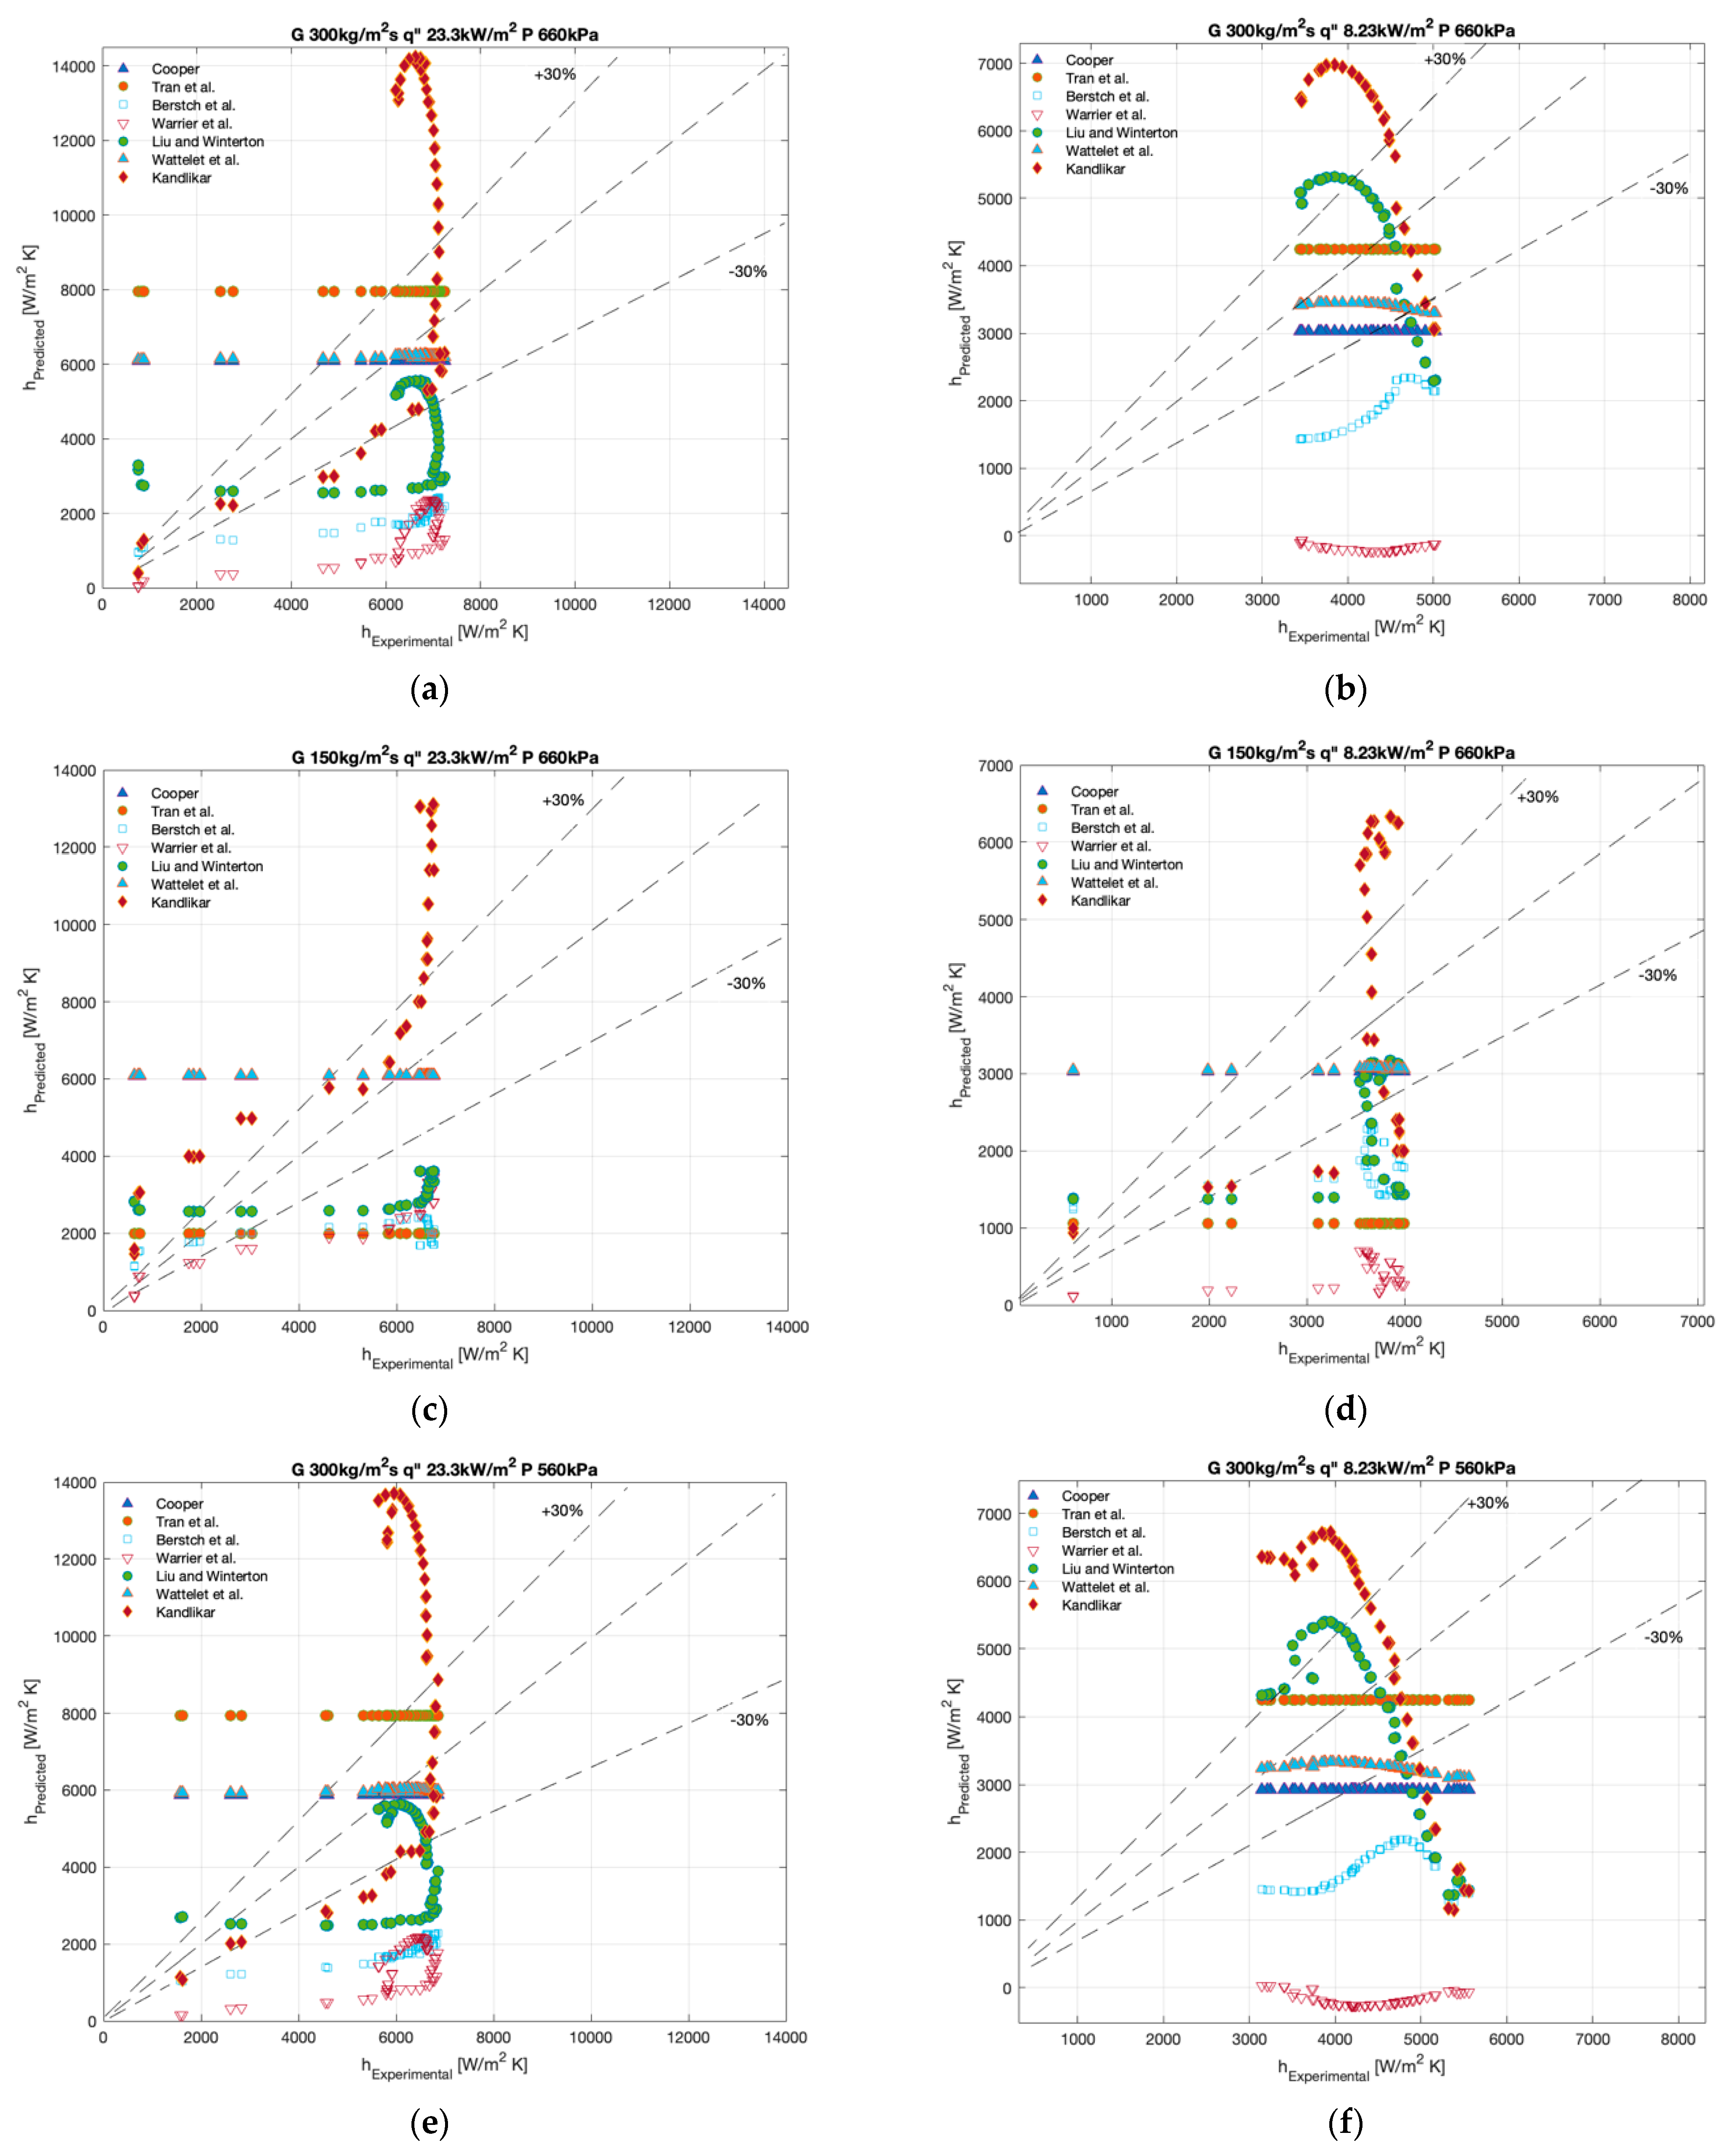
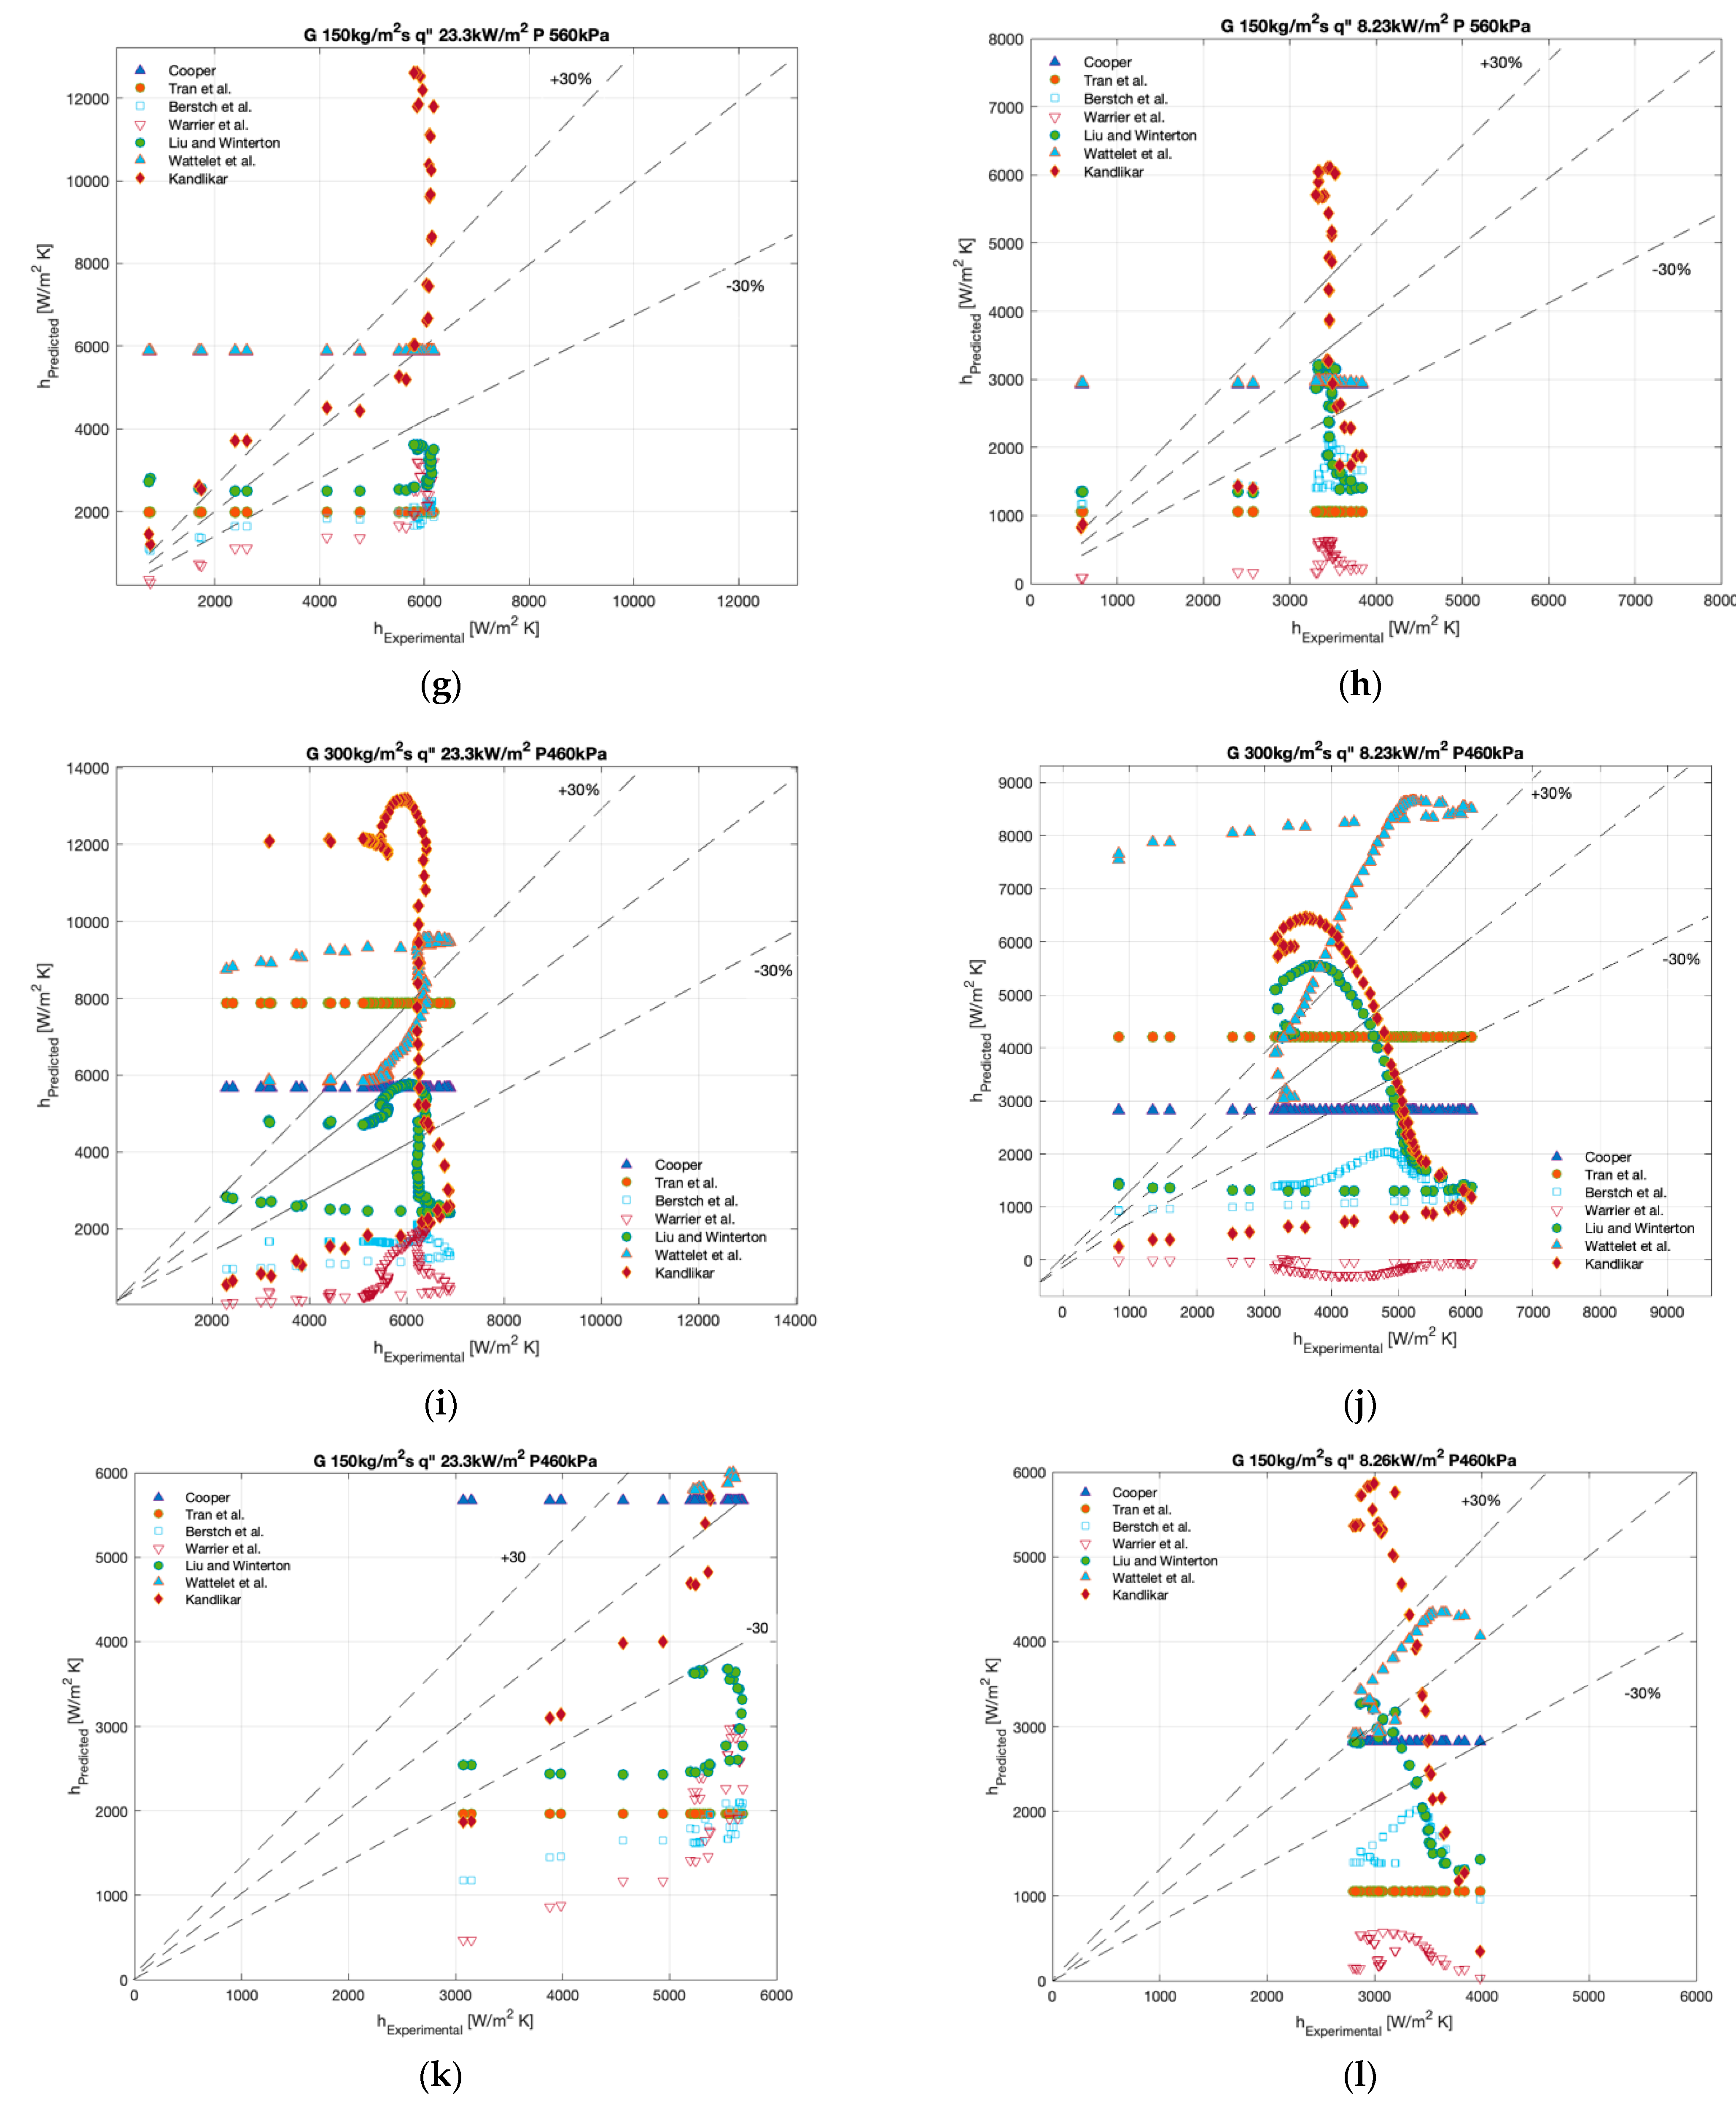
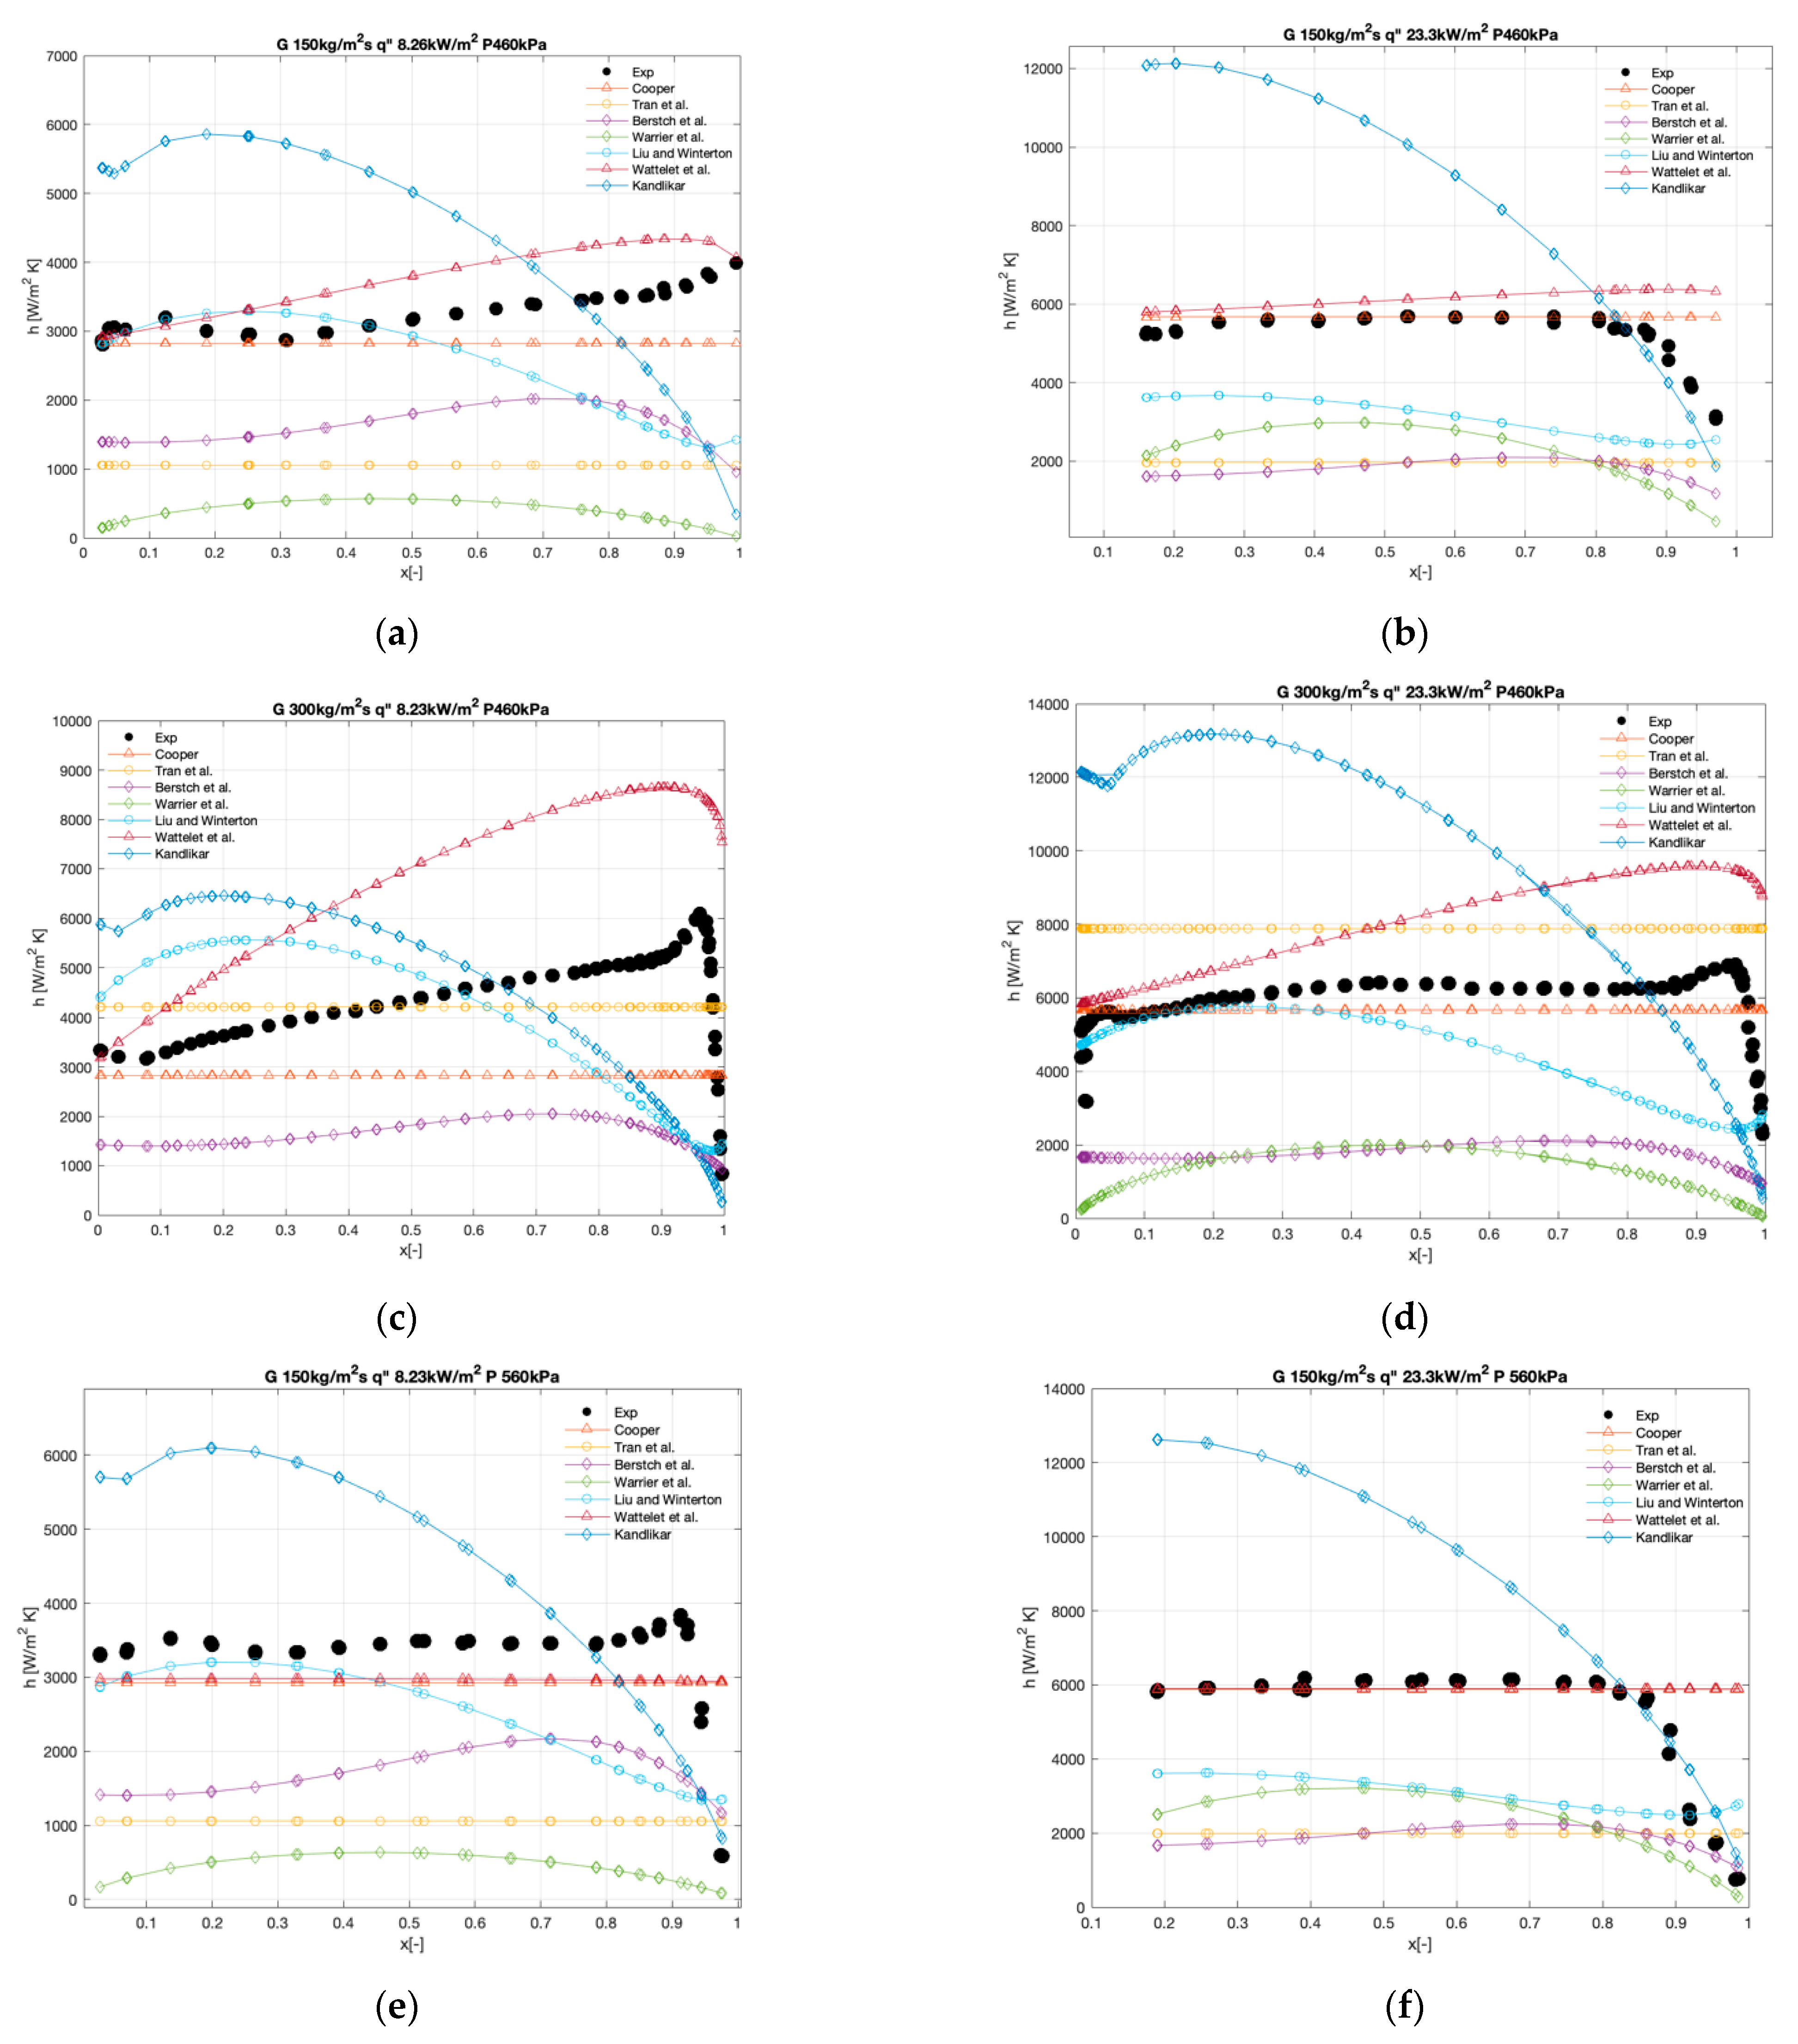
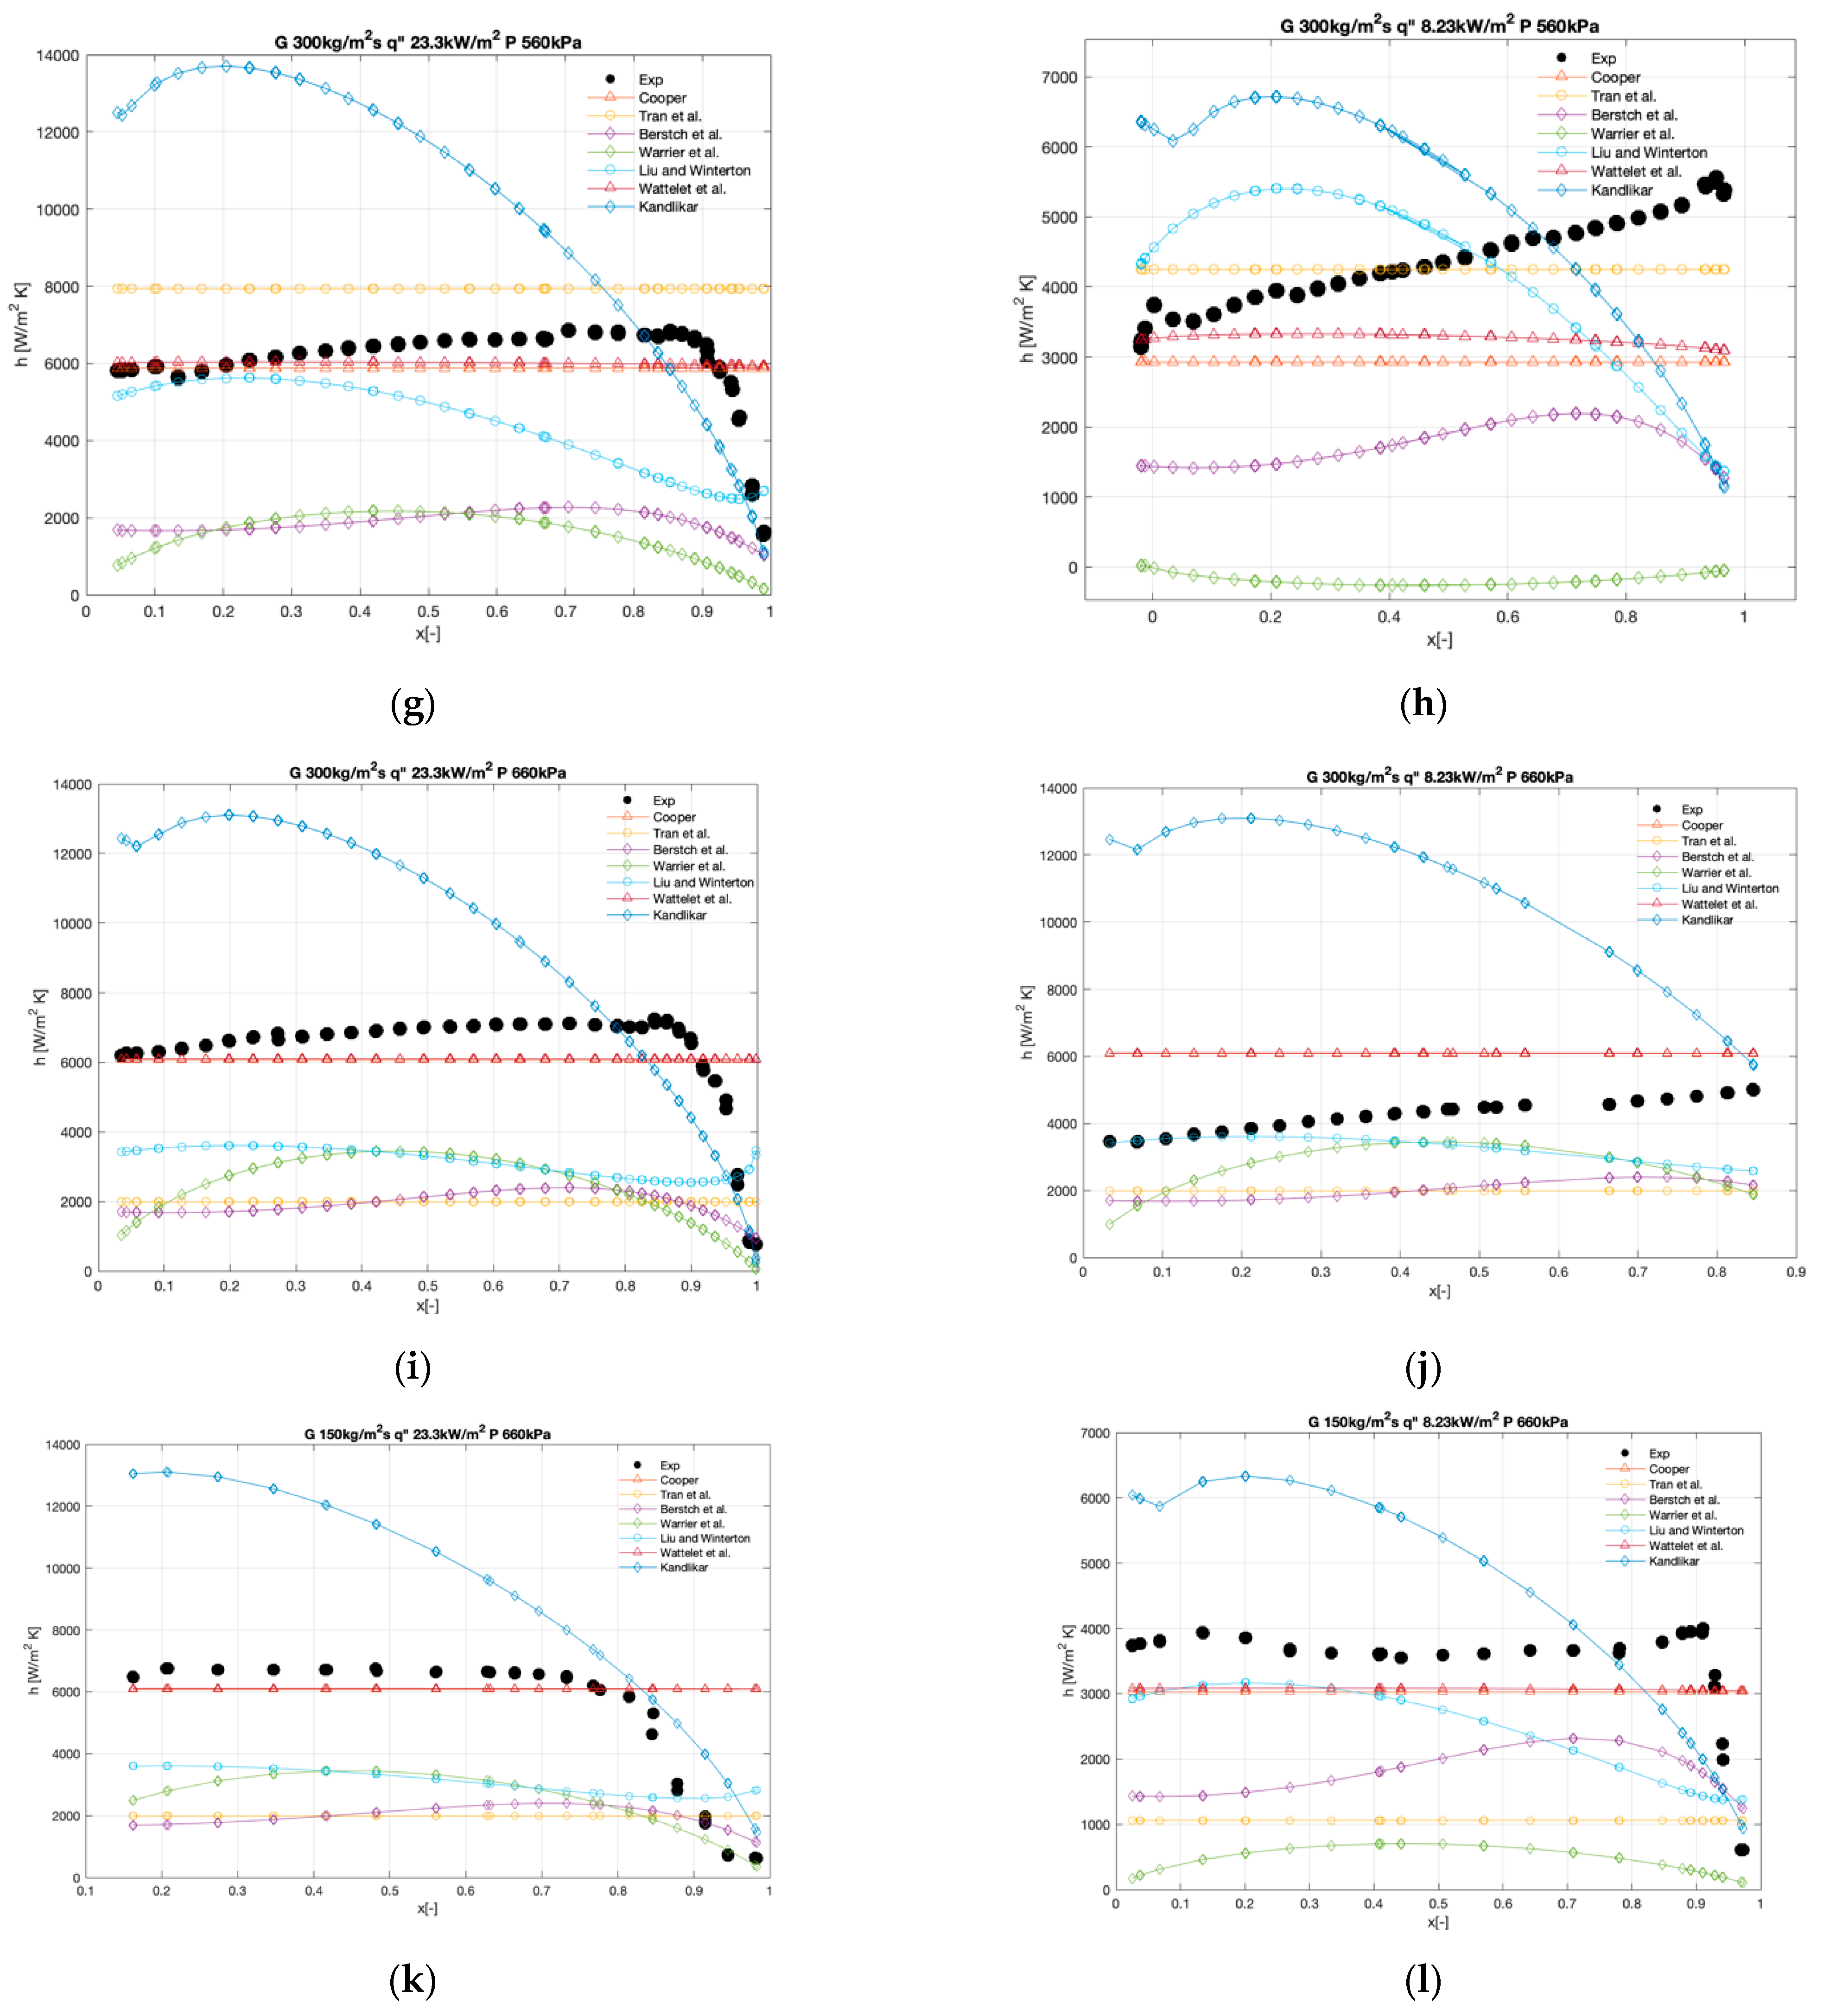
3.4. Comparison of Experimental Results with Correlations of Heat Transfer Coefficient Developed Based on Different Theories
4. Conclusions
- -
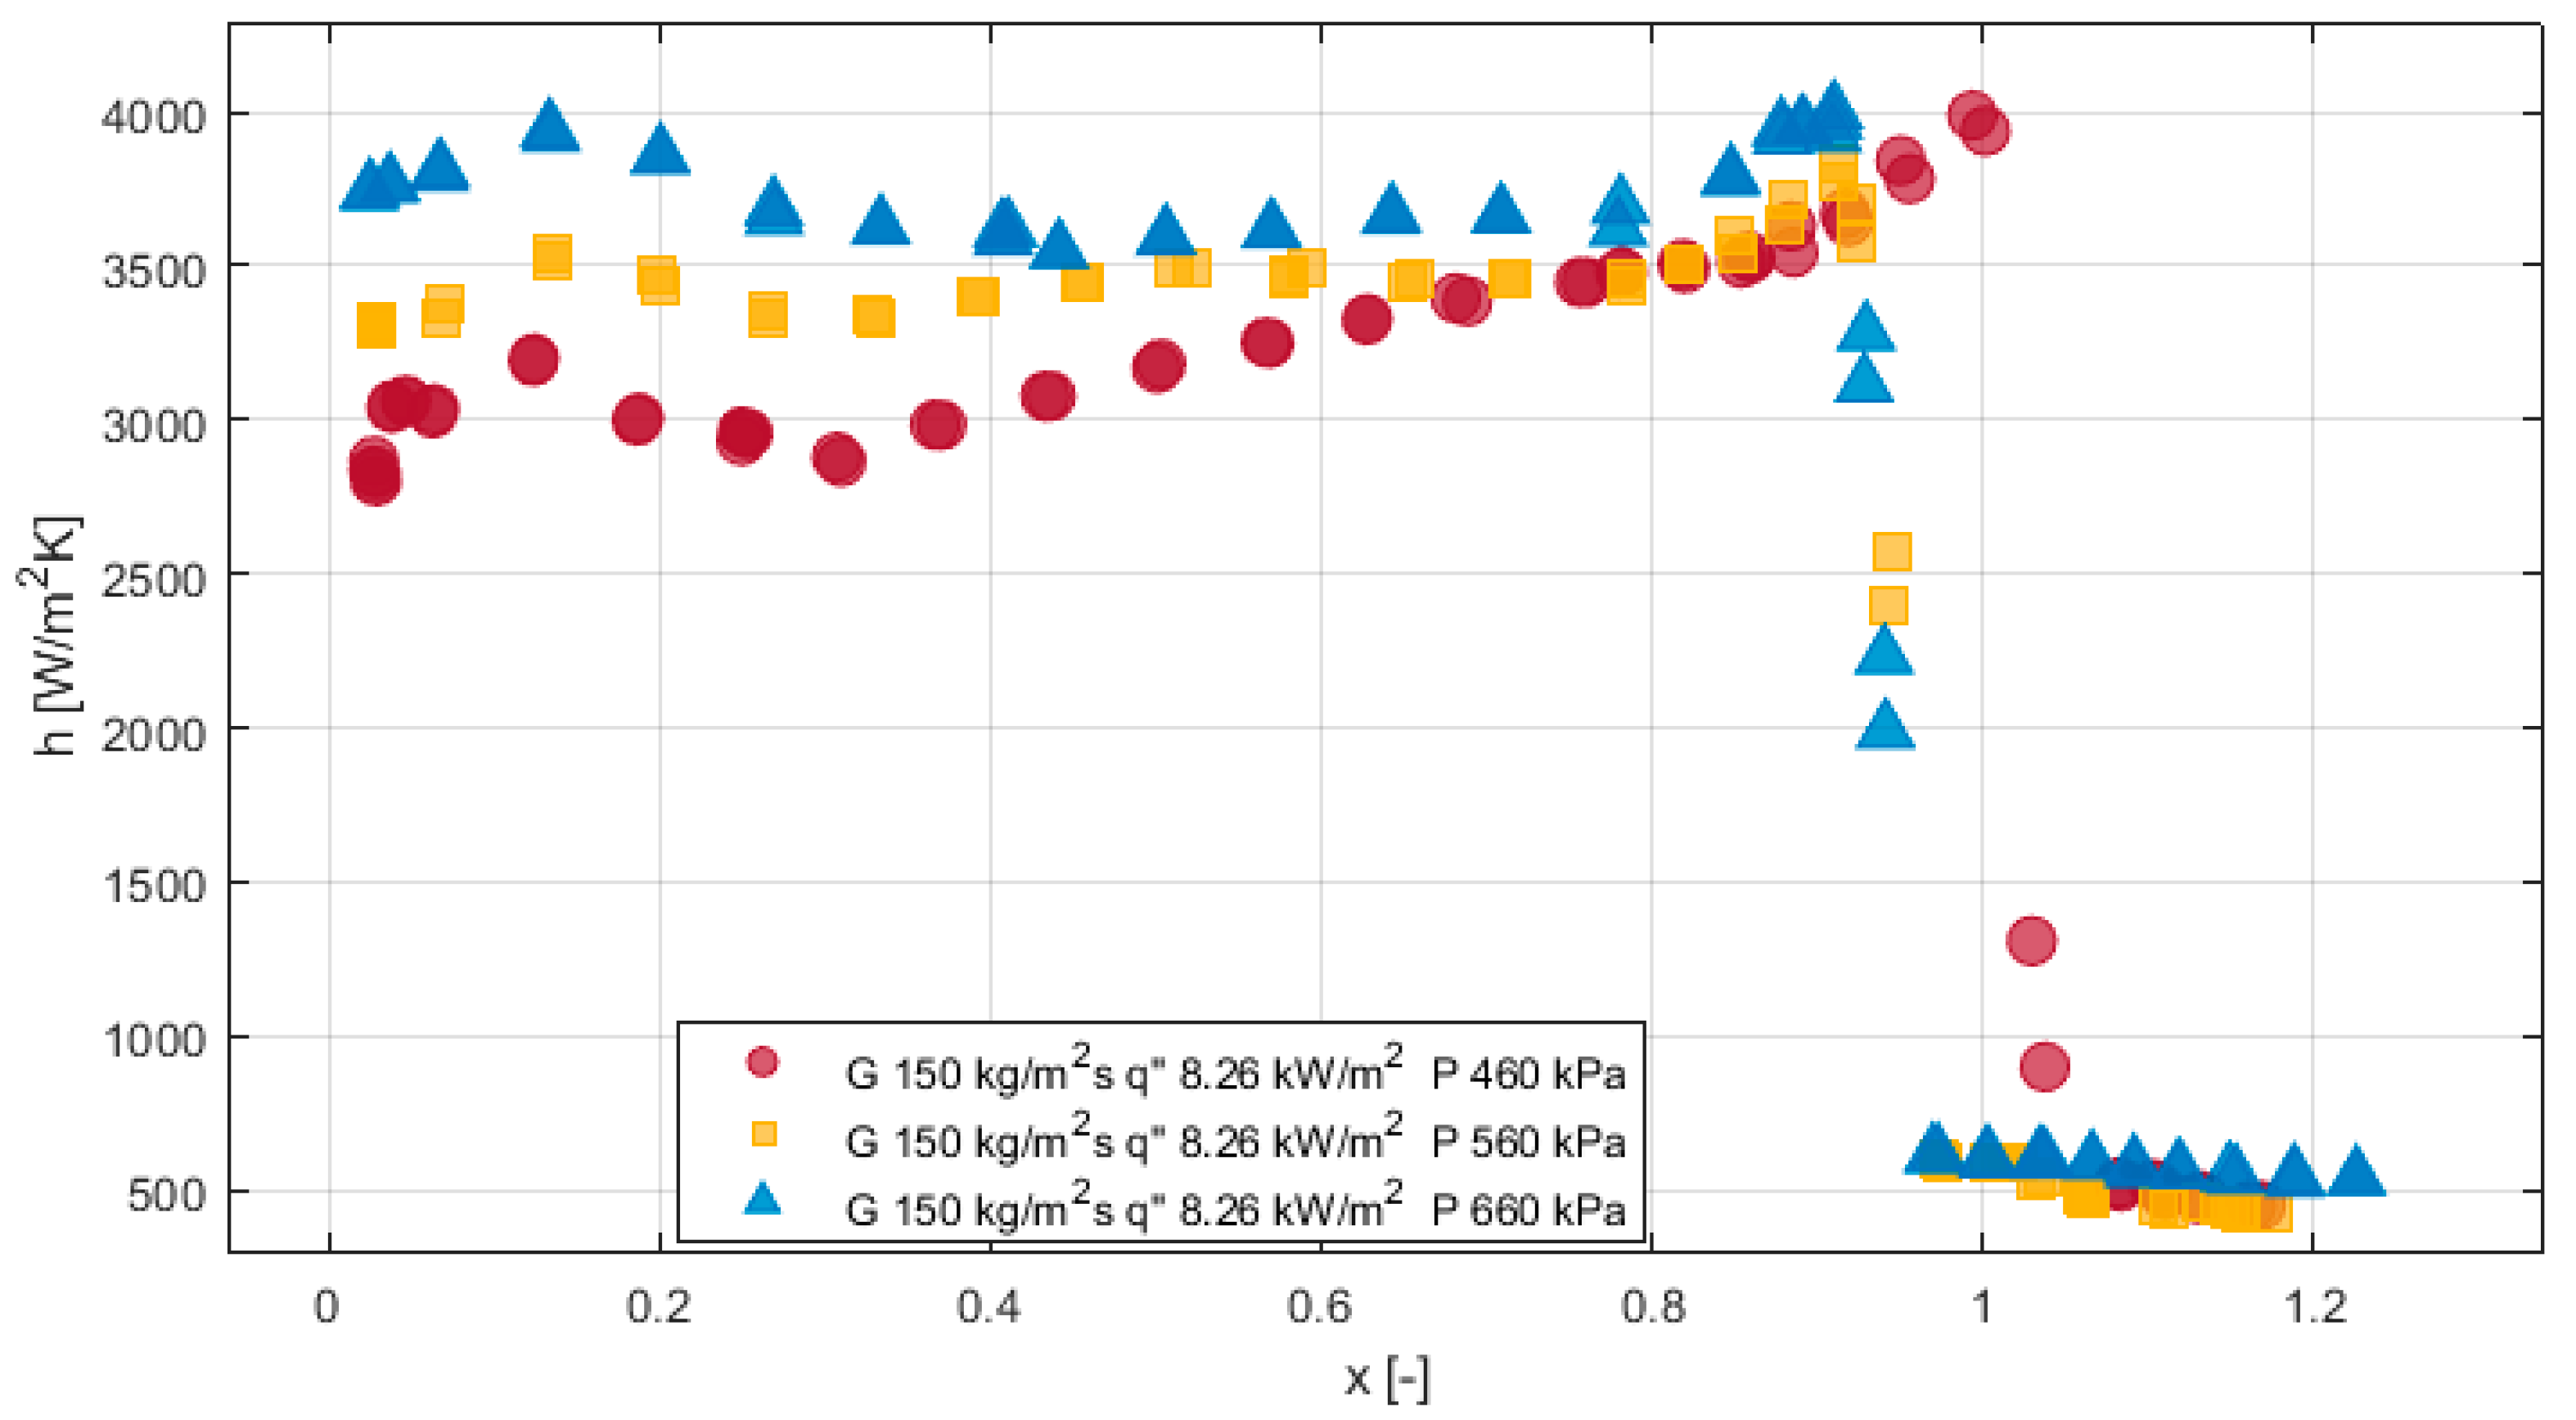
- At low mass flux, increasing saturation pressure increased the heat transfer coefficient. This effect was more pronounced in the low vapor quality region and the dominant mechanism was nucleate boiling.
- -
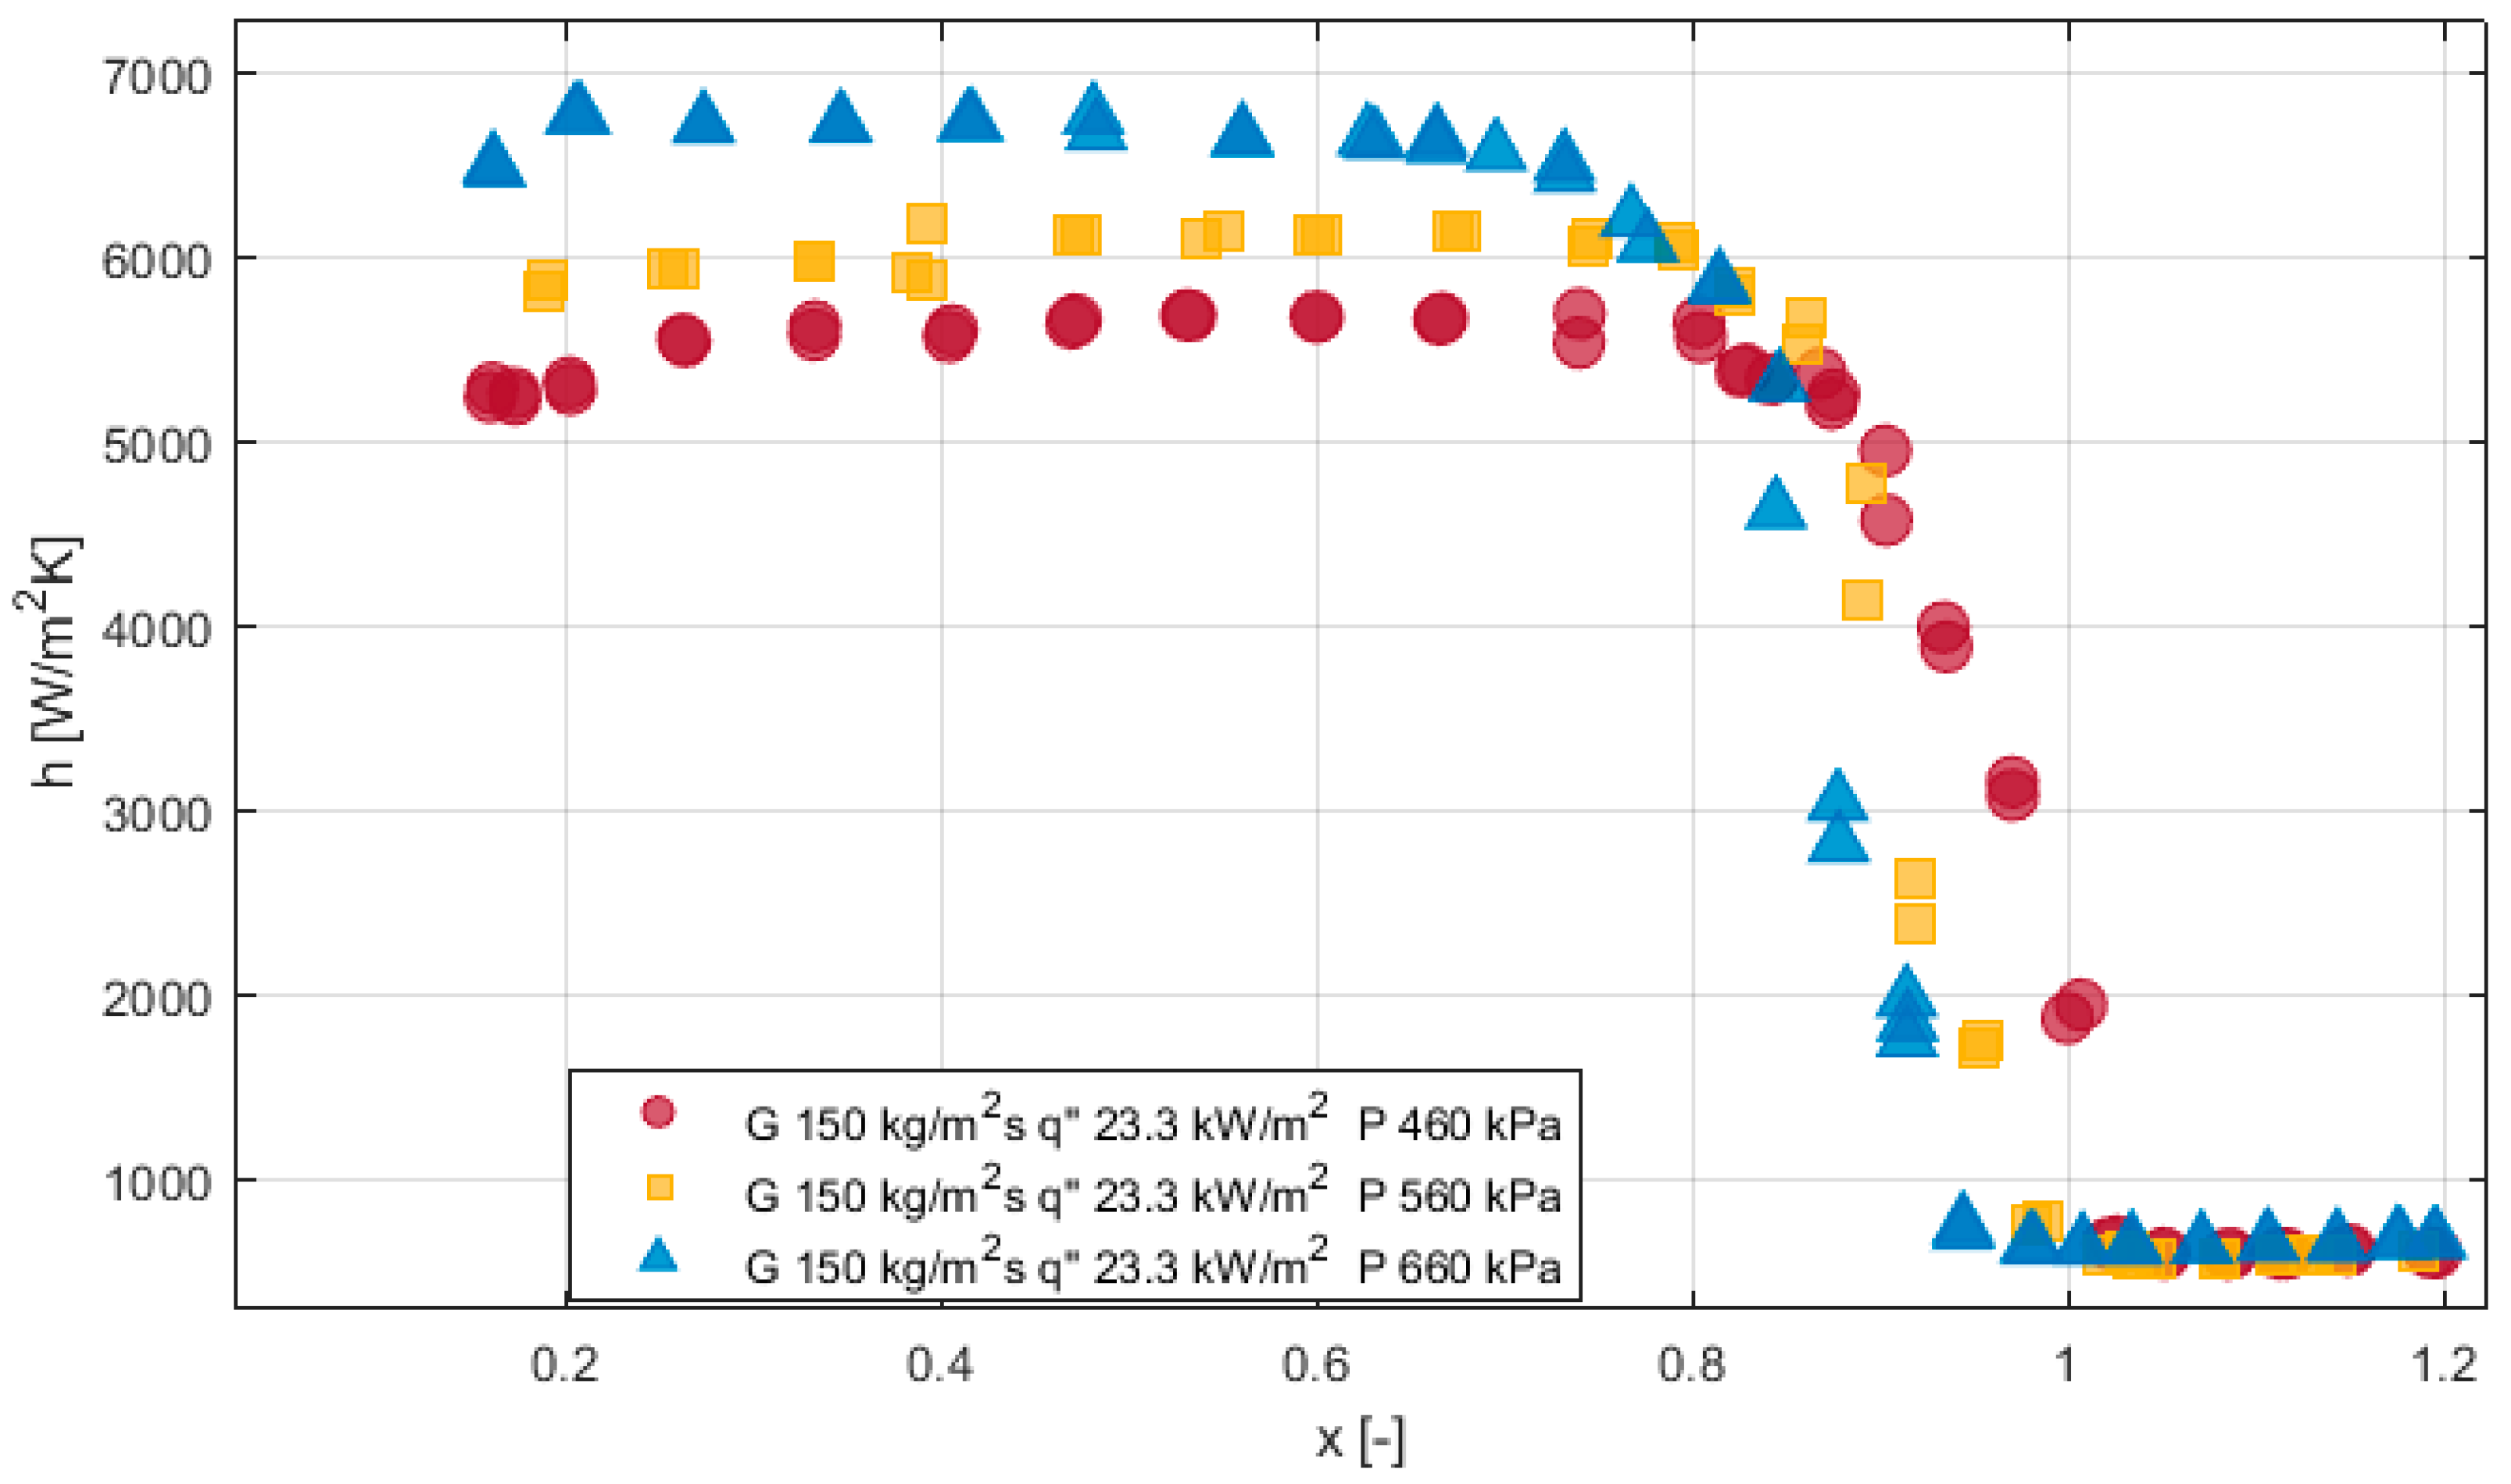
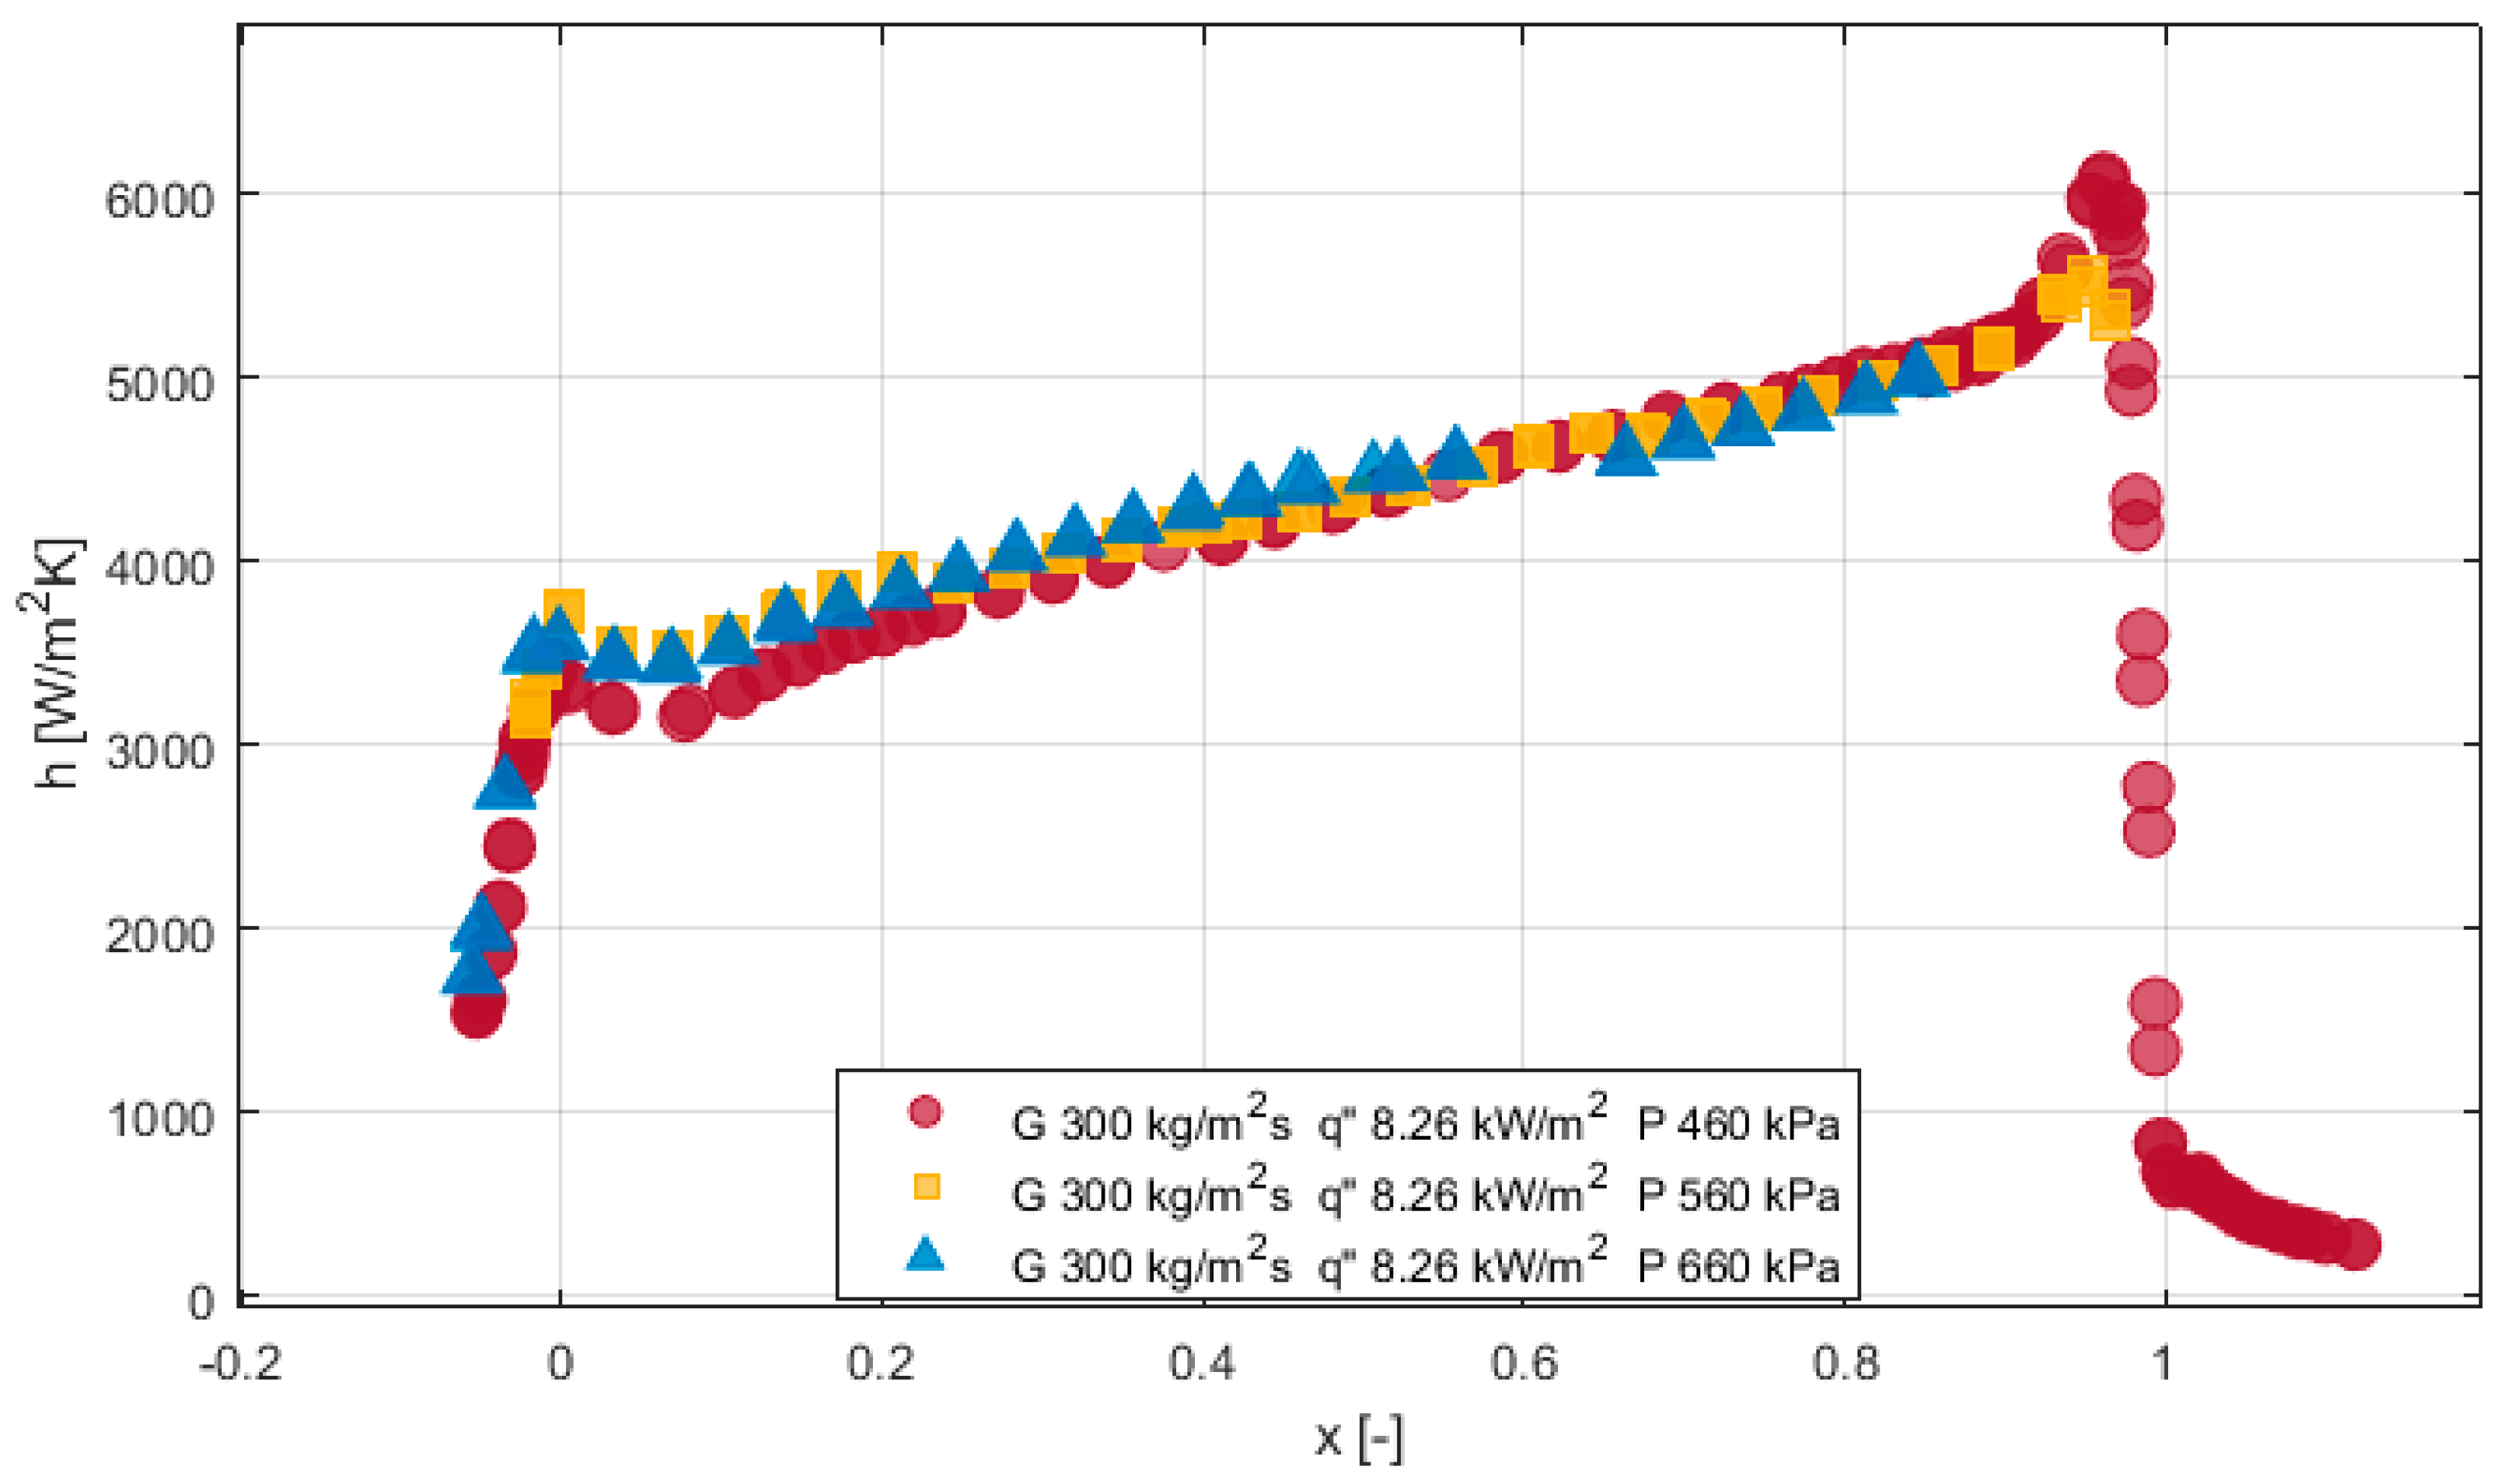
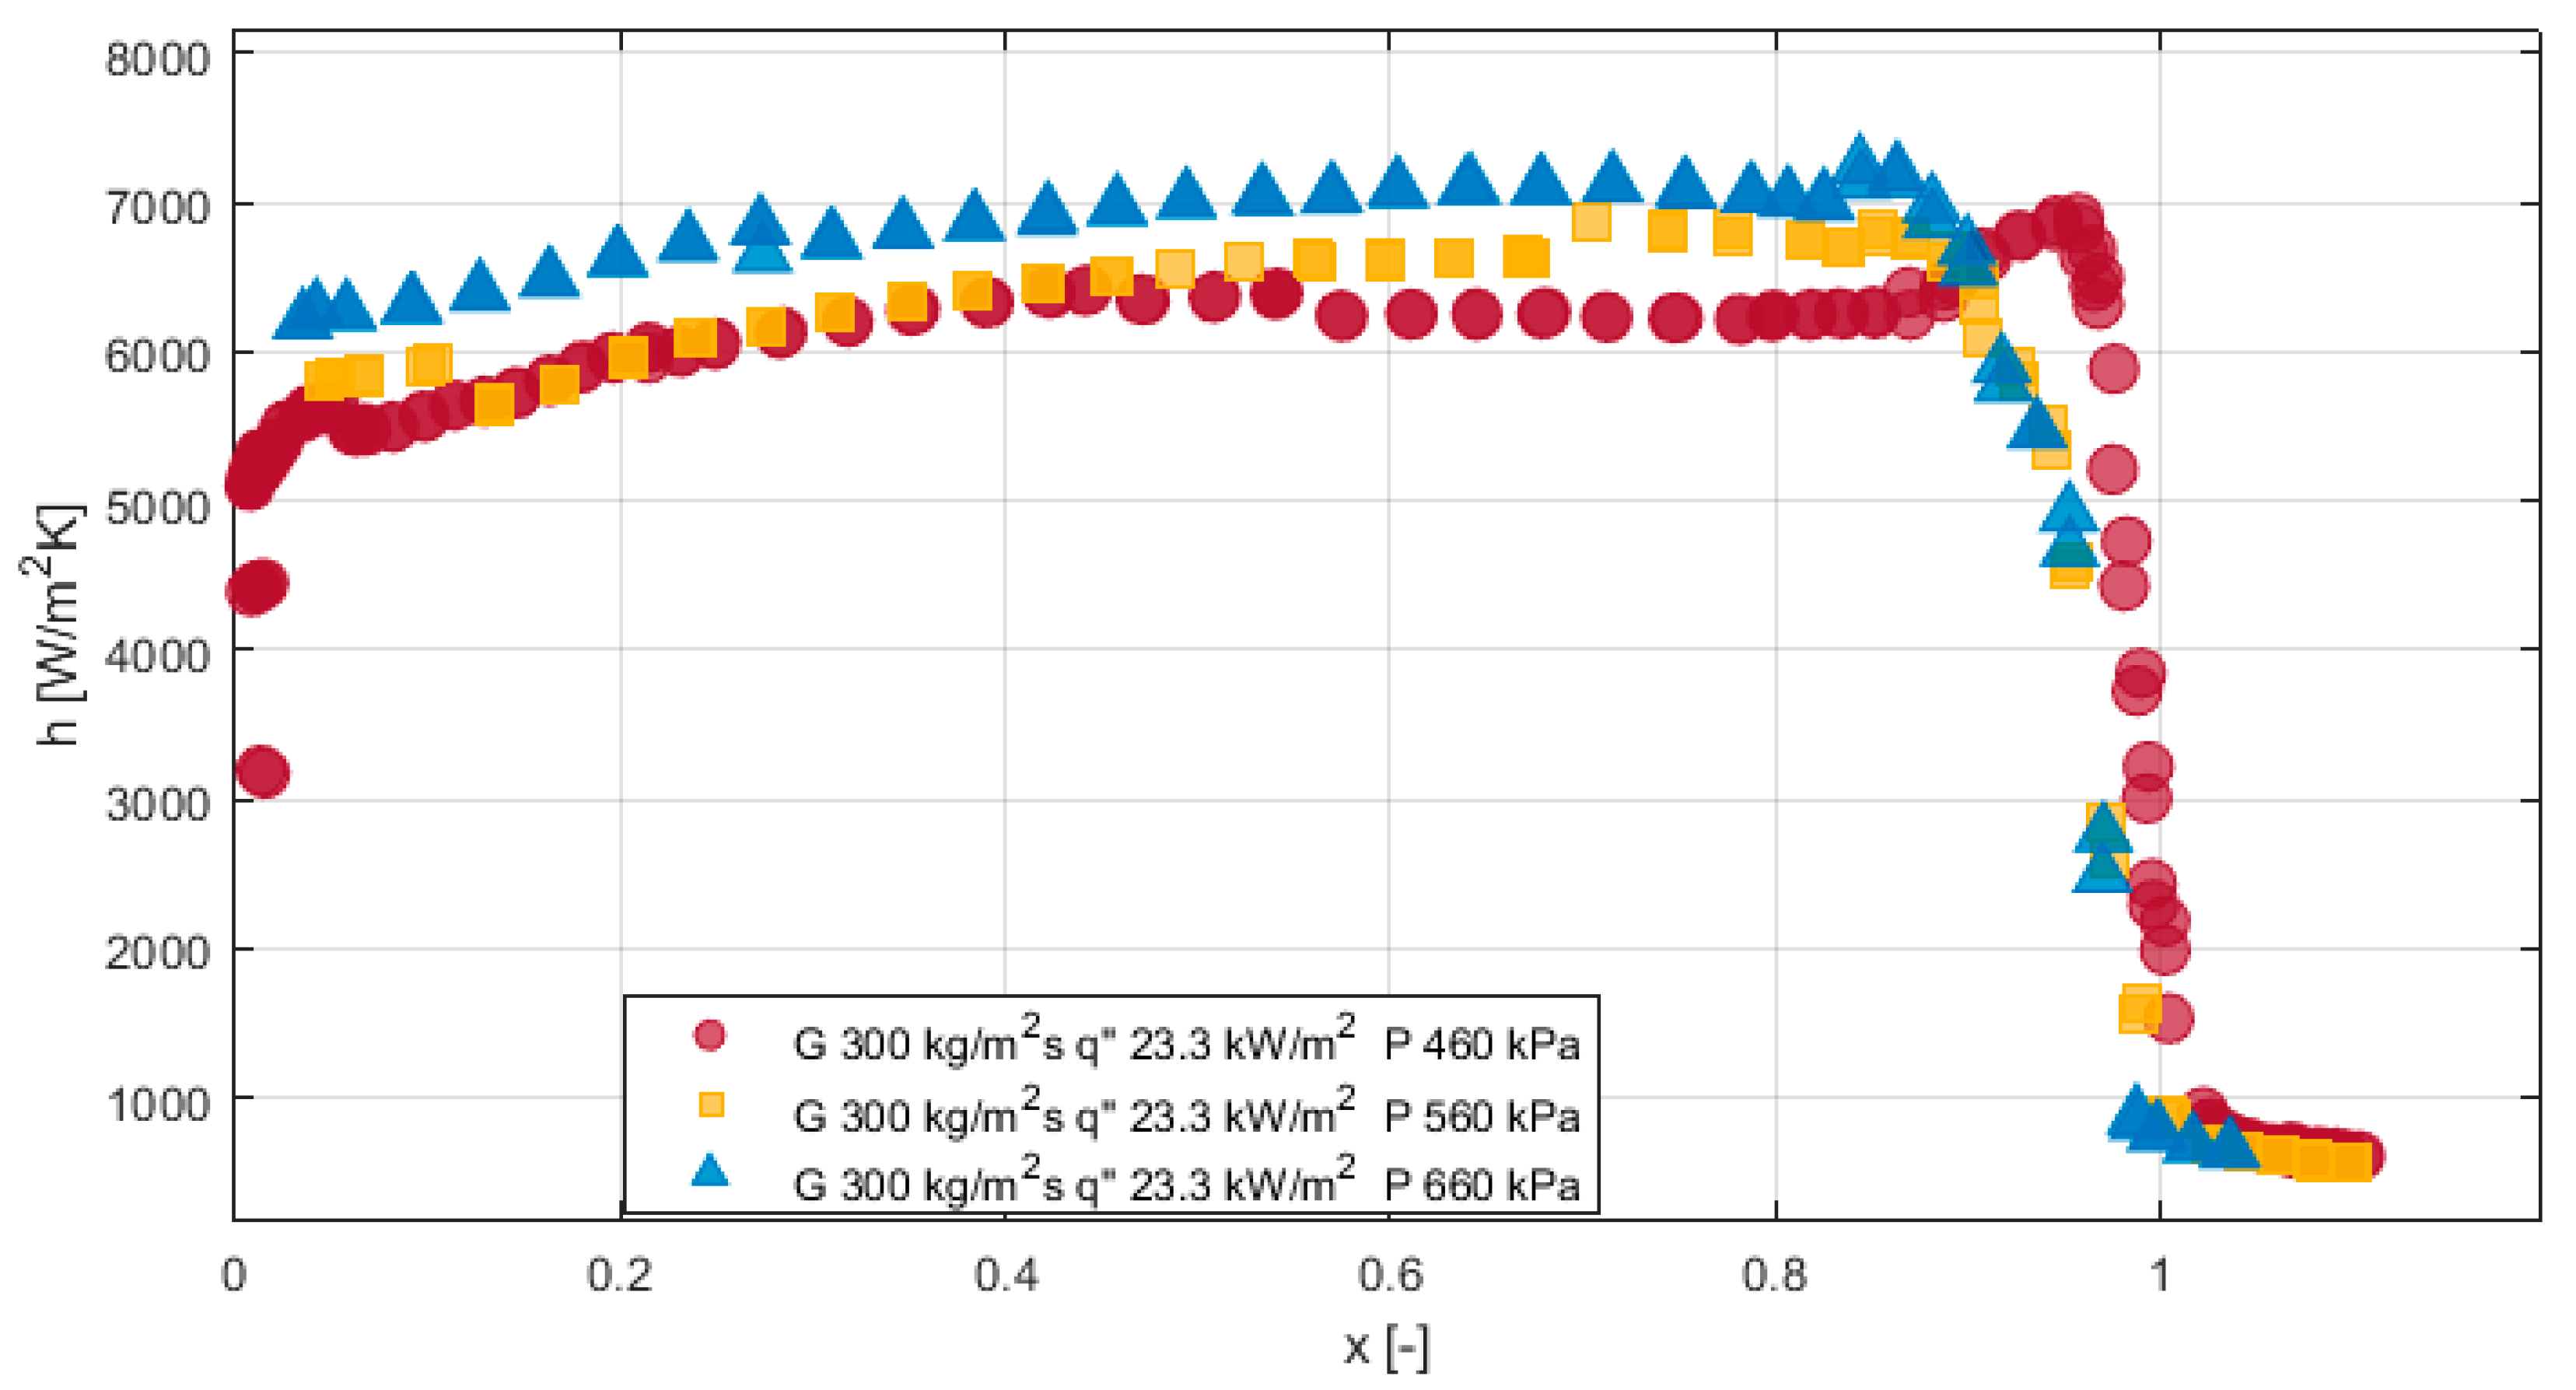
- At high mass flux, increasing saturation pressure led to an insignificant increase in the heat transfer coefficient. At high mass flux but low heat flux, the heat transfer coefficient increased with vapor quality, indicating convective boiling dominance. However, for high heat flux, the heat transfer coefficient was linear over vapor quality, indicating nucleate boiling dominance.
- -
- Pressure drop was observed to decrease with increasing saturation pressure.
- -
- Increasing saturation pressure increased the vapor quality at which the flow pattern transitions from intermittent flow to annular flow. The flow patterns predicted by Wojtan’s flow pattern map were a mixture of slug and stratified wavy and purely stratified wavy for low mass fluxes. For increased mass fluxes, the flow patterns predicted were slug, intermittent, annular, and dry out.
- -
- Cooper’s model was the best predictor of the experimental data and the trend of heat transfer followed by the models of Wattalete et al. and Liu and Winterton.
Author Contributions
Funding
Data Availability Statement
Conflicts of Interest
Nomenclature
| A | Cross section area (m2) |
| cp | Specific heat capacity |
| D | Channel diameter (m) |
| h | Heat transfer coefficient (W/(m2·K)) |
| G | Mass flux (kg/(m2s)) |
| g | Acceleration due to gravity (ms−2) |
| k | Thermal conductivity of liquid (W/(m K)) |
| Nu | Nusselt number (hD/k) |
| Pr | Prandtl number |
| PrL | Liquid phase Prandtl number |
| PrV | Vapor phase Prandtl number |
| P | Total heat len (W) |
| q′′ | Heat flux (Wm−2) |
| ReL | Liquid Reynolds number |
| Tsub | Inlet subcooling (K) |
| ReV | Vapor Reynolds number |
| Re2 | Two-phase Reynolds |
| x | Vapor quality |
| hlv | Latent heat of vaporization (J/(kg K) |
| hl | Specific enthalpy of liquid (J/(kg K)) |
| Tw,i | Inner wall temperature (K) |
| Tf | Fluid temperature (K) |
References
- Copetti, J.B.; Macagnan, M.H.; Zinani, F.; Kunsler, N.L. Flow boiling heat transfer and pressure drop of R-134a in a mini tube: An experimental investigation. Exp. Therm. Fluid Sci. 2011, 35, 636–644. [Google Scholar] [CrossRef] [Green Version]
- Mortada, S.; Zoughaib, A.; Arzano-Daurelle, C.; Clodic, D. Boiling heat transfer and pressure drop of R-134a and R-1234yf in minichannels for low mass fluxes. Int. J. Refrig. 2012, 35, 962–973. [Google Scholar] [CrossRef]
- Oudah, M.H.; Mejbel, M.K.; Allawi, M.K. R134a flow boiling heat transfer (FBHT) characteristics in a refrigeration system. J. Mech. Eng. Res. Dev. 2021, 44, 69–83. [Google Scholar]
- Kim, S.-M.; Mudawar, I. Review of databases and predictive methods for heat transfer in condensing and boiling mini/micro-channel flows. Int. J. Heat Mass Transf. 2014, 77, 627–652. [Google Scholar] [CrossRef]
- Charnay, R. Experimental Study of Flow Boiling in Horizontal Minichannels at High Saturation Temperature. Doctoral Dissertation, INSA de Lyon, Villeurbanne, France, 2015. [Google Scholar]
- Kandlikar, S.G. Heat Transfer Mechanisms During Flow Boiling in Microchannels. J. Heat Transf. 2004, 126, 8–16. [Google Scholar] [CrossRef]
- Charnay, R.; Revellin, R.; Bonjour, J. Flow boiling characteristics of R-245fa in a minichannel at medium saturation temperatures. Exp. Therm. Fluid Sci. 2014, 59, 184–194. [Google Scholar] [CrossRef]
- Paul, S.; Fernandino, M.; Dorao, C.A. On the scaling of convective boiling heat transfer coefficient. Int. J. Heat Mass Transf. 2021, 164, 120589. [Google Scholar] [CrossRef]
- Dorao, C.A.; Fernandez, O.B.; Fernandino, M. Experimental Study of Horizontal Flow Boiling Heat Transfer of R134a at a Saturation Temperature of 18.6 °C. J. Heat Transf. 2017, 139, 111510. [Google Scholar] [CrossRef]
- Charnay, R.; Revellin, R.; Bonjour, J. Flow boiling heat transfer in minichannels at high saturation temperatures: Part I—Experimental investigation and analysis of the heat transfer mechanisms. Int. J. Heat Mass Transf. 2015, 87, 636–652. [Google Scholar] [CrossRef]
- Wang, L.; Chen, M.; Groll, M. Flow Boiling Heat Transfer Characteristics of R134a in a Horizontal Mini Tube. J. Chem. Eng. Data 2009, 54, 2638–2645. [Google Scholar] [CrossRef]
- Ali, R. Dryout Incipience and Critical Heat Flux in Saturated Flow Boiling of Refrigerants in a Vertical Uniformly Heated Microchannel. In Proceedings of the ASME 2008 6th International Conference on Nanochannels, Microchannels, and Minichannels, Darmstadt, Germany, 23–25 June 2008; pp. 1–8. [Google Scholar]
- van den Bergh, W.J.; Moran, H.R.; Dirker, J.; Markides, C.N.; Meyer, J.P. Effect of low heat and mass fluxes on the boiling heat transfer coefficient of R-245fa. Int. J. Heat Mass Transf. 2021, 180, 121743. [Google Scholar] [CrossRef]
- Hellenschmidt, D.; Petagna, P. Effects of saturation temperature on the boiling properties of carbon dioxide in small diameter pipes at low vapour quality: Heat transfer coefficient. Int. J. Heat Mass Transf. 2021, 172, 121094. [Google Scholar] [CrossRef]
- Greco, A.; Vanoli, G.P. Flow-boiling of R22, R134a, R507, R404A and R410A inside a smooth horizontal tube. Int. J. Refrig. 2005, 28, 872–880. [Google Scholar] [CrossRef]
- Celen, A.; Dalkılıç, A.S. A complete evaluation method for the experimental data of flow boiling in smooth tubes. Int. Commun. Heat Mass Transf. 2017, 89, 108–121. [Google Scholar] [CrossRef]
- Eckels, S.; Pate, M. An experimental comparison of evaporation and condensation heat transfer coefficients for HFC-134a and CFC-12. Int. J. Refrig. 1991, 14, 70–77. [Google Scholar] [CrossRef] [Green Version]
- Xu, Y.; Fang, X.; Li, G.; Li, D.; Yuan, Y. An experimental study of flow boiling heat transfer of R134a and evaluation of existing correlations. Int. J. Heat Mass Transf. 2016, 92, 1143–1157. [Google Scholar] [CrossRef]
- Guo, Q.; Li, M.; Tian, X. Experimental study on flow boiling heat transfer characteristics of R134a, R245fa and R134a/R245fa mixture at high saturation temperatures. Int. J. Therm. Sci. 2019, 150, 106195. [Google Scholar] [CrossRef]
- Grauso, S.; Mastrullo, R.; Mauro, A.; Thome, J.; Vanoli, G.P. Flow pattern map, heat transfer and pressure drops during evaporation of R-1234ze(E) and R134a in a horizontal, circular smooth tube: Experiments and assessment of predictive methods. Int. J. Refrig. 2013, 36, 478–491. [Google Scholar] [CrossRef]
- Saitoh, S.; Daiguji, H.; Hihara, E. Effect of tube diameter on boiling heat transfer of R-134a in horizontal small-diameter tubes. Int. J. Heat Mass Transf. 2005, 48, 4973–4984. [Google Scholar] [CrossRef]
- Balachander, P.; Raja, B. Investigation on the boiling heat transfer characteristics of R404A and R134a under stratified flow condition. Heat Mass Transf. 2015, 51, 825–835. [Google Scholar] [CrossRef]
- Dorao, C.A.; Drewes, S.; Fernandino, M. Can the heat transfer coefficients for single-phase flow and for convective flow boiling be equivalent? Appl. Phys. Lett. 2018, 112, 064101. [Google Scholar] [CrossRef]
- Mahmoud, M.M.; Karayiannis, T.G. Heat transfer correlation for flow boiling in small to micro tubes. Int. J. Heat Mass Transf. 2013, 66, 553–574. [Google Scholar] [CrossRef] [Green Version]
- Charnay, R.; Revellin, R.; Bonjour, J. Flow boiling heat transfer in minichannels at high saturation temperatures: Part II—Assessment of predictive methods and impact of flow regimes. Int. J. Heat Mass Transf. 2015, 87, 653–672. [Google Scholar] [CrossRef]
- Fang, X. A new correlation of flow boiling heat transfer coefficients based on R134a data. Int. J. Heat Mass Transf. 2013, 66, 279–283. [Google Scholar] [CrossRef]
- Bediako, E.G.; Dančová, P.; Vít, T. Experimental Study of Horizontal Flow Boiling Heat Transfer Coefficient and Pressure Drop of R134a from Subcooled Liquid Region to Superheated Vapor Region. Energies 2022, 15, 681. [Google Scholar] [CrossRef]
- Lemmon, E.; McLinden, M.; Huber, M. NIST Standard Reference Database 23-NIST Thermodynamic and Transport Properties Refprop, Version 7.0. 2002. Available online: https://www.nist.gov/publications/nist-standard-reference-database-23-nist-thermodynamic-and-transport-properties-refprop (accessed on 26 October 2021).
- Wojtan, L.; Ursenbacher, T.; Thome, J.R. Investigation of flow boiling in horizontal tubes: Part I—A new diabatic two-phase flow pattern map. Int. J. Heat Mass Transf. 2005, 48, 2955–2969. [Google Scholar] [CrossRef]
- Cooper, M.G. Heat Flow Rates in Saturated Nucleate Pool Boiling-A Wide-Ranging Examination Using Reduced Properties. Adv. Heat Transf. 1984, 16, 157–239. [Google Scholar] [CrossRef]
- Tran, T.N.; Wambsganss, M.W.; France, D.M. Small circular- and rectangular-channel boiling with two refrigerants. Int. J. Multiph. Flow 1996, 22, 485–498. [Google Scholar] [CrossRef]
- Bertsch, S.S.; Groll, E.A.; Garimella, S.v. Refrigerant flow boiling heat transfer in parallel microchannels as a function of local vapor quality. Int. J. Heat Mass Transf. 2008, 51, 4775–4787. [Google Scholar] [CrossRef] [Green Version]
- Warrier, G.R.; Dhir, V.K.; Momoda, L.A. Heat transfer and pressure drop in narrow rectangular channels. Exp. Therm. Fluid Sci. 2002, 26, 53–64. [Google Scholar] [CrossRef]
- Wattelet, J.P.; Chato, J.C.; Souza, A.L.; Christoffersen, B.R. Evaporative characteristics of R-134a, MP-39, and R-12 at low mass fluxes. 1993. Available online: http://www.ideals.illinois.edu/handle/2142/9736 (accessed on 7 October 2022).
- Liu, Z.; Winterton, R.H.S. A general correlation for saturated and subcooled flow boiling in tubes and annuli, based on a nucleate pool boiling equation. Int. J. Heat Mass Transf. 1991, 34, 2759–2766. [Google Scholar] [CrossRef]
- Kandlikar, S.G. A General Correlation for Saturated Two-Phase Flow Boiling Heat Transfer Inside Horizontal and Vertical Tubes. J. Heat Transf. 1990, 112, 219–228. [Google Scholar] [CrossRef]


| Author(s) | Fluid Type | Experimental Set Up | P_sat (kPa) | G (kg/m2s) | q’’ (kW/m2) | Effect of Saturation Pressure on HTC |
|---|---|---|---|---|---|---|
| Greco and Vanoli [15] | R134a | 6 mm ID, horizontal smooth tube, 6 m length | 300–1200 | 360 | 11–21 | Increases |
| Celen and Dalkiliç [16] | R134a | 8.62 mm ID horizontal smooth tube | 488.75–609.17 | 290–381 | 10–15 | Increases |
| Eckels and Pate [17] | R134a | 8.0 mm ID, horizontal smooth tube | 350–490 | 125–400 | 9.1 | Increases |
| Xu et al. [18] | R134a | 4.065 mm ID, Horizontal smooth tube | 578–820 | 185–935 | 18–35.5 | Increases |
| Grauso et al. [20] | R134a | 6 mm ID, horizontal smooth tube | 264.11–445.59 | 146–520 | 5–20.4 | Negligible |
| Guo et al. [19] | R134a | 10 mm ID, Horizontal smooth tube | 1379–3608.3 | 100–300 | 6–24 | Negligible |
| Saitoh et al. [21] | R134a | 3.1 mm ID, horizontal smooth tube | 350–488 | 150–450 | 5–39 | Negligible |
| Balachander and Raja [22] | R134a | 7.49 mm ID, horizontal smooth tube | 164–293 | 57–102 | 2–18 | Decreases |
| Variable | Symbol | Accuracy | Information |
|---|---|---|---|
| Mass flux | G | 0.2% of the reading | Given by supplier |
| Pressure drop | ΔP | 0.075% full scale (fs = 50 kPa) | Given by supplier |
| Absolute pressure | P | 0.04% full scale (fs = 25 bar) | Given by supplier |
| Temperature | T | 0.1 K | Inhouse calibration |
| Heat flux | q″ | 3% of the reading | Inhouse calibration |
| Parameter | Symbol | Error |
|---|---|---|
| Mass flux | G | ±10 kg/m2s |
| Inlet pressure | Pi | ±10 kPa |
| Inlet temperature | Ti | ±0.2 °C |
| Heat flux (all 5 zones) | q″ | ±<40 W |
| Working Condition | Unit | Range |
|---|---|---|
| Saturation Pressure | kPa | 460–660 |
| Mass flux | kg/(m2s) | 150–300 |
| Heat flux | kW/m2 | 8.26–23.3 |
| Vapor quality | - | 0.1–1.0 |
| Properties | Saturation Pressure (460 kPa) | Saturation Pressure (560 kPa) | Saturation Pressure (660 kPa) |
|---|---|---|---|
| Saturation temperature (oC) | 13.50 | 19.33 | 24.73 |
| Liquid density (kg/m3) | 1250.00 | 1227.8 | 1207.7 |
| Vapor density (kg/m3) | 22.397 | 27.2 | 32.1 |
| Liquid enthalpy (kJ/kg) | 217.92 | 226.5 | 234.16 |
| Vapor enthalpy (kJ/kg) | 406.06 | 409.4 | 412.2 |
| Liquid viscosity (Pa.s) | 2.258 × 10⁻⁴ | 2.09 × 10⁻⁴ | 1.96 × 10⁻⁴ |
| Vapor viscosity (Pa.s) | 1.1219 × 10⁻⁵ | 1.1462 × 10⁻⁵ | 1.1682 × 10⁻⁵ |
| Liquid conductivity (mW/m.K) | 86.247 | 83.572 | 81.251 |
| Vapor conductivity (mW/m.K) | 12.690 | 13.271 | 13.798 |
| Surface tension (mN/m) | 9.6121 | 8.7804 | 8.0669 |
| Experimental Condition | P460 kPa G150 kg/m2s q″ 8.26 kW/m2 | P460 kPa G150 kg/m2s q″ 23.3 kW/m2 | P460 kPa G300 kg/m2s q″ 8.26 kW/m2 | P460 kPa G300 kg/m2s q″ 23.3 kW/m2 | All Data at 460 kPa | |
|---|---|---|---|---|---|---|
| Cooper [30] | MRE % | −11.9 | 11.1 | −27.7 | 3.5 | −6.25 |
| MAE % | 0.2 | 8.4 | 14.1 | 11.2 | 8.48 | |
| Tran et al. [31] | MRE % | −67.0 | −61.4 | 8.0 | 43.7 | −19.18 |
| MAE % | 62.7 | 62.4 | 28.3 | 54.5 | 51.825 | |
| Bertsch et al. [32] | MRE % | −49.8 | −65.8 | −62.1 | −70.0 | −61.30 |
| MAE % | 50.6 | 69.1 | 56.6 | 67.2 | 60.88 | |
| Warrier et al. [33] | MRE % | −88.7 | −60.8 | −103.5 | −84.1 | −84.28 |
| MAE % | 94.7 | 59.0 | 99.4 | 95.6 | 87.18 | |
| Liu and Winterton [35] | MRE % | −19.2 | −41.0 | −15.4 | −19.5 | −23.78 |
| MAE % | 0.39 | 30.9 | 28.1 | 7.6 | 16.75 | |
| Wattelet et al. [34] | MRE % | 13.1 | 20.5 | 76.5 | 34.4 | 36.13 |
| MAE % | 3.1 | 10.7 | 7.8 | 14.4 | 9.0 | |
| Kandlikar [36] | MRE % | 38.6 | 52.8 | −7.8 | 74.4 | 39.5 |
| MAE % | 89.9 | 130.8 | 80.7 | 138.0 | 109.9 | |
| Experimental Condition | P560 kPa G150 kg/m2s q″ 8.26 kW/m2 | P560 kPa G150 kg/m2s q″ 23.3 kW/m2 | P560 kPa G300 kg/m2s q″ 8.26 kW/m2 | P560 kPa G300 kg/m2s q″ 23.3 kW/m2 | All Data at 560 kPa | |
|---|---|---|---|---|---|---|
| Cooper [30] | MRE % | 5.2 | 64.7 | −30.7 | 6.1 | 11.33 |
| MAE % | 11.4 | 1.3 | 7.0 | 1.3 | 5.25 | |
| Tran et al. [31] | MRE % | −61.8 | −44.4 | 0.6 | 43.3 | −15.58 |
| MAE % | 67.8 | 65.8 | 35.1 | 36.7 | 51.35 | |
| Bertsch et al. [32] | MRE % | −41.9 | −55.0 | −60.0 | −68.5 | −56.35 |
| MAE % | 57.2 | 71.3 | 54.0 | 71.2 | 63.43 | |
| Warrier et al. [33] | MRE % | −87.4 | −56.5 | −103.9 | −77.2 | −81.25 |
| MAE % | 94.9 | 56.8 | 99.2 | 86.9 | 84.45 | |
| Liu and Winterton [35] | MRE % | −22.0 | −19.7 | 0.9 | −27.2 | −17.0 |
| MAE % | 13.0 | 37.8 | 37.3 | 11.3 | 24.85 | |
| Wattelet et al. [34] | MRE % | 6.6 | 65.1 | −22.6 | 8.2 | 14.33 |
| MAE % | 9.9 | 1.6 | 3.3 | 3.7 | 4.63 | |
| Kandlikar | MRE % | 26.6 | 56.5 | 27.1 | 50.8 | 40.25 |
| MAE % | 72.8 | 117.2 | 102.1 | 115.3 | 101.85 | |
| Experimental Condition | P 660 kPa G150 kg/m2s q″ 8.26 kW/m2 | P 660 kPa G150 kg/m2s q″ 23.3 kW/m2 | P 660 kPa G300 kg/m2s q″ 8.26 kW/m2 | P 660 kPa G300 kg/m2s q″ 23.3 kW/m2 | All Data at 660 kPa | |
|---|---|---|---|---|---|---|
| Cooper [30] | MRE % | 2.8 | 110.4 | −27.4 | 33.1 | 29.73 |
| MAE % | 19.0 | 6.0 | 12.5 | 1.9 | 9.85 | |
| Tran et al. [31] | MRE % | −63.9 | −31.4 | 1.9 | 73.7 | −4.93 |
| MAE % | 71.6 | 69.3 | 22.9 | 28.1 | 47.98 | |
| Bertsch et al. [32] | MRE % | −42.9 | −41.5 | −56.8 | −64.4 | −51.4 |
| MAE % | 61.7 | 73.9 | 58.4 | 72.5 | 66.63 | |
| Warrier et al. [33] | MRE % | −87.0 | −48.1 | −104.1 | −76.7 | −78.98 |
| MAE % | 95.5 | 61.4 | 101.9 | 88.7 | 86.88 | |
| Liu and Winterton [35] | MRE % | −26.8 | −2.4 | 8.4 | −16.9 | −9.43 |
| MAE % | 21.8 | 44.4 | 42.3 | 16.4 | 31.22 | |
| Wattelet et al. [34] | MRE % | 4.2 | 110.9 | −18.2 | 35.3 | 33.05 |
| MAE % | 17.6 | 5.7 | 1.3 | 0.5 | 6.28 | |
| Kandlikar [36] | MRE % | 24.1 | 80.6 | 42.0 | 48.9 | 48.90 |
| MAE % | 61.9 | 101.7 | 86.2 | 115.1 | 91.23 | |
| Experimental Pressure | P 460 kPa | P 560 kPa | P 660 kPa | |||
|---|---|---|---|---|---|---|
| MRE % | MAE % | MRE % | MAE % | MRE % | MAE % | |
| Cooper [30] | −6.25 | 8.48 | 11.33 | 5.25 | 29.73 | 9.85 |
| Tran et al. [31] | −19.18 | 51.825 | −15.58 | 51.35 | −4.93 | 47.98 |
| Bertsch et al. [32] | −61.30 | 60.88 | −56.35 | 63.43 | −51.4 | 66.63 |
| Warrier et al. [33] | −84.28 | 87.18 | −81.25 | 84.45 | −78.98 | 86.88 |
| Liu and Winterton [35] | −23.78 | 16.75 | −17.0 | 24.85 | −9.43 | 31.22 |
| Wattelet et al. [34] | 36.13 | 9.0 | 14.33 | 4.63 | 33.05 | 6.28 |
| Kandlikar [36] | 39.5 | 109.9 | 40.25 | 101.85 | 48.90 | 91.23 |
Publisher’s Note: MDPI stays neutral with regard to jurisdictional claims in published maps and institutional affiliations. |
© 2022 by the authors. Licensee MDPI, Basel, Switzerland. This article is an open access article distributed under the terms and conditions of the Creative Commons Attribution (CC BY) license (https://creativecommons.org/licenses/by/4.0/).
Share and Cite
Bediako, E.G.; Dančová, P.; Vít, T. Flow Boiling Heat Transfer of R134a in a Horizontal Smooth Tube: Experimental Results, Flow Patterns, and Assessment of Correlations. Energies 2022, 15, 7503. https://doi.org/10.3390/en15207503
Bediako EG, Dančová P, Vít T. Flow Boiling Heat Transfer of R134a in a Horizontal Smooth Tube: Experimental Results, Flow Patterns, and Assessment of Correlations. Energies. 2022; 15(20):7503. https://doi.org/10.3390/en15207503
Chicago/Turabian StyleBediako, Ernest Gyan, Petra Dančová, and Tomáš Vít. 2022. "Flow Boiling Heat Transfer of R134a in a Horizontal Smooth Tube: Experimental Results, Flow Patterns, and Assessment of Correlations" Energies 15, no. 20: 7503. https://doi.org/10.3390/en15207503