Article

Coupling a Chlor-Alkali Membrane Electrolyzer Cell to a Wind Energy Source: Dynamic Modeling and Simulations

by
Krunalkumar Thummar
1,*,
Roger Abang
1,
Katharina Menzel
2 and
Matheus Theodorus de Groot
3,4
1
Department of Power Plant Technology, Faculty of Mechanical, Electrical and Energy-Systems Engineering, Brandenburg University of Technology (BTU) Cottbus-Senftenberg, Forschungszentrum 3E, Siemens-Halske-Ring 13, 03046 Cottbus, Germany
2
Nobian GmbH, 65926 Frankfurt am Main, Germany
3
HyCC, Van Asch van Wijckstraat 53, P.O. Box 2089, 3811 LP Amersfoort, The Netherlands
4
Department of Chemical Engineering and Chemistry, Eindhoven University of Technology, P.O. Box 513, 5600 MB Eindhoven, The Netherlands
*
Author to whom correspondence should be addressed.
Energies 2022, 15(2), 606; https://doi.org/10.3390/en15020606
Submission received: 17 November 2021 / Revised: 4 January 2022 / Accepted: 12 January 2022 / Published: 15 January 2022

Abstract

:
Renewable energy sources are becoming a greater component of the electrical mix, while being significantly more volatile than conventional energy sources. As a result, net stability and availability pose significant challenges. Energy-intensive processes, such as chlor-alkali electrolysis, can potentially adjust their consumption to the available power, which is known as demand side management or demand response. In this study, a dynamic model of a chlor-alkali membrane cell is developed to assess the flexible potential of the membrane cell. Several improvements to previously published models were made, making the model more representative of state-of-the-art CA plants. By coupling the model with a wind power profile, the current and potential level over the course of a day was simulated. The simulation results show that the required ramp rates are within the regular operating possibilities of the plant for most of the time and that the electrolyte concentrations in the cell can be kept at the right level by varying inlet flows and concentrations. This means that a CA plant can indeed be flexibly operated in the future energy system.

Graphical Abstract

1. Introduction

The share of renewable energy in the electricity market is increasing in countries all over the world. Germany has been a forerunner in the promotion of renewable energy over the last decade with the outspoken objective to achieve a great share of renewable energy in gross power generation of 80% by 2050 [1,2]. The increasing share of renewable energy in the electricity market is desirable for many reasons, such as reduced CO2 emissions, less dependence on crude oil and natural gas, long-term sustainability, and decentralized energy solutions [3]. On the other hand, it introduces its dynamic characteristics into the whole power grid. This raises new technical challenges, e.g., regarding net stability.
A flexible operation that is adjustable to actual energy availability, the so-called demand side management or demand response (DR), can be one strategy to stabilize the electricity grid. Instead of operating at a constant load, industrial plants can operate more profitably by operating at high loads during off-peak hours, when electricity is cheap, and store the product. Then, during times when electricity is expensive, they decrease their load and use their storage in order to supply customers with the product [4]. Demand response can be carried out at both short and long timescales. The fastest form of DR is control reserve power, in which the plant load is controlled by a signal from the virtual energy grid provider/grid operator to control the frequency of the grid to remain at 50 Hz on the high voltage (380 kV) grid [5].
Through demand response, energy-intensive industrial processes have a large potential role in electricity markets [6]. There are several industrial processes that rely on electricity as a primary feedstock, such as reverse osmosis plants and air separation units [7,8,9,10]. Peak power demand reduction at these plants can be substantial, and these processes can typically modulate their production rate quickly in response to price signals or requests from grid operators [11,12].
Another promising candidate for flexibilization is chlor-alkali (CA) electrolysis [6]. The production capacity of CA plants worldwide was 75 million metric tons of chlorine (Cl2) per year in 2017 according to the World Chlorine Council [13]. In Germany, the installed capacity of CA electrolysis is 1.484 GW. [3,14]. This accounts for 4.25% of the total industrial power consumption in Germany [8]. A typical CA process consumes 2.1–3 MWh of electricity per ton of Cl2, which represents 51–58% of the total Cl2 production cost [13,14,15]. The production rate and energy consumption of the CA process can be modulated rapidly by varying the current density. Yet, there are technical constraints of the whole system, which limit the flexibility of the process [12,15]. These include the requirement to keep the membrane wet and the maximum allowable chloride in caustic concentration. A too high ramp rate or a too low current density can potentially damage the electrolyzer cells.
A detailed understanding of the dynamic behavior of the process is essential in order to operate the CA electrolysis flexibly. Models can help in creating this understanding, but commonly used steady state models cannot assess the transient behavior of the process. For this reason, a dynamic model is needed to describe the transient response of the system and to understand the effects of different ramp rates of current density on the performance of the electrolyzer cell.
There are relatively few studies available on the modeling of CA electrolysis on cell and system levels. Within these studies, several models describe the diaphragm CA electrolysis technology, in which the anode and cathode are separated using a permeable asbestos diaphragm, instead of a cation-exchange membrane as in membrane CA electrolysis. This outdated technology requires a brine of lower purity, which reduces the complexity of the brine pre-treatment plant, but disadvantages are the large consumption of steam needed for concentrating caustic soda as well as the lower quality of the products (caustic soda and chlorine gas) [16,17].
Nagy et al. [18] developed a steady state mechanistic model for the calculation of material balance parameters, such as concentration of brine and caustic, flow rates and current efficiency losses in diaphragm CA electrolysis. Van Zee et al. [19] used a parameter estimation technique with a simple electrochemical model to predict the electrical energy cost for NaOH production. They also developed a steady state material balance model to predict a maximum in the relationship between the caustic yield and caustic effluent concentration of diaphragm-type cells. The model predictions were compared with experimental data by using nonlinear least squares regression techniques to estimate the diffusion coefficients of hydroxyl ions and protons and the specific conductivity of the electrolyte within the diaphragm [20]. Van Zee et al. [21] developed a spatially distributed dynamic material balance model for the same diaphragm cell. They additionally integrated mass transport of hydroxyl ions ( OH ) through the diaphragm. This model has shown how the concentration distribution of OH along the diaphragm length and the caustic concentration of the effluent changes when subjected to a step change of current density.
The use of selective cation-exchange membranes (CEM) instead of diaphragms is state of the art in CA electrolysis. The main advantage of the membrane technology is that it produces a very pure caustic soda solution and requires considerably less energy [16,22].
Chen et al. [23] presented a steady state model to predict the effect of the cell operating conditions on the caustic quality produced from a CA membrane cell by describing the mass transport of ionic species by diffusion, migration and electro-osmotic water convection. Chandra et al. [24] formulated steady state electrochemical, mass, and energy balances assuming both compartments of the electrolyzer are continuously stirred tank reactors (CSTRs). Cell voltage, electrical power demand, and the heat requirements of the cell were predicted and compared to data from bench scale cell experiments. Babu et al. [25] solved a mixed-integer nonlinear scheduling problem using a simplified steady-state model to show the economic benefit of DR for CA electrolysis. Richstein et al. [26] used a steady-state model to investigate the impact of different network tariffs and regulations on the flexibility of CA electrolysis. Mitsos et al. [13,27] and Roh et al. [8] studied another approach to increase the flexibility of CA electrolysis. They employed a quasi-stationary model of CA electrolysis to describe the operation with both a standard and an oxygen depolarized cathode for DR.
A number of studies have investigated the dynamic behavior of the membrane CA process. Agachi et al. [28] modeled dynamic electrochemical, mass and energy balances of membrane cells for process control. Dynamics of the cell voltage, anode compartment temperature and electrolytes exit concentrations with changing feed brine temperature were presented and verified with the data measured in an industrial plant. Budiarto et al. [29] presented a dynamic model of the CA membrane cell using electrochemical and mole balance equations under isothermal conditions for demand side management. The dynamic behavior of the total cell voltage and concentration of species at the exit of the cell were predicted as a function of current density. However, the electrochemical model was validated by comparing steady-state simulation data with published experimental data. The simulated cell voltage values were found to be in reasonable agreement with the experimental values.
The same approach was used by Baldea et al. [12] in an analysis of the potential economic benefits of load changes in a CA membrane process. In particular, they investigated the thermal behavior of the process by including energy balances in the model and showed that temperature constraints limit the load variations. Baldea et al. [30] later used their dynamic model to determine the optimal operation under varying electricity prices and also incorporated frequency-balancing in their framework in the context of DR. Simkoff et al. [7] identified a Hammerstein–Wiener model using the model developed by Baldea et al. [11] and utilized this surrogate model to manage load for the day-ahead and real-time markets. Weigert et al. [31] recently presented a detailed dynamic model of an industrial CA plant, which was successfully validated with real plant data for load variations of a typical magnitude in DR.
In the present work, steady state and dynamic simulation studies are carried out by using both an electrochemical and dynamic material balance model under isothermal conditions. The model includes migration through the membrane, OH transport from cathode to anode and the evaporation of water in the anolyte and catholyte as introduced in previous works [12,31]. In contrast to Baldea et al. [12] and Weigert et al. [31], our model includes oxygen evolution at the anode and employs recent values for electrochemical kinetic parameters (Tafel slope and exchange current density) instead of semi-empirical correlations for the anodic and cathodic activation overpotential equations to improve the precision of the electrochemical model. As opposed to some other models, our model is based on isothermal conditions due to advanced temperature control systems in modern chlor-alkali plants, where the temperature of both the anolyte and the catholyte inlet can be controlled easily. As a result, temperature is not a major limiting factor for flexibility.
The models can predict the transient behavior of the electrolyzer cell in terms of cell voltage, as well as outlet anolyte and catholyte concentration as a function of time. The model has been used to predict how a CA membrane cell can respond to electricity input based on a wind profile.
The CA electrolysis process is presented in the next section, followed by a description of the model. The steady-state and dynamic simulation results are presented and explained in Section 3. Finally, Section 4 provides a conclusion.

2. Materials and Methods

2.1. Description of the CA Membrane Electrolysis

As described in the section above, the CA membrane electrolysis is the current state-of-the-art electrolysis technology in which Cl 2 can be produced by using a cation-exchange membrane (CEM) [17,32]. A schematic representation of the membrane cell can be seen in Figure 1. The cell consists of anode and cathode compartments, which are separated by the CEM. An ultrapure saturated brine with a concentration of 300 gL 1 NaCl enters the anode compartment where the chloride ions are oxidized to produce Cl 2 (Equation (1)) and sodium ions migrate through the membrane to the cathode compartment [33,34].
An aqueous solution of 31 wt% NaOH is fed to the cathodic compartment, where water is reduced to H 2 and hydroxyl ions ( OH ) according to Equation (2). Together with the sodium ions, these hydroxyl ions form NaOH . The depleted brine (206.6 gL 1   NaCl ) and the concentrated NaOH solution (32.5 wt% NaOH ) are discharged from the anode and cathode compartments, respectively [35,36,37]. The overall cell reaction is given by Equation (3).
Anode :   Cl 1 2 Cl 2 ( g ) + e
Cathode :   H 2 O + e 1 2 H 2 ( g ) + OH
Overall   reaction :   NaCl ( aq ) + H 2 O ( l ) NaOH ( aq ) + 1 2 Cl 2 ( g ) + 1 2 H 2 ( g )
The formation of oxygen and chlorate contribute to current inefficiencies for chlorine gas production. The efficiency of the CEM is less than 100% in practice due to migration of OH ions through the membrane [34,38]. This increases the pH of the anolyte and results in some formation of oxygen on the anode as per Equation (4). Another minor side reaction is the formation of chlorate from chlorine dissolved in the anolyte [38,39,40]. It should be noted that, in a significant part of modern CA plants, the acidification of the anolyte is used to suppress oxygen and chlorate formation. We have decided not to include this in our model, since this has limited influence on the flexible operation of the plant and increases the model’s complexity.
2 OH 1 2 O 2 ( g ) + H 2 O + 2 e

2.2. Model Development

The developed model of the electrochemical cell for the chlor-alkali process contained an electrochemical model and a mole balance model. The model used differential algebraic equations (DAEs) and was a lumped parameter model, so spatial variations of the concentration and temperature inside the cell along the time were ignored. In the following subsections, the model equations for the various compartments of the cell are discussed.

2.2.1. Mole Balance Model

In order to calculate the molar flows of the anolyte, catholyte and the gas flows over the cell under different operating conditions, a dynamic mole balance was formulated for the anode, membrane and cathode compartments. Figure 2 shows various molar and volumetric flow rates inside the cell. It is assumed that the anode and cathode compartment behave as CSTRs.
  • Anode Compartment
In the anode compartment, sodium chloride (NaCl), water, chlorine gas ( Cl 2 ), oxygen ( O 2 ) and water vapor flows were dynamically calculated. The mole balance equations for the NaCl and water are given in Equations (5) and (6):
dn an , NaCl dt = n ˙ an , NaCl in n ˙ an , NaCl out n ˙ an , NaCl cons [ mol / s ]
dn an , H 2 O dt = n ˙ an , H 2 O in n ˙ an , H 2 O out n ˙ an , H 2 O mem n ˙ an , H 2 O , g out + 2 × n ˙ an , O 2 , g out [ mol / s ]
where n ˙ an , NaCl in , n ˙ an , H 2 O in , n ˙ an , NaCl out , n ˙ an , H 2 O out are the anode inlet and outlet molar flow rates of sodium chloride and water, respectively. n ˙ an , NaCl cons is the sodium chloride consumption during the electrolysis; n ˙ an , H 2 O mem is the molar flow rate of the water through the membrane; n ˙ an , O 2 , g out is the molar flow rate of oxygen gas (Equation (4)); and n ˙ an , H 2 O , g out is the molar flow rate of water vapor in the chlorine gas.
In the cation-exchange membrane (CEM), sodium ions ( Na + ) and water molecules are transported by electro-osmotic drag, diffusion and convection. The flow of Na + ions in an electrical field is accompanied by an electro-osmotic flow of water in the same direction. At the current densities at which the chlor-alkali process is typically operated, the influence of the electrical-potential-driven water transport (electro-osmotic drag) is significantly higher than the diffusion- and pressure-driven transport (diffusion and convection) [23,41,42,43]. In this work, it was assumed that there is no pressure drop between the anode and cathode compartment, so the pressure-driven transport was neglected. The diffusion of water was also neglected.
Thus, the molar flow rate of water and sodium ion ( n ˙ an , H 2 O mem , n ˙ an , Na + mem ) through CEM can be expressed in Equations (8) and (9), in terms of only the electro-osmosis drag process:
ζ   = t Na + = ( 1 t OH )
n ˙ an ,   Na + mem = ζ · t Na + · i · A F [ mol / s ]
n ˙ an , H 2 O mem = ζ · t Na + · t H 2 O · i · A F [ mol / s ]
where t Na + is the transport number of Na + , which equals the membrane permselectivity ( ζ ). A value for t Na + of 0.96 was used for this study (Equation (7)). t H 2 O is the water transport number ( mol H 2 O / mol Na + ) , which is defined as the number of moles of water transported per mole of Na + . The value of t H 2 O was experimentally found to depend on the temperature and electrolyte concentration [23], but is typically approximately 4.1 [43,44,45,46], which is also assumed in this work.
In the cell, the feed sodium chloride NaCl is consumed by the sodium ion transport through the membrane and reaction of chloride ions ( Cl ) to form Cl 2 at the anode according to Equation (10):
n ˙ an , NaCl cons = n ˙ an , Na + mem = n ˙ an , Cl [ mol / s ]
The molar flow rate of sodium chloride consumption ( n ˙ an , NaCl cons ) and chlorine gas ( n ˙ an , Cl 2 , g out ) can be calculated with Faraday’s law according to Equations (11) and (12), where F is Faraday’s constant, A is the effective area of electrode, ζ is the faradaic efficiency, and i is the current density:
n ˙ an , NaCl cons = ζ · i · A F [ mol / s ]
n ˙ an , Cl 2 , g out = ζ · i · A 2 · F [ mol / s ]
The model assumed that the faradaic efficiency is 96 % , resulting from back transport of OH ions through membrane [34]. This leads to oxygen evolution at the anode compartment (Equation (4)) [47,48]. Hence, the outlet molar flow rate of oxygen gas n ˙ an , O 2 , g out is expressed by Equation (13), where n ˙ cat , OH back is the molar flow rate of back transported OH   ions as given in Equation (37).
n ˙ an , O 2 , g out = n ˙ cat , OH back 4 = ( 1 ζ ) · i · A 4 · F [ mol / s ]
The produced chlorine and oxygen gas were saturated with water vapor. The assumption made here was that the rate of production of oxygen gas n ˙ an , O 2 , g out is less than the rate of generation of chlorine gas. Therefore, we neglected oxygen vapor pressure and the saturated water vapor in the oxygen gas flow [12,34,38]. The partial pressure of the saturated water vapor p an , H 2 O , g sat , out above the aqueous solution of NaCl is given by Equation (14) [22,49], where P an is the total pressure inside the anode, which is sum of the partial pressure of the chlorine gas p an , Cl 2 , g out and saturated water vapor p an , H 2 O , g sat , out :
p an , H 2 O , g sat , out = [ n   an , H 2 O , g out n   an , Cl 2 , g out ] ·   p an , Cl 2 , g out [ bar ]
p an , Cl 2 , g out = P an   p an , H 2 O , g sat , out [ bar ]
The water vapor pressure p an , H 2 O , g sat , out can be calculated from the relation proposed in Equation (16), where p H 2 O , g * is the vapor pressure of pure water, which can be calculated from Equation (17) using the Antoine equation [34]. The parameters, b, c and d are provided in Table 1.
p an , H 2 O , g sat , out = ( 1 R NaCl · y an ,   NaCl out ) · p H 2 O , g * [ bar ]
p H 2 O , g * = ( 1 760 ) · 10 ( b ( d / ( ( T + 273.15 ) e )   ) ) [ bar ]
R NaCl is the fractional lowering of vapor pressure of the pure water due to dissolved NaCl in the anolyte and it can be expressed by Equation (18) [50]. y an ,   NaCl out is the molality of NaCl in brine at the outlet of anode, which is given in Equation (19), where ρ an ,   ( NaCl + H 2 O ) out is the outlet brine density as expressed in Equation (27). M W , NaCl is the molecular weight of NaCl.
R NaCl = ( y an ,   NaCl out 3 ) · [ 0.0019772 0.00001193 · T ] + 0.035
y an ,   NaCl out = ( C an , NaCl out · 1000 ρ an ,   ( NaCl + H 2 O ) out C an , NaCl out ·   M W , NaCl ) [ mol   kg 1 water ]
Equation (20) can now be used for the calculation of the water vapor molar flow rate n ˙ an , H 2 O , g out .
n ˙ an , H 2 O , g out = [ n ˙ an , Cl 2 , g out · p an , H 2 O , g sat , out ( P an   p an , H 2 O , g sat , out ) ] [ mol / s ]
The mass flow rate of the NaCl ( m ˙ an , NaCl out ) and water ( m ˙ an , H 2 O out ) at the outlet of the anode compartment can be written in Equations (21) and (22), which are obtained from Equations (5) and (6), respectively, where m ˙ an , NaCl in , m ˙ an , H 2 O in , m ˙ an , NaCl out , m ˙ an , H 2 O out are the anode inlet and outlet mass flow rates of sodium chloride and water, respectively, whereas m ˙ an , H 2 O react is the mass flow rate of reacted water at anode for the evolution of oxygen gas:
dm an , NaCl out dt = m ˙ an , NaCl in m ˙ an , NaCl out m ˙ an , NaCl cons [ g / s ]
dm an , H 2 O out dt = m ˙ an , H 2 O in m ˙ an , H 2 O out m ˙ an , H 2 O mem m ˙ an , H 2 O , g out m ˙ an , H 2 O react [ g / s ]
The total outlet mass flow rate at the anode ( m ˙ an , NaCl + H 2 O out ) can be expressed in Equation (23) by adding the terms m ˙ an , NaCl out and m ˙ an , H 2 O out , which are calculated by solving Equations (21) and (22). The outlet volume flow rate of brine Q ˙ an out can be calculated from the relation proposed in Equation (24). The densities of brine at the inlet and outlet of the anode compartment were assumed to be the same to reduce complexity.
m ˙ an , NaCl + H 2 O out = m ˙ an , NaCl out + m ˙ an , H 2 O out [ g / s ]  
Q ˙ an out = { m ˙ an , NaCl + H 2 O out / ρ an ,   ( NaCl + H 2 O ) out } [ L / s ]  
The change in concentration of sodium chloride C an ,   NaCl out at the outlet of the anode compartment can be obtained by Equation (25), where C an ,   NaCl in and C an ,   NaCl out are the concentrations in mol / L of NaCl in the brine at the inlet and outlet of the anode, respectively. Q ˙ an in and Q ˙ an out are the inlet and outlet volume flow rates of brine ( L / s ), respectively; t is the time (s); and V an is the volume of the anode compartment ( L ) .
dC an ,   NaCl out dt = ( Q ˙ an in · C an , NaCl in Q ˙ an out · C an ,   NaCl out ) n ˙ an , NaCl cons V an [ mol / L · s ]
The outlet concentration of NaCl ( W an , NaCl out ) in wt% can be calculated from C an ,   NaCl out with the help of Equation (26), where ρ an ,   ( NaCl + H 2 O ) out is the outlet density of brine, which can be obtained from the empirical expressions given in Equations (27)–(30) [34,51,52,53].
W an , NaCl out = C an ,   NaCl out   · M W , NaCl   ρ an , NaCl + H 2 O out   [ wt % ]
ρ an , NaCl + H 2 O out =   b NaCl +   d NaCl · { 0.01 ·   W an , NaCl out } +   e NaCl ·   { 0.01 · W an , NaCl out } 2   [ g / L ]
  b NaCl = 1.0004075 0.71687895 · 10 5 · T 0.51792075 · 10 5 · T 2 + 0.1054032 · 10 7 · T 3
  d NaCl = 0.0074569085 0.2960572 · 10 4 · T + 0.30564225 · 10 6 · T 2 0.934493315 · 10 9 · T 3
  e NaCl = 0.18372605 · 10 4 + 0.42360185 · 10 6 · T 0.51483125 ·   10 8 · T 2 + 0.1794537 · 10 10 · T 3
The exit concentration of water in the anolyte ( C an , H 2 O out ) is calculated based on the outlet density of brine and concentration of NaCl ( W an , NaCl out ) as given in Equation (31) [34,51].
C an , H 2 O out = 1000 · ρ an ,   ( NaCl + H 2 O ) out M W , H 2 O · ( 100   W an , NaCl out 10 , 000   )   [ mol / L ]
  • Cathode Compartment
In the cathode compartment, caustic (NaOH), water, hydrogen gas ( H 2 ), and water vapor flows were dynamically calculated. At the cathode, water is reduced to produce H 2 and hydroxyl ions ( OH ). Together with the sodium ions ( Na + ), which migrate through the membrane, these hydroxyl ions ( OH ) form caustic (Figure 1). The mole balance equations for the NaOH and water are given in Equations (32) and (33), where n ˙ cat , NaOH in , n ˙ cat , H 2 O in , n ˙ cat , NaOH out ,   and   n ˙ cat , H 2 O out are the cathode inlet and outlet molar flow rates of caustic and water, respectively. n ˙ cat , NaOH prod is the produced caustic during the electrolysis; n ˙ an , H 2 O mem is the molar flow rate of the water through the membrane; n ˙ cat , H 2 O , g out is the molar flow rate of water vapor in the hydrogen gas; and n ˙ cat , H 2 O cons is the water consumption during the electrolysis.
dn cat , NaOH out dt = n ˙ cat , NaOH in n ˙ cat , NaOH out + n ˙ cat , NaOH prod [ mol / s ]  
dn cat , H 2 O out dt = n ˙ cat , H 2 O in n ˙ cat , H 2 O out n ˙ cat , H 2 O cons + n ˙ an , H 2 O mem n ˙ cat , H 2 O , g out [ mol / s ]
The molar flow rate of the decomposed water ( n ˙ cat , H 2 O cons ) and hydrogen gas ( n ˙ cat , H 2 , g out ) can be calculated with Faraday’s law according to Equations (34) and (35):
n ˙ cat , H 2 O cons = i · A F [ mol / s ]
n ˙ cat , H 2 , g out = i · A 2 · F [ mol / s ]
Similarly, the molar flow rate of produced caustic n ˙ cat , NaOH prod is given by Equation (36), where n ˙ cat , OH prod is the molar flow rate of hydroxyl ions ( OH ), which are produced at the cathode due to decomposition of water, and n ˙ an , Na + mem is the molar flow of sodium ion transport through the membrane.
n ˙ cat ,   NaOH prod = n ˙ an , Na + mem = n ˙ cat , OH prod = ζ · i · A F [ mol / s ]  
As the faradaic efficiency ( ζ ) was assumed to 96 % ; the OH back transport through the membrane from cathode to anode compartment occurs and the molar flow rate of back transported OH ( n ˙ cat , OH back ) are given in Equation (37). Due to the relatively low OH back transport, the water transport accompanying the OH -ions was neglected.
n ˙ cat , OH back = ( 1 ζ ) · i · A F [ mol / s ]
The produced hydrogen gas was saturated with water vapor. The partial pressure of the saturated water vapor p cat , H 2 O , g sat , out above the caustic solution ( NaOH + H 2 O ) is given by Equation (38) [22,49], where P cat is the total pressure inside the cathode, which is the sum of the partial pressure of the hydrogen gas p cat , H 2 , g out and the saturated water vapor p cat , H 2 O , g sat , out .
p cat , H 2 O , g sat , out = [ n ˙ cat , H 2 O , g out n ˙ cat , H 2 , g out ] ·   p cat , H 2 , g out [ bar ]
p cat , H 2 , g out = P cat   p cat , H 2 O , g sat , out [ bar ]
The saturated water vapor pressure p cat , H 2 O , g sat , out can be calculated from the relation proposed in Equation (40), where p H 2 O , g * is the vapor pressure of pure water, which can be calculated from Equation (17) using the Antoine equation [34]. R NaOH is the fractional lowering of vapor pressure of pure water due to the dissolved NaOH in the catholyte and it can be calculated with using Equation (41) [50].   y cat , NaOH out is the molality of NaOH in caustic at the outlet of cathode, which is given in Equation (42), where ρ cat ,   ( NaOH + H 2 O ) out is the outlet density of caustic solution and is expressed in Equation (50). M W , NaOH is the molecular weight of NaOH.
p cat , H 2 O , g sat , out = ( 1 R NaOH · y cat , NaOH out ) · p H 2 O , g * [ bar ]
R NaOH = { [ 0.0317 + ( 174 T ) ] · [ 8.6715 · 10 5 + 3.368 · 10 5 · ( y cat , NaOH out ) + ( 7.88 · 10 5 / y cat , NaOH out ) 1.354 · 10 6 · ( y cat , NaOH out ) 2 ] }
y cat , NaOH out = ( C cat , NaOH out · 1000 ρ cat ,   ( NaOH + H 2 O ) out C cat , NaOH out ·   M W , NaOH ) [ mol   kg 1 water ]  
Hence, Equation (43) results for the calculation of the water vapor molar flow rate n ˙ cat , H 2 O , g out .
n ˙ cat , H 2 O , g out = [ n ˙ cat , H 2 , g out · p cat , H 2 O , g sat , out ( P cat   p cat , H 2 O , g sat , out ) ] [ mol / s ]
The mass flow rate of the NaOH   ( m ˙ cat , NaOH out ) and water ( m ˙ cat , H 2 O out ) at the outlet of the cathode compartment can be written in Equations (44) and (45), which are obtained from Equations (32) and (33), respectively, where m ˙ cat , NaOH in , m ˙ cat , H 2 O in , m ˙ cat , NaOH out ,   and m ˙ cat , H 2 O out are the cathode inlet and outlet mass flow rates of caustic and water, respectively.
dm cat , NaOH out dt = m ˙ cat , NaOH in m ˙ cat , NaOH out + m ˙ cat , NaOH prod [ g / s ]
dm cat , H 2 O out dt = m ˙ cat , H 2 O in m ˙ cat , H 2 O out m ˙ cat , H 2 O cons + m ˙ an , H 2 O mem m ˙ cat , H 2 O , g out [ g / s ]
The total outlet mass flow rate at cathode ( m ˙ cat , NaOH + H 2 O out ) can be expressed by adding the terms m ˙ cat , NaOH out and m ˙ cat , H 2 O out in Equation (46), which are calculated by solving Equations (44) and (45). The outlet volume flow rate of caustic solution Q ˙ cat out can be calculated from the relation proposed in Equation (47), where ρ cat ,   ( NaOH + H 2 O ) out is the outlet density of caustic solution and is expressed in Equation (50). The densities of caustic solutions at the inlet and outlet of the cathode compartment were assumed to be the same to reduce complexity.
m ˙ cat , NaOH + H 2 O out = m ˙ cat , NaOH out + m ˙ cat , H 2 O out [ g / s ]  
Q ˙ cat out = { m ˙ cat , NaOH + H 2 O out / ρ cat ,   ( NaOH + H 2 O ) out } [ L / s ]  
The change in concentration of caustic C cat ,   NaOH out at the outlet of the cathode compartment can be obtained by Equation (48), where C cat ,   NaOH in and C cat ,   NaOH out are the concentrations of NaOH in the caustic solution at the inlet and outlet of the cathode, respectively ( mol / L ). Q ˙ cat in and Q ˙ cat out are the inlet and outlet volume flow rates of caustic solution ( L / s ), respectively; t is the time (s); and V cat is the volume of cathode compartment (L).
dC cat ,   NaOH out dt = ( Q ˙ cat in · C cat ,   NaOH in Q ˙ cat out · C cat ,   NaOH out ) + n ˙ cat , NaOH prod   V cat [ mol / L · s ]
The outlet concentration of NaOH ( W cat , NaOH out ) in terms of wt% can be calculated from C cat ,   NaOH out with the help of the expression given in Equation (49), where ρ cat , NaOH + H 2 O out is the outlet density of the caustic solution, which can be obtained from the empirical expression given in Equations (50)–(54) [34,41,51].
W cat , NaOH out = C an ,   NaOH out   · M W , NaOH   ρ an , NaOH + H 2 O out [ wt % ]
ρ cat , NaOH + H 2 O out =   b NaOH +   d NaOH · { 0.01 ·   W cat , NaOH out } +   e NaOH ·   { 0.01 · W cat , NaOH out } 2 +   f NaOH · { 0.01 · W cat , NaOH out } 3 [ g L ]
  b NaOH = 1.00224925 0.116831975 · 10 3 · T 0.3210971 · 10 5 · T 2
d NaOH = 0.01148599 0.319841025 · 10 4 · T + 0.21510285 · 10 6 · T 2
e NaOH = 0.19658565 · 10 5 + 0.761527825 · 10 6 · T 0.61560685 ·   10 8 · T 2
  f NaOH = 0.334691125 · 10 6 + 0.7552771 · 10 8 · T 0.661632323 ·   10 10 · T 2
The exit concentration of water in the anolyte ( C cat , H 2 O out ) is calculated based on the outlet density of brine and the concentration of NaCl ( W cat , NaOH out ) as given in Equation (55).
C cat , H 2 O out = 1000 · ρ cat ,   ( NaOH + H 2 O ) out M W , H 2 O · ( 100   W cat , NaOH out 1000   )   [ mol L ]
By setting the dynamic terms on the left of Equations (21), (22), (25), (44), (45) and (48) to zero, the steady-state behavior of the CA membrane cell can be modeled.

2.2.2. Electrochemical Model

An electrochemical cell can be operated in either the galvanostatic mode or potentiostatic mode. When it is operated in the potentiostatic mode, the potential is the input value and the power conversion system applies the required current to reach that potential. The majority of commercially available cells are run in the galvanostatic mode, meaning that the current is the input value, while the power conversion system applies the required potential to reach that current [34]. The operating voltage of a cell E cell is expressed in Equation (56), where E rev is the reversible voltage, E act is the activation overpotential and E ohm is the ohmic overpotential.
E cell =   E rev + E act +   E ohm  
  • Reversible Voltage
The reversible voltage E rev is the minimum voltage required to make the electrochemical reactions (Equations (1) and (2)) occur. It is given by the difference between the thermodynamic potential E 0 , th of the anode and cathode.
E rev =   E 0 , th , an   E 0 , th , cat
These potentials ( E 0 , th , an and E 0 , th , cat ) vary with temperature, pressure and the activities of NaCl and NaOH according to the Nernst expression given in Equations (58) and (59) for anode and cathode, respectively [24,54,55], where E st , an 0 and E st , cat 0 are the standard electrode potentials, which have a combined value of 2.1884 V at 25 °C [56].
Hence, the reversible voltage E rev can be estimated from Equation (60):
E 0 , th , an = E st , an 0 + R · T n · F · ln ( a OX a RED ) = 1.3595 0.001248   · ( T   25 ) + R · ( T + 273.15 ) F · ln ( p cat , Cl 2 , g out a an , NaCl )
E 0 , th , cat =   E st , cat 0 + R · T n · F · ln ( a OX a RED ) = 0.8280 0.000033 ·   ( T   25 ) + R · ( T + 273.15 ) F · ln ( a cat ,   H 2 O a cat , NaOH · p cat , H 2 , g out )
E rev = 2.1884 0.001215 ·   ( T 25 ) + R · ( T + 273.15 ) F · ln ( a cat , NaOH · p cat , H 2 , g out · p cat , Cl 2 , g out a cat ,   H 2 O · a an , NaCl )
where a cat ,   H 2 O is the water activity in the catholyte, a an , NaCl is the activity of NaCl in the anolyte and a cat , NaOH represents the activity of NaOH in the catholyte.
The activity is a function of temperature and concentration, and it can be estimated from the mean activity coefficients of NaCl and NaOH [38,55,56]. The following empirical expressions can be used to calculate the mean activity coefficient of NaOH , γ NaOH [57,58]:
log ( γ NaOH ) = b ·   y cat , NaOH / ( 1 + 2 y cat , NaOH ) + d · y cat , NaOH + e · y cat ,   NaOH 2 + f · y cat , NaOH 3 + g · y cat , NaOH 4 ( for   y cat , NaOH < 12   )
The constants b , d , e ,   f , and ,   g are given by the following expressions:
b = 0.00144 · T + 0.46 ( for   40 <   T < 100   )
d = 0.0065 + 0.0016 · T 1.8 ·   10 5 · T 2  
e = 0.014 0.0005 · T + 5.6 ·   10 6 · T 2
f = 0.0006 + 5 ·   10 5 · T 6.48 ·   10 7 · T 2
g = 5 ·   10 6 1.81 ·   10 6 · T + 2.4 ·   10 8 · T 2
The following empirical expressions can be used to calculate the mean activity coefficient of NaCl ( γ NaCl ) , which is a function of anolyte concentration ( y an , NaCl ) [24]:
γ NaCl = 0.50 · e ( 0.112 · y an , NaCl ) ( for   3.5 < y an , NaCl < 6 )
  • Activation Overpotential
The activation overpotential E act of the cell can be calculated from Equation (68). The linear relationship between the overpotentials ( η an , η cat ) and the logarithm of current density is characterized by the Tafel slopes ( k an , Cl 2 , k cat , H 2 ) and exchange current densities ( i 0 , an , Cl 2 , i 0 , cat , H 2 ) :
E act =   η an + η cat =   k an , Cl 2 · log ( i i 0 , an , Cl 2 ) +   k cat , H 2 · log ( i i 0 , cat , H 2 )
These kinetic parameters are greatly dependent on the materials and porosity of the electrodes, the electrolyte concentration and the pH of the solution and temperature [44,59]. A Tafel slope ( k an , Cl 2 ) of 0.030–0.040 V is reported for the chlorine evolution reaction on DSA® (dimensionally stable anode) electrodes in 5 M NaCl at 80–90 °C [60]. The exchange current density ( i 0 , an , Cl 2 )   for the chlorine evolution on DSA® is 1.2 mAcm 2 at 90 °C [24,61]. The kinetic data for the hydrogen evolution reaction (HER) were taken from the data presented in [62,63]. A Tafel slope ( k cat , H 2 ) of 0.05 V and an exchange current density ( i 0 , cat , H 2 ) of 3.0 mAcm 2 have been reported for the HER on activated cathode. The values are valid for Raney Nickel cathodes (Ni coated with Ni-Al) in this model, which are known to have an excellent corrosion resistance as well as mechanical stability in concentrated NaOH solutions [34].
  • Ohmic Overpotential
The ohmic overpotential E ohm results from the ohmic resistance of electrolyte, membrane and electrode [34]. The ohmic overpotential is linearly proportional to the current ( I ) :
E ohm = E elec +   E mem +   E eled = ( R elec + R mem + R eled ) · I
Here, R elec , R mem ,   and   R eled are the resistances of the electrolyte, membrane and electrodes, respectively, and E elec , E mem ,   and   E eled are the corresponding contributions to the ohmic overpotential.
The voltage losses E eled associated with the flow of electrons through the electrode material is ignored in this model due to the lack of substantial electrode material data in the open literature. The voltage drops in the electrolytes E elec is given by:
E elec = ( R elec ) · I = l · i K elec  
where l is the length of the resistance, which corresponds to the distance between electrode and membrane. K elec represents the electrical conductivity of electrolytic solution. It corresponds to the conductivity of brine and caustic solution, which are reported and summarized in [24,32].
A zero-gap electrode cell configuration is considered in this model. For this type of cell configuration, the distance between anode membrane and membrane cathode is close to zero and therefore the expected voltage losses in the anolyte and catholyte ( E elec ) are very small. The value of E elec was assumed to be 0.02 V in this work, based on a previously reported value [64].
The dominant contribution to E ohm is the membrane resistance ( R mem ), caused by resistance to the ion flow through the membrane. The R mem is not only a function of the electrolyte concentration, but also of the temperature and current density [23,38]. In this model, it is assumed that the R mem varies only with respect to temperature and current density, whereas it remains constant at any given value of electrolyte concentration.
The ohmic drop across a CEM, which is also known as membrane potential ( E mem ), can be expressed as follows, based on the empirical equation given in [28]:
E mem = ( R mem ) · I   = { 2.6125   ·   10 4 1.75   ·   10 6 · T } · i  

2.2.3. Controllers

The model considers two PI controllers [65] to regulate the exit concentration of electrolytes, as seen in Figure 1. Table 2 presents the pairing and parameterization of the implemented controllers.
The anolyte exit concentration ( X an ,   NaCl out ) is controlled by modulating the brine input volumetric flow rate ( Q ˙ an in ), whereas the water feed rate in the catholyte ( Q ˙ cat , water in ) is adjusted with the current density to control the exit caustic concentration ( W cat , NaOH out ).

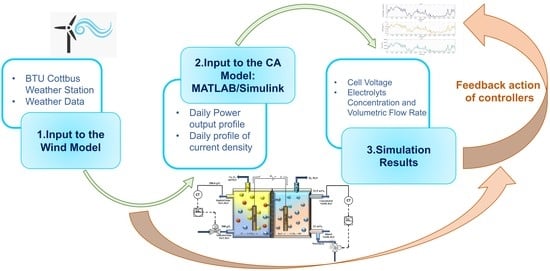
2.3. Input Parameters and Simulation Approach

The values of the input parameters used in the model as well as the values of the Tafel slope and exchange current density for anode and cathode are listed in Table 3.
The flow chart in Figure 3 depicts the series of steps that were taken to calculate the process parameters iteratively. The governing equations were implemented and solved using the MATLAB Simulink TM environment (The MathWorks Inc., Natick, MA, USA, version used: R2020a). The flow chart of the MATLAB program was used to determine the change of cell voltage, electrolyte concentration and volume flow rate of the outlet streams as a function of time.

3. Results and Discussion

3.1. Steady State Simulations

The model was solved by using the input parameters, which were presented in Table 3. The model run with the same operating conditions as reported previously [12,64,66,67]: 23 wt% NaCl, 32 wt% NaOH and 85 °C. Figure 4 graphically represents the values of the total cell voltage E cell and membrane potential E mem predicted by this model as compared with experimentally measured values [64,66,67] and published model values [12]. It can be observed in Figure 4a that our model shows significantly lower cell voltages than the data of [67]. The reason is that the CA process has significantly developed since 1990 through improved catalysts and membranes, resulting in lower cell potentials. However, the communication on these lower cell voltages has been limited to dedicated chlor-alkali conferences [67] with no publications in scientific journals. Nevertheless, based on the limited available data, it can still be said that our model is representative of modern chlor-alkali electrolyzers.
Figure 4b indicates an excellent match between the experimental [67] and model predicted values of E mem , as the line of experimental and the predicted values have the same slope of 0.110 and 0.112 ( Vm 2 / kA ) , respectively. The only difference is that the experimental data show an offset at the axis of membrane potential E mem (y-axis), which is the result of the different solutions on both sides of the membrane.
A steady state simulation for the flows and concentrations in the CA membrane as a function of current density was also carried out as shown in Figure 5. It can be seen that the outlet concentration of NaCl decreases, as the current density is increased, whereas the outlet NaOH concentration increases (Figure 5a). The outlet volumetric flow rate of catholyte increases owing to electro-migration phenomena (Figure 5b).

3.2. Dynamic Simulations

The model was used to investigate the effects of load variations with a ramp rate of 0.1 (1 kA   m 2 in 10 min), 0.2 (1 kA   m 2 in 5 min), 0.4 (1 kA   m 2 in 2.5 min), and 1 (1 kA   m 2 in 1 min) kA   m 2   min 1 on the cell performance. The input parameters listed in Table 3 were employed for these transient simulations. As the composition controllers were turned off, the electrolyte inlet concentrations and volumetric flow rates for both compartments were held constant throughout the simulation. The temporal variations in the electrolytes concentration and cell voltage were plotted to elucidate the dynamic response of the cell and are discussed in the section.
Figure 6 and Figure 7 illustrate the dynamic characteristics of the anolyte and catholyte outlet concentrations as a function of time following a ramp up and ramp down in current density, respectively. As shown in Figure 6a, the outlet NaCl concentration falls as the current density increases from 3 to 6 kA   m 2 , while the outlet NaOH concentration is increased (Figure 6b). The rate of NaCl depletion in anolyte is higher at a fast ramp rate (1 kA m−2min−1) than at a slow ramp rate (0.1 kA m−2min−1). This can be attributed to electromigration phenomena, which is a function of applied current density (Equations (7) and (8)), and as a consequence, a rapid mass transport of Na + ions and water across the membrane is attained at fast ramp rate in contrast to the slower ramp rate. Therefore, the rate of change of NaOH concentration in the catholyte is faster, and the time required to reach a steady state value is shorter as compared to slow ramp rate. Figure 7 likewise depicts the opposite trajectory, when the load is ramped down.
Figure 8a shows that the cell voltage ( E cell ) initially rises quickly with the current density, then gradually increases to the steady state level. This is because the activation ( E act ) and ohmic ( E ohm ) overpotentials directly responds to the current density increase, whereas the reversible potential responds to the changing electrolyte concentration, as shown in Figure 9. As the current density is increased, the anolyte concentration gradually decreases while the catholyte concentration increases in a continuous manner. Consequently, the reversible potential ( E rev ) increases (Figure 9), causing the cell voltage to smoothly raise to the steady state value. Figure 8b shows the opposite result once the load is scaled down.

3.3. Simulation with Wind Power Profile

In this section, the model was used to simulate the dynamics of a chlor-alkali (CA) electrolysis cell based on a 24 h wind power profile. Although it is not expected that CA plants in the future will be directly coupled to wind farms, it is likely that power prices will be linked to the supply of renewable electricity and therefore there will be an economic incentive for the CA plant to try to follow this supply. In this simulation, the electrolyte’s outlet concentration was controlled to maintain a constant value.
Figure 10a depicts the wind power output profile utilized in the simulation. Wind power output was calculated using 2006 meteorological data with a ten-minute precision. The data were collected by the Brandenburg University of Technology’s weather station. Figure 10b,c illustrate the resulting current density profile and the associated transient response of the cell voltage. The current density (Figure 10b) follows a similar pattern as the power output during the 24 h period with a maximum of 6 kA   m 2 after 3 h.
The ramp rate profile of current density (rate of change of current density) over the course of a day is presented in Figure 11. It can be observed that at the end of the day, the highest ramp rate (positive and negative) of 0.28 kA   m 2   min 1 was obtained. The CA cell typically runs at a ramp rate of ± 0.1 kA   m 2   min 1 [34], dictated by downstream processes and the ability to maintain effective differential pressure control in the cell. The maximum ramp rate is nearly three times higher than the normal operating ramp rate (represented by the black dotted line), implying that the CA process needs to be operated at higher ramp rate than normal to follow the wind profile. Yet, for most of the time, the ramp rates are within the normal operating range, meaning that the CA process is able to easily follow the wind profile to a large extent.
The electrolyte concentrations in the electrolyzer need to be maintained at a constant value during the load variations, since the lifetime of the cation exchange membrane (CEM) is negatively influenced by concentration variations [34]. Figure 12 displays how the brine input volumetric flow rate was modulated with current density throughout the day to control the exit anolyte concentration to the set point of 206.6 gL 1 .
As illustrated in Figure 13a, the exit caustic concentration was maintained constant at 32.5 wt% (set point) by regulating the water feed rate (manipulated variable) in the catholyte, resulting in a changing inlet caustic concentration (Figure 13b). In addition, the model can robustly regulate the electrolyte exit concentrations with extremely minimal oscillations around the set point during load variations.
It should be remarked that there are other factors that limit the flexibility of the CA plant that are not described by this model. One of them is the content of chloride in caustic, which is a specification of the caustic product. This chloride content increases with decreasing current density and therefore limits the minimum current at which the CA plant can be operated. Another limitation is the power electronics system, where low loads can result in problems with harmonics. As a result of these limitations, the CA plant has a minimum load, below which the plant cannot be operated. This means that the CA plant cannot fully follow the wind profile, but it will need a certain level of baseload power when no wind power is available. How much of this baseload power is required differs per plant, but it always exceeds 20% of the nominal power.

4. Conclusions

In this work, steady state and dynamic simulation studies were performed by using both an electrochemical and dynamic material balance model under isothermal conditions. The model comprised migration through the membrane, OH transport from cathode to anode and the evaporation of water in the anolyte and catholyte as introduced in previous contributions. It also included oxygen evolution at the anode. Additionally, to increase the precision of the electrochemical model, recent values for electrochemical kinetic parameters (Tafel slope and exchange current density) were used instead of semi-empirical correlations for the anodic and cathodic activation overpotential equations.
The predicted values of the total cell voltage and membrane potential are in good agreement with the experimental data and published model values. An average deviation of 4.95% was detected for the total cell voltage. Similarly, the predicted membrane potential with a line slope of 0.112 Vm 2 / kA is almost equivalent to the experimental data with a line slope of 0.110 Vm 2 / kA . Moreover, the calculated brine and caustic effluent concentrations are representative of the industry practice.
The model was used to predict the dynamics of cell voltage and electrolyte concentrations under various ramp rates. The cell voltage rises quickly with current density at first, then gradually increases as the electrolyte concentrations change.
A 24 h wind power profile was simulated when the model was further integrated with the wind energy source. It was demonstrated that by modulating the inlet brine and water feed flowrate, the outgoing electrolyte concentrations could be effectively controlled. Furthermore, when the disturbance is caused by a change in available wind power over the day, the model ensures a stable operation with minimal fluctuations around the set points.
The profile of rate of change of current density over the course of a day was also generated and the highest ramp rate (positive and negative) of 0.28 kA   m 2   min 1 was obtained, which is about three times more than the normal operational ramp rate ( ± 0.1 kA   m 2   min 1 ). Yet, for the majority of the time, the CA plant is able to follow the wind profile, showing that a CA plant can be effectively operated in an electricity system based on renewable electricity.
The model provides a good framework for the subsequent development of more complex models (e.g., the 1D and 2D model) in order to examine cell behavior at a more detailed level.

Author Contributions

Conceptualization, methodology, software, validation, investigation, data curation, writing—original draft preparation, visualization, K.T.; formal analysis, K.T. and R.A.; resources, writing—review and editing, K.M., M.T.d.G., K.T. and R.A.; supervision, M.T.d.G. and K.M. All authors have read and agreed to the published version of the manuscript.

Funding

The authors would like to acknowledge the German Federal Ministry of Education and Research for its funding for the project H2-Flex (project number 03ZZ0740C).

Institutional Review Board Statement

Not applicable.

Informed Consent Statement

Not applicable.

Data Availability Statement

Not applicable.

Conflicts of Interest

The authors declare no conflict of interest. The funders had no role in the design of the study; in the collection, analyses, or interpretation of data; in the writing of the manuscript, or in the decision to publish the results.

List of Symbols and Abbreviations

Abbreviations
CAChlor-alkali
CEMCation exchange membrane
CSTRContinuously stirred tank reactor
DAEsDifferential algebraic equations
DSA®Dimensionally stable anode
HERHydrogen evolution reaction
PIProportional-integral feedback controller
Greek Symbols
η an Anodic overpotential (V)
η cat Cathodic overpotential (V)
γ Mean activity coefficient
ζ Faradaic efficiency/Permselectivity (%)
ρ Density   of   electrolyte   ( g   L 1 )
ϱ Electrical   resistivity   ( Ω   cm )
Latin Symbols
a H 2 O Activity   of   water   ( mol   L 1 )
a k Activity   of   electrolyte   ( mol   L 1 )
E 0 , th Thermodynamic potential (V)
E act Activation overpotential (V)
E cell Total cell voltage (V)
E st 0 Standard potential (V)
i 0 Exchange   current   density   ( mA   cm 2 )
m ˙ Mass   flow   rate   ( g   s 1 )
M W Molecular   weight   ( g   mol 1 )
n ˙ Molar   flow   rate   ( mol   s 1 )
p H 2 O , g * Vapor pressure of pure water (bar)
p sat Saturation pressure (bar)
Q ˙ Volume   flow   rate   of   electrolyte   ( L   min 1 )
R elec Resistance   of   electrolyte   ( Ω )
R eled Resistance   of   electrode   ( Ω )
R mem Resistance   of   membrane   ( Ω )
t H 2 O Transport   number   of   water   molecules   ( mol H 2 O / mol Na + )
t Na + Transport number of sodium ion
y an , k Molality   of   anolyte   in   the   anode   compartment   ( mol   kg 1 water )
y cat , k Molality   of   catholyte   in   the   cathode   compartment   ( mol   kg 1 water )
AEffective area of MEA (m2)
bParameter in various correlations
C Molarity   of   electrolyte   ( mol   L 1 )
dParameter in various correlations
eParameter in various correlations
FFaraday’s constant (A s mol−1)
fParameter in various correlations
gParameter in various correlations
i Current   density   ( kA   m 2 )
ICurrent (kA)
KElectrical conductivity (Ω−1 cm−1)
k Tafel   slope   ( V   decade 1 )
lLength of resistance (cm)
pPartial pressure (bar)
PTotal pressure (bar)
R Universal   gas   constant   ( J   ( m o l   K ) 1 )
tTime
TCell temperature (°C)
VVolume of cell compartment (L)
WConcentration of electrolyte (wt%)
X Concentration   of   electrolyte   ( g   L 1 )
y Molality   of   electrolyte   ( mol   kg 1 water )
Superscripts
*In pure form
backBack transported
consConsumed
inInlet flow
memMembrane
outOutlet flow
prodProduced
reactReacted
satSaturated
Subscripts
actActivation
anAnode compartment
aqAqueous
catCathode compartment
elecElectrolyte
eledElectrode
gGaseous
LLiquid
NaCl + H 2 O (Brine) or sodium chloride solution
NaOH + H 2 O (Caustic) or caustic soda solution
ohmOhmic
OXOxidation
REDReduction
revReversible

References

  1. Arbeitsgruppe Erneuerbare Energien-Statistik (AGEE-Stat)/Umweltbundesamt. Erneuerbare Energien in Zahlen. November 2021. Available online: https://www.umweltbundesamt.de/themen/klima-energie/erneuerbare-energien/erneuerbare-energien-in-zahlen#uberblick (accessed on 8 December 2021).
  2. European Commission, Directorate-General for Research and Innovation, Velte D, Kuittinen H. Mission-Oriented R&I Policies: In-Depth Case Studies: Energiewende (Germany): Case Study Report; Publications Office: Bonn, Germany, 2018. [Google Scholar] [CrossRef]
  3. Hoffmann, C.; Weigert, J.; Esche, E.; Repke, J.-U. Towards demand-side management of the chlor-alkali electrolysis: Dynamic, pressure-driven modeling and model validation of the 1,2-dichloroethane synthesis. Chem. Eng. Sci. 2020, 214, 115358. [Google Scholar] [CrossRef] [Green Version]
  4. Stadler, I. Power grid balancing of energy systems with high renewable energy penetration by demand response. Util. Policy 2008, 16, 90–98. [Google Scholar] [CrossRef]
  5. Dehmer, D. The German Energiewende: The First Year. Electr. J. 2013, 26, 71–78. [Google Scholar] [CrossRef]
  6. Ausfelder, F.; Seitz, A.; von Roon, S. Flexibilitätsoptionen in der Grundstoffindustrie: Methodik, Potenziale, Hemmnisse. July 2018. Available online: https://nbn-resolving.org/html/urn:nbn:de:bsz:wup4-opus-70910 (accessed on 10 March 2020).
  7. Simkoff, J.M.; Baldea, M. Stochastic Scheduling and Control Using Data-Driven Nonlinear Dynamic Models: Application to Demand Response Operation of a Chlor-Alkali Plant. Ind. Eng. Chem. Res. 2020, 59, 10031–10042. [Google Scholar] [CrossRef]
  8. Roh, K.; Brée, L.C.; Perrey, K.; Bulan, A.; Mitsos, A. Flexible operation of switchable chlor-alkali electrolysis for demand side management. Appl. Energy 2019, 255, 113880. [Google Scholar] [CrossRef]
  9. Daryanian, B.; Bohn, R.; Tabors, R. Optimal demand-side response to electricity spot prices for storage-type customers. IEEE Trans. Power Syst. 1989, 4, 897–903. [Google Scholar] [CrossRef]
  10. Xenos, D.P.; Noor, I.M.; Matloubi, M.; Cicciotti, M.; Haugen, T.; Thornhill, N.F. Demand-side management and optimal operation of industrial electricity consumers: An example of an energy-intensive chemical plant. Appl. Energy 2016, 182, 418–433. [Google Scholar] [CrossRef] [Green Version]
  11. Kelley, M.; Pattison, R.C.; Baldick, R.; Baldea, M. An MILP framework for optimizing demand response operation of air separation units. Appl. Energy 2018, 222, 951–966. [Google Scholar] [CrossRef]
  12. Otashu, J.I.; Baldea, M. Demand response-oriented dynamic modeling and operational optimization of membrane-based chlor-alkali plants. Comput. Chem. Eng. 2019, 121, 396–408. [Google Scholar] [CrossRef]
  13. Brée, L.C.; Perrey, K.; Bulan, A.; Mitsos, A. Demand side management and operational mode switching in chlorine production. AIChE J. 2019, 65, e16352. [Google Scholar] [CrossRef]
  14. Klaucke, F.; Hoffmann, C.; Hofmann, M.; Tsatsaronis, G. Impact of the chlorine value chain on the demand response potential of the chloralkali process. Appl. Energy 2020, 276, 115366. [Google Scholar] [CrossRef]
  15. Chlor, E. Questions and Answers on the Chlor-Alkali Sector and the EU Emission Trading System (ETS). Brussels, Belgium. 2010. Available online: http://www.eurochlor.org/media/9379/3-2-questionsandanswersonthechlor-alkalisectorandtheeuemissiontradingsystem.pdf (accessed on 13 August 2020).
  16. Joint Research Centre, Institute for Prospective Technological Studies; Brinkmann, T.; Giner Santonja, G.; Delgado Sancho, L.; Schorcht, F.; Roudier, S. Best Available Techniques (BAT) Reference Document for the Production of Chlor-Alkali: Industrial Emissions Directive 2010/75/EU (Integrated Pollution Prevention and Control); Publications Office: Bonn, Germany, 2014. [Google Scholar] [CrossRef]
  17. Schmittinger, P.; Florkiewicz, T.; Curlin, L.C.; Lüke, B.; Scannell, R.; Navin, T.; Zelfel, E.; Bartsch, R. Chlorine, in: Ullmann’s Encyclopedia of Industrial Chemistry; Wiley-VCH Verlag GmbH & Co. KGaA: Weinheim, Germany, 2012. [Google Scholar] [CrossRef]
  18. Nagy, Z. A Mechanistic Model for the Calculation of Material Balance for a Diaphragm-Type Chlorine Caustic Cell. J. Electrochem. Soc. 1977, 124, 91–95. [Google Scholar] [CrossRef]
  19. Van Zee, J.; White, R.E. Using Parameter Estimation Techniques with a Simple Model of a Diaphragm-Type Electrolyzer to Predict the Electrical Energy Cost for NaOH Production. J. Electrochem. Soc. 1985, 132, 818–826. [Google Scholar] [CrossRef]
  20. Van Zee, J.; White, R.E. Simple Models for Diaphragm-Type Chlorine/Caustic Cells: II. Effect of Acidic Anolyte on Steady-State Caustic Yield. J. Electrochem. Soc. 1986, 133, 508–515. [Google Scholar] [CrossRef] [Green Version]
  21. Van Zee, J.; White, R.E.; Watson, A.T. Simple Models for Diaphragm-Type Chlorine/Caustic Cells: I. Dynamic Behavior. J. Electrochem. Soc. 1986, 133, 501–507. [Google Scholar] [CrossRef]
  22. Chavan, N.; Pinnow, S.; Polcyn, G.D.; Turek, T. Non-isothermal model for an industrial chlor-alkali cell with oxygen-depolarized cathode. J. Appl. Electrochem. 2015, 45, 899–912. [Google Scholar] [CrossRef]
  23. Chen, C.-P.; Tilak, B.V. A model for the determination of chloride and chlorate levels in the caustic product of ion-exchange membrane chlor-alkali cells. J. Appl. Electrochem. 1996, 26, 235. [Google Scholar] [CrossRef]
  24. Chandran, R.; Chin, D.-T. Reactor analysis of a chlor—alkali membrane cell. Electrochimica Acta 1986, 31, 39–50. [Google Scholar] [CrossRef]
  25. Babu, C.A.; Ashok, S. Peak Load Management in Electrolytic Process Industries. IEEE Trans. Power Syst. 2008, 23, 399–405. [Google Scholar] [CrossRef]
  26. Richstein, J.C.; Hosseinioun, S.S. Industrial demand response: How network tariffs and regulation (do not) impact flexibility provision in electricity markets and reserves. Appl. Energy 2020, 278, 115431. [Google Scholar] [CrossRef]
  27. Brée, L.C.; Bulan, A.; Herding, R.; Kuhlmann, J.L.; Mitsos, A.; Perrey, K.; Roh, K. Techno-Economic Comparison of Flexibility Options in Chlorine Production. Ind. Eng. Chem. Res. 2020, 59, 12186–12196. [Google Scholar] [CrossRef]
  28. Agachi, P.S.; Nagy, Z.K.; Cristea, M.V.; Imre-Lucaci, Á. Model Based Control: Case Studies in Process Engineering; Wiley-VCH Verlag GmbH & Co. KGaA: Weinheim, Germany, 2007. [Google Scholar]
  29. Budiarto, T.; Esche, E.; Repke, J.; Leksono, E. Dynamic Model of Chloralkali Membrane Process. Procedia Eng. 2017, 170, 473–481. [Google Scholar] [CrossRef]
  30. Otashu, J.I.; Baldea, M. Scheduling chemical processes for frequency regulation. Appl. Energy 2020, 260, 114125. [Google Scholar] [CrossRef]
  31. Weigert, J.; Hoffmann, C.; Esche, E.; Fischer, P.; Repke, J.-U. Towards demand-side management of the chlor-alkali electrolysis: Dynamic modeling and model validation. Comput. Chem. Eng. 2021, 149, 107287. [Google Scholar] [CrossRef]
  32. 32. Dias and Ana Catarina de Bastos Vidal. Chlor-Alkali Membrane Cell Process: Study and Characterization. Ph.D. Thesis, University of Porto, Porto, Portugal, 2010.
  33. Valderrama, C. Ion-Exchange Membranes in Chlor-Alkali Process. In Encyclopedia of Membranes; Springer: Singapore, 2015; pp. 1–4. [Google Scholar]
  34. O’Brien, T.F.; Bommaraju, T.V.; Hine, F. Handbook of Chlor-Alkali Technology. In Handbook of Chlor-Alkali Technology; Fundamentals; Springer: New York, NY, USA, 2005; Volume I. [Google Scholar]
  35. Domga, D.; Domga, R.; Noumi, G.; Tchatchueng, J. Study of Some Electrolysis Parameters for Chlorine and Hydrogen Production Using a New Membrane Electrolyzer. Int. J. Chem. Eng. Anal. Sci. 2017, 2, 1–8. [Google Scholar]
  36. Jung, J.; Postels, S.; Bardow, A. Cleaner chlorine production using oxygen depolarized cathodes? A life cycle assessment. J. Clean. Prod. 2014, 80, 46–56. [Google Scholar] [CrossRef]
  37. Paidar, M.; Fateev, V.; Bouzek, K. Membrane electrolysis—History, current status and perspective. Electrochimica Acta 2016, 209, 737–756. [Google Scholar] [CrossRef] [Green Version]
  38. Mendoza, P.G. Intensification of the Chlor-Alkali Process Using a Rotor-Stator Spinning Disc Membrane Electro-Chemical Reactor. PhD Thesis, Technical University of Eindhoven, Eindhoven, The Netherlands, 2016. Available online: https://research.tue.nl/nl/publications/intensification-of-the-chlor-alkali-process-using-a-rotor-stator- (accessed on 13 August 2020).
  39. Wellington, T.C. Modern Chlor-Alkali Technology; Elsevier Applied Science: New York, NY, USA, 2012; Volume 5, pp. 93–104. ISBN 1-85166-778-4. [Google Scholar]
  40. Bergner, D. Reduction of by-product formation in alkali chloride membrane electrolysis. J. Appl. Electrochem. 1990, 20, 716–722. [Google Scholar] [CrossRef]
  41. Akerlof, G.; Kegeles, G. The Density of Aqueous Solutions of Sodium Hydroxide. J. Am. Chem. Soc. 1939, 61, 1027–1032. [Google Scholar] [CrossRef]
  42. Twardowski, Z.; Yeager, H.L.; O’Dell, B. A Comparison of Perfluorinated Carboxylate and Sulfonate Ion Exchange Polymers: II. Sorption and Transport Properties in Concentrated Solution Environments. J. Electrochem. Soc. 1982, 129, 328–332. [Google Scholar] [CrossRef]
  43. Hogendoorn, J.; van der Veen, A.; van der Stegen, J.; Kuipers, H.; Versteeg, G. Application of the Maxwell–Stefan theory to the membrane electrolysis process: Model development and simulations. Comput. Chem. Eng. 2001, 25, 1251–1265. [Google Scholar] [CrossRef]
  44. Yeo, R.S.; Buck, R.P. Proceedings of the Symposium on Ion Exchange–Transport and Interfacial Properties; The Electrochemical Society: Pennington, NJ, USA, 1981. [Google Scholar]
  45. Shibli, S.M.A.; Noel, M. Evaluation of transport properties of cation exchange membranes for application in alkali concentrators. J. Appl. Electrochem. 1993, 23, 1147–1150. [Google Scholar] [CrossRef]
  46. Leah, R.T.; Brandon, N.P.; Vesovic, V.; Kelsall, G.H. Numerical Modeling of the Mass Transport and Chemistry of a Simplified Membrane-Divided Chlor-Alkali Reactor. J. Electrochem. Soc. 2000, 147, 4173. [Google Scholar] [CrossRef]
  47. Beckmann, R.; Lüke, B. Know-how and technology—improving the return on investment for conversions, expansions and new chlorine plants. Modern Chlor-Alkali Technology. In Proceedings of the 2000 London International Chlorine Symposium Organized by SCI’s Electrochemical Technology Group, London, UK, 31 May–2 June 2000; pp. 196–212. [Google Scholar]
  48. Ukihashi, H.; Yamabe, M. Perfluorocarboxylate Polymer Membranes. In ACS Symposium Series; American Chemical Society (ACS): Washington, DC, USA, 1982; pp. 427–451. [Google Scholar]
  49. Pfennig, A.; Schabel, W.; Wolf, H. D5 Properties of Multicomponent Fluid Mixtures. In VDI Heat Atlas; Springer: Singapore, 2010; pp. 513–550. [Google Scholar]
  50. MacMullin, R.B. Algorithms for the Vapor Pressure of Water Over Aqueous Solutions of Salt and Caustic Soda. J. Electrochem. Soc. 1969, 116, 416–419. [Google Scholar] [CrossRef]
  51. Sijabat, R.R.; De Groot, M.T.; Moshtarikhah, S.; Van Der Schaaf, J. Maxwell–Stefan model of multicomponent ion transport inside a monolayer Nafion membrane for intensified chlor-alkali electrolysis. J. Appl. Electrochem. 2019, 49, 353–368. [Google Scholar] [CrossRef] [Green Version]
  52. Adams, J.J.; Bachu, S. Equations of state for basin geofluids: Algorithm review and intercomparison for brines. Geofluids 2002, 2, 257–271. [Google Scholar] [CrossRef]
  53. Dittman, G.L. Calculation of Brine Properties; Lawrence Livermore National Lab (LLNL): Livermore, CA, USA, February 1977. Available online: https://www.osti.gov/biblio/7111583 (accessed on 13 August 2020).
  54. Keating, J.T. Modern Chlor-Alkali Technology. J. Membr. Sci. 1996, 115, 109–110. [Google Scholar] [CrossRef]
  55. Caldwell, D.L. Production of chlorine. In Comprehensive Treatise of Electrochemistry; Springer: Boston, MA, USA, 1981; pp. 105–166. [Google Scholar]
  56. Bratsch, S.G. Standard Electrode Potentials and Temperature Coefficients in Water at 298.15 K. J. Phys. Chem. Ref. Data 1989, 18, 1–21. [Google Scholar] [CrossRef] [Green Version]
  57. Suhara, M.; Oda, D. Transport Number through the Perfluorinated Cation Membrane, Flemion. J. Electrochem. Soc. 1980, 127, C407. [Google Scholar]
  58. Åkerlöf, G. Activity Coefficients of sodium, potassium and lithium chlorides and hydrochloric acid at infinite dilution in water-methyl alcohol mixtures. J. Am. Chem. Soc. 1930, 52, 2353–2368. [Google Scholar] [CrossRef]
  59. Marangio, F.; Santarelli, M.; Cali, M. Theoretical model and experimental analysis of a high pressure PEM water electrolyser for hydrogen production. Int. J. Hydrogen Energy 2009, 34, 1143–1158. [Google Scholar] [CrossRef]
  60. Trasatti, S. Progress in the understanding of the mechanism of chlorine evolution at oxide electrodes. Electrochim. Acta 1987, 32, 369–382. [Google Scholar] [CrossRef]
  61. Moorhouse, J. Modern Chlor-Alkali Technology; John Wiley & Sons: Hoboken, NJ, USA, 2008. [Google Scholar]
  62. Tilak, B. Chlorine and hydrogen evolution characteristics of ion implanted electrode materials. Mater. Chem. Phys. 1989, 22, 149–161. [Google Scholar] [CrossRef]
  63. Tilak, B.V.; Chen, C.-P. Generalized analytical expressions for Tafel slope, reaction order and a.c. impedance for the hydrogen evolution reaction (HER): Mechanism of HER on platinum in alkaline media. J. Appl. Electrochem. 1993, 23, 631–640. [Google Scholar] [CrossRef]
  64. Houda, H. Recent development of Asahi Kasei Chemicals’s IM technology (TSEM 08/358). April 2018. Available online: https://www.eurochlor.org/document/tsem-08-358-recent-development-of-asahi-kasei-chemicalss-im-technology-h-houda/ (accessed on 15 September 2020).
  65. Campione, A.; Cipollina, A.; Calise, F.; Tamburini, A.; Galluzzo, M.; Micale, G. Coupling electrodialysis desalination with photovoltaic and wind energy systems for energy storage: Dynamic simulations and control strategy. Energy Convers. Manag. 2020, 216, 112940. [Google Scholar] [CrossRef]
  66. Takahashi, Y.; Obanawa, H.; Noaki, Y. New Electrolyser Design for High Current Density. In Modern Chlor-Alkali Technology; John Wiley & Sons: Hoboken, NJ, USA, 2001; Volume 8, pp. 213–224. [Google Scholar]
  67. Bergner, D.; Hartmann, M.; Kirsch, H. Voltage-Current Curves: Application to Membrane Cells. In Modern Chlor-Alkali Technology; Springer: Singapore, 1990; pp. 159–170. [Google Scholar]
Figure 1. Schematic representation of a single-membrane-based chlor-alkali cell.
Energies 15 00606 g001
Figure 2. Illustration of molar and volumetric flow rates associated with the membrane chlor-alkali cell.
Energies 15 00606 g002
Figure 3. MATLAB program flow chart showing calculation steps followed to calculate process parameters.
Energies 15 00606 g003
Figure 4. Comparison of the predicted data with experimental [64,66,67] and published model data [12] of total cell voltage E cell (a) and membrane potential E mem (b) as a function of current density ( i ) . The experimental data of Bergner et al. [67]: i = 6   kA   m 2 , NaCl   = 26   wt % , NaOH   = 33   wt % , temperature = 85   ° C and Nafion® NX954 membrane. The experimental data of Takahashi et al. [64,66] and published model data of Baldea et al. [12]: i = 6   kA   m 2 , NaCl   = 23   wt % , NaOH   = 32   wt % , temperature = 90   ° C , and membranes: Aciplex F6801 [64], Aciplex F4401 [66].
Energies 15 00606 g004
Figure 5. The outlet concentration as well as volumetric flow rate of electrolytes as a function of current density from 1 to 6 kA   m 2 . (a) Concentration of electrolytes and (b) volumetric flow rate of electrolytes. Operating conditions: temperature: T an in =   T cat in = 85   ° C ; electrolyte concentration: X an ,   NaCl in = 300 gL 1 and W can ,   NaOH in = 31 wt % ; inlet volumetric flow rate: Q ˙ an in = 5 L min−1 and Q ˙ cat in = 6 L min−1.
Energies 15 00606 g005
Figure 6. The outlet electrolytes concentration as a function of time in response to ramped up in current density from 3 to 6 kA   m 2 at time, t = 1 min , with ramp rates of 0.1, 0.2, 0.4 and 1 kA   m 2   min 1 . (a) Anolyte concentration and (b) catholyte concentration. Operating conditions: temperature: T an in =   T cat in = 85   ° C ; electrolyte concentration: X an ,   NaCl in = 300 gL 1 and W cat , NaOH in = 31 wt % ; inlet volumetric flow rate: Q ˙ an in = 5 L   min 1 and Q ˙ cat in = 6 L   min 1 .
Energies 15 00606 g006
Figure 7. The outlet electrolytes concentration as a function of time in response to ramped down in current density from 6 to 3 kA   m 2 at time, t = 1 min , with ramp rates of 0.1, 0.2, 0.4 and 1 kA   m 2   min 1 . (a) Anolyte concentration and (b) catholyte concentration. Operating conditions: temperature: T an in =   T cat in = 85   ° C ; electrolyte concentration: X an ,   NaCl in = 300 gL 1 and W cat , NaOH in = 31 wt % ; inlet volumetric flow rate: Q ˙ an in = 5 L   min 1 and Q ˙ cat in = 6 L   min 1 .
Energies 15 00606 g007
Figure 8. Temporal response of the cell voltage to ramp up from 3 to 6 kA   m 2 (a) and ramp down from 6 to 3 kA   m 2 (b) at time, t = 1 min , with ramp rates of 0.1, 0.2, 0.4 and 1 kA   m 2   min 1 . Operating conditions: temperature: T an in =   T cat in = 85   ° C ; electrolyte concentration: X an ,   NaCl in = 300 gL 1 and W cat , NaOH in = 31 wt % ; inlet volumetric flow rate: Q ˙ an in = 5 L   min 1 and Q ˙ cat in = 6 L   min 1 .
Energies 15 00606 g008
Figure 9. Temporal behavior of the cell voltage components to ramp up from 3 to 6 kA   m 2 at time, t = 1 min , with ramp rates of 0.1, 0.2, 0.4 and 1 kA   m 2   min 1 . Left: reversible potential. Top-right: activation overpotential. Bottom-right: ohmic overpotential. Operating conditions: temperature: T an in =   T cat in = 85   ° C ; electrolyte concentration: X an ,   NaCl in = 300 gL 1 and W cat , NaOH in = 31 wt % ; inlet volumetric flow rate: Q ˙ an in = 5 L   min 1 and Q ˙ cat in = 6 L   min 1 .
Energies 15 00606 g009
Figure 10. (a) Simulated wind power output profile, (b) resultant current density profile and (c) the associated transient response of the cell voltage over the course of a day. Operating conditions: temperature: T an in =   T cat in = 85   ° C ; and electrolyte concentration: X an ,   NaCl in = 300 gL 1 .
Energies 15 00606 g010
Figure 11. Simulated ramp rate profile of current density over a whole day.
Energies 15 00606 g011
Figure 12. Transient response of the outlet brine concentration (controlled variable), inlet volumetric flow rate of brine (manipulated variable) and the resulting outlet volumetric flow rate of brine at the anode compartment. Operating conditions: temperature: T an in = 85   ° C ; and anolyte concentration: X an ,   NaCl in = 300 gL 1 .
Energies 15 00606 g012
Figure 13. Dynamic response of (a) the outlet caustic concentration (controlled variable), inlet volumetric flow rate of water for caustic (manipulated variable), the resulting outlet volumetric flow rate of caustic and (b) the inlet caustic concentration at the cathode compartment. Operating conditions: temperature: T cat in = 85   ° C ; and anolyte concentration: X an ,   NaCl in = 300 gL 1 .
Energies 15 00606 g013
Table 1. Parameters for the Antoine equation, valid in the temperature range 0 to 100 °C [34].
ParameterValue
b7.95190
d1659.793
e45.854
Table 2. Pairing and parameterization of the implemented controllers.
Controlled
Parameter
Set PointManipulated
Parameter
Proportional (P)
( L / s )
Integral (I)
( 1 / s )
X an ,   NaCl   out 206.6   g   L 1 Q ˙ an in 0.120.28
W cat , NaOH out 32.5 wt% Q ˙ cat , water in 74.277.42
Table 3. Values of input parameters used in the model for the simulation of the single chlor-alkali cell.
ParameterSymbolUnitValueRef.
Inlet temperature of brine T an , ( NaCl + H 2 O ) in °C85[34]
Inlet temperature of the caustic solution T cat , ( NaOH + H 2 O ) in °C85[34]
Inlet volumetric flow rate of the brine Q ˙ an in L min−15[11,64]
Inlet volumetric flow rate of the caustic solution Q ˙ cat in L min−16[12,34]
Inlet density of the brine ρ an , ( NaCl + H 2 O ) in g L−11114[34]
Inlet density of the caustic solution ρ cat , ( NaOH + H 2 O ) in g L−11299[41,51]
Anode and cathode compartment volume per unit cell V an , V cat L100[12]
Inlet concentration of NaCl in the brine X an , NaCl in g L−1300[34]
Inlet concentration of NaOH in the caustic solution W cat , NaOH in wt%31[34]
Current densityikA m−23–6[34]
Water transport numbertH2OmolH2O/molNa+4.1[43,44,45]
Effective electrode areaAm22.7[34]
Faradaic efficiency/permselectivity ζ %96[34]
Reversible voltage E rev V2.1884[56]
Exchange current density for the anode i 0 , an , Cl 2 mAcm−21.2[34]
Exchange current density for the cathode i 0 , cat , H 2 mAcm−23[34]
Tafel slope of anode ( RuO 2 + TiO 2   based) k an , Cl 2 V   decade 1 0.03[60]
Tafel slope of cathode (Ni coated with Ni–Al) k cat , H 2 V   decade 1 0.05[62]
Absolute pressure inside the anode compartment P an bar1.01[34]
Absolute pressure inside the cathode compartment P cat bar1.05[34]
Ramping rate Δ i / Δ t kA   m 2 min 1 0.1[34]
Publisher’s Note: MDPI stays neutral with regard to jurisdictional claims in published maps and institutional affiliations.

