1. Introduction
Reliability and lifetime of energy-efficient lighting are important features to meet the goals set to save electricity. If both the reliability and the lifetime are too low, the energy required for the production of the lamps may exceed the energy gain that the use itself entails. Another important factor to consider is that the reputation of energy-efficient lighting has to be maintained for it to reach a wide spread among the consumers. A low energy consumption is not enough for customers to be satisfied. It is important that the lifetime specified by the manufacturer can be achieved for customer satisfaction. Otherwise, the type of lighting can easily get a bad reputation and it can be more difficult to achieve the energy-saving goals. During the tests of lighting performance performed today, a well-defined and constant voltage with small distortion (small deviations from an ideal voltage) is used, which is not what the lighting is exposed to in reality.
In [
1,
2], the authors have estimated the thermal stress of key components of LED lamps using a new thermal coupling model. In a degradation data-driven method the degradation pattern was analyzed by the lumen maintenance data to determine the lifetime of an LED [
3]. A non-accelerated 20,000-h aging test based on lumen degradation and color shift was performed to explore the error in a 6000-h test [
4]. An advanced lifetime prediction method was proposed in [
5] which considered the field operation mission profile and statistical properties of the life data from accelerated degradation testing. In [
6], a hybrid numerical approach based junction temperature analysis for LED luminous flux lifetime prediction was performed. In [
7], the Bayesian method was proposed to estimate the lifetime gathering lumen degradation data. This technique showed better prediction accuracy compared to the nonlinear squares (NLS) method. A latest research on lifetime prediction has used single accelerated degradation test (ADT) and electrothermal interaction (ETI) multiplication factor to predict lifetime. This method involves junction temperature estimation and determination of lumen output reduction [
8]. In [
9], the authors discussed the colour shift of N-based luminaires and the reason is dominated by the Ag mirror tarnish of the LED package, blue chip and phosphor-based degradation. The results identify that LED physics and device packaging also play a significant role in reliability study. In [
10], an accelerated degradation test was performed, such as lumen maintenance, deep ultraviolet (Duv), capacitance, and equivalent series resistance (ESR) were estimated, and reliability was analyzed. The article [
11] focuses on the spatial distribution uniformity of luminous intensity. In [
12], the effectiveness of the Eyring model as a lumen maintenance life prediction model for thermal-electrical operating conditions was investigated. The step-stress temperature accelerated aging test was performed in [
13]. The estimation errors of the accelerated lifetimes by the traditional method were in a range from 12.8% to 18.6% under the aging temperature of 80 °C and from 12.5% to 20.3% under the aging temperature of 70 °C for the seven samples. The estimation accuracy of the decay rates and accelerated lifetimes of LED lamps were improved using the step-stress accelerated aging test. Many articles have discussed different factors such as thermal stress and mechanical stress for LED failure, but very few articles have discussed the electrical stress.
The nominal lifetime specified by the manufacturer is a statistical estimate of how long a lamp will work as intended. The actual lifetime is affected by design, material selection, component selection, the manufacturing process, and the environment (including electrical environment) in which it is placed. In particular, the electrical environment is something that the manufacturer cannot control. The single value specified by the manufacturer for the service life must therefore only be seen as a general performance index where many other parameters may affect the actual outcome.
Failures of lighting can manifest themselves in several different ways and some are:
- ➢
Reduction in luminous flux. Here a certain limit is often set, e.g., “median useful life” has been introduced in international electrotechnical commission (IEC) 62,717 where 50% of the population has decreased to example L80, 80% luminous flux [
14];
- ➢
Reduced light due to partial catastrophic failure. This is measured in the same way as above, but the error is due to one or more components in the electronics failing;
- ➢
Completely absent light (catastrophic failure). This can be due to either the LED module or the driver circuit completely ceasing to function.
It has been found that more than half of all faults that occur on LED lighting are related to the drivers, 10% to the LED unit [
15]. The design and component selection of the drivers can differ considerably between different types of lighting equipment, but both the drivers and the LED unit have the same properties during their lifetime.
The voltage used to perform standard aging tests has a constant amplitude and low distortion, total harmonic distortion (THD) should be less than 3%. Such detailed definitions of tests are common in testing standards. The harmonics limit for lamps tests are given in [
16]. The reason for this is that the tests must be reproducible and independent of deviations between different test facilities. The disadvantage, however, is that certain phenomena are not included in the assessment.
The voltage in a standard test does not have to be the same as in reality, but two important conditions must be met:
A lamp that has a short lifetime according to the standard test should have, with high probability, a short lifetime under real conditions;
A lamp that has a long lifetime according to the standard test should have, with high probability, a long lifetime under real conditions.
It is the second condition that may not be met because the amplitude and waveform of the voltage is idealized in the standard test. The first condition will still be met.
The supply voltage deviations from the ideal voltage in a number of ways, so-called voltage disturbances. Some of these are defined in standards and are studied in detail in the literature, where a lot of information about them can be found [
17,
18]. Examples of these disturbances are voltage variations (including undervoltage and overvoltage); voltage dips (short-duration, up to a few seconds, reduction in voltage magnitude), and waveform distortion. Immunity tests exists for short-term high distortion levels (such as IEC 61000-4-13 [
19] for waveform distortion) or for individual events (such as IEC 61000-4-11 [
20] for voltage dips). However, there are no standard tests to assess the device’s immunity to prolonged high levels of voltage disturbances or to repeated events. An attempt by the institute of electrical and electronic engineers (IEEE) to create an informal list of levels of voltage disturbances against which a customer-friendly equipment manufacturer would test its products unfortunately did not go beyond the idea stage. A checklist for voltage dips has been proposed by an international working group in 2010 [
21], but even here it is unclear whether it is used by equipment manufacturers. Getting the message across to those who design and build appliances (whether those are large drive systems or small LED lights) remains a major challenge.
An overview of voltage disturbances to which low-voltage equipment is exposed is given in [
22]. The overview is intended as a recommendation for manufacturers of small appliances connected to the low-voltage network. Recommendations in [
22] can be applied directly to lighting equipment. The overview deals with some well-known types of disturbances (e.g., those mentioned above), but some new types of disturbances are also introduced, such as supraharmonics and medium-fast voltage variations [
23,
24].
The impact and potential problems on LED lamps caused by voltage variations such as rapid voltage changes, voltage steps, undervoltage and overvoltage due to photovoltaics (PV) or electric vehicle (EV) operation in a low-voltage network are studied in [
25].
Several studies performed through the years have shown that the distortion of voltage can differ considerably between different locations. The voltage distortion at a specific location depends on what electrical equipment is connected and on the impedances in the network. This is expected to affect the reliability and lifetime of the lamps as well, but to what extent is unknown. If there were a strong impact, it would mean that the same lighting would age at different speeds in different places, but no information on that is available either. When it comes to waveform distortion in particular, it can be assumed that primarily it is the drivers and their components that are affected to the greatest extent because these are electrically closest to the network.
The same reasoning also applies to the amplitude of the voltage: It also varies a lot between different connection points, and it can affect the service life of the lighting. The effect of the amplitude of the voltage on the life of incandescent lamps is well known, but for electronics-based lighting, such a relationship has not (yet) emerged.
Repeated events could also reduce the lifetime of lighting equipment. Possible examples are voltage dips, short-term voltage increases or switching transients that often occur at a certain point in the network. Overvoltage transients due to lighting strokes typically lead to damaged appliances, including lighting.
2. Description of the Experiment
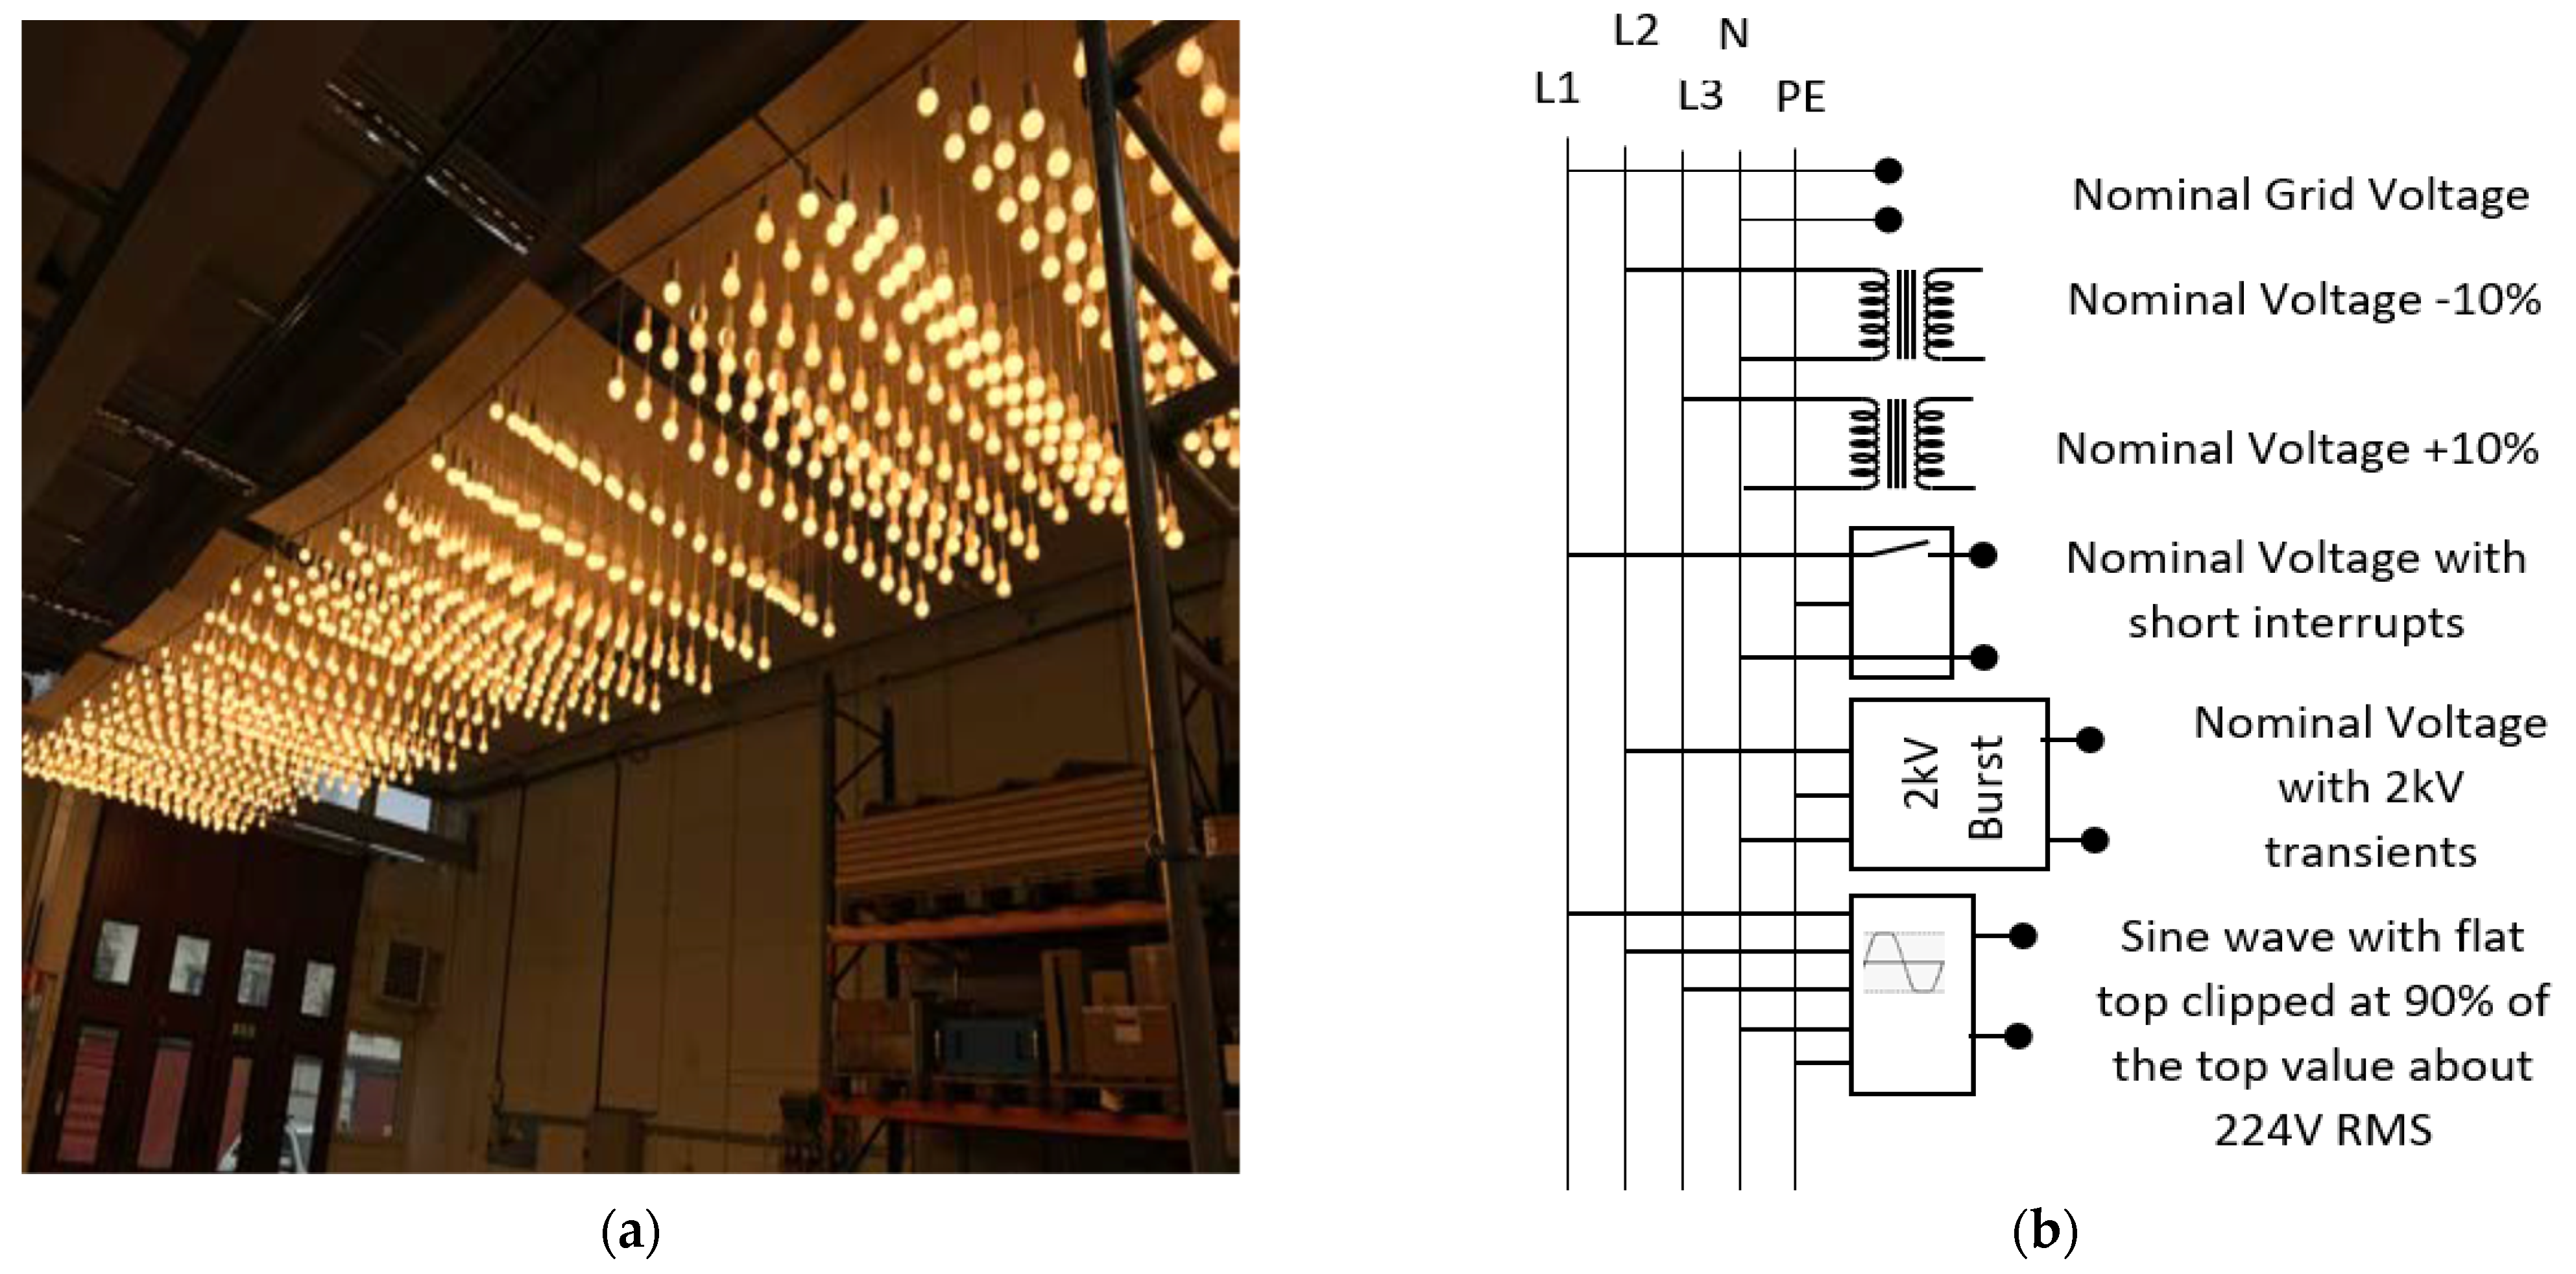
A group of 1080 LED lamps was exposed to different voltages for 6618 h. The LED lamps were divided into six equally sized groups, each consisting of four different types of LED lamps. Each group was subjected to a different voltage profile during the duration of the experiment as shown in
Figure 1b. The lamps are shown in
Figure 1. The four lamp types are described in
Section 2.1; the six groups are described in
Section 2.2.
Since the luminaires/fixtures are of different shapes and sizes, standardizing the result was not possible. The results for naked unshielded lamps can be used further for standardizing any lamp, taking into account the heat dissipation factor. Hence, lamp fixtures were not included in this study.
2.1. Types of Lamps
All lamps were LED-based and had a power between 4, 5, and 6 W, mounted on an E27 socket. All were of well-known brands, designed for the European market with 230 V, 50 Hz supply voltage, and were intended to be a direct replacement for an incandescent light bulb.
The price ranged from lamps that were primarily intended for domestic applications, sold to customers at very competitive prices, up to lamps intended for use in offices, shops, etc.
Three of the four lamps tested were of the topology with heatsink. These are built with one or more LED chips soldered to the surface of a circuit board, often of the insulated metal substrate (IMS) type. The IMS circuit boards are designed for thermal handling of electronic components; those components are built on an aluminum holder for good thermal conductivity. This circuit board is then mounted on a heat-conducting base that acts as a heat sink.
The second type of lamp that was tested was designed with LED filament strips, where small LEDs are connected in series on a transparent surface in the form of a filament to mimic a light bulb.
The following four types of lamps detailed in
Table 1 were selected; information on manufacturer is not disclosed.
Lamp Type A and Type B were ordinary lamps from stores with a large turnover. It can be assumed that these are common lamps in Swedish households. Type C is a lamp similar to Type A but from a different manufacturer. Type D is a filament type lamp which failed during the test.
2.2. Voltage Profile Applied to Six Groups of Lamps
Group 1, control group: This group acted as a control group, supplied directly from the mains through phase L1. Information on the voltage can be found in
Section 2.6;
Group 2, undervoltage: This group was supplied, with a voltage 10% below the mains voltage, from an adjustable transformer connected from phase L2. The transformer was permanently set for an output voltage equal to 90% of the input voltage. No voltage regulation was applied, so that the voltage that supplied the lamps followed the variations in the mains voltage (i.e., approximately the same voltage variations as group 1). It should be noted that 90% of the rated voltage was the lower limit of the supply voltage specified in SS-EN 50,160 [
26]. SS-EN 62,612 [
16] provided a lower limit for supply voltage equal to 92% of the rated voltage at which a lamp should function satisfactorily;
Group 3, overvoltage: This group received a voltage that was 10% above the voltage from phase L3. The layout was similar to that for group 2. The only difference was that the transformer that fed this group was set to an output voltage that was 10% higher (instead of 10% lower). It should be noted that 110% of the rated voltage was the upper limit of the supply voltage specified in SS-EN 50,160 [
26]. SS-EN 62,612 [
16] provided an upper limit for supply voltage at 106% of rated voltage at which a lamp should function satisfactorily. A discussion on voltage variations can be found in
Section 2.6;
Group 4, short interruptions: This group was supplied from phase L1 via a device that creates short interruptions, lasting one second, every two hours. The interruption always started at 90 degrees from the zero crossing of the supply voltage. This emulates the situation when the lights are turned on and off many times, in this case 12 times a day;
Group 5, voltage transients: This group of lamps was supplied from phase L2. Every two hours, 10,000 voltage transients (2 kV peak value, 50 μs duration) were generated for 1 s. For the rest of the two-hour period, the lamp received normal voltage. The polarity of the transients was chosen at random. It emulates an electrical environment with regular extreme disturbance levels. Nothing is known about what levels there are in reality;
Group 6, harmonics: This group is supplied from a programmable alternating current (AC) power source. The voltage for this group was created according to IEC 61000-4-13 [
19], “flat top” class 2, where the sinusoidal voltage was cut to 90% of its maximum value, during both positive and negative half periods. The compatibility levels in class 2 were the same as in public low-voltage networks. With the source originally set to an output of 230 V RMS 50 Hz, the remaining rms voltage after application of the cut waveform was just over 221 V. The AC power source used was connected to a 400-V three-phase mains voltage, which offered a single-phase output to the load. EN 62,612 [
16] set a limit for the supply voltage THD to 3% when testing lamps, this limit was maintained for all groups except group 6.
2.3. Test Period
The experiment started on 14 January 2020 and ended on 18 March 2021. The experiment was temporarily stopped for about two months during the summer of 2020. All the lamps were exposed to the same temperature of around 20 degrees, so that this would not impact the difference in behavior between the different groups. The total time that the lamps were on was 6618 h.
2.4. Electricity Supply to the Experiment
The experiment was fed from a mains connection with a single-phase source impedance of 230 mΩ. Each group of 90 lamps was fed with a 20- to 25-m cable with 1.5-mm2 conductor. This cable had a resistance of approximately 325 mΩ.
The total current (three-phase) of 1080 lamps (5 W each) was 7.8 A per phase. The voltage drop across the source impedance then became around 1.8 V.
The current (three-phase) to 90 lamps was 0.65 A per phase, which provided a voltage drop over the conductor to the lamps of approximately 0.2 V.
2.5. Description of the Experiment
For control and handling, a programmable logic control unit (PLC) measured the current supplied to each wooden board and the ambient temperature, in order to be able to turn off groups in the event of a fault. The PLC unit also drove the groups up and down sequentially when there was a need to pause the experiment. With a connection to the monitoring system and the fire alarm in the building, the control unit was also able to switch off the entire experiment directly if any of the smoke detectors in the room would detect smoke. The controller could also send text messages if an event occurred; via its web server the state of the experiment could be monitored remotely.
In order to perform an experiment of this size, 12 wooden boards were mounted just below the ceiling with lamps hanging from the boards at different heights to minimize the heat transfer between them, as shown in
Figure 1. Although precautions were taken to minimize ambient temperature, the lamps were occasionally exposed to higher temperatures (1 to 2 degree) than those defined as test conditions for lighting equipment in IEC 61000-3-2 [
27]. Two boards formed a group of lamps and there were 180 lamps in each group. All six groups had lamps of four different types, 45 lamps of the same type in each group. All groups had the same set of lamps, resulting in 1080 lamps. The lamps that underwent catastrophic failure during the experiment were not replaced by new ones.
2.6. Voltage Variations
As mentioned before, lamps in groups 1, 2, and 3 were exposed to a voltage equal to 100%, 90%, and 110% of the supply voltage, respectively.
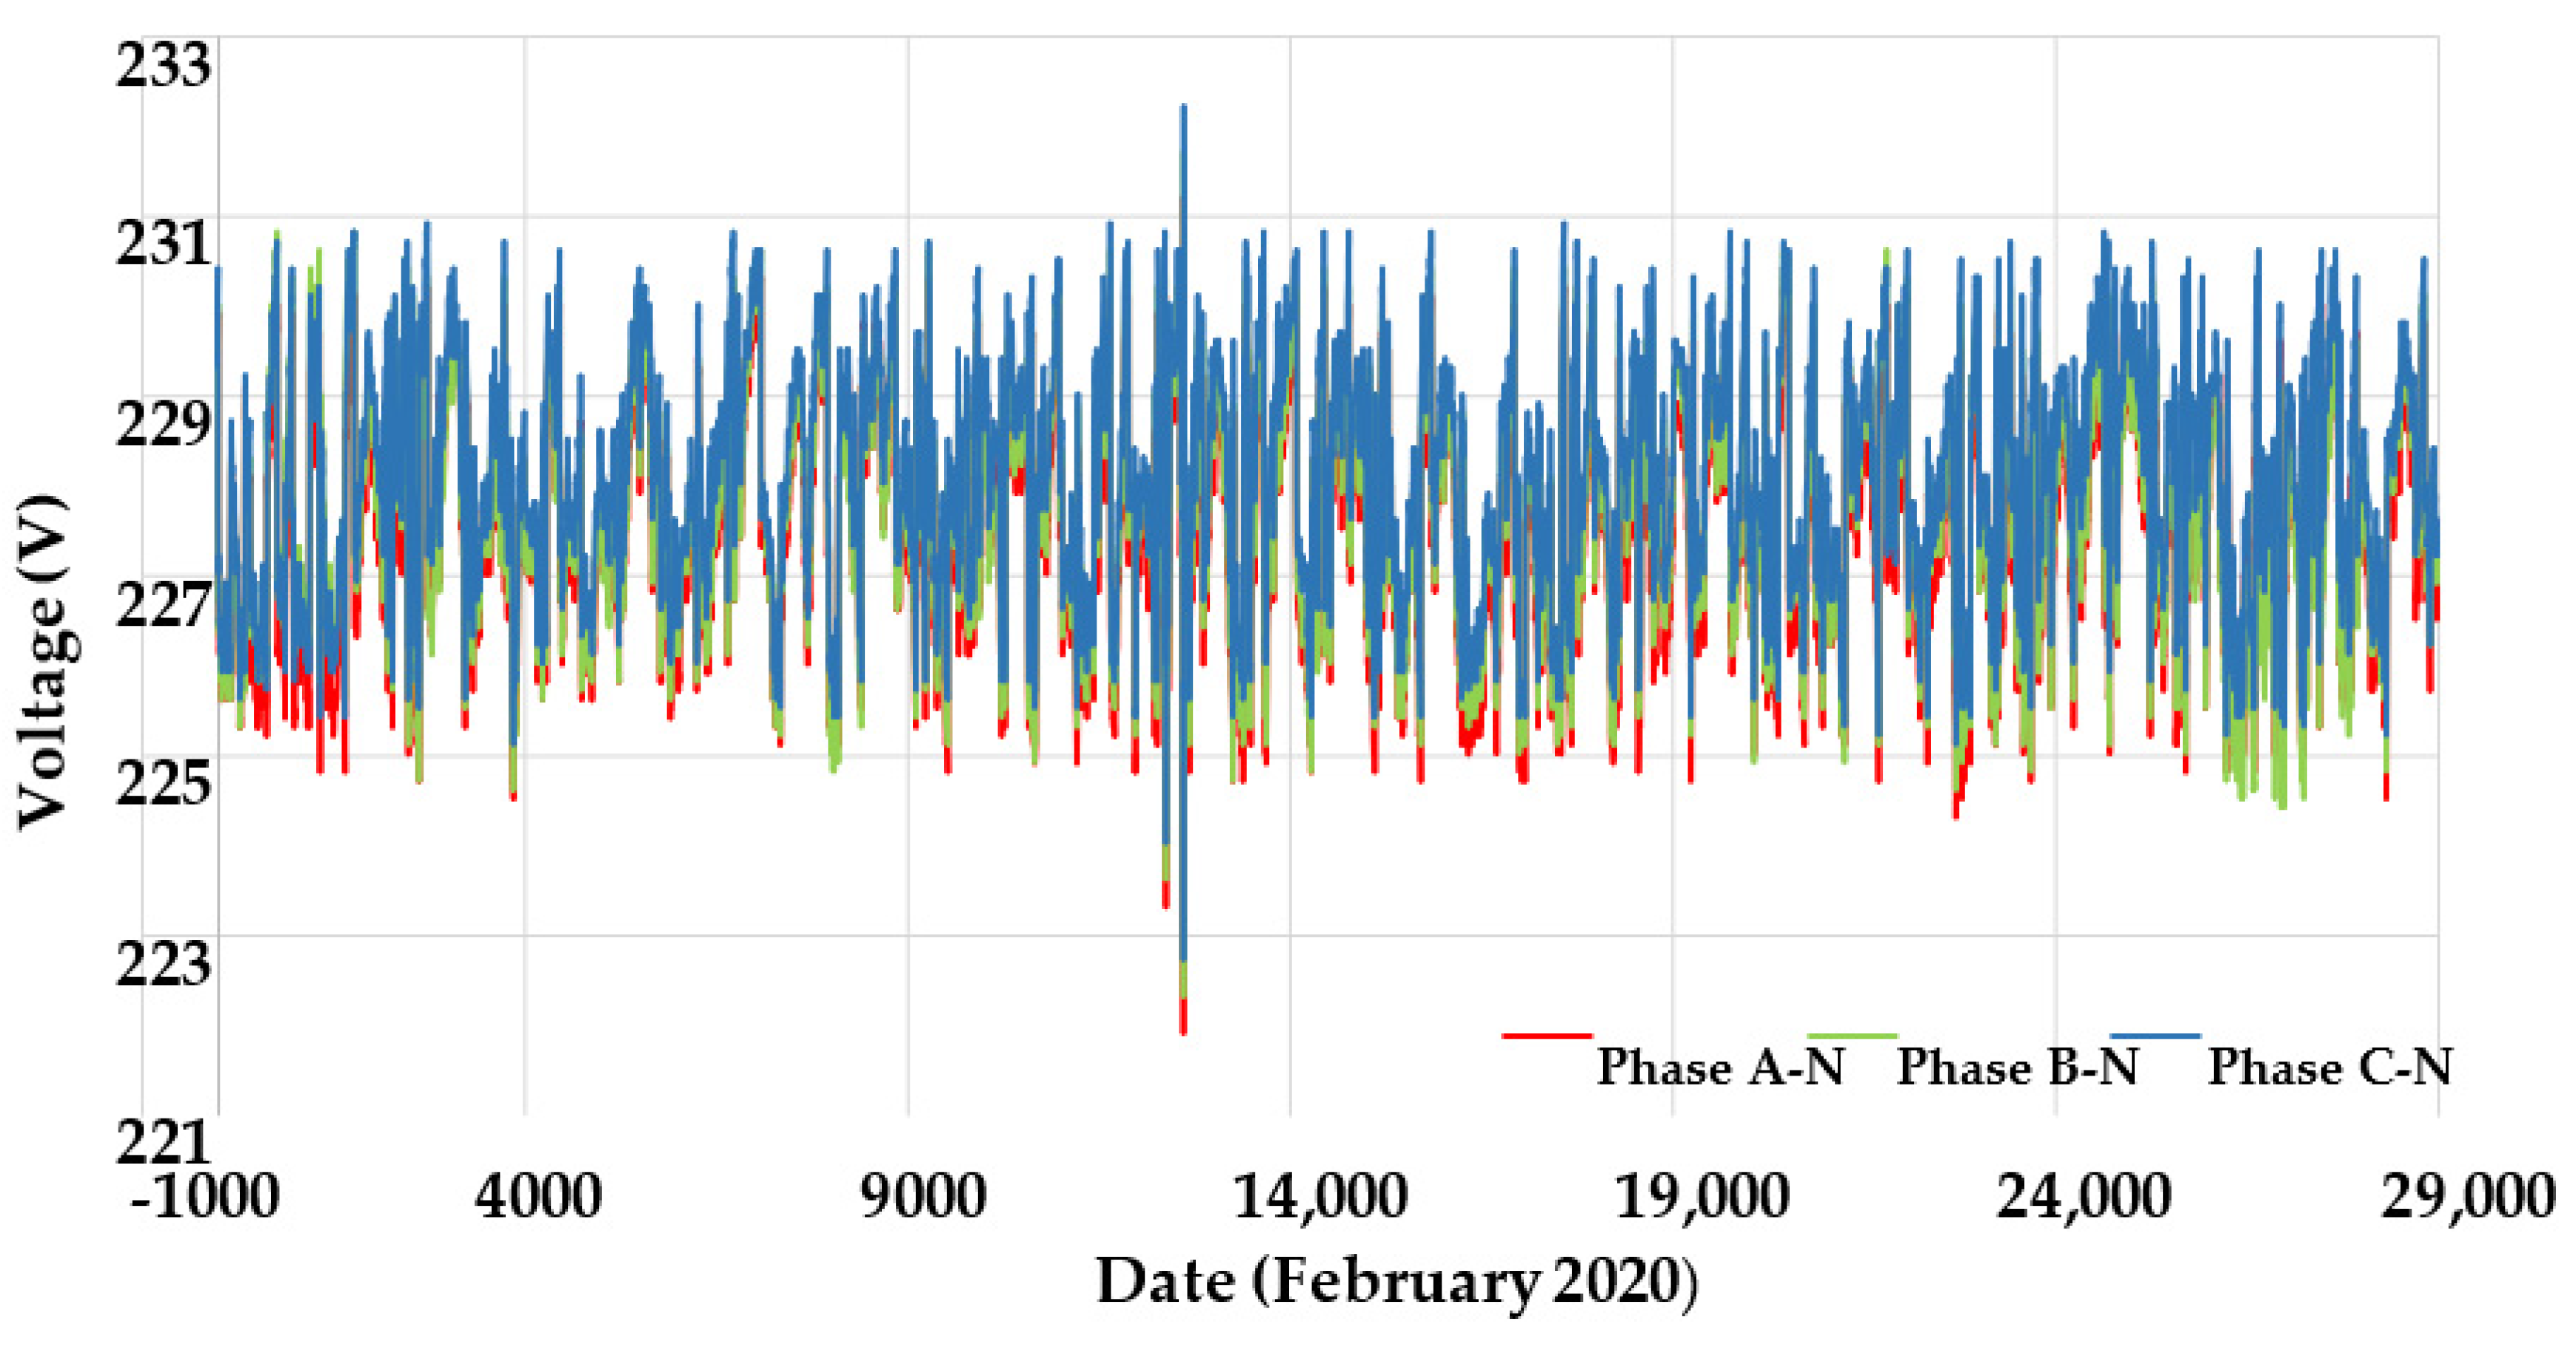
Figure 2 shows the measured voltage, the 5-min rms value during February 2020.
The laboratory where the experiment was performed is fed from a nearby distribution transformer and there is a cable directly from the transformer to the laboratory. The voltage at the transformer is therefore a good estimate of the voltage to which the lamps have been exposed. There was a PQube power quality monitor installed on low voltage side of the distribution transformer that feeds the lab and some office buildings on Campus Skellefteå.
Figure 2 shows that the voltage varies, most of the time, between 225 and 231 V; the difference between the phases is small. There are some periods with a marginal increase and decrease in voltages, i.e., about 1 V above or about 2 V below. However, since this is a long-term experiment, it will not have any major effect on the result. If we assume that there is a 1-V voltage drop between the transformer and the lamps, then the following voltages apply to the lamps:
- ➢
Group 1 (control group): 224–230 V, or 97–100% of rated voltage;
- ➢
Group 2 (undervoltage): 202–207 V, or 88–90% of rated voltage;
- ➢
Group 3 (overvoltage): 246–253 V, or 107–110% of rated voltage.
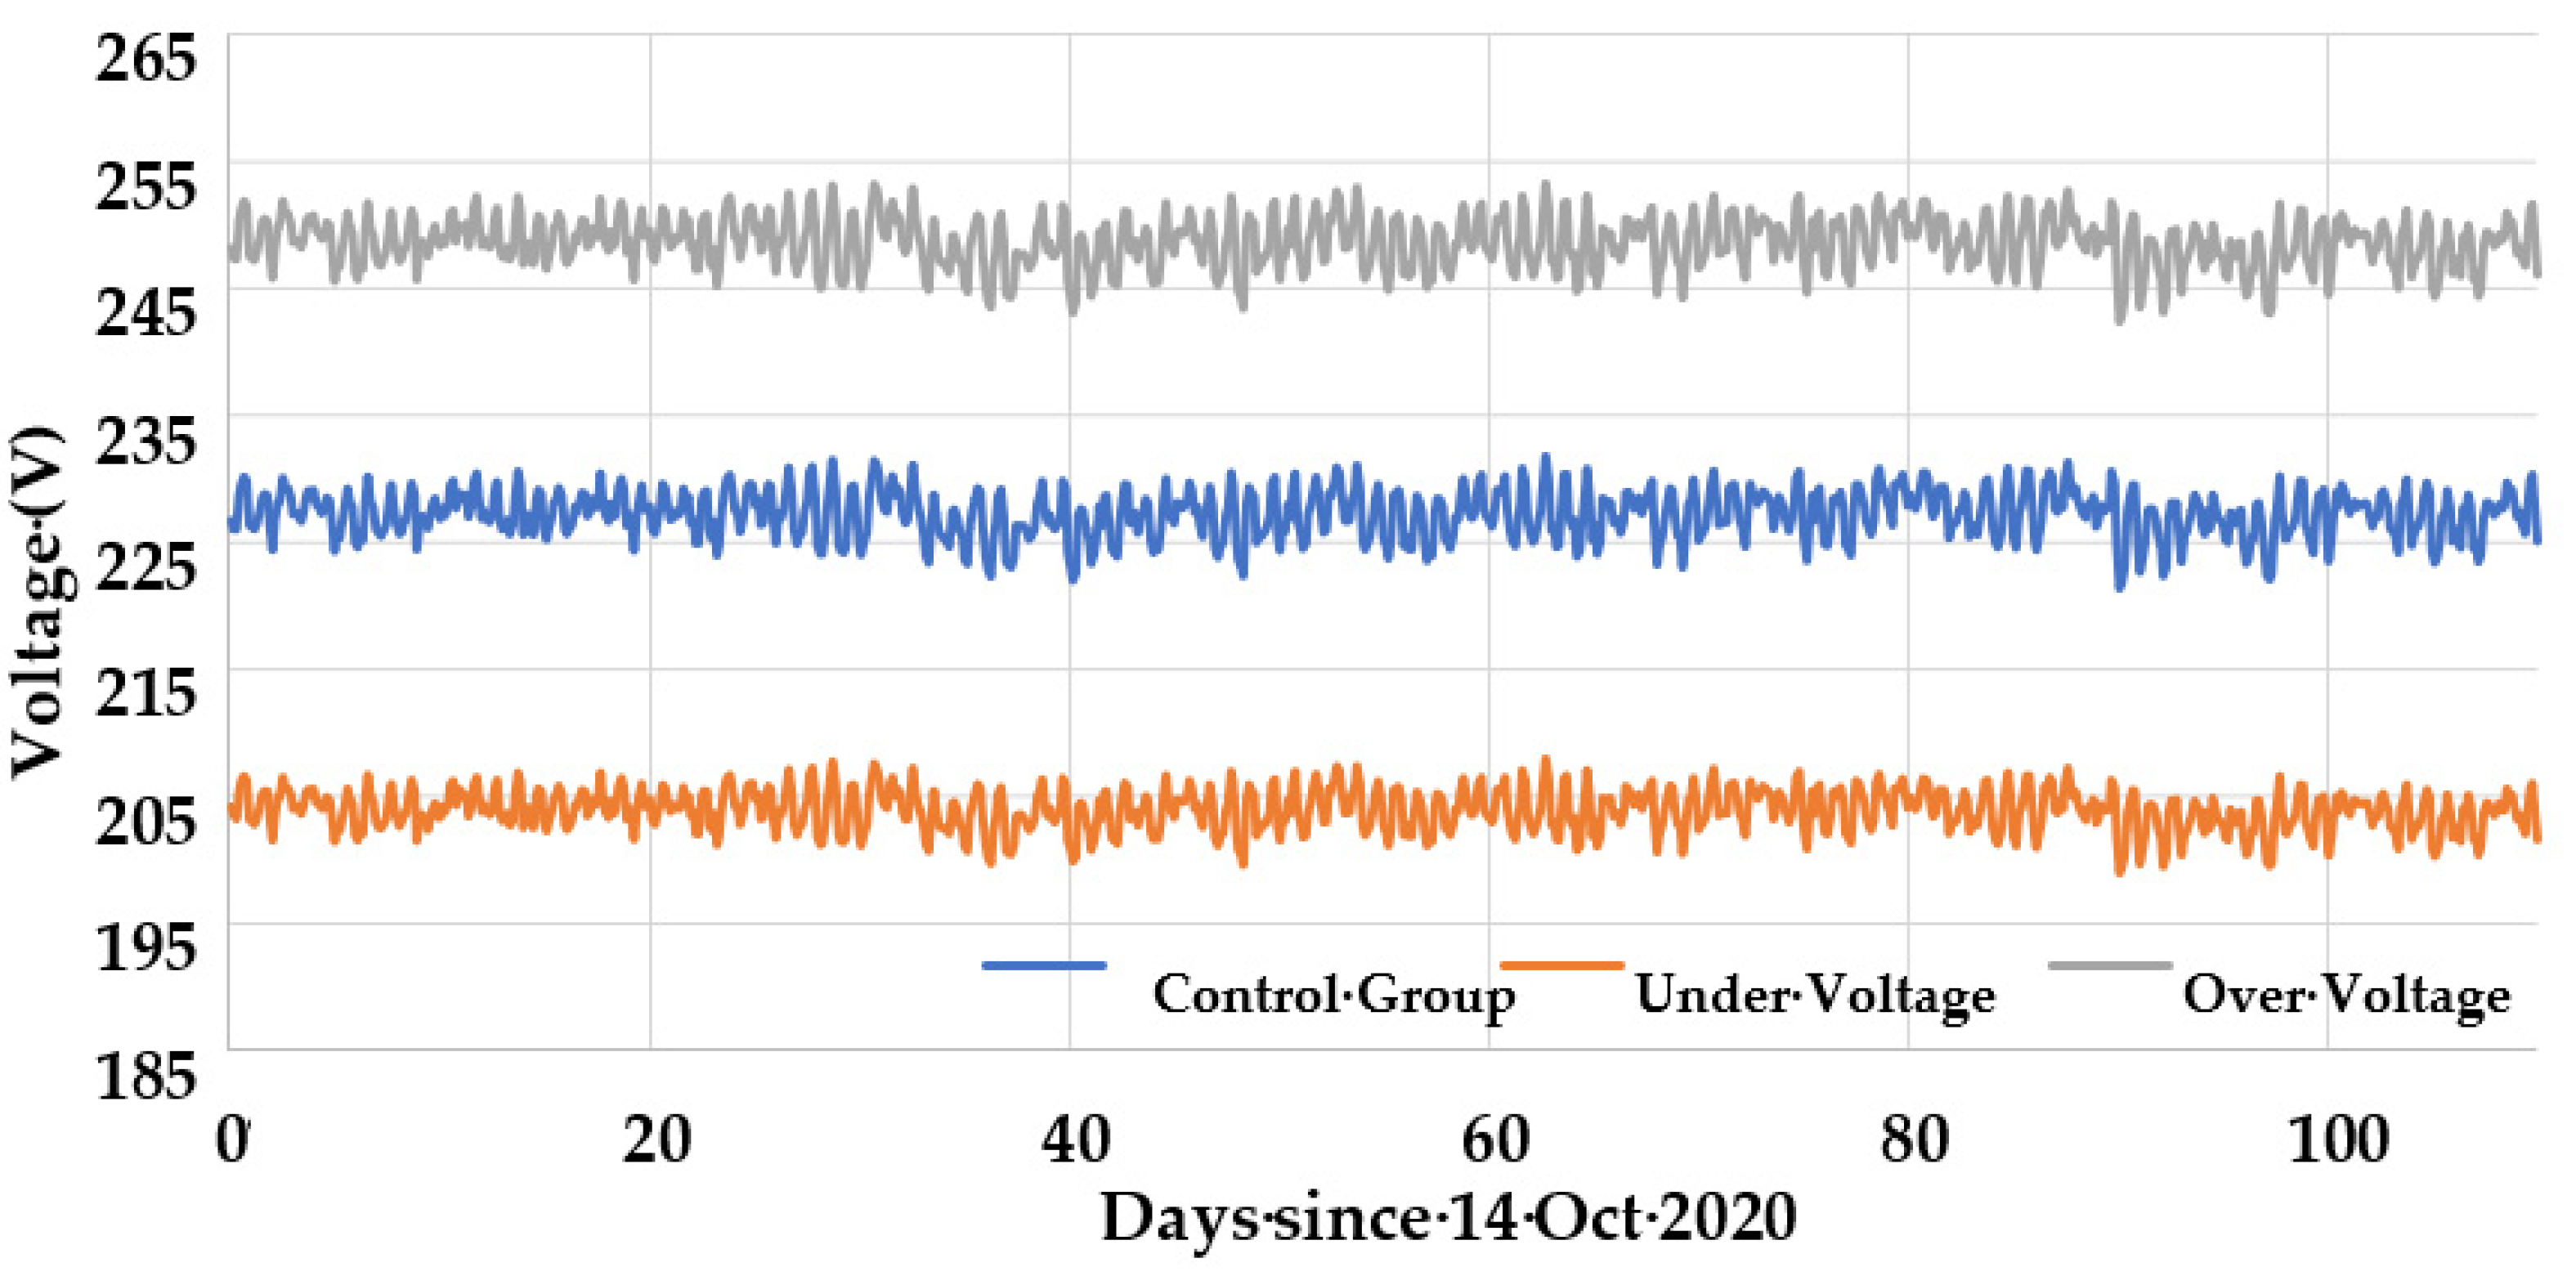
Voltage measurements over a longer period, near the lamps, are shown in
Figure 3. In this case, the rms value over a three-hour period is shown, for groups 1, 2, and 3. The results of the voltage to which the lamps were exposed were the same as the results of measurements with the distribution transformer. The measurements in
Figure 3 also show that the voltages in the three phases (groups) followed each other.
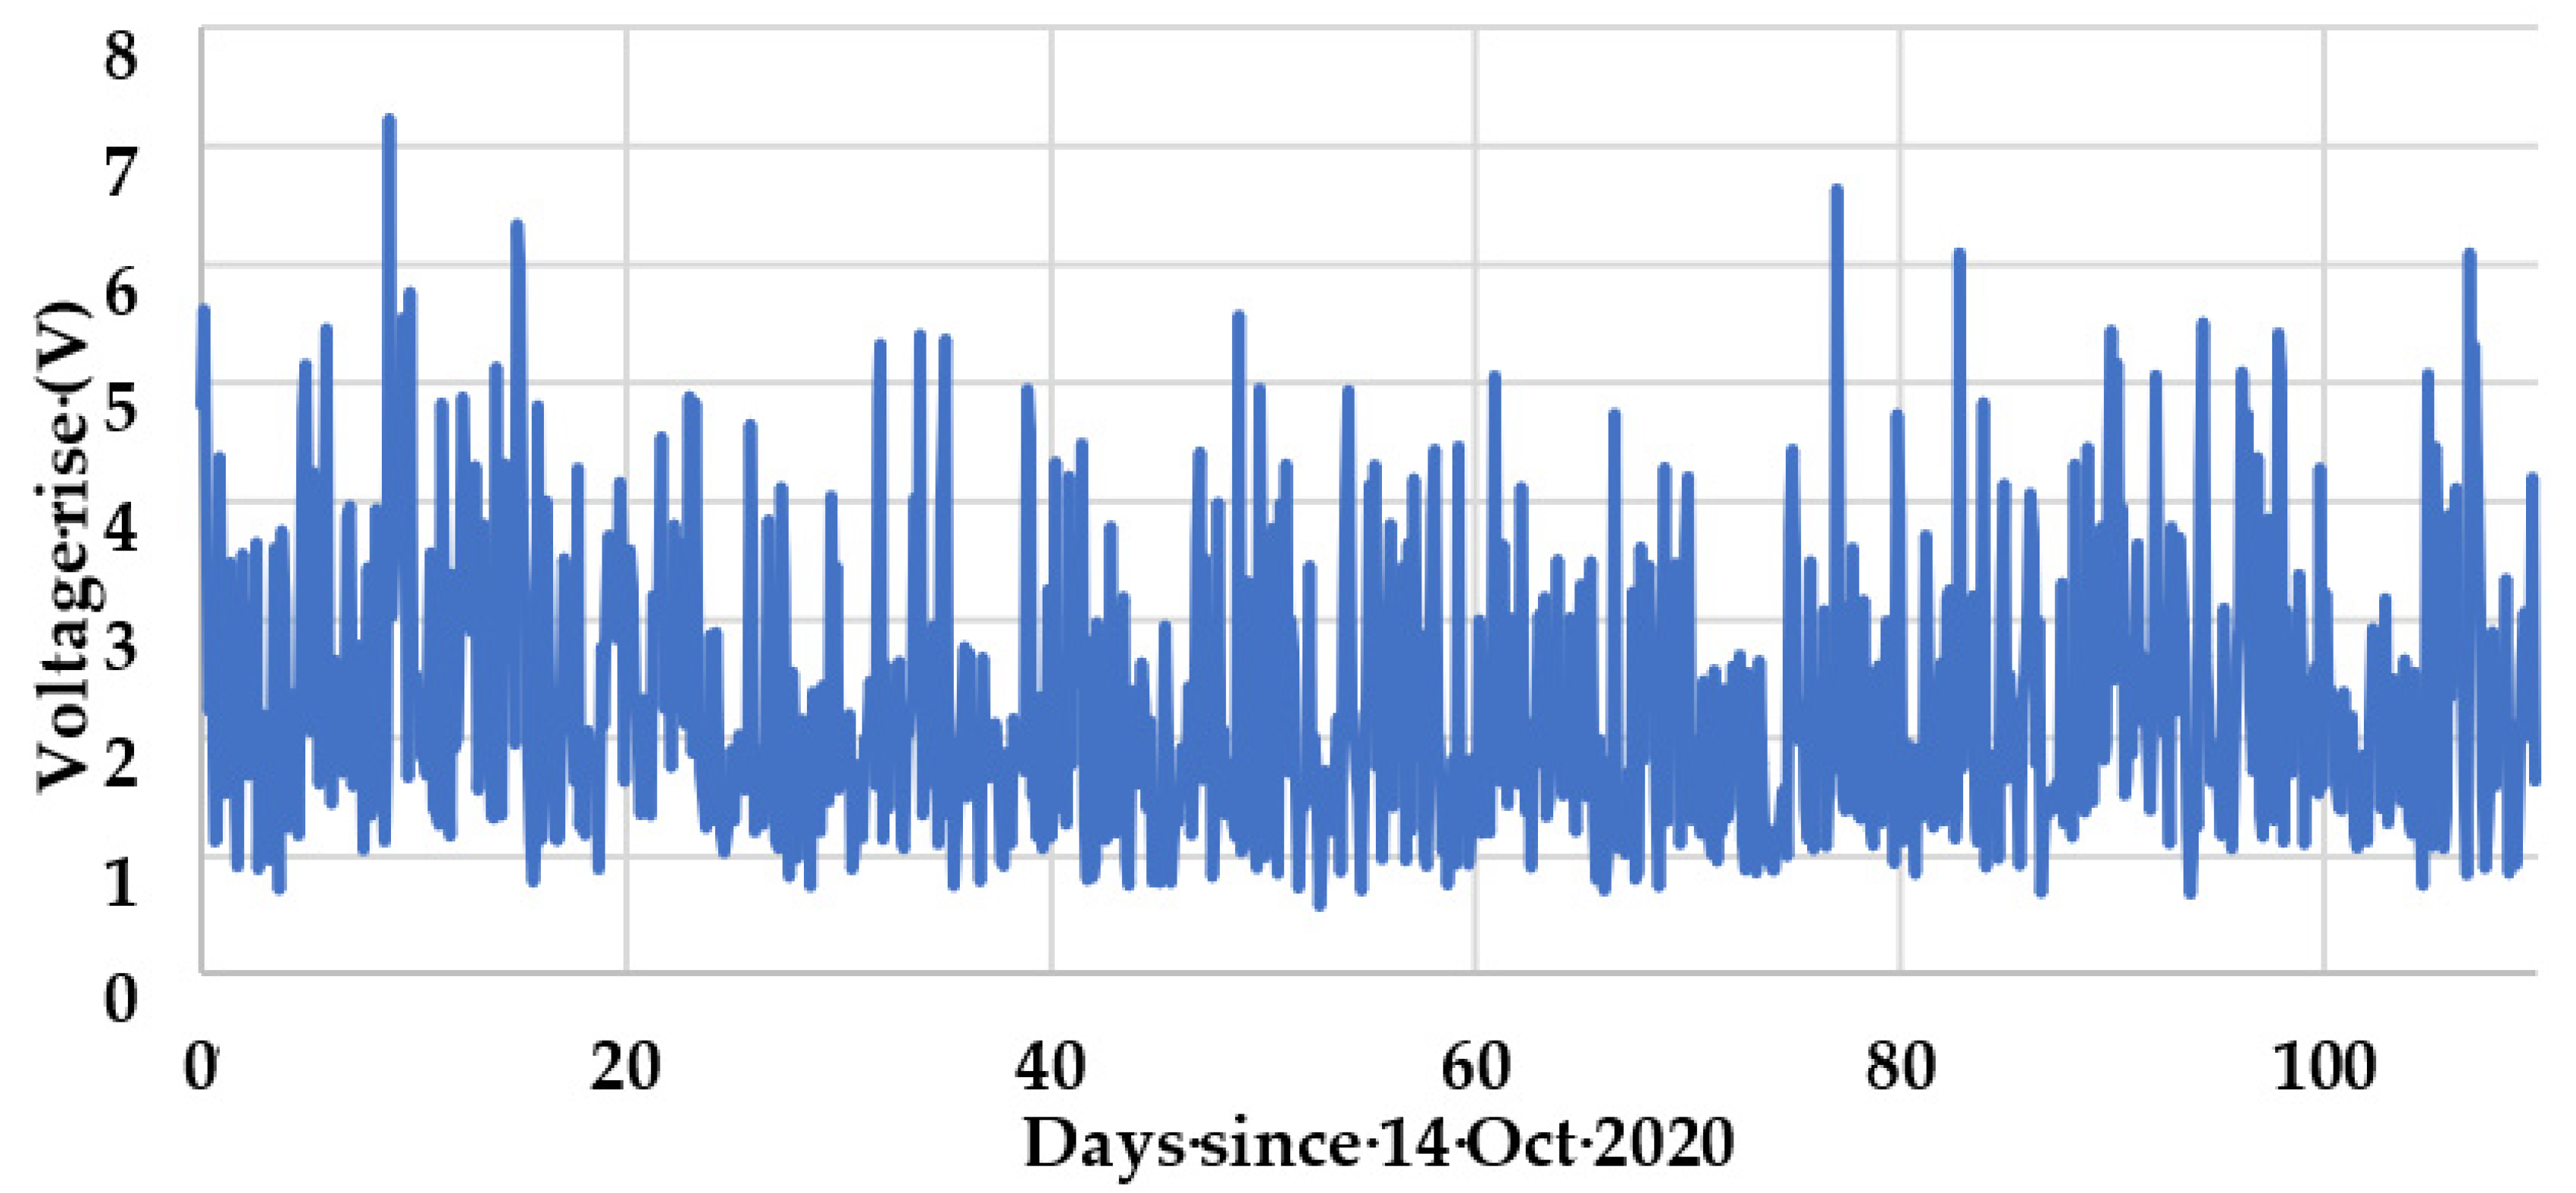
The voltage will not be constant for a 3-h period. From the measurement data over each 3-h period, the highest rms value over a period of 20 ms and the rms value over the entire period were calculated. The difference between these two values is shown in
Figure 4. The voltage varies less than 2% of the rated voltage over most 3-h periods. The highest measured variation is 3.1% of the rated voltage.
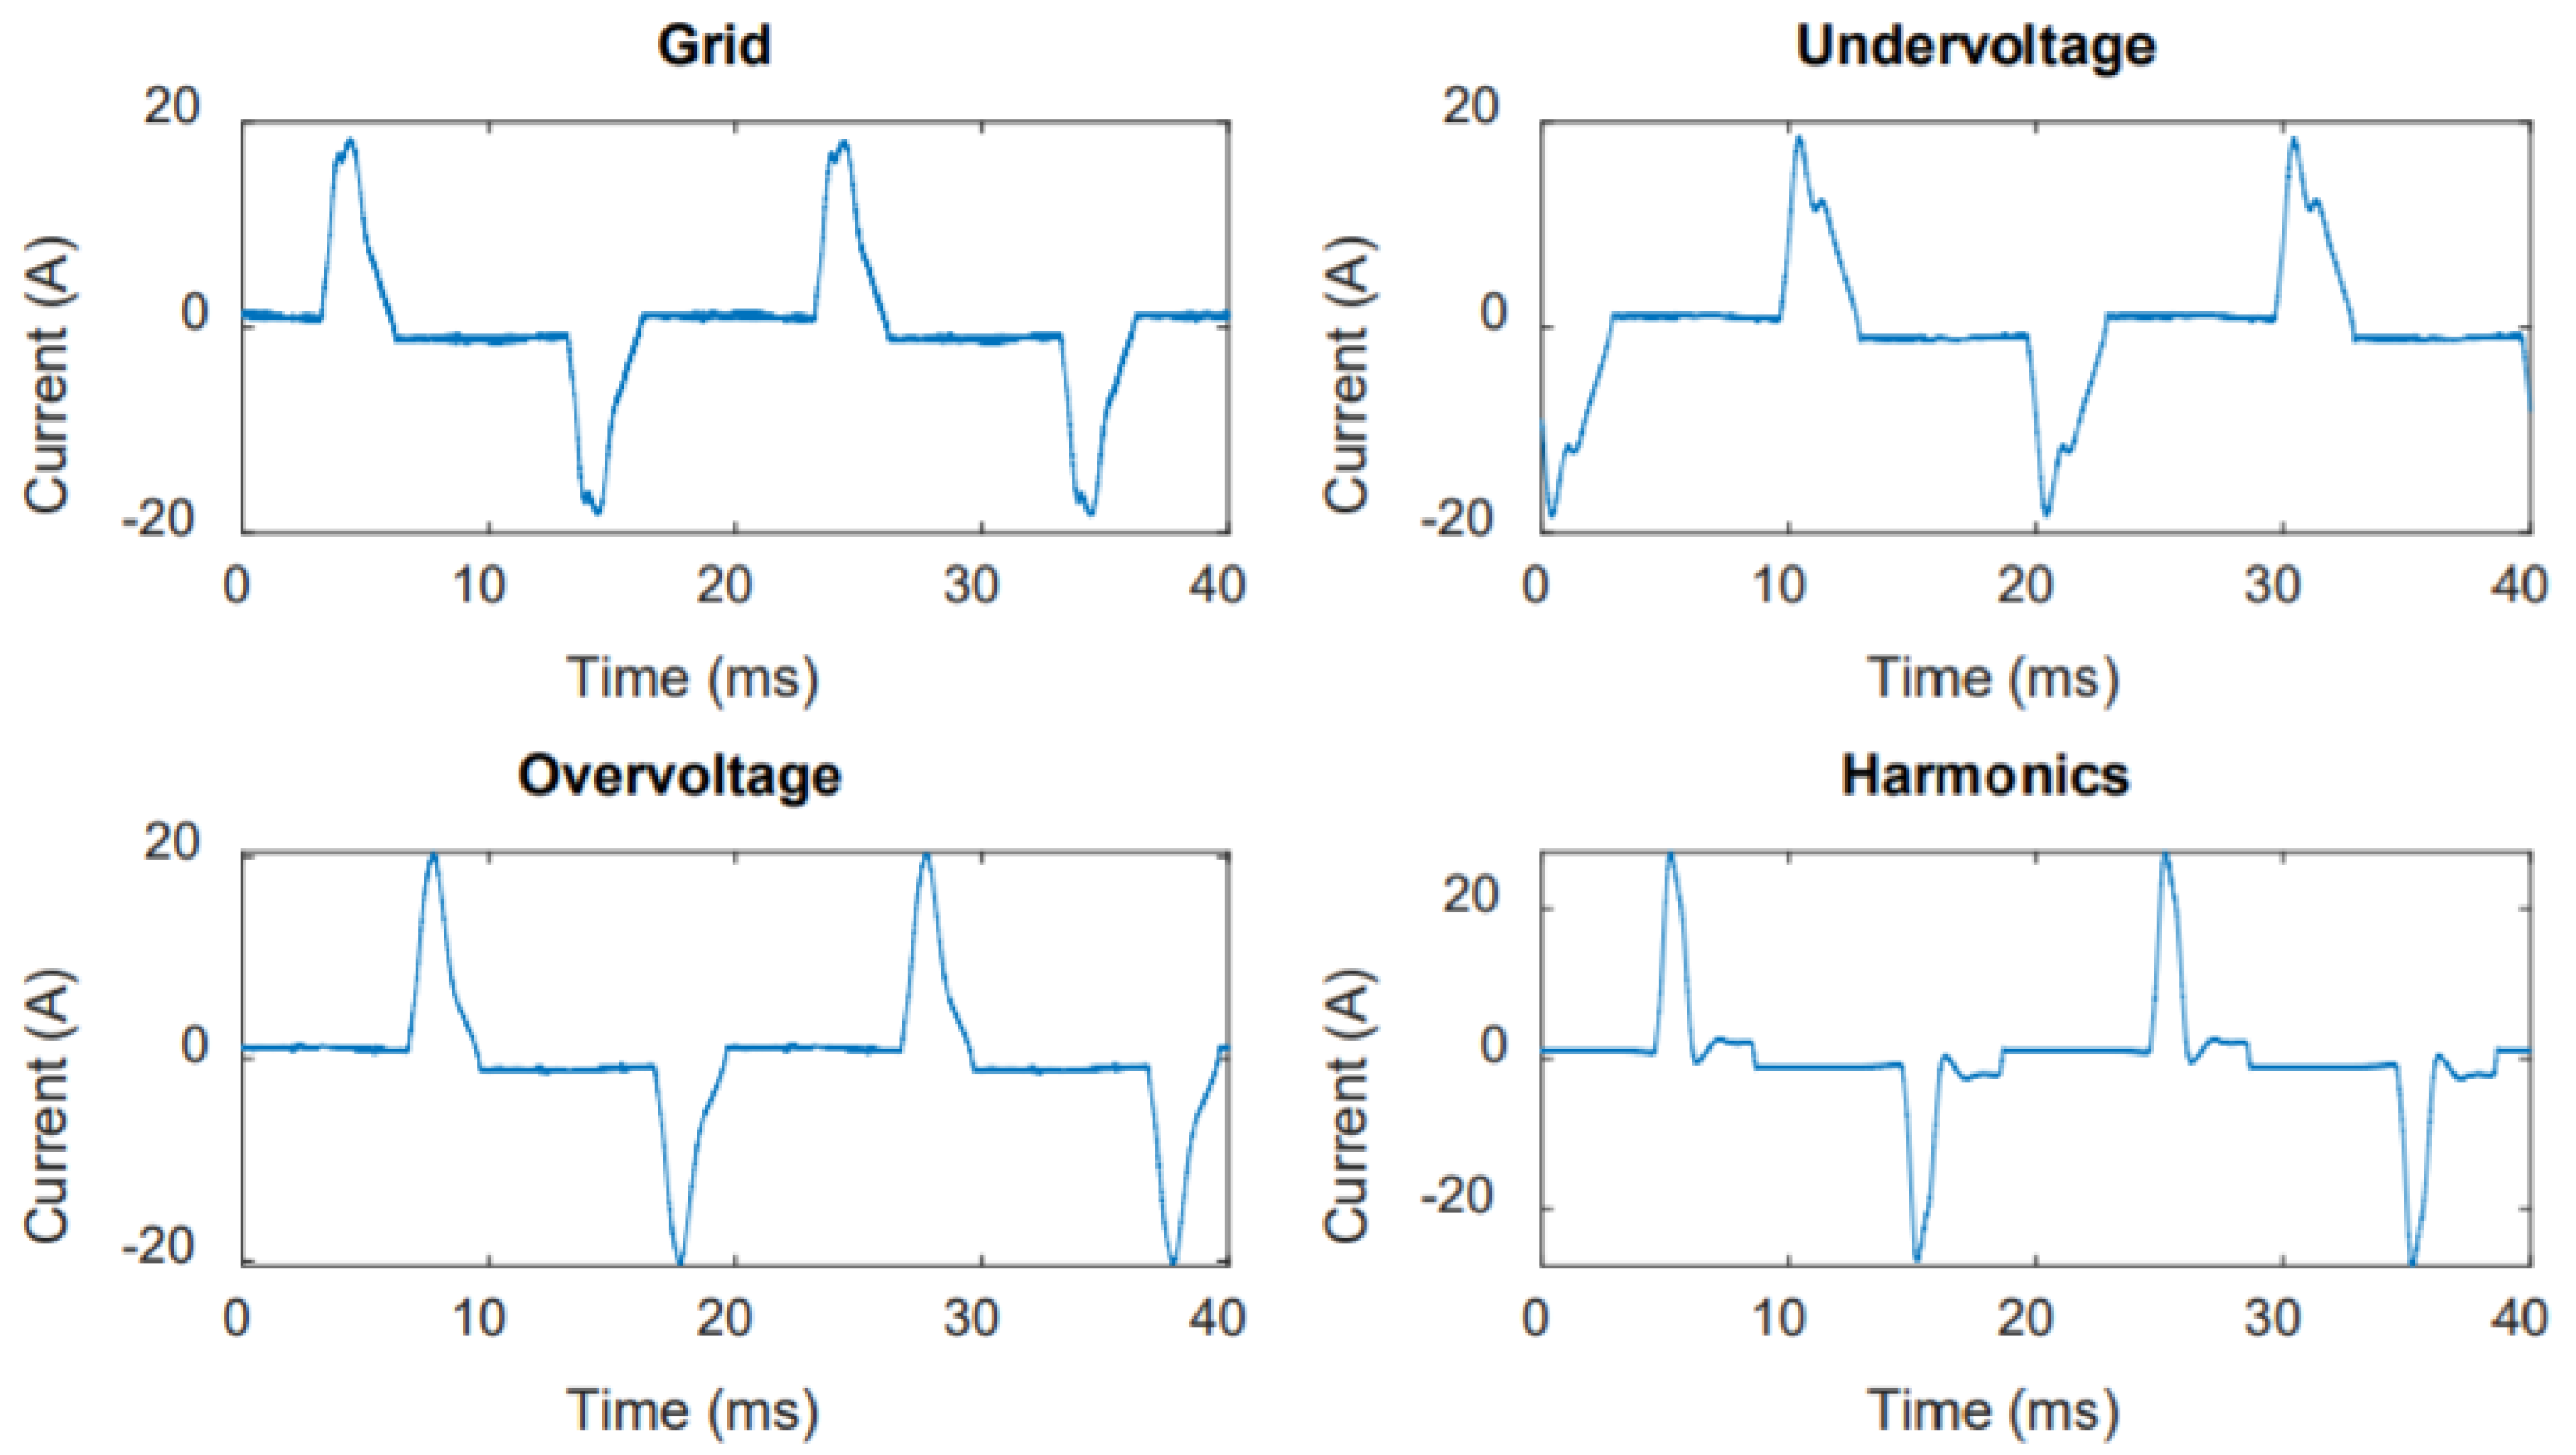
2.7. Impact of Background Voltage on Current
The current profile of the six groups of identical lamp were measured and is shown in
Figure 5. The group interruptions and transients current profile were similar to group 1, and hence not shown here.
The current total harmonic distortion (THD) of 115% (grid), 103% (undervoltage), 123% (overvoltage), and 141% (harmonics) were obtained.
3. Results and Discussion
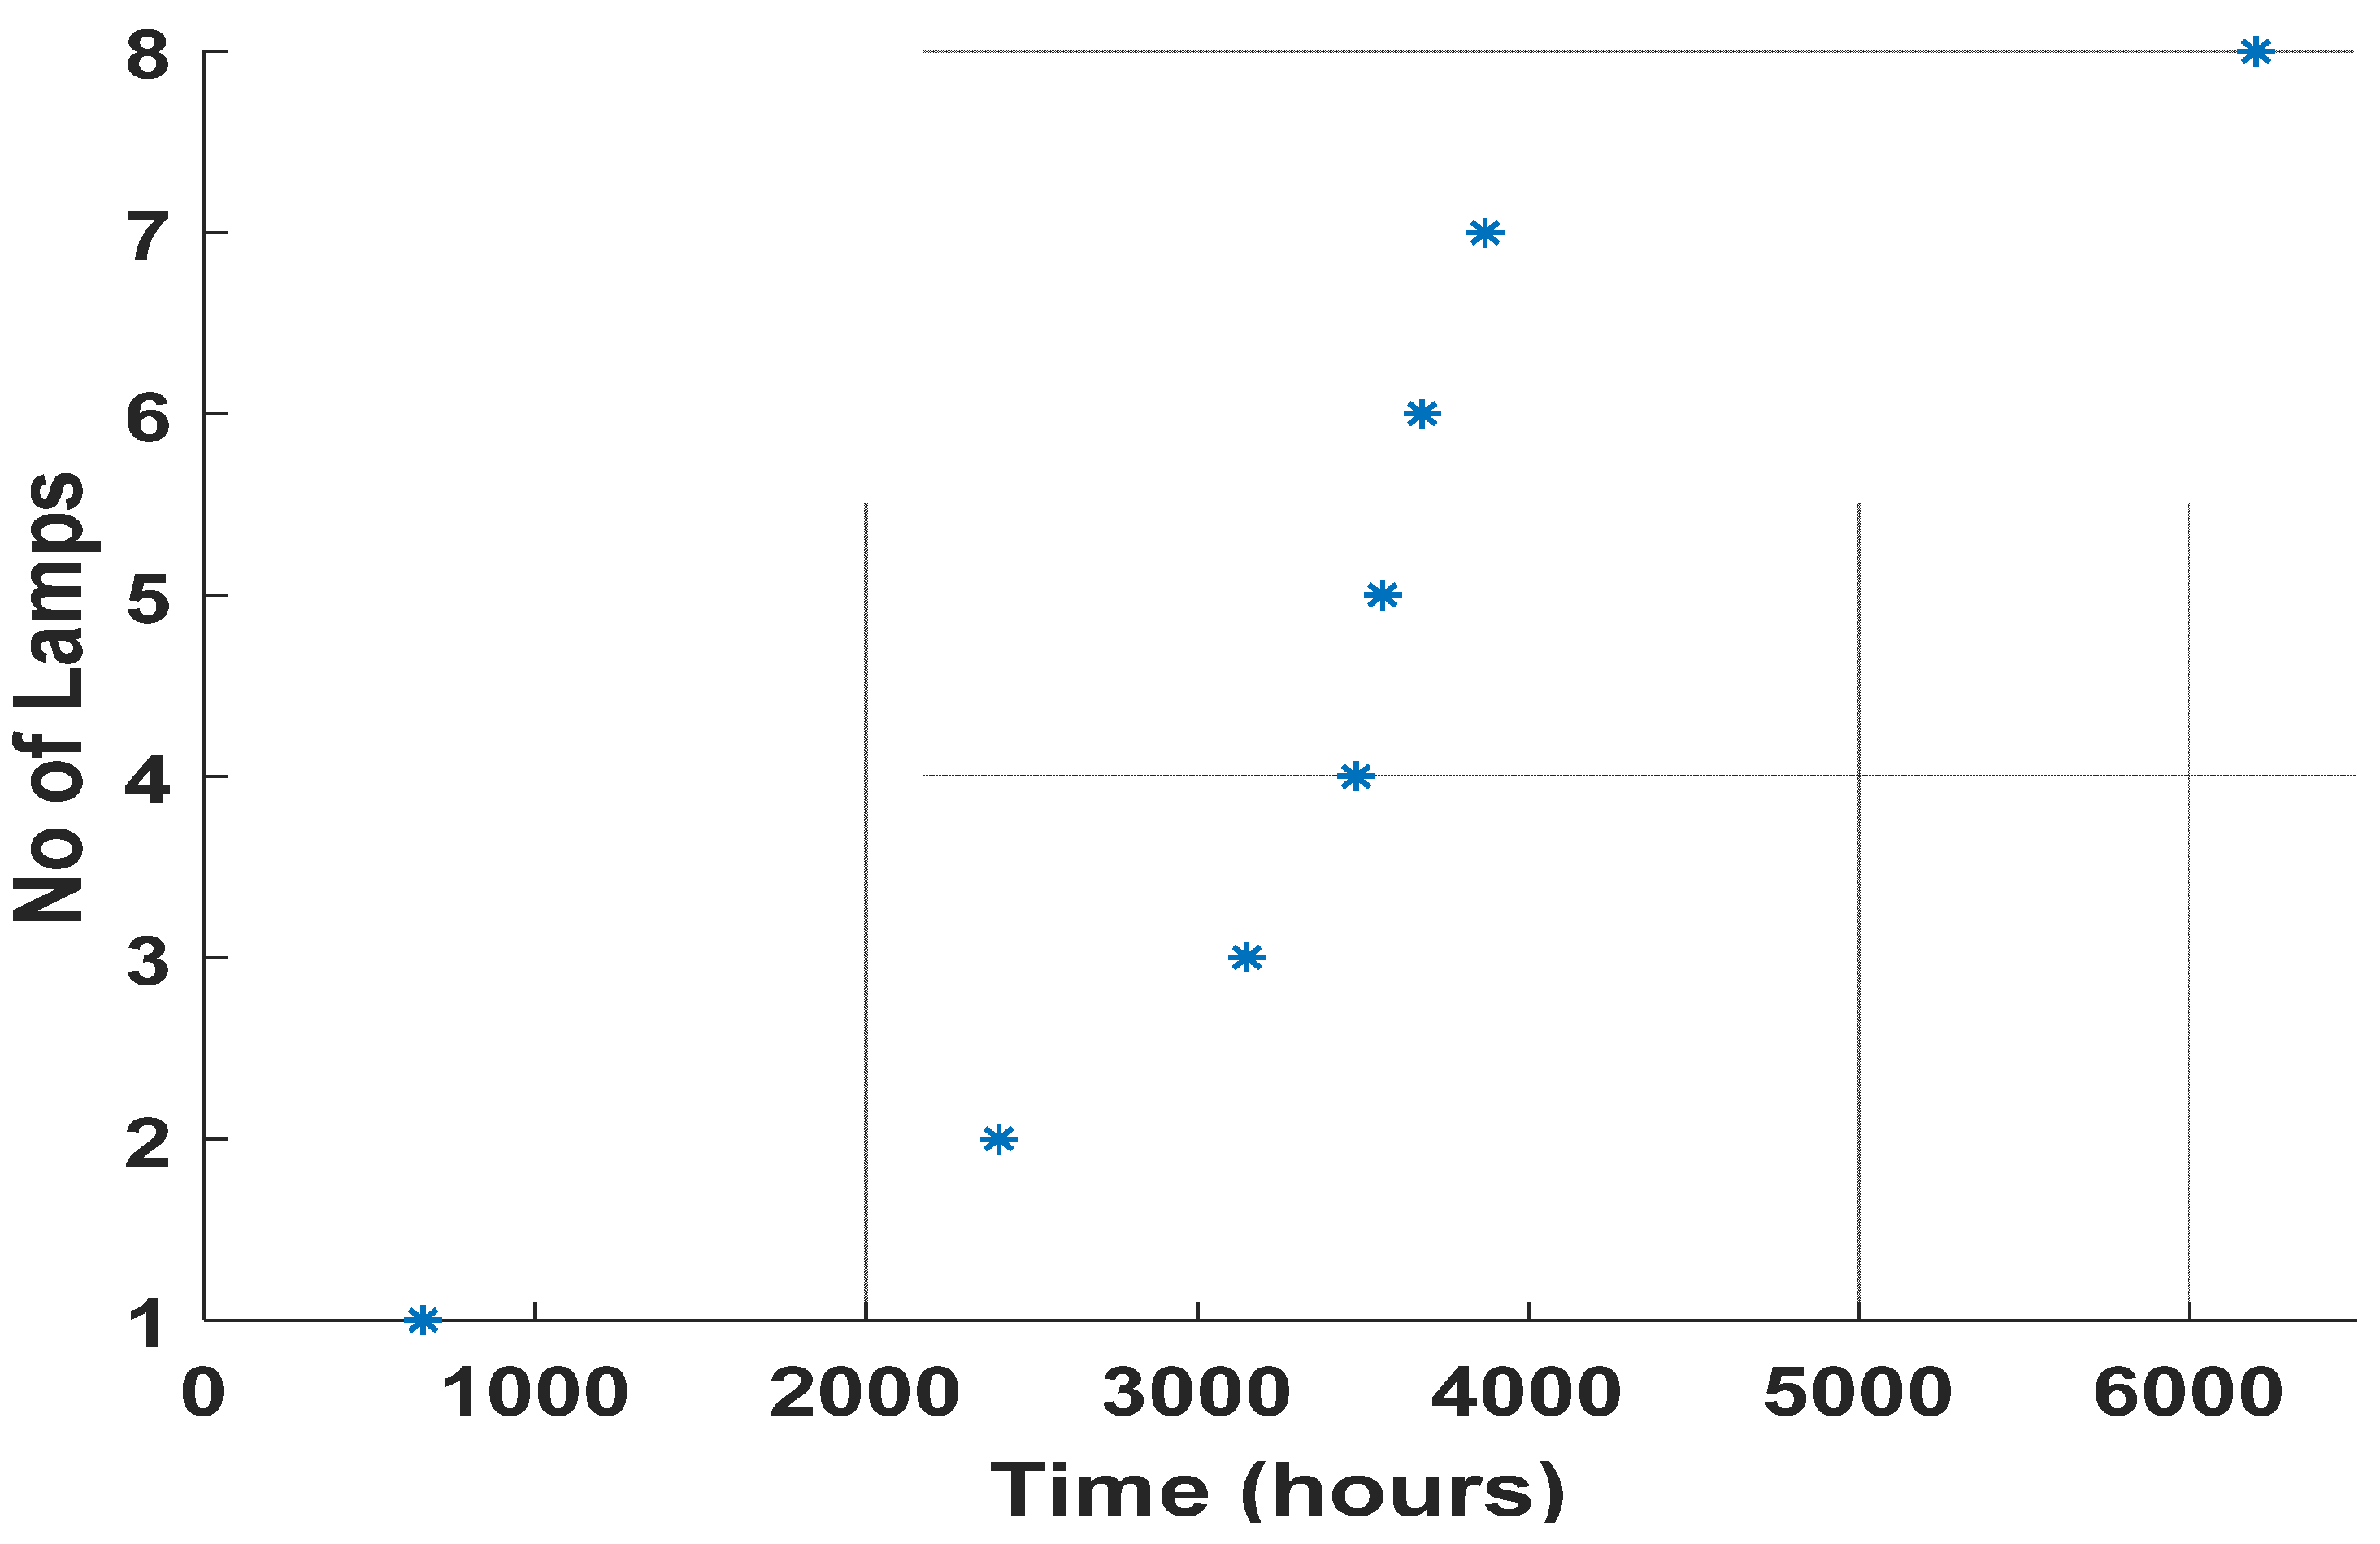
3.1. Lamps that Failed
Eight lamps failed (“extinguished”) during the test period. All those lamps were of the filament-based model (Type 4) and they had all been exposed to overvoltage. No other lamps failed. If we assume the entire population (1080 lamps) and 6618 h, then the failure rate was:
Lamps failed at the following operating times: 660, 2400, 3150, 3480, 3560, 3680, 3870, and 6200 h. It was determined through physical verification on hourly basis and precise time was obtained using the electrical parameters obtained from the PLC data. This is shown in
Figure 6.
If we focus on the Type 4 lamp and overvoltage, then 8 out of 45 lamps failed during a 6618-h period. Assuming that failures occur randomly then it would mean a failure rate equal to:
Or a time between failures equal to:
The manufacturer states a service life “up to 25,000 h”, which means that even this lamp, even in the event of an overvoltage, would still be able to fulfil what was promised, if one were to assume that the lifetime was the average lifetime, not the shortest lifetime.
However, the curve in
Figure 5 indicates that errors do not occur randomly. There is a clear concentration of failures between 3000 and 4000 h. There is another failure at 6000 h, which may indicate that there will be a new group of failures shortly after 6000 h; however, it can also be a purely random error.
It is also worth noticing that only some of the Type 4 lamps failed when they were exposed to overvoltage. Out of 45 lamps, 8 failed, as the last lamp could belong to a different failure mechanism than the others that failed. It is difficult to know what the reason was that around 15% of lamps failed between 3000 and 4000 h, while the rest lasted 6000 h and more.
Here it should also be added that this is no ordinary operating situation. There may be places in the grid when the voltage is on the high side (for example 108 to 110% of rated voltage). However, these voltages then occur only for part of the time; it may be that the voltage during the summer, especially early in the morning, is significantly higher than during the winter. However, in this experiment, the lamps were exposed to a voltage between 107 and 110% of rated voltage, for a whole year, which is very unusual in real life. A simple change in the off-load tap changer settings of the distribution transformer could lower the voltage by 2.5%, 5%, or even 7.5% without undervoltage occurring.
The lifetime distribution shown in
Figure 5 should also be compared with the lifetime of incandescent light bulbs, which was between 750 and 2000 h [
28] for normal voltage; long-term exposure to voltage above the rated voltage led to a large reduction in lifetime. All but one of the LED lamps had a lifetime longer than 2000 h.
According to [
29], the lifetime of incandescent lamps is inversely proportional with the voltage to the power of 13. A voltage equal to 107% (the lowest value to which they were exposed during the experiment), would then have reduced the lifetime to
of the life time at rated voltage; it would have a lifetime between 350 and 850 h, less than even the worst of the 1080 LED lights.
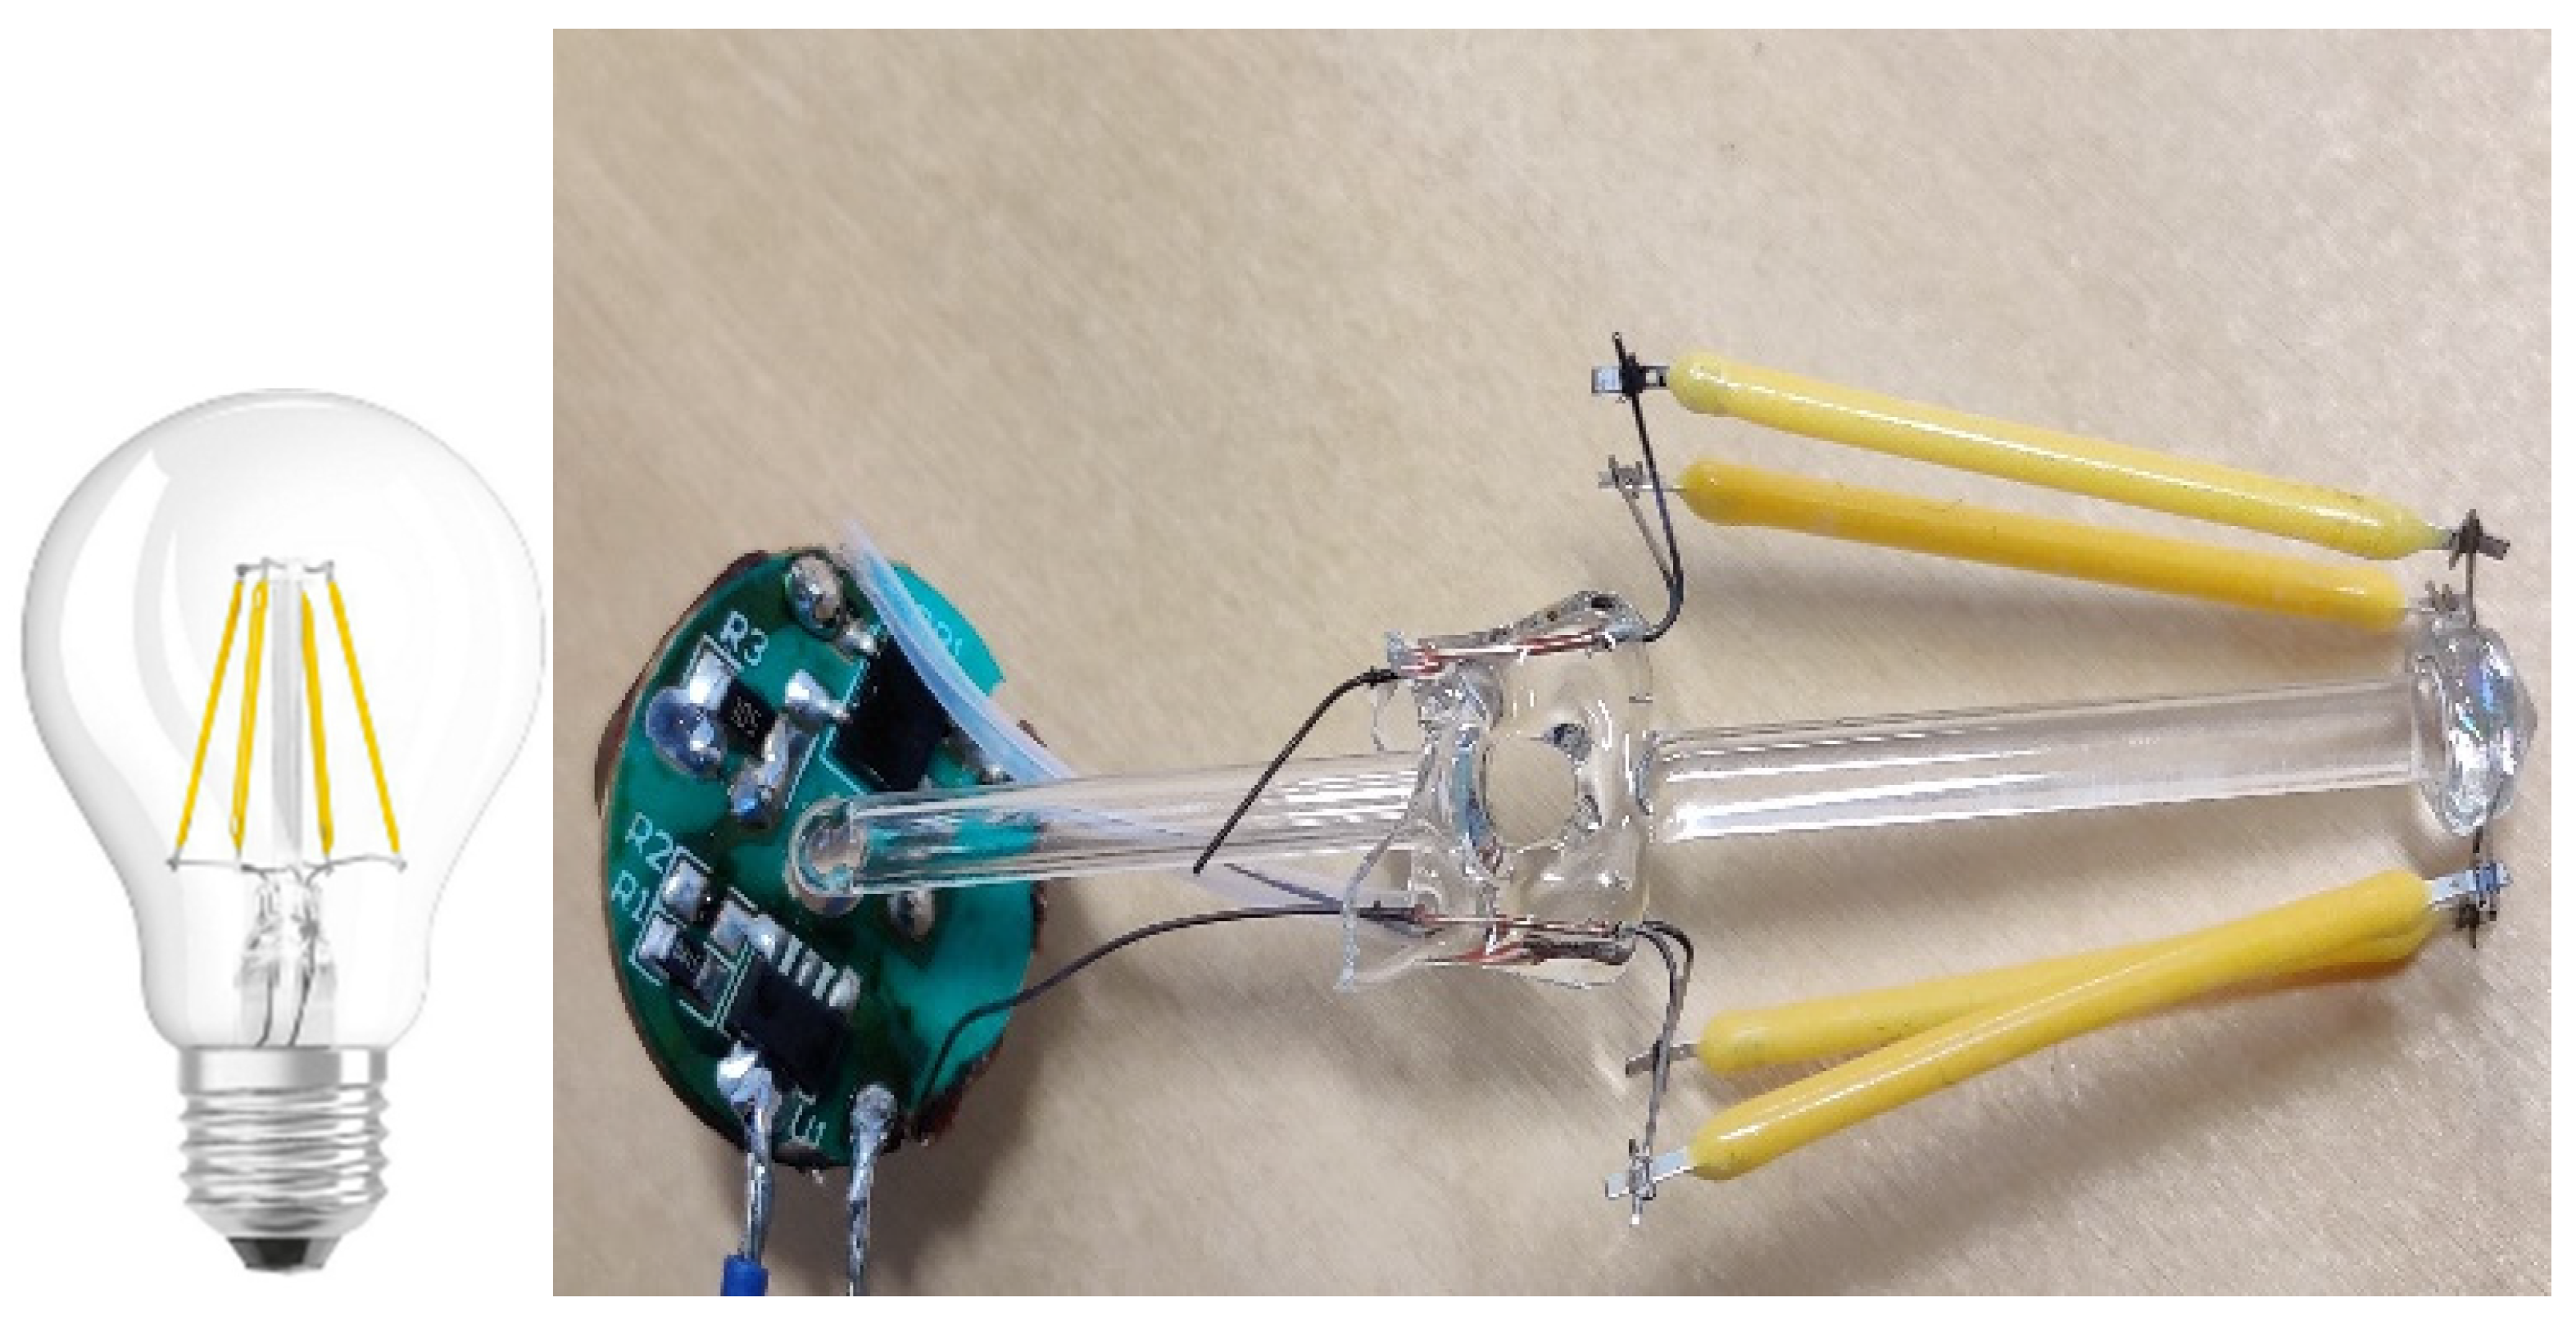
3.2. Detailed Analysis of the Failure Mechanism
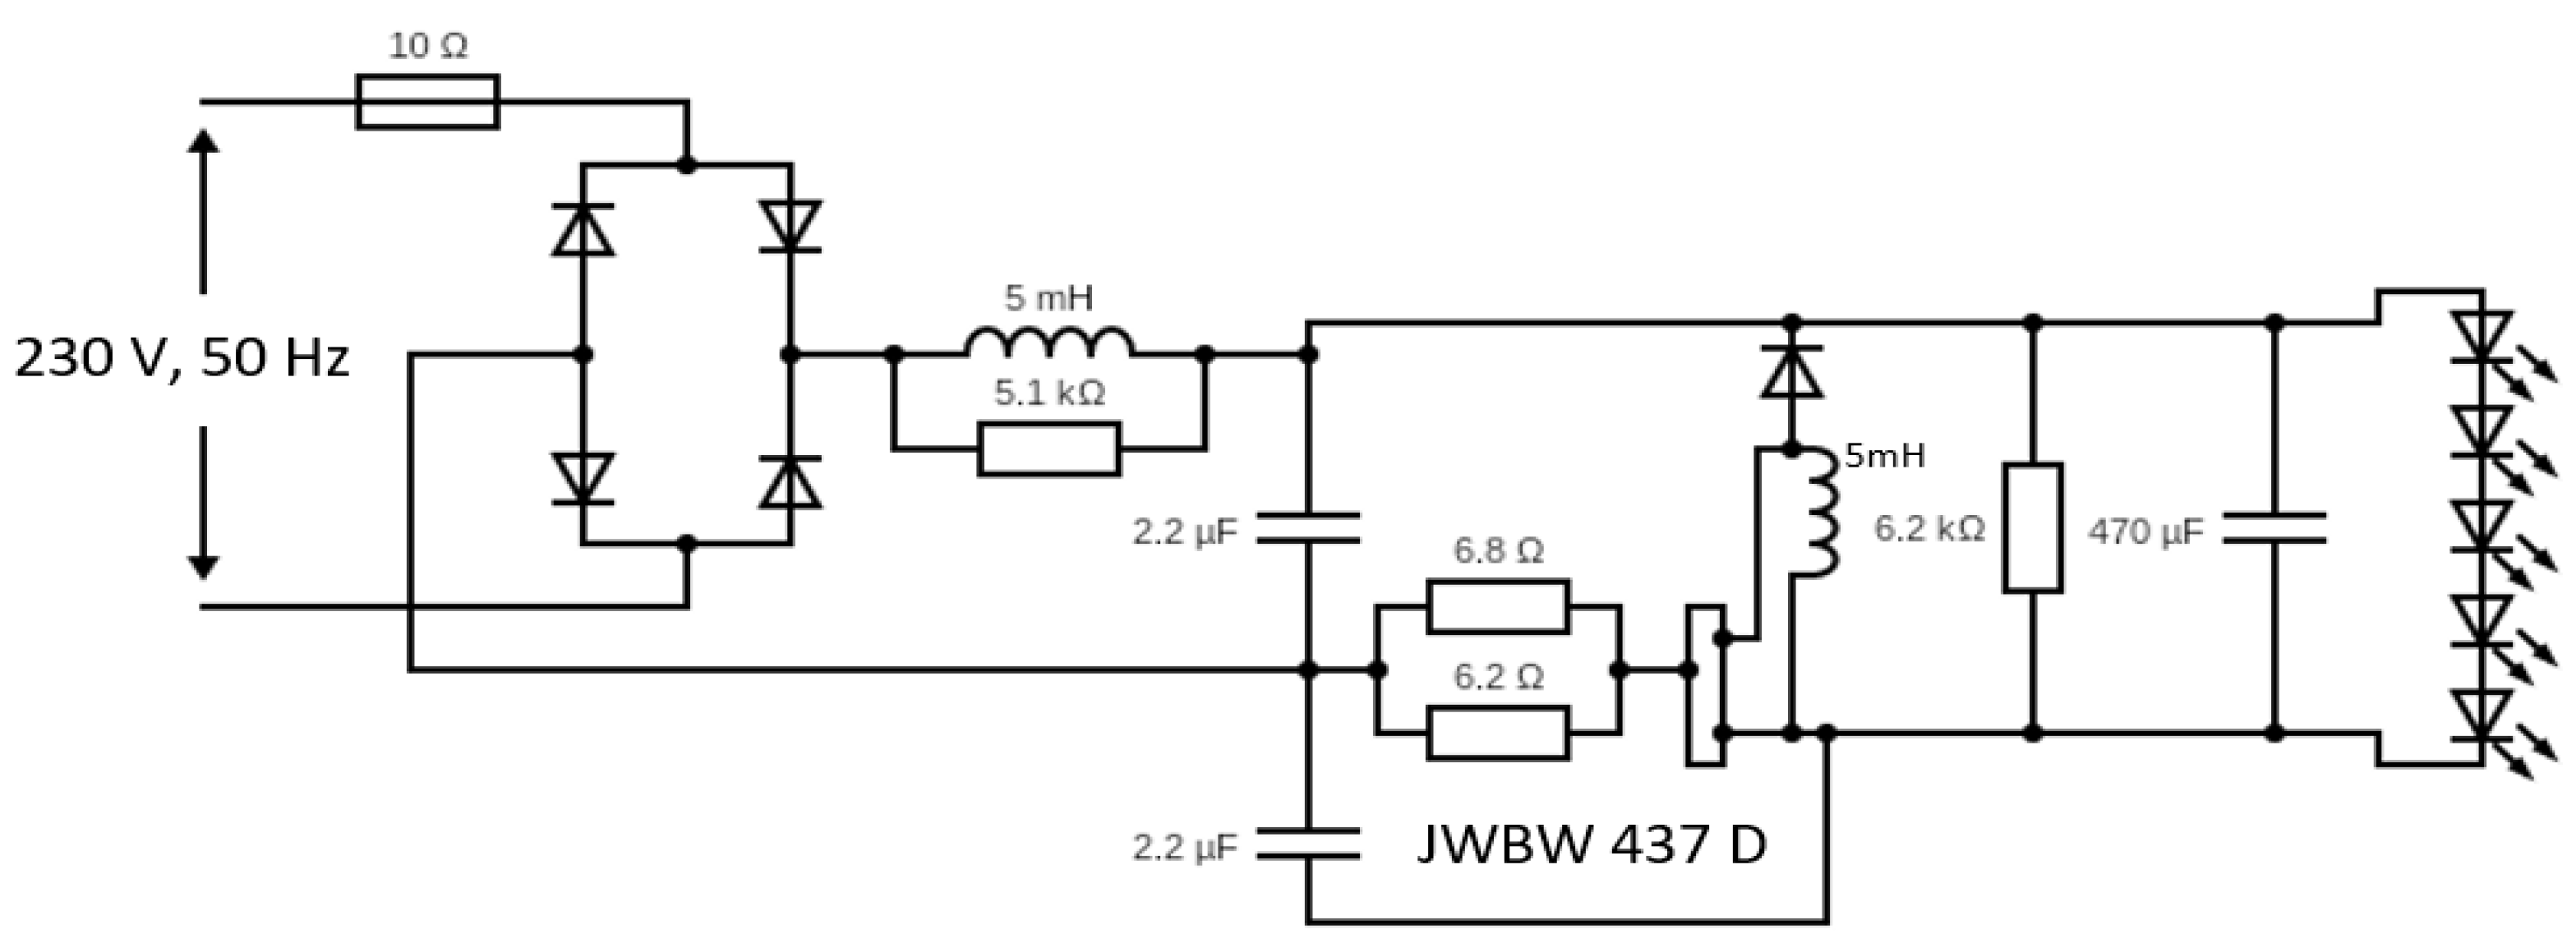
All lamps that failed under voltage stress were of Type D. The appearance of the lamp and the component inside are shown in
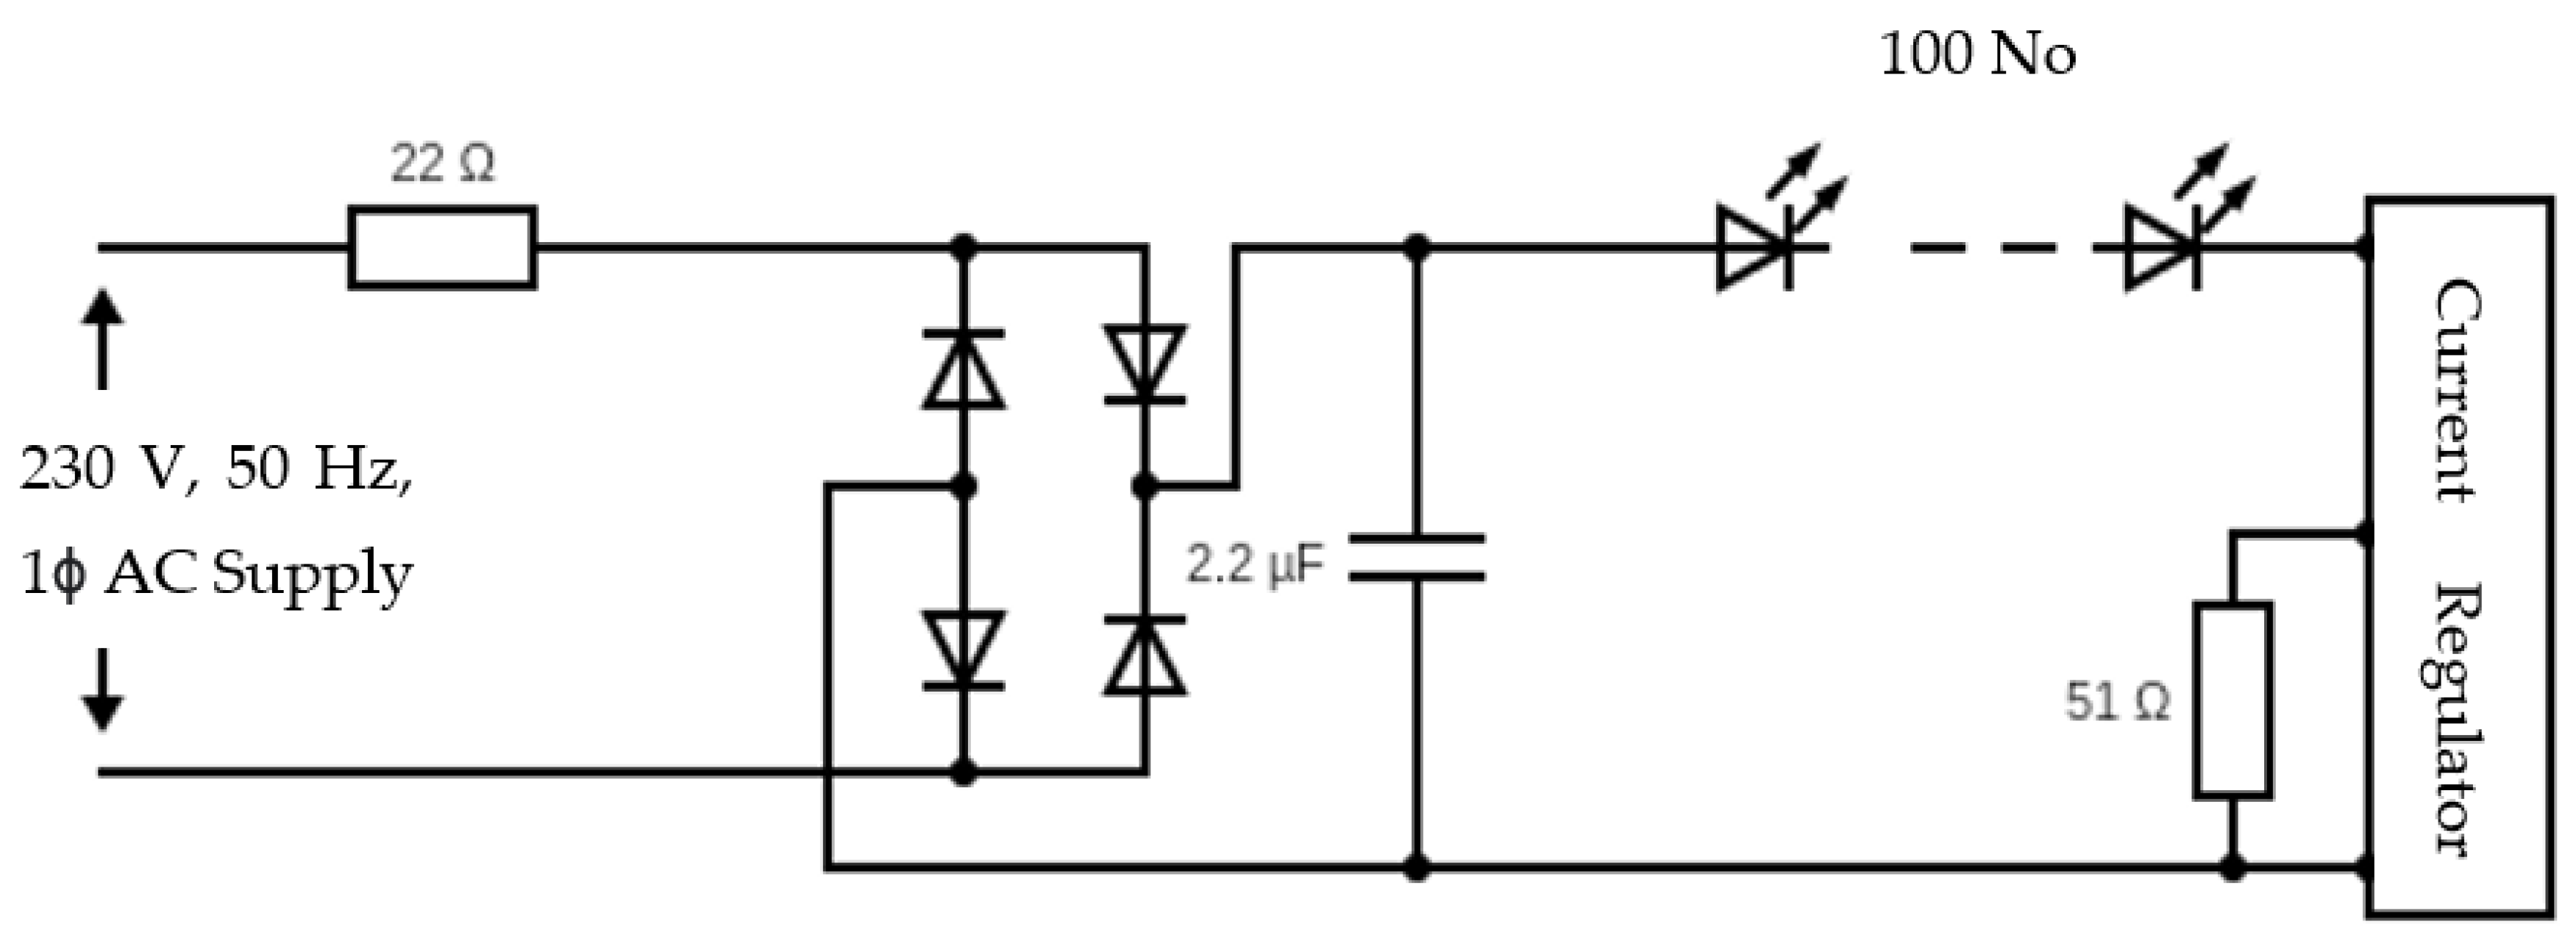
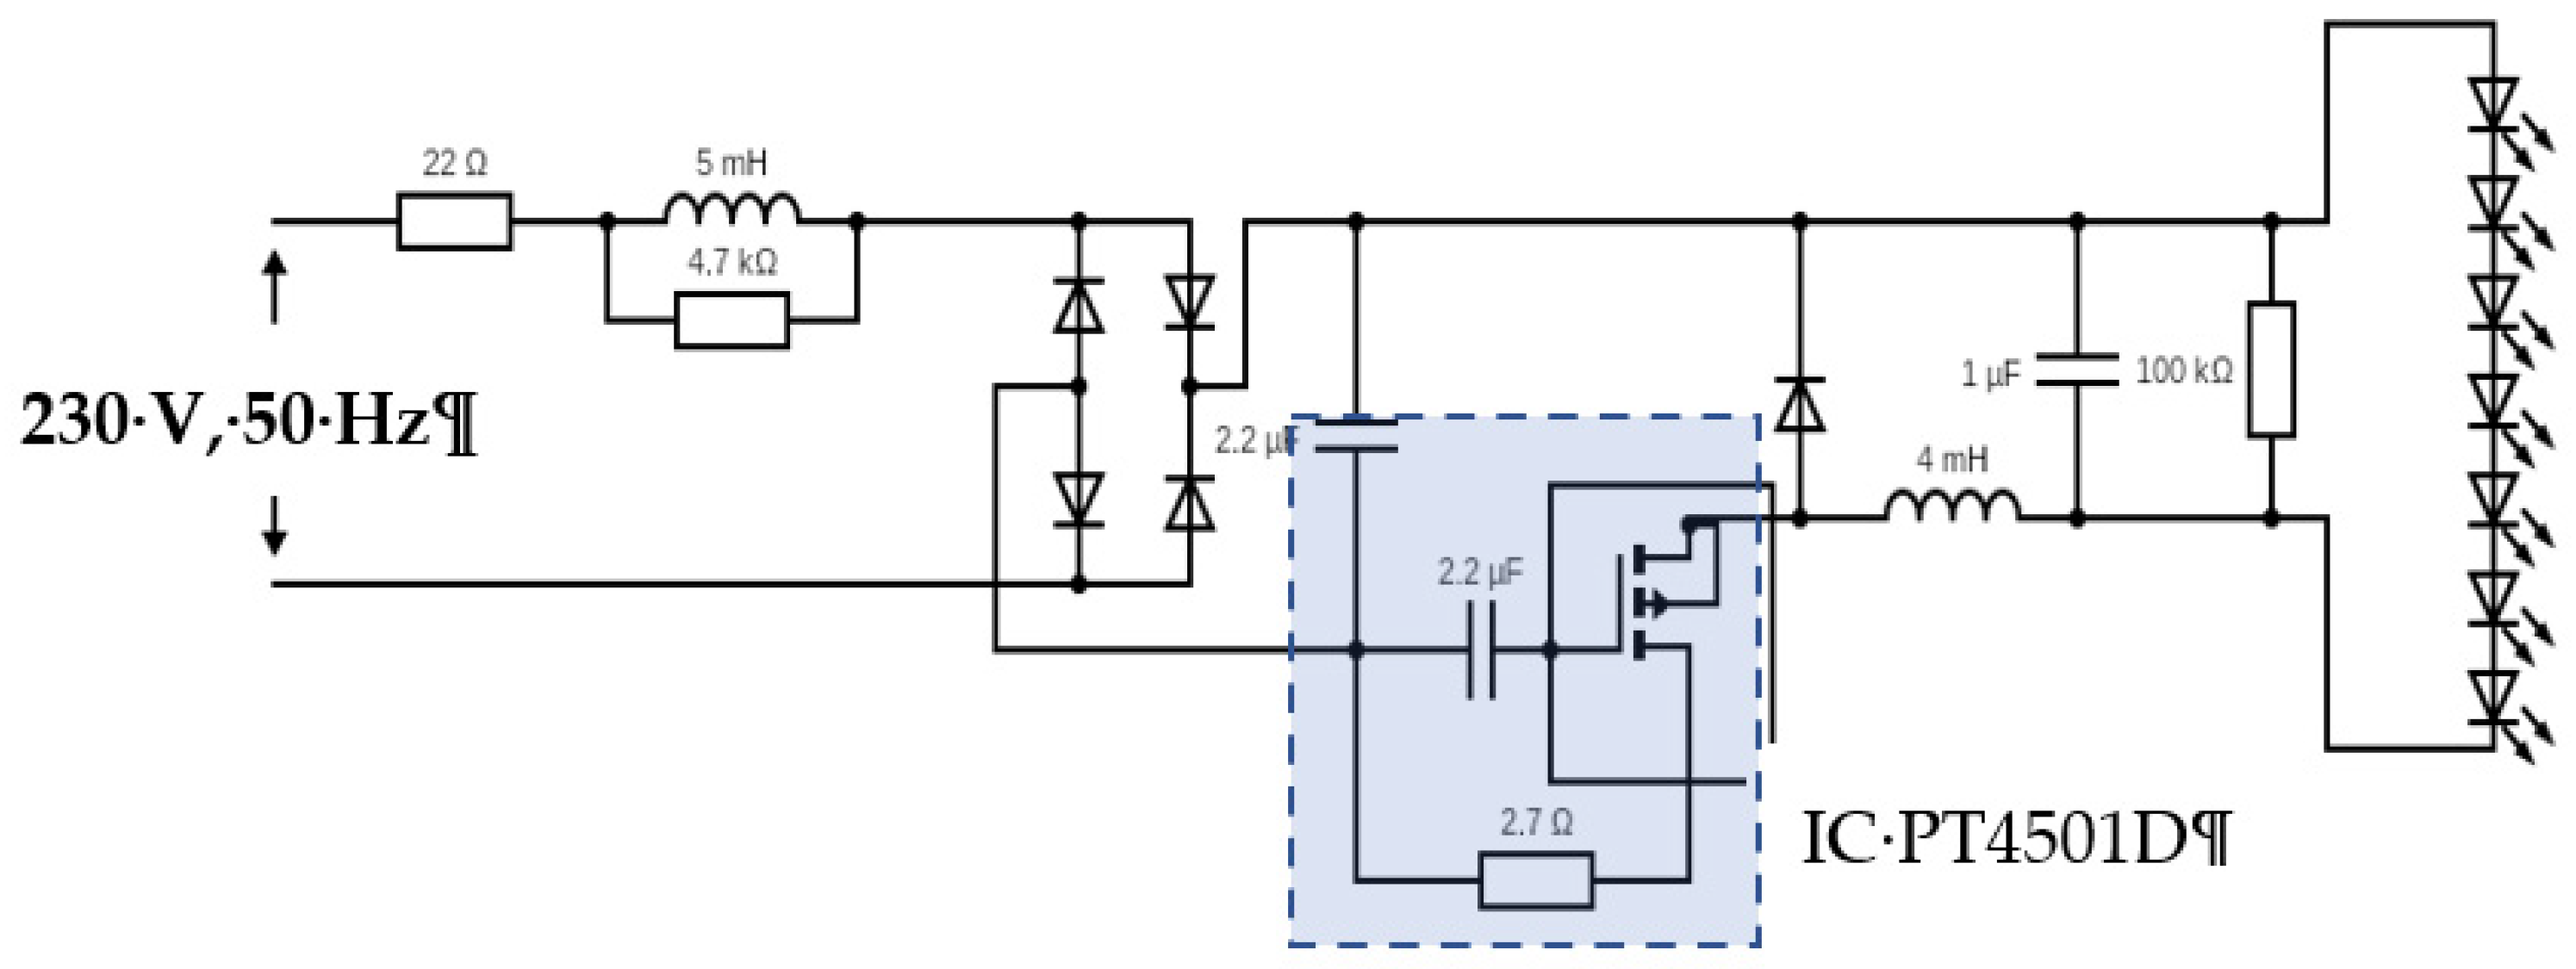
Figure 7. The electrical circuit diagram is shown in
Figure 8.
The circuit consists of a resistor on the AC side of the rectifier; a simple diode rectifier with a smoothing capacitor, a few hundred series-connected LEDs and an integrated circuit (IC) that controls the current through the LEDs.
The 22-Ω resistance limits the switching current when the lamp is energized (when the light comes on) and while the smoothing capacitor is discharged.
The power consumption of the lamp is 4 W, which corresponds to a current of 17 mA at 230 V. The voltage drop across the resistor is then 0.4 V during normal operation, which can be neglected.
The goal of the smoothing capacitor is to limit variations in voltage on the direct current (DC) voltage side. Assuming a direct voltage equal to 300 V, and a discharge time equal to 8 ms, then the voltage variation becomes approximately:
which is something on the high side, but the current regulator integrated circuit (IC) keeps the current through the LEDs (and thus the luminous flux) constant.
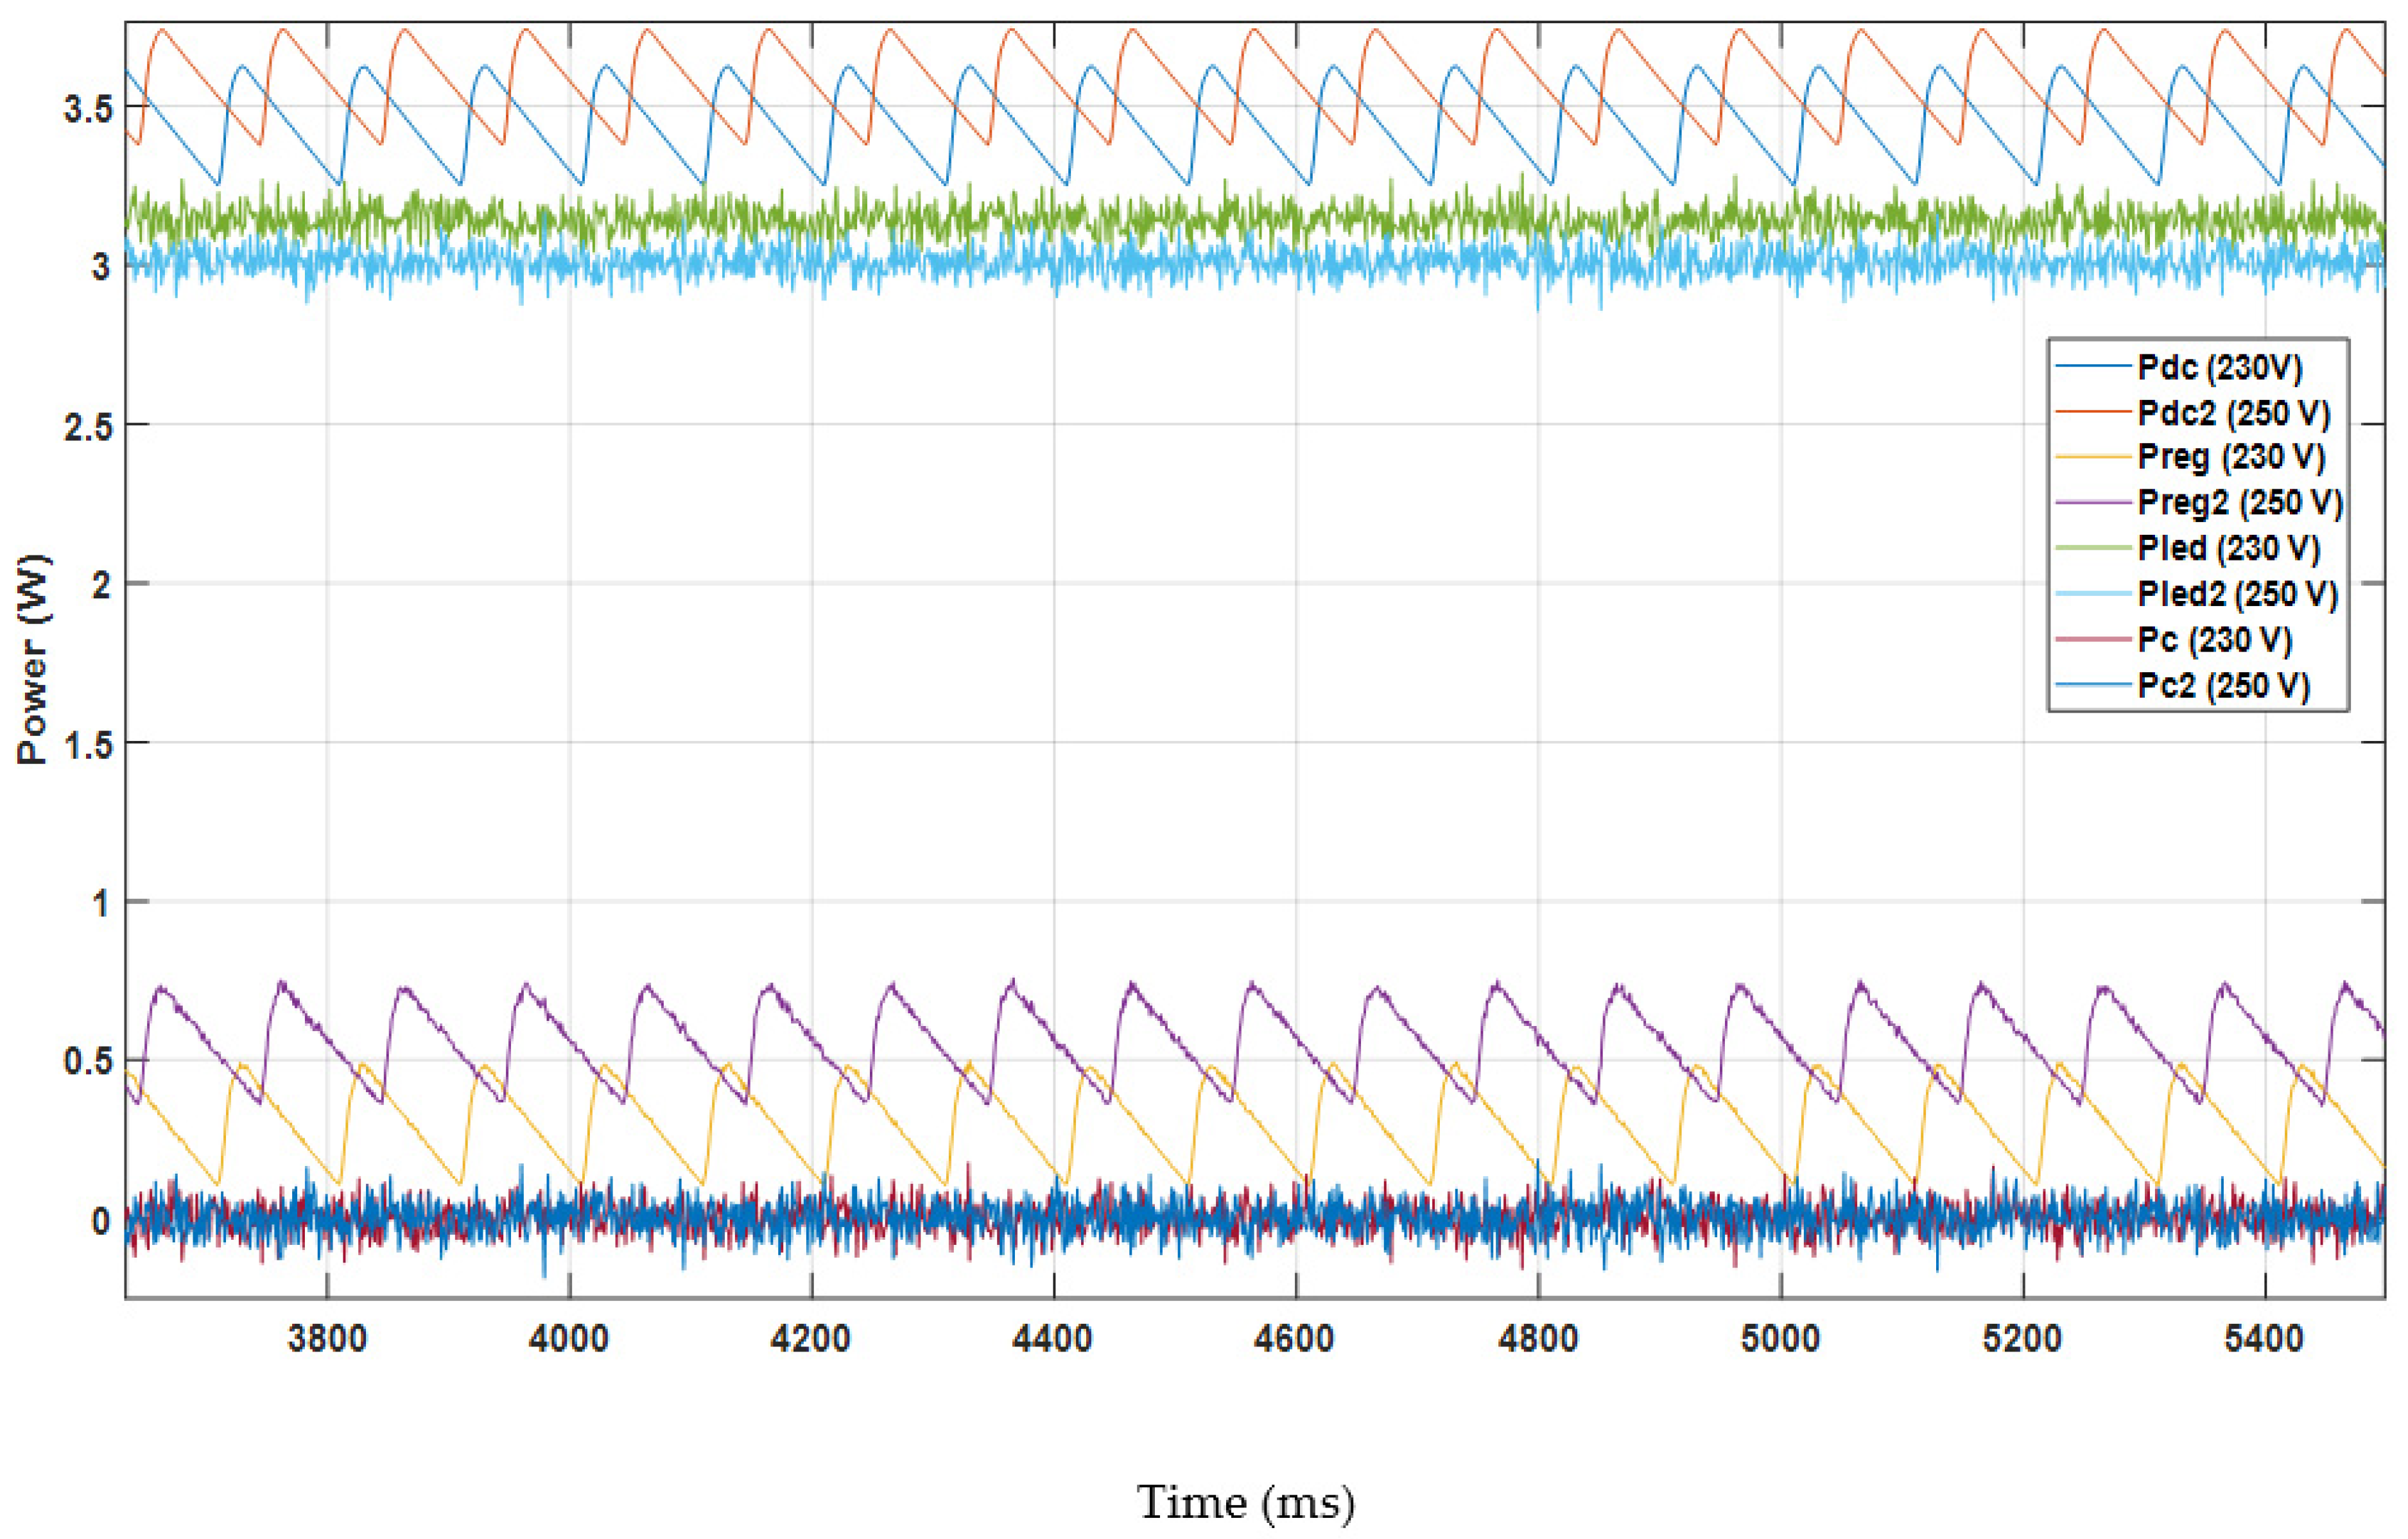
Some detailed measurements were performed on a Type D lamp, in order to understand why this particular type of lamp was so affected by overvoltages. Some results are shown in
Figure 9. The power was measured over a number of periods for two different voltages on the AC side: 230 (rated voltage) and 250 V (108.7% of rated voltage). The diode current and voltage ripple were calculated using Equations (1) and (2), respectively.
The power on the DC voltage side shows a fairly large variation during the 50 Hz period; the average is somewhere around 3.5 W. Power taken by the LEDs is constant during the 50 Hz period. However, no measurements of luminous flux were made.
An increase in supply voltage from 230 to 250 V leads to an increase in the power that comes through the rectifier. However, it does not lead to an increase in the power drawn by the LEDs, and thus does not increase the luminous flux.
Instead of increasing the luminous flux, the voltage increase provided an increase in the power absorbed by the current regulator circuit. The average power absorbed by the circuit was doubled from about 300 to about 600 mW when the mains voltage increased from 230 to 250 V. One possible explanation is that a large part of this power was absorbed by the 51-Ω resistor connected to the circuit. However, measurements showed that the voltage drop across the resistor was only 0.597 V, which corresponded to an output equal to 7 mW. It is a negligible part of the power that comes to the residual current.
The conclusion from this analysis is that the failure is due to overheating of the current regulator IC when it absorbs more energy with increased supply voltage in the absence of a heat sink.
3.3. Construction of Heat Sink Type Lamps
For comparison with other lamp types, the electrical construction of Type A is shown in
Figure 10 with results in
Figure 11 and
Figure 12 and that of Type B in
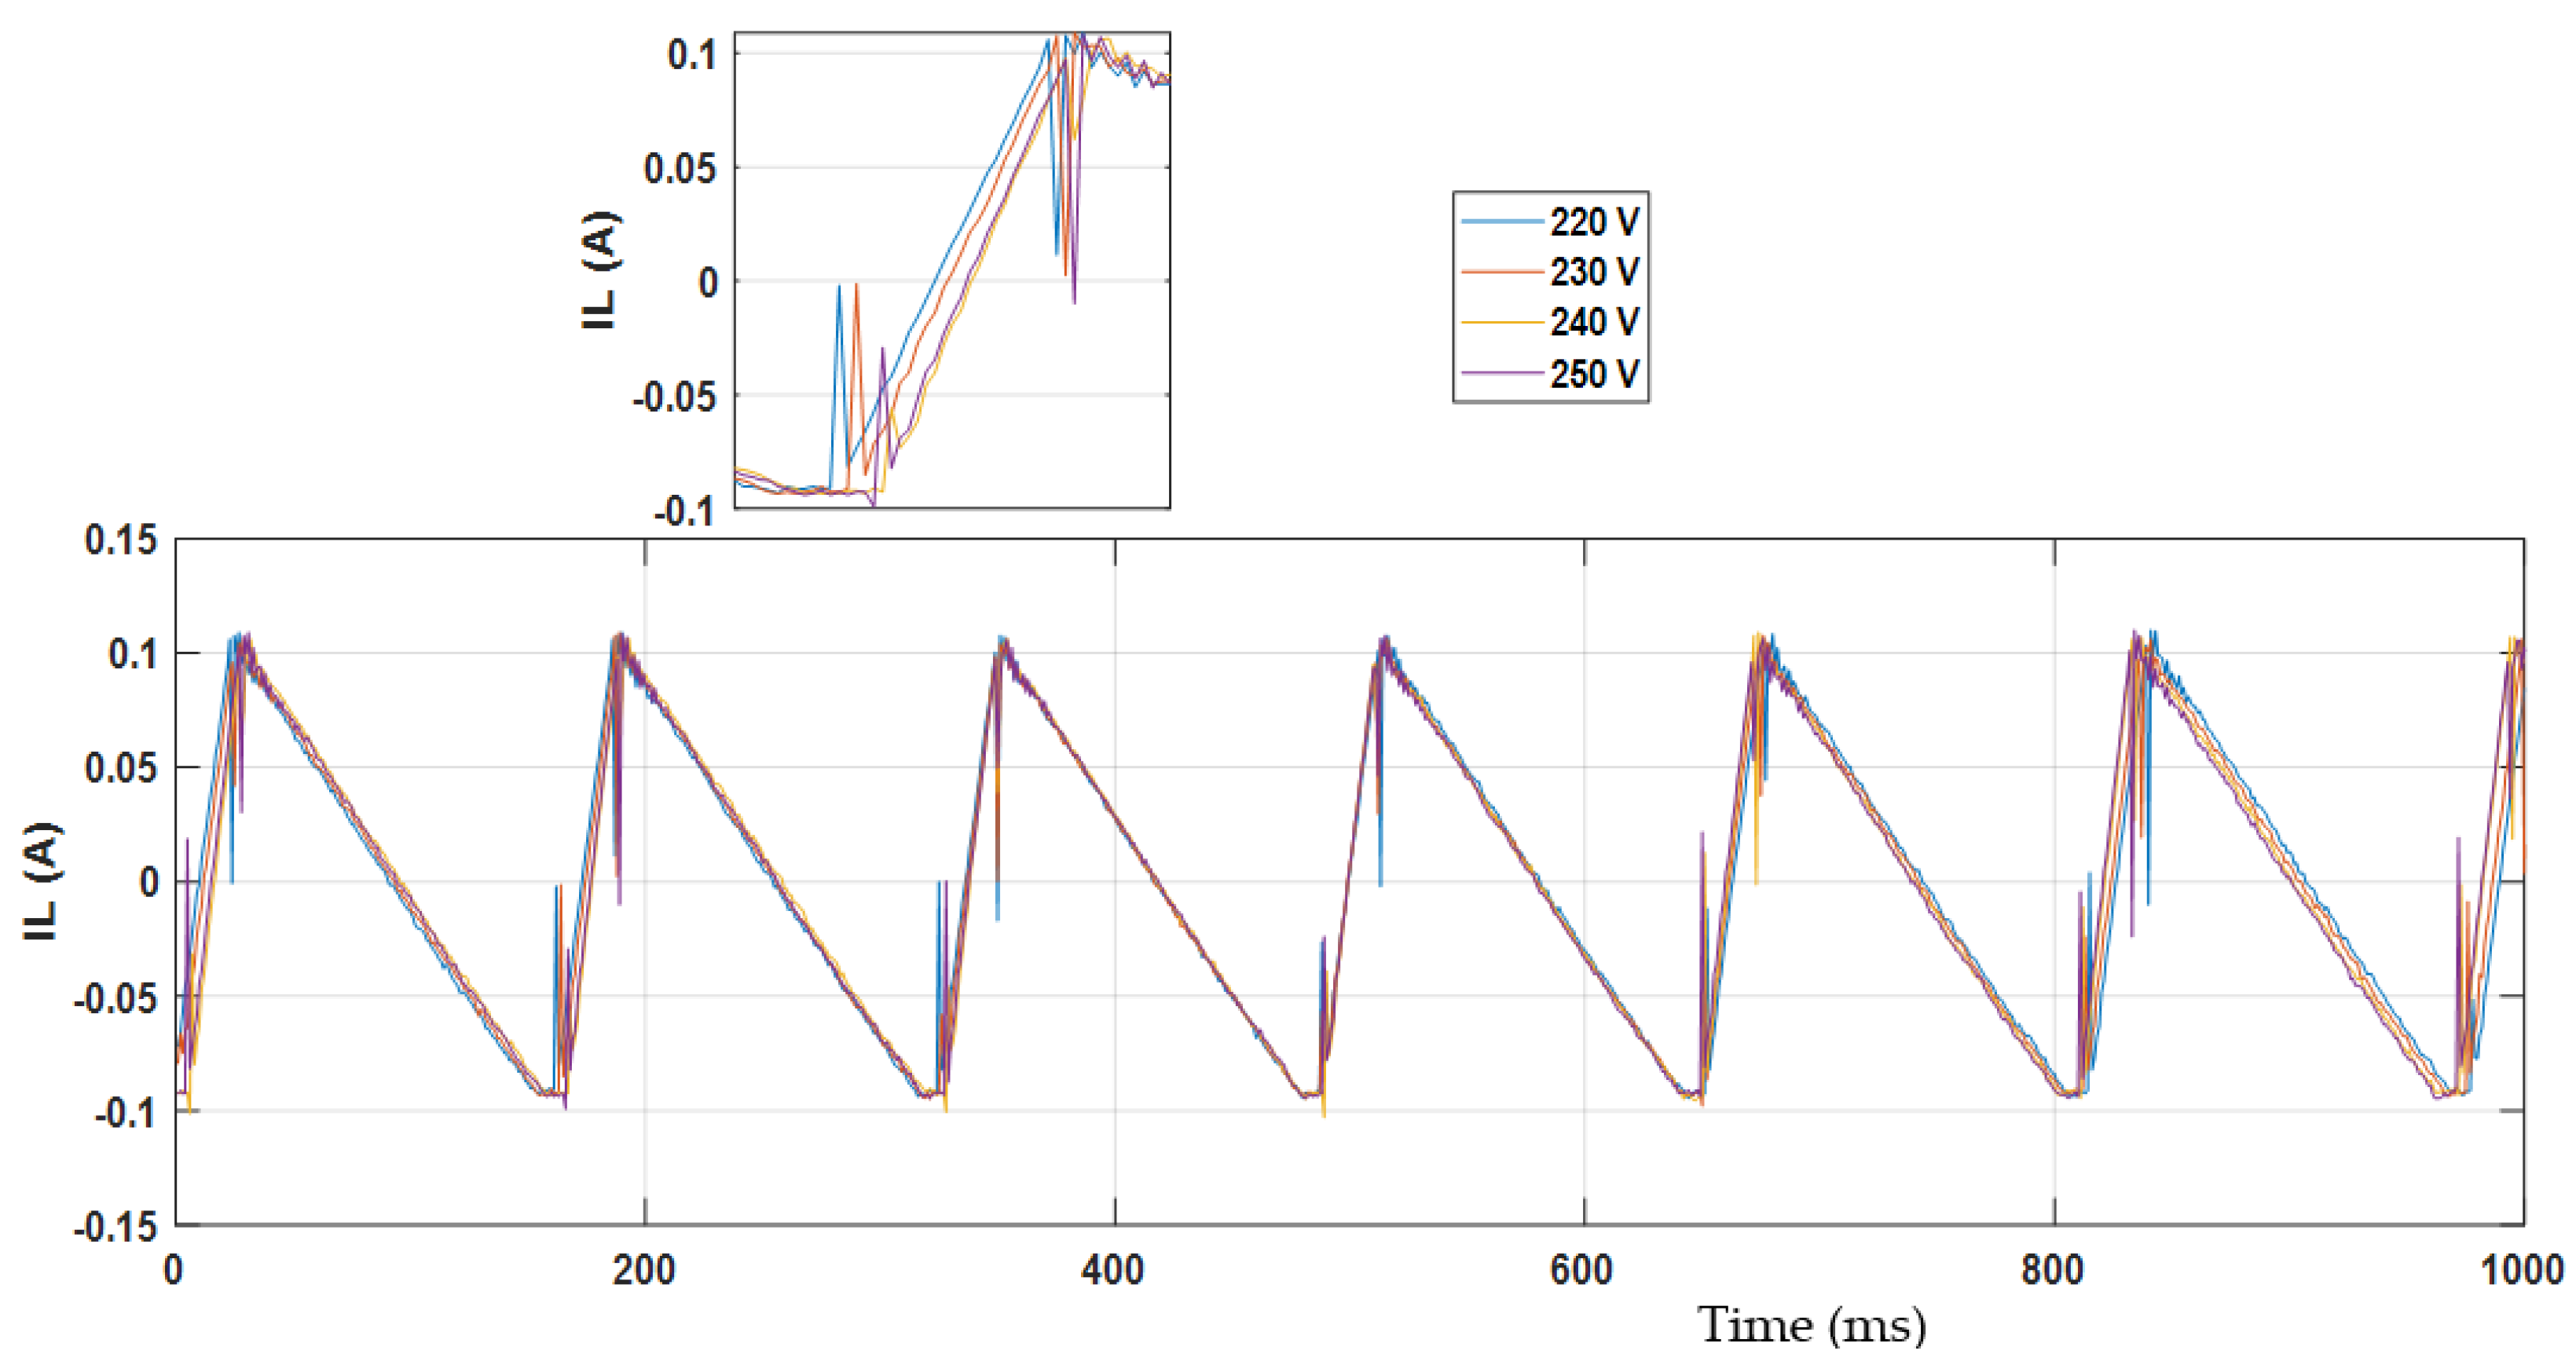
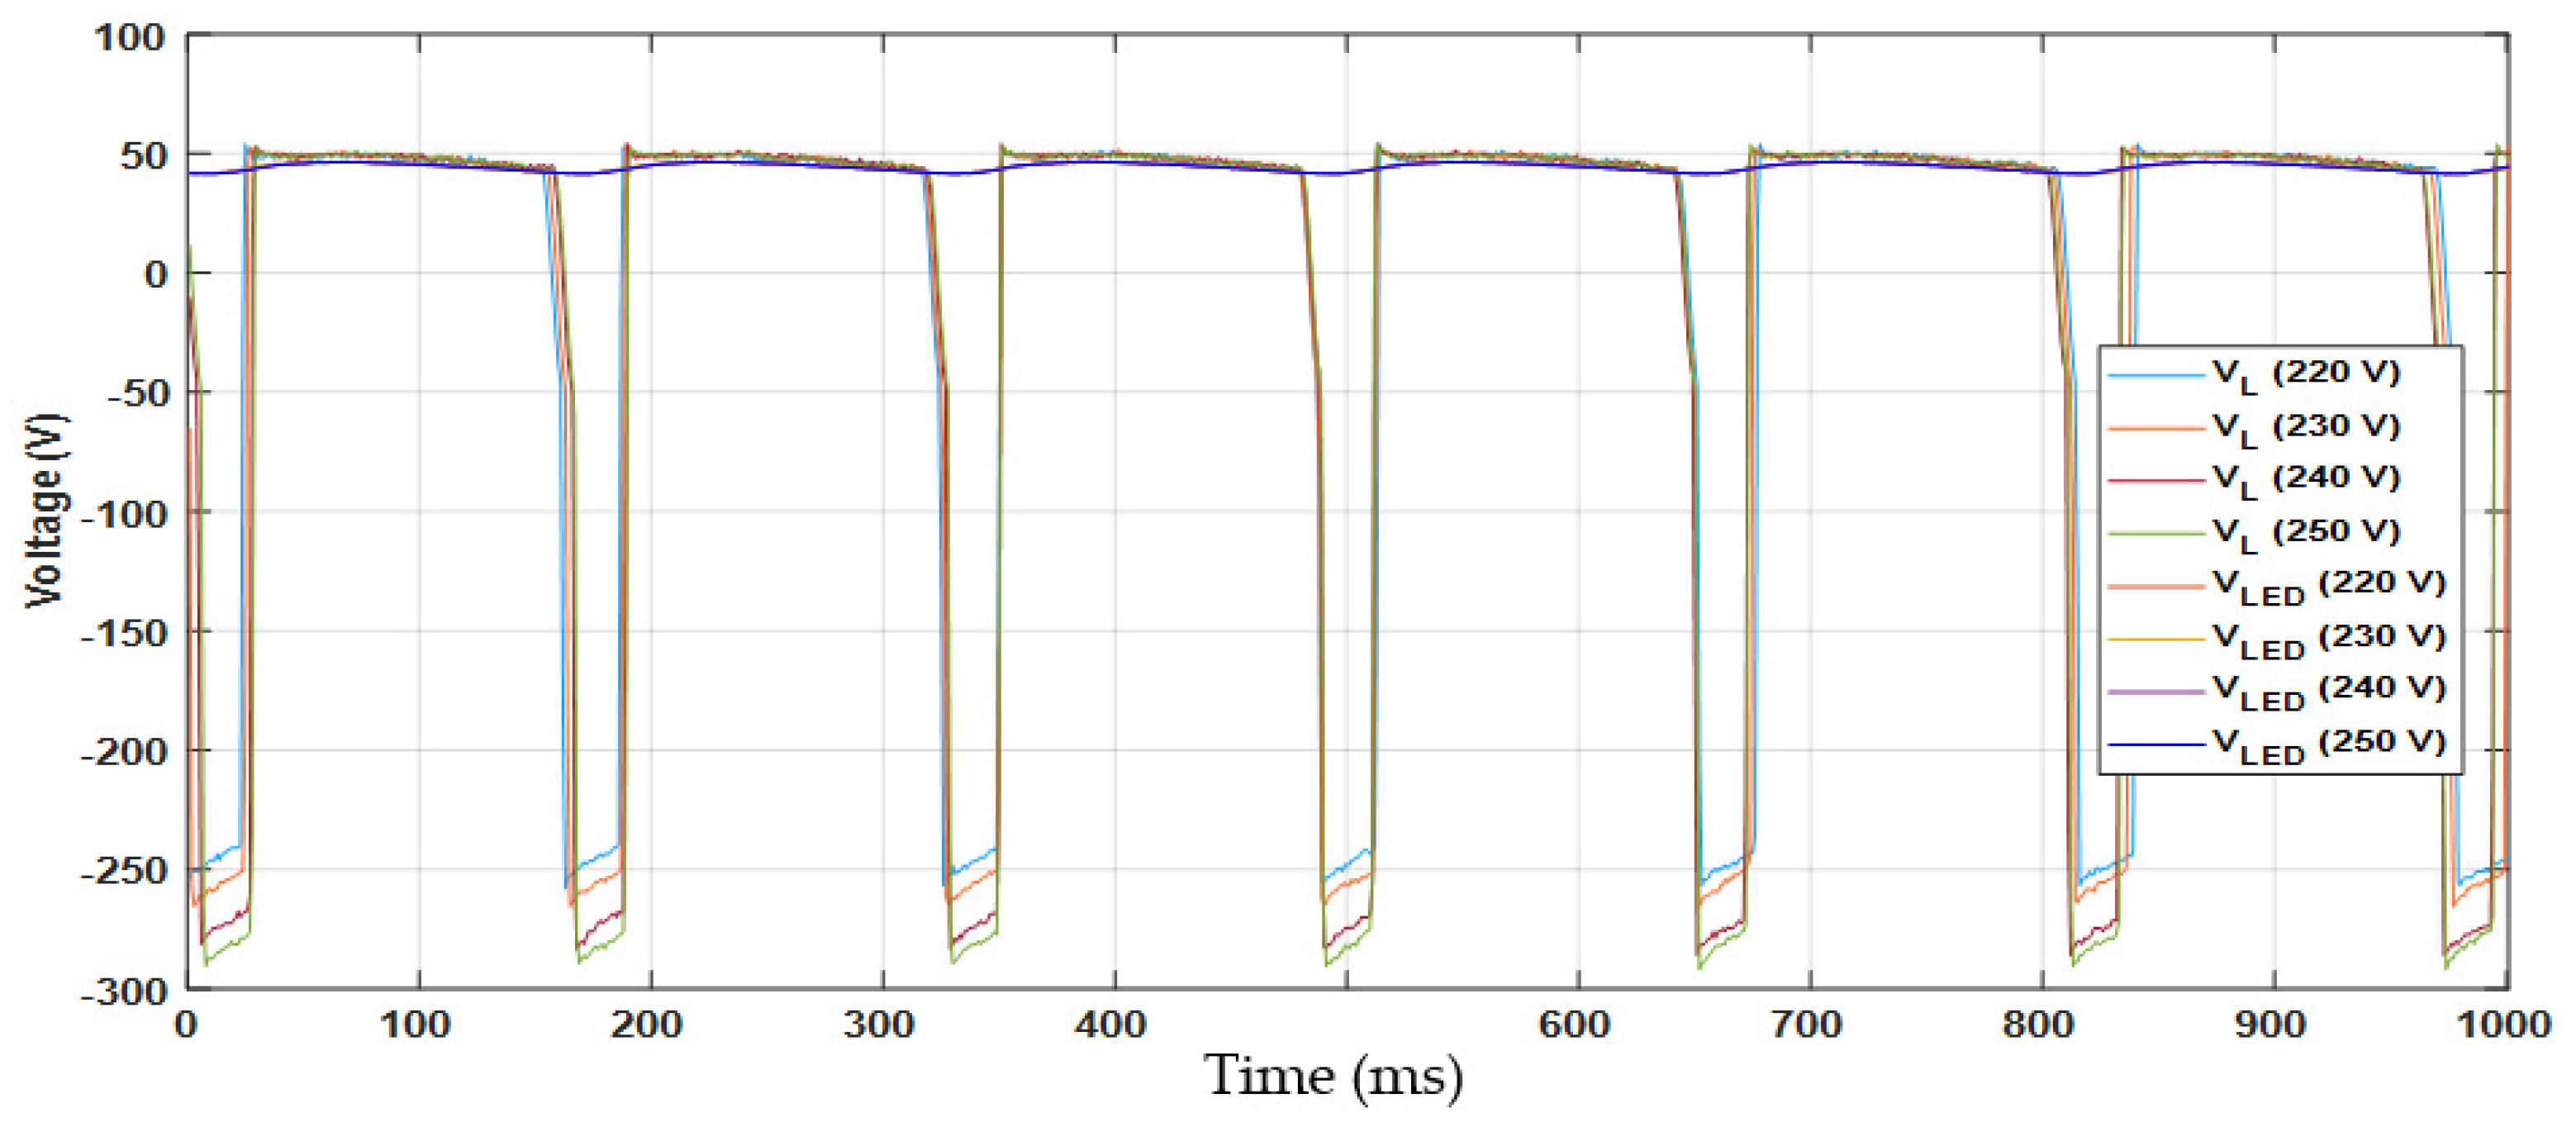
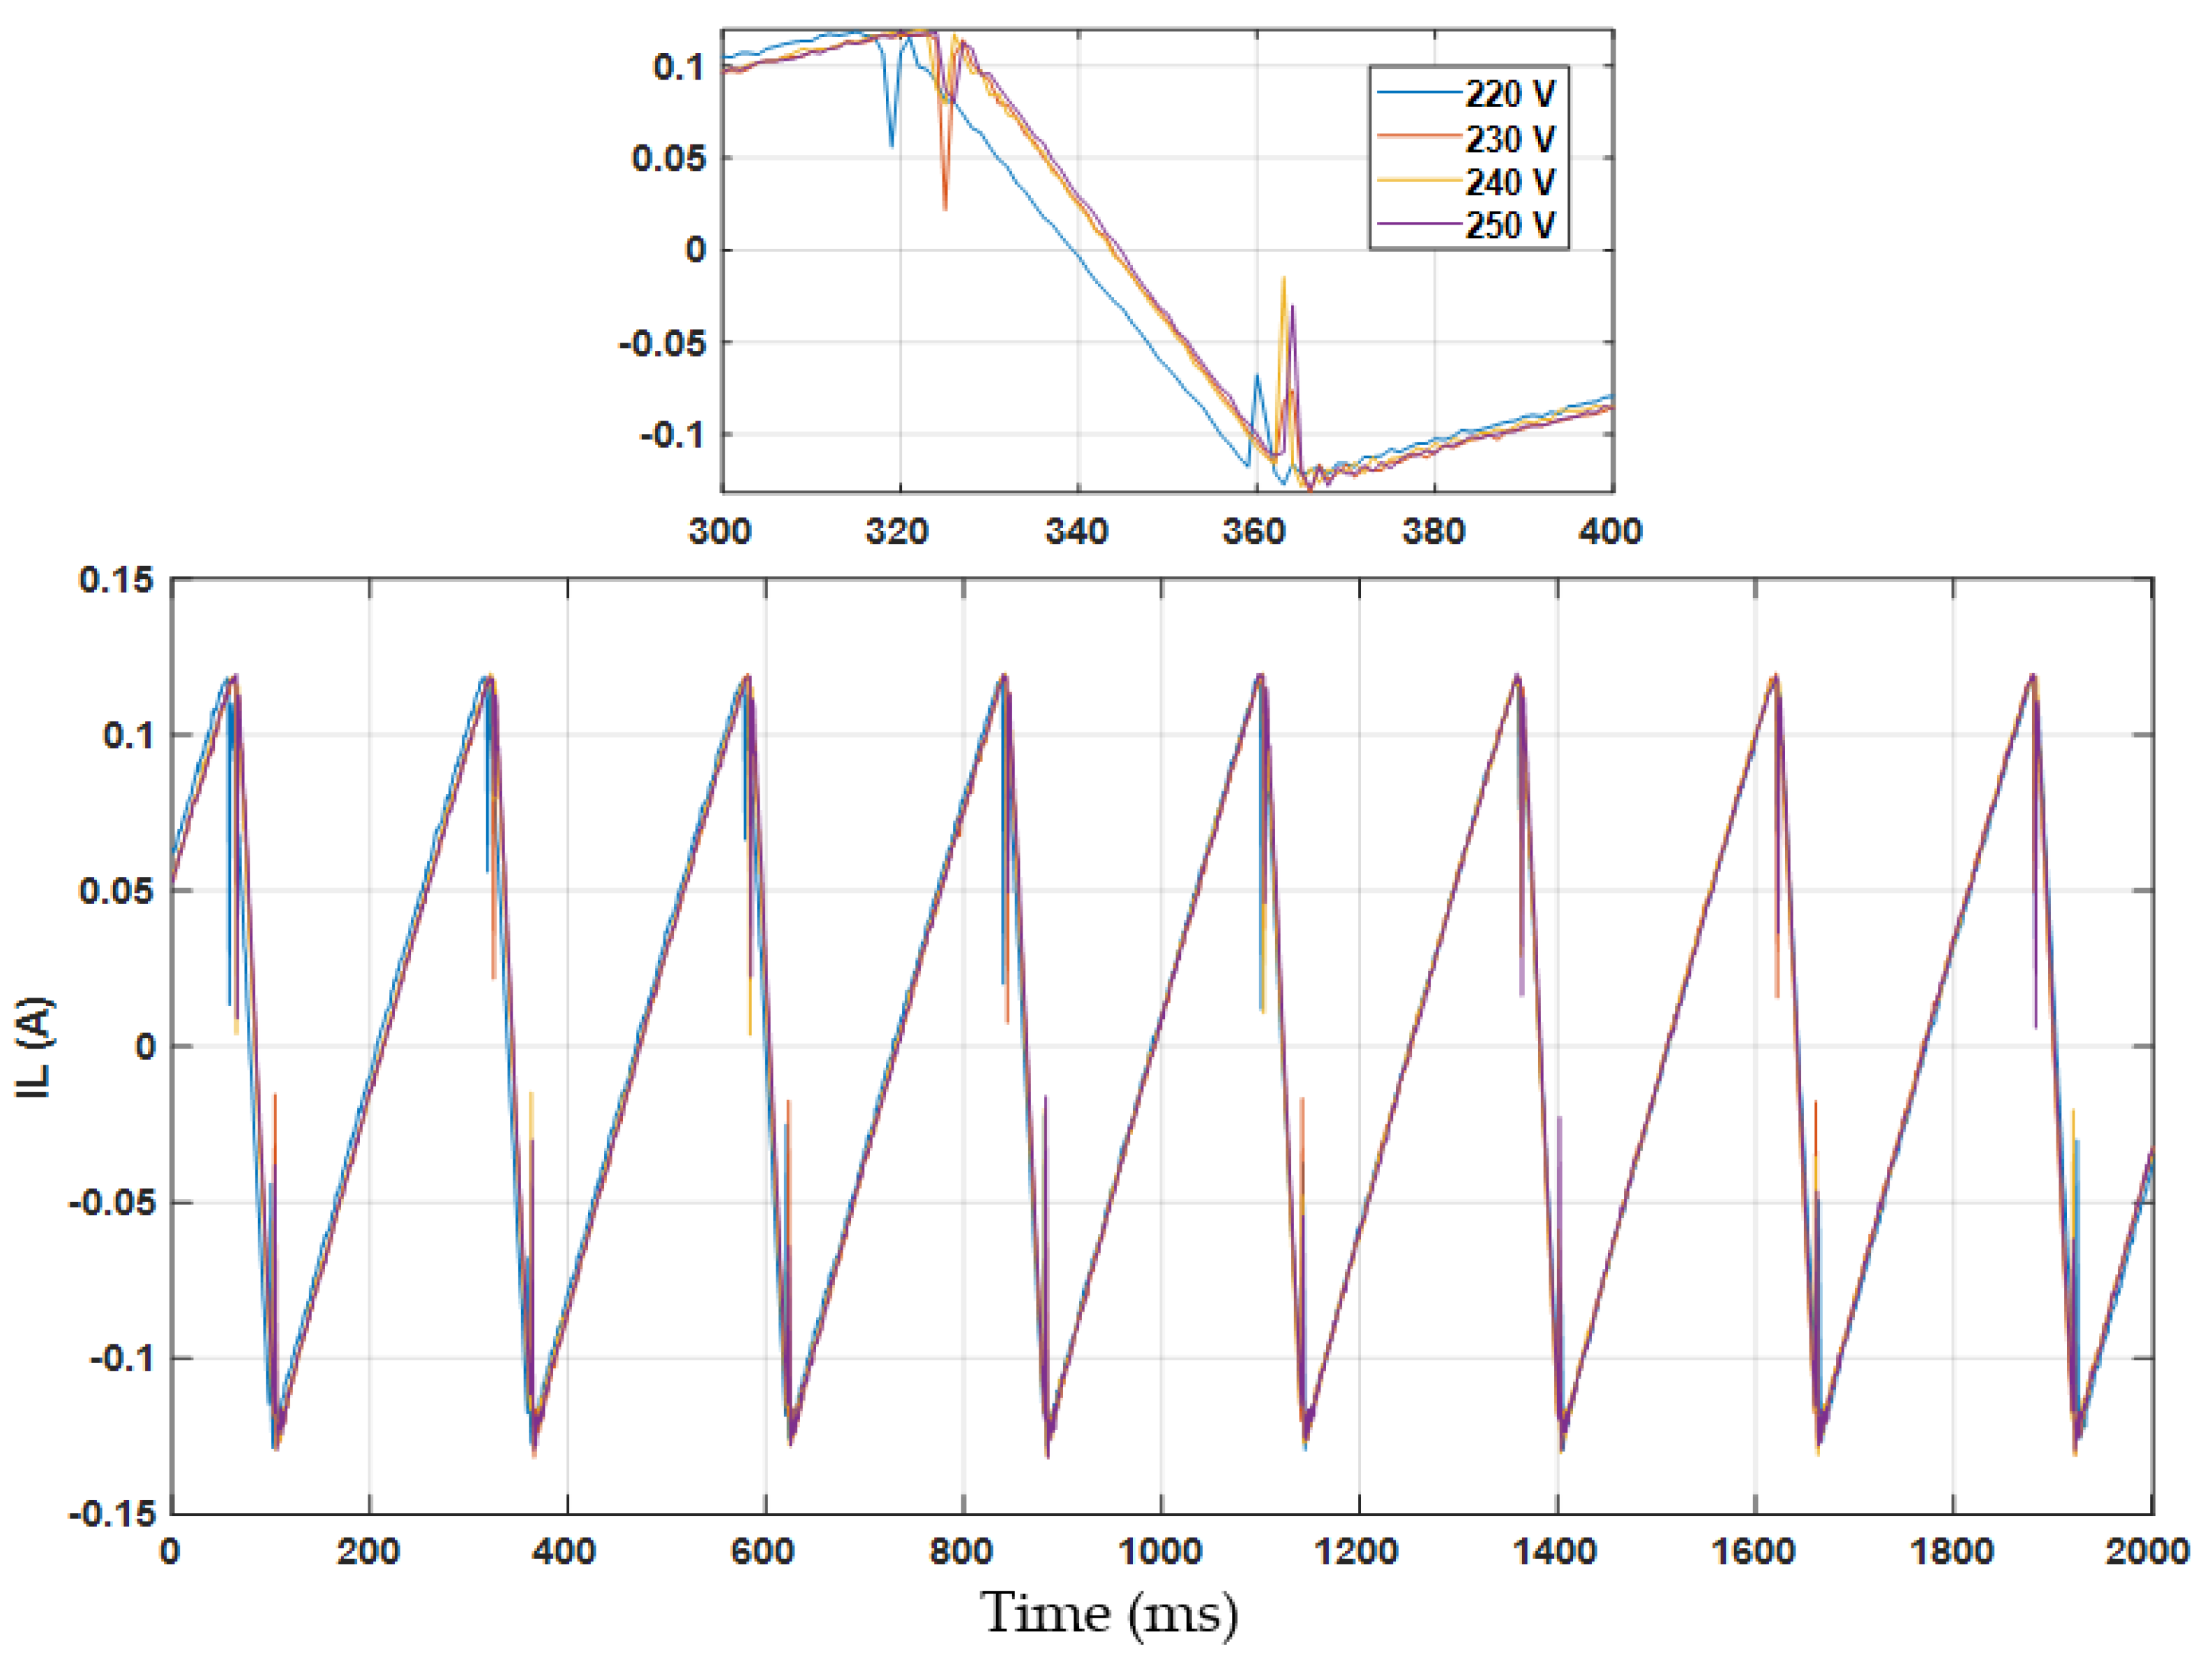
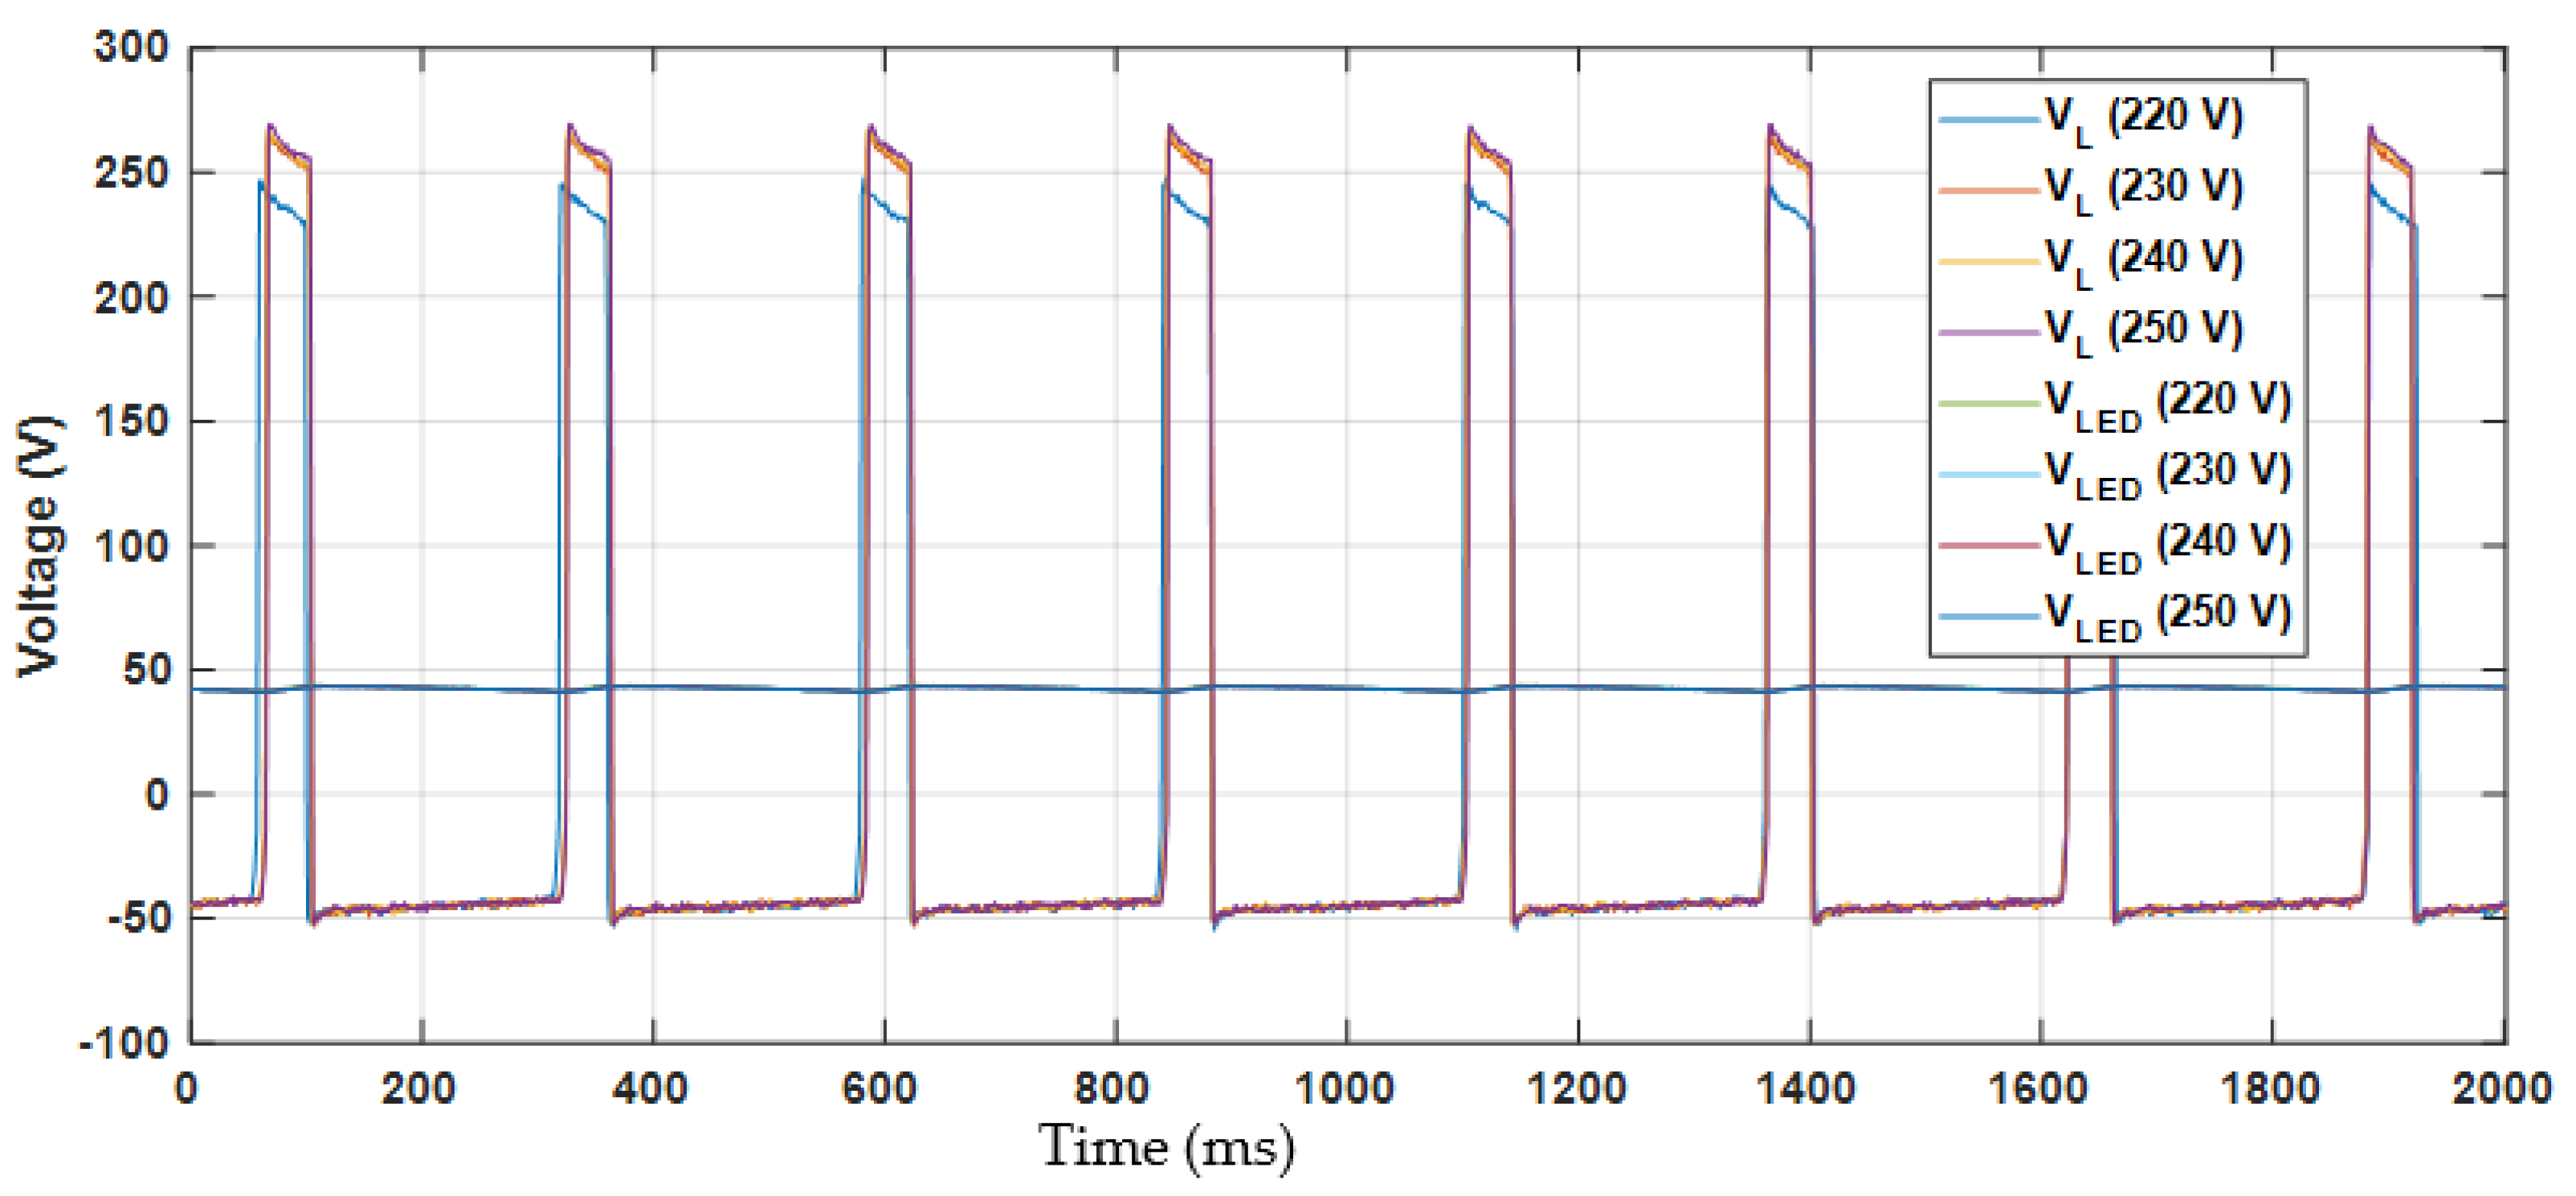
Figure 13. These lamps survived the catastrophic failure test. For both lamp types a different structure for the DC voltage side was seen compared to Type D. The AC voltage side and the rectifier look similar to the ones for Type D. The current through the LEDs is controlled in a different way. Currents and voltages in the lamp, as a function of time, have been measured for different mains voltages; results for a Type A lamp are displayed in
Figure 11 and
Figure 12, respectively. The same result for a Type B lamp is displayed in
Figure 14 and
Figure 15.
In both lamp types, the voltage across the LEDs is kept constant by controlling the current through the reactance. The current through the reactance changes direction to increase or decrease the voltage across the LEDs. The duty cycle of the power metal-oxide-semiconductor field-effect transistor (MOSFET) in
Figure 13 is defined using the turn on time in Equation (3):
For both lamp types, the voltage across the LEDs is independent of the mains voltage; in the range 220 to 250 V, no measurements were made outside this voltage range.
There is an electronic switch (integrated circuit) that controls the current. The circuit has zero voltage or zero current, and thus no heat generation most of the time. Only during switching is there heat generation. However, the switching frequency shows no dependence on the mains voltage. There is some dependence on the mains voltage for voltage across and the current through the switch; this in turn affects the heat generation during switching. However, it is significantly less than the doubling found for Type D lamps.
4. Recommendations
A number of recommendations to equipment manufacturers, to verify that the lamp is able to cope with certain voltage disturbances, are listed below. In this article, no consideration was given for any possible difficulties in following the recommendations.
4.1. Overvoltages
The voltage at the terminals of a lamp can be higher than the nominal voltage (230 V in most of Europe); long-term exposure of lamps to such voltages can result in ageing and premature failure of the device. Voltages more than 110% of nominal voltage are not likely to occur at the lamp terminals in practical cases. It is also not likely that the voltage at the lamp terminals will be continuously high and in fact, locations at which high voltages occur also often experience low voltages, albeit at other times of the day or year.
It is recommended to verify that the lamp is able to cope with long-term exposure of voltages up to 110% of the nominal voltage.
4.2. Undervoltages
In the same way as for overvoltages, the voltage at the terminals of a lamp can be lower than the nominal voltages. The requirements on networks operators typically allow voltages down to 90% of nominal. Because of an additional voltage drop of a few percent, inside of the installation, values as low as 85% of nominal can be expected.
As with overvoltages, it is not likely that undervoltage occurs during the whole year, and long-term exposure should still be considered.
It is recommended to verify that the lamp is able to cope with long-term exposure of voltages down to 85% of the nominal voltage.
4.3. Long and Short Interruptions
Switching the lamps on and off constitutes an interruption of the supply for a lamp. Such switching will typically occur much more often than the occurrence of short and long interruptions in the mains. Such interruptions occur, at most, some 50 times per year, whereas switching at least once a day is very common.
Some things should be considered where it concerns interruptions.
The presence of multiple (especially many) lamps in an installation being switched together results in transient phenomenon occurring after disconnection. The energy present in any grid-side capacitor could result in overvoltages inside of the installation immediately after this is disconnected from the supply. This is not an issue for lamps for domestic use, but could be an issue for lamps intended for use in large lighting installations.
It is recommended to verify that lamps, intended for use in large lighting installations, are able to cope with regular switching of the whole installation.
4.4. Waveform Distortion
Waveform distortion, i.e., the voltage waveform deviating from a sinusoidal waveform, comes in many different forms. The most commonly used distinction is between harmonics, interharmonics, and supraharmonics.
4.4.1. Harmonics
Harmonics are frequency components at integer multiples of the power-system frequency, up to 2 kHz (harmonic 40 in a 50 Hz system). They come in many different combinations; there are test levels for equipment defined in IEC 61000-4-13, to avoid that equipment should be tested for many combinations.
It is recommended to verify that lamps can cope with long-term exposure to the harmonic testing levels defined in IEC 61000-4-13.
4.4.2. Interharmonics
Interharmonics are frequency components below 2 kHz that are not harmonics, i.e., that are not an integer multiple of the power-system frequency. Additionally for interharmonics are test levels defined in IEC 61000-4-13.
It is recommended to verify that lamps can cope with long-term exposure to the interharmonic test levels defined in IEC 61000-4-13.
4.4.3. Supraharmonics
Supraharmonics are frequency components in the range between 2 and 150 kHz. Limited information is available on the disturbance levels in this frequency range. Compatibility levels have been defined, but it is unclear how realistic these are.
Testing levels for supraharmonics are defined in IEC 61000-4-19 in the form of levels for single-frequency signals for different frequency bands within the supraharmonic range. Even for those levels, it is unclear how realistic they are, but the general impression is that the levels are higher than what is typically present in reality.
It is recommended to verify that lamps can cope with long-term exposure to the supraharmonic testing levels defined in IEC 61000-4-19.
4.4.4. Zero-Crossing Oscillations
A specific type of disturbances occurs in the border range between supraharmonics and (inter) harmonics: damped oscillations with an oscillation frequency up to a few kHz that occur twice each power-system period. These oscillations typically occur around the zero crossing of the current; they are hence referred to as zero-crossing oscillations.
Several studies have shown that the amplitude of these oscillations increases with the number of devices. High levels, up to some tens of volt, have been observed in lighting installations [
30,
31,
32].
It is recommended to verify that lamps can tolerate long-term exposure to zero-crossing oscillations with an amplitude of some tens of volt and oscillation frequency of a few kHz.
4.5. Voltage Transients and Transient Overvoltages
Voltage transients are deviations from the normal voltage for periods up to a few milliseconds; they are typically due to switching actions, where switching of capacitors is the main cause for serious transients.
Transient overvoltages are short-duration high-magnitude overvoltages with duration below a few milliseconds and most often much below 1 ms. They could be due to rare conditions during switching actions, but also due to lighting strokes either directly to a conductor in the grid or close to an electrical installation. Higher overvoltages can be expected in grids with overhead low-voltage lines than in grids with low-voltage cables.
Little is known about the occurrence, magnitude, and frequency of transients in low-voltage networks, EN 50,160 gives a peak value of 6 kV, but no specific duration of the transient. For lightning transients, the ones causing the highest overvoltages, 50 µs has traditionally been used for the duration.
It is recommended to verify that lamps can cope with occasional overvoltages up to 6 kV and a duration of 50 µs.
4.6. Voltage Dips
Voltage dips are short-duration reductions in voltage, with duration between about 100 ms up to several seconds. The voltage drop can be as small as a few percent but the voltage can also drop such that only a few percent of residual voltage remains. Next to the drop in voltage, the waveform distortion upon voltage recovery can be high.
The number of voltage dips varies strongly between different locations and depends on the residual voltage as well. Dips with a large drop in voltage occur, for the vast majority of locations, up to a few times per year.
It is recommended to verify that lamps can cope with an occasional (several times a year) sharp drop in voltage magnitude, down to almost zero, with a sharp rise shortly after and followed by a period with high harmonic distortion. Based on the design of the lamp electronics, shorter or longer dips can cause more damage.
4.7. Voltage Swells
Voltage swells are short-duration increases in voltage magnitude. The most severe ones, in European-type grids, are due to faults on low-voltage overhead lines rather far away from the distribution transformer. The voltage during such a swell can be up to about 130% of the nominal voltage, during several seconds.
It is recommended to verify that lamps can cope with an occasional overvoltage (several times a year) up to 135% of the nominal voltage, during 5 s.


