1. Introduction
The operational reliability of current transformers is directly related to the security and stability of the power system. In particular, the safe operation of oil-immersed inverted current transformers, for high-speed rail traction networks, is a necessary condition to ensure the safe operation of high-speed rails [
1]. Current transformers used in traction networks have a special working environment. During the operation of the transformer, the oil-paper insulation will age under the influence of factors, such as electricity and heat, for a long time. During the aging process, the moisture, decomposed by the insulation or the intrusion of moist air, will change the oil-paper. The water content of the insulation affects the conductivity and polarization of the oil-paper insulation and changes the dielectric properties of the oil-paper insulation [
2,
3].
On the other hand, whether it is a lightning shock or a VFTO generated by a switching operation, there are components from DC to tens of MHz, or even higher frequencies, and its energy is mainly concentrated between 1 kHz–10 MHz [
4], and the dielectric properties of the insulating material will also change with the change of frequency [
5,
6]. Such a wide frequency range of voltage excitation intrudes into the transformer insulation, which not only produces uneven voltage distribution, but it also causes the insulation to withstand excessive voltage drops, resulting in aging and damage to the insulation, and may even cause overvoltage breakdown of the insulation. Therefore, wide-band modeling of the main insulation of the transformer, and the use of numerical calculation methods to study the distribution of extremely fast transient overvoltage under different humidity, will help to propose appropriate measures to improve the electric field distribution of the main insulation and implement effective methods for the insulation structure. Optimal design has important theoretical and engineering significance for ensuring the reliable and safe operation of current transformers.
Establishing an equivalent model of the current transformer insulation system is the basis for calculating the VFTO distribution. Whether the calculation of the equivalent network parameters is correct or not has a great influence on the calculation accuracy of the electric field. To analyze the overvoltage transient of transformer insulation, in the frequency range of 10 MHz, it is necessary to consider the frequency and humidity-dependent characteristics of the parameters, especially the influence of relative permittivity and conductivity, with frequency and humidity on VFTO [
7]. The significance of water content is paramount: a humidity of 4% can shorten a transformer’s operational lifetime by a factor of 40 (i.e., by 97.5%), while oxygen only reduces it to one-half [
8]. The dielectric response of transformer oil-paper insulation can be represented by the Cole–Cole model [
9]. In Ref. [
10], a transformer winding high-frequency circuit model, based on frequency response, is proposed for VFTO research. In Refs. [
11,
12], a winding distribution parameter model, based on the Multiconductor Transmission Line (MTL) theory, was established, and the frequency domain method was used to calculate the winding voltage distribution under various conditions. In Ref. [
13], a parameterization method of an oil-paper insulation dielectric response model measured by FDS was proposed. In Ref. [
14], grey relational analysis of power transformer insulation status evaluation, based on conventional dielectric response measurement, is proposed.
Regarding the calculation of insulation withstand transient voltage, the previous literature mostly focused on the analysis of the transient response of power transformers and motor windings, under impulse voltage before steep slopes, and did not consider the influence of the dielectric parameters, of the insulating material on the voltage distribution, with the change of humidity and frequency. There is a lack of detailed research on the impulse voltage distribution of the main insulation of the current transformer.
This paper takes a 330 kV current transformer, for a high-speed railway traction network, as an example. The change of the dielectric parameters of the transformer’s main insulation with frequency under different humidity is measured, and the modified Cole–Cole model is used to fit the measurement results to obtain the functional relationship between insulation parameters, humidity, and frequency. Then, considering the semi-conductive capacitive screen, this paper establishes a broadband MTL model of the insulation system. FFT is used to decompose the excitation pulse into a superposition of sinusoids and convert the time-domain MTL equation into a frequency domain solution. Considering the particularity of the boundary conditions, the first-end voltage of each insulation layer, through matrix transformation, is directly solved and brings the result into the MTL model of each structural part of the transformer insulation system to obtain the VFTO distribution of each part. The result is superimposed to obtain each Part of the time-domain electric field distribution under different humidity. The result shows that this method is feasible for calculating the current transformer insulation system, before steep slope and under high-frequency impulse voltage, and the VFTO distribution of each part under different humidity.
2. FDS Measurement and Fitting of Insulating Materials
The response of the dielectric constant to the frequency of the electric field, that is, the frequency dependence of the electric field, is called the dielectric spectrum, and it is also called the dielectric relaxation spectrum [
15]. FDS measures the voltage at both ends of the medium, under different frequency electric fields, and the current flowing through the medium, and it calculates the change of its complex permittivity, complex capacitance, dielectric loss factor, and other dielectric parameters, with frequency according to the size of the dielectric.
2.1. Model Description
The IOCT insulation system is composed of an oil-impregnated insulating paper layer and a semi-conductive paper inserted into the electric screen (collectively referred to as the insulating layer below), where the outermost layer is a high potential, and the innermost layer is ground potential. The cross-sectional view of the ring structure is shown in
Figure 1 shows:
It can be seen, from the above figure, that the main insulation circuit of IOCT can be approximately equivalent to a set of series capacitors. Taking the size of a 330 kV ultra-high voltage IOCT as an example, the geometric capacitance
Kg and geometric resistance
Rg of each insulating layer (defined as the resistance value when the resistivity is 1) are calculated, as shown in
Table 1:
2.2. Applied Technologies
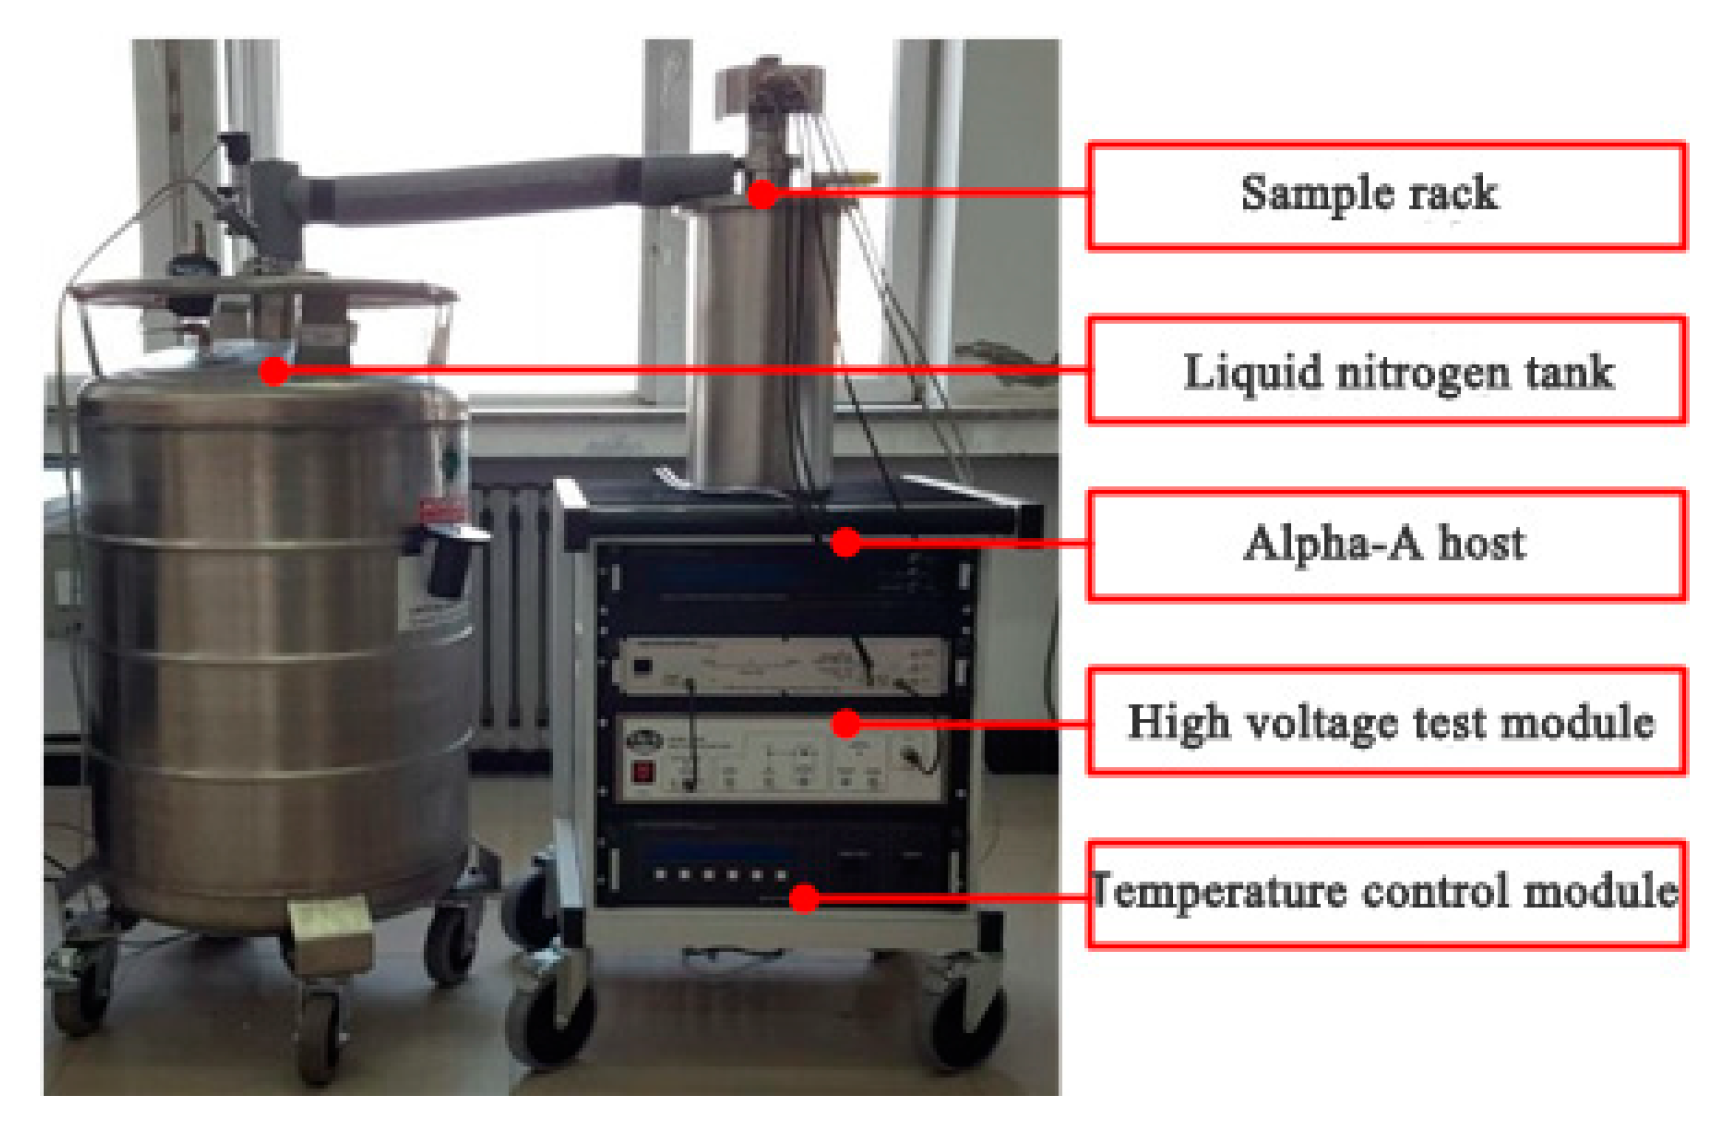
The experimental operation process of the thesis strictly follows the ASTM D150-98 standard. The test process is the same material tested five times, the maximum value is removed, the minimum value is removed, and the other three data are averaged. The experiment uses Alpha-A broadband dielectric impedance spectrometer (manufactured by The German novocontrol technologies company, Montabaur, Germany)to measure the relative permittivity FDS of Minsk oil-impregnated insulating paper and German semi-conductive paper under different humidity conditions. The measurement temperature is 20 °C, and the measurement frequency is 1 kHz–10 MHz. To facilitate the measurement, the experimental samples are cut into 20 mm diameter discs: (a) Minsk oil-impregnated insulating paper has nine layers per millimeter thickness, and each layer has a mass of 39.7 mg; (b) German semi-conductive paper has eight layers per millimeter thickness. The mass of each layer is 42.9 mg. The measuring device is shown in
Figure 2 below:
The measurement is carried out according to the following steps:
- (1)
Place the sample in a vacuum drying oven, set the temperature to 23 °C (two days), and then adjust the temperature to 100 °C (two days). Under laboratory conditions, expose the vacuum-dried samples to the air for 5, 10, 15, 20, and 25 min to absorb moisture naturally;
- (2)
The processed sample is immersed in a glass bottle containing transformer insulating oil, sealed, and placed in a 40 °C constant temperature box (two days) to make the moisture in the sample evenly distributed.
- (3)
Quickly transfer the sample to the Metrohm 860 KF moisture extraction furnace, and then use the supporting Karl Fischer moisture analyzer to accurately measure the moisture of the sample.
- (4)
Take out other samples of the same batch that are processed in the same way as the samples for moisture determination, wipe off the excess insulating oil on their surfaces, and then place them in the FDS measurement equipment for measurement.
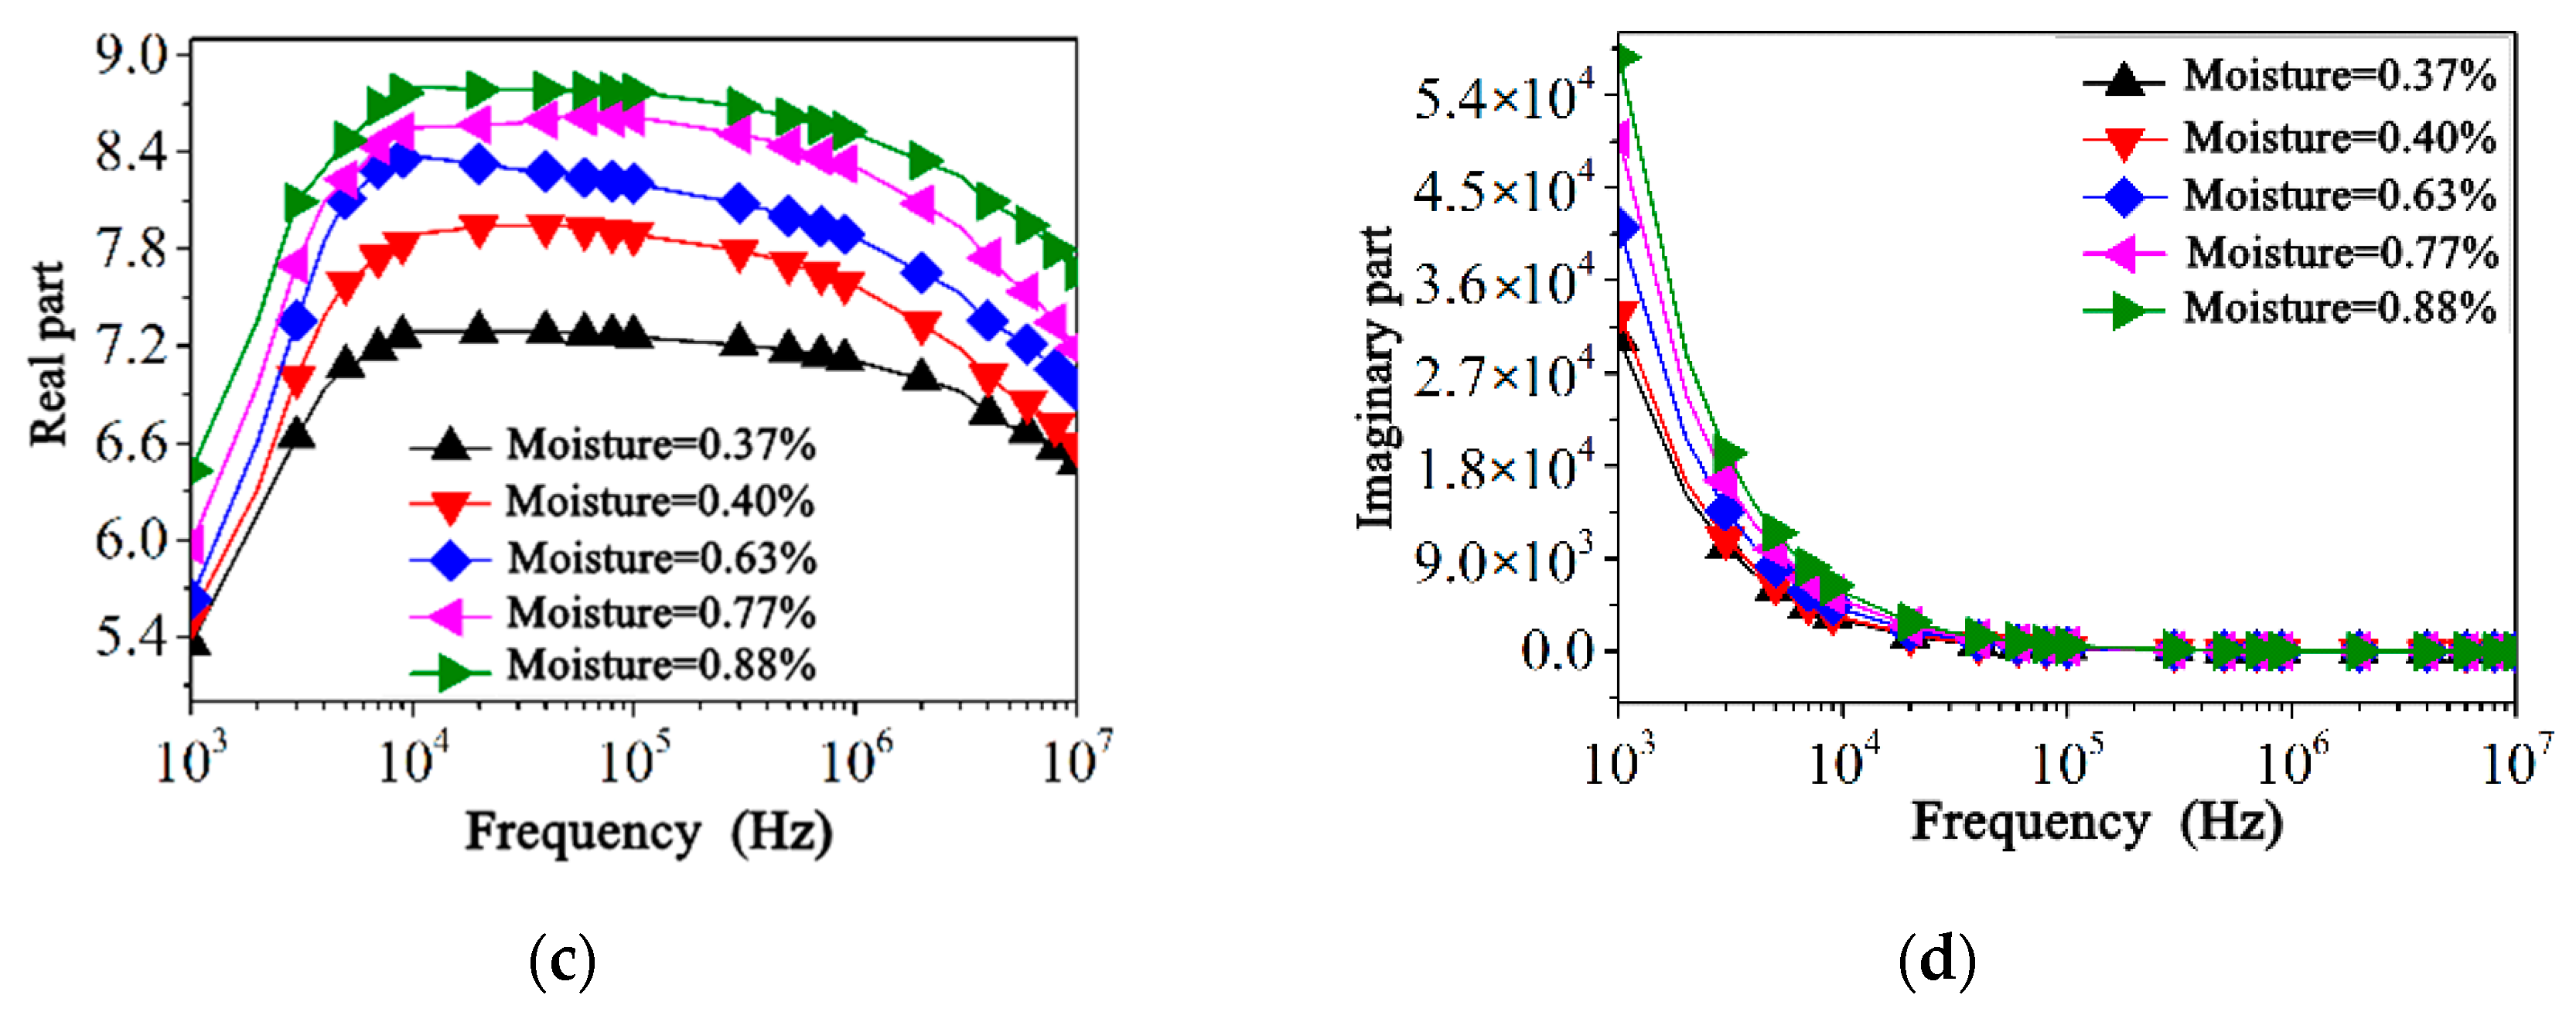
The water content of the final oil-impregnated insulating paper is 0.05%, 0.23%, 0.38%, 0.52%, and 0.72%, and the water content of the semi-conductive paper is 0.37%, 0.40%, 0.63%, 0.77%, and 0.88%, respectively. The above insulating materials, with different moisture content, are respectively tested for FDS. To ensure the repeatability of the experiment, the samples in the same state are sampled five times for measurement. If the repeatability of the five measurements is not satisfactory, continue to sample and repeat the test. Select the data with good repeatability for analysis. The experimental results are shown in
Figure 3 below:
As can be seen from the above figure, the real and imaginary FDS of relative permittivity, of oil-impregnated insulating paper and semi-conductive paper, both increase with the increase in water content, and the changes are obvious. This is because water molecules are polar molecules and will participate during the polarization process; the greater the moisture content in the insulating material, the more polar molecules involved in the polarization and the stronger the polarization. In addition, the increase in the moisture content of the insulating material not only increases the interface loss between oil and paper but also the conductivity of the insulating material. The rate also increases with the increase in moisture content, and its conductivity loss also increases. In addition, the complex relative permittivity of insulating materials varies significantly with frequency. It can be seen that the influence of water content and frequency on the distribution parameters of IOCT main insulation cannot be ignored.
2.3. Financial and Technical Assumptions
The Cole–Cole model can explain the dielectric relaxation process of the polymer system well [
16,
17]. The oil-impregnated insulating paper and semi-conductive paper are mainly composed of cellulose macromolecules, so the modified Cole–Cole model can be used to account for the direct current conductance. The dielectric constant FDS is fitted. The model function is as follows:
where,
—omplex permittivity;
—the material electric permittivity for frequency f→∞;
ε0—the vacuum dielectric constant;
ω—the angular frequency;
—the relaxation time, ;
—parameters related to the shape of the response;
—the static dielectric polarizability;
σdc—the DC conductivity.
In an alternating electric field, considering the relationship between the conductivity
σ(ω) and the imaginary part of the relative permittivity
ε*(ω),
σ(ω) =
ωε0ε*(ω), and by changing the real part of Equation (1), separate from the imaginary part, the relative permittivity
ε(ω) (the real part of the complex relative permittivity) and the electrical conductivity
σ(ω) can be expressed as follows:
The modified double relaxation Cole–Cole model was used to fit the relative permittivity and conductivity FDS of oil-impregnated insulating paper and semi-conductive paper with different water content. The equation parameters
ε∞, Δ
ε1, Δ
ε2,
α1,
α2,
τ1,
τ2, and
σdc are obtained by the least-squares fitting method, and the results are shown in the following
Table 2 and
Table 3:
It can be seen, from the fitting results, that the parameters
ε∞, Δ
ε2, and
σdc change most obviously with water content and have strong regularity, while other parameters are constant. Therefore, these three parameters can be selected as characteristic parameters, for characterization of the moisture content of the insulating material is m%. The functional relationship between the characteristic parameters of oil-impregnated insulating paper, semi-conductive paper, and water content is obtained by the least-squares method, as shown in the following Equations (4) and (5):
Combining Formulas (2)–(4) and
Table 2 and
Table 3, the relative permittivity
ε and electrical conductivity
σ can be expressed as a function of water content
m% and frequency
ω. Taking into account the calculated geometric capacitance and geometric resistance of each insulating layer of the IOCT main insulation, the distributed capacitance
K and resistance
R of each insulating layer can be expressed as a function of water content and frequency, that is,
K(m,ω) = ε0ε(ω, m)Kg, R(m,ω) = σ(ω,m)Rg.
3. Establishment of MTL Model of Insulation Layer
First, make the following assumptions in the IOCT main insulation:
- (1)
The distance between the main insulation of IOCT and the ground is much larger than the radial size of the head insulation layer, and the radial size of the head is much larger than the thickness of the insulation layer and the local size of the main insulation;
- (2)
Each insulating layer is a homogeneous material, that is, for each insulating layer, the dielectric parameters along the thickness direction are equal;
- (3)
The moisture distribution does not depend on the thickness and depth, that is, the moisture content at any position of the main insulation at the same time is equal.
According to the structure of the IOCT insulation system, the equivalent circuit diagram of a single insulation layer is derived as shown in
Figure 4:
In
Figure 4,
u and
i represent the voltage and current at the insulating layer
x, and
u + ∂u and
i + ∂i represent the voltage, and current at
x + dx.
K0,
R0, and
C0 are the distributed capacitance per unit thickness of the single-layer insulation, the resistance, and the capacitance to ground, respectively.
K,
R, and
C are the total distributed capacitance, resistance, and ground capacitance of single-layer insulation, respectively. In fact, the conductance
G of the insulating layer to the ground is very small, the conductance has little effect on the result, and in order to simplify the calculation, the conductance of the main insulating layer to the ground is ignored. Assuming that
d is the thickness of the insulating layer, the relationship between them is shown in the following Equation (6):
The total distributed capacitance
K and resistance
R are obtained by the method mentioned in the previous section, and they are both functions of water content
m% and frequency
ω. The ground capacitance
C is obtained by the mirror image method, and the single-layer insulation voltage equation can be established, as shown in the following Equation (7):
For the VFTO distribution calculation, of power transformer or motor winding, and current transformer insulation system, although the models and model parameters of this type of problem are different, the essence of the calculation is the same, that is, the propagation process of electromagnetic waves in complex structures. Simplifying the problem appropriately, the establishment of its mathematical model can be attributed to the following two types: lumped parameter network and multi-conductor transmission line. When the impulse voltage wavefront is steep and the repetition frequency is high, the lumped network is not accurate enough, and the lumped parameter model does not consider the wave propagation in the single-layer main insulation. Therefore, the MTL model of the IOCT insulation system is established to calculate the VFTO distribution of its main insulation with different water content. The single-layer insulation voltage equation is extended to the entire insulation system, and the equation transformation is performed to obtain the MTL model equation of the entire main insulation, as shown below:
[Z] and [Y] are the impedance matrix and admittance matrix of the insulating layer, respectively.
Through model analysis, the general form of the solution of Equation (9) can be expressed as the following Equation (10):
Among them, [Y0] = [Z]−1[P], [Ua], and [Ub] are the incident voltage column vector and the reflected voltage column vector of each insulating layer, respectively, and [Y0] is the characteristic admittance matrix.
Substituting
and the insulating layer thickness matrix [
d] into Equation (10), it can be expressed as follows:
[US] and [UR] are the first and end voltage column vectors of the insulating layer, respectively; [IS] and [IR] are the current column vectors at the head and end of the insulating layer, respectively.
According to the two-port network, Equations (11) and (12) can be expressed as follows:
According to the IOCT insulation system structure, the insulation layer is equivalent to a set of series capacitors, so the boundary conditions shown in the following Equation (12) are obtained, where
E(ω) is the excitation pulse in the frequency domain, and the voltage and current, at the end of the
i th insulating layer, are equal to the voltage and current at the head of the (
i+1) th insulating layer, respectively. The first end of the first insulating layer is connected to a voltage source, and the end of the last insulating layer is grounded.
Substituting boundary Condition (15) into Equation (13) and then sorting and simplifying the matrix, the relationship between the input voltage of each insulating layer and the input current of the first layer is obtained as follows:
Among them, [G] is the coefficient matrix related to [K0], [R0], and [C0]. From the above formula, the head-end voltage of each insulating layer can be obtained and then combined with Equations (10)–(15), so the distribution of the electric field strength of each insulating layer along the thickness direction can be obtained.
4. Calculation and Discussion
The pulse voltage is a standard lightning impulse cut wave 1.2/50 μs, the full-wave is cut off at 2.5 μs, the cutoff steepness is 1 μs, and the zero-crossing coefficient is 0.3. The positive peak value of the pulse is 330 kV, and the expression is as follows:
where,
a1 = 1.037243,
a2 = 0.9977558,
b1 = −0.0146589,
b2 = −2.4690878,
b3 = −1.201726,
t0 = 2.5,
A = 330 kV
Taking into account the dependence of the distribution parameters on water content and frequency, the excitation pulse is decomposed into a series of simple harmonics with a single frequency by FFT. By solving the MTL equation in vector form, the electric field distribution of each insulating layer along the thickness direction, under sinusoidal excitation at various frequencies, can be obtained, and then, the results can be superimposed to obtain the total electric field time-domain distribution of each insulating layer under different humidity conditions.
Figure 5 shows the excitation pulse waveform in the frequency domain.
It can be seen, from the preliminary calculation results, that the electric field is relatively concentrated in the 0–2.5 μs time period. Therefore, the electric field distribution, in this time period, is mainly studied. According to
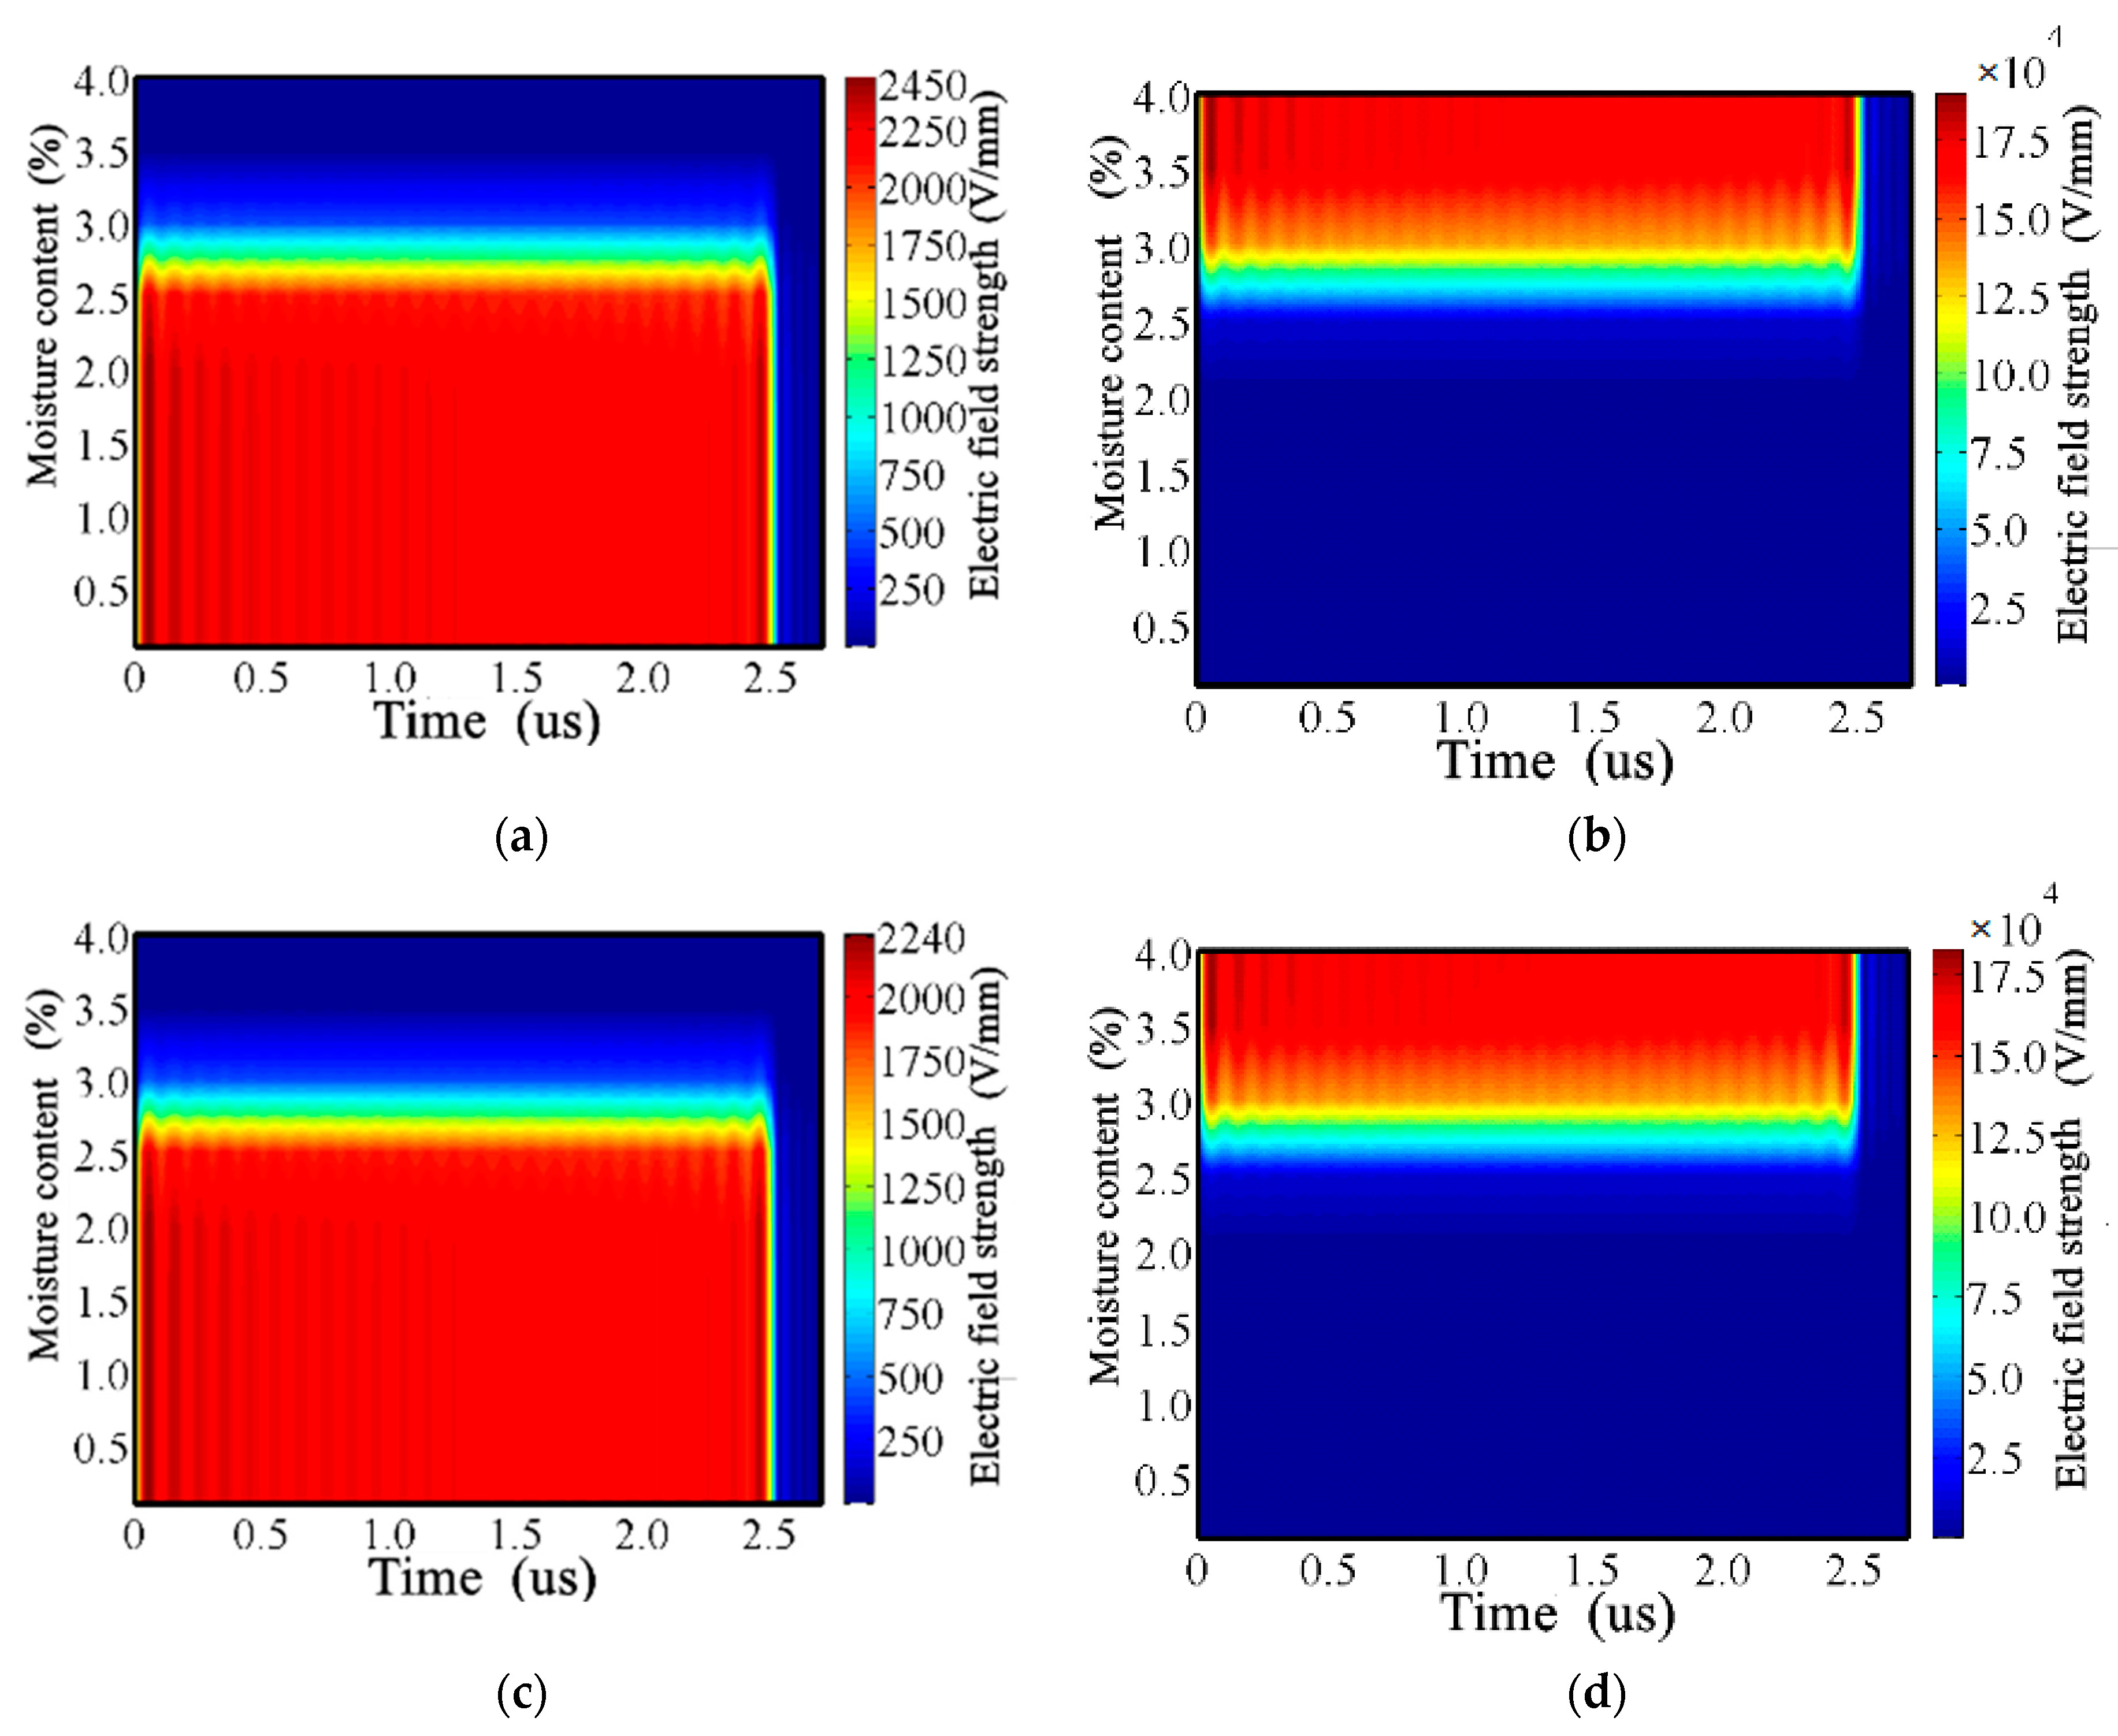
, the maximum electric field strength of the insulating layer, at any time, is located at the end of each insulating layer. Therefore, the electric field strength at the end of the insulating layer is taken for analysis. The electric field intensity distribution at the end of each insulating layer, within 0–2.5 μs under different humidity conditions, is shown in
Figure 6 below:
It can be seen from
Figure 6 that, when the water content of the IOCT insulation system is less than 2.6%, the electric field strength is mainly concentrated in the oil-immersed insulating paper, and the maximum value appears in the oil-immersed insulating paper III at 0.5 μs, which is 2476.49 V/mm; on the contrary, when the water content of the IOCT insulation system is higher than 2.9%, the maximum electric field strength appears in the semi-conductive paper II at 0.6 μs, which is 18.9 × 10⁴ V/mm; when the water content of the main insulation is between 2.6% and 2.9%, the electric field strength of the insulating layer is evenly distributed between the oil-impregnated insulating paper and the semi-conductive paper. It can be seen that the moisture content of 2.6% is the inflection point that affects the electric field distribution of the IOCT insulation system. With the change of moisture content, the most violent change in electric field strength appears in oil-impregnated insulating paper I. At 2.5 μs, the electric field strength of oil-impregnated insulating paper I, with a water content of 4%, is at a water content of 0.1%. It can be seen, 2.3 × 10⁷ times, that the influence of moisture content on the electric field intensity distribution is very significant. The results show that the proposed calculation method is effective and has engineering guiding significance for the optimization of IOCT main insulation design.


