Article

Exergy Analysis of Alternative Configurations of Biomass-Based Light Olefin Production System with a Combined-Cycle Scheme via Methanol Intermediate

1
Guangzhou Institute of Energy Conversion, Chinese Academy of Sciences, Guangzhou 510640, China
2
Nano Science and Technology Institute, University of Science and Technology of China, Suzhou 215123, China
3
School of Chemistry and Chemical Engineering, South China University of Technology, Guangzhou 510641, China
*
Authors to whom correspondence should be addressed.
Energies 2022, 15(2), 404; https://doi.org/10.3390/en15020404
Submission received: 26 November 2021 / Revised: 15 December 2021 / Accepted: 17 December 2021 / Published: 6 January 2022
(This article belongs to the Topic Exergy Analysis and Its Applications)

Abstract

:
Thermodynamic performance of three conceptual systems for biomass-derived olefin production with electricity cogeneration was studied and compared via exergy analysis at the levels of system, subsystem and operation unit. The base case was composed of the subsystems of gasification, raw fuel gas adjustment, methanol/light olefin synthesis and steam & power generation, etc. The power case and fuel case were designed as the combustion of a fraction of gasification gas to increase power generation and the recycle of a fraction of synthesis tail gas to increase olefin production, respectively. It was found that the subsystems of gasification and steam & power generation contribute ca. 80% of overall exergy destruction for each case, of which gasifier and combustor are the main exergy destruction sources, due to the corresponding chemical exergy degrading of biomass and fuel gas. The low efficiency of 33.1% for the power case could be attributed to the significant irreversibility of the combustor, economizer, and condenser in the combined-cycle subsystem. The effect of the tail gas recycle ratio, moisture content of feedstock, and biomass type was also investigated to enhance system exergy performance, which could be achieved by high recycle ratio, using dry biomass and the feedstock with high carbon content. High system efficiency of 38.9% was obtained when oil palm shell was used, which was 31.7% for rice husk due to its low carbon content.

1. Introduction

Light olefins, mostly derived from steam cracking of naphtha, have versatile applications with annual production of 230 million tonnes globally [1]. In the last 30 years, coal-based olefin technologies have been extensively developed [2], using methanol as the intermediate via the processes of methanol-to-olefin (MTO) and dimethyl ether-to-olefin (DTO) [3]. The olefins obtained usually include ethylene, propylene and butylene with low carbon chain. Great interest in bio-olefin production has also been inspired recently [4] and a negative net carbon emission was reported for the bio-olefin production process via steam gasification of biomass [5,6]. Since the pilot projects for methanol or dimethyl ether production have been demonstrated [7,8], a tandem process via biomass gasification, methanol synthesis and MTO could be a potential approach for the substitutable light olefin production.
However, this biomass-olefin process is currently significantly immature; thus, there is a need for the exploration of new conversion technologies and heat/product integration strategies. For example, biomass gasification efficiency is critical for processes such as bio-H2, biofuels and the combined-cycle for power generation. Thus, various gasification techniques were investigated using air, O2, steam or their mixtures or adopting staged gasification processes [9].
Besides, coproduction of electricity and biofuels could also benefit the flexibility of a biomass-based system. A nonlinear optimization model was applied to decrease the cost of a poly-generation system for the generation of power, Fischer–Tropsch (FT) oil and methanol from the hybrid feedstocks of biomass, coal and natural gas [10]. As to the biomass-olefin system, most studies have been carried out on the gasification process [11]. This may be due to its outperforming environmental impact for ethylene production, as compared with a fermentation-based route [12]. Comparing of ethylene manufacturing via biomass fermented ethanol and bioethanol dehydration and shale gas steam cracking shows that the corn-stover-based fermentation pathway resulted in the highest ethylene price [13]. It was found that high yield of syngas could benefit methanol synthesis and the subsequent olefin production [14]. Given the growing interest for bio-light olefin supply, evaluation of the various process configurations is needed to testify to its feasibility and possible improvement [15,16].
Exergy analysis is a useful method to distinguish the source of thermodynamic degradation in the conversion processes of coal and natural gas. The exergy-derived analysis from the aspects of economy and environment was also developed [17]. As to biomass, exergy analysis was mainly focused on the separate conversion processes, such as gasification, biogas reforming and combustion [18]. It was reported that exergy destruction usually occurred due to phase change, temperature change and chemical reaction in these processes [19]. The exergy analysis of the integrated system or facilities was mostly carried out for the production of bio-H2, bio-ethanol, bio-FT oil, methanol [20,21].
However, the research on the configuration evaluation of biomass gasification based-olefin system is rather limited. Hannula et al. estimated the possibilities for olefin production by heat integration using biomass-derived methanol and an off-site MTO plant [16]. At the system level, the assessment from the aspects of carbon emission and energy efficiency was investigated [1,6]. The economic study on different configurations for coproduction of olefin and liquid fuels from biomass and natural gas suggested that high olefin production could be profitable because of the high net present values [22]. Xiang et al. carried out an overall exergy analysis of a biomass-olefin system via methanol [23]. Yang et al. studied bio-olefin systems by incorporating bio-methanol production and DMTO-II olefin synthesis, of which the overall exergy efficiency was 58.4% [24]. To date, the exergy analysis at the level of operation unit for a biomass-olefin system is not clearly studied and the detailed exergy analysis is not available in the literature.
Furthermore, the alternative configurations for coproduction of olefins and electricity are still under investigation according to the coproduction strategy. Besides, the property of biomass feedstock is critical for bioenergy processes [25]. As the elemental composition and physical properties are different for forest residues and agricultural residues, these certainly affect the heating values and chemical exergy of the feedstocks [26]. As a result, the different input energy to the bioconversion system may therefore affect conversion efficiency as various feedstocks are supplied [27].
This study is therefore designed to conduct a detailed exergy evaluation on the conceptual biomass-olefin system via gasification and synthetic methanol/olefins. Three alternative production schemes, coupled with the combined cycle for electricity generation, were proposed and compared. The base case was the system using O2-steam for gasification, as reported in the previous work [28]. The other two modifications of the base case were as follows: (1) the combustion of a fraction of gasification gas to increase electricity production (power case); (2) the recycle of a fraction of synthesis tail gas to increase methanol/light olefins production (fuel case). The performance of the different configuration was evaluated and compared in terms of yield, utility usage, and exergetic efficiency. In addition, the detailed exergy analysis was performed at the levels of the overall system and subsystem, as well as the operation unit, respectively, to ascertain the exergy destruction source, which has not yet been reported in the literature. Furthermore, the sensitivity analysis of the recycle ratio of synthesis tail gas, the moisture content of the feedstock and biomass type on system performance, which were critical for the product proportion between olefins and electricity, was studied. At the same time, rough annual sales were calculated according to different price scenarios of electricity and olefin products. Particular attention was paid towards the possible approaches to enhance exergetic efficiency of the biomass-olefin system.

2. Materials and Methods

2.1. System Description

The system simulated is depicted in Figure 1 and the dried feedstock treatment capacity is ca.200,000 t/a. It included the subsystem of biomass gasification, gas composition adjustment, methanol and olefin synthesis, steam and power generation and cooling water treatment. O2-steam gasification of biomass is considered in the base case, as further detailed in Section 2.1.1. The two alternative configurations are the power case and the fuel case, as mentioned above. All cases were designed to be self-sufficient of steam and electricity.

2.1.1. Base Case

The system of the base case is based on O2-steam gasification of biomass. Poplar wood chips were used as the feedstock; its proximate and ultimate analysis are listed in Table 1 [29].
Briefly, the moisture content of feedstock first decreased from 20 wt% to 12 wt% by the exhaust gas from the steam & power generation subsystem. The dried biomass was then introduced to the gasifier, operated at high temperature of 825 °C to reduce the contents of light hydrocarbon and tar in gasification gas. Therefore, the reformer was avoided, which is a modification from the previous design, in that the combination of a low-temperature gasifier (725 °C) and a high -temperature reformer (850 °C) was designed for raw gasification gas production [28]. To sustain the high and isothermal gasification temperature in this context, a virtual heat stream was adopted to simulate the circulating hot bed material or external heat source supplied to the gasifier. The sum of the heat duties of the gasification section (decomposer, gasifier and combustor) was zero to make the overall gasifier adiabatic using O2-steam gasification [21]. Steam and O2 (95 vol%) were the gasification agents, with the mass ratios of O2/biomass and steam/biomass (O/B and S/B) as 0.14 and 0.26, respectively. After, separation of ash and the other particles was performed by a cyclone separator. The raw gasification gas, after being cooled to 40 °C, was initially compressed to 2.0 MPa, followed by sulphur removal by LO-CAT and ZnO absorber at 43 °C and 375 °C, respectively. The subsequent unit of water-gas shift reactor (denoted as WGS) was applied to increase the H2/CO molar ratio of the gas stream to 2.0 at 350 °C and 2.0 MPa. A pressure-swing adsorber (PSA) was designed to remove CO2 by propylene carbonate adsorption with 80% CO2 removal efficiency. A second compressor enhanced pressure to 4.0 MPa for methanol synthesis. The isothermal temperature for synthesis was 240 °C, maintained by boiling water for steam generation. After two-stage coolers by air and water, the temperature of synthesis tail gas decreased to 45 °C and the obtained liquid blend contained ca.95 wt% methanol, which was used for olefin production. The MTO reactor was operated at 0.4 MPa and 400 °C, just as in UOP/Hydro’s MTO process with ca. 90% selectivity to light olefins and nearly complete methanol conversion [23]. The details of olefin separation, subsystems of utility as steam and power generation and cooling water have been referred to in the previous work [28]. Tail gases from PSA and methanol synthesis are combusted for heat and steam generation.

2.1.2. Power Case and Fuel Case

The power case is aimed at enhancing electricity generation; 20% of the raw gasification gas is split and introduced to the combustor, together with the tail gases from PSA and methanol synthesis. The remaining 80% of the raw gasification gas is treated following the same procedure as that in the base case. In the fuel case, 20% of the synthesis tail gas was recycled to the second compressor and compressed in order to enhance olefin production. The remaining 80% of synthesis tail gas was supplied for combustion in steam and power generation subsystems as that in the base case.
The splitting ratios of the streams mentioned above were used to investigate system performance under typical scheme configuration, together with the precondition of self-sufficiency in terms of electricity and steam.

2.2. System Simulation

The system is simulated using Aspen Plus software (Aspen Technology Inc., Bedford, MA, USA) with the RKS-BM method as the general method to define thermodynamic property. CO2 removal by the alkali absorber follows the ELECNTRL method, due to the electrolytic reactions during chemical absorption. The assumptions and parameters are briefly presented in Table 2, along with the modules of the main operation units. The gasifier was modelled with a Gibbs module to calculate the equilibrium gasification composition at 825 °C by minimizing Gibbs free energy. Although the adoptiong of thermal equilibrium in this context may overpredict H2 and CO content in the gas as compared with the actual conditions, it is still a common and reliable approach to model biomass gasifier, especially for theoretical studies when no experimental data is available. The PSA unit is simply modelled using an sep module and olefin yied is calculated according to the UOP/Hydro’s MTO report. The subsystem of cooling water treatment was designed to supply cooling water at 28 °C with 9 °C rise in the water coolers throughout the system.

2.3. Exergy Analysis

Exergy comparison of the three coproduction configurations was performed at the levels of system, subsystem and operation unit. The exergy balance at the levels of system and subsystem was calculated as the equation below:
E x F , j = E x P , j + E x D , j + E x L , j
where ExF, ExP, ExD, and ExL represent the exergy rates of inputs, desired products (olefin and surplus electricity, denoted as Exole and Exelec respectively), irreversible destructions, and loss to the surroundings, respectively. The subscript j denotes a subsystem or the overall system. In addition, exergy rates include the energy streams from materials, heat and power, which are defined similarly with that in the reference [30]. For example, the exergy rate of a material stream is the sum of chemical exergy, physical exergy and mixing exergy.
The exergy balance of each operation unit depends on its type, which follows the well-established criteria in the literature [31].
E x F , i = E x P , i + E x D , i
The subscript i denotes an operation unit. The exergetic efficiency and exergy destruction ratio of the system and subsystems are expressed as ηEx,j and yD,j, which are calculated as below respectively [21].
η E x , j = E x P , j / E x F , j × 100 %
y D , j = E x D , j / E x F , t o t × 100 %
where ExF,tot is the total input exergy rate to the system. The exergetic efficiency of an operation unit (ηEx,i) is also defined and similar to that of ηEx,j.

3. Results

3.1. Verification of System Modeling

The overestimated H2 content and underestimated CH4/tar content may occur when the equilibrium RGibbs gasification model is adopted. However, this simplified treatment of gasifier may still be able to predict its thermodynamic tendency and is still useful, as reported by other theoretical research [32]. Therefore, it was adopted in this conceptual study. The comparison of gasification gas composition was investigated, which is consistent with the reference results as shown in Table 3.
For the MTO process, an RStoic module was adopted. Selectivity to light olefins of 90.3% and complete methanol conversion are in accordance with the literature results (not shown for brevity) [16].
From the above verification results of the key operation units, it is reasonable to deduce that the modeling assumptions are reasonable to carry out the theoretical exergy analysis on bio-light olefin production in this context.

3.2. Overall Balance of Mass and Energy

The overall mass balance and flow rate derived from the simulation are presented in Table 4. The input air for reactions was consumed for sulphur removal and combustion. Makeup water is mainly supplied to compensate for the water losses in the conversion processes and evaporation in the cooling tower. Except for the desired olefins, the output materials also include the waste streams, such as ash, wastewater, flue gases from heat recovery and dryer.
The maximum electricity generation was 23.5 MW, obtained in the power case. However, it was at the expense of low olefin production (2.93 t/h). Subsequently, relatively low amount of alkali solution is applied for CO2 absorption from the crude olefin flow stream and the flow rate of wastewater decreases to 10.1 t/h. The flow rate of air evaporation in the power case (2520 t/h) was much higher than that in the base case and the fuel case. It could derive from its high steam amount and the high condensation duty, which needed more air blowing to the cooling tower. At the same time, it had the highest flow rate of makeup water as 63.7 t/h since the amount of recycling water and its evaporation depended proportionately on the system cooling duty. As a result, the water consumption ratio was raised to 21.8 t/t olefins in the power case.
Compared with the base case, the recycle of 20% synthesis tail gas increased light olefin yield to 0.156 t/t biomass in the fuel case. However, it was still lower than the results of bio-mixed alcohols and analogous results of bio-light olefins, which is in the range of 0.169–0.245 t/t biomass, as reported [16,35]. It could be ascribed to the tandem conversion processes for bio-light olefin system and a low methanol yield of ca. 0.41 t/t biomass under low-pressure synthesis condition even for the fuel case in this study. The relatively high yield of light olefins in the fuel case decreases its utility with the makeup water and electricity consumption ratios as 12.3 t/t and 3.45 MWh/t, respectively.
The flow rate of flue gases in the fuel case was relatively low at 123 t/h. Yet, the consumption of alkali solution for CO2 absorption synchronously increased to 7.51 t/h as a result of light olefin yield increase, which also enhanced the flow rate of wastewater to 14.1 t/h.

3.3. Exergy Results

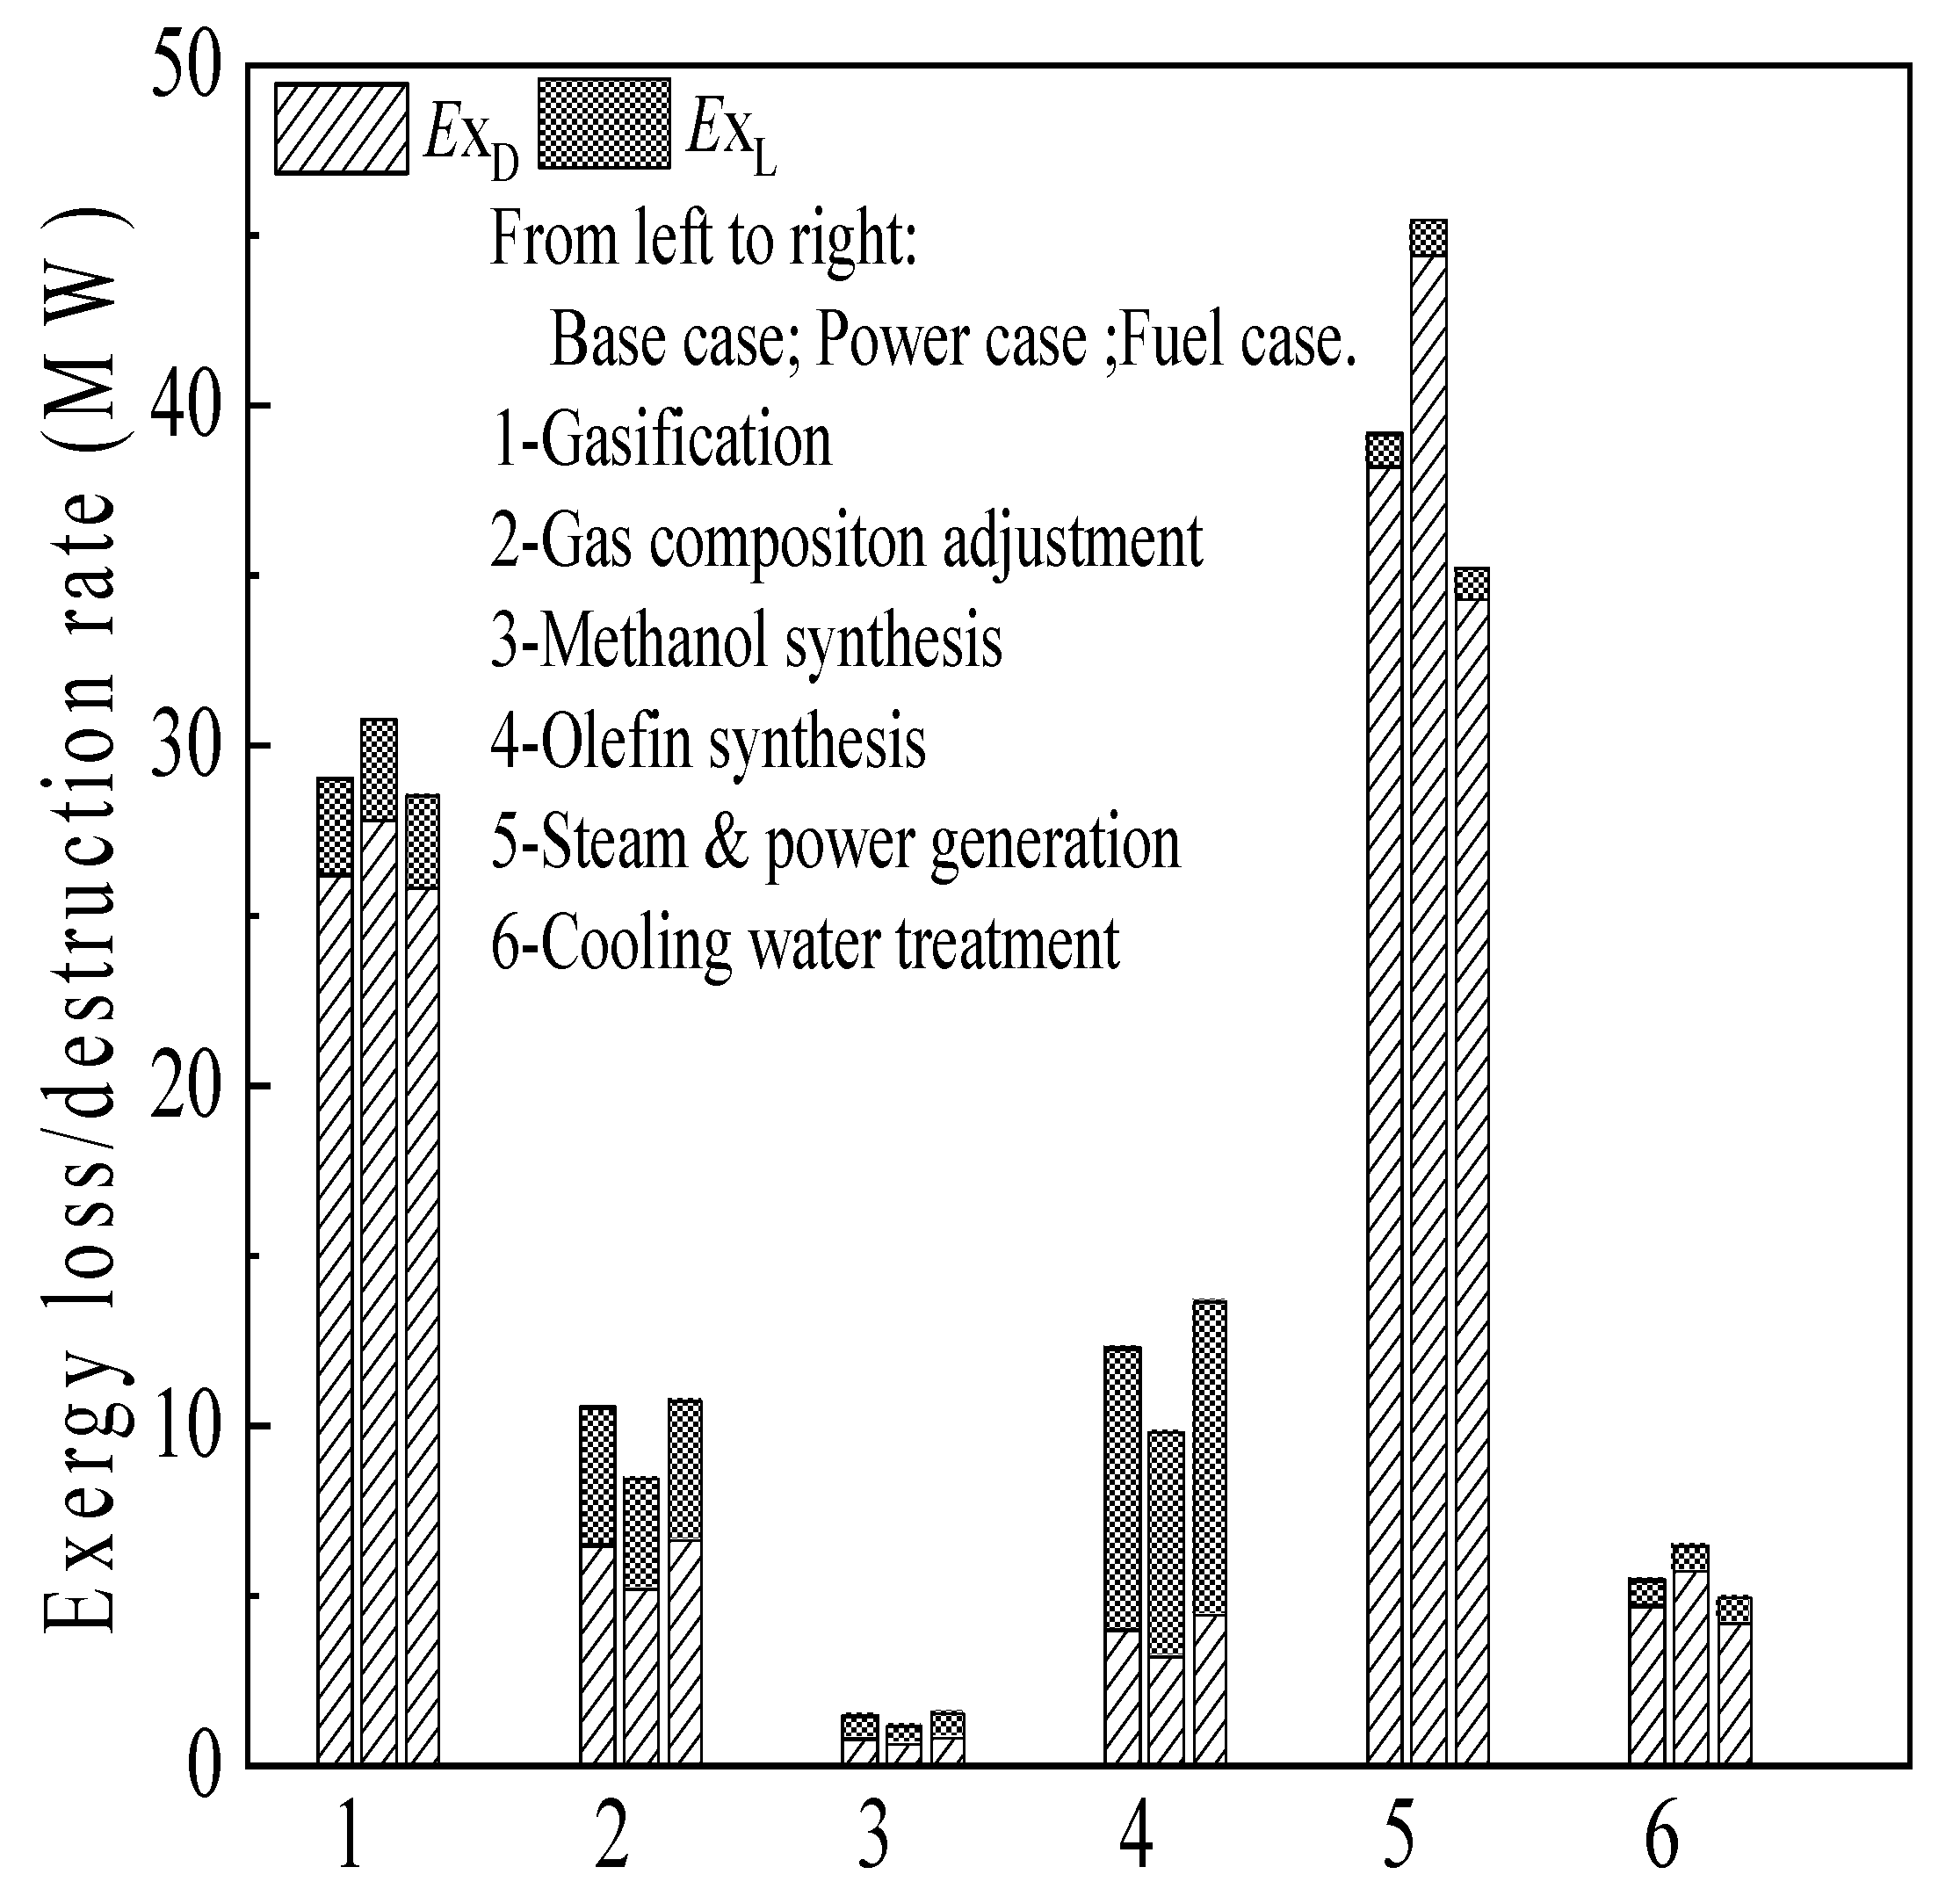
3.3.1. Exergy Analysis at System and Subsystem Levels

Exergy balance at the system level is presented in Figure 2. Since the input streams such as air and water are introduced to the system at the reference state (0.1 MPa and 25 °C), their exergy rates are rather small. Thus, the exergy rate of biomass of 150.9 MW accounts for ca.99% of the total input exergy for all cases.
The exergy rate of light olefins increased from 48.7 MW to 54 MW when 20% synthesis tail gas is recycled. Together with the exergy rate of output electricity of 3.79 MW, the overall exergetic efficiency increased to 38% in the fuel case. Yet, it was still low compared with the other biofuel production systems. For example, microwave-assisted biomass pyrolysis showed an exergetic efficiency of 48.8% using corn stalk [36]. Using coke-oven gas and pulverized coke demonstrated 65% exergeitc efficiency toward coproduction of olefins and ammonia [37]. The efficiency was in the range of 37–44% for the bio-olefin system with biomass moisture content of 6.9 wt% [6]. However, the bio-FT system using biomass with 50 wt% moisture content presented low exergy efficiency of 24–27% [21]. Therefore, the moisture content of feedstock and the tandem process might have resulted in the low yield of light olefins and exergetic efficiency in this context. Besides, the precondition of power self-sufficiency also associates with the severe exergy destruction in the combustion units, it consequently decreased overall system efficiency [38].
Splitting 20% of the raw gasification gas for combustion enhanced the exergy rate of net output electricity to 11.6 MW at the expense of the low light olefin yield in the power case. Moreover, its internal exergy irreversibility was the maximum of 86.9 MW. At the same time, the exergy loss to the surroundings in the power gas is relatively low at 15.1 MW.
It is seen that the input exergy of the subsystem decreases along with the conversion pathway in Table 5, which means exergy destruction from the tandem production of syngas, methanol and light olefin subsequently. Due to the introduction of the combustion effluent gas for drying, together with gasification steam, the input exergy rate of the gasification subsystem is above 175 MW in each case, which is higher than biomass input exergy of 150.9 MW. For the gas composition adjustment subsystem, the input exergy, including WGS steam, compression work, heat stream for sulphur removal and raw gasification gas, is also higher than biomass exergy in the base case and the fuel gas. However, it decreased to 127 MW in the power case due to the splitting of 20% raw gasification gas for combustion, rather than for syngas production.
The exergy destruction rate and exergy loss to the surroundings for the gasification subsystem in the power case were 27.8 MW and 2.97 MW, respectively, slightly higher than those in the base case and fuel case, as shown in Figure 3. It might be due to the large amount of combustion effluent gas for biomass drying and the corresponding irreversibility heating loss. As a result, this subsystem has a relatively high inefficiency of 18.2%.
For the subsystem of cooling water treatment, the exergetic efficiency was less than 10% within all cases due to the low chemical exergy of the recycling water, which was the only product of this subsystem. The relatively high output exergy of this subsystem in the power case also indicated the high amount of recycling water and the entropy increase [39]. Thus, the highest exergy destruction ratio of this subsystem at 3.75% was found in the power case, although it only represented 5.61% of system thermodynamic inefficiency.
The exergy irreversibility rate in the subsystem of methanol synthesis was rather low, which is less than 1 MW for each case. Certainly, the exergy destruction rate slightly increased with the syngas flow rate, from the power case to the base case, and to the fuel case. For the subsystem of olefin synthesis, the input and output exergy and exergy destruction rate are also proportionally related to olefin yield. The high exergy loss to the surroundings of 9.22 MW for the olefin synthesis subsystem in the fuel case was mainly derived from the increased amount of non-condensable gas and waste alkali solution.
The exergy destruction ratio of 29.1% and the rate of 44.4 MW for steam & power generation subsystem in the power case are the highest, which is accompanied by less than 56% exergetic efficiency. In this sense, the utilization of gasification gas for combustion decreased the exergetic efficiency at the subsystem level, and therefore the overall system level [38]. Since exergy destruction is caused by the non-isentropic process, the exergy analysis of the main operation unit among the conceptual system was calculated and is discussed below to ascertain the thermodynamic irreversibility sources under various system configurations.

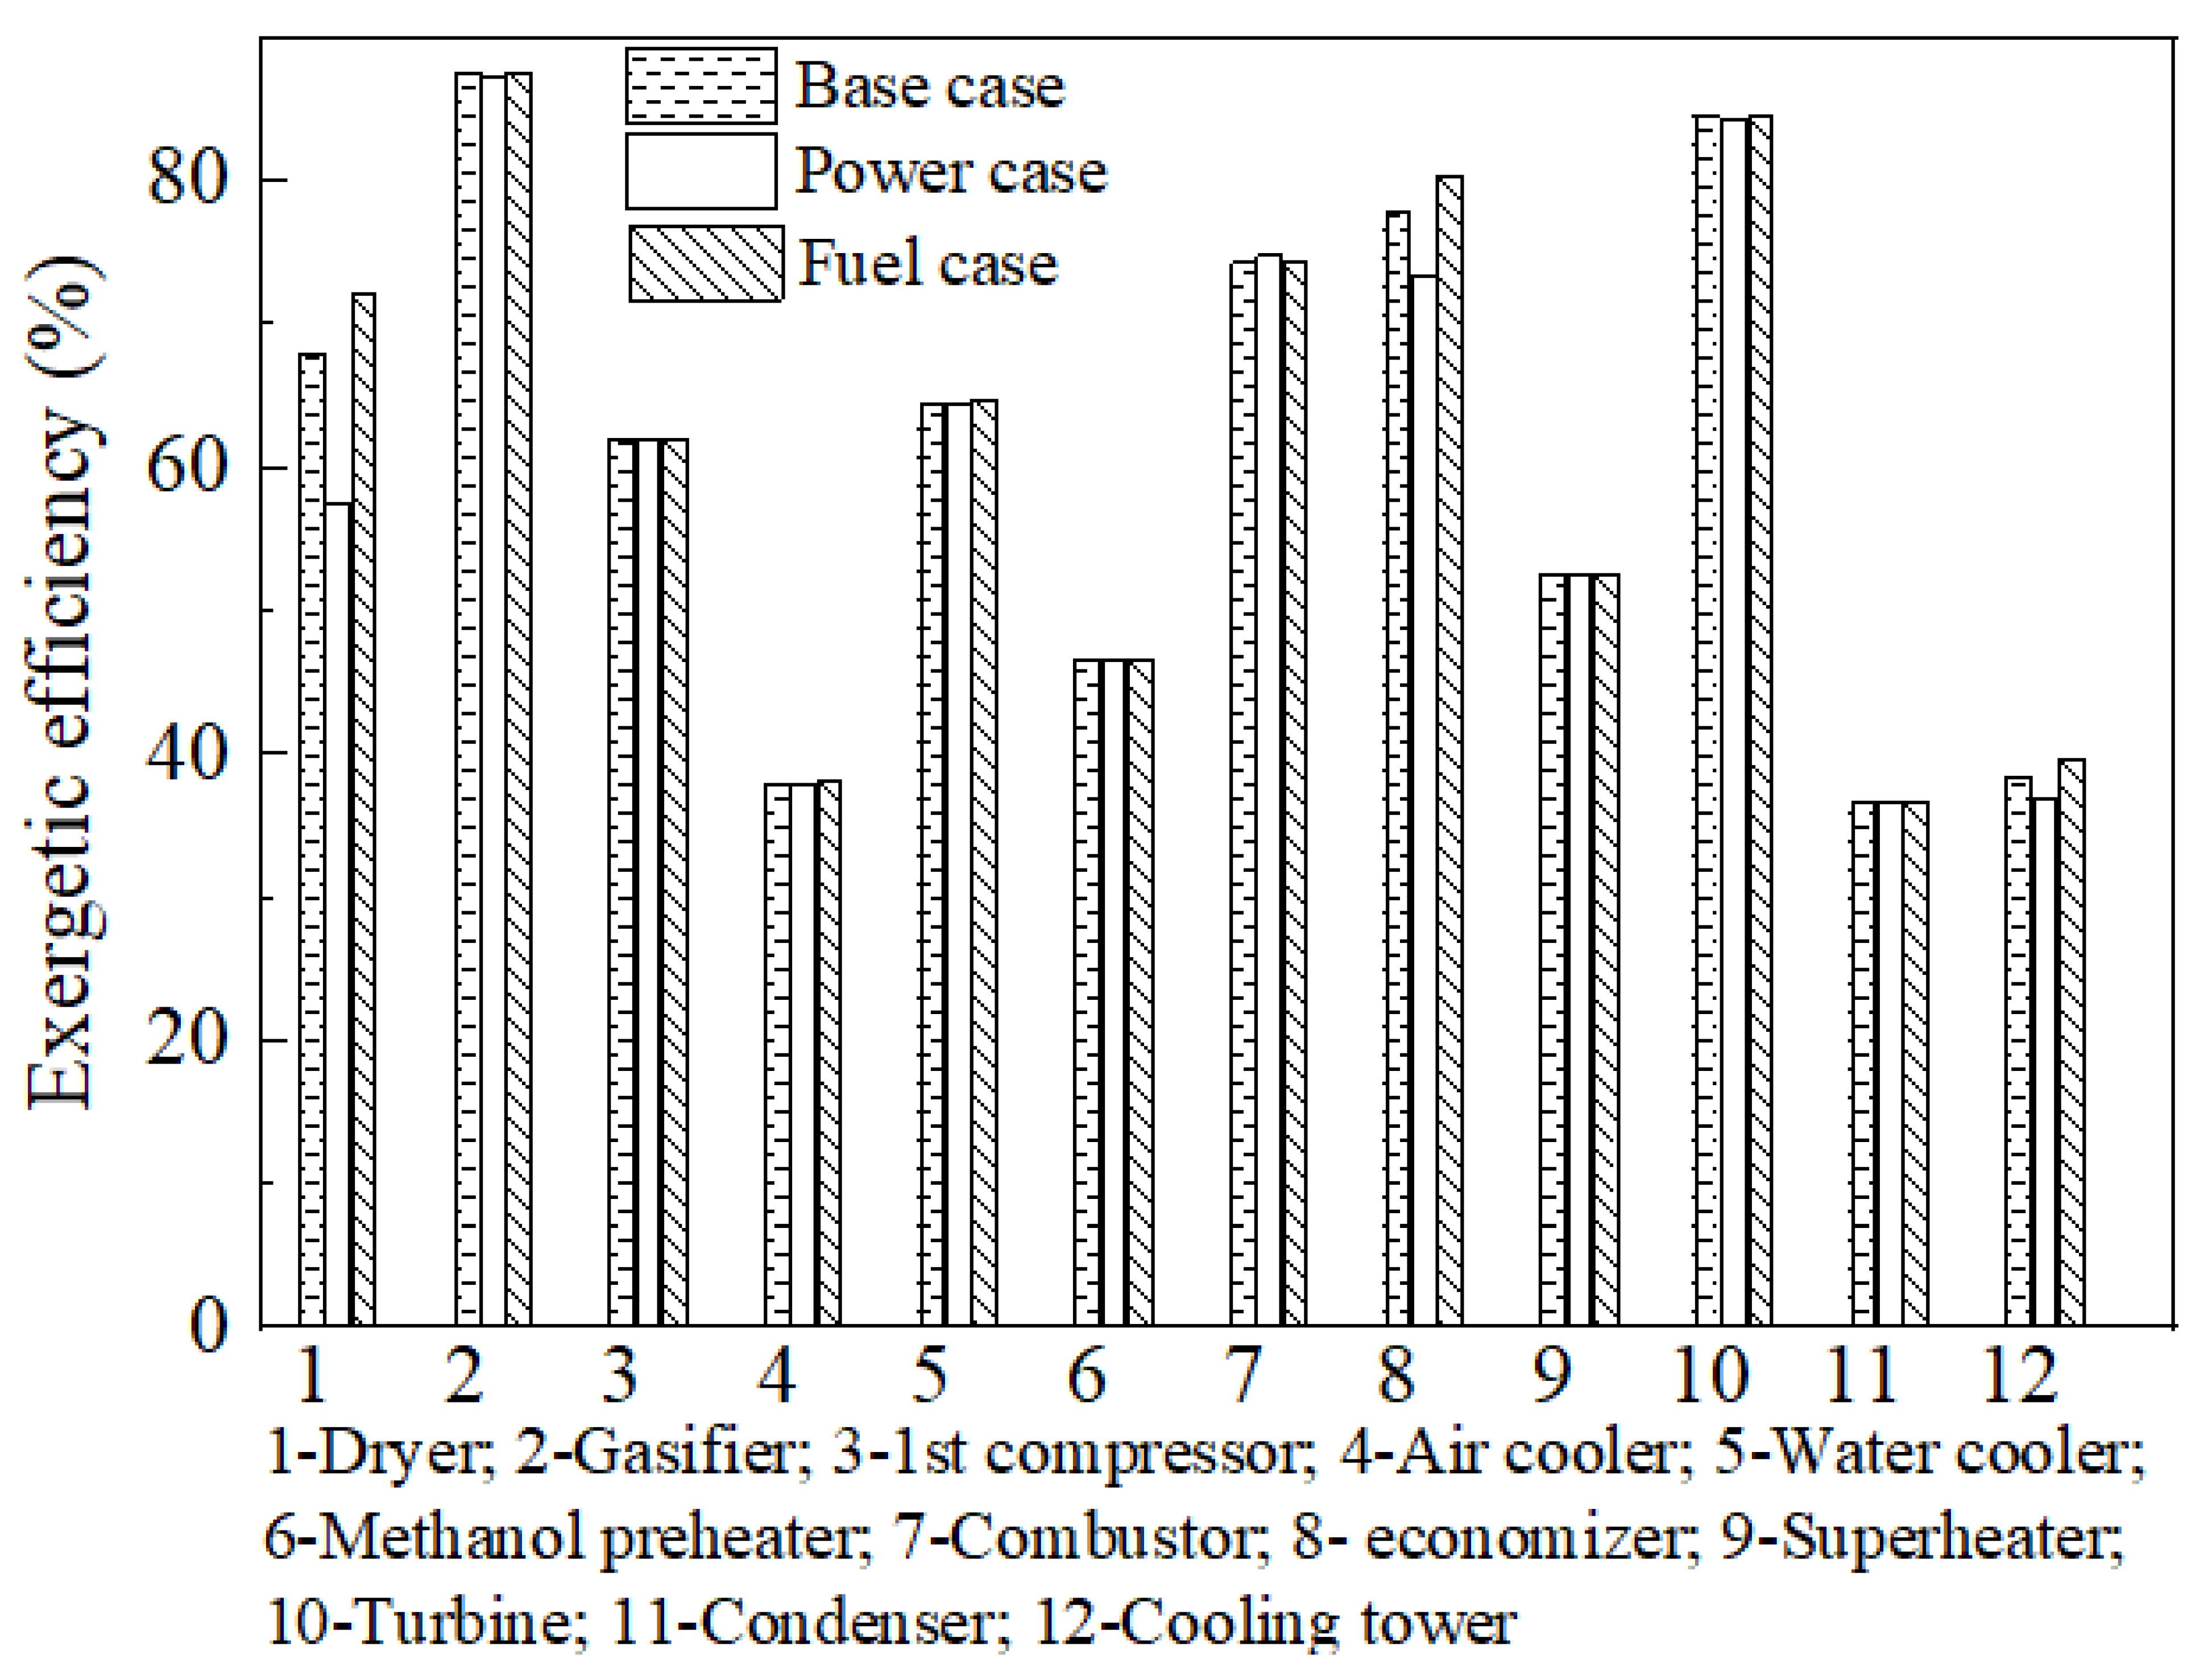
3.3.2. Exergy Analysis at The Operation Unit Level

As seen from Table 6 and Figure 4, the exergy destruction rate in the dryer was 2.89 MW with the low efficiency of 57.3% in the fuel gas. It could attribute to the moisture evaporation by relatively high amount of combustion effluent gas and the other heat sources. Due to the high amount of the recycling water mentioned above in the power case, the efficiency of the cooling tower decreases to 36.8% in the power case. Water evaporation by air blowing and temperature dropping causes exergy destruction rate of 4.58 MW, which is only 3.37 MW in the fuel case.
The total exergy destruction rate was less than 9 MW for three reactors (WGS, methanol reactor and olefin reactor) and alkali absorber with high exergetic efficiencies of above 94% within all cases. It was due to the stable temperature and pressure of these reactors and the formed products with high standard chemical exergy like methanol and olefins. The increase of the irreversible formation of CO2 in the WGS reactor and H2O in the methanol reactor results in the increase of the exergy destruction rate in the reactors as the order of power case < base case < fuel case. Similarly, the exergy destruction rates of air cooler and water cooler, settled to decrease the temperature of the effluent gases from the reactors of WGS, methanol/olefin synthesis, also follow the same order. Nevertheless, the exergetic efficiency of air cooler (ca. 38%) was lower than that of water cooler (ca. 64%), attributing to the relatively large temperature difference in the air cooler.
The compressors account for an exergy destruction rate from 2.98 MW to 3.91 MW with the efficiency in the range of 62–67.4%. In particular, the second compressor involves compressing the recycled synthesis tail gas in the fuel case. Therefore, it shows a higher exergy destruction rate. The irreversibility caused by pressure increase and friction in the compressor made it the significant inefficient unit in the subsystem of gas component adjustment.
The noticeable exergy irreversibility exists in the combustor and gasifier, followed by condenser, superheater, and turbine. The high exergy destruction rate in the gasifier and combustor contributes ca.55% of total exergy irreversibility in all cases.
In the gasifier, biomass was the main input exergy and the decomposition of solid feedstock into gaseous molecules causes chemical exergy degrading. The internal entropy generation in the gasifier contributed high irreversibility, which was ca. 23 MW within all cases. However, the physical exergy of raw gasification gas somehow compensated the output exergy of the gasifier with the exergetic efficiency of ca.87%, derived from high gasification temperature of 825 °C in this study [40]. In combustor, burning the tail gas for heat generation also involved chemical exergy degrading to CO2 and H2O and heat transfer across temperature difference. That resulted in the exergetic efficiency of less than 75% within all cases. The high exergy destruction rate of 24.2 MW is found in the power case.
Condenser and superheater are another two units that contribute to a high exergy destruction rate with low efficiency in the subsystem of steam & power generation, deriving from the change of phase and temperature [41]. Since more electricity is generated in the power case, it also means the increase of irreversibility by non-isentropic processes, such as steam expanding and pressure drop, which is 4.38 MW in the power case and 3.28 MW in the fuel case, respectively. The relatively low exergetic efficiency (73.3%) for the economizer in the power case is mainly due to the inefficient heat transfer behavior and the quite amount of heat for water temperature change.
As more tail gas is introduced to the steam & power subsystem in the power case, it is related to the enhanced physical exergy change or phase change within the irreversible heat transfer units such as combustor, economizer and condenser. That results in the low exergetic efficiency of this subsystem in the power case (54.7%) as discussed in Section 3.3.1, which also makes it the less favorable system configuration in terms of exergy.
As discussed above, the non-isentropic processes, accompanies by chemical conversion, phase change, heat transfer or pressure drop, cause entropy generation. Of the main system units, the exergy destruction rate of the gasifier is more than 22 MW within three system configurations; therefore, it has a critical effect on system performance. Moreover, the serious irreversibility in the combustor also illustrates the feasible approach for system improvement. Besides, heat allocation and optimization among different subsystems and units could also possibly reduce irreversibility in the steam cycle [42].

3.4. Sensitivity Analysis

It is seen that recycling synthesis tail gas impacts not only light olefin yield, but also net output electricity. In addition, the property of biomass feedstock could also affect carbon conversion and thermodynamic performance of biofuel system. Therefore, the effect of the recycle ratio of synthesis tail (F, 0–80%), biomass moisture content (12–60 wt%) and biomass type (rice husk, cotton stalk, poplar chips and oil palm shell) on the coproduction system is investigated and compared below.

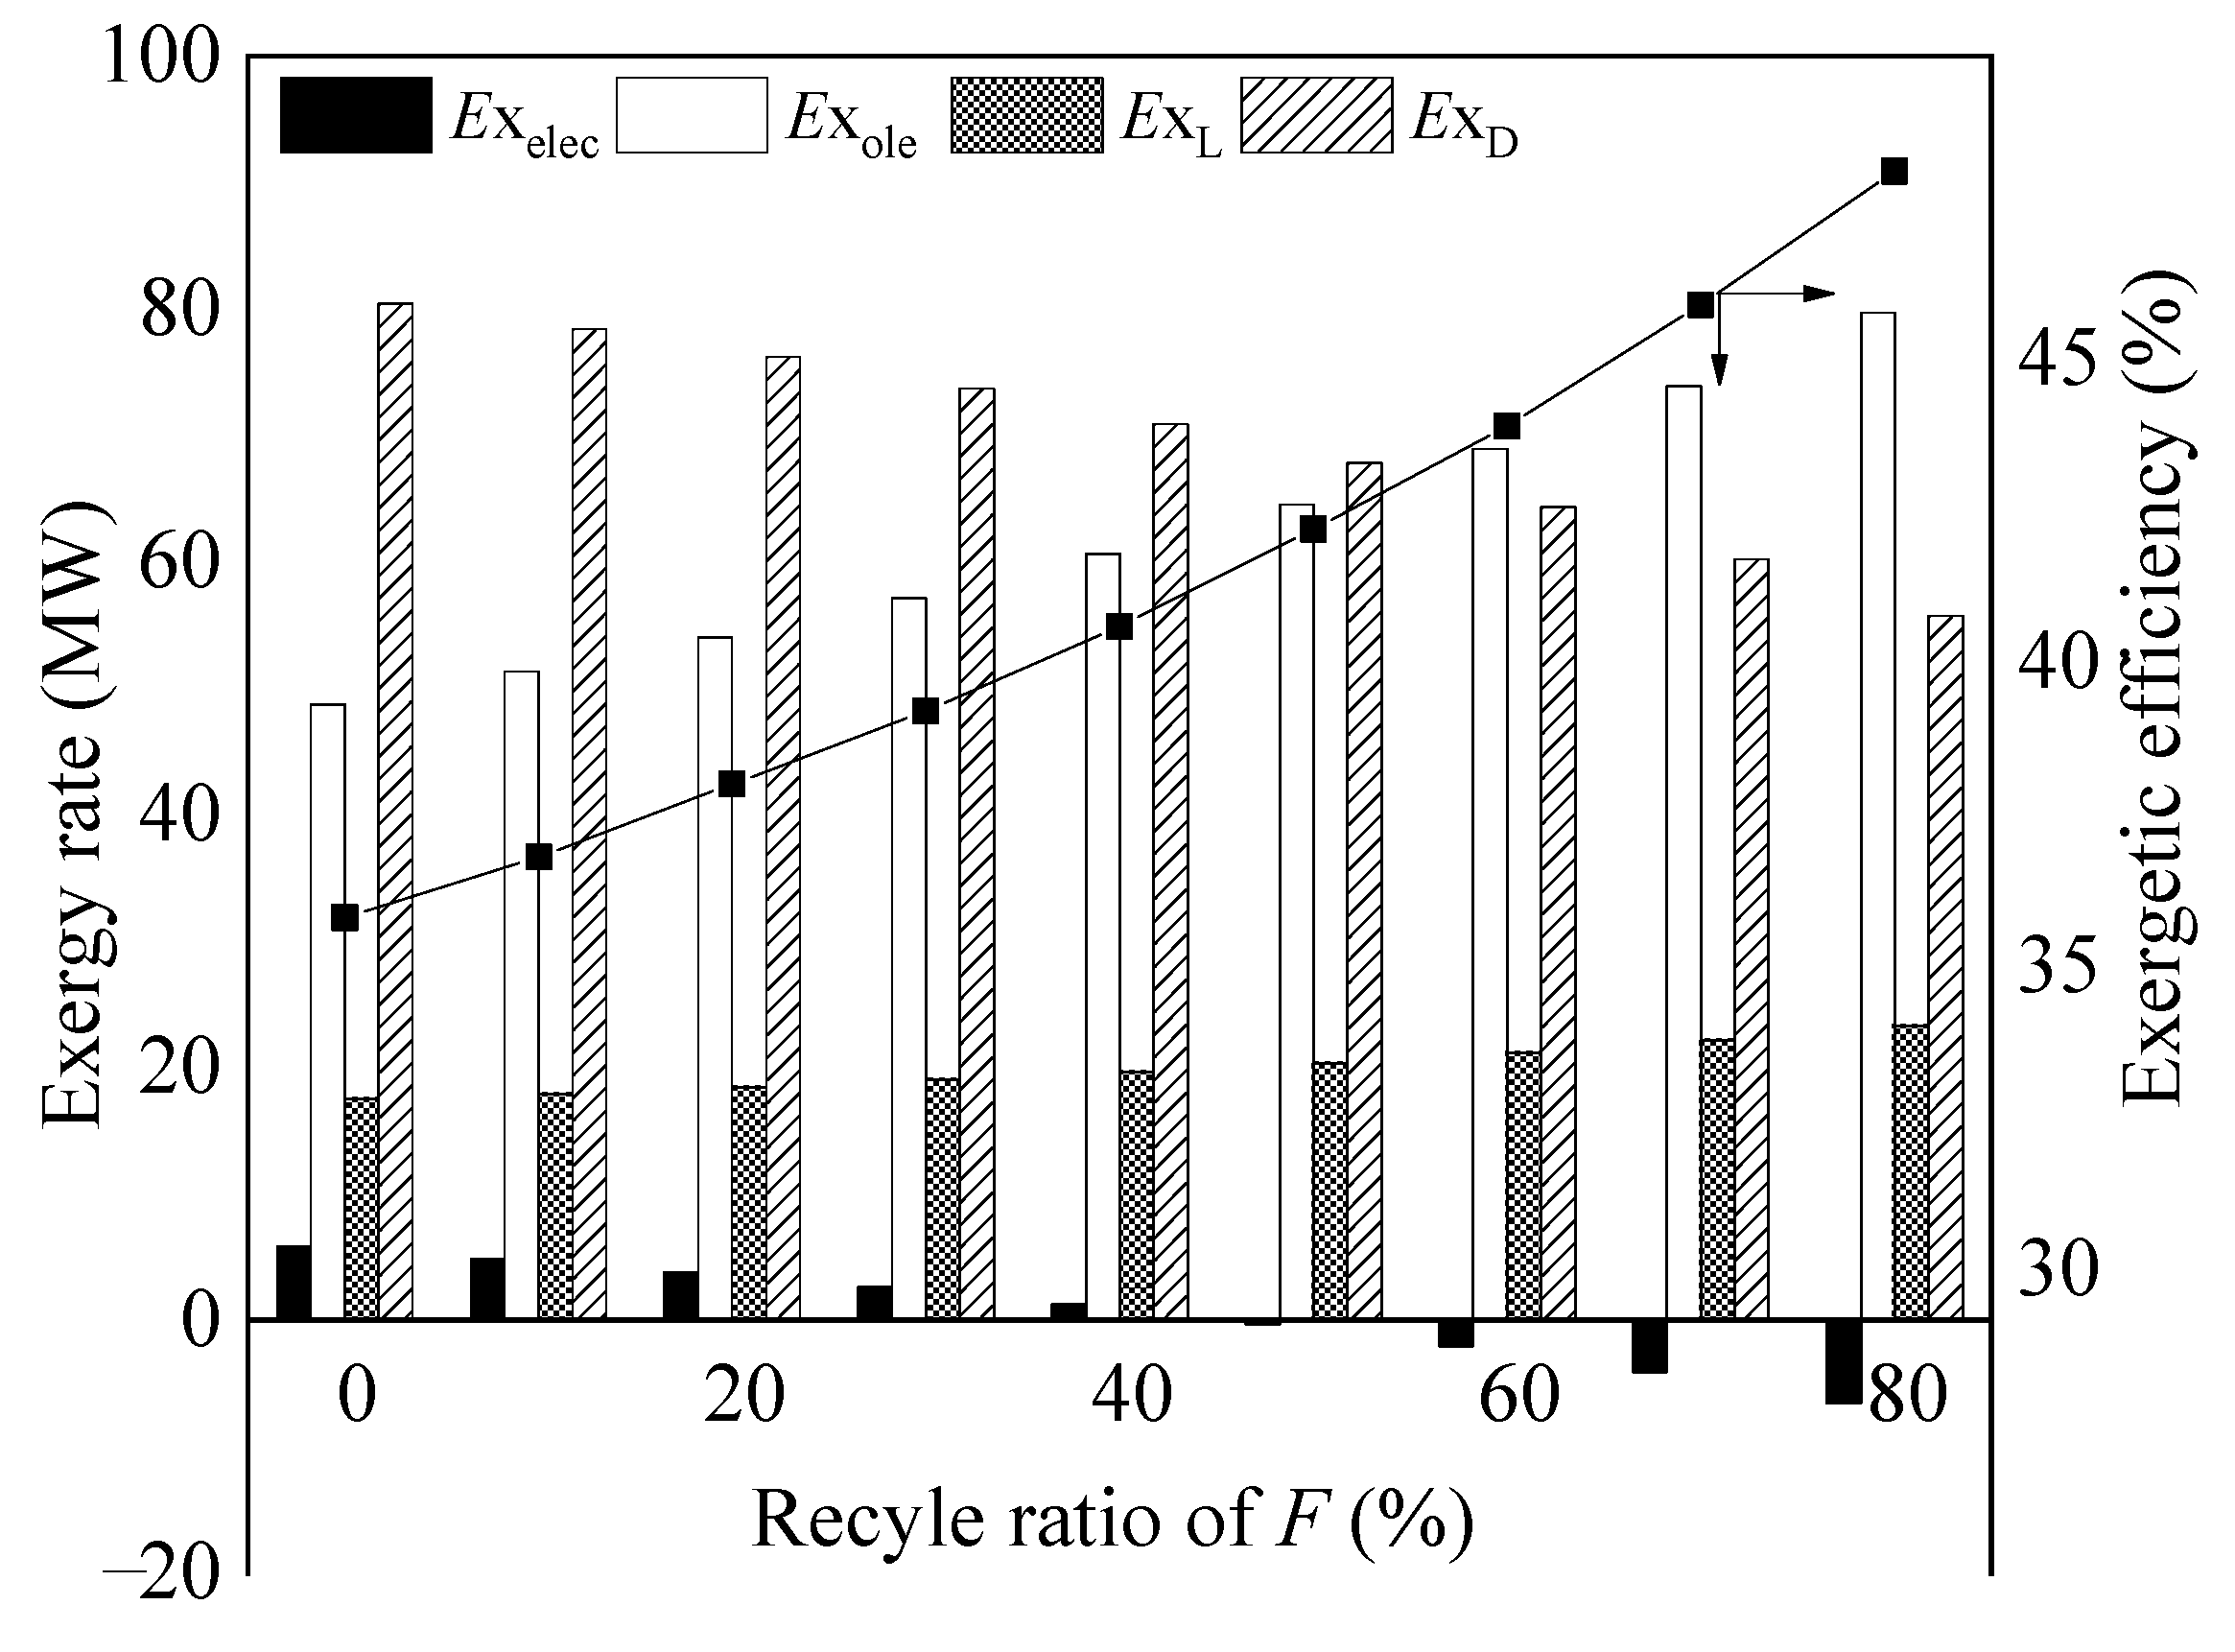
3.4.1. Effect of the Recycle Ratio of Synthesis Tail Gas

It should be pointed out the recycle ratio is designed in the range of 0–80%, since some synthesis tail is combusted to generate steam for gasification and WGS reaction. The exergy flow rate of olefins keeps increasing from 48.7 MW to 79.7 MW when F value increases from 0 to 80% as shown in Figure 5, due to the enhanced yield of methanol and light olefins. Electricity is self-sufficient when F is below 50%. On one hand, electricity requirement increases since more flow gas is treatment by compressor and pumps, etc. On the other hand, electricity generation decreases when F value increases. That results in an increase of input electricity, which is 6.59 MW at the recycle ratio of 80%. The exergy loss to the surroundings increases from 17.5 MW to 23.3 MW for F value range of 0–80%. It is attributing to the increase of non-condensible gas emission from MTO reactions and heat released from air coolers, as discussed above. Consequently, system irreversibility decreases from 80.4 MW to 55.7 MW. The overall exergy efficiency increases to 48.1% at F value of 80%, which is compatible with the reference result of 47.6% with 95% recycle ratio [23].
Although the exergy efficiency of the biomass-olefin system can be improved by recycling tail gas for light olefin production, it does not mean that the economic performance is optimal, since external electricity must be supplied. According to market investigation, the average prices of industrial electricity supply and light olefin selling are ¥ 0.725/KWh and ¥ 6560/t in China, which usually fluctuates in the range of ¥ 0.425–1.025/KWh and ¥ 4920–8528/t, respectively. Taking the average prices of electricity and light olefins as the benchmark, the relationship between the recycle ratio and the sales of the biomass-olefin system is calculated. Five price scenarios are considered as seen in Figure 6.
The overall system annual sales for the base case are ¥ 247 MM/a, which increases to ¥ 302 MM/a at the F value of 80%. With the increase of the F value and overall exergy efficiency, the tendency of system sales keeps increasing, except for the scenario with high electricity price and low olefin prices. It could attribute to the increasing electricity demand at high F values. The increase of light olefin sales by its high yield is somehow offset by external electricity cost. The remarkable increase of annual sales is found for the scenario with low electricity price and high olefin price. The maximum sales are ¥ 422 MM/a at the F value of 80% since the contribution of olefin sales plays the dominant role.
Therefore, the benefit of the biomass-olefin system may be different, even though the thermodynamic exergy efficiency is the same. Besides, the strategy of power self-sufficiency may not be advantageous for bio-olefin system. To achieve thermoeconomic optimization, a balance between exergy efficiency and economic profit should be studied.

3.4.2. Effect of Moisture Content in Biomass Feedstock

As discussed above, the major exergy irreversibility occurs in the units of gasifier and combustor. However, in a steady system, the operation condition of gasifier and combustor is usually fixed and their performance improvement is considerably limited. Under this circumstance, it is necessary to explore the improvement possibility from the origin of feedstock. So the effect of its moisture content on system exergy performance is investigated for the fuel case, varying in the range of 12–60 wt%.
Since same amount of dried biomass is supplied to the system, the mass output of light olefin and its exergy rate are same, which is 4.05 t/h and 54 MW, respectively. Exergy loss to the surroundings increases from 18.4 MW to 20.6 MW with the moisture content increase in biomass. The exergy of the generated electricity declines significantly from 18.5 MW to 9.76 MW as the moisture content is 60 wt%. It is due to the rising consumption of heat for moisture removal, rather than for steam generation [43].
The electricity generated is not sufficient for the system usage as the moisture content of biomass feedstock is higher than 40%, which shows the negative electricity exergy values in Figure 7. At the same time, exergy destruction increases with the increase of the moisture content, which results in the decrease of overall exergetic efficiency from 38.4% to 33.1%. Therefore, a feedstock with low moisture content is preferred for the bio-olefin production. Besides, alternative configuration of heat integration may also be a feasible attempt since drying heat could be obtained by heat optimization approach. A future investigation using a thermal pinch analysis is ongoing to identify the minimum targets for the mass recycle alternatives and thermal integration in the biomass-olefin system.

3.4.3. Effect of Biomass Material Type

To address the effect of typical feedstock material on biomass-olefin system performance, three types of waste biomass material, including rice husk, corn stalk and oil palm shell, are also investigated and compared with the results using poplar chips above.
The results of the ultimate analysis and heating values of each feedsctock and the overall exergy analysis for the corresponding fuel gas are shown in Table 7, using 20% moisture content biomass. It should be pointed out that the ultimate analysis of the feedstock is cited from the references, which represents the typical results of each biomass type. It is seen that the carbon content of various feedstocks is in the range of 38.2–53.8%, of which oil palm shell is the highest. According to the analysis of various feedstocks with the Duncan test [26], the CHONS contents indicate significant differences between the studied biomass types, which may have formed the separate homogeneous groups.
The overall exergy analysis for each feedstock type (20% moisture content) is shown in Table 7. Compared with poplar chips, olefin flow rate using rice husk significantly decreased to 2.22 t/h. The ascending order of olefin flow rate is rice husk < corn stalk < poplar chips < oil palm shell, which should be related to the increase of the carbon content in the feedstock and the separate homogeneous group in the corresponding feedstock. The low olefin yield by rice husk enhances the consumption of the utility and biomass. The consuming ratio of feedstock, water and electricity for producing olefin by oil palm shell is relatively low, which is 5.45 t, 12.2 t and 3.26 MWh for one tonne olefin, respectively.
The olefin rate of the system using oil palm shell is as high as 4.78 t/h, together with the highest output exergy of olefin and electricity as 63.7 MW and 4.76 MW respectively. However, the LHV of feedstock is 21.7 MJ/kg, which results in considerable amount of total input exergy as 176 MW. That decreases the increase tendency of exergetic efficiency to 38.9%, as compared with that of 38% using poplar chips (LHV =18.6 MJ/kg). Therefore, a comprehensive study on the input energy of feedstock, together with the carbon content of biomass, would be considered to improve olefin yield and thermodynamic efficiency.

3.5. Carbon Flow of Biomass-Olefin System

The schematic layout of carbon flow of the typical fuel case, using Sankey diagram, is shown in Figure 8, with 20% recycle ratio of synthesis tail gas and 20% moisture content in poplar feedstock. The carbon percentage of the intermediate products, based on biomass feedstock, decreases along with conversion procedure, which is 100%, 65.8%, 30.7% and 26.2% for raw gasification gas, syngas, methanol and light olefins, respectively. The corresponding exergy percentage values are 96.9%, 93.5%, 44.4% and 35.8%%, respectively. It could attribute to the tandem conversion of materials and the increase of entropy generation along with the interconnected biomass-olefin system.
26.2% of carbon atoms from biomass leaves as light olefins. Major carbon loss is due to the flue gas vent, accounting for 62.3% input. This is due to the fact that the majority of tail gas of the system is burned for power generation and eventually vented in the form of CO2.
As discussed in Section 3.3.1, only 12.2% of biomass exergy is lost to the surroundings in the forms of flue gas, ash, air cooling heat, wastewater and non-condensable gas. As ca. 38.3% of biomass exergy transferred in the forms of light olefins and output electricity, it indicates that almost 50% of biomass exergy is destructed in the whole procedure. In other words, although the conversion of biomass to light olefins enhances product energy density, the total exergy efficiency still needs to be improved as compared with a bio-ethanol or FT-oil process [8,35].

4. Summary and Conclusions

Exergy evaluation and comparison for renewable light olefin production system via biomass gasification and methanol synthesis, integrated with a combined cycle, are carried out. Three alternative configurations were designed as base case, power case and fuel case. For the power case, a fraction of raw gasification gas is sent to the combustor to increase electricity generation. While for the fuel case, a fraction of synthesis tail gas is recycled to improve light olefin production. The subsystems of gasification and steam and power generation contribute 39.4–47.2% of exergy destruction ratio for each case, which mainly derives from the destruction of chemical exergy in the gasifier and combustor respectively.
It is found that the power case leads to unfavorable exergy efficiency of 33.1% with the high consumption ratios of biomass, water and electricity as 8.9 t, 21.8 t, 4.05 MWh for one tonne light olefin production. In contrast, the system efficiency increased from 35.8% to 48.1% with the increase of the recycle ratio of synthesis tail gas to 80%, due to the increase in yield of bio-light olefin. However, external electricity must be supplied for system requirements when the recycle ratio is above 40%. According to the crude economic analysis considering various price levels of olefin and electricity, the tendency of system sales continues to increase with the increase in the recycle ratio of synthesis tail gas, except for the scenario with high electricity price and low olefin prices, due to extra expense on the input electricity.
High exergetic efficiency could also be obtained by using the feedstock with low moisture content and high carbon content, due to the decreased heat for drying and the increased light olefin yield. When the moisture content is above 40 wt%, resorting to external electricity is necessary to sustain system usage. Using oil palm shell with the high carbon content (53.8 wt%) resulted in the high system efficiency of 38.9%, which decreased to 31.7% for rice husk (38.2 wt% carbon content). However, the high input exergy of oil palm shell feedstock to the system somehow decelerated the rising tendency, as compared with 38% efficiency using polar chips.

5. Challenges and Future Work

Although the system discussed above is feasible, exergy irreversibility is still serious, even using high carbon contented feedstock such as oil palm shell with 38.9% efficiency. From the detailed exergy analysis of the production system, extra effort should be paid towards the modification of the individual operation units with the highest irreversible destruction rate, such as the gasifier and the combustor, together with the optimization of heat integration. As chemical exergy destruction due to biomass decomposition in the gasifier and fuel gas combustion in the burner is inevitable, advanced strategies are going to be developed to transfer them to the syngas chemical exergy and physical exergy of combustion gas, for example, the adoption of allothermal gasification, multistage gasification, using CO2 as gasification agent, chemical looping gasification and combustion.
Most important of all, exergy analysis carried out in this context was based on the conceptual system, since there was no actual bio-olefin facility operation until now. However, exergy analysis alone cannot provide enough information for decisions on the suitability of a bio-olefin system. Besides, some simplification assumptions were performed, such as using Gibbs free energy minimizing method for gasification. Although equilibrium calculation could somehow predict the trends of gasifier operation and system performance in this conceptual study, there were still considerable derivations from actual results. Thus, the parameters and experimental data from field operation should be examined and adopted in future work to provide more reliable information for bio-olefin production and application.
Besides, the maximization yield of olefins may be achieved using biomass feedstock with high carbon content with high exergy efficiency. However, high quality feedstock usually means high price of the biomass materials. High exergy efficiency does not necessarily mean the optimal economic performance, especially under low olefin price conditions. Therefore, additional investigation focused on economic and environmental aspects is still necessary in future work and should also be considered for the integrated evaluation of biomass-olefin systems.

Author Contributions

Y.L. and M.Y. carried out the literature collection and the manuscript writing; F.T. partially wrote the introduction and conclusion; C.W. and J.L. proofread the paper. All authors have read and agreed to the published version of the manuscript.

Funding

This work was supported by the National Natural Science Foundation of China (No.51776205) and National Key R&D Program of China (No.2019YFB1503905).

Institutional Review Board Statement

Not applicable.

Informed Consent Statement

Not applicable.

Data Availability Statement

Not applicable.

Conflicts of Interest

The authors declare no conflict of interest.

References

  1. Arvidsson, M.; Haro, P.; Morandin, M.; Harvey, S. Comparative thermodynamic analysis of biomass gasification-based light olefin production using methanol or DME as the platform chemical. Chem. Eng. Res. Des. 2016, 115, 182–194. [Google Scholar] [CrossRef]
  2. Zhang, Q.; Hu, S.; Chen, D. A comparison between coal-to-olefins and oil-based ethylene in China: An economic and environmental prospective. J. Clean. Prod. 2017, 165, 1351–1360. [Google Scholar] [CrossRef]
  3. Gogate, M.R. Methanol-to-olefins process technology: Current status and future prospects. Pet. Sci. Technol. 2019, 37, 559–565. [Google Scholar] [CrossRef]
  4. Long, F.; Zhang, X.; Cao, X.; Zhai, Q.; Song, Y.; Wang, F.; Jiang, J.; Xu, J. Mechanism investigation on the formation of olefins and paraffin from the thermochemical catalytic conversion of triglycerides catalyzed by alkali metal catalysts. Fuel Process. Technol. 2019, 200, 106312. [Google Scholar] [CrossRef]
  5. Kikuchi, Y.; Oshita, Y.; Mayumi, K.; Hirao, M. Greenhouse gas emissions and socioeconomic effects of biomass-derived products based on structural path and life cycle analyses: A case study of polyethylene and polypropylene in Japan. J. Clean. Prod. 2017, 167, 289–305. [Google Scholar] [CrossRef]
  6. Jiang, P.; Parvez, A.M.; Meng, Y.; Xu, M.-X.; Shui, T.-C.; Sun, C.-G.; Wu, T. Exergetic, economic and carbon emission studies of bio-olefin production via indirect steam gasification process. Energy 2019, 187, 115933. [Google Scholar] [CrossRef] [Green Version]
  7. Wang, Z.; He, T.; Li, J.; Wu, J.; Qin, J.; Liu, G.; Han, D.; Zi, Z.; Li, Z.; Wu, J. Design and operation of a pilot plant for biomass to liquid fuels by integrating gasification, DME synthesis and DME to gasoline. Fuel 2016, 186, 587–596. [Google Scholar] [CrossRef]
  8. Gautam, P.; Neha; Upadhyay, S.; Dubey, S. Bio-methanol as a renewable fuel from waste biomass: Current trends and future perspective. Fuel 2020, 273, 117783. [Google Scholar] [CrossRef]
  9. Jiang, P.; Parvez, A.M.; Meng, Y.; Dong, X.; Xu, M.; Luo, X.; Shi, K.; Wu, T. Novel two-stage fluidized bed-plasma gasification integrated with SOFC and chemical looping combustion for the high efficiency power generation from MSW: A thermodynamic investigation. Energy Convers. Manag. 2021, 236, 114066. [Google Scholar] [CrossRef]
  10. Baliban, R.C.; Elia, J.A.; Weekman, V.; Floudas, C.A. Process synthesis of hybrid coal, biomass, and natural gas to liquids via Fischer–Tropsch synthesis, ZSM-5 catalytic conversion, methanol synthesis, methanol-to-gasoline, and methanol-to-olefins/distillate technologies. Comput. Chem. Eng. 2012, 47, 29–56. [Google Scholar] [CrossRef]
  11. Zhang, Y.; Ke, C.; Fu, W.; Cui, Y.; Rehan, M.A.; Li, B. Simulation of microwave-assisted gasification of biomass: A review. Renew. Energy 2020, 154, 488–496. [Google Scholar] [CrossRef]
  12. Liptow, C.; Tillman, A.-M.; Janssen, M. Life cycle assessment of biomass-based ethylene production in Sweden—is gasification or fermentation the environmentally preferable route? Int. J. Life Cycle Assess. 2015, 20, 632–644. [Google Scholar] [CrossRef] [Green Version]
  13. Yang, M.; Tian, X.; You, F. Manufacturing Ethylene from Wet Shale Gas and Biomass: Comparative Technoeconomic Analysis and Environmental Life Cycle Assessment. Ind. Eng. Chem. Res. 2018, 57, 5980–5998. [Google Scholar] [CrossRef]
  14. Haydary, J.; Šuhaj, P.; Husár, J. Waste biomass to methanol–optimisation of gasification agent to feed ratio. Biomass. Convers. Bior. 2020, 11, 419–428. [Google Scholar] [CrossRef]
  15. Zhou, H.; Qian, Y.; Yang, S. Energetic/economic penalty of CO2 emissions and application to coal-to-olefins projects in China. Appl. Energy 2015, 156, 344–353. [Google Scholar] [CrossRef]
  16. Hannula, I.; Arpiainen, V. Light olefins and transport fuels from biomass residues via synthetic methanol: Performance and cost analysis. Biomass Convers. Bior. 2015, 5, 63–74. [Google Scholar] [CrossRef]
  17. Kumar, R. A critical review on energy, exergy, exergoeconomic and economic (4-E) analysis of thermal power plants. Eng. Sci. Technol. 2017, 20, 283–292. [Google Scholar] [CrossRef] [Green Version]
  18. Reyes, L.; Abdelouahed, L.; Campusano, B.; Buvat, J.-C.; Taouk, B. Exergetic study of beech wood gasification in fluidized bed reactor using CO2 or steam as gasification agents. Fuel Process. Technol. 2020, 213, 106664. [Google Scholar] [CrossRef]
  19. Kusumaningtyas, R.D.; Purwono, S.; Rochmadi, N.; Budiman, A. Graphical exergy analysis of reactive distillation column for biodiesel production. Int. J. Exergy 2014, 15, 447–467. [Google Scholar] [CrossRef]
  20. Navas-Anguita, Z.; Cruz, P.L.; Gamboa, M.M.; Iribarren, D.; Dufour, J. Simulation and life cycle assessment of synthetic fuels produced via biogas dry reforming and Fischer-Tropsch synthesis. Fuel 2019, 235, 1492–1500. [Google Scholar] [CrossRef]
  21. Cruz, P.L.; Iribarren, D.; Dufour, J. Exergy analysis of alternative configurations of a system coproducing synthetic fuels and electricity via biomass gasification, Fischer-Tropsch synthesis and a combined-cycle scheme. Fuel 2017, 194, 375–394. [Google Scholar] [CrossRef]
  22. Onel, O.; Niziolek, A.M.; Elia, J.A.; Baliban, R.C.; Floudas, C.A. Biomass and Natural Gas to Liquid Transportation Fuels and Olefins (BGTL+C2_C4): Process Synthesis and Global Optimization. Ind. Eng. Chem. Res. 2015, 54, 359–385. [Google Scholar] [CrossRef]
  23. Xiang, Y.; Zhou, J.; Lin, B.; Xue, X.; Tian, X.; Luo, Z. Exergetic evaluation of renewable light olefins production from biomass via synthetic methanol. Appl. Energy 2015, 157, 499–507. [Google Scholar] [CrossRef]
  24. Yang, S.-Y.; Li, B.-X.; Zheng, J.-W.; Yang, Y.-C.; Gao, X.-H. Performances and net CO2 emission of light olefin production based on biomass-to-methanol and DMTO-II technologies with CO2 capture and sequestration. ACS Sustain. Chem. Eng. 2021, 9, 14670–14677. [Google Scholar] [CrossRef]
  25. Roman, K.; Barwicki, J.; Rzodkiewicz, W.; Dawidowski, M. Evaluation of Mechanical and Energetic Properties of the Forest Residues Shredded Chips during Briquetting Process. Energies 2021, 14, 3270. [Google Scholar] [CrossRef]
  26. Nurek, T.; Gendek, A.; Roman, K. Forest residues as a renewable source of energy: Elemental composition and physical properties. BioResources 2019, 14, 6–20. [Google Scholar] [CrossRef]
  27. Habibollahzade, A.; Ahmadi, P.; Rosen, M.A. Biomass gasification using various gasification agents: Optimum feedstock selection, detailed numerical analyses and tri-objective grey wolf optimization. J. Clean. Prod. 2021, 284, 24718. [Google Scholar] [CrossRef]
  28. Li, Y.; Li, Y.; Zhang, X.; Wang, C.; Li, X.; Ma, L. Exergy analysis of renewable light olefin production system via biomass gasification and methanol synthesis. Int. J. Hydrog. Energy 2021, 46, 3669–3683. [Google Scholar] [CrossRef]
  29. Jones, S.; Meyer, P.; Snowden-Swan, L.; Padmaperuma, A.; Tan, E.; Dutta, A.; Jacobson, J.; Cafferty, K. Process Design and Economics for the Conversion of Lignocellulosic Biomass to Hydrocarbon Fuels: Fast Pyrolysis and Hydrotreating Bio-Oil Pathway. In Pacific Northwest National Laboratory; U.S. Department of Energy: Washington, DC, USA, 2013. [Google Scholar]
  30. Wincy, W.B.; Edwin, M.; Sekhar, S.J. Energy and exergy evaluation of rice processing mills working with biomass gasifier in parboiling process. Fuel 2020, 259, 16255. [Google Scholar] [CrossRef]
  31. Rashidi, H.; Khorshidi, J. Exergy analysis and multiobjective optimization of a biomass gasification based multigeneration system. Int. J. Hydrog. Energy 2018, 43, 2631–2644. [Google Scholar] [CrossRef]
  32. Nakyai, T.; Authayanun, S.; Patcharavorachot, Y.; Arpornwichanop, A.; Assabumrungrat, S.; Saebea, D. Exergoeconomics of hydrogen production from biomass air-steam gasification with methane co-feeding. Energy Convers. Manag. 2017, 140, 228–239. [Google Scholar] [CrossRef]
  33. Parvez, A.; Mujtaba, I.; Wu, T. Energy, exergy and environmental analyses of conventional, steam and CO2-enhanced rice straw gasification. Energy 2016, 94, 579–588. [Google Scholar] [CrossRef] [Green Version]
  34. Huang, Z.; He, F.; Zhu, H.; Chen, D.; Zhao, K.; Wei, G.; Feng, Y.; Zheng, A.; Zhao, Z.; Li, H. Thermodynamic analysis and thermogravimetric investigation on chemical looping gasification of biomass char under different atmospheres with Fe2O3 oxygen carrier. Appl. Energy 2015, 157, 546–553. [Google Scholar] [CrossRef]
  35. Rafati, M.; Wang, L.; Dayton, D.; Schimmel, K.; Kabadi, V.; Shahbazi, A. Techno-economic analysis of production of Fischer-Tropsch liquids via biomass gasification: The effects of Fischer-Tropsch catalysts and natural gas co-feeding. Energy Convers. Manag. 2017, 133, 153–166. [Google Scholar] [CrossRef] [Green Version]
  36. Parvez, A.M.; Afzal, M.T.; Jiang, P.; Wu, T. Microwave-assisted biomass pyrolysis polygeneration process using a scaled-up reactor: Product characterization, thermodynamic assessment and bio-hydrogen production. Biomass Bioenergy 2020, 139, 105651. [Google Scholar] [CrossRef]
  37. Xiang, D.; Xiang, J.; Liu, S.; Sun, Z.; Jiang, Y.; Dong, Z.; Tao, Q.; Cao, Y. A chemical looping scheme of co-feeding of coke-oven gas and pulverized coke toward polygeneration of olefins and ammonia. Chem. Eng. J. 2018, 334, 1754–1765. [Google Scholar] [CrossRef]
  38. Zhao, Z.; Situmorang, Y.A.; An, P.; Yang, J.; Hao, X.; Rizkiana, J.; Abudula, A.; Guan, G. A biomass-based small-scale power generation system with energy/exergy recuperation. Energy Convers. Manag. 2021, 227, 113623. [Google Scholar] [CrossRef]
  39. Dimian, A.C.; Bildea, C.S. Energy efficient methanol-to-olefins process. Chem. Eng. Res. Des. 2018, 131, 41–54. [Google Scholar] [CrossRef]
  40. Karamarkovic, R.; Karamarkovic, V. Energy and exergy analysis of biomass gasification at different temperatures. Energy 2010, 35, 537–549. [Google Scholar] [CrossRef]
  41. Zueco, J.; López-Asensio, D.; Fernández, F.; López-González, L.M. Exergy analysis of a steam-turbine power plant using thermocombustion. Appl. Therm. Eng. 2020, 180, 115812. [Google Scholar] [CrossRef]
  42. Eboh, F.C.; Ahlström, P.; Richards, T. Exergy Analysis of Solid Fuel-Fired Heat and Power Plants: A Review. Energies 2017, 10, 165. [Google Scholar] [CrossRef] [Green Version]
  43. Motta, I.L.; Miranda, N.T.; Filho, R.M.; Maciel, M.R.W. Biomass gasification in fluidized beds: A review of biomass moisture content and operating pressure effects. Renew. Sustain. Energy Rev. 2018, 94, 998–1023. [Google Scholar] [CrossRef]
  44. Yang, W.; Zhu, Y.; Cheng, W.; Sang, H.; Yang, H.; Chen, H. Characteristics of Particulate Matter Emitted from Agricultural Biomass Combustion. Energy Fuels 2017, 31, 7493–7501. [Google Scholar] [CrossRef]
  45. Cohce, M.; Dincer, I.; Rosen, M. Energy and exergy analyses of a biomass-based hydrogen production system. Bioresour. Technol. 2011, 102, 8466–8474. [Google Scholar] [CrossRef] [PubMed]
Figure 1. Schematic flow diagram of the proposed biomass-olefin system with a combined-cycle (Base case: solid arrows; Power case: dotted arrows; Fuel case: dashed arrows).
Energies 15 00404 g001
Figure 2. Exergy rates and exergetic efficiencies at the system level for each case.
Energies 15 00404 g002
Figure 3. Exergetic loss/destruction rate at the subsystem level for each case.
Energies 15 00404 g003
Figure 4. Exergetic efficiency of the main units for each case.
Energies 15 00404 g004
Figure 5. Exergy analysis at the system level with different recycle ratio of synthesis tail gas.
Energies 15 00404 g005
Figure 6. Relationship between the recycle ratio of synthesis tail gas and annual system sales.
Energies 15 00404 g006
Figure 7. Effect of moisture content of feedstock on overall exergy performance for the fuel case.
Energies 15 00404 g007
Figure 8. Schematic layout of system d carbon flow. (%, based on biomass exergy).
Energies 15 00404 g008
Table 1. Proximate and ultimate analysis of biomass feedstock.
Moisture
(wt%)
Proximate Analysis
(wt%, Dried)
Ultimate Analysis
(wt%, Dried)
LHV
(MJ/kg)
20AshVolatile matterFixed carbonCHONS18.6
0.983.815.350.96.0441.90.170.09
Table 2. The major operating parameters and model assumption of biomass-olefin system.
Key UnitsAspen Plus ModuelsInput Conditions
DryerRStoic + Flash2Moisture content of dried biomass = 12 wt%/Pressure = 0.11 MPa
GasifierRYield + RGibbsT = 825 °C/P = 0.16 MPa
CompressorMComprP (out) = 0.3/1.0/2.0/4.0 MPa
S removerSep + RStoicLO-CAT: T = 43 °C/P = 2.0 MPa
ZnO absorber: T = 375 °C/P = 2.0 MPa
WGS reactorREquilT = 350 °C/P = 2.0 MPa
PSA unitSep80% of CO2 removal efficiency
Methanol reactorREquilT = 240 °C/P = 4.0 MPa/Reactions: CO +2H2 = CH3OH, CO2 +3H2 = CH3OH + H2O, CO +3H2 =CH4 +H2O
Olefin reactorRStoicT = 400 °C/P = 0.4 MPa/Olefin yields are calculated by UOP/Hydro MTO results [1]
Alkali absorberRadfracNumber of stages = 10/Reflux ratio =2.0
CombustorRStoicAdiabatic reactor/20% excess air
Steam turbineComprInlet pressure of each stage = 5.8/2.0/0.4 MPa/0.85 of isentropic efficiency
Cooling water treatmentHeater + MHeatX + Pump + MixerCooling water supply temperature = 28 °C/gas stream temperature after air cooler and water cooler = 60 °C, 43 °C
Gas splittersFSplitSplit ratio for raw gasification gas combustion = 20% (power case)/Split ratio for synthesis tail gas recycle = 20% (fuel case)
Table 3. Verification of gasification gas composition.
ComponentComposition (mol%)
Steam Gasification aChemical Looping Gasification b
Present ModelData by Parvez [33]Present ModelData by Huang [34]
H20.540.540.400.39
CO0.360.360.230.22
CO20.030.030.090.09
CH40.0020.0020.0010.001
a Feedstock moisture: 8.9 wt%; Feedstock ultimate analysis: C/H/O/N/S = 45.1/6.2/32/3.1/0.6, wt%; Temperature: 900 °C; S/B = 0.3. b Feedstock ultimate analysis: C/H/O/N/S = 86.3/2.27/6.23/0.14/0.01, wt%; Temperature: 1000 °C; Oxygen carrier/Feedstock = 1.5 (mass ratio); Steam/Feedstock = 2 (molar ratio).
Table 4. Overall mass balance of designed biomass-olefin system with a combined-cycle.
Base CasePower CaseFuel Case
Input
Biomass (t/h, moisture: 20 wt%)32.632.632.6
Air to cooling tower (t/h)206324641864
Air for reactions (t/h)97.911389.7
Makeup water (t/h)54.663.750
Alkali solution (t/h)6.665.337.51
O2-rich air3.653.653.65
Output
Solid waste (t/h)0.260.260.26
Flue gas (t/h)132149123
Evaporation air from cooling tower (t/h)211025201906
Waste water (t/h)12.610.114.1
Light olefins (t/h)3.662.934.05
Net power output (MW)5.8311.63.79
Power generated (MW)19.623.517.8
Consumption ratio
Biomass (t/t olefins)7.128.96.42
Water (t/t olefins)14.921.812.3
Electricity (MWh/t olefins)3.784.053.45
Table 5. Exergy balance at the subsystem level.
Base CasePower CaseFuel Case
SubsystemExFExPExLyD,jExFExPExLyD,jExFExPExLyD,j
(MW)(%)(MW)(%)(MW)(%)
Gasification1761472.8217.21801492.9718.21761472.7316.9
Gas composition adjustment1591484.064.261271193.253.41731624.094.36
Methanol synthesis1281270.660.531021010.520.421421400.720.55
Olefin synthesis61.248.98.282.6248.939.16.622.0967.954.29.222.91
Steam & power generation86.1470.962510054.91.0429.179.544.30.9122.5
Cooling water treatment6.060.60.753.097.180.710.733.755.490.540.762.75
Table 6. Exergy balance at the level for each case. (MW).
Base CasePower CaseFuel Case
ExFExPExDExFExPExDExFExPExD
Dryer5.423.681.746.783.892.894.953.561.38
Gasifier18215922.818315923.418215922.8
Fuel gas cooler9.98.51.47.926.81.129.98.51.4
1st Compressor8.225.093.136.584.072.58.225.093.13
LO-CAT unit0.170.090.080.140.070.060.170.090.08
WGS reactor1551531.791241221.431551531.79
2st Compressor1.841.240.61.470.990.482.041.270.78
Air cooler2.480.941.541.990.751.232.651.011.64
Water cooler0.280.180.10.230.150.080.30.20.11
Syngas preheater0.990.680.310.790.540.251.110.770.35
Methanol reactor128127.50.511021020.411421410.46
Methanol preheater1.690.790.91.350.630.721.870.871
Olefin reactor61.158.62.5248.946.92.0167.8652.79
Alkali solution absorber56.553.53.0745.242.762.4562.759.33.44
Light olefin separator53.548.74.842.8393.8159.3545.27
Combustor8260.821.195.771.524.275.355.919.4
Economizer14.411.23.1917.813.14.7712.710.22.51
Evaporator24.724.40.2528.828.50.2922.522.30.23
Superheater9.324.894.4210.95.715.168.514.474.04
Turbine23.319.63.6427.823.54.382117.83.28
Condenser7.952.915.049.653.536.127.142.614.52
Cooling tower6.152.363.797.242.664.585.592.213.37
Table 7. Effect of feedstock type on overall exergy performance of biomass-olefin system.
Rice Husk [44]Cotton Stalk [44]Poplar Chips
[29]
Oil Palm
Shell [45]
Ultimate analysis (wt %, ar)
C38.245.750.953.8
H3.155.436.047.2
N0.891.10.170
S0.190.240.090.51
O41.444.841.936.3
Ash16.22.740.922.21
LHV (MJ/kg)11.71618.621.7
Olefin flow rate (t/h)2.223.344.054.78
Consumption ratio
Biomass (t/t olefins)11.77.86.425.45
Water (t/t olefins)13.712.512.312.2
Electricity(MWh/t olefins)4.213.723.453.26
ExF (MW)97.9133152176
Exelec (MW)1.393.053.794.76
Exole (MW)29.644.55463.7
ExL (MW)20.717.618.421.1
ExD (MW)46.267.876.286.2
ηEx,j (%)31.735.83838.9
Publisher’s Note: MDPI stays neutral with regard to jurisdictional claims in published maps and institutional affiliations.

