Article

Characterization of Supraharmonic Emission from Three Different Electric Vehicle Charging Infrastructures in Time and Frequency Domain

1
Institute of Power Transmission and High Voltage Technology, 70569 Stuttgart, Germany
2
BSS Hochspannungstechnik, 70569 Stuttgart, Germany
*
Author to whom correspondence should be addressed.
Energies 2022, 15(2), 394; https://doi.org/10.3390/en15020394
Submission received: 3 November 2021 / Revised: 14 December 2021 / Accepted: 21 December 2021 / Published: 6 January 2022
(This article belongs to the Topic Power Distribution Systems)

Abstract

:
With the recent proliferation of electric vehicles (EVs), maintaining power quality within acceptable limits in future distribution grids will become a challenging task. A specific concern is the spread of Supraharmonics in the range from 2 to 150 kHz, generated by modern power electronic devices. In this paper, the long term Supraharmonic distortion from three differently sized electric vehicle charging infrastructures is analyzed in frequency and time domain. At the monitored sites several interruptions of EV charging processes were observed due to poor power quality. It was found that vehicles disconnect when exposed to high levels of harmonic distortion. Moreover, the impact of the charging EVs on the Supraharmonic distortion and the interaction with the background distortion for the individual sites is discussed. Results show that a general increase in Supraharmonics emission can be expected due to the rising number of EVs. However, measurements also indicate that damping effects can occur for certain load configurations.

1. Introduction

The successful integration of electric vehicles (EVs) is a challenging task to implement the shift towards a more sustainable transport sector. Although the German government has failed to achieve the goal of reaching one million EVs by 2020, the number of newly registered EV’s roughly tripled in 2020 compared to 2019 [1]. This development can be observed in several countries, indicating a global trend and imposing new challenges for distribution grid operators. With the proliferation of EVs, the number of power electronic loads connected to the grids, utilizing active switching techniques is continuously growing. It is expected that this development will have several consequences with adverse effects on the power quality. This is one of the key aspects concluded by the CIGRE JWG 4.24 [2] (“PQ and EMC Issues with future electricity networks”), stating that the ongoing proliferation of power electronic devices will have a significant impact on the design and operation of future power systems.
In EVs, power electronic rectifiers are utilized to provide a DC current for batteries. These devices have made significant technological advancements in the last few decades. The initial switching components, such as diodes and thyristors, have been replaced by faster active switching elements (i.e., transistors) with higher energy efficiency, allowing the design of devices with reduced weight and size. As a consequence, the generated harmonic emissions from power electronic equipment have shifted towards higher frequencies in the range from 2–150 kHz, also referred to as Supraharmonics [3]. This has raised concerns among the research and standardization community, since the number of devices emitting in this frequency range is growing fast. At the same time, these devices are becoming more susceptible toward EMC interference [4,5]. Moreover, a lack of normative limits and measurement procedures in the Supraharmonic frequency range has accelerated this trend [5]. However, recently, new recommended compatibility levels have been released [6]. Extensive research regarding new procedures for measurement methods for Supraharmonics has been published in recent years [7,8,9,10,11,12,13,14,15]. Different measurement approaches, currently not considered by standards, are compared in [8,12]. It is also important to consider that the measurement setup itself can affect the results [14]. However, there is still a lack of long-term measurement datasets, describing the distortion behavior in the field.
Unintended Supraharmonic distortion is primarily emitted by the switching action of modern power electronic devices. Typical Supraharmonic sources include rectifiers, switched-mode power supplies, modern lightning equipment, industrial machines, and household equipment [16]. Consequently, EVs are considered a Supraharmonics source as well. This has been concluded from a study by [17], where several EV models were analyzed in respect to their harmonic emission. In [18], the Supraharmonic distortion of EVs in respect to different charging methods is discussed. The emission behavior of Supraharmonics has different properties compared to lower order harmonics below 2 kHz (LFH). For LFH, the distortion is mostly generated for integer multiples of the power system frequency. Depending on the frequency characteristics of the grid impedance, LFH tend to flow into the grid. For multiple LFH sources, the total harmonic emission generally is less than the sum of the emission from each of the connected sources [4]. This effect is caused by the summation of harmonics with different phase angles. Supraharmonics on the other hand have different propagation characteristics. They tend to rather flow into neighboring equipment than into the grid [4]. The reason for this behavior is the low impedance paths for higher frequency harmonics, created by the grid side filters of the connected loads. It is shown in [16,18] that the Supraharmonic distortion and interaction of power electronic devices are highly affected by the number and configuration of connected devices and the grid impedance. This is presented in detail by the authors of [18], presenting the Supraharmonics emission characteristics for different load configurations. Hence, the emission behavior of Supraharmonic sources is not necessarily reproducible due to harmonic interaction effects as well as primary and secondary emission. The primary harmonic emission refers to the part of harmonic current at the device terminal by the device, whereas secondary emission is part of the harmonic current driven by sources outside of the device [17]. The term interaction was proposed in [19] to describe the various non-linear phenomena that affect the Supraharmonic emission, such as distorted supply voltage, grid impedance, and background distortion voltage. The different effects and properties of Supraharmonic interaction are discussed in more detail in [20,21,22].
There are several adverse effects on power electronic equipment linked to high levels of Supraharmonic distortion. Reported cases of malfunctioning devices are presented in [15,23]. In [24,25], the relationship between Supraharmonic emission and acoustic noise of equipment is described. The authors of [26,27] show the lifetime reduction and increased power losses due to Supraharmonic distortion. Different sources of unintentional Supraharmonic emission have been studied extensively. The properties of high frequency distortion generated by inverters and specifically the impact of distributed generators can be found in [28,29,30,31,32,33]. Other major sources are modern lighting technologies, such as compact fluorescent lamps (CFLs) and light emitting diodes (LEDs), discussed in [28,34,35]. The emission from various types of household equipment and its influence of the grid impedance are presented in [36,37,38]. However, apart from the unintentional Supraharmonic distortion, there is also intentional emission from mains communication systems (MCS), such as power line communication (PLC). For the digitalization of low voltage distribution grids smart meters utilizing PLC, where the power system serves as the communication system (i.e., remote meter reading), play an important role in many countries. Different problems have been identified with low signal noise ratio (SNR) due to Supraharmonic emission, where the transmitted signal does not reach the receiver. High attenuation at certain communication frequencies or interference with other equipment can disturb the transmission [39]. Research regarding the interaction of Supraharmonics emission with the PLC technology, describing the individual interference mechanisms, can be found in [39,40,41,42,43]. The adverse effects of Supraharmonics are not limited to the low voltage networks. The authors of [44] address the effect of lifetime reduction of MV cables due to high levels of Supraharmonics.
Considering the accelerated proliferation of EVs, disturbances and interference within grids with a high penetration of charging infrastructure is becoming more likely in the future. Since the number of EVs still remains low in many countries, there is limited experience with emission behavior in distribution grids. A majority of the published work on Supraharmonics has investigated the emission under laboratory conditions. In a controlled laboratory environment, the characterization of Supraharmonics is generally carried out in time and frequency domain. The frequency domain characterization of Supraharmonics utilizes the properties of Fourier transformation. The time-domain characterization requires a high pass filter, removing the low frequency components below 2 kHz of the measured signal. The characterization of Supraharmonics in both domains over longer time periods has not been adapted in the field yet. Moreover, monitoring Supraharmonics over longer durations in the field is rarely carried out. It requires costly equipment and the efficient processing and analysis of the extensive datasets generated by the meters is a challenging task. However, the large number of influencing factors on the Supraharmonic distortion in-field, such as varying grid impedance and dependency on the load behavior, can only be considered with adequate measurement data sizes.
Simple rectifier circuits, such as two-pulse diode rectifiers, do not have integrated means for adjusting the power factor. This results in inefficient loads generating high levels of low order odd harmonics (9 to 15) [45]. In order to increase the efficiency during the charging process and reduce the emission of lower order harmonics (below 2 kHz), EVs utilize active power factor correction (APFC) [16]. With APFC, pulse width modulated (PWM) switching patterns align the phase angle between supply voltage and current of a non-linear load, with a nearly sinusoidal input current. This reduces low frequency harmonics and maximizes the displacement factor (≈1.0) and hence the active power drawn by the load. This subsequently increases the efficiency of the circuit. The switching patterns of the APFC are generated independently from the power system frequency and Supraharmonic emission from other switching units, such as DC/AC or DC/DC converters within the load [46]. The emission generated from equipment utilizing APFC are rarely constant but changes depending on the variations in input voltage, temperature, or loading [36]. However, not only does the emission from the APFC varies over time; depending on the vehicle type, various influencing factors have been identified according to [18,47,48], such as the rectifier topology, battery state of charge, and charge current limitation. Moreover, the varying grid impedance, the extent of LFH present in the grid, unbalance, and fundamental voltage magnitude affects the emitted Supraharmonics as well.
The proliferation of EVs will increase the emission in the Supraharmonic range [49]. Due to the various interaction phenomena and large number of different influences affecting the secondary and primary emission, possible interaction between EVs should be investigated. Considering the complexity of assessing the effects caused by Supraharmonics, interference and equipment damage is possible despite equipment complying with the tests according to the product standard [4]. In this paper, the results of a long-term monitoring campaign of three different electric vehicle charging infrastructures are presented. The objective is to outline how the increasing numbers of EVs correlates with the Supraharmonic distortion levels in distribution grids and present the observer interaction effects. Different influences on statistical frequency domain properties of Supraharmonics are discussed. In addition, a high pass filter with an event detection was implemented on the installed measurement devices, allowing a characterization of the time-domain properties of the Supraharmonic distortion.

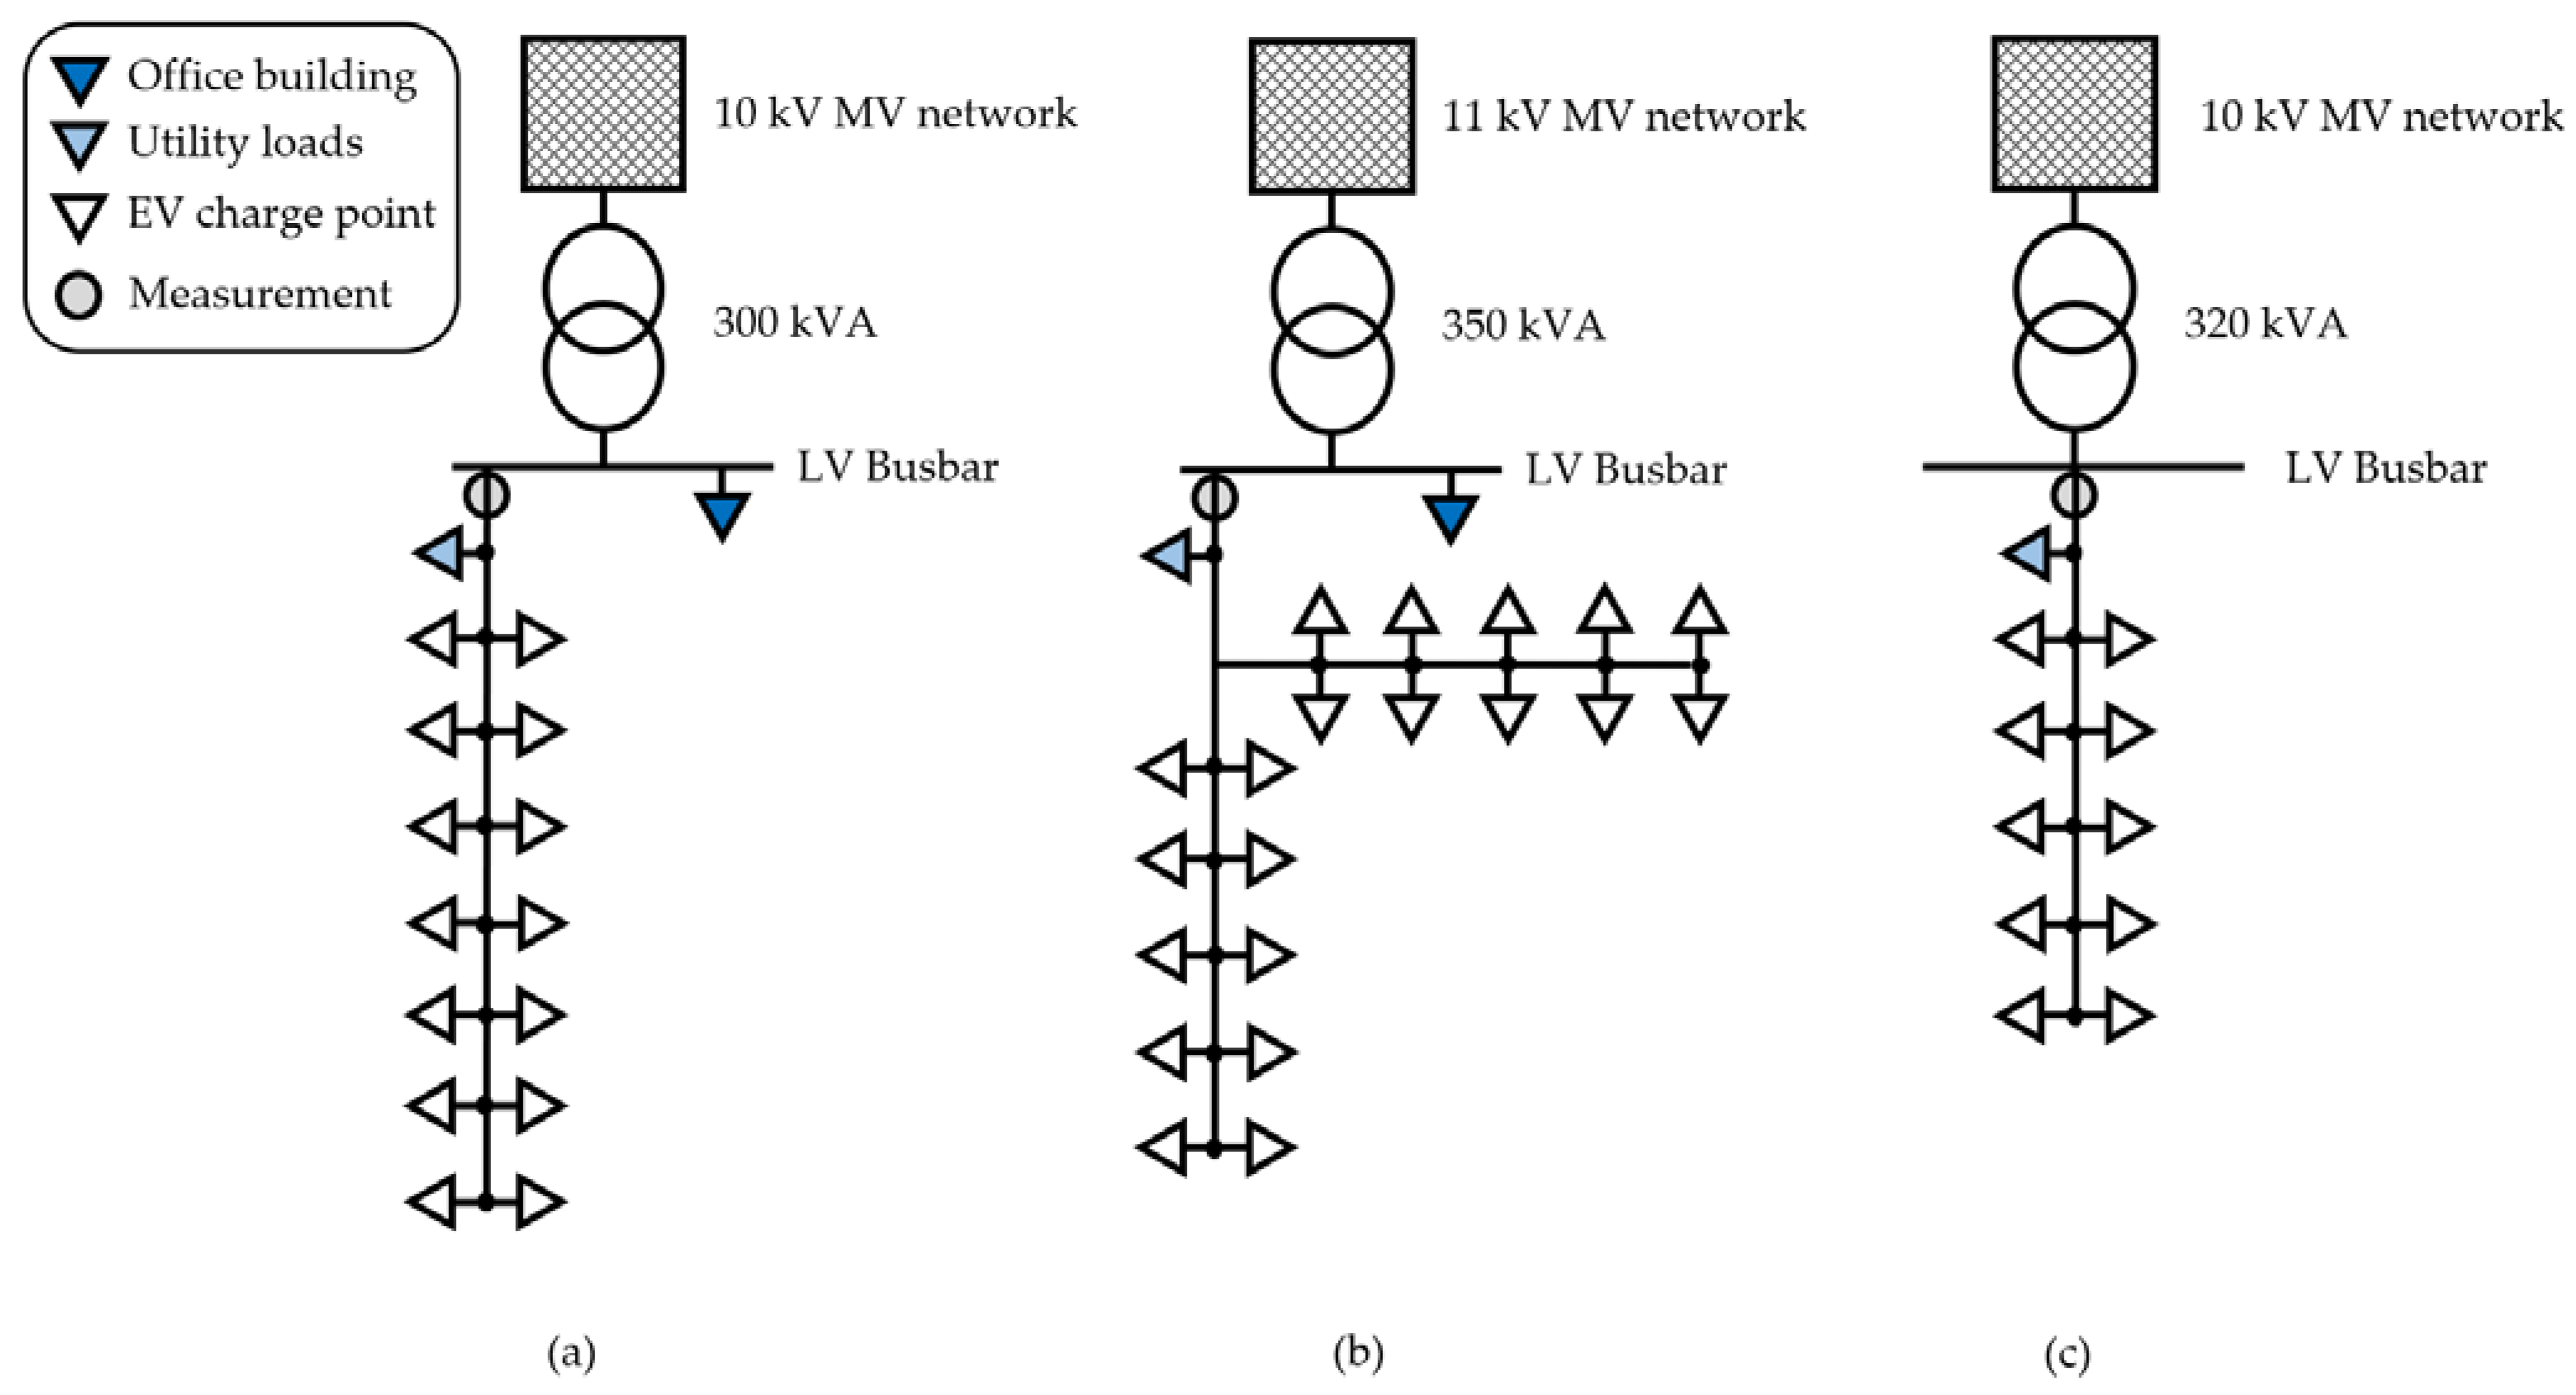
2. Monitoring System and Sites

The data basis for this investigation consists of measurements recorded at three different parking garages with charging infrastructure with measurement periods ranging from 6 to 12 months. The individual sites will be referred to as site A, B, and C. At each site charge, wall boxes were installed, allowing for single, two, and three phase AC charging (type 2). The number of charging points varied between the sites. At site A, 14 charging points were available, for site B, 20 charging points were available and for site C, 10 charging points were available. Sites A and C were parking garages owned by companies to allow employee parking while site B provided public parking. Each of the monitored sites were located in urban areas. At site A, the EVs from primarily a single model were connected, while the vehicle models varied for the other two sites. An overview over the sites network topologies is schematically illustrated in Figure 1. The corresponding site characteristics are summarized in Table 1. Utility loads refer to smaller power electronic devices (such as lightning installations, monitors, and PCs). Over the course of the monitoring duration, several complaints related to the EV charging process were issued by the users. The complaints included audible noise from charging vehicles and unintended interruptions of charging processes. Examples of the latter case will be presented in the following chapter.
Measurements were recorded with a sample rate of 1 MS/s. Harmonics were calculated processing each 10-period voltage and current waveform in accordance to IEC 61000-4-7 [50] and IEC 61000-4-30 [51]. For each phase, including the neutral conductor, voltage and current was measured. The currents were measured by utilizing high precision Rogowski coils with a bandwidth up to 1 MHz. The three analyzed datasets contained the standard power quality measurements and the Supraharmonics in frequency and time domain. The standard power quality measurements refer to the parameters required for determining normative compliance according to EN5160 [52] (root mean square (RMS) voltage, LFH, frequency, THDU etc.). The RMS means, maximum values and 95th percentiles of the Supraharmonic currents, and voltage were continuously recorded with a time aggregation of 1 s. The frequency aggregation in the range from 2 to 150 kHz was set to 200 Hz bands, resulting in 740 harmonic amplitudes.

3. Results

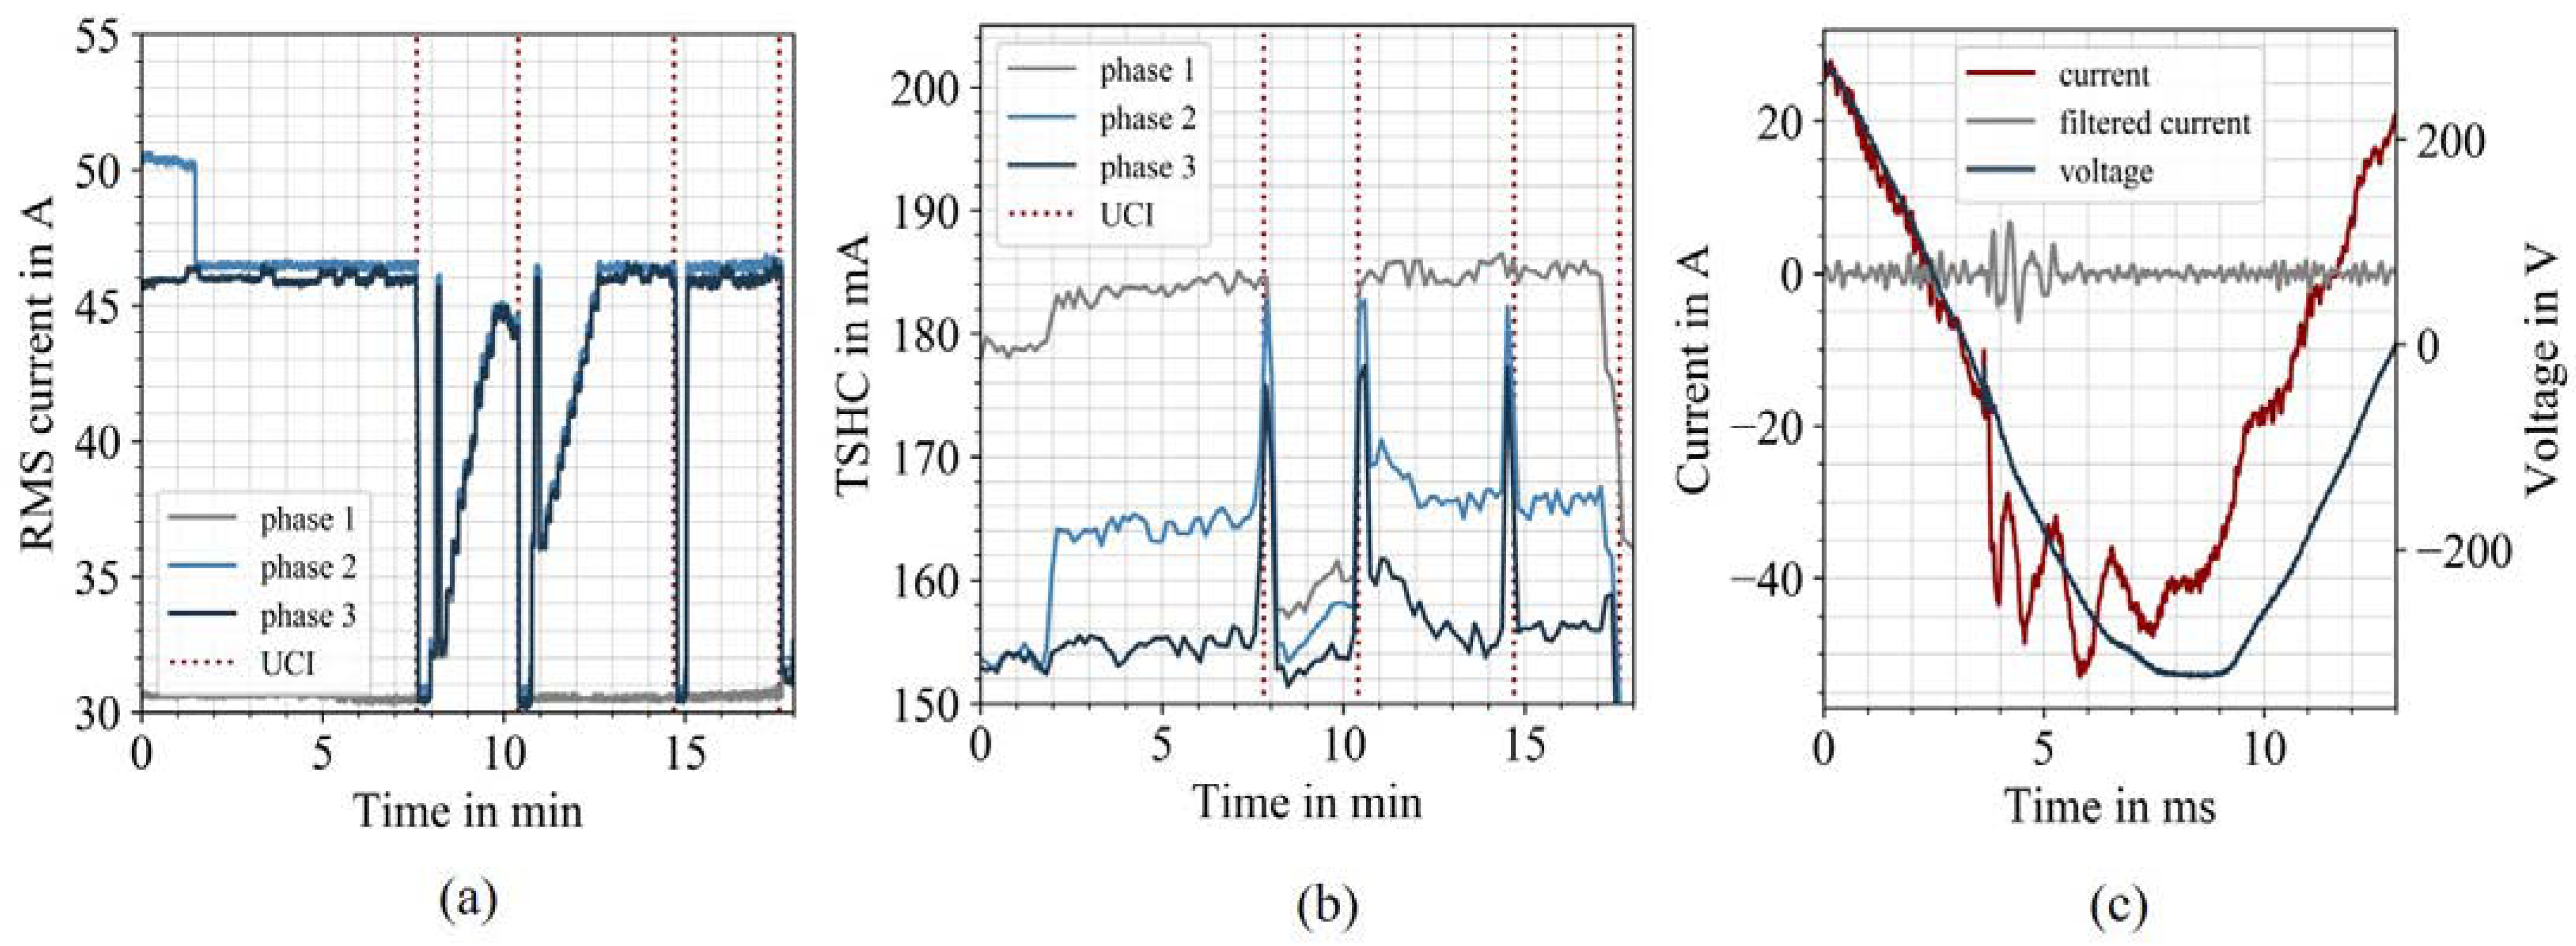
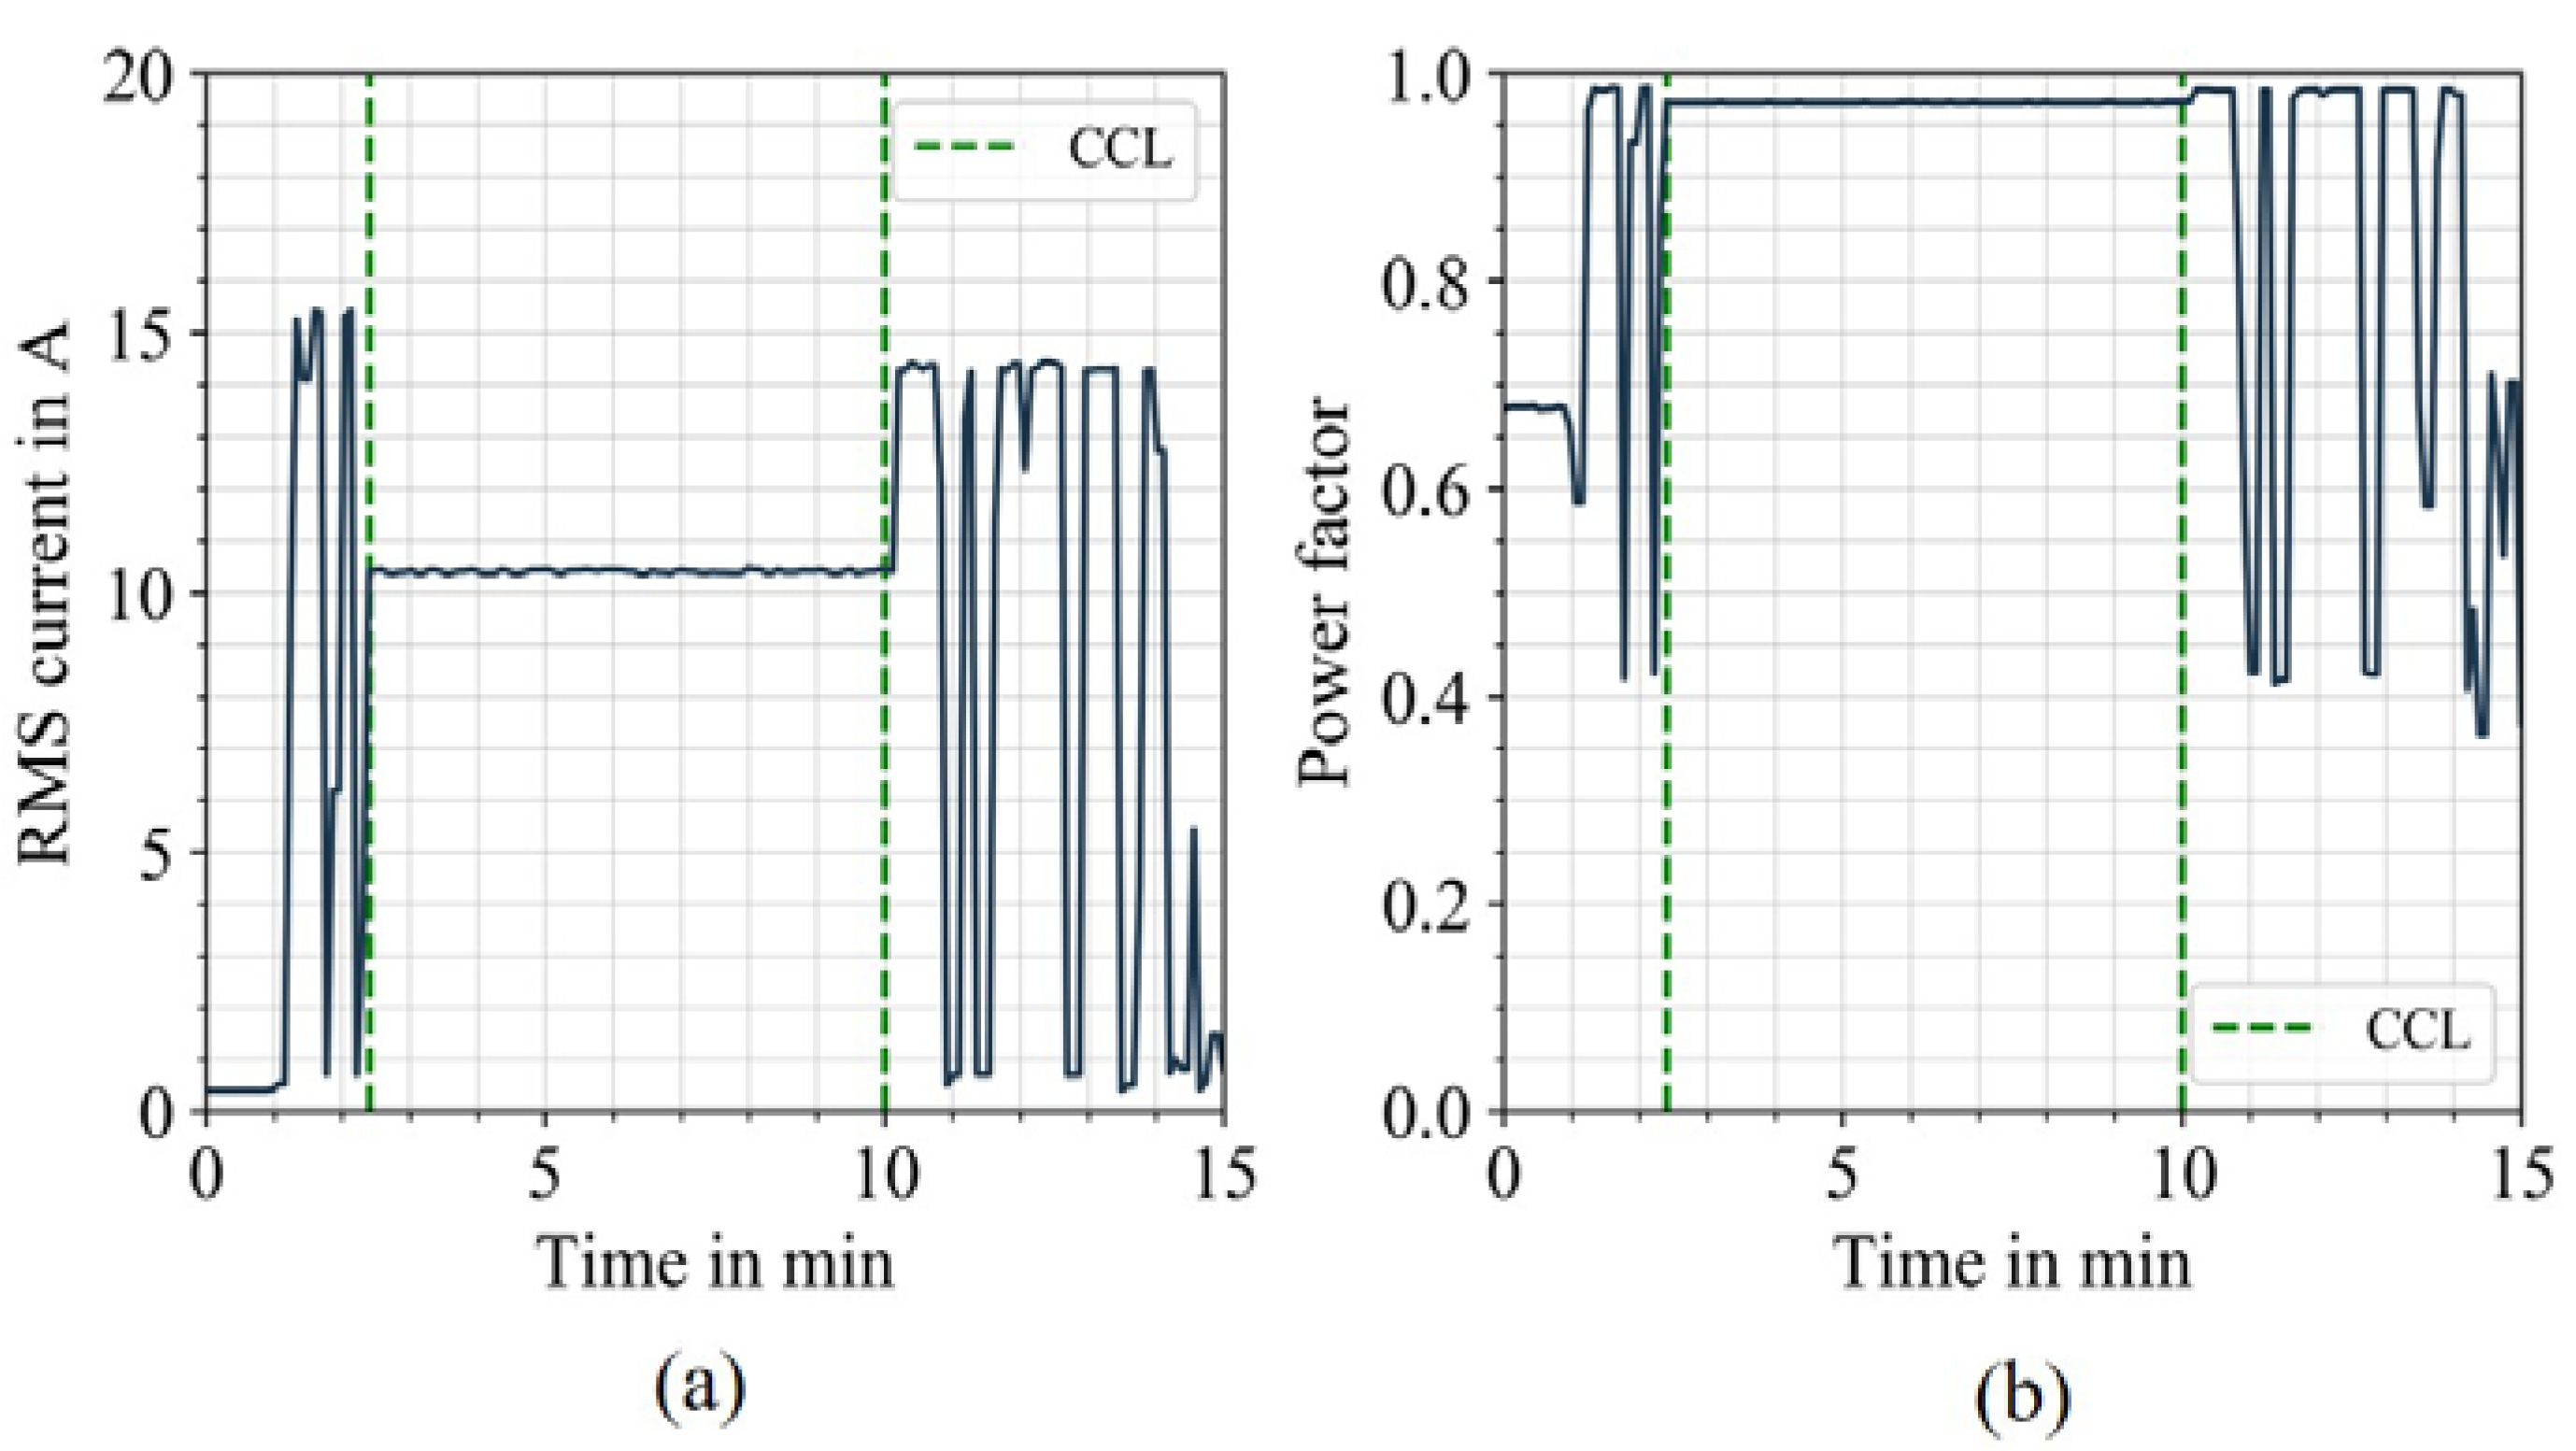
3.1. Complaints of Charge Process Interruptions

Over the duration of the monitoring campaign, several complaints were issued in respect to the charging processes at sites A and B. Vehicles that were connected to charging points over several hours did not seem to increase their battery charge, resulting in unsatisfied customers. Multiple cases of unintended charging interruptions (UCI) of different EV models were identified. An example of such an UCI case, detected at site B, is displayed in Figure 2. Figure 2a displays the RMS current trend measured at site B for each phase. Multiple vehicles were charging simultaneously until the first UCI occurred at the 6-min mark. Due to this event, one vehicle (charging over phase 2 and phase 3) disconnected from its charging point, with 48% remaining battery charge. In the following minutes the vehicle failed to reinitiate the charging process several times and repeatedly disconnected itself from the charging point. At the last UCI, the vehicle shut down and did not automatically reinitiate a charging process. At this state, it was necessary to manually unlock the vehicle, unplug the charger, and reinstate the cable to continue charging. As displayed in Figure 2a, at the 2-min mark, an EV disconnected from the charging infrastructure. This vehicle reached 100% battery capacity and terminated the charging process, disconnecting from the grid as intended. This caused a change in the grid impedance, resulting in a rise in Supraharmonic currents as displayed in Figure 2b. The total Supraharmonic currents showed significant spikes at the timestamps of the UCIs. The TSHC is calculated with the following expression:
TSHC   =   i   =   1 740 h i 2
where the i refers to the index of individual harmonic RMS values h, aggregated with 200 Hz. The 200 Hz aggregation bands results in 740 values for the Supraharmonics range. For the LFH, a high fluctuation for uneven current harmonics in phase 2 was identified as well, while the voltage harmonics remained low. It is unlikely that the Supraharmonic are the only cause of the charge disturbances, but rather a combination of elevated harmonics in general. Additional data in respect to the LFH harmonic distortion during the occurrence of the UCIs can be found in Appendix A. Moreover, the Supraharmonic current spectrum before the first UCI occurred can be found in Figure A1b. Figure 2c displays the filtered current and fundamental current for the exact moment of the first occurring UCI. The figure illustrates a transient event with high frequency components briefly after the zero crossing, resulting in the interruption of the charging process and the disconnection of the vehicle. It is assumed that the APFC circuit of the vehicle is not able to align the load current with supply voltage in a stable manner. This assumption is based on the increased fluctuation in reactive power, briefly before the UCIs occur. An example of this process is displayed in Figure A1a for the time window prior to the UCIs. It is likely that this increase in reactive power is responsible in the observed elevated harmonic distortion, leading to the UCI.
The failure of stable APFC operation was also observed for a second case of UCIs of a different EV model. The RMS current for the second case is displayed in Figure 3a. Similar to the previous case, the EV was not able to charge in a stable manner, showing significant fluctuations in the RMS current and power factor (PF), displayed in Figure 3b. However, in order to reduce the harmonic emission, the fundamental charge current of the EV was limited to 13 A by the vehicle. As a consequence, the LFH and Supraharmonic current distortion was reduced. This charge current limit (CCL), allowed the vehicle to initiate stable charging between the time period marked by the green dotted lines with a PF close to 1. As soon as the CCL was removed, the vehicle tried to charge at a rated current of 16 A, causing the harmonic distortion to increase. As a consequence, the vehicle charging process was interrupted multiple times. The fluctuation of the power factor, displayed in Figure 3b, indicates that harmonic distortion is responsible for the unstable operation of the APFC. The high Supraharmonic content could be responsible for the interference with APFC control due to multiple zero crossings or increasing to the RMS value.
The successful charging with the CCL indicates that LFH and high frequency harmonic distortion, correlated with the fundament current, are responsible for the UCIs. Within this work, the correlation of the Supraharmonic distortion with the charging current is investigated for three different charging infrastructures. It should be noted that all measurements recorded at the three sites showed normative compliance according to the EN51060 standard [52]. Moreover, Supraharmonic voltage distortion was compliant with IEC61000-2-2 [6] for each site (Appendix C). These UCIs of EVs could impose significant problems for distribution system operators, charging infrastructure owners and their customers in the future. Particularly, when considering the occurrences of UCIs with power quality within normative limits and assuming the vehicles fulfilled the required EMC compatibility tests. Moreover, it is difficult to determine which party has the legal responsibility to prevent UCI or is accountable for the consequences.

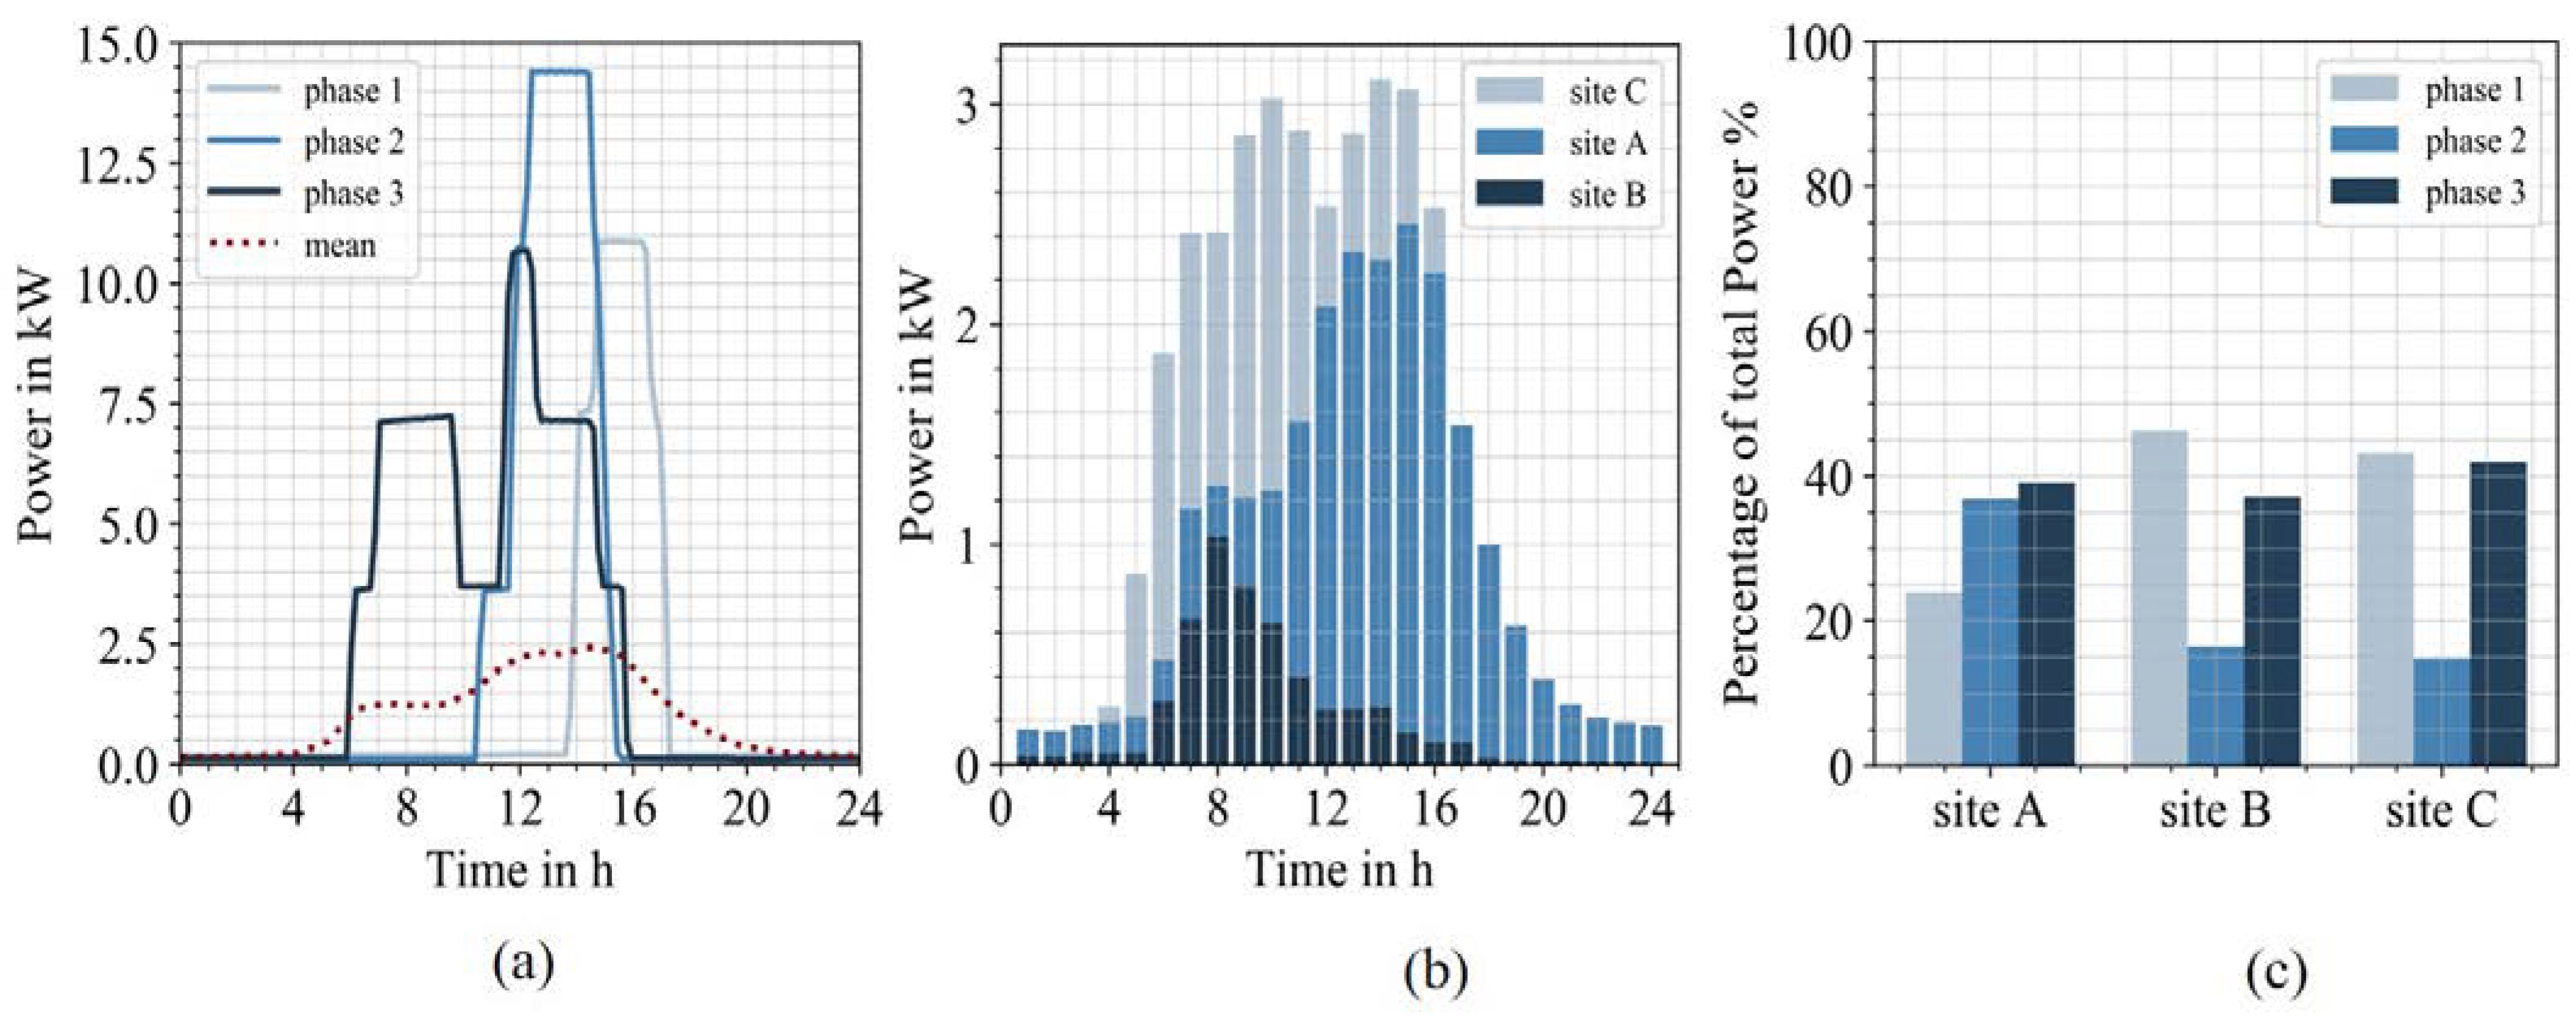
3.2. Site Characteristics

In order to provide more context to the Supraharmonic emission characteristics, the observed load behaviors of the individual charging infrastructures are discussed. A typical daily trend of the active power from the three phases is displayed in Figure 4a along with the three phased mean of all active power measurements (red line). The majority of the charging processes were single or two phases ranging from 3.6 kW to 15 kW. Figure 4b displays the arithmetic mean of the aggregated three phase active power drawn for each hour of the day over the course of the entire measurement periods for the individual sites. This corresponds to approximately 300,000 values for each hour. To illustrate the extent of unbalance, the active power drawn from each phase is, displayed in Figure 4c, normalized to the total power.
Figure 4b shows how the charging processes of the EVs start to increase in the morning hours as employees arrive at their workplace. Peaks vary between the sites but the trends generally correlate with the typical 9 to 5 working hours. Even though the number of installed charging points is larger at site B compared to site C, the higher demand at site C results in a larger arithmetic mean in active power. With respect to the cumulative distribution, 95% of the time the average load was less than 5 kW for the three sites, indicating relatively low demand compared to the number of installed charging points. Due to the low demand and mostly single- or two-phased charging, the EVs represented an unbalanced load for the majority of time at each site. This is illustrated in Figure 4c, where the portion of active power (normalized to the total power) drawn by each phase is displayed over the course of a six-month period. The figures show that for each site, the load is not distributed equally among the three phases. At the monitored sites, the charging points were connected to a 4-wire distribution system. Under balanced load conditions, the neutral current is equal to zero. Most combinations of multiple vehicles charging over one or two phases will result in a current flowing through the neutral conductor. Since EVs behave like a nonlinear load, generating harmonic distortion, the neutral conductor also consists of positive, negative, and zero sequence harmonic currents [53]. Higher order harmonics also affect the neutral current since they are superimposed on triple harmonics, adding the peak and RMS values [54].

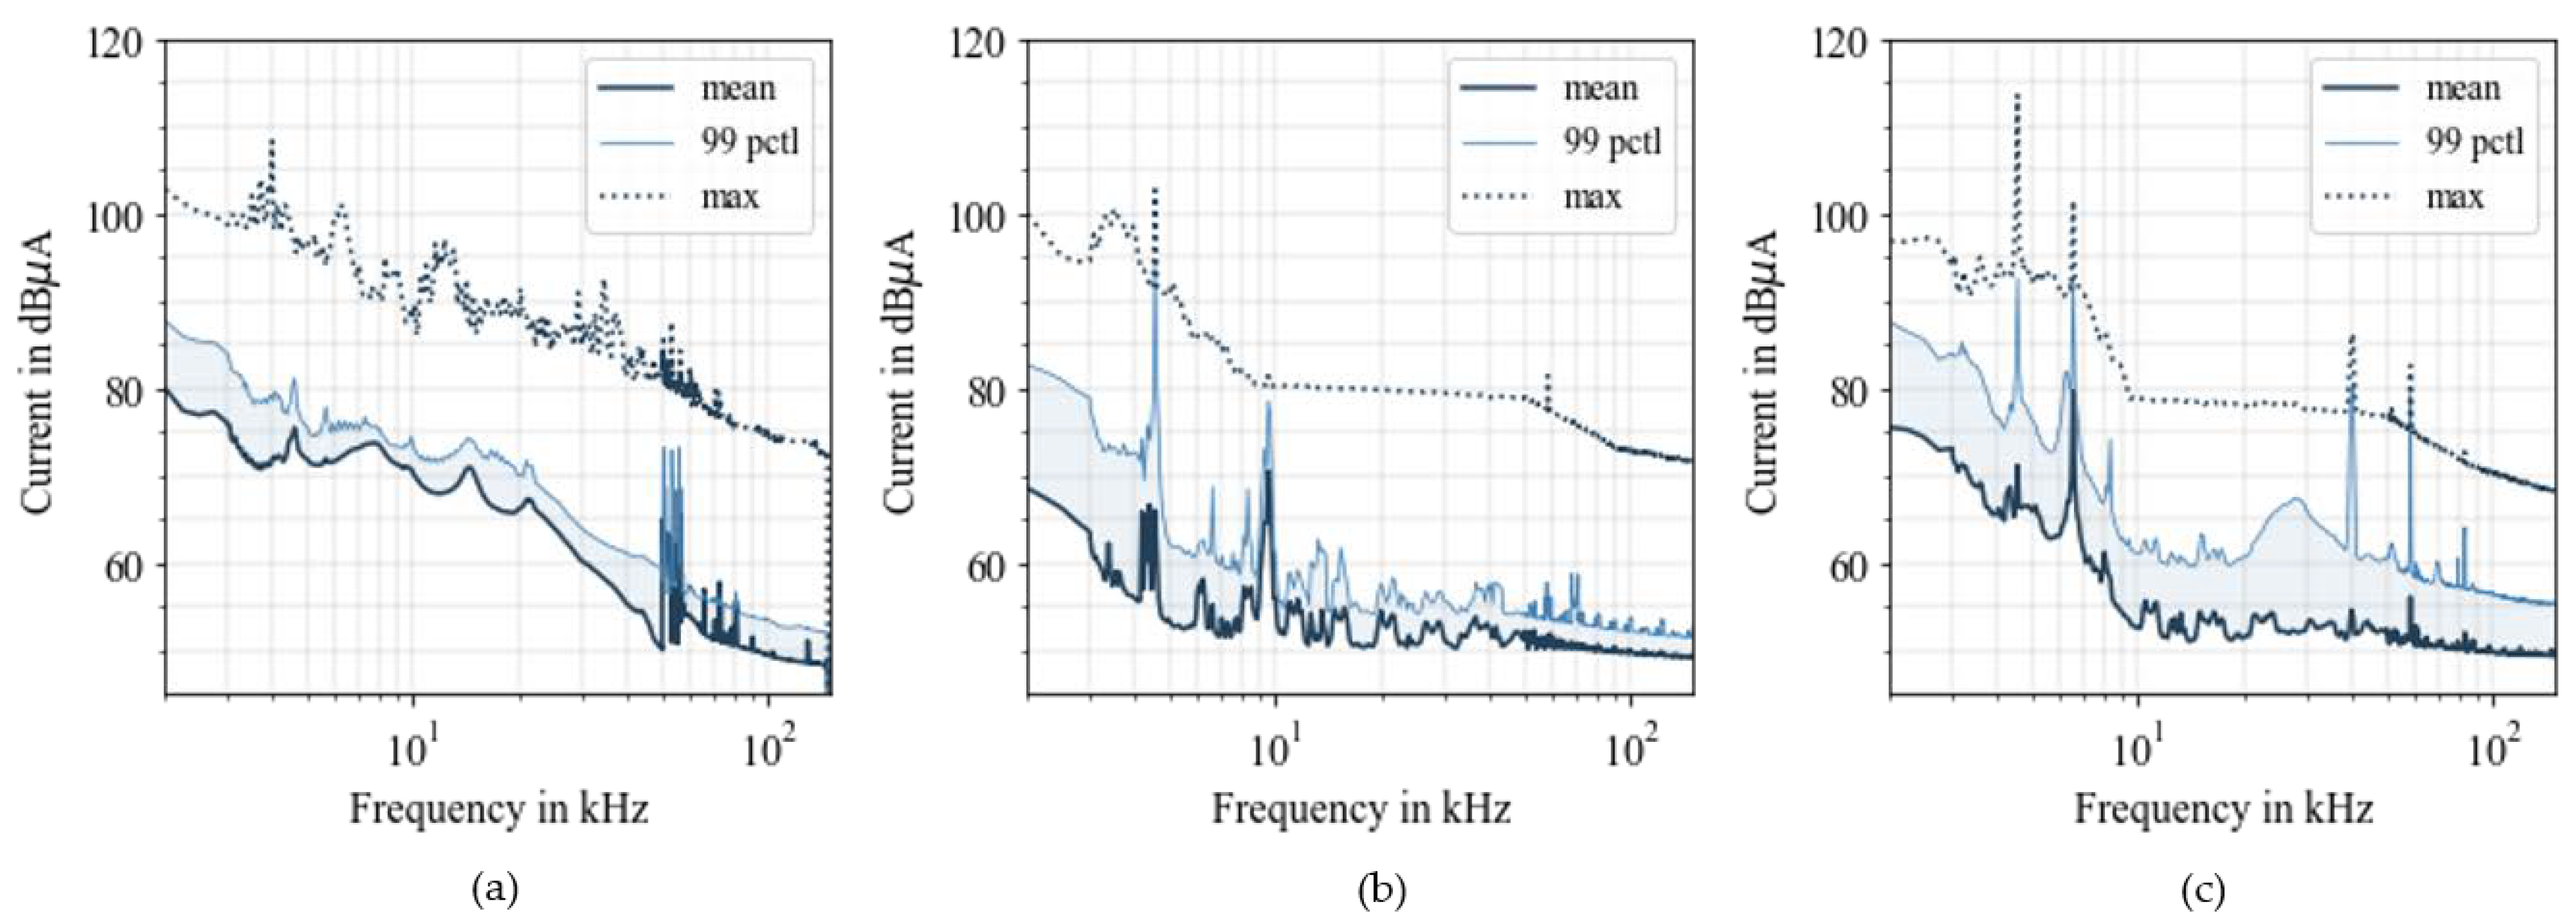
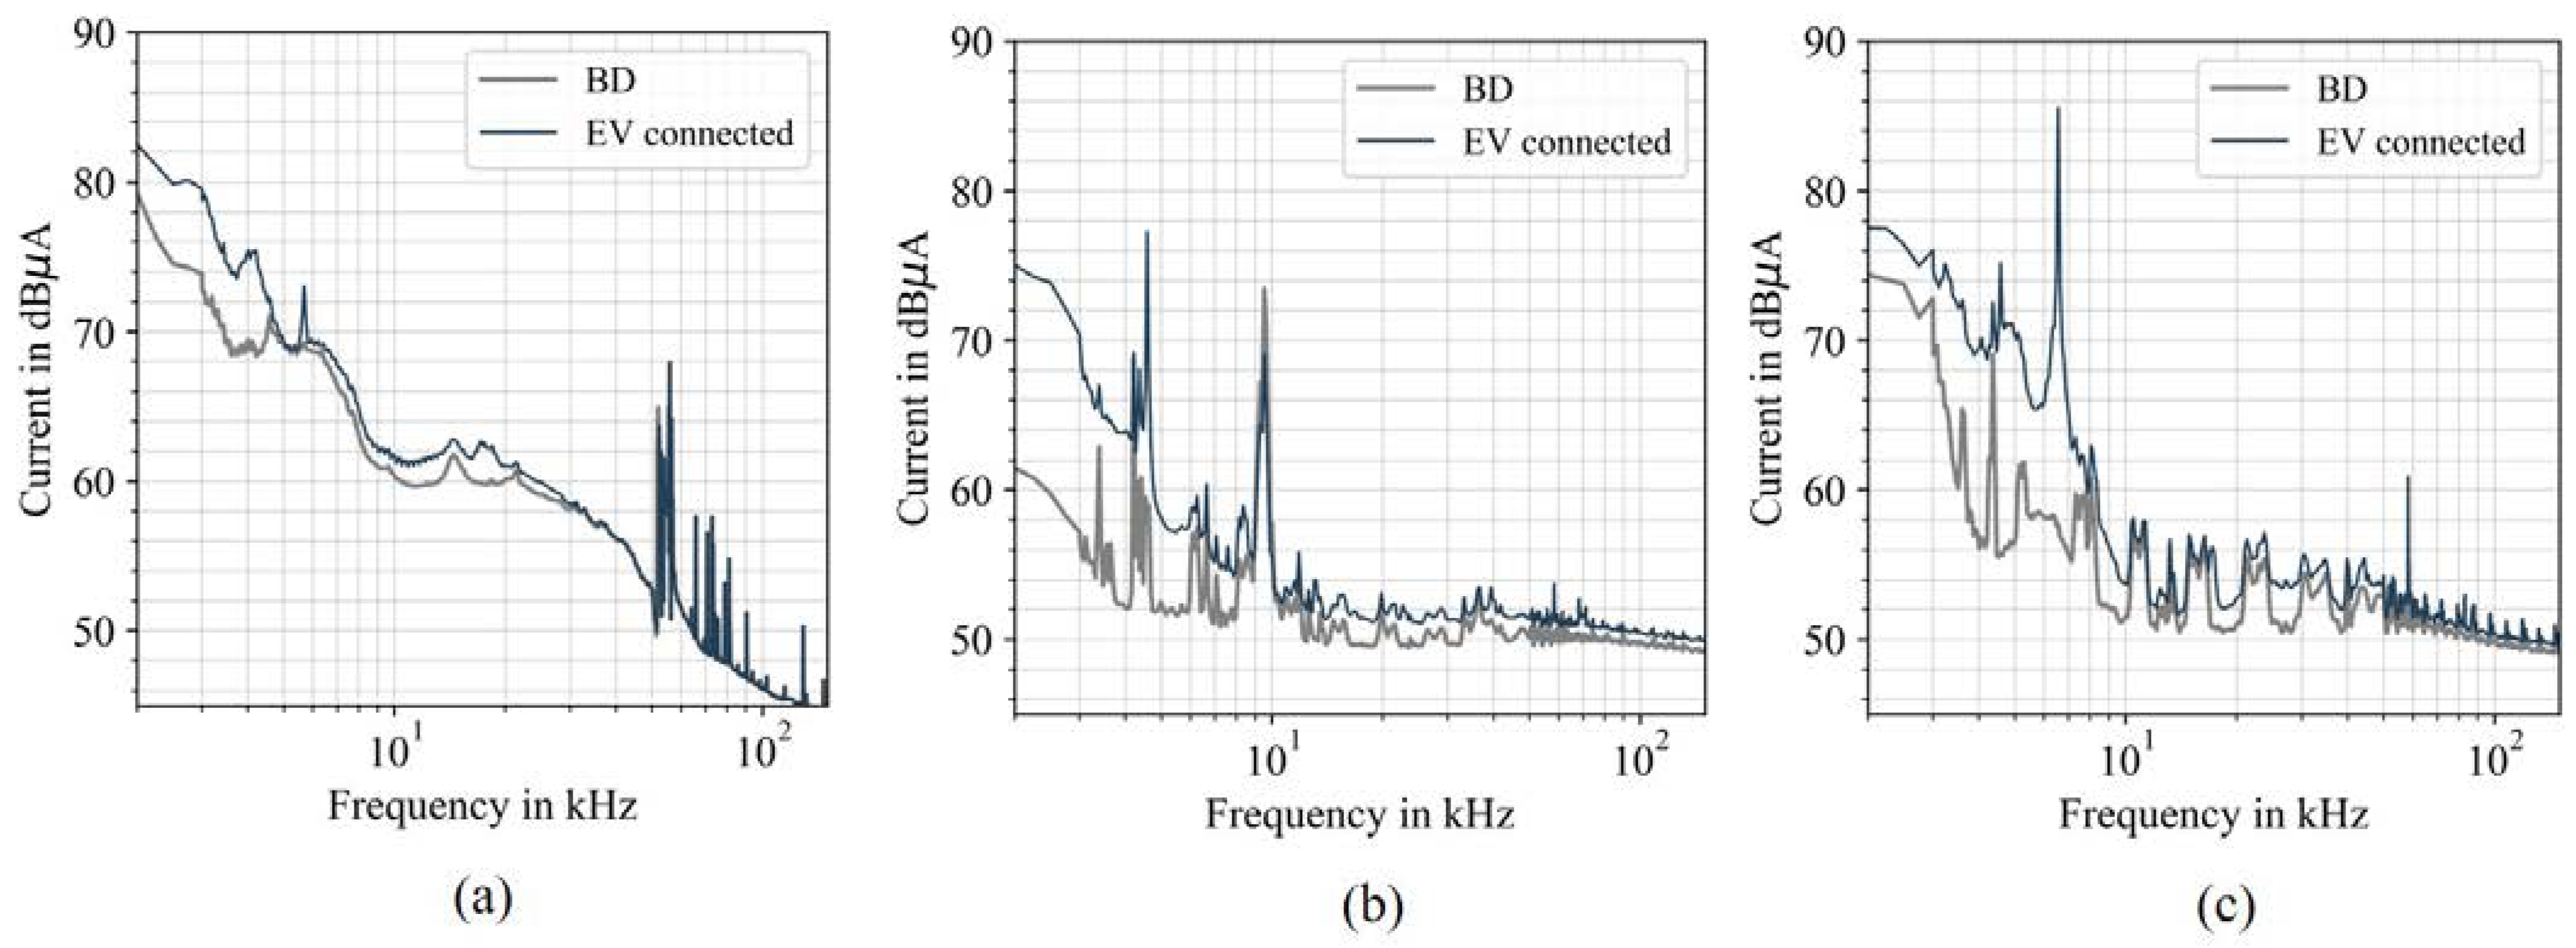
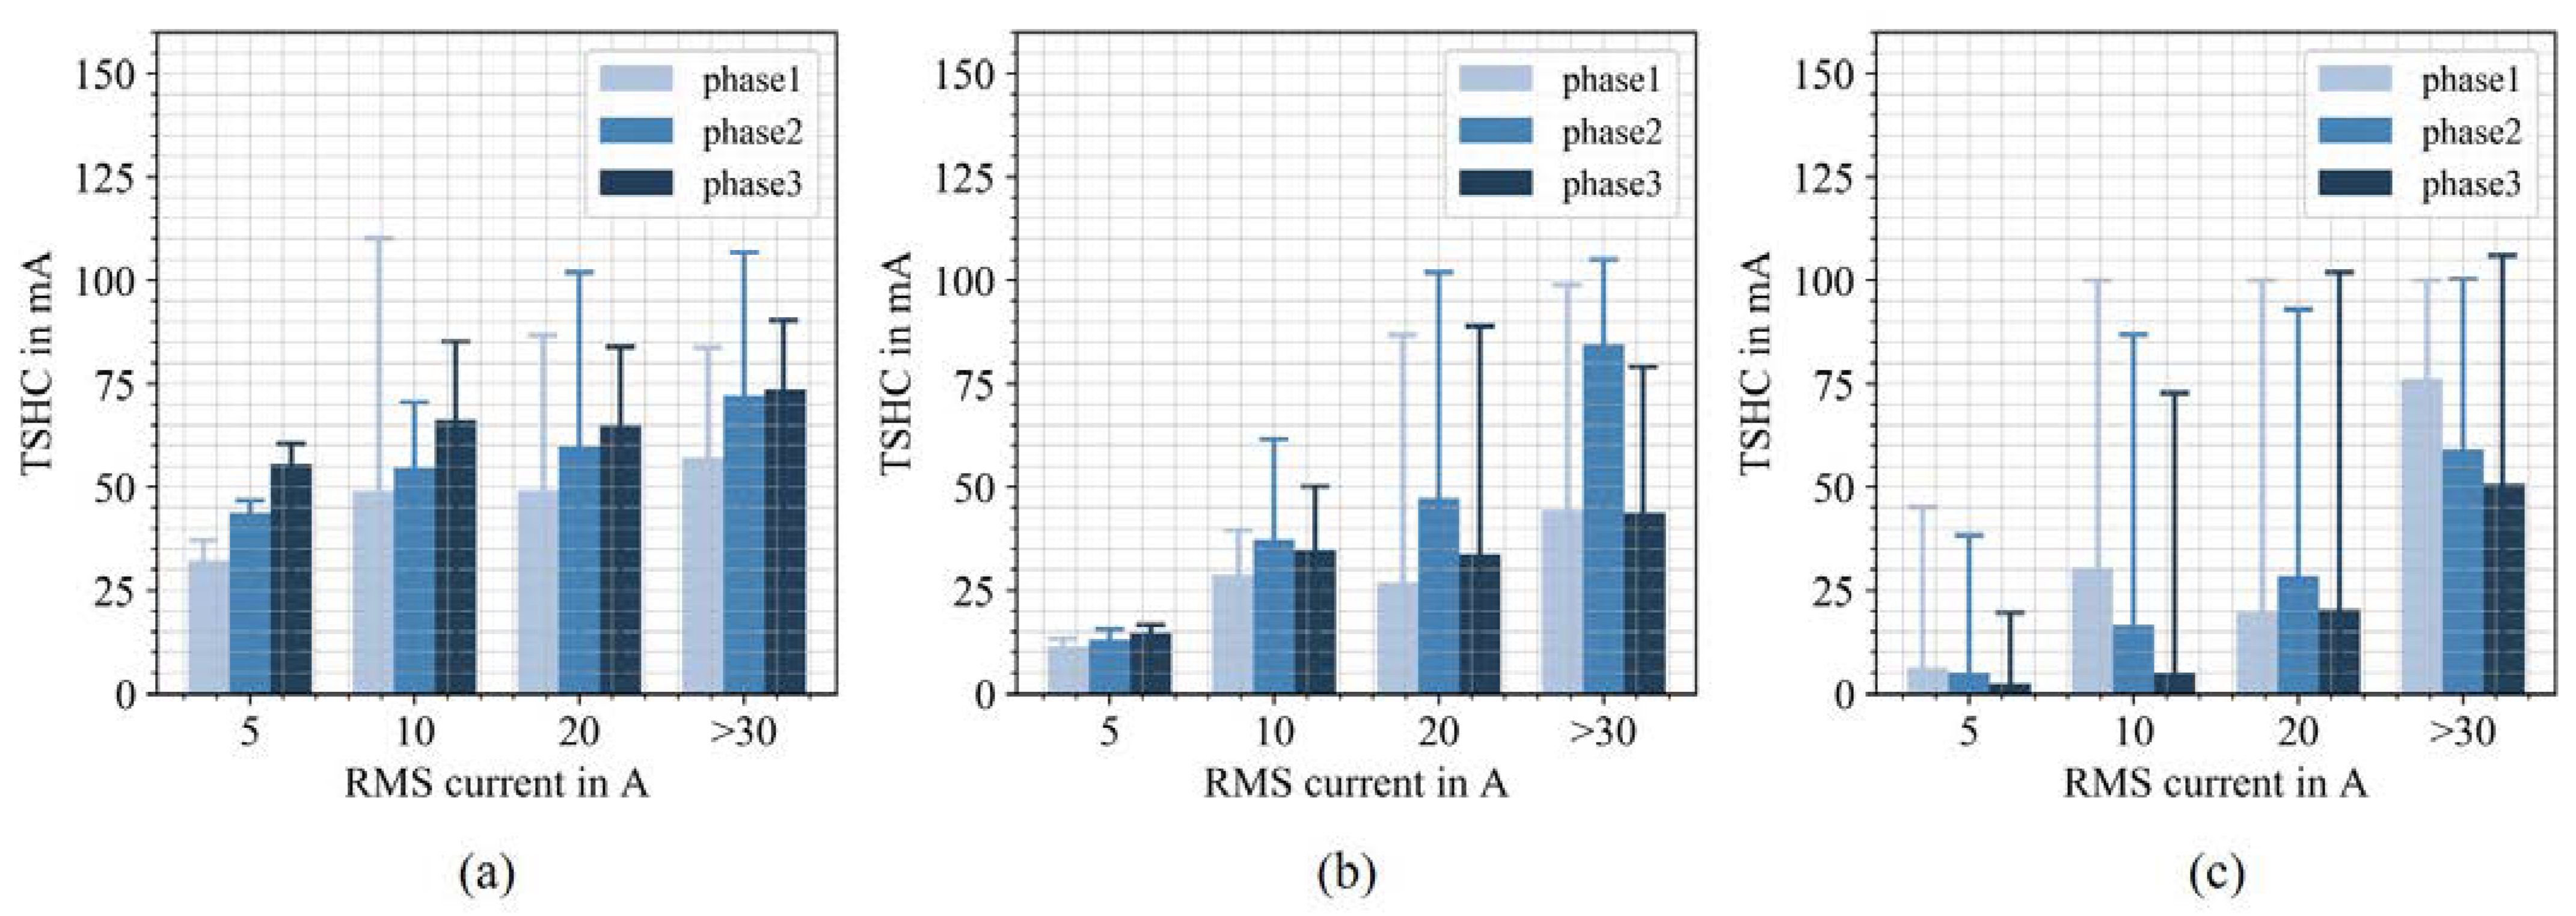
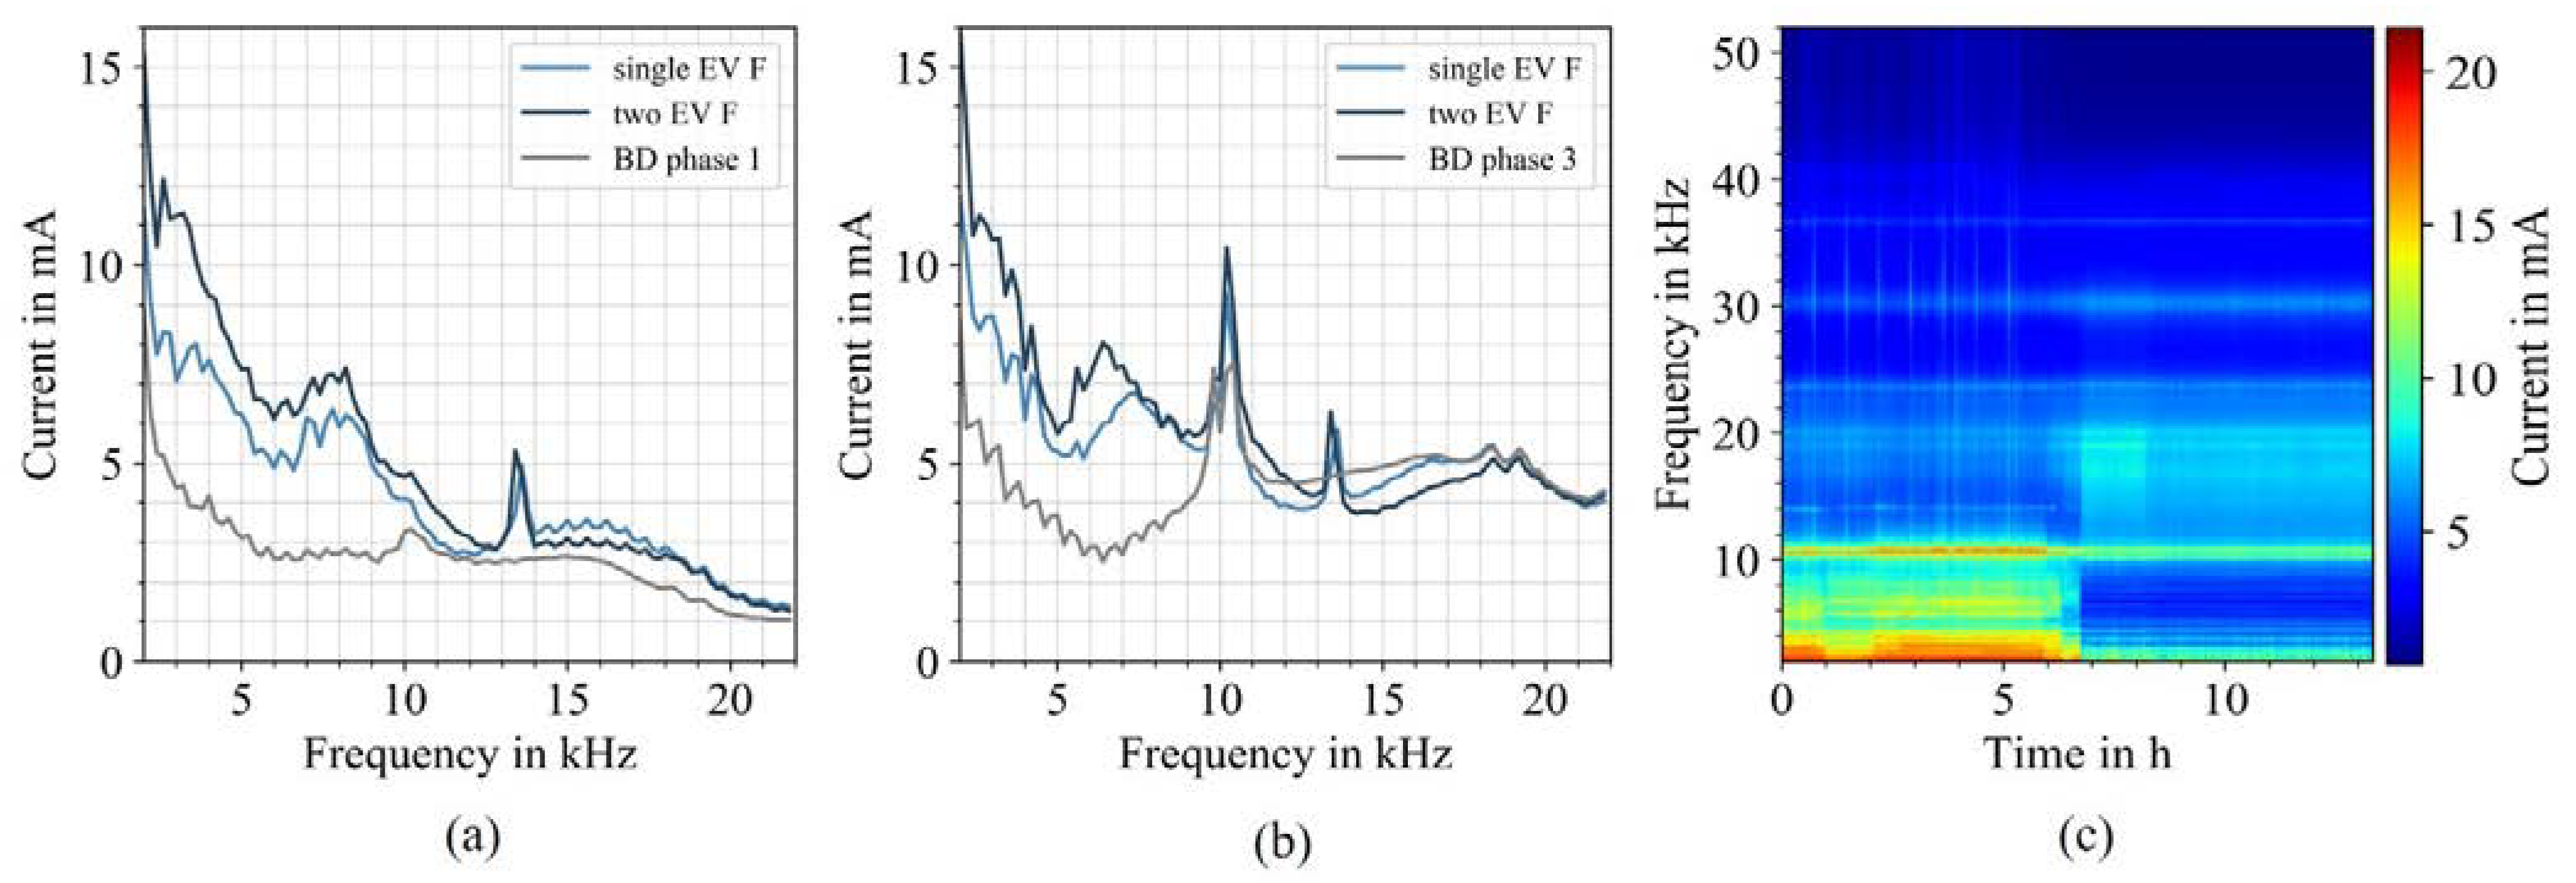
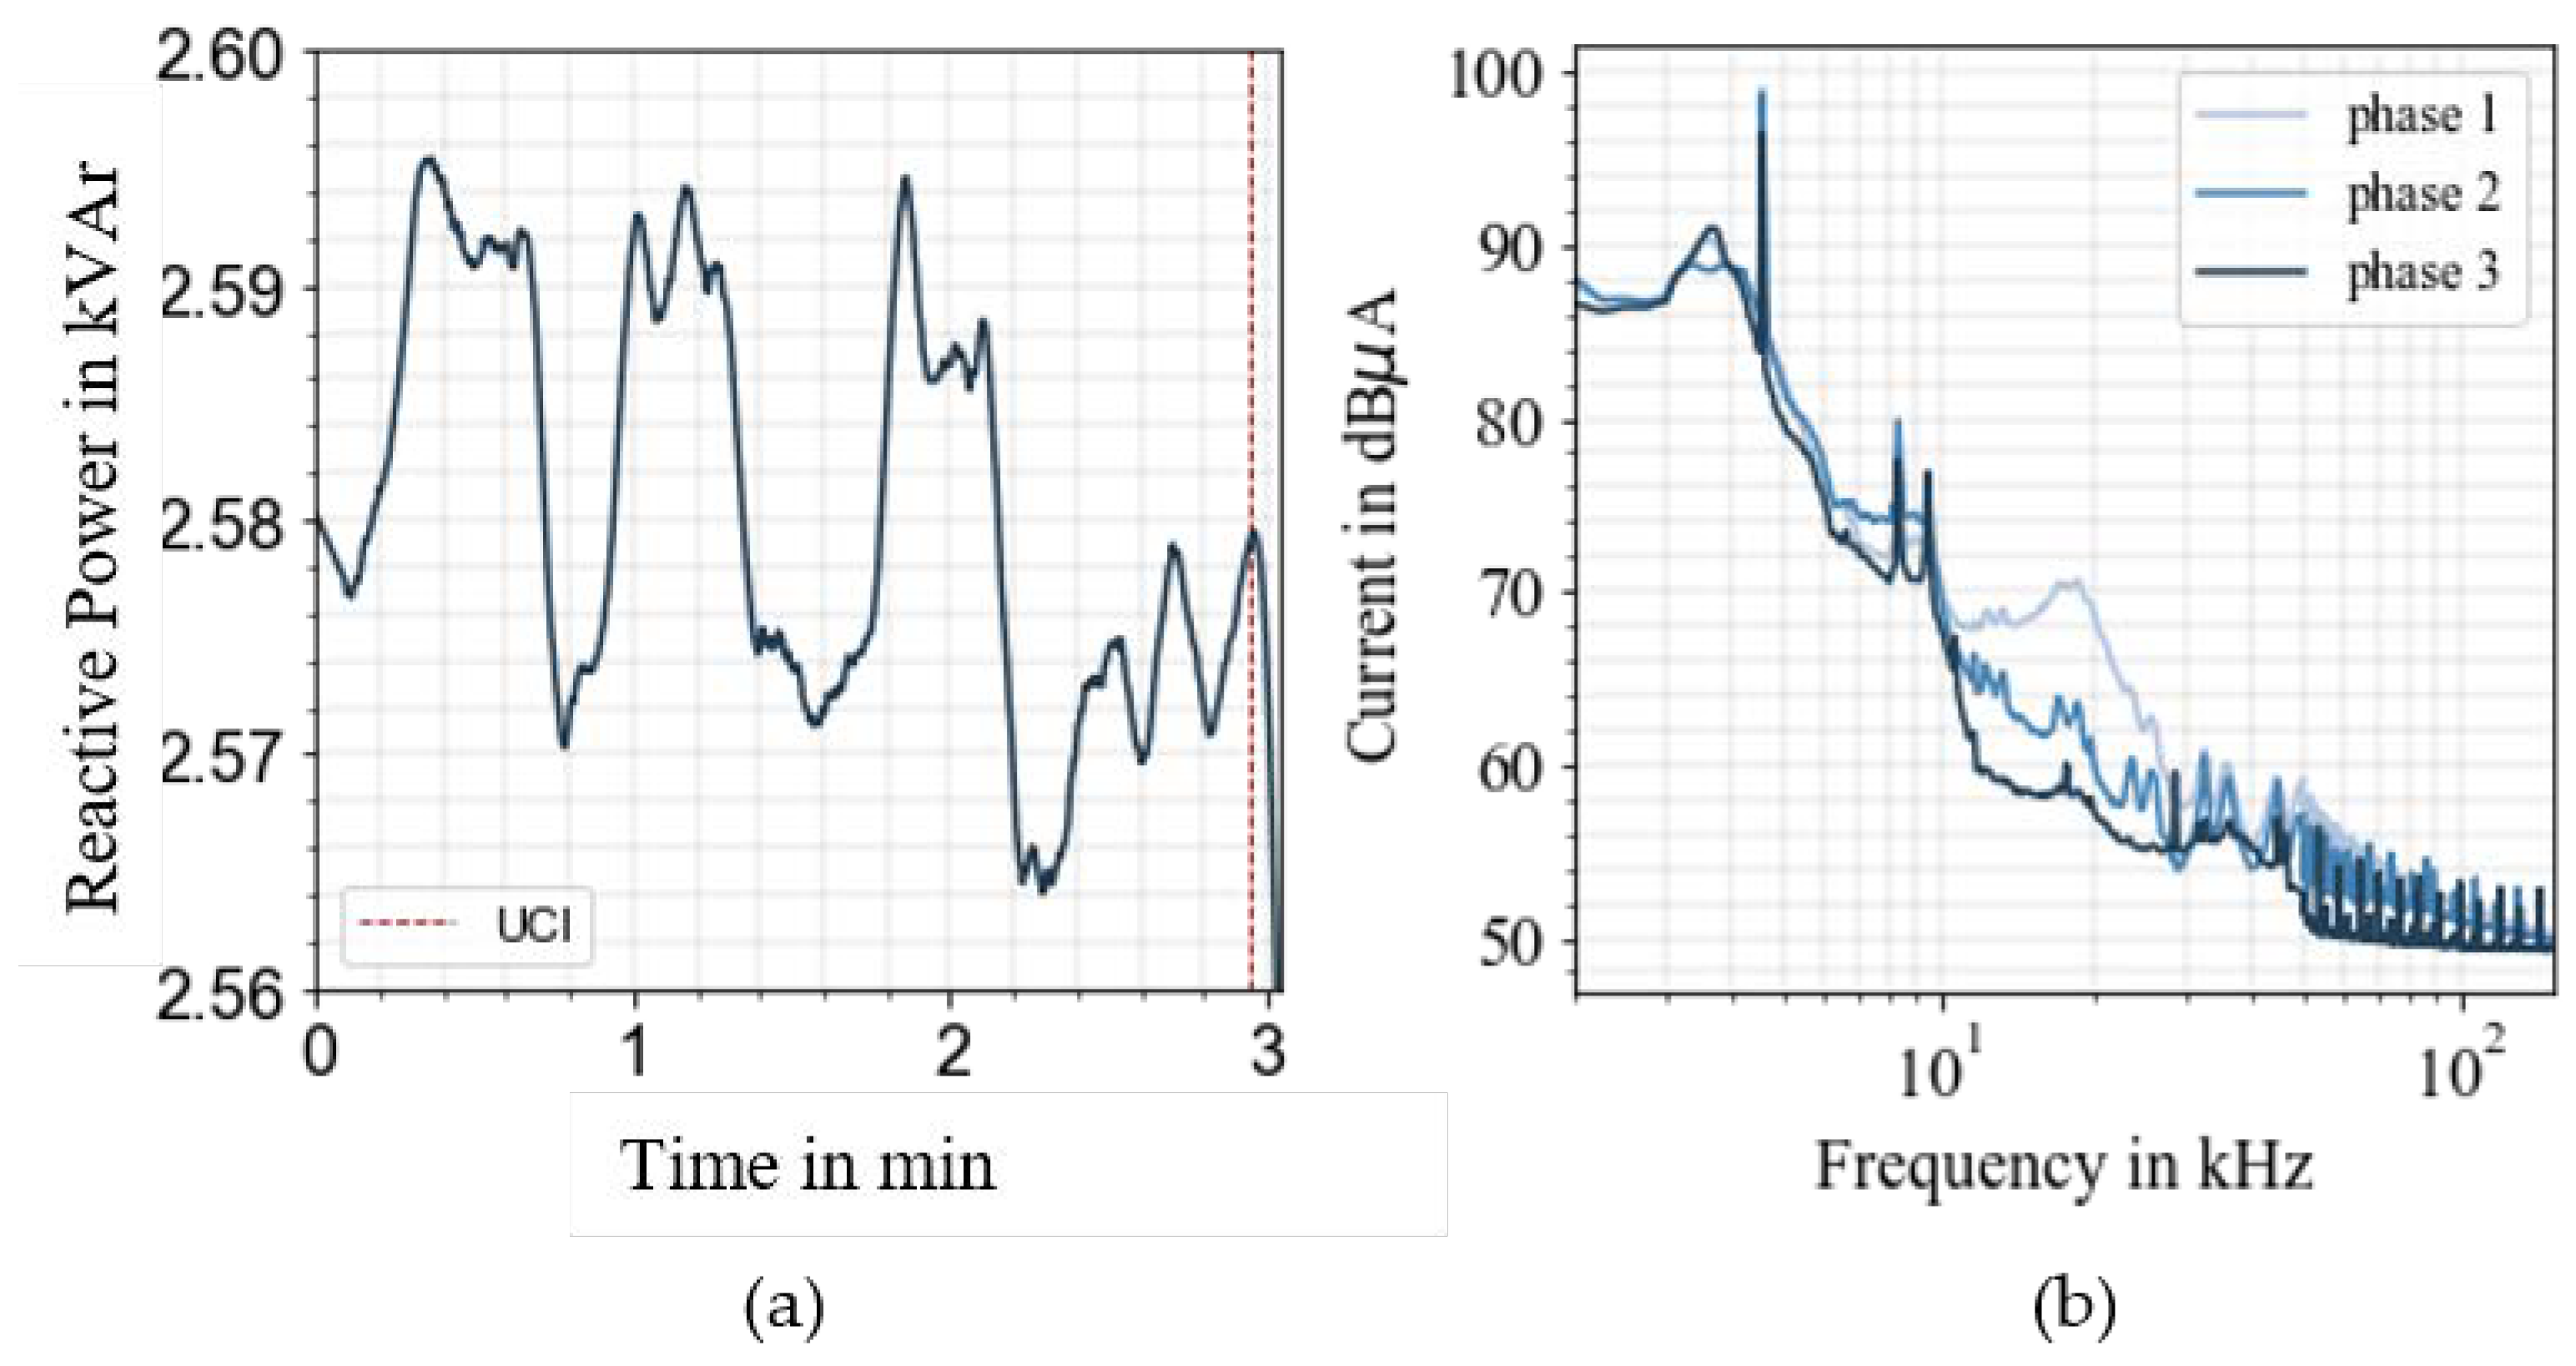
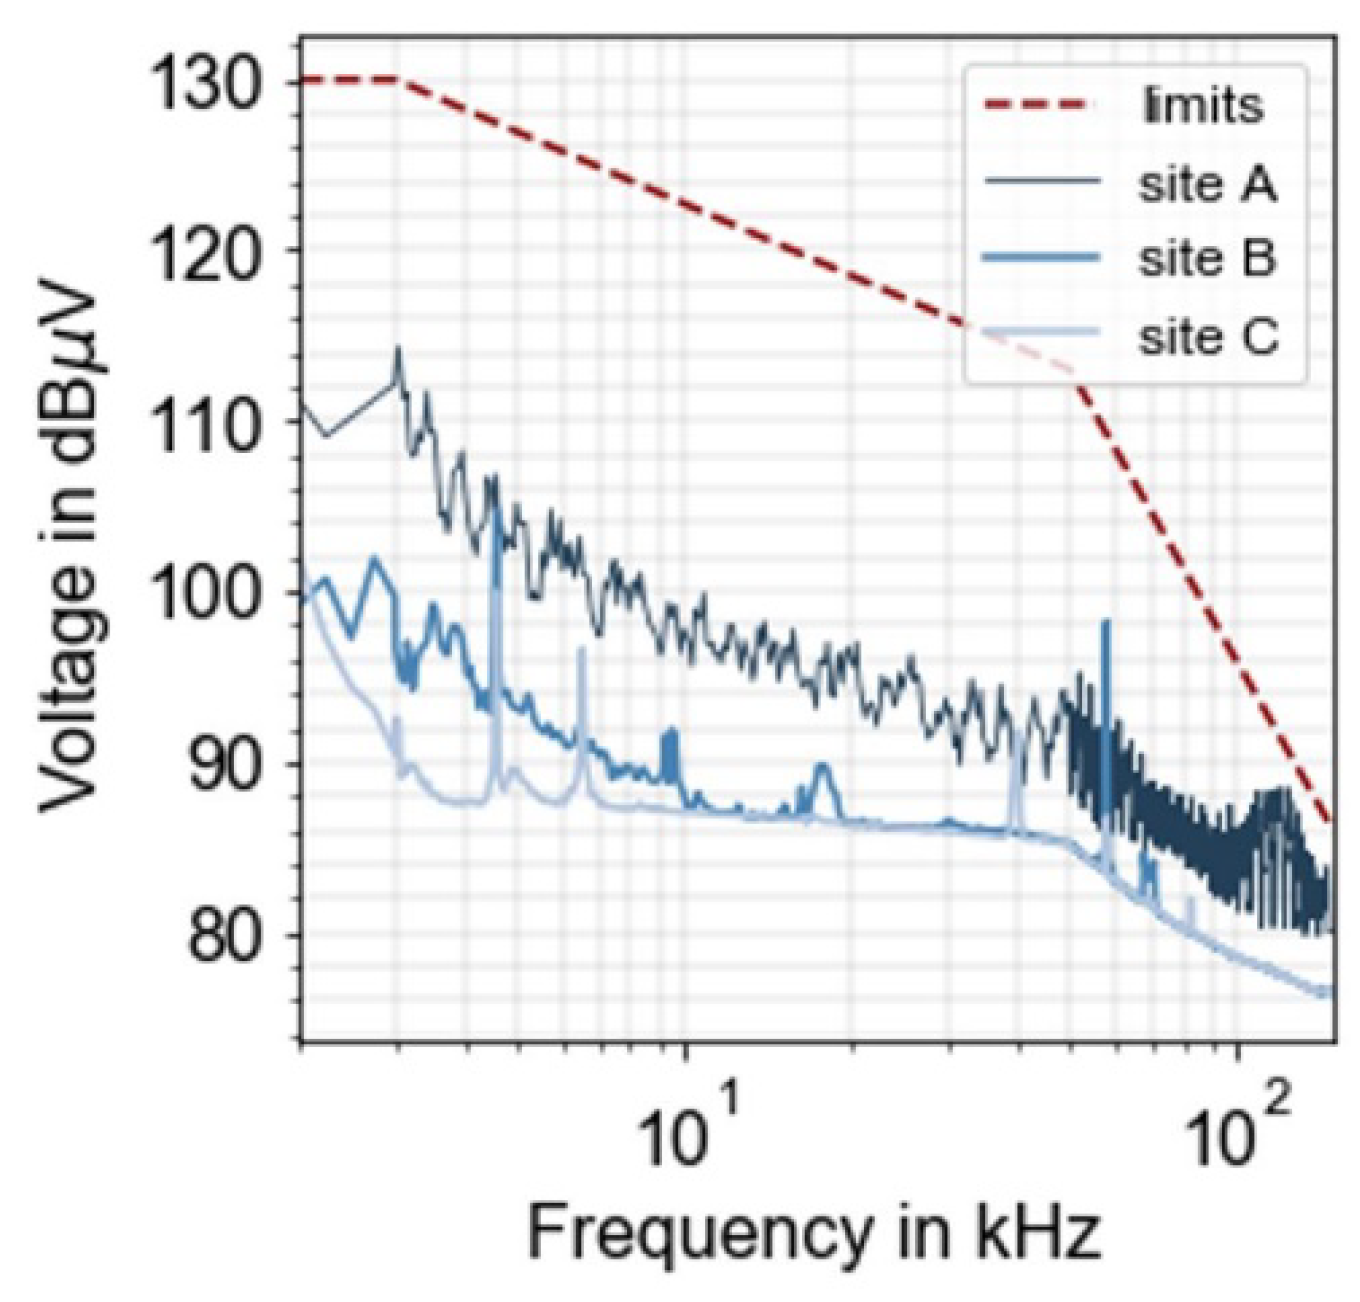
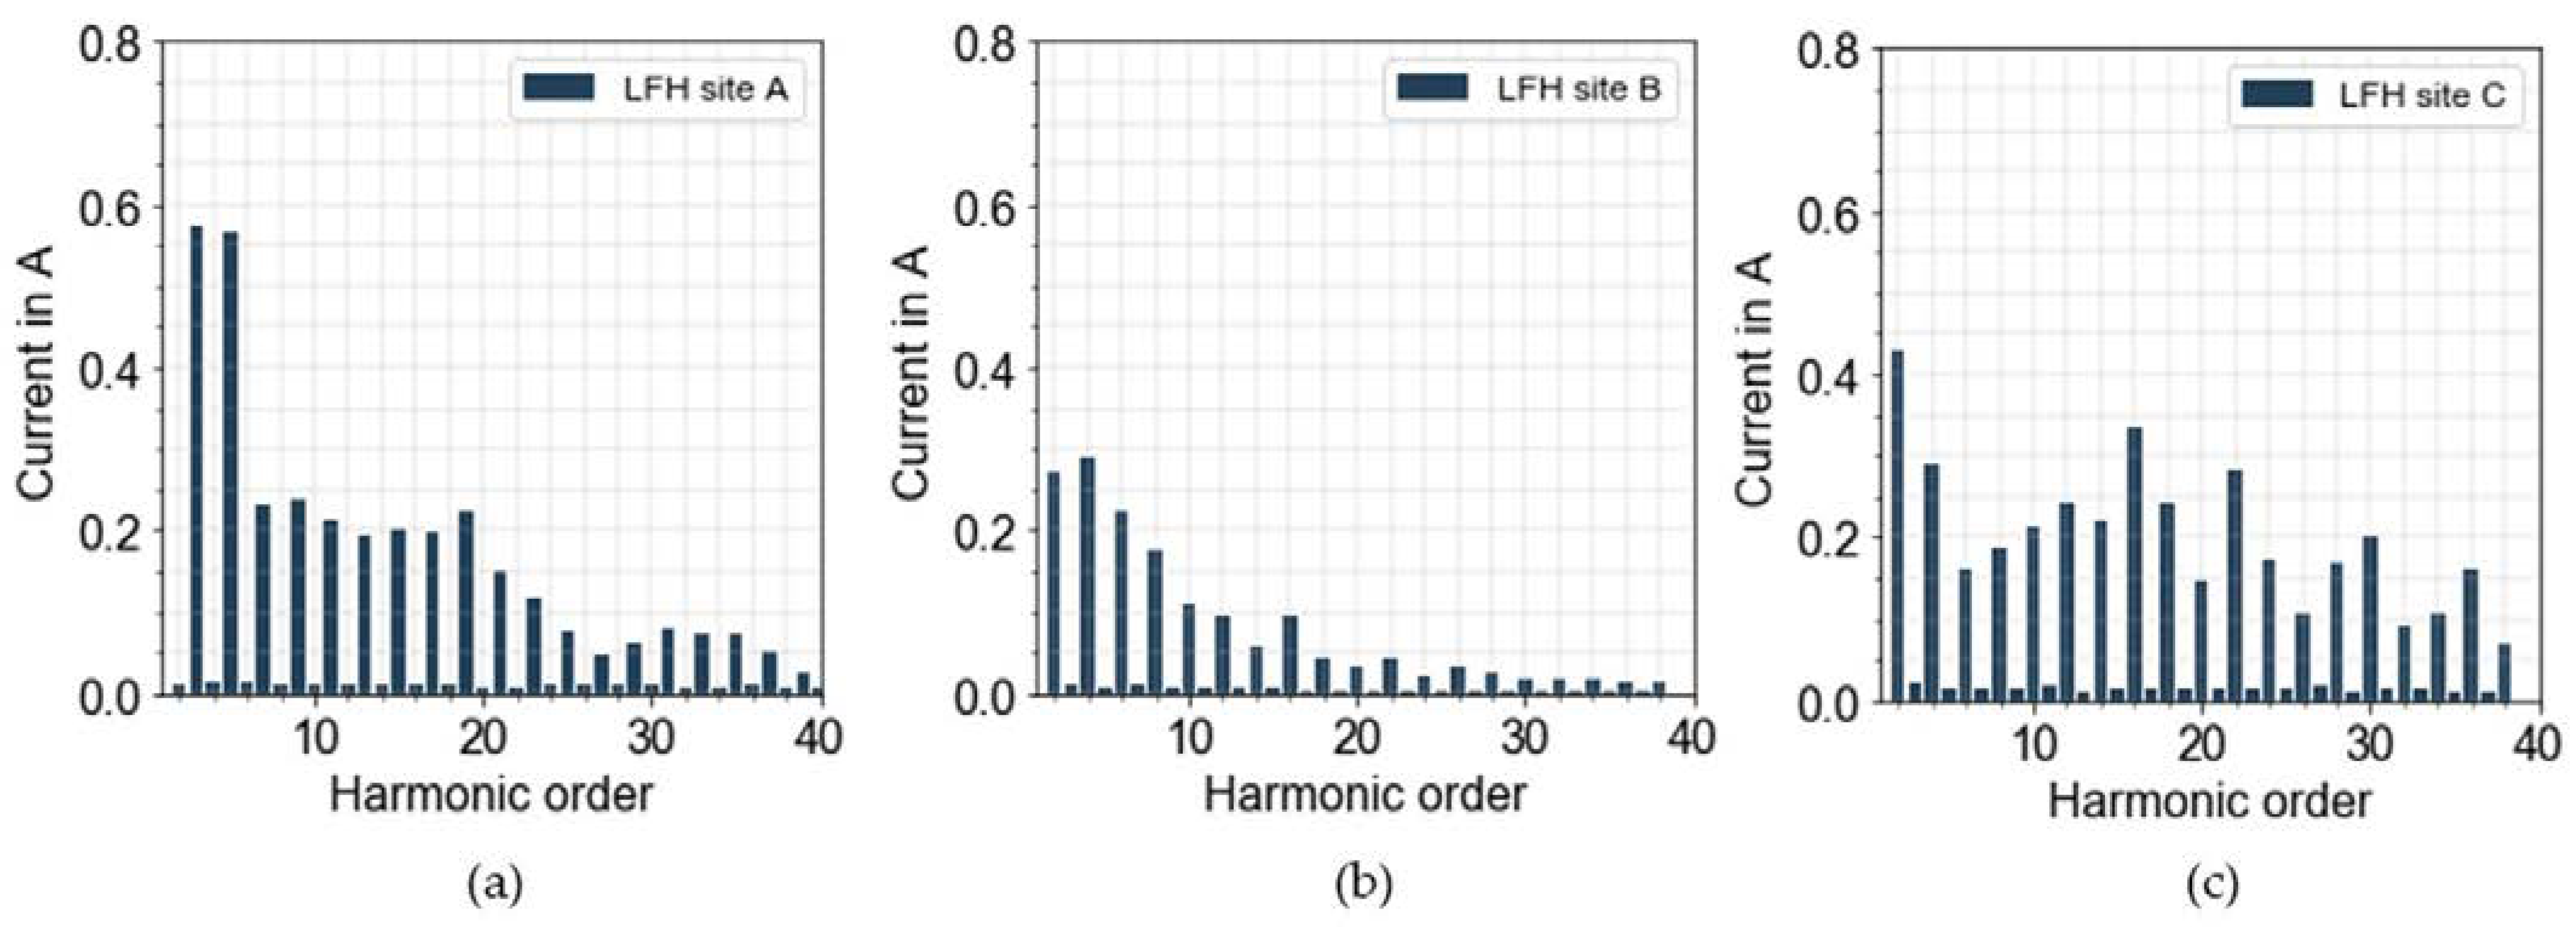
3.3. Statistical Properties of the Supraharmonics Distortion in Frequency Domain

In order to review the Supraharmonic currents of the phases and the propagation into the neutral conductor, the arithmetic mean, 99th percentiles, and maximum values for each harmonic in the range from 2 to 150 kHz are considered. The Supraharmonics for the three phases were aggregated for each site over the entire monitoring period and converted to dBµA, as displayed in Figure 5. Figure 6 displays the Supraharmonic current distortion for each site while EVs were connected compared to the distortion while no EVs were connected. The distortion while no EVs were connected will be referred to as background distortion (BD).
When comparing the current levels in Figure 5, the general extent of emission is within similar ranges between 40 and 115 dBµA. The ratio between mean and maximum amplitudes varies but can be as high as 70% for some frequencies. Particularly in the frequency range below 10 kHz, a high variation in emission is visible. These are likely to be generated from the connected EVs, which can be concluded from Figure 6. The high variation between the mean and 99th percentile at peak frequencies indicate that the emission at the frequency is generally low, but rises in case an EV is connected. Site A shows significantly higher emission up to 40 kHz compared to site B and C. Since the emission is permanently present, unrelated to the EVs charging behavior as seen in Figure 6a, the sources responsible for the elevated background distortion cannot be identified with certainty. However, the emission is likely to originate from power electronic devices such as lighting, monitors, and other utility connected at the site. The narrow variation at site A for the frequencies at 50 to 60 kHz points to a constant Supraharmonic emission source and does not also necessarily originate from the EVs. This frequency range is barely affected by the connected EV, as indicated by Figure 6.
Figure 6 shows that the background distortion levels significantly differ between the sites. The BD is affected by the neighboring equipment connected at the sites and consequently differs between the phases. The influence of the BD on the overall Supraharmonic distortion with an increasing number of charging vehicles is displayed in Figure 7. The TSHC was calculated for each measured RMS phase and site and separated into bins with an interval of 5 A. The figures display the means and 95th percentiles for each interval.
The figure indicates that the TSHC rises with an increasing number of connected vehicles. The background distortion determines the initial offset of the increase and varies between the phases and sites. The high background distortion at site A leads to higher distortion levels for the interval from 10 A to 20 A compared to other sites. For site B and C, a higher variation in the emission is visible.
As Figure 7 shows, the background distortion levels differ significantly between the monitored sites and phases. A reason for the different extent of background distortion in the frequency range from 2 to 10 kHz for the individual sites could be the LFH. The higher order LFH (order 10–40) showed strong correlations to the Supraharmonics for the corresponding frequency range. The means of the LFH for the individual sites can be found in Appendix D. Connected Supraharmonic sources interact with the background distortion, affecting the overall emission levels. This leads to different harmonic spectrums of the same EV, depending on the connected phase and site. The measurements indicate an increase of Supraharmonic distortion with a rising number of connected EVs. However, for some configurations of charging EVs, a damping effect of certain frequency ranges was observed. Figure 8 shows the arithmetic means of the Supraharmonic distortion from a single connected EV (model Z refers to a three phase charging EV with a rated current of 16 A.) and two connected EVs of the same model at phase 3 (a) and phase 1 (b) for the site. The models were company owned vehicles and frequently charged at site A. In both figures, the arithmetic means of the background distortion (no EVs connected) measured for the corresponding phase is shown. The figures show that the background distortion at phase 3 is higher compared to phase 1. Particularly for the frequency range between 8 and 20 kHz, phase 3 shows elevated emission levels due to background distortion. Upon the connection of a single EV Z model, the overall distortion levels increase for phase 1. However, for phase 3 the frequency range between 11 kHz and 18 kHz are reduced. Upon connection of the vehicle, distortion is lower compared to the background distortion.
This interaction indicates that the EV Z has a damping effect on specific Supraharmonics. The attenuating effect can be linked to a similar configured grid side filter of the connected vehicles, which are supposed to dampen the generated distortion. As Figure 8b shows, this attenuation effect in this frequency range is even higher for two connected EV Z models. However, the vehicles do not show the same damping effect at phase 1 since the background distortion is significantly lower in the relevant frequency range. For a better visualization of this effect, Figure 8c shows the spectrogram of an EV Z ending its charging process at phase 3. For a better color scaling of the spectrogram, the currents are displayed in mA. At the 6.5-h mark, the EV Z is disconnected from the charging point at site A. This causes a reduction in emission levels up to 10 kHz but slightly increases the Supraharmonics between 10 and 20 kHz. Each of the measurements of the damping effect were recorded while no other vehicle was connected to the charging infrastructure. The figures indicate that vehicles with grid side filters of similar configuration can reduce the Supraharmonics in certain frequency ranges for phases with high background distortion. In Table 2, the results of frequency domain analysis of the three different monitored sites are summarized.

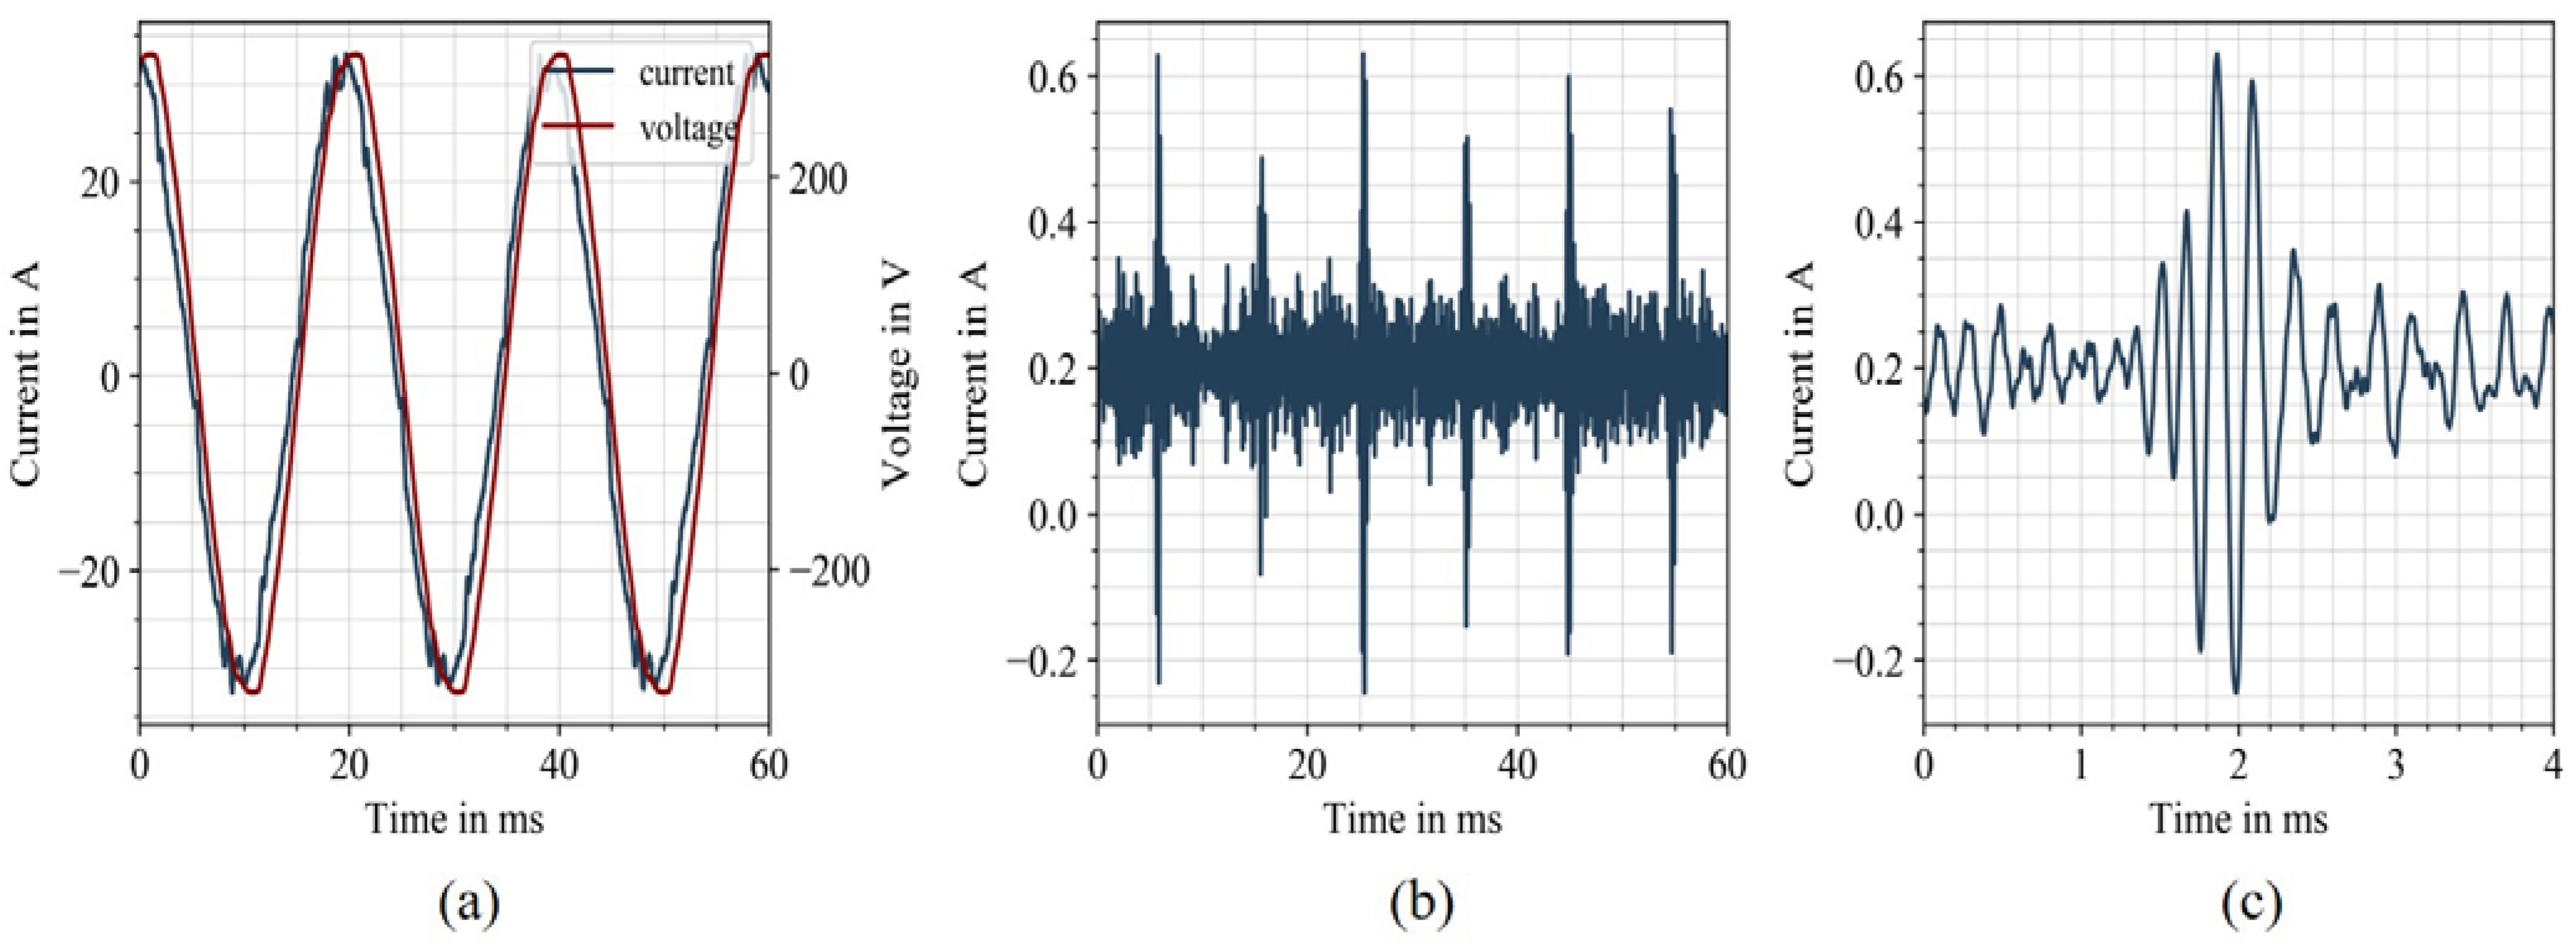
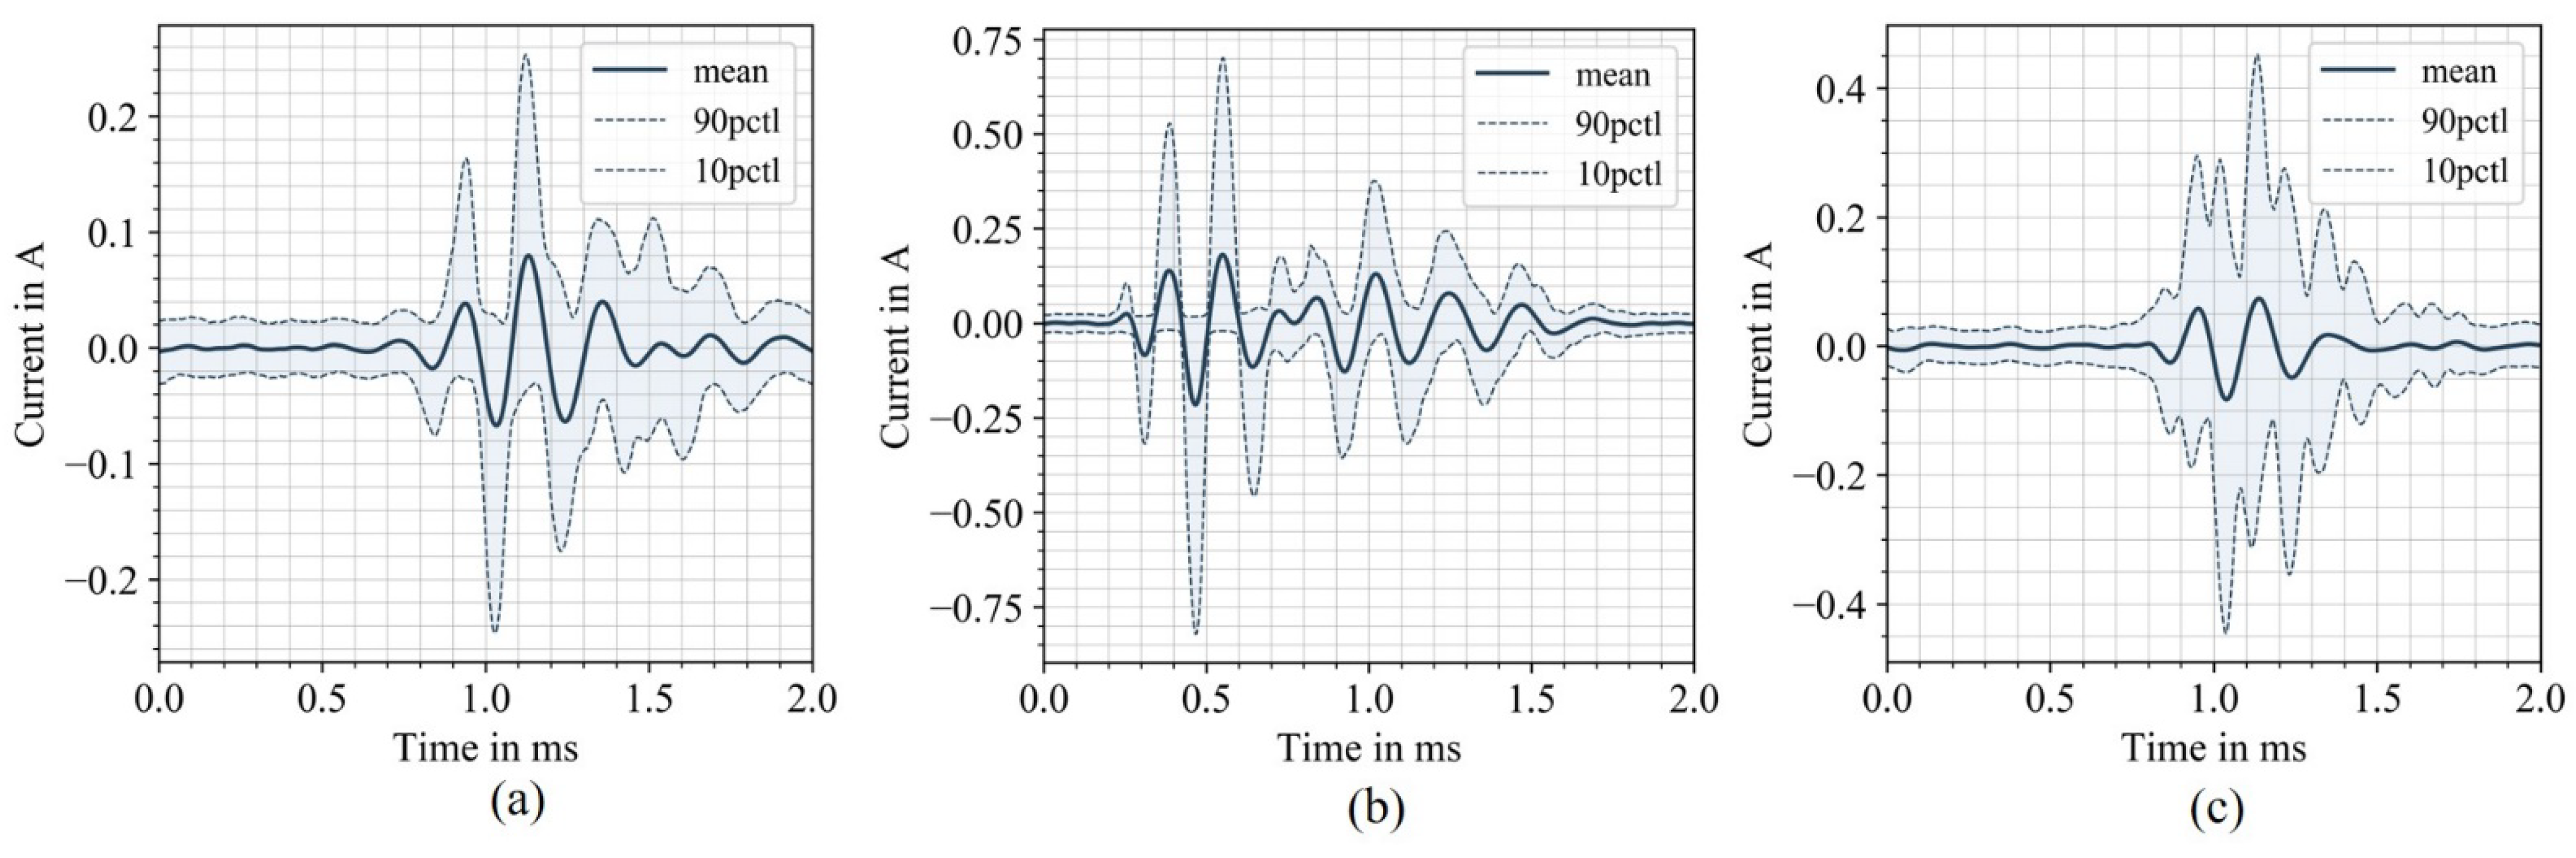
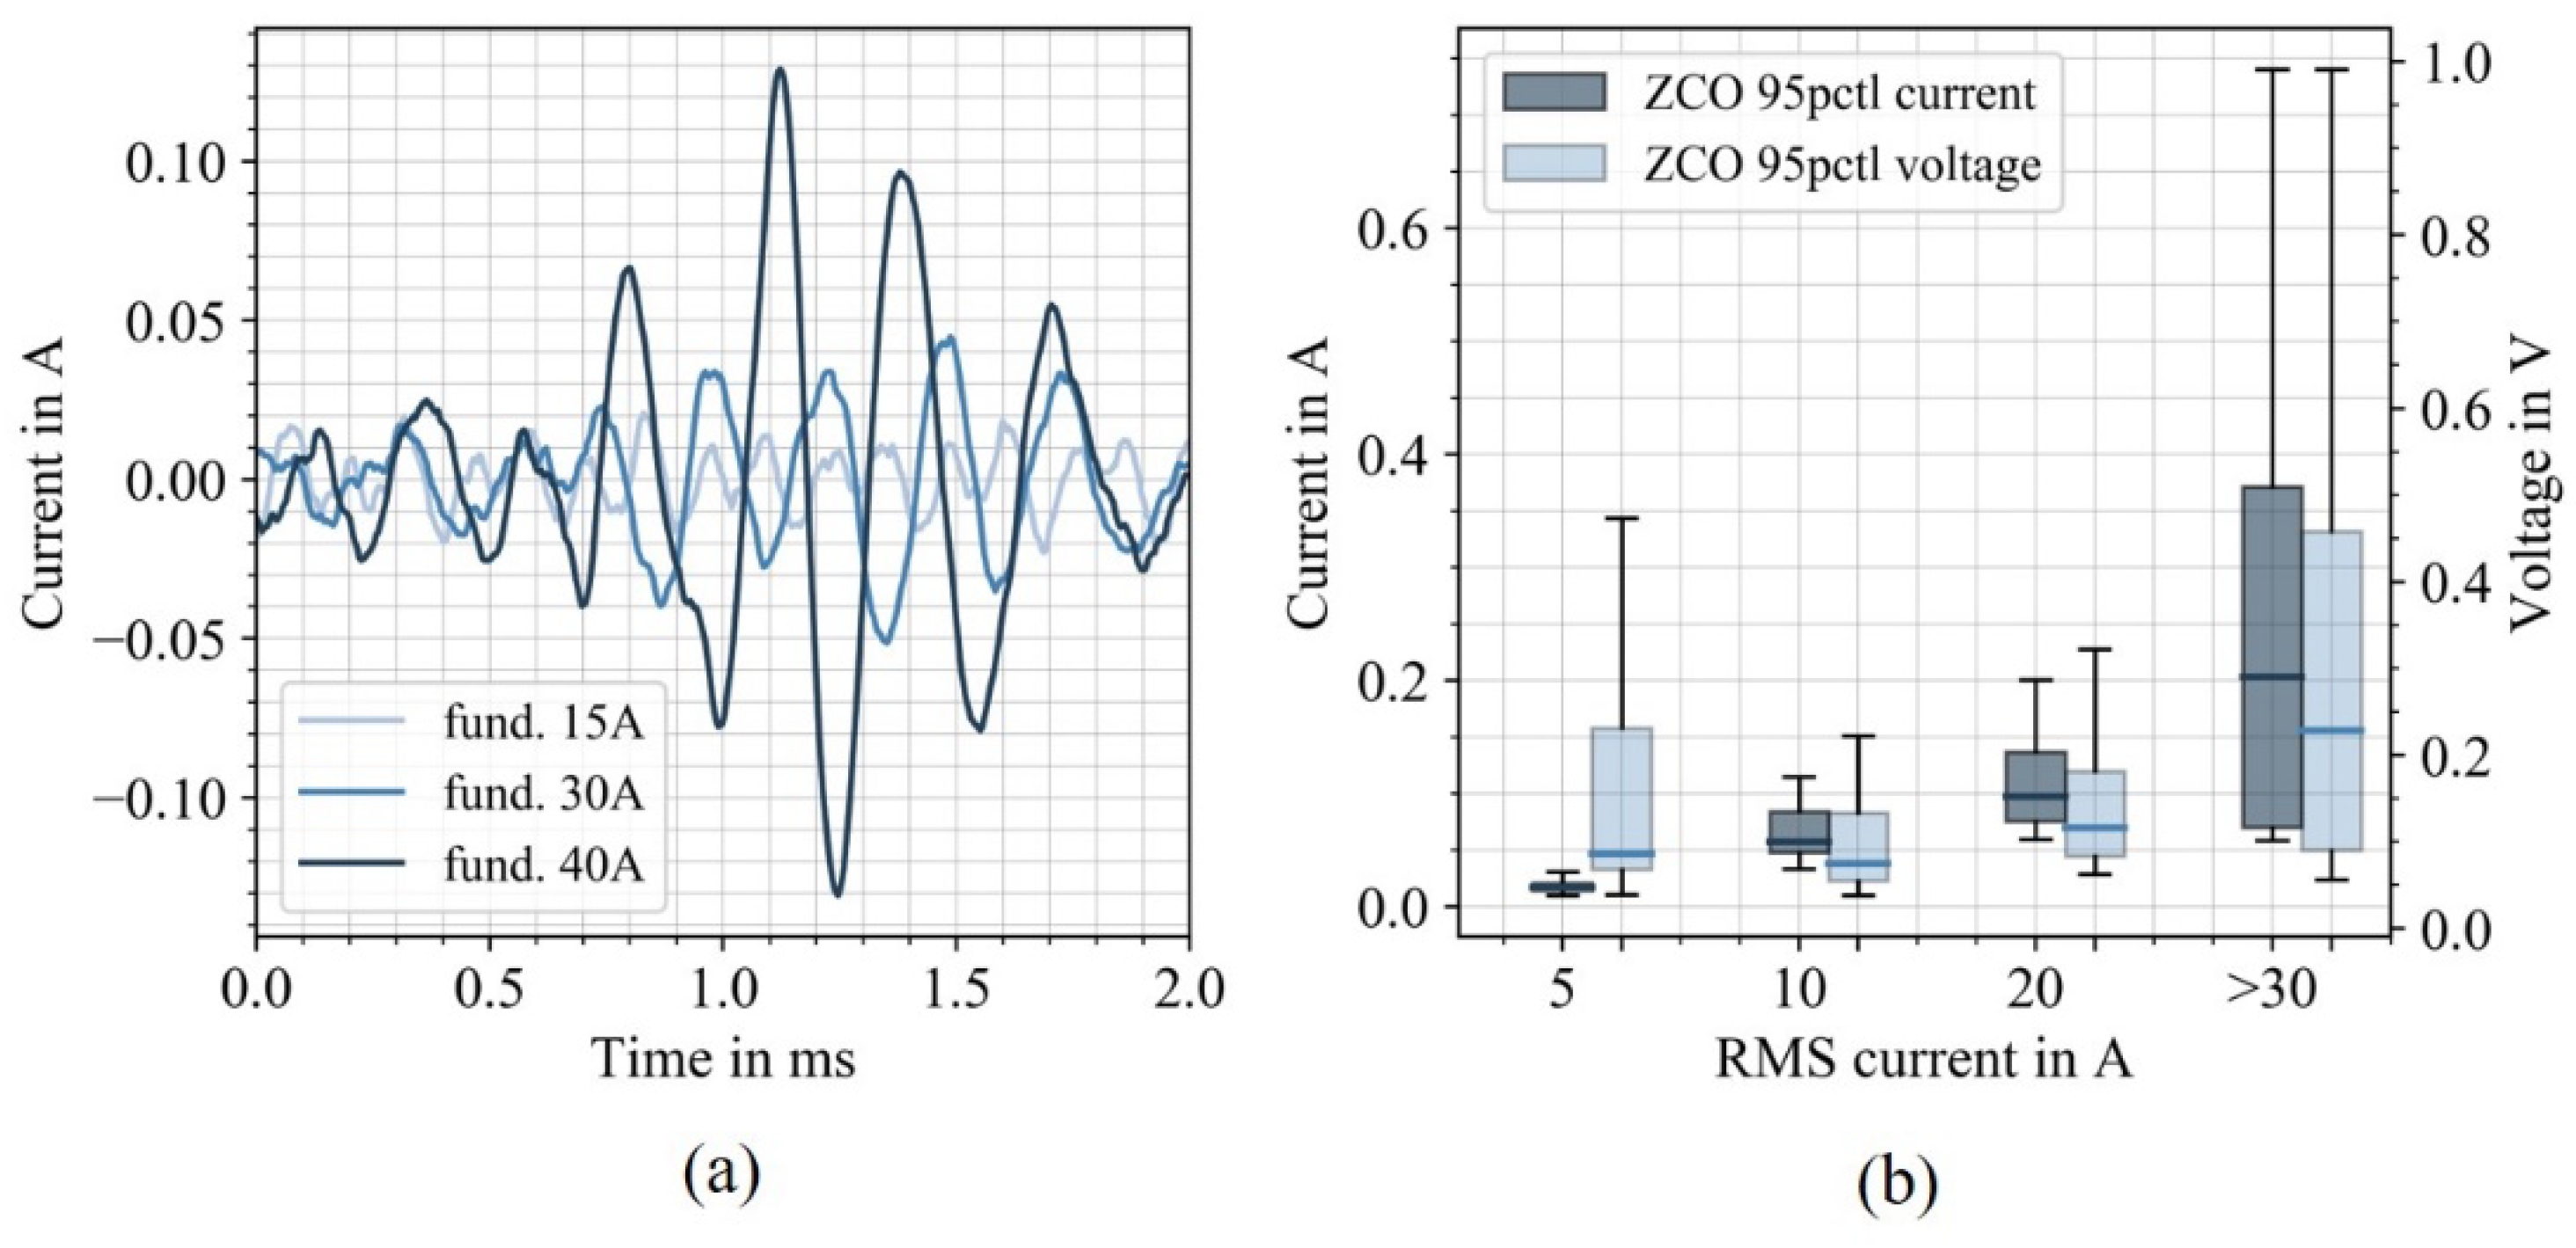
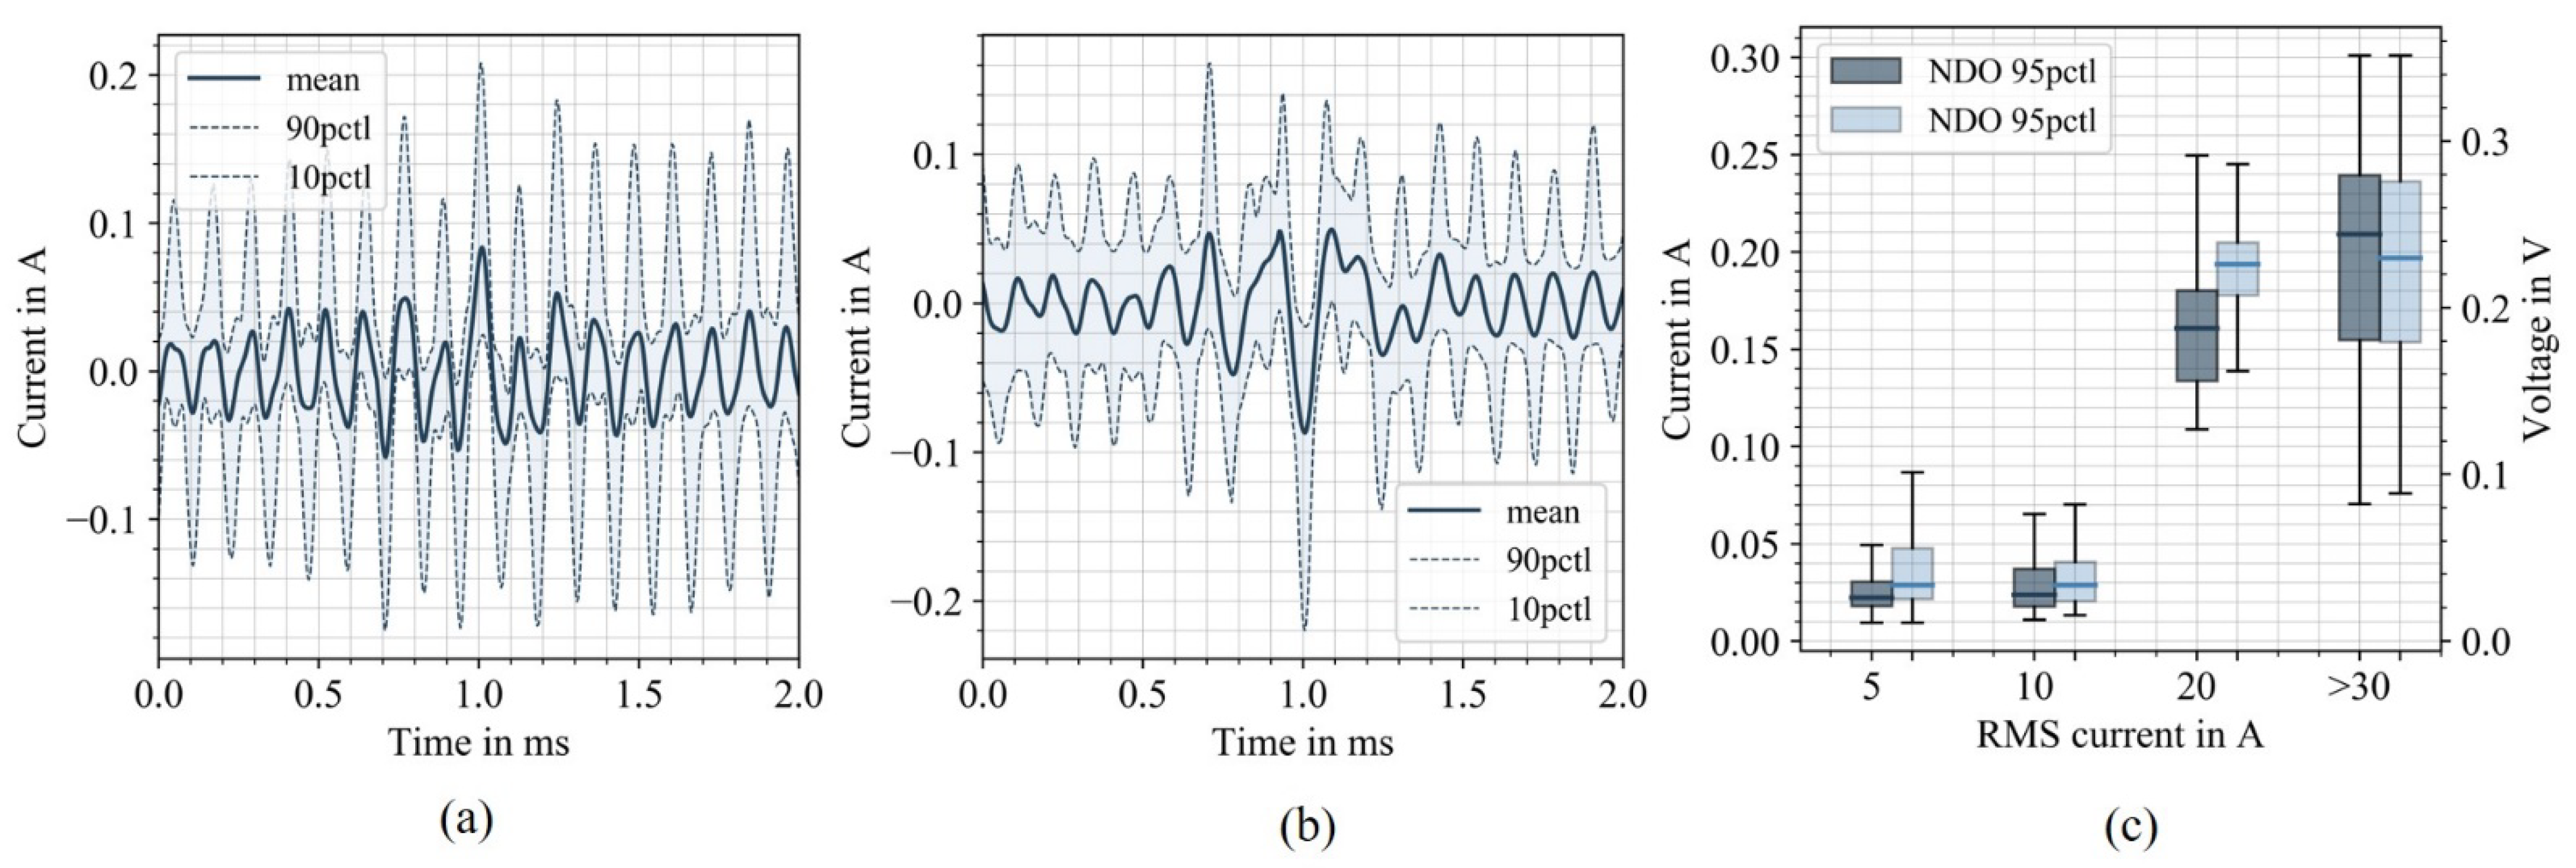
3.4. Statistical Properties of the Supraharmonic Distortion in Time Domain

In order to fully characterize the Supraharmonic emission, the time-domain properties of the distortion should be considered as well [36,37]. The evaluation of the time-domain characteristics requires a high pass filter, removing the frequency components below 2 kHz. In a laboratory environment, the general procedure is to analyze a snapshot of the filtered signal from a Supraharmonic source with an oscilloscope. However, with the aforementioned large number of influencing factors on the Supraharmonic emission in field (e.g., varying grid impedance and unbalance), a “one point in time” snapshot does not adequately describe the distortions. The long-term in-field monitoring of Supraharmonics in a time domain, continuously processing the filtered signals in order to describe its statistical properties, has not been carried out yet to the knowledge of the authors. Filtering, processing, and storing 200-ms time-domain signals of the three-phase voltage and current in high resolution over longer time periods is a challenging task. It drastically increases the hardware and software demands of the meters and requires efficient processing of large data sizes with limited resources. Storing each filtered waveform would require significant storage capacities on the measurement devices and reduce the possible monitoring duration. However, in the scope of this work, an event detection for Supraharmonic short-duration oscillations was implemented utilizing an edge processing monitoring approach [55]. The installed measurement equipment processed the properties of short-duration oscillations locally on the meter and only sent compressed results, such as statistical features of the distorted waveforms, to the monitoring server. A 7th-order Butterworth high pass filter with a cut-off frequency of 2.5 kHz was implemented on each measurement device. Large deviations within the filtered 200-ms time signal for current and voltage were detected with an anomaly detection algorithm. Within the measurement period, over several hundred thousand (>10 TB) events were detected for each of the monitored sites. By analyzing the characteristics of the large number of events, the oscillation properties of in-field environments can be described with statistical relevance.
Figure 9 illustrates a typical event detected during an EV charging process. Figure 9a shows the fundamental voltage and current signal over three power system periods (50Hz), while (b) represents the high-pass filtered current signal for the corresponding time period. Figure 9c displays the first oscillation present in Figure 9b on a shorter time scale. The current signal in Figure 9a is slightly shifted in phase, showing repeating distortions located at the positive and negative peaks, also referred to as non-damped oscillations (NDO) [4].
These oscillations have high frequency components and are consequently present within the filtered signal displayed in Figure 9b at the 15-ms, 35-ms, and 55-ms marks. Figure 9b also displays repeating peaks with each cycle at zero crossings of the fundamental current. The zero crossing oscillations (ZCO) are emitted from power electronic devices and can be associated with the switching use in active power factor correction circuits [56,57]. Both distortion types (ZCO and NDO) were observed at each site while an EV was connected and charging. The oscillation phenomena are repeating for every power system cycle. Depending on the EVs grid side EMC filter configuration, the presence of the oscillations can result in different types of interference. The ZCO can create a resonant response between the grid impedance and EV filter capacitor. This has been shown for PV inverters in [58,59], where a large number of parallel inverters cause significant voltage distortions disturbing neighboring equipment. Consequences of oscillations superimposed on the fundamental current include malfunction of equipment, blown power supply units, interference with electronic controls, or unacceptable noise levels [59].
At the monitored sites, the majority of detected events (>95%) were triggered during EV charging processes and contained ZCO and NDO distortions. Each event contained the filtered 10 period signal of voltage and current, including 20 ZCO. Each ZCO present in the event signal was segmented and different statistical features were extracted. Figure 10 displays the arithmetic means, 10th and 90th percentiles for each ZCO at site B for the different phases. Figure 10a–c shows the typical waveforms of ZCO and the ranges in peak magnitudes. The shapes differ between the phases, higher magnitudes are visible for the phases 1 and phase 3. For phase 1, the detected events show a high uniformity with only narrow deviations compared to the other phases. This could indicate that the same Supraharmonic sources (EV model) were connected to phase 1, and external influences were smaller compared to the other phases. Due to the high variability between the events, generalizations regarding the shape of the ZCO are difficult.
The damping depends on various factors such as grid impedance at the corresponding frequency and the inverter causing the distortion. However, the magnitudes significantly increase with rising fundamental current. Figure 11a displays three ZCO measured at different fundamental currents. The individual peaks of the oscillation rise with higher fundamental currents, i.e., with the number of charging EVs. This relation is illustrated in Figure 11b, where the distribution of the 95th current and voltages percentiles of the detected ZCO are displayed with the fundamental current in 10 A bins.
With an increasing fundamental current, the average and maximum 95th percentiles peaks of the ZCO rise significantly, which also applies for the ZCO voltages. This linear relationship could be a serious challenge for the successful integration of a large number of EVs in distribution networks. The increasing number of parallel EVs charging the risk of interference due to the high ZCO current peaks, leads to repeating every power system cycle. Especially when considering the extent of ZCO currents with the relatively low number of EVs at the monitored sites. The statistical properties of the NDO are displayed in Figure 12 for the NDO appearing at the negative peaks (a) and positive peaks (b) of the fundamental current. The figures display the arithmetic means, the 10th and 90th percentiles of the segmented NDO for one phase at site B over a 2-ms time window. Both figures have distinctive peaks (1 ms) at the corresponding maximum and minimum value of the fundamental current. The magnitudes of the peaks are lower compared to the ZCO. The variation in the distribution before and after the peaks indicate a superimposed high frequency component. This frequency component could originate from a switching pattern of the active power factor correction integrated in the EV inverter circuit.
Figure 12c displays the distribution of the 95th percentiles of the individual NDO for separate fundamental currents. For higher fundamental currents, the 95th percentiles increase significantly. However, this linear relationship was not seen for all phases and could not be generally shown. This might be dependent for the charging vehicles and requires further investigation.

4. Conclusions

In this work, the long-term Supraharmonic emission of three different sized EV charging infrastructures was analyzed in time and frequency domain. At the monitored sites, multiple cases of unintended charge process interruptions (UCI) were identified. Under certain load configurations, vehicles disconnected from the charging point in the presence of high harmonic distortion. By limiting the charge current, the distortion levels were reduced, which enabled stable charging. This indicates that reducing the charge current for EVs for certain time periods by a charge management system could prevent the observed interruptions. Since the power quality during the occurrences of the UCIs was within the normative limits, the increasing distortion in distribution grids could result in more interference in the future, considering a large-scale integration of EVs. In frequency domain, the statistical properties of the aggregated 200 Hz RMS Supraharmonics were utilized to investigate the influence of elevated background emission, neutral current distortion, and the impact of varying EV charging demand for the individual phases and sites. In order to analyze the time domain properties of the distortions, generally only carried out within laboratory environments, a high pass filter with an integrated continuous event detection algorithm was implemented on the measurement devices. This allowed the statistical analysis of several hundred thousand zero crossing and non-damped oscillations events, caused by the charging EVs.
Supraharmonics in the form of background distortion, unrelated to the connected EVs, varied between the phases and had a major influence on the site’s emission behavior. Phases with elevated background distortion levels showed the highest emission in combination with the switching frequencies of the EV inverters. Sites with varying Supraharmonic emission between the phases, due to background distortion, showed less cancellation in the neutral conductor. While the TSHC increased with the number of connected EVs, the offset in distortion levels between the phases remained. Although the distortion generally increased with the number of connected vehicles, a damping effect could be observed for phases with elevated background distortion. In time domain, the zero-crossing oscillation and non-damped oscillation were found to be the driving factor of distortion generated from the EVs. The distributions of the segmented zero crossing oscillations showed 2–3 distinctive peaks, with varying magnitude and damping. Considering these linear relationships in respect to the extent of Supraharmonic distortion at sites with relatively low numbers of charging points and vehicles, increasing distortions levels should be expected in future distortion grids. With the proliferation of EVs, intelligent charging infrastructure with the ability to reduce unbalance should be utilized to mitigate the Supraharmonic distortion to some extent.

Author Contributions

Conceptualization, T.S.; methodology, T.S. and C.K.; software, T.S.; validation, C.K., A.E. and K.R.; formal analysis, T.S.; investigation, T.S.; resources, T.S.; data curation, T.S.; writing—original draft preparation, T.S.; writing—review and editing, T.S., K.R., C.K. and A.E.; visualization, T.S.; supervision, K.R. and C.K.; project administration, K.R. All authors have read and agreed to the published version of the manuscript.

Funding

This research was funded by the Ministry of Environment, Climate Protection and the Energy Sector Baden-Württemberg grant number BWINP 19005 And the APC was funded by University of Stuttgart Open Access.

Conflicts of Interest

There are no conflicts of interest.

Appendix A

Table A1. Distortion parameters during the occurrence of UCIs. The table shows RMS measurements aggregated with a 1-s interval.
PropertyPhase 1Phase 2Phase 3
THDU arithmetic mean in%1.92.21.7
THDU 95th percentile in %2.02.31.8
THDU maximum in %2.22.41.9
THDD arithmetic mean in %12.920.218.2
THDD 95th percentile in %13.621.920.6
THDD maximum in %17.924.722.8
THDU: Total harmonic distortion THDD: Total harmonic demand distortion (nominal current of 16 A).

Appendix B

Figure A1. Fluctuation in reactive power prior to the UCI (a). Arithmetic means of Supraharmonic currents for the three phases prior to the UCI (b).
Energies 15 00394 g0a1

Appendix C

Figure A2. Arithmetic means of the voltage Supraharmonics for the monitored sites.
Energies 15 00394 g0a2

Appendix D

Figure A3. Average LFH for phase 1 at site A (a), site B (b), and site C (c) up to 2 kHz.
Energies 15 00394 g0a3

References

  1. KBA Ministry Germany. Vehicle Registrations in December 2020; KBA Annual Balance Sheet: Berlin, Germany, 2021. [Google Scholar]
  2. Zavoda, F.; Rönnberg, S.; Bollen, M.; Meyer, J.; Langella, R.; Djokic, S.Z.; Moreno-Munoz, A.; Das, R.; Zhong, J.; Ciufo, P.; et al. Power Quality and EMC Issues with Future Electricity Networks; CIRED Joint Working Group C2.24, CIGRE Technical Brochure Vol. 719; CIGRE: Paris, France, 2018. [Google Scholar]
  3. Bollen, M.; Olofsson, M.; Larsson, A.; Rönnberg, S.; Lundmark, M. Standards for Supraharmonics (2 to 150 kHz). IEEE Electromagn. Compat. Mag. 2016, 3, 114–119. [Google Scholar] [CrossRef]
  4. Lundmark, M. The Zone Concept–Design of Low-Voltage Installations Considering the Spread of High Frequency Harmonics. Ph.D. Thesis, Luleå University of Technology, Lulea, Sweden, 2010. [Google Scholar]
  5. Lundmark, M.; Larrson, A.; Bollen, M. Required changes in emission standards for high frequency noise in power systems. Int. J. Technol. Policy 2006, 4, 19–36. [Google Scholar] [CrossRef]
  6. IEC. IEC Electromagnetic Compatibility (EMC)—Part 2-2 IEC Std. 61000 2-2 Ed2 A1/CD, Environment—Compatibility Levels for Low-Frequency Conducted Disturbances and Signaling in Low-Voltage Power Supply Systems; IEC 61000-2-2:2018; IEC: Geneva, Suisse, 2018. [Google Scholar]
  7. Mendes, T.; Duque, C.; Meyer, J. Comparative analysis of the measurement methods for the supraharmonic range. Int. J. Electr. Power Energy Syst. 2020, 118, 105801. [Google Scholar] [CrossRef]
  8. Klatt, M.; Meyer, J.; Schegner, P. Comparison of measurement methods for the frequency range of 2 kHz to 150 kHz. In Proceedings of the 16th International Conference on Harmonics and Quality of Power (ICHQP), Bucharest, Romania, 25–28 May 2014. [Google Scholar]
  9. Larsson, A. On High Frequency Distortion in Low-Voltage Power Systems. Ph.D. Thesis, Luleå University of Technology, Lulea, Sweden, 2011. [Google Scholar]
  10. Larsson, A.; Bollen, M. Measurements of High-Frequency (2–150 kHz) Distortion in Low-Voltage Networks. IEEE Trans. Power Deliv. 2010, 25, 1749–1757. [Google Scholar] [CrossRef]
  11. Alfalahi, S.T.Y.; Alkahtani, A.A.; Al-Shetwi, A.Q.; Al-Ogaili, A.S.; Abbood, A.A.; Bin Mansor, M.; Fazea, Y. Supraharmonics in Power Grid: Identification, Standards, and Measurement Techniques. IEEE Access 2021, 9, 103677–103690. [Google Scholar] [CrossRef]
  12. Ritzmann, D.; Lodetti, S.; De La Vega, D.; Khokhlov, V.; Gallarreta, A.; Wright, P.; Meyer, J.; Fernández, I.; Klingbeil, D. Comparison of Measurement Methods for 2–150-kHz Conducted Emissions in Power Networks. IEEE Trans. Instrum. Meas. 2020, 70, 1–10. [Google Scholar] [CrossRef]
  13. Carpinelli, G.; Bracale, A.; Varilone, P.; Khokhlov, V.; Gallarreta, A.; Wright, P.; Meyer, J.; Fernandez, I.; Klingbeil, D. A New Advanced Method for an Accurate Assessment of Harmonic and Supraharmonic Distortion in Power System Waveforms. IEEE Access 2021, 9, 88685–88698. [Google Scholar] [CrossRef]
  14. Agudelo-Martinez, D.; Pavas, A.; Blanco, A.M.; Stiegler, R.; Meyer, J. Influence of the Measurement Setup on the Emission of Devices in the Frequency Range 2–150 kHz; IEEE PowerTech: Milan, Italy, 2019. [Google Scholar]
  15. CENELEC. IEC SC 205—A Study Report on Electromagnetic Interference between Electrical Equipment/Systems in the Frequency Range below 150 kHz; CENELEC: Dublin, Ireland, 2014. [Google Scholar]
  16. Lundmark, M.; Larrson, A.; Bollen, M. Harmonics and high-frequency emission by small end user equipment. In Proceedings of the IEEE International Conference on Harmonics and Quality of Power, Cascais, Portugal, 1–6 October 2006. [Google Scholar]
  17. Slangen, T.M.H.; Van Wijk, T.; Cuk, V.; Cobben, J.F.G. The Harmonic and Supraharmonic Emission of Battery Electric Vehicles in The Netherland. In Proceedings of the International Conference on Smart Energy Systems and Technologies (SEST), Istanbul, Turkey, 7–9 September 2020. [Google Scholar]
  18. Darmawardana, D.; David, J.; Perera, S.; Robinson, D.; Meyer, J.; Jayatunga, U. Analysis of High Frequency (Supraharmonics) Emission Caused by Electric Vehicle Charging. In Proceedings of the 19th International Conference on Harmonics and Quality of Power (ICHQP), Dubai, UAE, 6–7 July 2020. [Google Scholar]
  19. Bollen, M.; Rönnberg, S. Primary and Secondary Harmonics Emission; Harmonic Interaction–a Set of Definitions. In Proceedings of the International Conference on Harmonics and Quality of Power, Belo Horizonte, Brazil, 16–19 October 2016. [Google Scholar]
  20. Waniek, C.; Wohlfahrt, T.; Meyer, J.; Klatt, M.; Schegner, P. Supraharmonics, Root Causes and Interactions between Multiple Devices and the Low Voltage Grid. In Proceedings of the IEEE PES Innovative Smart Grid Technologies Conference Europe (ISGT-Europe), Torino, Italy, 26–29 September 2017. [Google Scholar]
  21. de Castro, G.G.; Larrson, A.S. Rönnberg, M. Bollen, LED lamps in different EMC environments. In Proceedings of the 23rd International Conference on Electricity Distribution (CIRED), Lyon, France, 15–18 June 2015. [Google Scholar]
  22. de Castro, A.G.; Rönnberg, S. A study about harmonic interaction between devices. In Proceedings of the 16th International Conference on Harmonics and Quality of Power (ICHQP), Bucharest, Romania, 25–28 May 2014. [Google Scholar]
  23. Leferink, F.; Keyer, C.; Melentjev, A. Static Energy Meter Errors Caused by Conducted Electromagnetic Interference. IEEE EMCS Mag. 2016, 5, 49–55. [Google Scholar] [CrossRef] [Green Version]
  24. Körner, P.; Stieger, R.; Meyer, J.; Wohlfahrt, T.; Waniek, C.; Myrzik, J.M.A. Acoustic Noise of Mass-market Equipment caused by Supraharmonics in the Frequency Range 2 to 20 kHz. In Proceedings of the 18th International Conference on Harmonics and Quality of Power (ICHQP), Ljubljana, Slovenia, 13–16 May 2018. [Google Scholar]
  25. Vines, R.; Trussel, H.; Gale, I. Noise on residential power distribution circuits. IEEE Trans. Electromagn. Compat. EMC 1984, 26, 161–168. [Google Scholar] [CrossRef]
  26. Novitskiy, A.; Schlegel, S.; Westermann, D. Estimation of Power Losses Caused by Supraharmonics. Energy Syst. Res. 2020, 3, 28–36. [Google Scholar] [CrossRef]
  27. Wohlfahrt, T.; Warniek, C.; Meyer, J.; Schegner, P. Supraharmonics Disturbances: Lifetime Reduction of Electronic Mass-Market Equipment by the Aging of Electrolytic Capacitors. In Proceedings of the 18th International Conference on Harmonics and Quality of Power (ICHQP), Ljubljana, Slovenia, 13–16 May 2018. [Google Scholar]
  28. Moreno-Munoz, A.; Castro, A.D.R.G.D.; Romero-Cavadal, E.; Rönnberg, S.; Bollen, M. Supraharmonics (2 to 150 kHz) and multi-level converters. In Proceedings of the 5th International Conference on Power Engineering, Energy and Electrical Drives (POWERENG), Riga, Latvia, 11–13 May 2015. [Google Scholar]
  29. Darmawardana, D.; Perera, S.; Meyer, J.; Meyer, J.; Jayatunga, U. Impact of High Frequency Emissions (2-150 kHz) on Lifetime Degradation of Electrolytic Capacitors in Grid Connected Equipment. In Proceedings of the IEEE Power and Energy Society General Meeting, Atlanta, GE, USA, 4–8 August 2019. [Google Scholar]
  30. Klatt, M.; Meyer, J.; Schegner, P.; Lakenbring, C. Characterization of Supraharmonic Emission caused by small Photovoltaic Inverters. In Proceedings of the Mediterranean Conference on Power Generation, Transmission, Distribution and Energy Conversion, Belgrade, Serbia, 6–9 November 2016. [Google Scholar]
  31. Bollen, M.; Meyer, J.; Amaris, H.; Blaco, A. Future Work on Harmonics–Some Expert Opinions Part II -Supraharmonics, Standards and Measurements. In Proceedings of the 16th International Conference on Harmonics and Quality of Power (ICHQP), Bucharest, Romania, 25–28 May 2014. [Google Scholar]
  32. Novitskiy, A.; Schlegel, S.; Westermann, D. Measurements and Analysis of Supraharmonic Influences in a MV/LV Network Containing Renewable Energy Sources. In Proceedings of the Electric Power Quality and Supply Reliability Conference (PQ) & 2019 Symposium on Electrical Engineering and Mechatronics (SEEM), Kardla, Estonia, 12–15 June 2019. [Google Scholar]
  33. Rönnberg, S.; Bollen, M.; Larsson, A. Emission from small scale PV-installations on the low voltage grid. In Proceedings of the International Conference on Renewable Energies and Power Quality (ICREPQ), Cordoba, Spain, 28–30 July 2014. [Google Scholar]
  34. Larsson, A.; Lundmark, C.; Bollen, M. Measurement of current taken by fluorescent lights in the frequency range 2–150 kHz. In Proceedings of the IEEE Power Engineering Society General Meeting, Montreal, QC, Canada, 18–22 June 2006. [Google Scholar]
  35. Rönnberg, S.; Bollen, M. Total conducted emission from a customer in the frequency range 2 to 150 kHz with different types of lightning. In Proceedings of the CIRED 21 International Conference on Electriciy Distribution, Frankfurt, Germany, 6–9 June 2011. [Google Scholar]
  36. Grevener, A.; Meyer, J.; Rönnberg, S.; Bollen, M. Survey of supraharmonic emission of household appliances. In Proceedings of the 24th International Conference & Exhibition on Electricity Distribution (CIRED), Glasgow, UK, 12–15 June 2017. [Google Scholar]
  37. Blanco, A.M.; Moller, F.; Meyer, J.; Schegner, P. Characterization of the leakage currents produced by household electronic devices. In Proceedings of the International Conference on Harmonics and Quality of Power (ICHQP), Dubai, UAE, 6–7 July 2020. [Google Scholar]
  38. Espin-Delgado, A.; Busatto, T.; Ravindran, V.; Rönnberg, S.K.; Meyer, J. Evaluation of Supraharmonic Propagation in LV Networks Based on the Impedance Changes Created by Household Devices. In Proceedings of the IEEE PES Innovative Smart Grid Technologies Europe, The Hague, The Netherlands, 26–28 October 2020. [Google Scholar]
  39. Rönnberg, S.; Lundmark, M.; Bollen, M. Attenuation and noise level–Potential Problems with Communication via Power Grid. In Proceedings of the 19th International Conference on Electricity Distribution (CIRED), Vienna, Austria, 21–24 May 2007. [Google Scholar]
  40. Rönnberg, S. Emission and Interaction from Domestic Installations in the Low Voltage Electricity Network, up to 150 kHz. Ph.D. Thesis, Luleå University of Technology, Lulea, Sweden, 28–30 July 2013. [Google Scholar]
  41. Rönnberg, S.; Bollen, M. Harmonic emission before and after changing to LED and CFL–Part I: Laboratory measurements for a domestic customer. In Proceedings of the IEEE International Conference on Harmonics and Quality of Power (ICHQP), Bergamo, Italy, 26–29 September 2010. [Google Scholar]
  42. Rönnberg, S.; Wahlberg, M.; Larsson, A.; Bollen, M.; Lundmark, M. Interaction between equipment and power line communication: 9–95 kHz. In Proceedings of the IEEE Powertech, Bucharest, Romania, 28 June–2 July 2009. [Google Scholar]
  43. Rönnberg, S.; Wahlberg, M.; Bollen, M. Interaction between narrowband power line communication and end-user equipment. IEEE Trans. Power Deliv. 2011, 26, 2034–2039. [Google Scholar] [CrossRef]
  44. Espin-Delgado, S.; Letha, S.; Rönnberg, S.; Bollen, M. Failure of MV Cable Terminations due to Supraharmonics Voltages: A Risk Indicator. IEEE Open J. Ind. Appl. 2020, 1, 42–51. [Google Scholar]
  45. Arigalla; Watson, J. Power System Harmonics, 2nd ed.; Wiley: Chichester, UK, 2003. [Google Scholar]
  46. Lundmark, M.; Larsson, E.; Bollen, M. Unintended consequences of limiting high frequency emission by small end-user equipment. In Proceedings of the IEEE Power Engineering Society General Meeting, Montreal, QC, Canada, 18–22 June 2006. [Google Scholar]
  47. Schöttke, S.; Meyer, J.; Schegner, P.; Bachmann, S. Emission in the Frequency Range of 2 kHz to 150 kHz caused by electric vehicle charging. In Proceedings of the 2014 International Symposium on Electromagnetic Combability (EMC Europe 2014), Gothenburg, Sweden, 1–4 September 2014. [Google Scholar]
  48. de Castro, A.G.; Bollen, M. Harmonic Interaction between and electric vehicle and different domestic equipment. In Proceedings of the 2014 International Symposium on Electromagnetic Compability (EMC Europe 2014), Gothenburg, Sweden, 1–4 September 2014. [Google Scholar]
  49. Meyer, J.; Klatt, K.; Schegner, P. Power quality challenges in future distribution networks. In Proceedings of the 2nd IEEE PES International Conference and Exhibition on Innovative Smart Grid Technologies (ISGT Europe), Manchester, UK, 5–7 December 2011. [Google Scholar]
  50. IEC. Standard IEC 61000-4-7: Electromagnetic Compability (EMC)—Testing and Measurement Techniques—General Guide on Harmonics and Interharmonics Measurements and Instrumentation, for Power Supply Systems and Equipment Connected Thereto; IEC: Geneva, Switzerland, 2009. [Google Scholar]
  51. IEC. Standard IEC 61000-4-30: Electromagnetic Compability (EMC)—Testing and Measurement Techniques—Power Quality Measurement Methods; IEC: Geneva, Switzerland, 2012. [Google Scholar]
  52. DIN. Standard EN 50160: Voltage Characteristics of Electricity Supplied by Public Electricity Networks; German Version EN 50160:2010; DIN: Berlin, Germany, 2015. [Google Scholar]
  53. Sutaria, J.; Espin-Delgado, A.; Rönnberg, S. Summation of Supraharmonics in Neutral for Three-Phase Four-Wire System. IEEE Open J. Ind. Appl. 2020, 1, 148–156. [Google Scholar] [CrossRef]
  54. Desmet, J.; Sweertvaegher, I.; Vanalme, G.; Stockman, K.; Belmans, R. Analysis of the neutral conductor current in a three-phase supplied network with nonlinear single phase loads. IEEE Trans. Ind. Appl. 2003, 39, 587–593. [Google Scholar] [CrossRef]
  55. Streubel, T.; Kattmann, C.; Eisenmann, A.; Rudion, K. Site Indices for High Frequency Harmonics for Long Term Power Quality Monitoring. In Proceedings of the CIRED Conference, Geneva, Suisse, 20–23 September 2021; Available online: https://www.cired2021.org/media/2000/cired-virtual-special-report.pdf (accessed on 2 November 2021).
  56. Müller, S.; Möller, F.; Meyer, J.; Schegner, P. Impact of Large-Scale Integration of E-Mobility and Photovoltaics on Power Quality in Low Voltage Networks. In Proceedings of the International ETG Congress, Bonn, Germany, 28–29 November 2017. [Google Scholar]
  57. Rönnberg, S.; Bollen, M.; Amar, H.; Change, G.; Gu, I.; Kocewiak, Ł.; Meyer, J.; Olofsson, M.; Ribeiro, P.; Desmet, J. On waveform distortion in the frequency range of 2 kHz-150 kHz–Review and research challenges. Electr. Power Syst. Res. 2017, 150, 1–10. [Google Scholar] [CrossRef]
  58. Kotsopoulos, A.; Heskes, P.; Jansen, M. Zero Crossing Distortion in Grid Connected PV Inverters. In Proceedings of the IEEE 2002 28th Annual Conference of the Industrial Electronics Society, Sevilla, Spain, 5–8 November 2002. [Google Scholar]
  59. Unger, C.; Krüger, K.; Sonnenschein, M.; Zurowski, R. Disturbances due to voltage distortion in the kHz range–Experiences and Mitigation Measures. In Proceedings of the CIRED 18th International, Interaction between Narrowband Power Line Communication and End-User Equipment, Turin, Italy, 6–9 June 2005. [Google Scholar]
Figure 1. Topology for the individual monitored sites A (a), site B (b), and site C (c) with the corresponding measurement locations.
Energies 15 00394 g001
Figure 2. RMS current of the three phases during the occurrences of the UCIs (a). Corresponding trend of the total Supraharmonic current (TSHC) (b). Waveform of voltage and current during the disconnection of the vehicle from the charging point (c).
Energies 15 00394 g002
Figure 3. RMS current of a second case of a vehicle able to initialize stable charging with CCL (a). Power factor of the vehicle during the charging process (b).
Energies 15 00394 g003
Figure 4. Typical daily trend of active power at site A for the different phases with the mean over all measurements (a). Arithmetic mean of the active power drawn by the EVs over the course of the measurement period for the different sites (b). Percentage of the active power for the individual phases and sites (c).
Energies 15 00394 g004
Figure 5. Aggregated statistical properties of all Supraharmonic currents recorded at the different sites over the entire measurement duration from 2 to 150 kHz. (a) refers to site A, (b) refers to site B, and (c) refers to site C.
Energies 15 00394 g005
Figure 6. Arithmetic means of the Supraharmonic distortion while EVs were connected (EV connected) compared to the background distortion (BD, no EVs connected) for the individual site A (a), site B (b), and site C (c).
Energies 15 00394 g006
Figure 7. TSHC means and 95th percentiles for different RMS current bin for the individual phases at site A (a), site B (b), and site C (c).
Energies 15 00394 g007
Figure 8. Impact of the connection of a single and two EVs of the model Z on the Supraharmonic distortion on phase 1 (a) and phase 3 (b). (c) Damping effect of the EV on the background distortion visualized in a spectrogram.
Energies 15 00394 g008
Figure 9. Voltage and current signal during the charting of an EV over three power system cycles (a). Filtered current signal containing Supraharmonic frequency components over the corresponding three periods (b). A current oscillation displayed on a shorter time scale (c).
Energies 15 00394 g009
Figure 10. Statistical properties of the filtered ZCO detected in phase 1 (a). Statistical properties of the filtered ZCO detected in phase 2 (b). Statistical properties of the filtered ZCO detected in phase 3 (c).
Energies 15 00394 g010
Figure 11. ZCO waveforms for different fundamental currents (a). Distribution of 95th percentiles of currents and voltages from the ZCO detected at different fundamental currents in 10 A bins (b).
Energies 15 00394 g011
Figure 12. Distribution of NDO for the positive fundamental current peaks (a). Distribution of the negative fundamental current peaks (b). Distribution of 95th percentiles of currents and voltages from the NDO detected at different fundamental currents in 10 A bins (c).
Energies 15 00394 g012
Table 1. Further details for the monitored sites.
PropertySite ASite BSite C
Charging points142010
Charge typeAC type 2AC type 2AC type 2
AccessibilityRestricted to company vehiclesPublic parkingRestricted to company vehicles
Parking infrastructure locationLocated below an office buildingLocated below an office buildingParking garage in an urban area
Charge-related complaintsYesYesNo
Table 2. Summary of results for each site in frequency domain.
PropertySite ASite BSite C
Interruptions of charge processesyesyesnot detected
Compliance with EN 50160 [51]yesyesyes
Supraharmonic distortion in compliance with IEC 61000-2-2 [6]yesyesyes
Max. magnitude of Supraharmonic current108 dBµA103 dBµA114 dBµA
Max. magnitude of Supraharmonic voltage114 dBµV100 dBµV104 dBµV
Cancellation effect observedyesnono
Background distortion 2–10 kHzhighestlowestintermediate
Low frequency harmonicshighestlowestintermediate
Frequency ranges strongly correlated with the charge current2–10 kHz2–8 kHz2–8 kHz
Publisher’s Note: MDPI stays neutral with regard to jurisdictional claims in published maps and institutional affiliations.

