Article

Planning and Energy–Economy–Environment–Security Evaluation Methods for Municipal Energy Systems in China under Targets of Peak Carbon Emissions and Carbon Neutrality

Institute of Electrical Engineering, Chinese Academy of Sciences, Beijing 100190, China
*
Author to whom correspondence should be addressed.
Energies 2022, 15(19), 7443; https://doi.org/10.3390/en15197443
Submission received: 13 September 2022 / Revised: 22 September 2022 / Accepted: 4 October 2022 / Published: 10 October 2022

Abstract

:
In order to mitigate the negative effects of global climate change, the Chinese government has committed to achieving peak carbon emissions by 2030 and carbon neutrality by 2060. Since municipal cities are the bottom administrative level for drawing up development plans, it is necessary and important to conduct decarbonization pathway research on municipal energy systems (MESs). However, there is little research on decarbonization at the municipal level, and the impact of development paths in each forecast scenario is mostly based on expert evaluation and qualitative assessment. Therefore, this study established a complete decarbonization framework for MESs, including general research procedures, models, and a sustainable evaluation method. The models of energy consumption and carbon emission were adapted and improved for MESs. In order to quantitatively evaluate the energy system development for each scenario, we proposed an energy–economy–environment–security (3E–S) evaluation method, in which principal component analysis (PCA) was adopted for multi-criterion decision making. According to the analysis results of the case city in Guangdong, this evaluation method was proved to be an effective way to identify the factors that may influence coordinated development. By adjusting the relevant parameters and factors in the model, the optimal decarbonization pathway can be found to promote sustainable and coordinated development, thus helping government decision makers to quantitatively evaluate planning paths.

1. Introduction

Global climate change is one of the greatest threats to human beings. In order to mitigate global warming, international communities have taken deliberate actions. The goal of the Paris Agreement is to limit global warming to well below 2 °C, preferably to 1.5 °C, compared to pre-industrial levels [1]. To achieve this long-term goal, countries aim to reach peak global greenhouse gas emissions as soon as possible, before attaining net-zero carbon emissions by the middle of the century. More than 17 countries and regions have submitted 2050 long-term strategies to the United Nations Framework Convention on Climate Change (UNFCC) Secretariat [2]. The number of countries with net-zero emissions pledges worldwide has shown a rapid increase, encompassing 48% of global emissions [3].
The goal of net-zero carbon emissions has risen to the level of national strategy in China, which committed to achieving peak carbon emissions by 2030 and carbon neutrality by 2060 [4]. Subsequently, introducing action plans for achieving peak carbon emissions by 2030 is required by the 14th Five-Year Plan (14th FYP) [5]. This is a great challenge for China. In 2020, China produced about 10.2 billion tonnes of carbon dioxide emissions [6], which accounted for 32% of global CO2 emissions. More than 80% of the national emissions were attributed to industry, industrial waste, and power generation [3]. This high proportion was largely ascribed to energy-intensive and emission-intensive industries, including steel, cement, and coal power production, which constitute the majority of China’s industrial sector. Thus, industry and power generation are the key fields for reducing emissions. It is also necessary to pay attention to the fields of transportation, building, and agriculture.
Hence, China must urgently achieve its decarbonization target, which will deeply affect energy system planning on the national, provincial, and municipal levels [7] for at least the next 40 years. On the policy side, the State Council of China issued two government documents [8,9] related to an implementation scheme for achieving peak carbon emissions. The purpose was to guide the formulation of carbon reduction plans at the provincial level. The provincial decarbonization goals are further divided on the municipal level on the basis of energy consumption, carbon emissions, and resource endowment. It is worth noting that municipal governments represent the bottom level for drawing up development plans and projects (such as the 14th FYP). Therefore, the decarbonization pathway planning methods of municipal energy systems (MESs) with the target of zero carbon are crucially important, as they will help municipal governments to formulate development plans scientifically, reasonably, and comprehensively.
Much research has focused on decarbonizing energy systems. However, the majority has been conducted at the national level [7,10]. As of now, at least 45 countries have explored and studied long-term, medium-term, or short-term carbon reduction planning for energy systems [11]. These studies have mainly concentrated on countries in Europe, Asia, and North American, such as the UK [12,13], China [7,14,15,16], the US [17,18], and India [19]. Some of these studies have considered a higher spatial resolution, at the provincial level [10,20]. Only a few have put special emphasis on the municipal level. Based on LEAP city model, Yingying Liu et al. [21] analyzed the obstacles and pathways to carbon neutrality for Beijing–Tianjin–Hebei and their surrounding cities under policy scenario (PO) and low-carbon scenario (LC). For different cities at various development levels, carbon capture and storage (CCS) technology, zero-carbon vehicles, and electrification play different roles in the process of achieving carbon neutrality. The key sectors for carbon reduction also differ depending on the type of city. The World Resources Institute and Nanjing University [2] jointly released an optimized peak carbon emissions roadmap and long-term vision for Suzhou by 2050. This report predicted the industrial structure, energy structure, power structure, and carbon emission pathway of Suzhou by 2050 using scenario analysis methodology. The 14th FYP and long-term suggestions for Suzhou’s low-carbon development in various fields were also put forward. Carbon reduction in an individual sector or a key industry is also a hot spot in decarbonization research. Extensive studies have been conducted on long-term pathways towards the deep decarbonization of power systems (or the power sector) [22,23,24,25,26], the building sector [27,28,29,30,31], the transport sector [32], the agricultural sector [33,34], the iron and steel industry [35], and other industries [36,37].
Various energy system models and scenario analyses have been adopted within the framework of decarbonization pathway research. However, the impact of development roadmaps in each forecast scenario is mostly based on expert evaluation and qualitative analysis. This is likely to result in many challenges related to uncoordinated development. For example, the excessive pursuit of high-speed economic development has led to a sharp increase in fossil energy consumption, which has caused adverse impacts on the environment in many developing countries [38]. Thus, coordinated and sustainable development in the energy, economy, and environment (3E) domains is crucial for countries and cities, especially during the decarbonization process [39,40,41,42,43]. The aim of 3E coordinated development is that the energy, economy, and environment subsystems coexist harmoniously with each other in the process of development and evolution. Meanwhile, the three subsystems are linked to each other by cooperation, complementarity, and synchronization. [44]. Research into 3E coordinated development has always concentrated on sustainable development [40]. Therefore, sustainable development and its evaluation methods have become a hot topic, especially with the current high level of concern for the environment and climate change.
The concept of sustainable development was first introduced in the UN’s World Energy Assessment (WEA) report in 2000 [45], but it was best defined by the Brundtland Commission as ‘development that meets the needs of the present without compromising the ability of future generations to meet their own needs’ [46]. Most of the relevant literature has evaluated the level of sustainable development according to environmental, social, and economic indicators [47]. Gunnarsdottir et al. [47] reviewed 57 sets of indicators of sustainable energy development (SED), with the majority of them being considered at the national level. Indicators developed in the typical context of one country are not completely replicable and applicable to other countries. Other types of indicators, including social [48,49], resource-related [50], and political [46], have also been introduced in some publications. Another important dimension, energy security, is treated as a vital issue and is usually considered independently. However, sustainable development is not possible without the consideration of energy security [47]. Hence, it is important to comprehensively evaluate sustainable development during the decarbonization transition of energy systems from the perspective of both 3E and energy security, yet few studies have achieved this.
As mentioned above, the limitations of the existing research can be summarized as follows: (1) Current decarbonization pathway research conducts analysis and evaluations mostly based on expert opinions and qualitative assessments. A comprehensive indicator set and quantitative analysis method for different scenarios need to be developed; (2) Most publications regard 3E development as only concerning the trends of sustainable MESs. However, few evaluation indicators have been established in combination with energy security. The concept of 3E coordinated development has also rarely been introduced into decarbonization pathway research, especially for MESs.
In this study, therefore, we established a complete decarbonization framework for MESs, from energy system modeling to a scenario quantitative analysis method. First, a comprehensive framework and procedures for energy system decarbonization research were reviewed and summarized. The models of energy consumption and carbon emissions were adapted and improved for MESs. In order to quantitatively evaluate the energy system development for each scenario, we proposed a 3E–S evaluation method, in which principal component analysis (PCA) was adopted for multi-criterion decision making. Finally, a municipal city in Guangdong was analyzed as a case study. According to the case study, the planning and 3E–S evaluation method for MESs was proved to be scientific, effective, and reasonable.
This paper is structured as follows: Section 2 summarizes a comprehensive framework and procedures for energy system decarbonization research. The models and 3E–S evaluation method are described in detail. Section 3 presents a case study of a municipal city in Guangdong province, including the calculation of its decarbonization pathway in different scenarios. The sustainable evaluation result of the case city and recommendations for pathways and policies are discussed in Section 4. Finally, Section 5 provides the conclusions of this study.

2. Materials and Methods

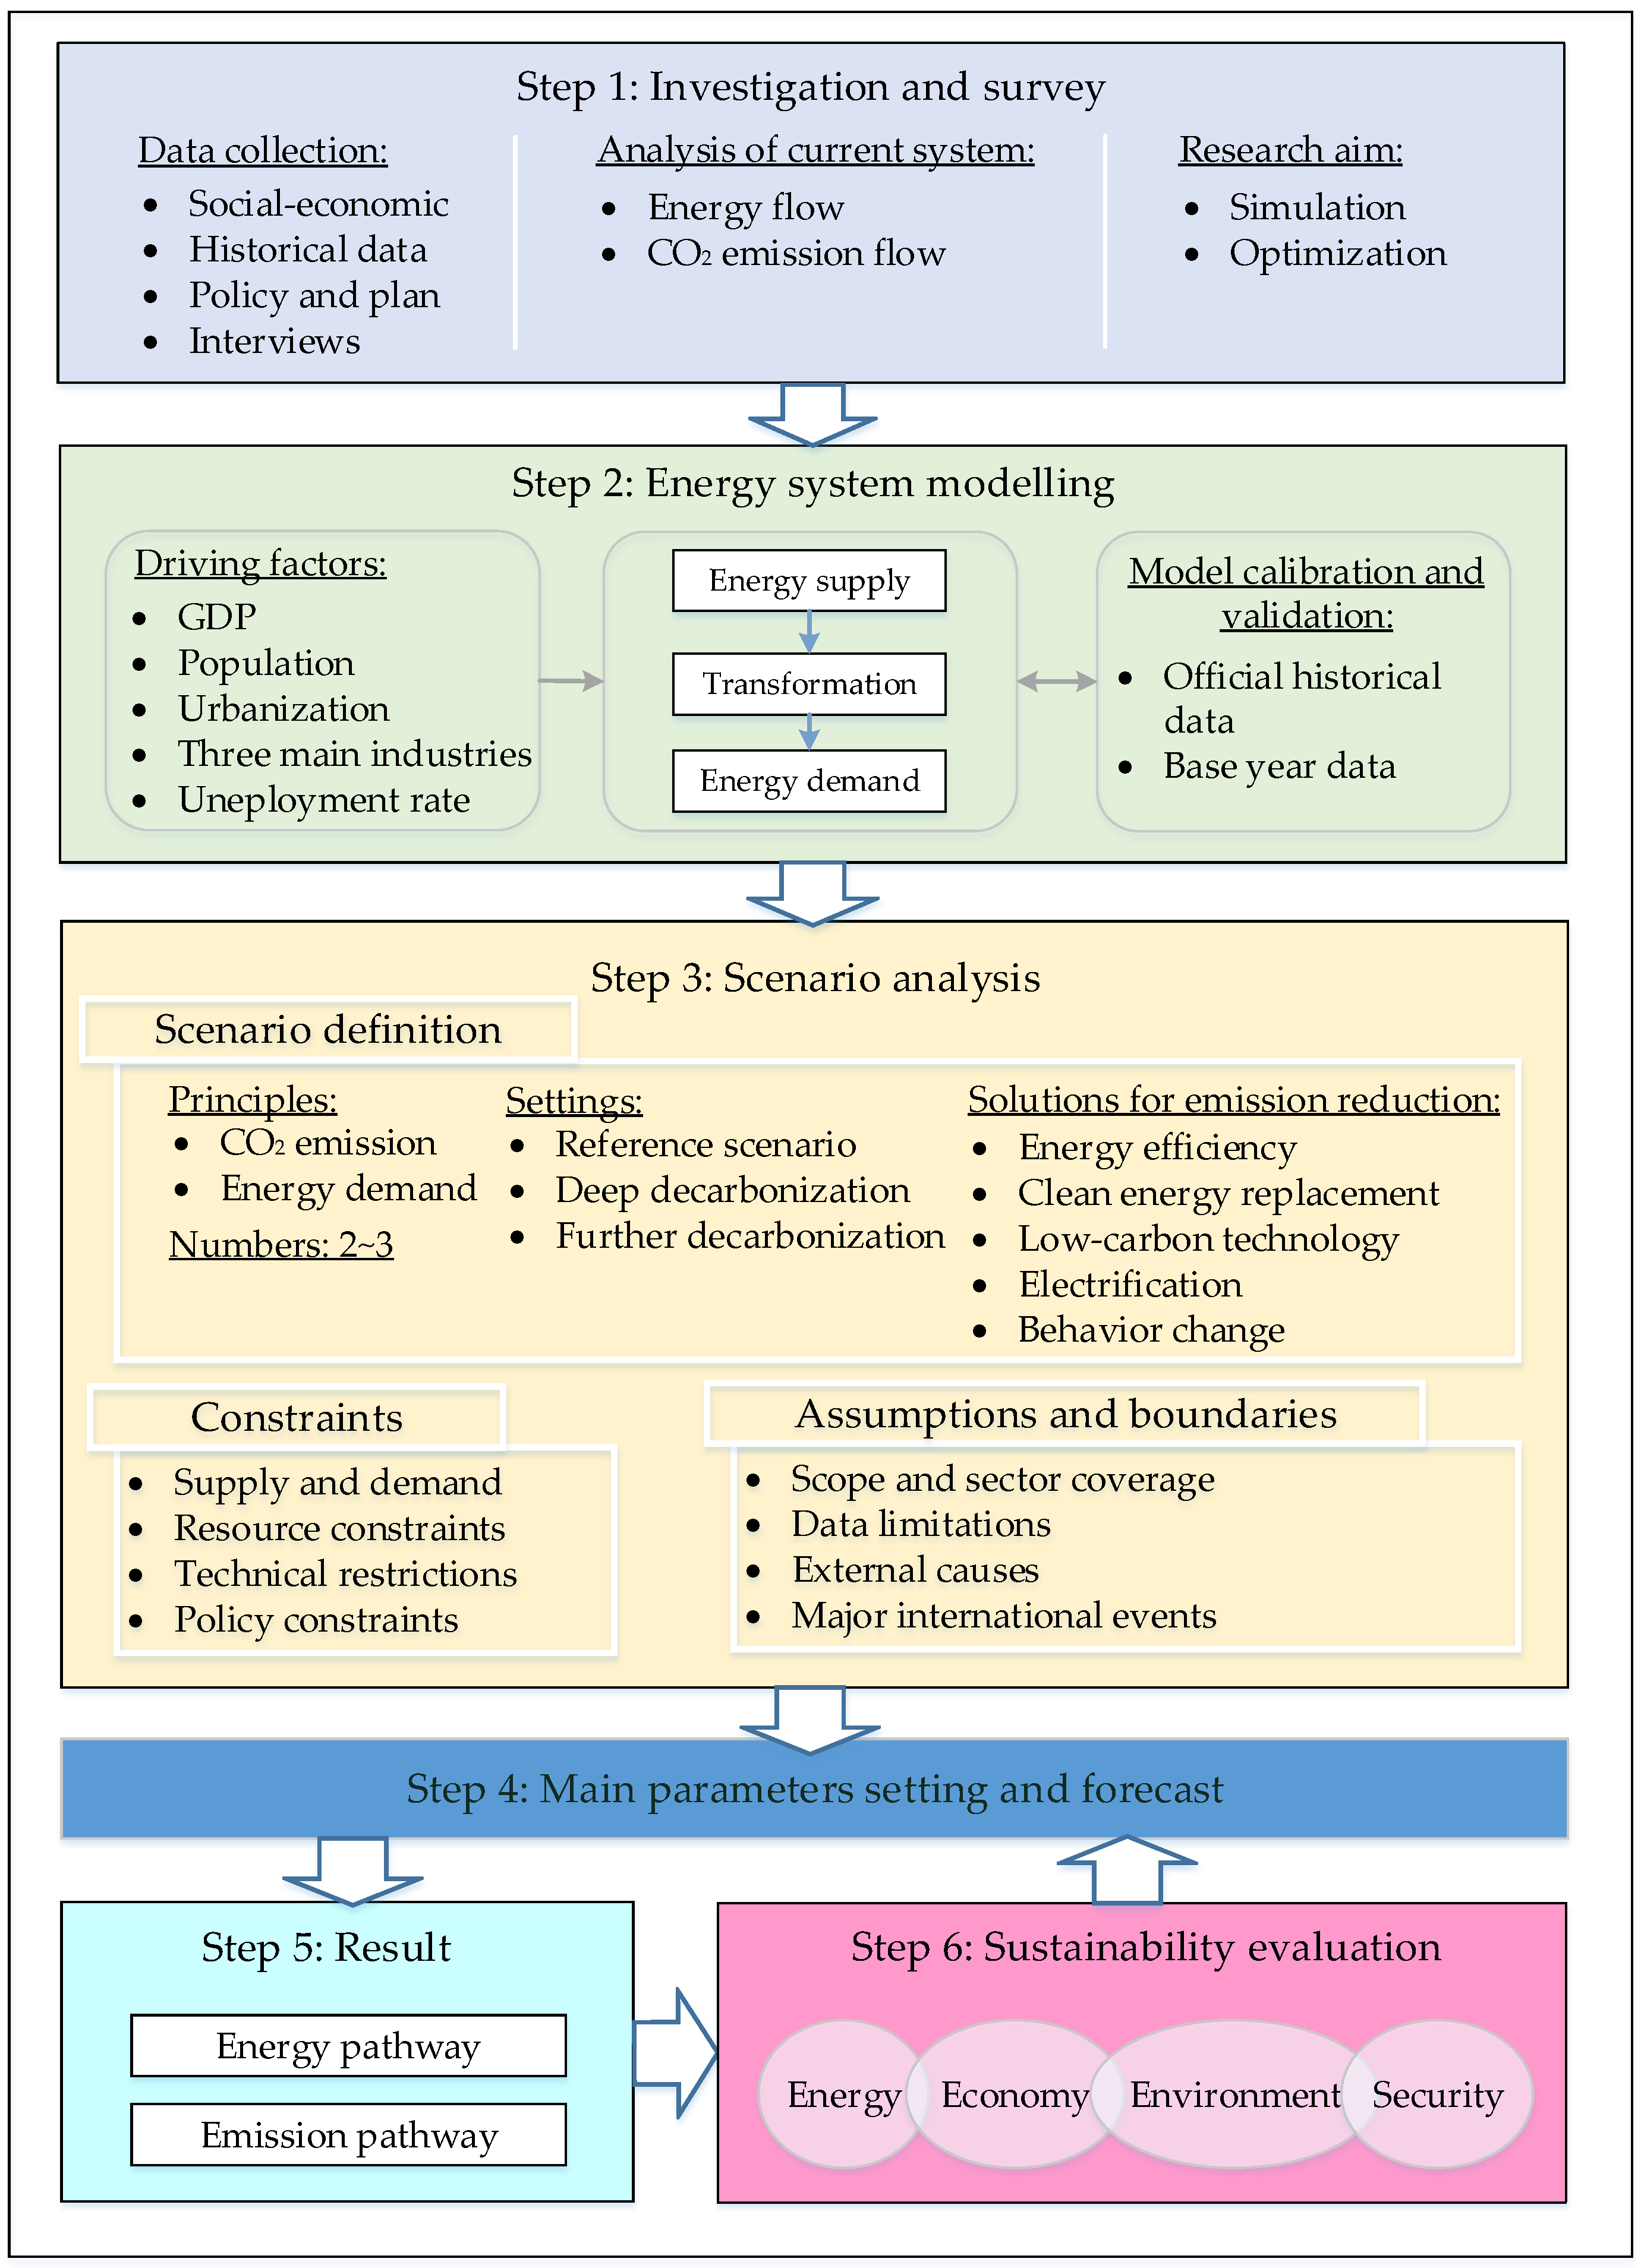
2.1. Procedures of Energy System Decarbonization Research

Through a review of the relevant literature, the procedures of energy system decarbonization could be summarized into the following 6 steps, as illustrated in Figure 1: (1) investigation and survey, (2) energy system modeling, (3) scenario analysis, (4) main parameter setting and forecast, (5) result, (6) sustainable development evaluation.
Step 1 is to conduct a preliminary investigation and survey, including data collection, an analysis of the current system, and research aim determination. An in-depth investigation and comprehensive data collection are the basic tasks to obtain a picture of the municipal foundations and development potential. Data can be gathered by reviewing annual statistics and summary reports; interviewing municipal representatives, mainly covering socio-economic details (GDP, population, and geography); consulting historical energy supply and demand data; examining policy and climate action plans [10,51], etc. It is necessary to analyze energy flow and CO2 emission flow using a Sankey diagram. Then, the research purpose needs to be determined, which is directly related to the selection of energy models, deciding between simulation or optimization. The former is used for energy system analysis and scenario analysis, while the latter is used for investment or operational decision support [52]. The framework of this paper was focused on the simulation of different scenarios. Optimization frameworks, procedures, models, and other characteristics are available from refs. [7,20,53,54,55].
Next, the energy system is modeled in Step 2. The commonly considered driving factors include GDP and its growth, population and its growth, urbanization, the structure of the three main industries, and the unemployment rate [2,21,56]. Based on these driving factors, the models of energy supply, transformation, and energy demand are generally constructed using existing models (such as LEAP and NEMS). The whole energy system can be divided into 6 sectors, including the power, building, industry, transportation, agriculture, and waste sectors. Some studies also consider non-energy sectors, such as livestock and industrial processes [51,56]. The model is calibrated and validated using official historical data and base-year data [7,56].
In Step 3, scenario analysis allows the examination of many possible future scenarios in terms of decarbonization paths and observable outcomes [57]. In general, this mainly comprises the definition of the scenario, constraints, assumptions, and boundaries. For scenario definition, the principles, numbers, settings, and potential solutions for CO2 emission reduction need to be determined. Based on the principles of CO2 emission and energy consumption, two or three scenarios are generally defined as the reference (also called business-as-usual (BAU)), deep decarbonization, and further decarbonization scenarios [10,53]. The potential solutions for decarbonization can summarized into five categories: (1) maximum energy efficiency to reduce energy demands; (2) renewable energy (RE) and zero-carbon fuel replacement to reduce carbon emissions directly; (3) the promotion of low-carbon technology and flexible facilities, such as CCS, large-scale storage, power-to-X, and hydrogen; (4) electrification in transportation and buildings; and (5) behavior change in energy consumers [51]. The constraints mainly describe the limitations regarding resources, technology, policy, and the supply and demand balance. The definition of clear assumptions and boundaries is also required.
Then, the main parameters and features are set and predicted in Step 4. The results of the energy pathway, carbon emission pathway, and other socio-economic pathways are obtained in Step 5. Finally, the quantitative evaluation of municipal sustainable development in different scenarios is necessary from the 3E–S perspective proposed in this paper. The evaluation results obtained in Step 6 can provide feedback for adjusting the main parameters and settings in Step 4 until a reasonable and coordinated decarbonization pathway is achieved.

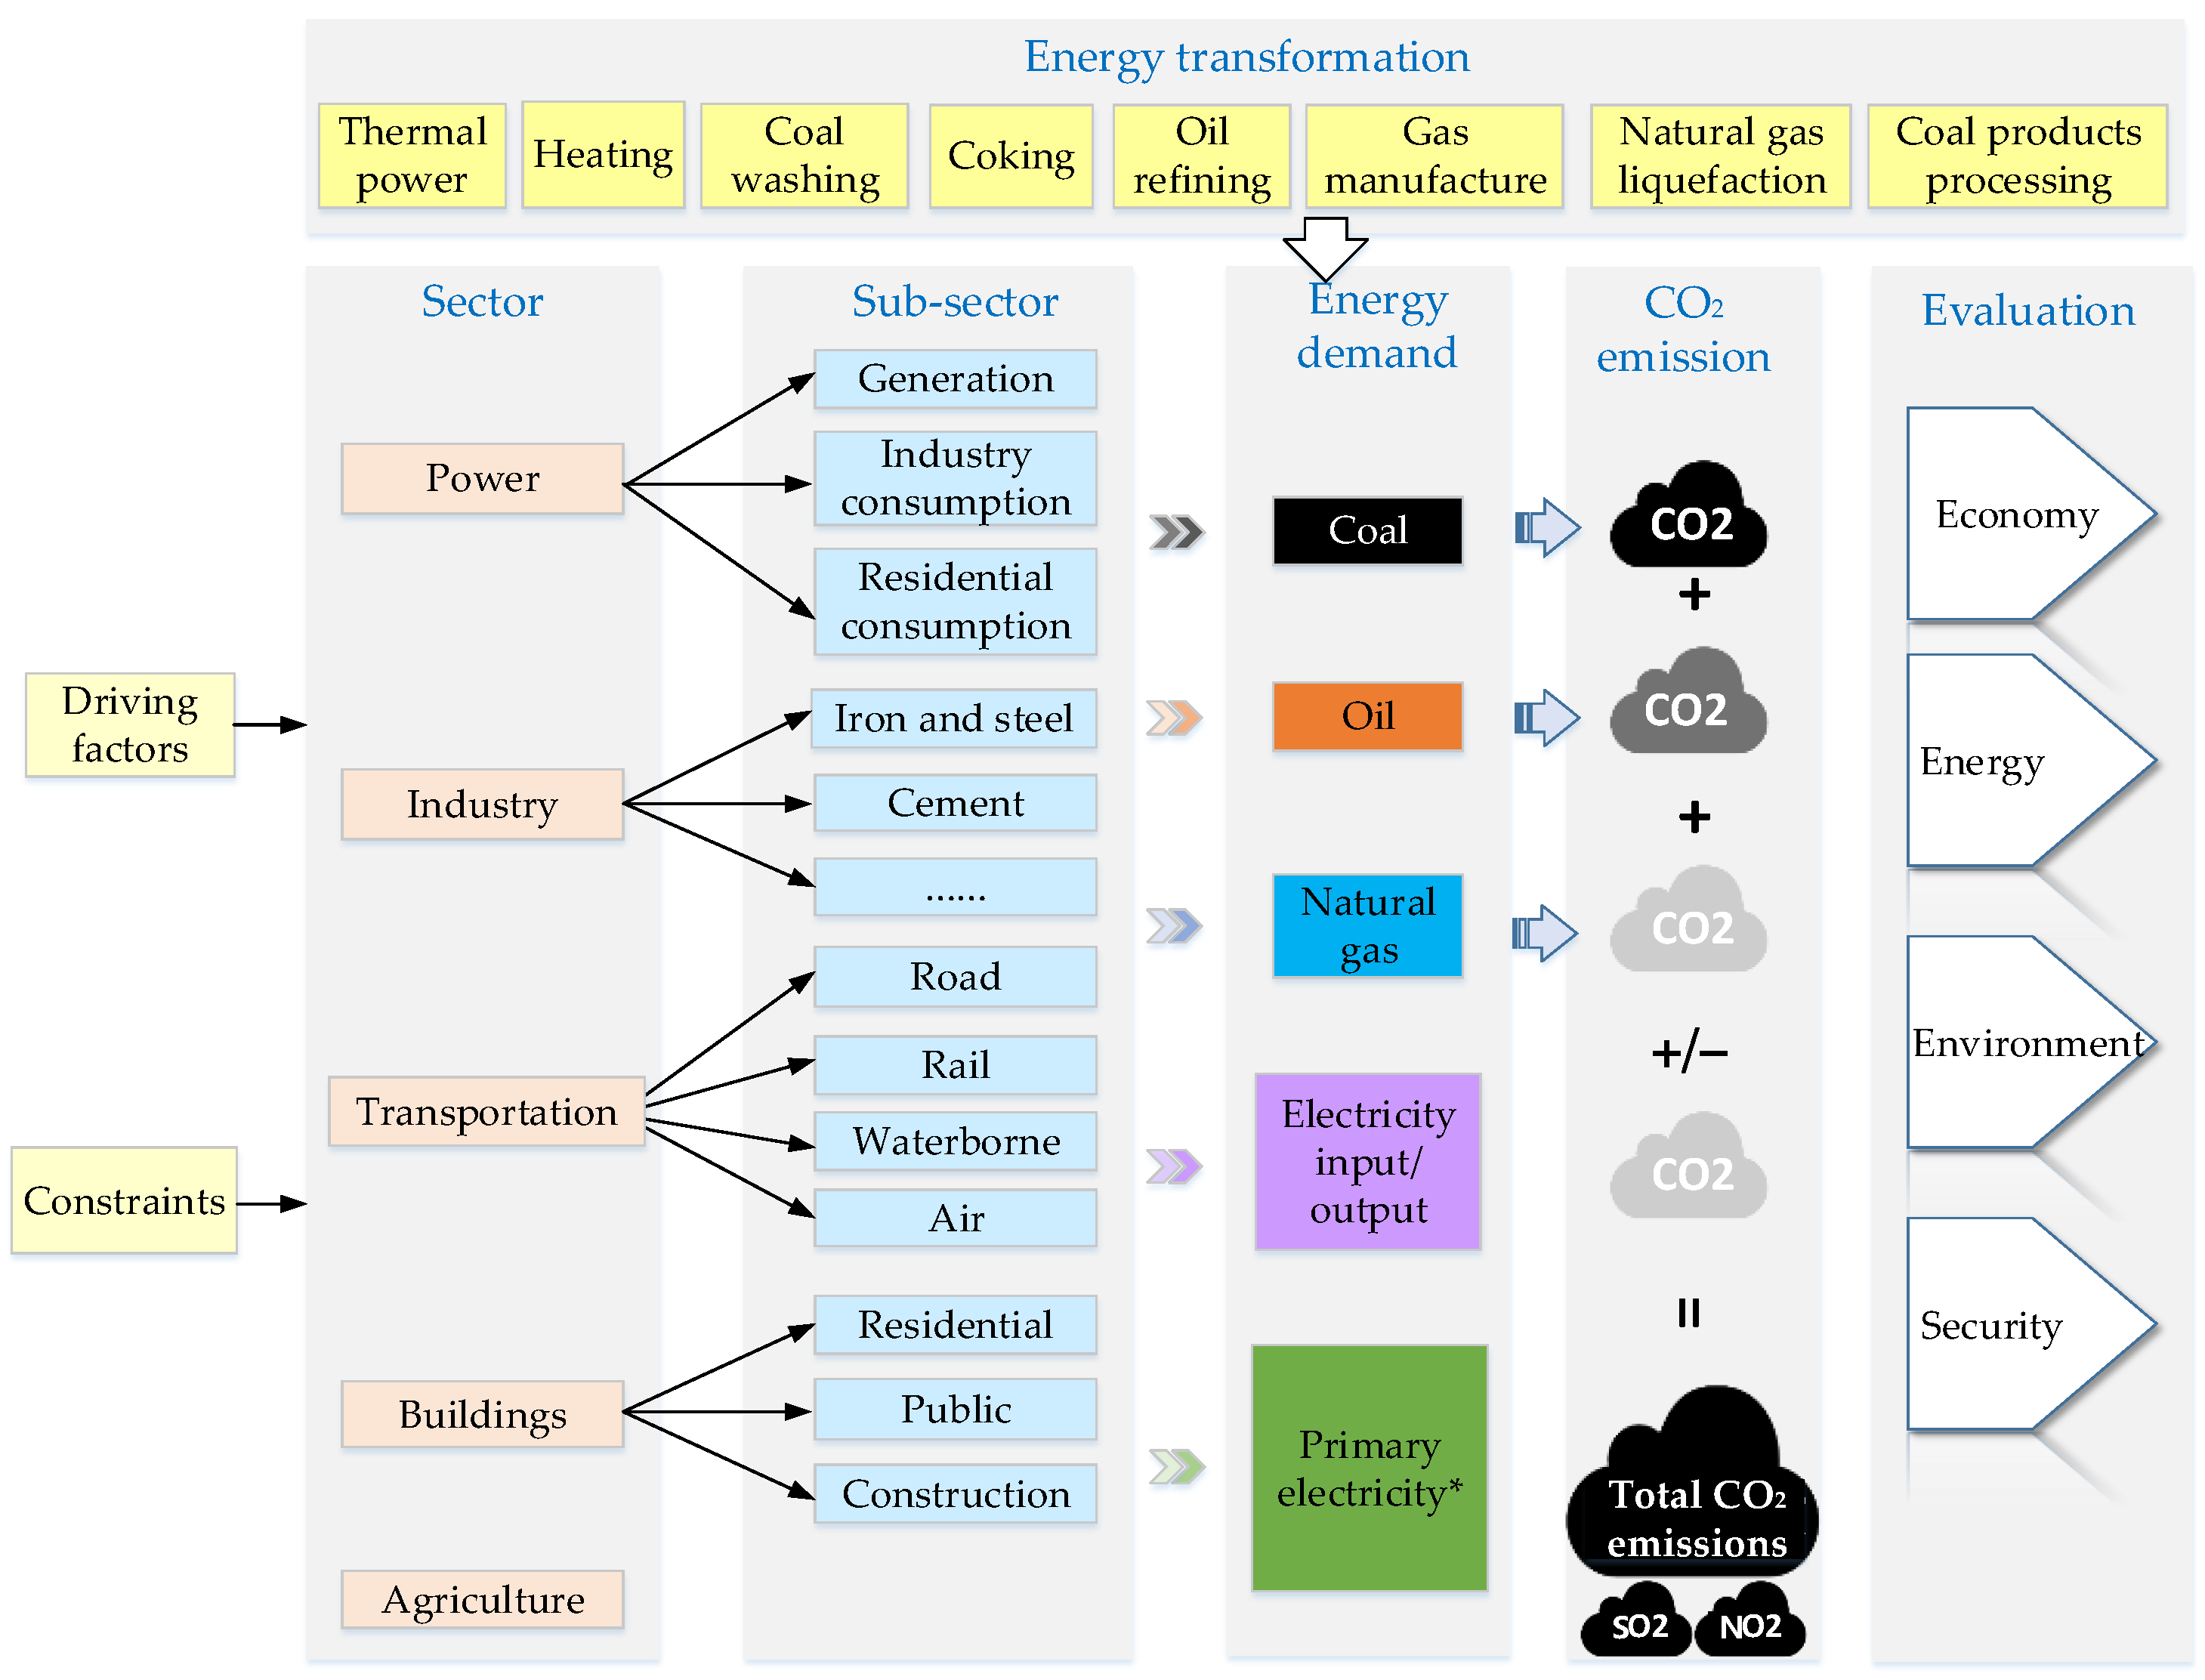
2.2. Modeling Framework

The modeling framework adopted in this paper is depicted in Figure 2. We considered five sectors: power, industry, transportation, building, and agriculture.
Non-energy sectors were ignored here because the overwhelming majority of municipal CO2 emissions come from energy sectors. Each sector was divided into different subsectors. The demand for coal, oil, natural gas, and primary electricity could be calculated by considering the energy activity level and energy consumption intensity in each subsector. Except for carbon emissions resulting from fossil fuels, the input electricity from other regions and output electricity to other areas were also considered in the CO2 emission model. Lastly, the 3E–S development of the system was evaluated.

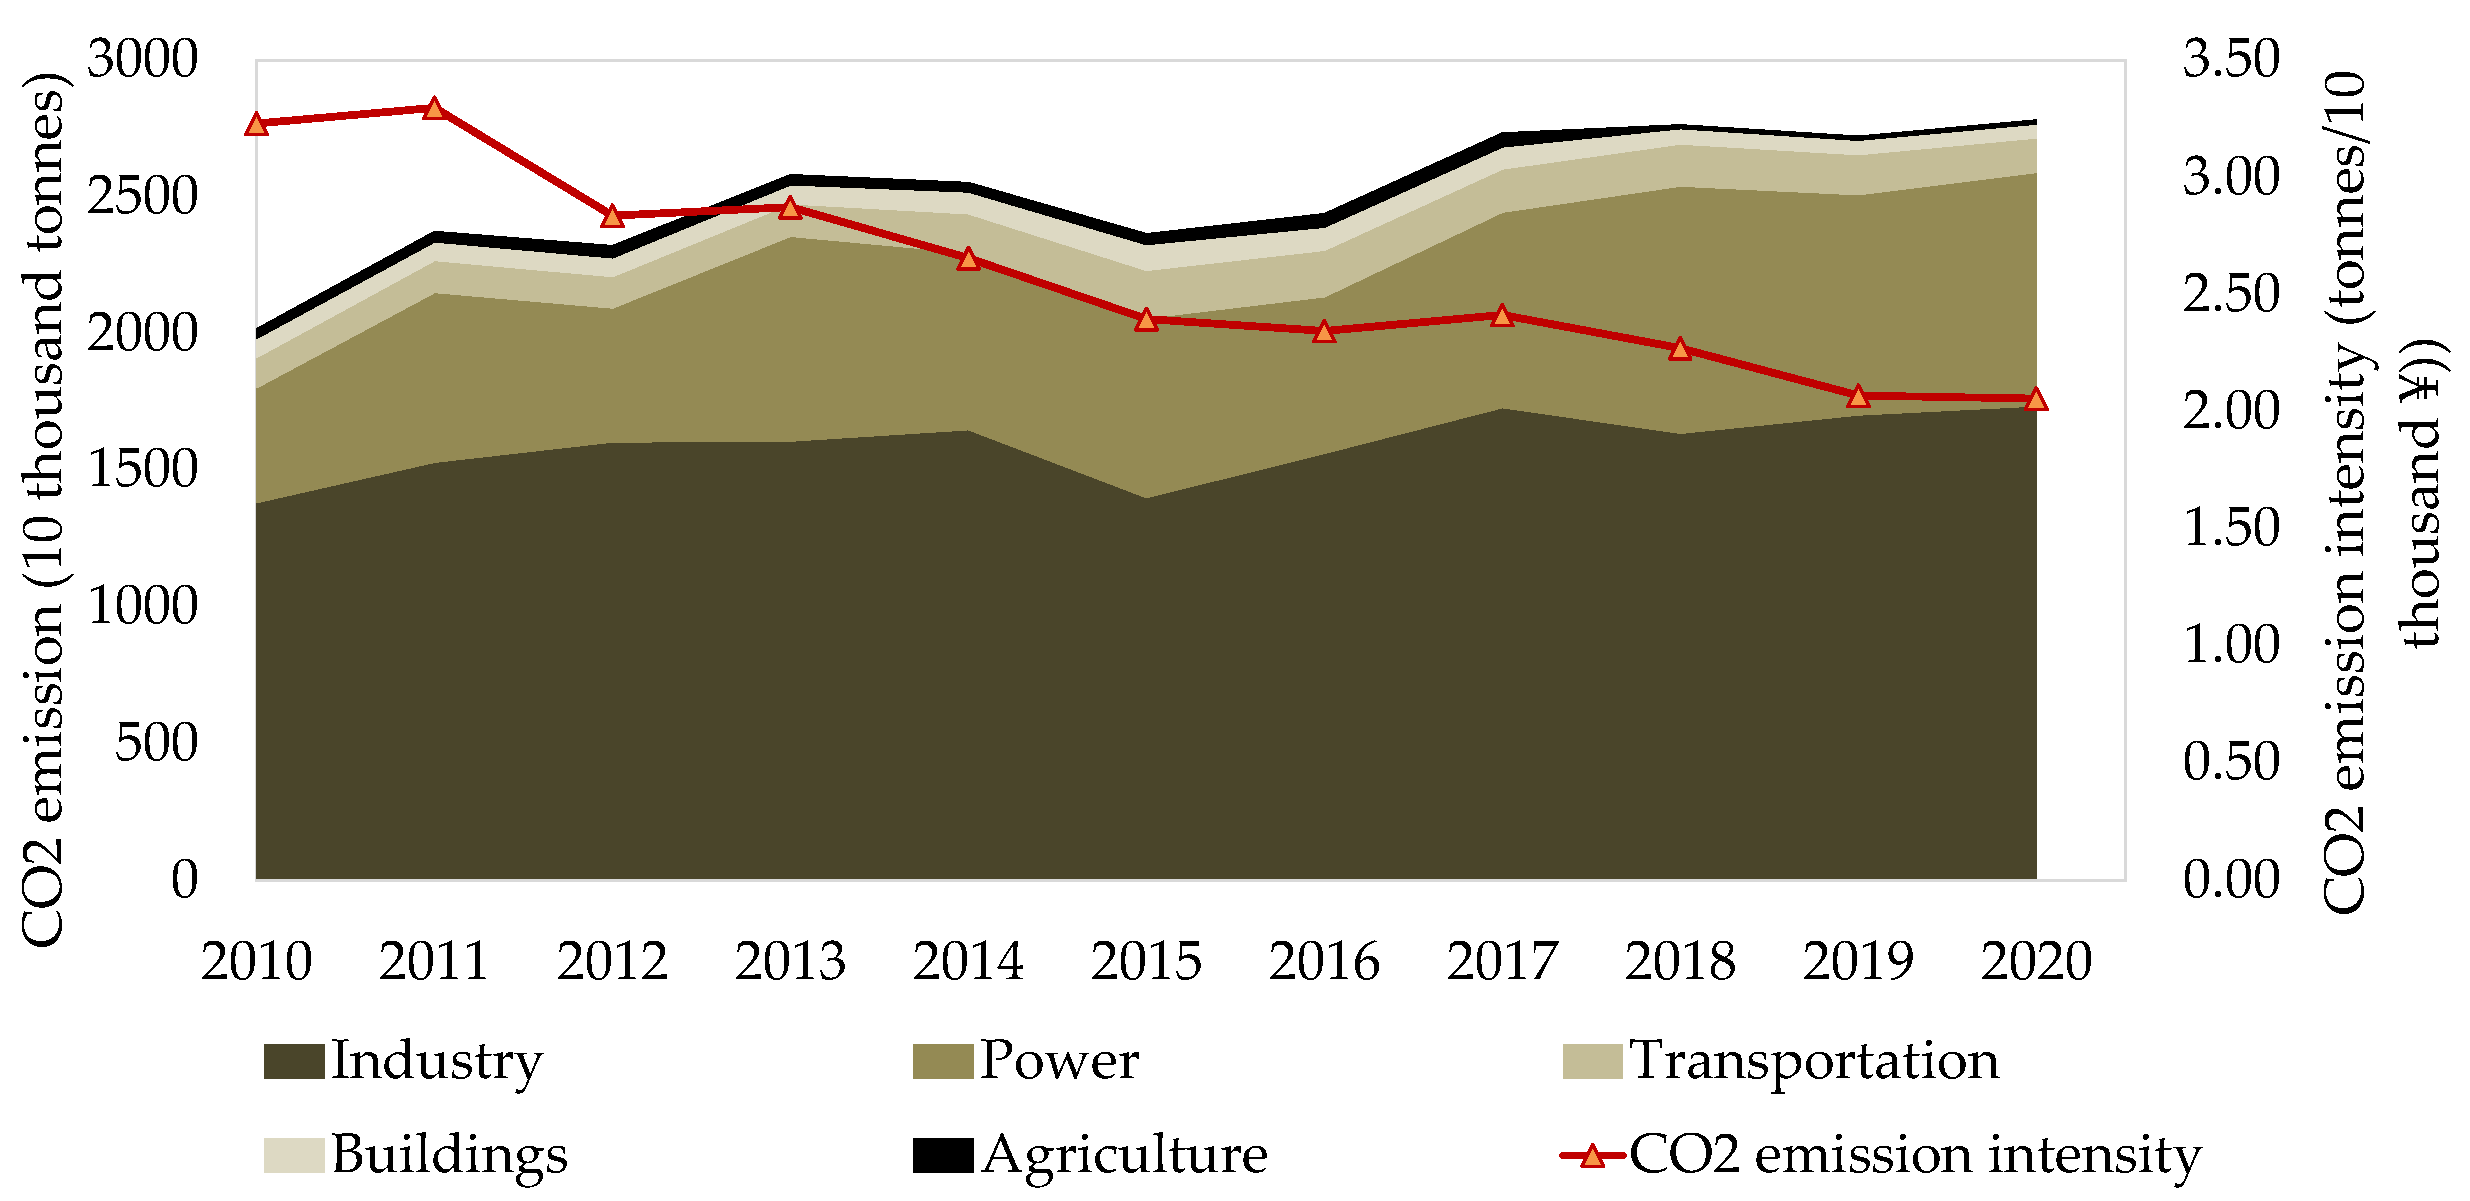
2.3. Energy Demand and CO2 Emissions

Energy demand can generally be expressed as the product of the activity level and the annual energy intensity. The formula is shown below:
E i = s t E A L s , t E I i , s , t ,
where Ei is the energy demand of fuel type i, EALs,t is the energy activity level of technology t in sector s, and EIi,s,t is the energy intensity. Based on the department analysis method used in LEAP, the total energy demand was calculated for the industry, transportation, building, agriculture, and power sectors, each of which could be broken down into different subsectors [58]. The expressions for each of the sectors listed in Figure 2 differed in terms of certain details, but they were all largely based on Equation (1), as is demonstrated in Table 1. More detailed explanations are found in Supplementary Materials.
The total CO2 emissions could be calculated by the carbon dioxide emission coefficient method [62], as Equation (2) shows. This method considers the direct carbon emissions from fossil fuel combustion and the indirect emissions from electricity transfer in and transfer out.
E M C D = E i E F i , C D + E L E i n p u t E F i n p u t , C D ,
If electricity is transferred from one city to another, Equation (3) is applicable.
E M C D = E i E F i , C D E L E o u t p u t E F o u t p u t , C D ,
where E M C D is the CO2 emissions; Ei is the energy demand of fuel i;  E F i , C D is the CO2 emission coefficient when fuel i is burned; ELEinput and ELEoutput are the electricity input and output, respectively; and EFinput,CD and EFoutput,CD are the CO2 emission coefficients of input and output electricity, respectively.
Calculating the net carbon dioxide emissions is important in the context of the carbon neutrality. This calculation takes the natural carbon sink into account, representing the difference between the actual emissions of carbon dioxide and the absorption capacity of the natural carbon sink. The formula is:
E M N et C D = E M C D C S n a t u r a l ,
where E M N et C D is the net CO2 emissions and CSnatural is the natural carbon sink.

2.4. Sustainable Development Indicators and Evaluation Method

The indicator system for municipal sustainable development was established based on the four dimensions of energy, economy, environment, and security, as shown in Table 2. There were 31 indicators in total, obtained through reference to the published literature on 3E sustainable development, municipal sustainable development, and energy security. The references for each indicator are included in Table 2. Specifically, the dimension of energy development had 10 indicators, concerning amount, structure, and growth; economic development had 6 indexes; and there were 8 indicators for the environment dimension. Besides CO2 emissions, SO2 and NOx emissions were also considered, because greenhouse gas (GHG) emission mitigation is a crucial issue. These emissions could be calculated by an emission factor method similar to Equation (4), and the value of the coefficient could be obtained following the method of [62]. Energy security was evaluated by 7 indicators.
The evaluation method consisted of standardization, the determination of indicator weight, the evaluation of each dimension, the calculation of the overall level of municipal sustainable development, and the evaluation of the coordination degree of the MES.

2.4.1. Standardization

Since many indicators were included in this paper, and the indictors had different units, making it difficult to determine an optimal standard, standardization (also called normalization) was required; for this, we selected the MIN–MAX method. The relevant expressions were as follows [66]:
For positive indicators:
Z i n = X i n X min X max X min ,
For negative indicators:
Z i n = X max X i n X max X min ,
where Zin is the standardized value of indicator in; Xin is the original value of indicator in; and Xmax and Xmin are the maximum and minimum value of all-year data, respectively.

2.4.2. Weighting

A multi-criterion decision method was required to compute the weight of the indicators. PCA was used in this paper because it presents superior performance for less-random, multivariate statistical studies and quantitative analyses compared to the other twelve techniques [76,77,78]. The procedures of PCA were conducted based on [71].

2.4.3. Evaluation of Each Dimension

The value of each dimension is expressed by Equation (7) [66].
E D d = i n = 1 n Z i n ω i n ,
where EDd is the value of dimension d, including 3E–S; n is the number of indicators of each dimension; and ωin is the weight of indicator in.

2.4.4. Overall Level of Municipal Sustainable Development

The overall level of municipal sustainable development was calculated by Equation (8). It was based on the assumption that the development of each dimension was equally important [66].
S D = E D e n e r g y + E D e n v i r o n m e n t + E D e c o n o m y + E D sec u r i t y 4 ,
where SD is the overall level of municipal sustainable development.

2.4.5. Coordination Degree

The coordination degree is a quantitative index for measuring the degree of coordination between dimensions in the 3E–S system [38]. Before obtaining the result, the coordination degree of each dimension first needed to be calculated, as shown in Equation (9). Then, the overall coordination degree of the MES was defined, as in Equation (10) [66].
H d = { exp ( d E d d t d S D d t ) d E d d t < d S D d t   1 d E d d t = d S D d t exp ( d S D d t d E d d t ) d E d d t > d S D d t ,
H W S = d = 1 4 H d 4 ,
where d E d d t is the developing rate of dimension d, d S D d t is the overall developing rate of the system, Hd is the coordination degree of dimension d, and HWS is the overall coordination degree of the MES. From the definition in Equation (9), Hd ranged from 0 to 1.

3. Case Study and Pathway Results

A municipal city in Guangdong province in southeast China was selected as the case study in this paper. This city has a residential population of 2.9 million, and its urbanization rate is 45%. In recent years, the dominant driving forces of GDP growth in the city were represented by traditional energy-intensive sectors such as industry, building, and transportation. In 2020, 87% of the total energy demands came from traditional fossil fuels, including coal, oil, and natural gas, as depicted in Figure 3 and Figure 4.
From the perspective of subsectors, energy is mainly consumed by iron and steel, cement, and power production (63%). The electricity generation structure is dominated by thermal power generation, with a proportion of 65%. It is noteworthy that the city has a strong natural carbon sink capacity, with a forest cover of 74% in 2020, which provides favorable conditions for achieving carbon neutrality. All data were obtained from historical statistical yearbooks, energy balance sheets, statistical communiques, reports, interviews, policy documents, and plans pertaining to the case city.
As illustrated in Figure 3, the total primary energy demand increased by 48% from 2010 to 2020, while the energy intensity decreased by 32%. In the past 11 years, coal consumption has represented over 70% of the total demand.
The Sankey diagram of energy flow was drawn according to the energy consumption data and demonstrates the primary energy sources and links to end-use sectors. About 56% of the coal was used in industry, including the iron and steel, cement, metallurgy, and chemical industries. Thermal power consumed 43% of the coal. Around 43% of the oil was used in the transportation sector, and 21% was consumed by the residential sector. As for natural gas, 61% flowed into the metallurgy and cement industries, etc.
Based on the model in Section 2.2, the historical CO2 emissions were calculated for the sectors of industry, transportation, building, agriculture, and power. The results are presented in Figure 5. The total CO2 emissions showed a fluctuating increase from 2010 to 2020, while the CO2 emission intensity decreased with the stable development of the economy. The industry sector and power sector produced the majority of the CO2 emissions, accounting for 93% in 2020. Only 7% of emissions were released by the other three sectors.

3.1. Scenario Setting

The decarbonization pathway was based on certain assumptions and boundaries. The electricity consumption of the industry, building, transportation, and agriculture sectors was jointly calculated as that of the power sector to avoiding double counting. The CO2 emissions were calculated for the energy sector, not including those produced by livestock, industrial process, waste, and other non-energy sectors.
Three scenarios were considered: the conservative scenario (reference), the carbon neutrality scenario, and the carbon-negative scenario. In the reference scenario, a conservative estimation was conducted according to the existing plans and policies and the current growth rate to ensure the achievement of peak carbon emissions by 2030 on the premise of guaranteeing the steady development of the municipal economy. The carbon neutrality scenario was constructed around the targets of peak carbon emissions by 2030 and carbon neutrality by 2060, with much greater efforts being put into carbon emission reduction, sink enhancement, and new policy implementation; additionally, zero-carbon and flexible technologies (especially RE and pumped storage) experience vigorous expansion, and great attention is paid to energy saving in all sectors. As for the carbon-negative scenario, the main objective was to contribute to a much improved carbon sink for both the province and the country, while ensuring the realization of net-zero carbon emissions. The energy system cost is further decreased, and energy efficiency is further enhanced. Moreover, faster breakthroughs are made to many important technological bottlenecks, which include cross-season energy storage (CRC) and the coproduction of different energy products.

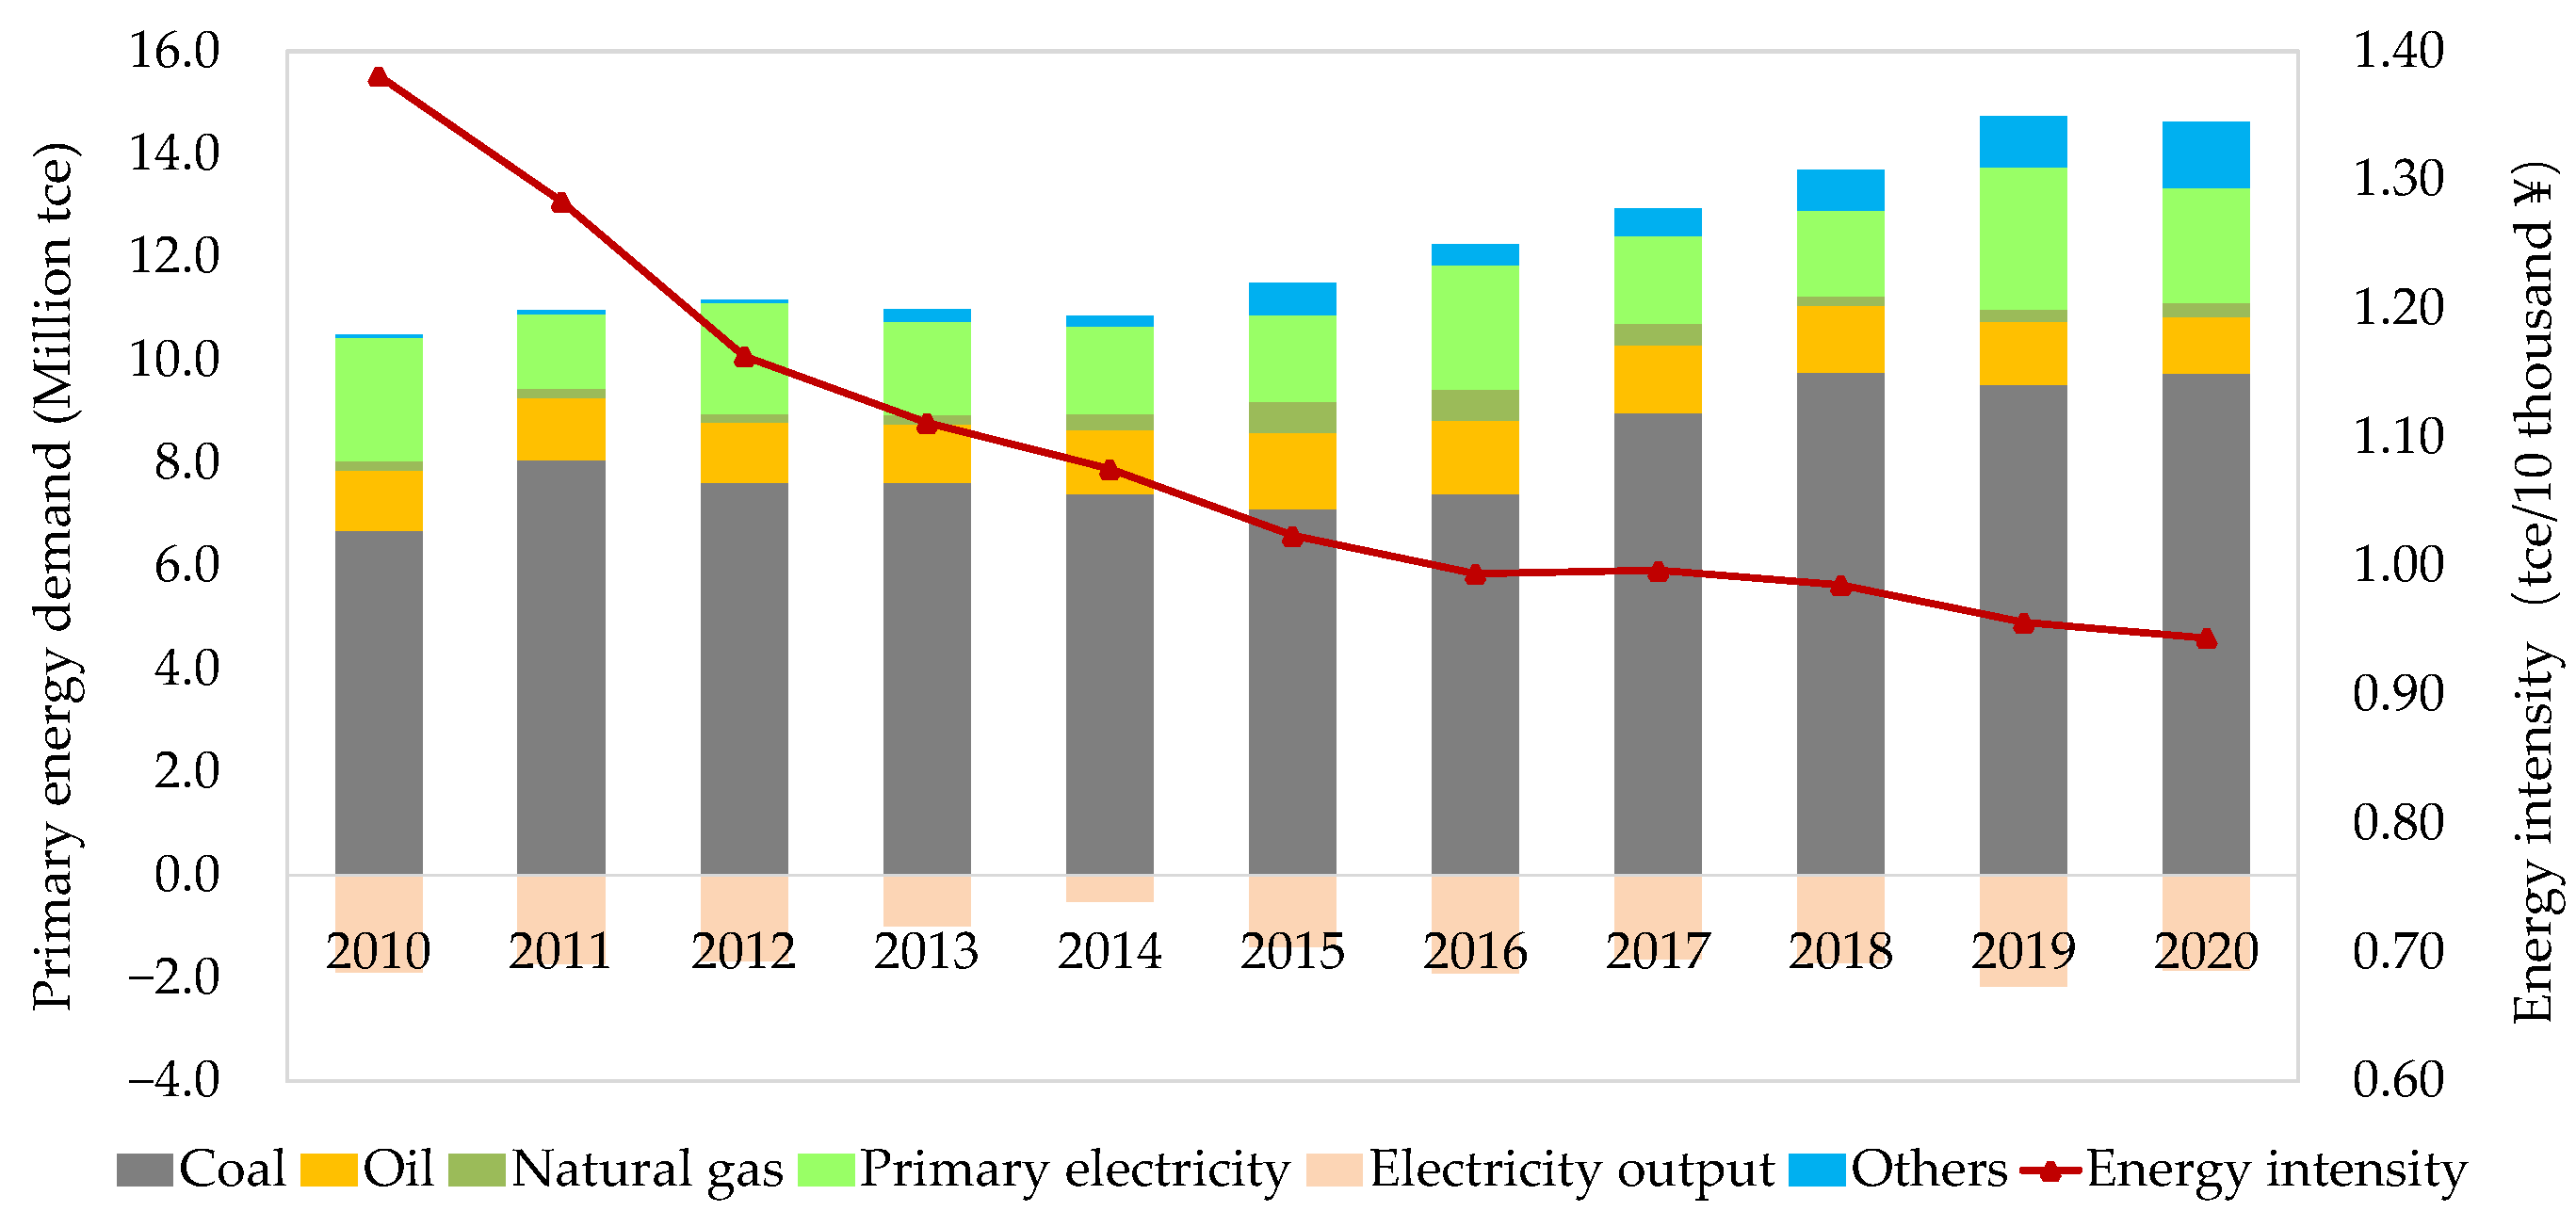
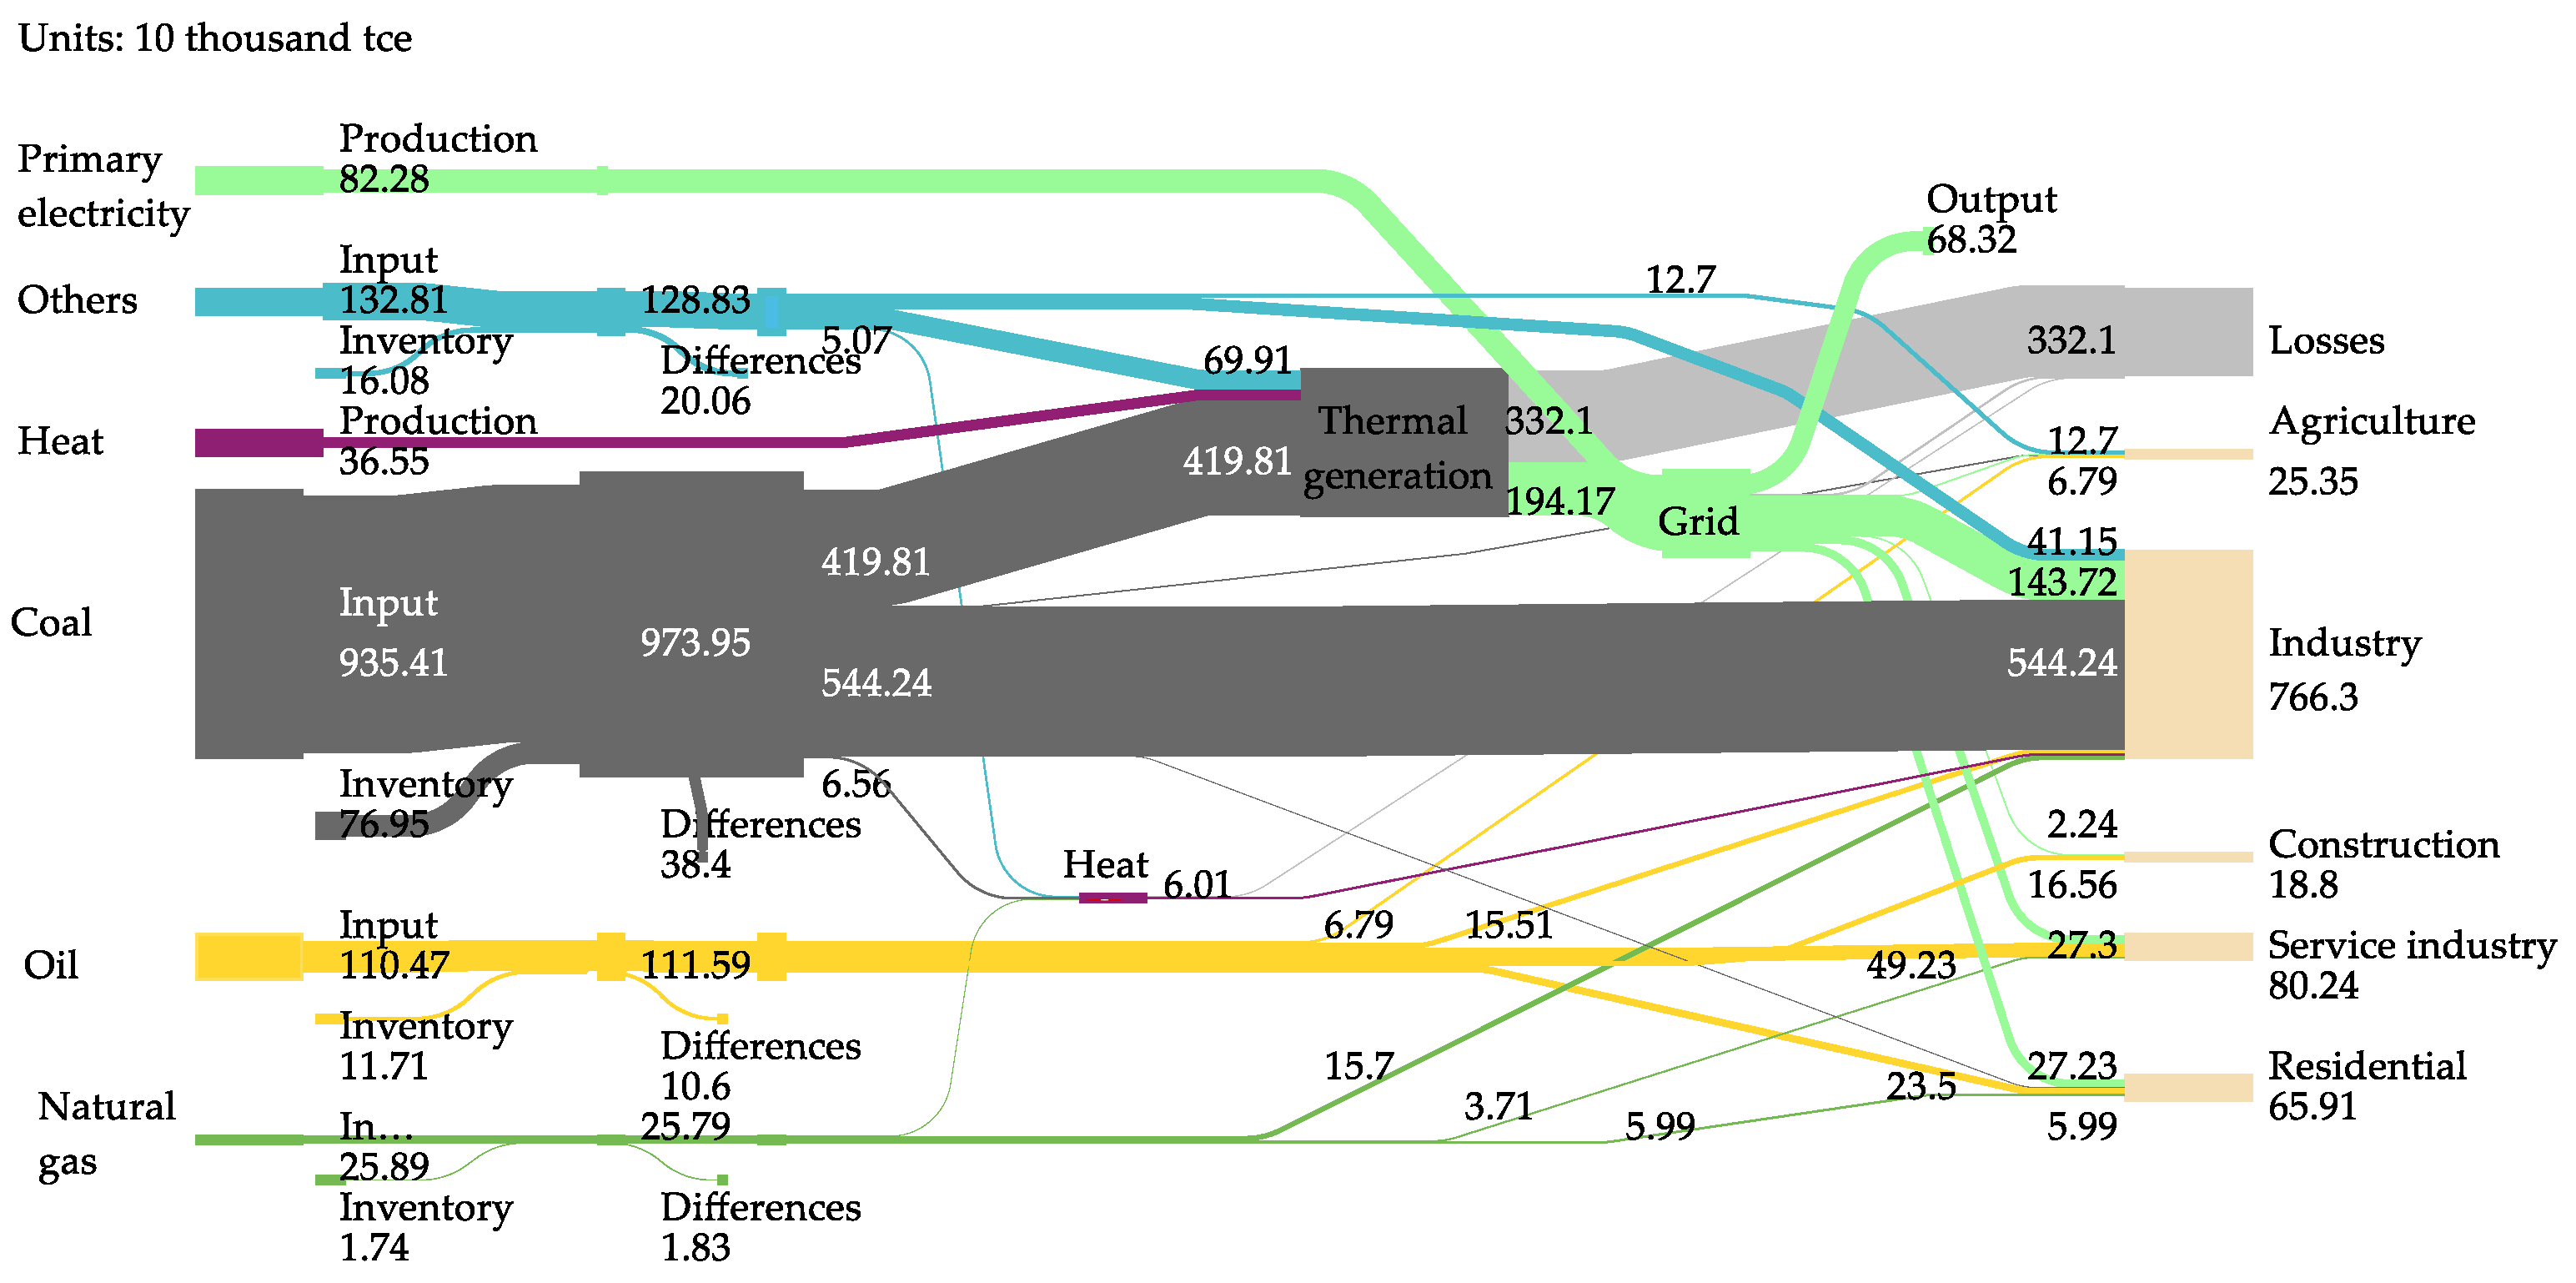
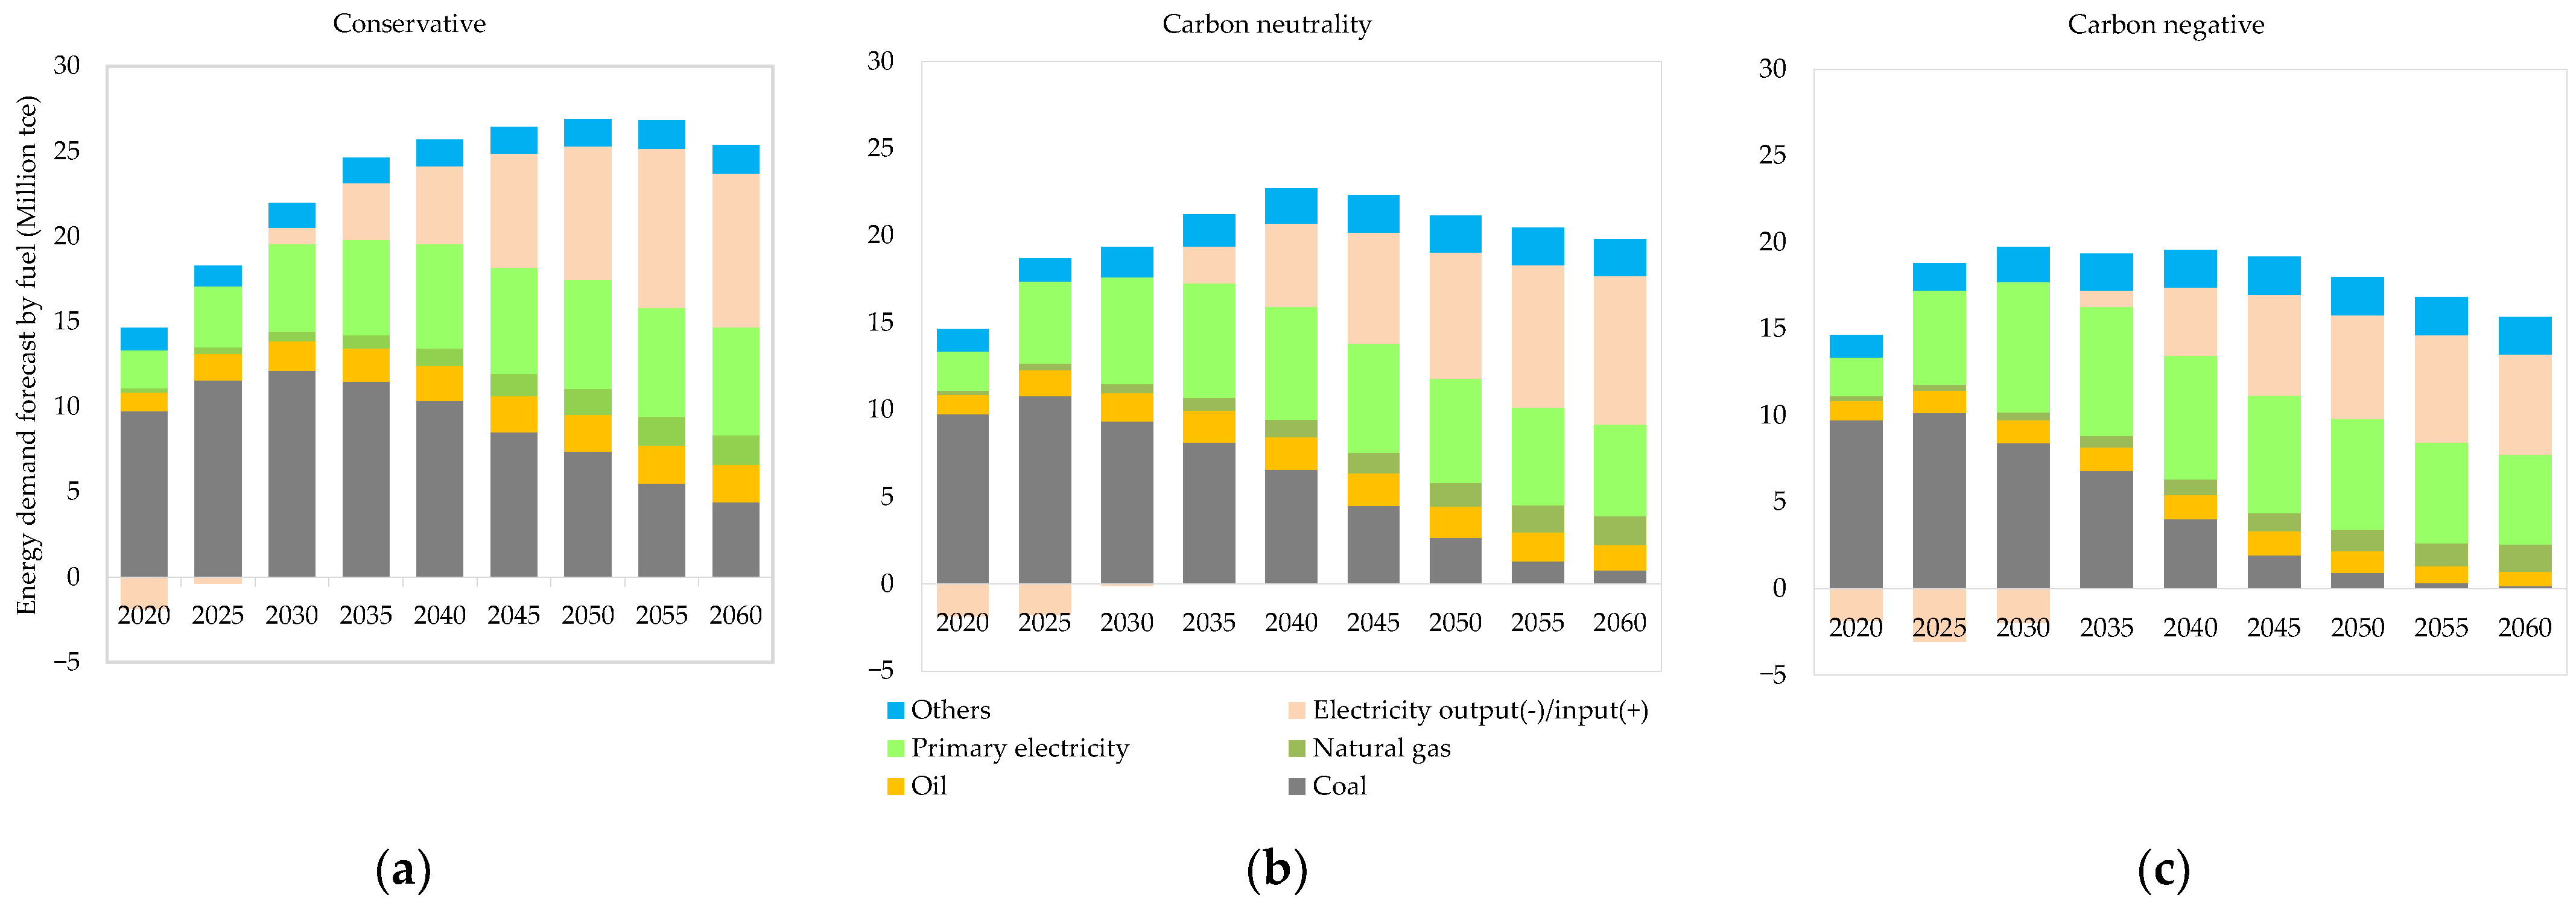
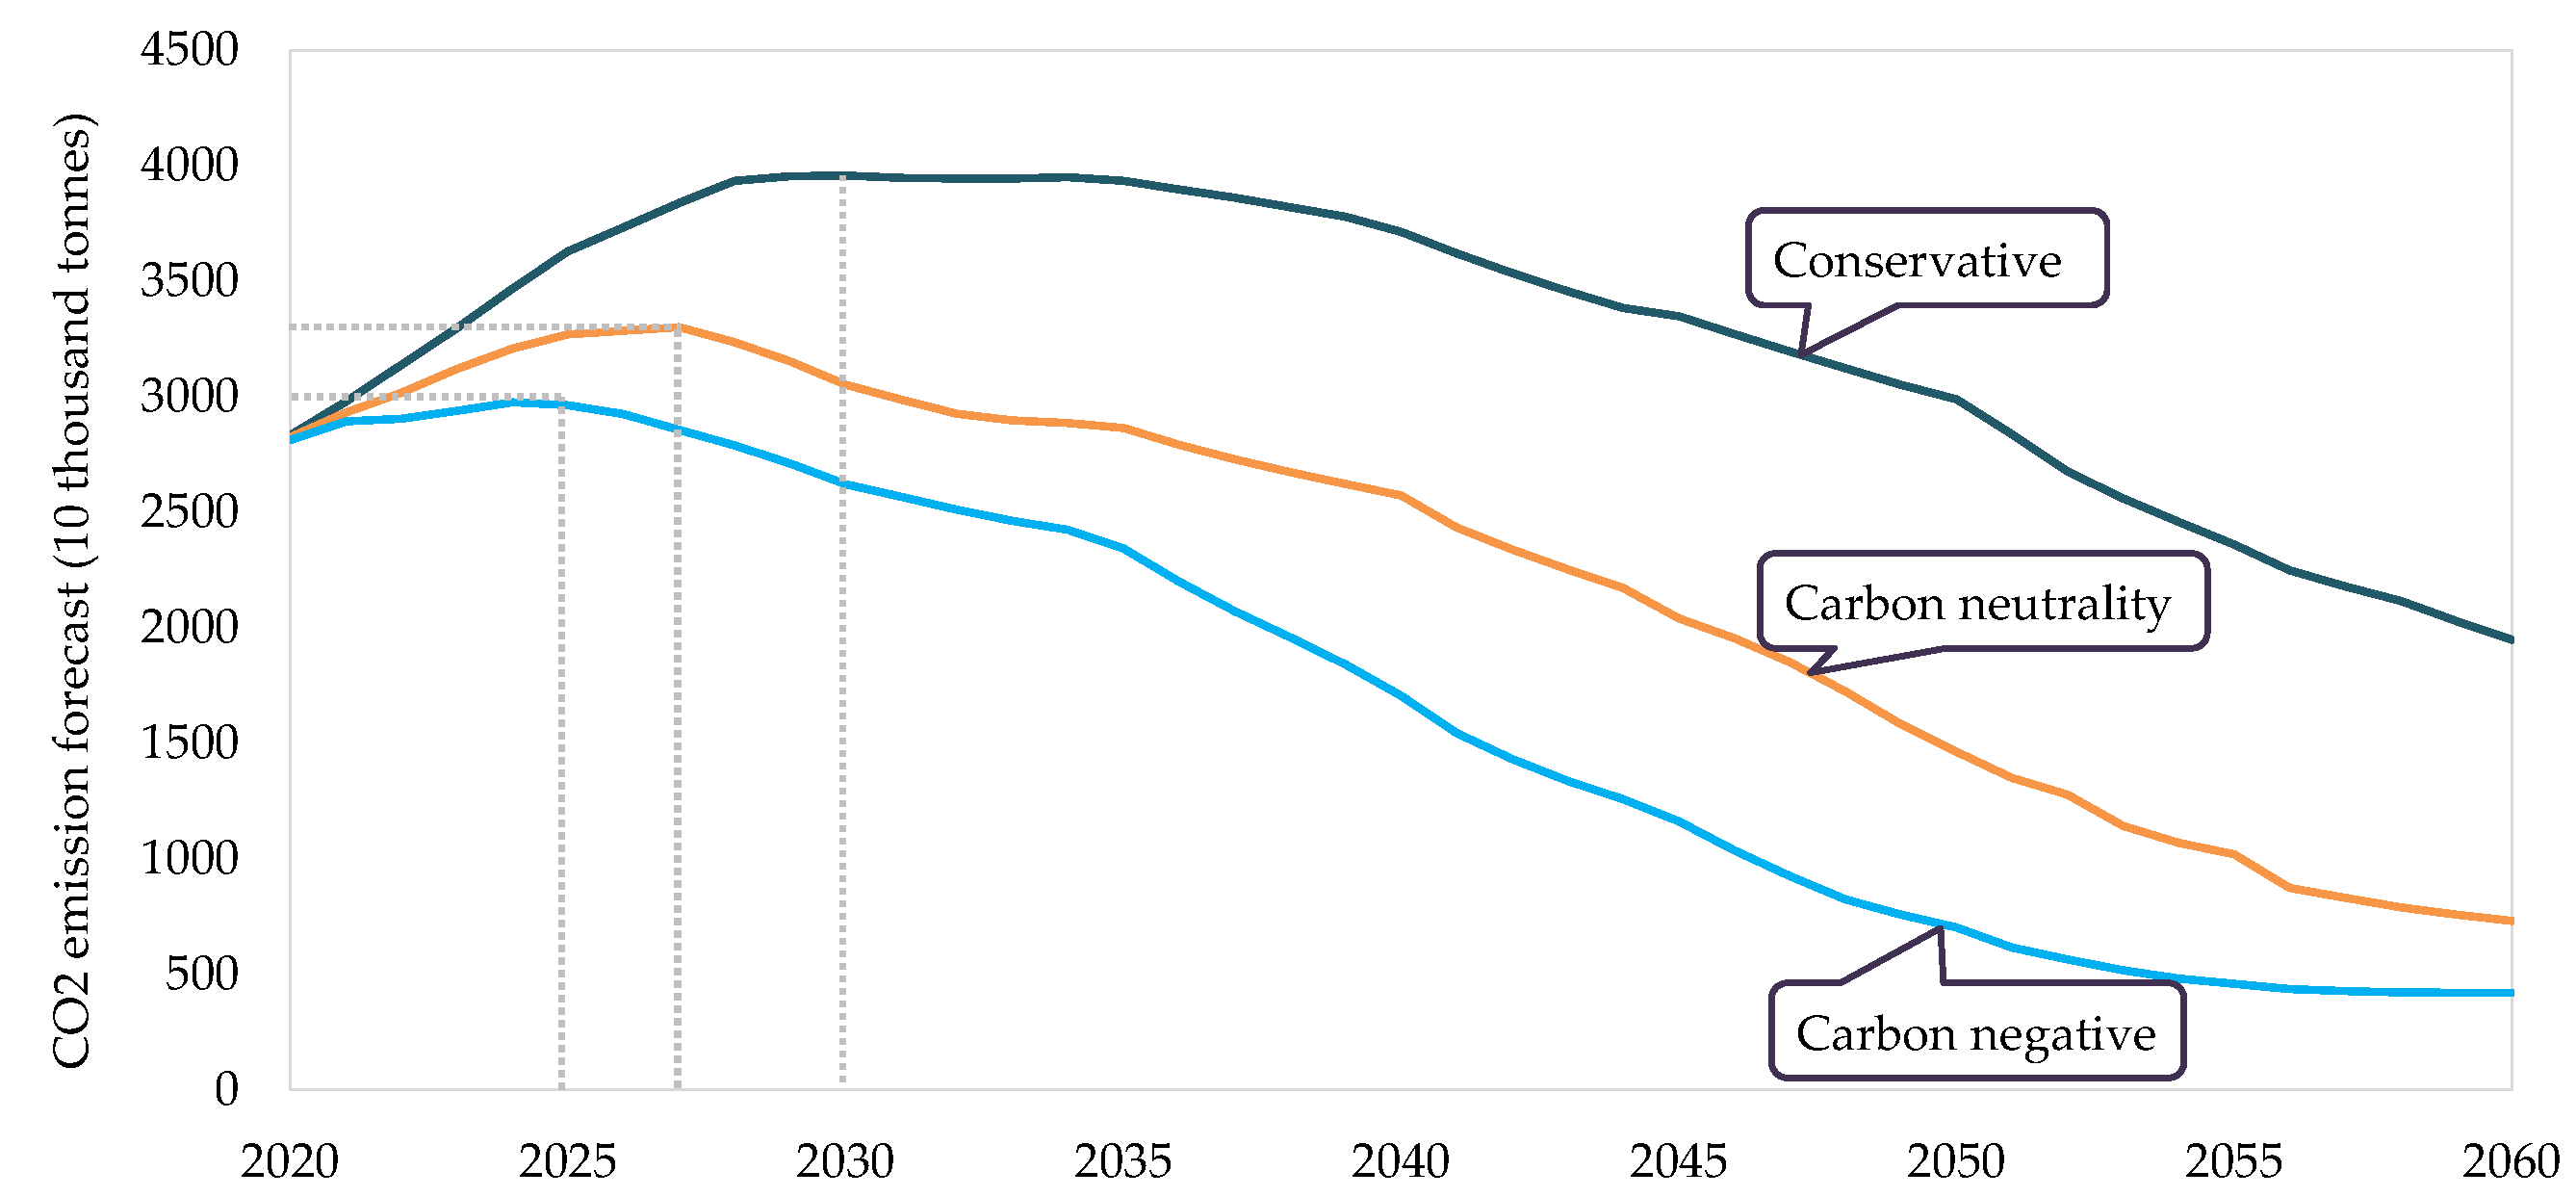
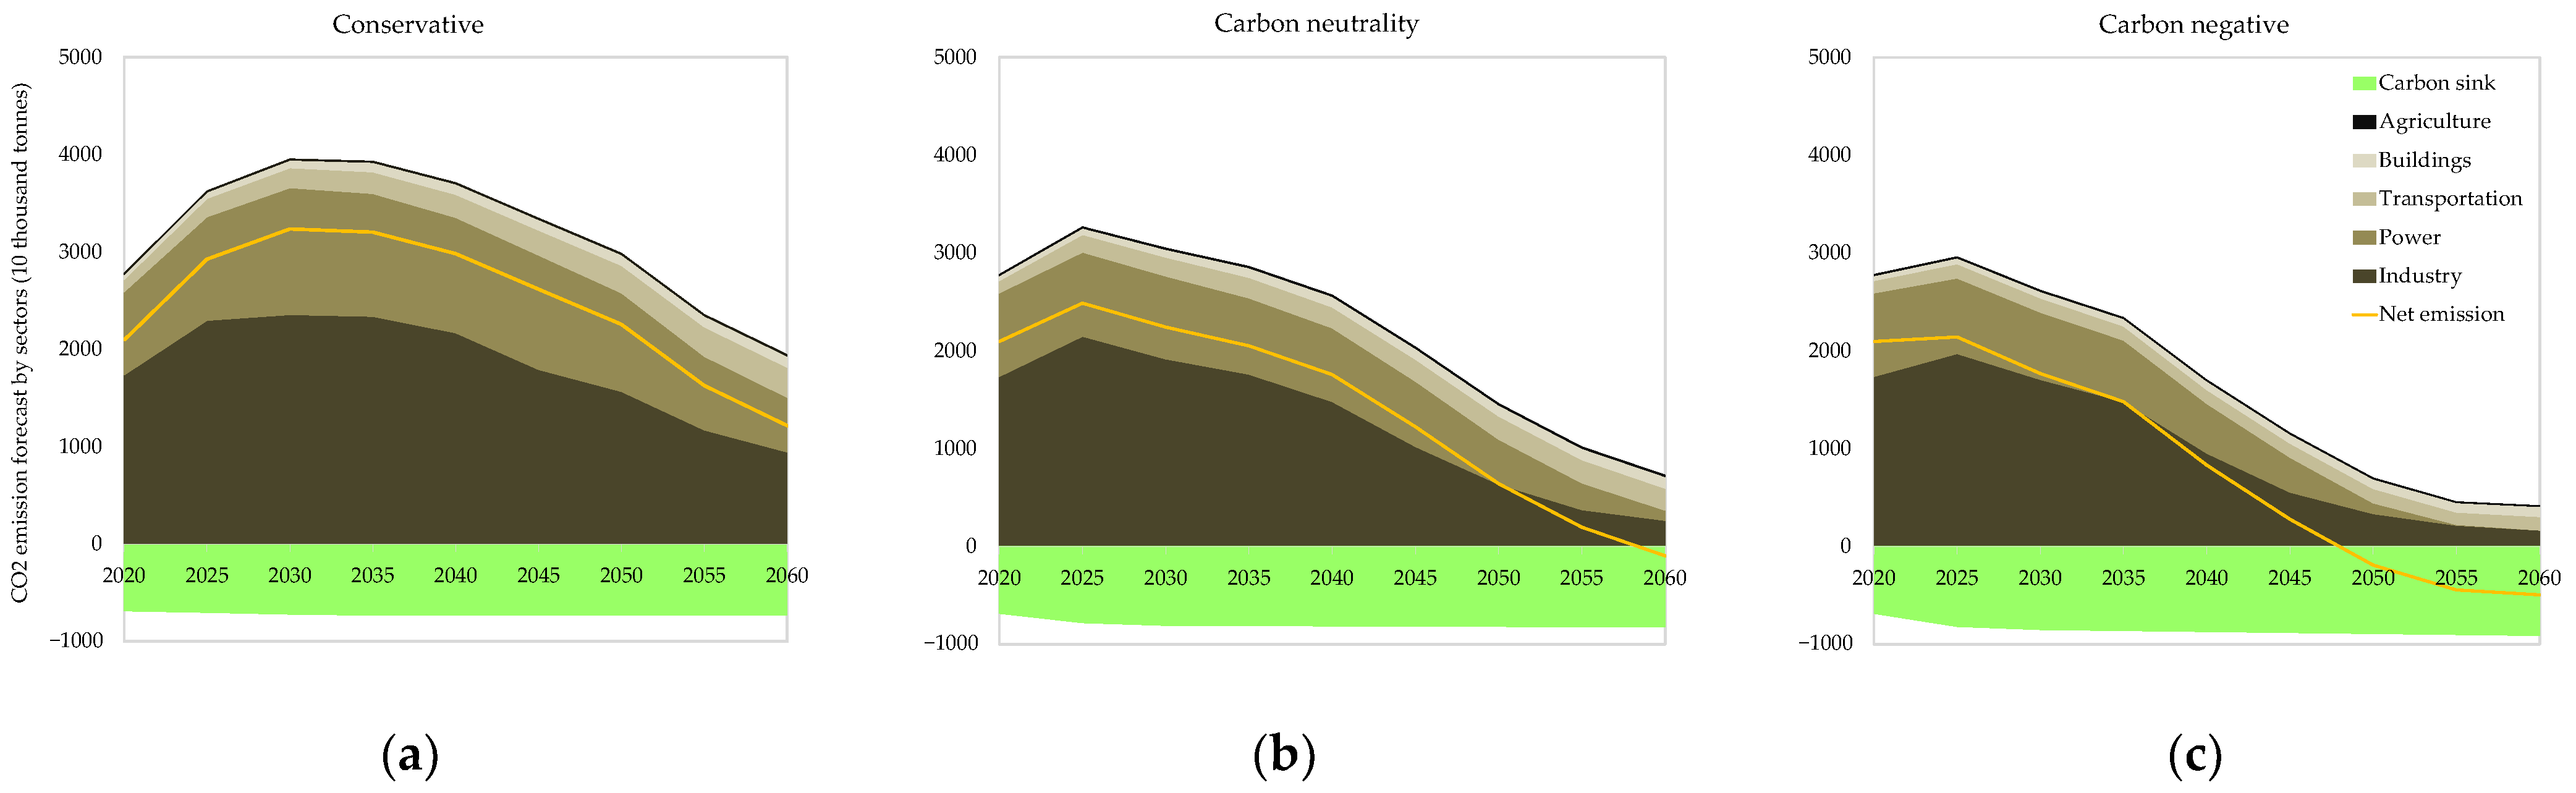
3.2. Energy and CO2 Emission Pathway

Based on the modeling framework in Section 2.2, the energy system of this case municipal city was established using LEAP software [58]. The main parameters of the five sectors were predicted according to the scenario definition in Section 3.1 and the main decarbonization solutions for the five sectors listed in Table 3.
The energy pathway and CO2 emission pathway were obtained after scenario analysis, as illustrated in Figure 6, Figure 7 and Figure 8. The most fundamental solution to reduce carbon dioxide emissions was to optimize the energy demand structure, transitioning to green and low-carbon systems. In Figure 6, the energy demands of the three scenarios show trends of rise–fall for the years 2020–2060. The proportion of fossil energy consumption decreased gradually, while the consumption of other energy types had an increasing share. In the later period, the proportion of RE consumption only increased slightly due to limited renewable resource potential. Compared to the peak energy demand in the conservative scenario, the energy demand in the carbon neutrality scenario reached a lower peak around 2040, and in the carbon-negative scenario, it reached the lowest plateau earlier, around 2030. These differences mainly resulted from changes in the process flow of energy-intensive industries (such as iron and steel), a decline in industrial product output, the evolution of energy-use technologies, and the wide popularization of high-efficiency and energy-saving technologies. In combination with the future industrial planning of this case area, an important direction is to strive to develop high-value-added industries, such as big data centers and biomedicine facilities. However, the local electricity output cannot satisfy theses electricity-intensive industries, so more electricity needs to be transferred from other cities or provinces in the future.
Figure 7 demonstrates that in the conservative scenario, the CO2 emissions reached their maximum in 2030, then declined gradually. The goal of carbon neutrality could not be achieved by 2060 in this scenario. In the carbon neutrality scenario, the peak carbon emissions appeared in 2027, and the emissions equaled the carbon sink capacity in 2058. The earlier achievement of these milestones was directly related to the lower level of fossil fuel consumption. In the carbon-negative scenario, the emissions reached their peak in 2025, and neutrality was achieved around 2050. Due to the efforts of CCS technology implementation and increasing the natural carbon sink capacity (e.g., by planting trees), this area could contribute 5000 thousand tonnes to the carbon sink by 2060.
From the perspective of the carbon reduction by the five sectors, industry had the greatest contribution, although its emissions accounted for the highest proportion of the total emissions in 2020, as depicted in Figure 8. The power sector had the second highest carbon reduction, due to the incorporation of RE and the restriction of the thermal power operating hours. There is space for the improvement of the forest carbon sink capacity in the future by increasing the forest quality, building carbon sink forests, planting high-carbon-fixation tree species, and clearing forest waste, but the overall improvement will not exceed 20%.

4. Discussion

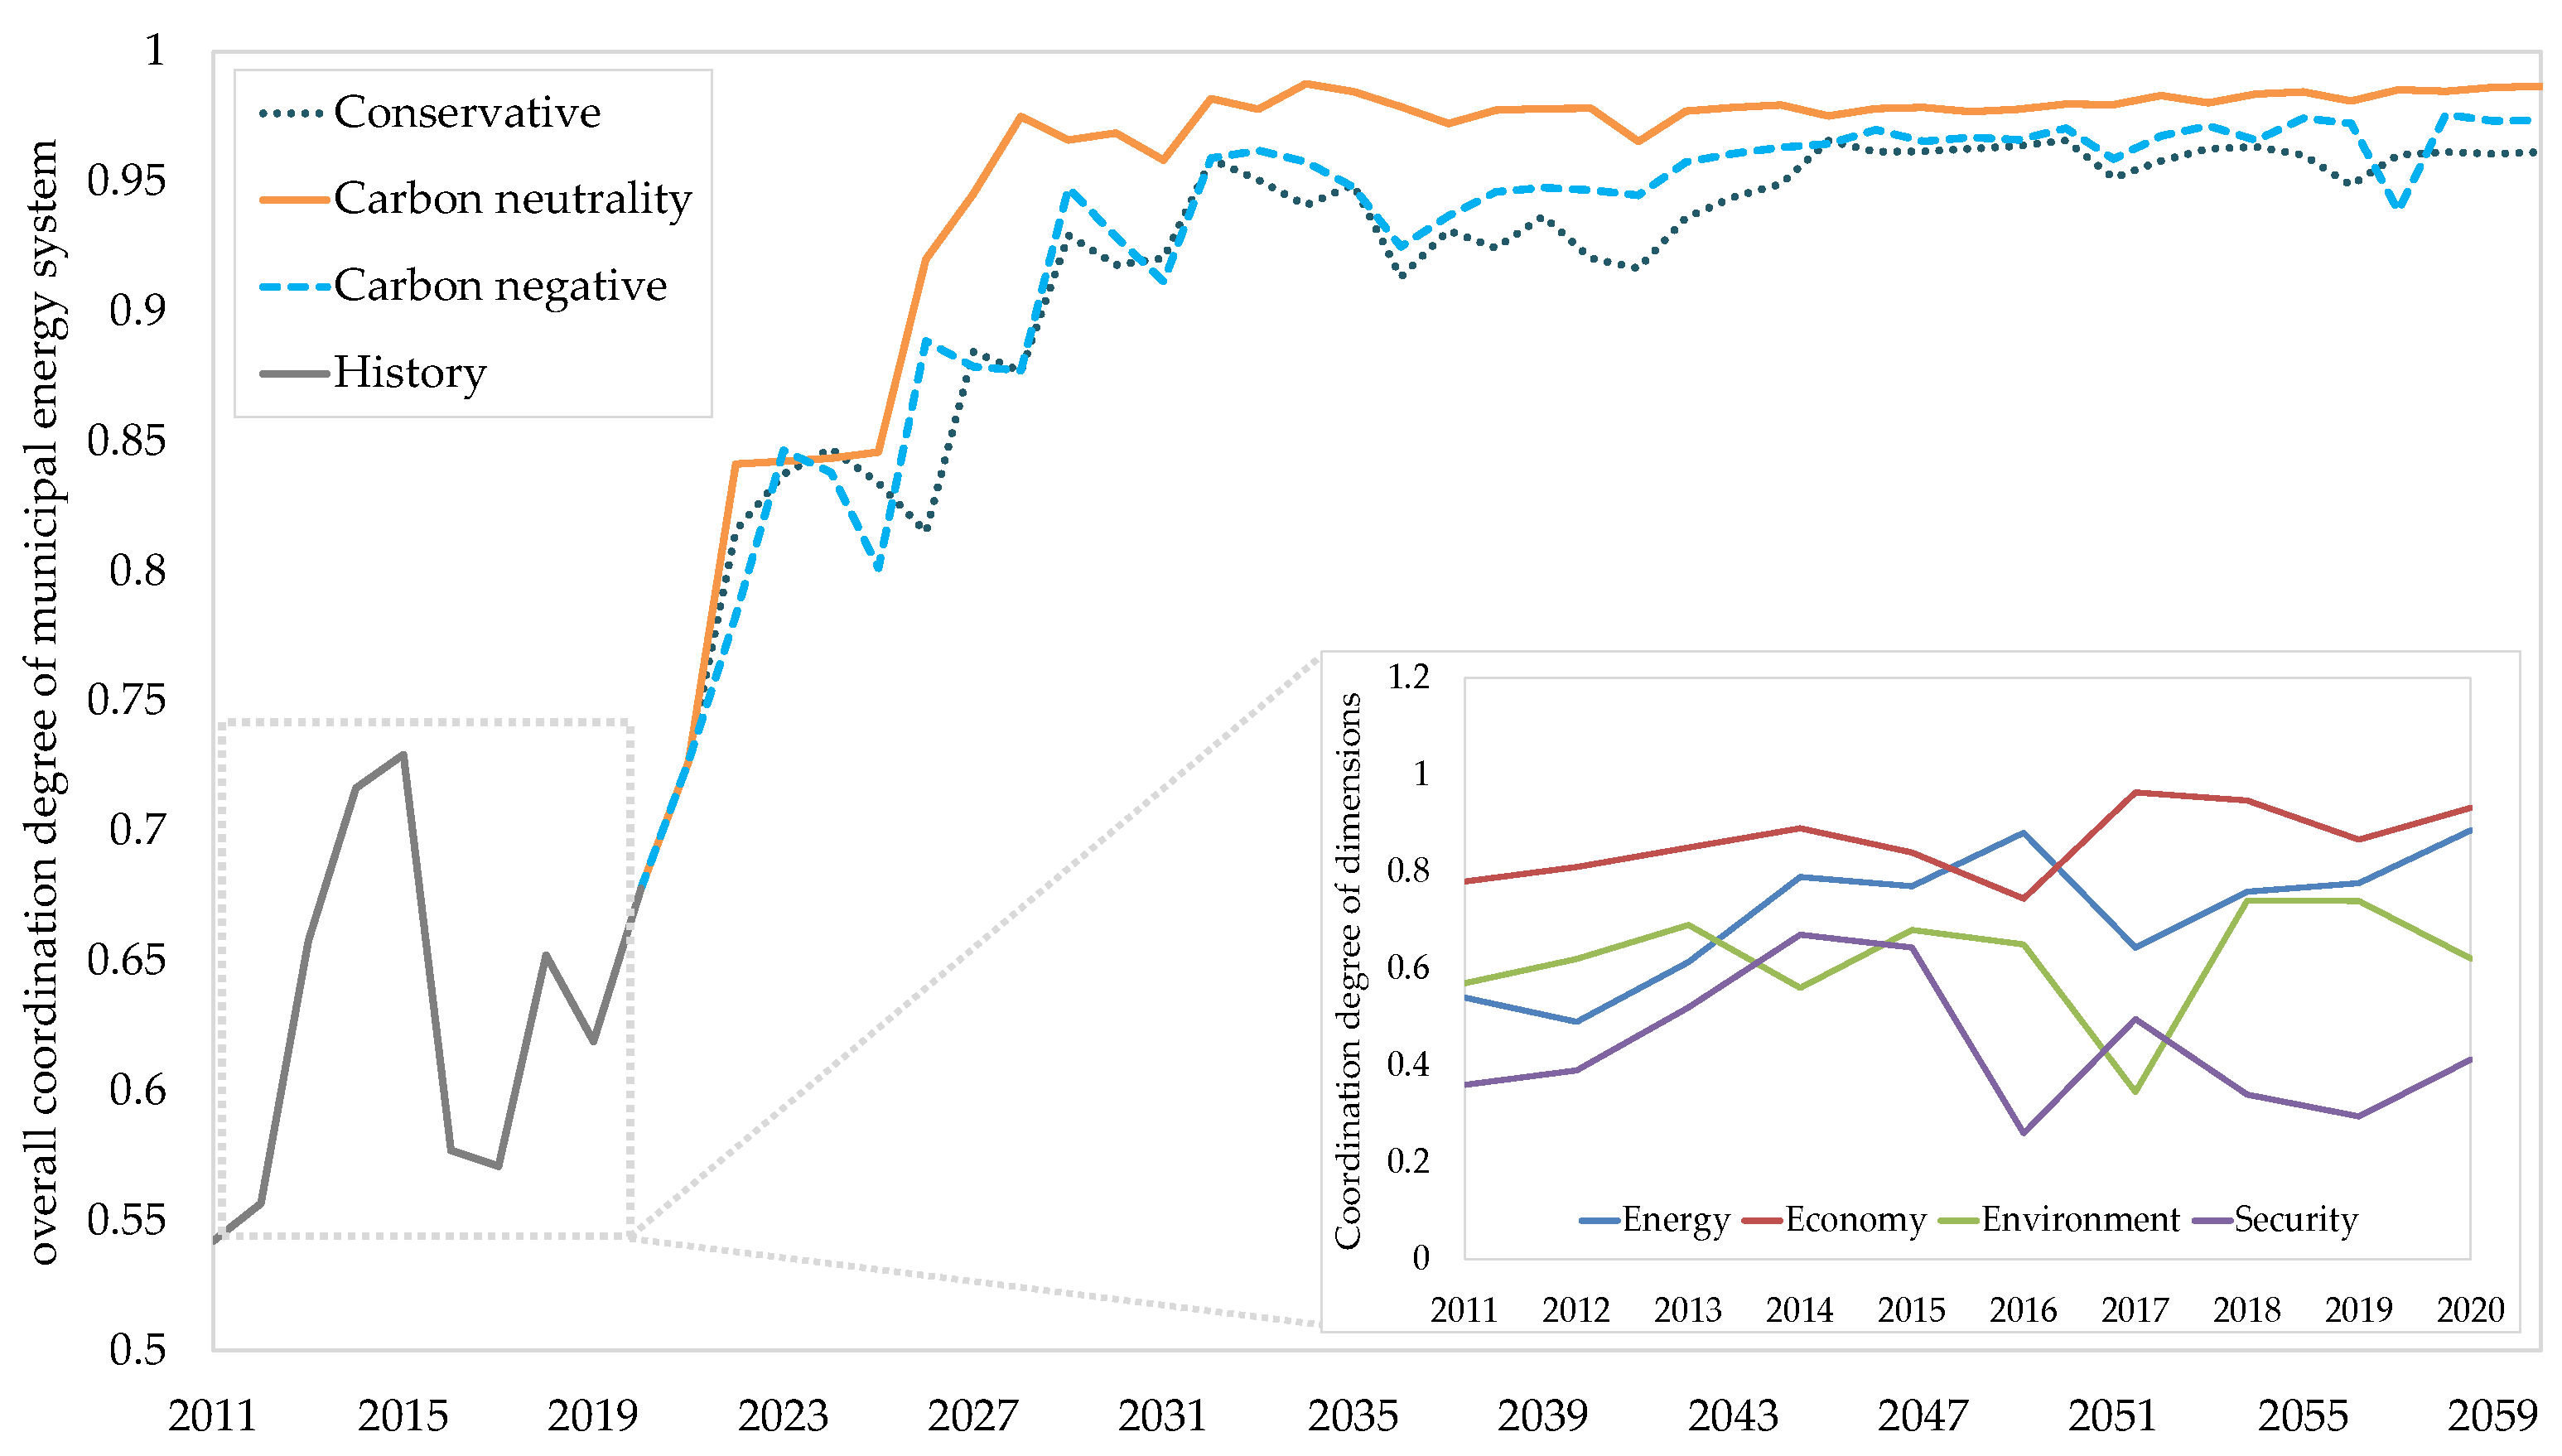
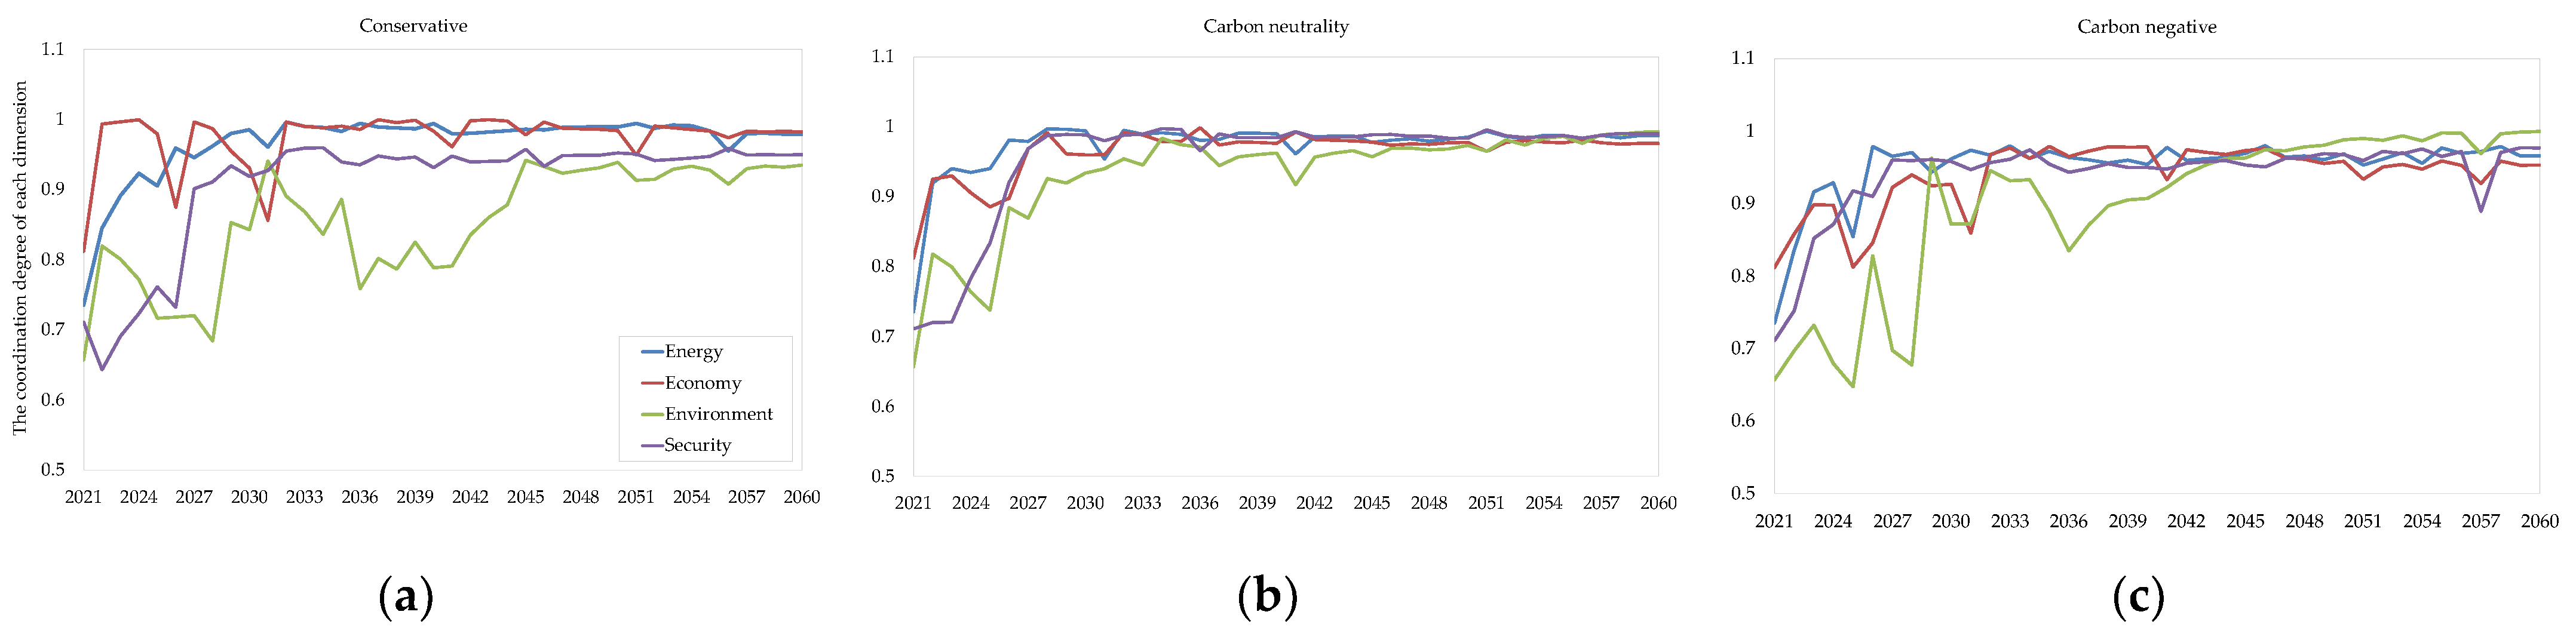
4.1. Sustaiable and Coordinated Development Evaluation

The sustainable and coordinated development evaluation of the three scenarios was conducted based on the method described in Section 2.4. Figure 9 shows the historical and future coordination levels of the different scenarios.
The historical coordination level from 2011 to 2020 was calculated as shown at the beginning of the curve in Figure 9. The overall coordination degree fluctuated around an average of 0.63 over the past 10 years. This low average fluctuation value resulted from the unbalanced development in the energy, economy, environment, and security dimensions. It can be seen from the graph in the bottom right-hand corner that the coordination degrees of environment and security were lower than those of economy and energy. Over the past 11 years, the case city experienced faster development in the economy and energy dimensions, with the GDP increasing by 117% and the energy demand rising by 48% compared to 2010. However, the energy consumption structure has always been dominated by fossil-fuel energy (over 80%), and more than 50% of the electricity is generated by coal-fired power, which has led to growing GHG emissions. Almost all the city’s fossil fuels are transported from other places, because fossil-fuel energy exploitation has been banned since 2005. Therefore, the energy security was relative low over the past 11 years.
After 2020, the overall coordination level of the three scenarios first showed a fluctuating upward trend and then tended towards the saturation value of the coordination degree. The conservative scenario had the lowest scores and the strongest fluctuation in the overall coordination level for most of the forecast years due to the little effort put into environmental and security development, as demonstrated in Figure 10a. This indicated that the current plans are not effective enough to improve the coordination level of the MES, especially in the environment dimension; this is also shown in Figure 7 and Figure 8. In contrast, the carbon neutrality scenario had a better score than the carbon-negative scenario after 2025 because of the coordinated and stable development of the 3E–S system. Indeed, the carbon-negative scenario performed best in the economy, energy, environment, and security dimensions in all three scenarios. This scenario represented an energy demand and power generation structure with a lower proportion of fossil-fuel energy, the lowest carbon emissions, the faster achievement of decarbonization targets, a higher level of electrification, and an improved carbon sink. However, its coordination scores were at a medium level. As shown in Figure 9 and Figure 10, the environment scores of the carbon-negative scenario experienced slower growth before 2045 and then a faster increase after 2045 compared to the other dimensions. This indicated that an excessive GHG emission reduction may lead to the slowdown of economic and energy development. Therefore, the consideration of the coordination level in a decarbonization pathway provides an effective way to identify the factors that may influence coordinated development.
By adjusting the relevant parameters and factors in the model, one can find the decarbonization pathway that promotes the sustainable and coordinated development of the energy, economy, environment, and security dimensions. The optimal decarbonization pathway is based on the objective of sustainable and coordinated development, as repeatedly emphasized in the main text. In order to demonstrate in detail how the evaluation results can provide feedback for adjusting the main parameters and settings, the conservative scenario is used as an example. The environment and security dimensions had lower coordination scores in this scenario, which indicated that the development rates of these two dimensions were lower than the overall development rate of the system. Conversely, the development rates for the economy and energy dimensions were higher than the system rate. This phenomenon was similar to that observed in 2011–2020, due to the setting of this scenario to maintain the current growth rate. Therefore, more efforts needed to be put into the environment and security dimensions; hence, the indicators with the highest weights in these two dimensions required adjustment. According to the weighing results, CO2 emissions and CO2 emission intensity had the highest weights in the environment dimension (3.9% and 3.8%, respectively), while in the security dimension, the highest weights were distributed between the primary energy production per capita and the self-sufficiency rate (3.6% and 3.5%, respectively). This indicated that carbon emissions needed to be further reduced and the energy consumption structure needed to be further optimized, especially in regard to RE development, which is the critical factor for increasing primary energy production and the self-sufficiency rate. Therefore, the above requirements could be met by reducing the annual production and energy intensity in the industry sector, improving the electrification level of vehicles in the transportation sector, decreasing the energy consumption per unit area in the building and agriculture sectors, accelerating the replacement of thermal power generation by RE generation, etc. After the adjustment of key parameters, the decarbonization pathway was transformed from the conservative scenario to the carbon neutrality scenario with lower carbon emissions, a better energy structure, and a higher proportion of RE. The highest overall coordination development level was obtained, which indicated that this decarbonization path was coordinated and sustainable. Therefore, this evaluation method would be helpful to government decision makers for quantitatively evaluating planning paths.

4.2. Recommendations

4.2.1. Decarbonization Pathway for the Case City

According to evaluation and analysis, the carbon neutrality scenario was appropriate for the case city. The CO2 emissions would peak at 33,000 thousand tonnes by 2027 and decrease to 8300 thousand tonnes in 2058 to achieve carbon neutrality. This huge emission reduction would result from great efforts and measures taken in the industry, power, transportation, building, and agriculture sectors, mainly including the following:
  • The steel industry needs to control the production of crude steel by 2030, with an increase of no more than 18%. In the meantime, a circular economy should be actively promoted by replacing the long-term steel production process with a short-term steel production process. The energy consumption per ton of steel would decrease by about 3/4. The restriction of cement production and improved energy efficiency in the cement industry could save 5–10% of fuel before 2030. CCS should be considered for those subsectors where fossil fuels are still needed.
  • RE plays a crucial role in the decarbonization of the power sector. The proportion of RE power generation, mainly including PV, wind turbines, hydropower, and biomass power, would increase from 40% in 2020 to 88% in 2060. On the other hand, the role of coal-fired power should gradually transition to an emergency and regulatory power supply.
  • In the transportation sector, public transport and logistics distribution vehicles should be fully electrified by 2025, which is predicted to save 28 thousand tonnes of fuel and 330 thousand tonnes of emissions every year. All diesel heavy trucks should transition to hydrogen fuel power, leading to a reduction of 9000 tonnes of diesel. The application of shore power and LNG is important for emission reductions by transport ships.
  • In the building sector, the implementation of green and low-energy-consuming building standards should be promoted in an orderly manner. The demonstration of zero-energy-consumption and zero-carbon structures are recommended first for new buildings. For existing buildings, energy-saving technologies should be considered, such as high-performance envelope structures and integrated energy supply schemes. Additionally, integrated photovoltaic systems are an effective solution to optimizing a building’s energy supply system, and 1000 MW roof photovoltaic systems should be installed by 2030. Cooking energy sources (e.g., gas) should be replaced by electric appliances, such as induction cookers and electric water heaters.
  • In the agriculture sector, agricultural machinery should be electrified or transitioned to hydrogen fuel power, reducing carbon dioxide emissions by 30 thousand tonnes each year. Agricultural and forestry wastes, biogas, biogas slurry, and biogas residue could be utilized as biomass energy to provide electricity.
Most notably, strong policy support is necessary for MES decarbonization. For example, the large-scale development of RE may bring excess renewable electricity, which would need support from grid companies to achieve the 100% consumption of RE power. Furthermore, carbon-sink exchange systems should be established as soon possible. Based on relevant policies from the government, these can be implemented efficiently, smoothly, and in a standardized manner.

4.2.2. The Role of Various Stakeholders

The central government plays a leading role in achieving carbon neutrality at the national level. It is important for central authorities to bridge the financial gap, create a fair competitive environment, balance the resources and carbon reduction potential of different regions, and drive the synergy of the market, policy, and technology. According to Goldman Sachs projections [3], the annual cost will be up to USD 1.8 trillion on the path to net-zero carbon in China, which accounts for more than 10% of China’s GDP in 2021. This huge cost will bring pressure and risks to the investment interest of enterprises. In this situation, the relevant policy and financial support from the government would be helpful, especially in the fields where zero-carbon technologies are needed. On the other hand, a fair competitive environment would ensure that the responsible subjects bear part of the carbon emission cost, e.g., through a carbon trading market. Meanwhile, China has vast territory with large gaps in the regional development resource bases. To avoid aggravating the imbalance in regional development on the way to achieving carbon neutrality, the central government should provide assistance based on resource endowment and development foundations. Market, policy, and technology are equally important to promote the achievement of the net-zero carbon target. Policies can help the development of new technologies and further establish the market system. At municipal level, the central government should mainly focus on guiding and supervising the carbon reduction process of municipal authorities, interfering only when necessary.
Based on the local conditions, municipal authorities are mainly responsible for overall planning, including specific development goals and carbon reduction targets for different stages and sectors, such as the industry, power, transportation, building, and agriculture sectors, and the carbon sink. Every key task is supervised by corresponding municipal departments. For example, developing RE is usually supervised by the municipal energy bureau, while the municipal transportation bureau takes the lead in the low-carbon transformation of public transport. Similar to the role of the central government, supporting policy, technology, and the market is also important for municipal authorities. Unified carbon emission accounting and other supporting policies play key roles in pushing forward the development of technologies through innovation mechanisms and systems, personnel training, research on the application of low-carbon technologies, demonstration, etc. Moreover, the municipal government should use the news media to increase publicity about carbon neutrality and promoting a green, low-carbon way of life and production.
Local businesses are the main contributors to achieving carbon neutrality in municipal cities. Different types of enterprises have various solutions to reducing carbon emissions. Traditional energy-intensive enterprises, such as the steel, cement, and chemical industries, increase energy efficiency and reduce energy consumption by applying low-carbon technologies and improving processes. For power plants and emerging industries, the use of renewable energy to replace traditional energy generation can effectively reduce emissions. Other effective approaches can be adopted by local businesses, including product innovation, equipment upgrades, technological innovation, recycling, a sharing economy, and environment–social–governance (ESG) development.
From the perspective of carbon reduction potential, inhabitants are also important participants. A green low-carbon lifestyle is recommended for residents, which mainly focuses on low-carbon travel, energy conservation, environmental protection, green spending habits, a low-carbon diet, and eliminating waste.
Finally, scientific researchers provide technical R&D support for achieving carbon neutrality. A number of core and key technologies are in urgent need of breakthroughs in different fields, including renewable energy, industry, green buildings, new-energy vehicles, carbon sink ecosystems, and resource recycling. Exploring the integration and application of renewable energy technology, power system technology, and information technology in the agriculture, industry, transportation, building and other sectors is also a necessary challenge for researchers.

5. Conclusions

This study established a complete decarbonization framework for MESs, including general research procedures, modeling, and a sustainable evaluation method. The energy system model was constructed based on LEAP and represented several improvements on the CO2 emissions model, considering in addition the carbon sink and the impact of input and output electricity on emissions. Notably, the sustainable evaluation method based on the 3E–S indicators is an effective way to evaluate the overall coordination level of different scenarios. It can be used to compare scenarios quantitatively from the dimensions of energy, economy, environment, and security. The analysis results of the municipal case city in Guangdong demonstrated that this evaluation method was able to identify the factors that may influence coordinated development. By adjusting the relevant parameters and factors in the model, one can identify the optimal decarbonization pathway to promote sustainable and coordinated development, thus helping government decision makers to quantitatively evaluate planning paths. Moreover, different stakeholders play various roles in achieving carbon neutrality. The central government is in a dominant and leading position at the national level while playing guiding and supervising roles at the municipal level. On the path to net-zero carbon in municipal cities, local authorities are mainly responsible for overall planning, goal establishment, and implementation supervision, while local enterprises and inhabitants are the main participants and contributors. As for scientific researchers, the R&D of low-carbon technologies and policy mechanisms are solid supports for achieving carbon neutrality.

Supplementary Materials

The following supporting information can be downloaded at: https://www.mdpi.com/article/10.3390/en15197443/s1.

Author Contributions

The individual contributions of each of the five authors, W.C., Y.W., J.Z., W.D. and Y.J., were as follows: conceptualization, W.C., Y.W., J.Z. and W.D.; methodology, W.C., Y.W., W.D. and Y.J.; software, W.C.; formal analysis, Y.W., W.C., J.Z., W.D. and Y.J.; investigation, Y.W., W.C., J.Z., W.D. and Y.J.; data curation, W.C.; writing—original draft preparation, W.C., W.D., J.Z. and Y.J.; writing—review and editing, Y.W.; supervision, Y.W. All authors have read and agreed to the published version of the manuscript.

Funding

This research was supported by the Strategic Priority Research Program of the Chinese Academy of Sciences, grant No. XDA21010104, and the National Key R&D Program Intergovernmental International Science and Technology Innovation Cooperation Project “Sino-US Green Community DC Microgrid Technology Cooperation Research”, grant No. 2019YFE0120200.

Data Availability Statement

Not applicable.

Conflicts of Interest

The authors declare no conflict of interest.

References

  1. United Nations. Paris Agreement. Available online: https://unfccc.int/process-and-meetings/the-paris-agreement/the-paris-agreement (accessed on 17 September 2021).
  2. School of the Environmental Nanjing University. Optimization of Suzhou’s Carbon Emissions Peak Roadmap and a Long-Term Vision for 2050; World Resources Institute: Suzhou, Jiangsu, 2020. [Google Scholar]
  3. Goldman Sachs. Carbonomics China Net Zero: The Clean Tech Revolution; Goldman Sachs: New York, NY, USA, 2021. [Google Scholar]
  4. CGTN. Xi Jinping’s Speech at the General Debate of the 75th Session of the United Nations General Assembly. Available online: https://news.cgtn.com/news/2020-09-23/Full-text-Xi-Jinping-s-speech-at-General-Debate-of-UNGA-U07X2dn8Ag/index.html (accessed on 1 September 2021).
  5. National Development and Reform Commision. Report on The Implementation of the 2020 Plan for National Economic and Social Development and on the 2021 Draft Plan for National Economic and Social Development; Xinhua’s News Agency: Beijing, China, 2021. [Google Scholar]
  6. British Petroleum. BP Statistical Review of World Energy. Available online: https://www.bp.com/en/global/corporate/energy-economics/statistical-review-of-world-energy/co2-emissions.html (accessed on 10 October 2021).
  7. Burandt, T.; Xiong, B.; Löffler, K.; Oei, P.-Y. Decarbonizing China’s energy system—Modeling the transformation of the electricity, transportation, heat, and industrial sectors. Appl. Energy 2019, 255, 113820. [Google Scholar] [CrossRef]
  8. The State Council of China. Opinions on Completely, Accurately and Comprehensively Implementing the New Development Concept and Doing a Good Job in Carbon Peak and Carbon Neutralization. Available online: http://www.gov.cn/zhengce/2021-10/24/content_5644613.htm (accessed on 25 August 2021).
  9. The State Council of China. The Action for Peaking Carbon Dioxide Emissions before 2030. Available online: http://www.gov.cn/gongbao/content/2021/content_5649731.htm (accessed on 25 August 2021).
  10. Luo, S.; Hu, W.; Liu, W.; Xu, X.; Huang, Q.; Chen, Z.; Lund, H. Transition pathways towards a deep decarbonization energy system—A case study in Sichuan, China. Appl. Energy 2021, 302, 117507. [Google Scholar] [CrossRef]
  11. Hofbauer, L.; McDowall, W.; Pye, S. Challenges and opportunities for energy system modelling to foster multi-level governance of energy transitions. Renew. Sustain. Energy Rev. 2022, 161, 112330. [Google Scholar] [CrossRef]
  12. Pye, S.; Usher, W.; Strachan, N. The uncertain but critical role of demand reduction in meeting long-term energy decarbonisation targets. Energy Policy 2014, 73, 575–586. [Google Scholar] [CrossRef] [Green Version]
  13. Pye, S.; Sabio, N.; Strachan, N. An integrated systematic analysis of uncertainties in UK energy transition pathways. Energy Policy 2015, 87, 673–684. [Google Scholar] [CrossRef] [Green Version]
  14. Lyu, C.; Ou, X.; Zhang, X. China automotive energy consumption and greenhouse gas emissions outlook to 2050. Mitig. Adapt. Strateg. Glob. Chang. 2014, 20, 627–650. [Google Scholar] [CrossRef]
  15. Zhou, N.; Fridley, D.; Khanna, N.Z.; Ke, J.; McNeil, M.; Levine, M. China’s energy and emissions outlook to 2050: Perspectives from bottom-up energy end-use model. Energy Policy 2013, 53, 51–62. [Google Scholar] [CrossRef]
  16. Cai, W.; Wang, C.; Chen, J.; Wang, K.; Zhang, Y.; Lu, X. Comparison of CO2 emission scenarios and mitigation opportunities in China’s five sectors in 2020. Energy Policy 2008, 36, 1181–1194. [Google Scholar] [CrossRef]
  17. U.S. Energy Information Administration. Annual Energy Outlook 2020 with Projections to 2050; U.S. Department of Energy: Washington, DC, USA, 2022. [Google Scholar]
  18. Brown, M.A.; Kim, G.; Smith, A.M.; Southworth, K. Exploring the impact of energy efficiency as a carbon mitigation strategy in the U.S. Energy Policy 2017, 109, 249–259. [Google Scholar] [CrossRef]
  19. Shukla, P.R.; Dhar, S.; Mahapatra, D. Low-carbon society scenarios for India. Clim. Policy 2008, 8, S156–S176. [Google Scholar] [CrossRef]
  20. Song, Q.; Han, S.; Rong, N.; Ao, W.; Huang, H.; Wei, Y. Decarbonization pathways of China’s provincial energy systems under carbon constraints: A case study of Guizhou Province. Energy Rep. 2022, 8, 9363–9378. [Google Scholar] [CrossRef]
  21. Liu, Y.; Chen, S.; Jiang, K.; Kaghembega, W.S.-H. The gaps and pathways to carbon neutrality for different type cities in China. Energy 2022, 244, 122596. [Google Scholar] [CrossRef]
  22. Sani, L.; Khatiwada, D.; Harahap, F.; Silveira, S. Decarbonization pathways for the power sector in Sumatra, Indonesia. Renew. Sustain. Energy Rev. 2021, 150, 111507. [Google Scholar] [CrossRef]
  23. Backe, S.; Zwickl-Bernhard, S.; Schwabeneder, D.; Auer, H.; Korpås, M.; Tomasgard, A. Impact of energy communities on the European electricity and heating system decarbonization pathway: Comparing local and global flexibility responses. Appl. Energy 2022, 323, 119470. [Google Scholar] [CrossRef]
  24. Zhang, W.; Meng, Z.; Yang, J.; Song, Y.; Zhou, Y.; Zhao, C.; Yuan, J. Managing the phaseout of coal power: A comparison of power decarbonization pathways in Jilin Province. Resour. Conserv. Recycl. 2022, 180, 106216. [Google Scholar] [CrossRef]
  25. Verástegui, F.; Lorca, Á.; Olivares, D.; Negrete-Pincetic, M. Optimization-based analysis of decarbonization pathways and flexibility requirements in highly renewable power systems. Energy 2021, 234, 121242. [Google Scholar] [CrossRef]
  26. Li, Z.; Siyuan, C.; Wenjuan, D.; Liu, P.; Ershun, D.U.; Linwei, M.A. Low carbontransition pathway of power sector under carbon emission constraints. Proc. CSEE 2021, 41, 3987–4000. [Google Scholar] [CrossRef]
  27. Zuo, J.; Read, B.; Pullen, S.; Shi, Q. Achieving carbon neutrality in commercial building developments—Perceptions of the construction industry. Habitat Int. 2012, 36, 278–286. [Google Scholar] [CrossRef]
  28. Fumo, N.; Torres, M.J.; Broomfield, K. A multiple regression approach for calibration of residential building energy models. J. Build. Eng. 2021, 43, 102874. [Google Scholar] [CrossRef]
  29. Leibowicz, B.D.; Lanham, C.M.; Brozynski, M.T.; Vázquez-Canteli, J.R.; Castejón, N.C.; Nagy, Z. Optimal decarbonization pathways for urban residential building energy services. Appl. Energy 2018, 230, 1311–1325. [Google Scholar] [CrossRef]
  30. Tang, B.-J.; Guo, Y.-Y.; Yu, B.; Harvey, L.D.D. Pathways for decarbonizing China’s building sector under global warming thresholds. Appl. Energy 2021, 298, 117213. [Google Scholar] [CrossRef]
  31. Garimella, S.; Lockyear, K.; Pharis, D.; El Chawa, O.; Hughes, M.T.; Kini, G. Realistic pathways to decarbonization of building energy systems. Joule 2022, 6, 956–971. [Google Scholar] [CrossRef]
  32. Zhang, R.; Zhang, J. Long-term pathways to deep decarbonization of the transport sector in the post-COVID world. Transp. Policy 2021, 110, 28–36. [Google Scholar] [CrossRef]
  33. Sroufe, R.; Watts, A. Pathways to Agricultural Decarbonization: Climate Change Obstacles and Opportunities in the US. Resour. Conserv. Recycl. 2022, 182, 106276. [Google Scholar] [CrossRef]
  34. Ugarte, D.D.L.T.; Collado, M.; Requejo, F.; Gomez, X.; Heros, C. A deep decarbonization pathway for Peru’s rainforest. Energy Strategy Rev. 2021, 36, 100675. [Google Scholar] [CrossRef]
  35. Ren, M.; Lu, P.; Liu, X.; Hossain, M.S.; Fang, Y.; Hanaoka, T.; O’Gallachoir, B.; Glynn, J.; Dai, H. Decarbonizing China’s iron and steel industry from the supply and demand sides for carbon neutrality. Appl. Energy 2021, 298, 117209. [Google Scholar] [CrossRef]
  36. Yuan, X.; Su, C.W.; Umar, M.; Shao, X.; Lobont, O.R. The race to zero emissions: Can renewable energy be the path to carbon neutrality? J. Environ. Manag. 2022, 308, 114648. [Google Scholar] [CrossRef]
  37. Jin, Y.; Hu, S.; Zhang, Z.; Zhu, B.; Bai, D. The path to carbon neutrality in China: A paradigm shift in fossil resource utilization. Resour. Chem. Mater. 2022, 1, 129–135. [Google Scholar] [CrossRef]
  38. Zhao, F. Empirical study on the coordinated development of China’s energy-economy-environment (3E). Economist 2009, 12, 35–41. [Google Scholar]
  39. Pan, A.; Wang, Q.; Yang, Q. Assessment on the coordinated development oriented to Green City in China. Ecol. Indic. 2020, 116, 106486. [Google Scholar] [CrossRef]
  40. Zhang, H.; Geng, C.; Wei, J. Coordinated development between green finance and environmental performance in China: The spatial-temporal difference and driving factors. J. Clean. Prod. 2022, 346, 131150. [Google Scholar] [CrossRef]
  41. Fan, Y.; Fang, C.; Zhang, Q. Coupling coordinated development between social economy and ecological environment in Chinese provincial capital cities-assessment and policy implications. J. Clean. Prod. 2019, 229, 289–298. [Google Scholar] [CrossRef]
  42. Zhao, L.; Zhang, G. Evaluation and welfare effect of coordinated ecological development of the Beijing–Tianjin–Hebei region. Chin. J. Popul. Resour. Environ. 2021, 19, 283–290. [Google Scholar] [CrossRef]
  43. Tao, A. Study on the path of coordinated development between carbon emission reduction and economy in Guangdong Province. Energy Rep. 2022, 8, 477–481. [Google Scholar] [CrossRef]
  44. Kumbaroğlu, G.S. Environmental taxation and economic effects: A computable general equilibrium analysis for Turkey. J. Policy Model. 2003, 25, 795–810. [Google Scholar] [CrossRef]
  45. United Nations Development Programme, United Nations Department of Economic and Social Affairs.; World Energy Council. World Energy Assessment: Energy and the Challenge of Sustainability; United Nations: New York, NY, USA, 2000. [Google Scholar]
  46. Zen, A.; Lima, A.; Bianchi, A.; Babot, L. Sustainability, Energy and Development: A Proposal of Indicators. Int. J. Infonomics 2012, 5, 537–541. [Google Scholar] [CrossRef] [Green Version]
  47. Gunnarsdottir, I.; Davidsdottir, B.; Worrell, E.; Sigurgeirsdottir, S. Review of indicators for sustainable energy development. Renew. Sustain. Energy Rev. 2020, 133, 110294. [Google Scholar] [CrossRef]
  48. Initiative, T.U.C. China Urban Sustainability Index (USI); McKinsey Global Institute, Urban China Initiative: Beijing, China, 2016. [Google Scholar]
  49. Keirstead, J. Selecting sustainability indicators for urban energy systems. In Proceedings of the International Conference on Whole Life Urban Sustainability and Its Assessment, Glasgow, UK, 1 January 2007. [Google Scholar]
  50. Zolfani, S.H.; Saparauskas, J. New Application of SWARA Method in Prioritizing Sustainability Assessment Indicators of Energy System. Eng. Econ. 2014, 24. [Google Scholar] [CrossRef] [Green Version]
  51. Linton, S.; Clarke, A.; Tozer, L. Technical pathways to deep decarbonization in cities: Eight best practice case studies of transformational climate mitigation. Energy Res. Soc. Sci. 2022, 86, 102422. [Google Scholar] [CrossRef]
  52. Klemm, C.; Vennemann, P. Modeling and optimization of multi-energy systems in mixed-use districts: A review of existing methods and approaches. Renew. Sustain. Energy Rev. 2021, 135, 110206. [Google Scholar] [CrossRef]
  53. Plazas-Niño, F.A.; Ortiz-Pimiento, N.R.; Montes-Páez, E.G. National energy system optimization modelling for decarbonization pathways analysis: A systematic literature review. Renew. Sustain. Energy Rev. 2022, 162, 112406. [Google Scholar] [CrossRef]
  54. DeCarolis, J.; Daly, H.; Dodds, P.; Keppo, I.; Li, F.; McDowall, W.; Pye, S.; Strachan, N.; Trutnevyte, E.; Usher, W.; et al. Formalizing best practice for energy system optimization modelling. Appl. Energy 2017, 194, 184–198. [Google Scholar] [CrossRef] [Green Version]
  55. Kueppers, M.; Paredes Pineda, S.N.; Metzger, M.; Huber, M.; Paulus, S.; Heger, H.J.; Niessen, S. Decarbonization pathways of worldwide energy systems—Definition and modeling of archetypes. Appl. Energy 2021, 285, 116438. [Google Scholar] [CrossRef]
  56. Lallana, F.; Bravo, G.; Le Treut, G.; Lefèvre, J.; Nadal, G.; Di Sbroiavacca, N. Exploring deep decarbonization pathways for Argentina. Energy Strategy Rev. 2021, 36, 100670. [Google Scholar] [CrossRef]
  57. Di Leo, S.; Pietrapertosa, F.; Salvia, M.; Cosmi, C. Contribution of the Basilicata region to decarbonisation of the energy system: Results of a scenario analysis. Renew. Sustain. Energy Rev. 2021, 138, 110544. [Google Scholar] [CrossRef]
  58. Stockholm Environment Institute. Low Emissions Analysis Platform (LEAP). Available online: https://leap.sei.org/ (accessed on 15 June 2021).
  59. National Bureau of Statistics of China. China Statistical Yearbook 2021. Available online: http://www.stats.gov.cn/tjsj/ndsj/2021/indexch.htm (accessed on 14 May 2021).
  60. Energy Transitions Commission. China 2050: A Fully Developed Rich Zero-Carbon Economy; Energy Transitions Comission: London, UK, 2019. [Google Scholar]
  61. Dictionary Communication Editorial Committee. Dictionary of Communication; Shanghai Jiao Tong University Press: Shanghai, China, 2005. [Google Scholar]
  62. IPCC. 2006 IPCC Guidelines for National Greenhouse Gas Inventories; Institute for Global Environmental Strategies (IGES): Kanagawa, Japan, 2006. [Google Scholar]
  63. ARCADIS. Sustainable Cities Index (SCI). Available online: http://www.sustainablecitiesindex.com/ (accessed on 22 August 2022).
  64. Mannu, A. Sustainable City Index 2.0 (SCI2); Sustainable Society Foundation: The Hague, The Netherlands, 2017. [Google Scholar]
  65. International Atomic Energy Agency. Energy Indicators for Sustainable Development: Guidelines and Methodologies; International Atomic Energy Agency: Vienna, Austria, 2005. [Google Scholar]
  66. Yang, L. Study on Regional Energy Development Strategy and its Evaluation Model. Ph.D. Thesis, Tianjin University, Tianjin, China, 2009. [Google Scholar]
  67. Marquez-Ballesteros, M.-J.; Mora-López, L.; Lloret-Gallego, P.; Sumper, A.; Sidrach-de-Cardona, M. Measuring urban energy sustainability and its application to two Spanish cities: Malaga and Barcelona. Sustain. Cities Soc. 2019, 45, 335–347. [Google Scholar] [CrossRef]
  68. Schlör, H.; Fischer, W.; Hake, J.-F. Methods of measuring sustainable development of the German energy sector. Appl. Energy 2013, 101, 172–181. [Google Scholar] [CrossRef]
  69. IESE. Cities in Motion; University of Navarra: Pamplona, Spain, 2018. [Google Scholar]
  70. Kearney, A.T. 2018 Global Cities Report: Learning from the East-Insights from China’s Urban Success. Available online: https://www.atkearney.com/global-cities/full-report. (accessed on 22 August 2022).
  71. Abdullah, F.B.; Iqbal, R.; Jawaid, M.; Memon, I.; Mughal, S.; Memon, F.S.; Ali Rizvi, S.S. Energy security index of Pakistan (ESIOP). Energy Strategy Rev. 2021, 38, 100710. [Google Scholar] [CrossRef]
  72. Sharifuddin, S. Methodology for quantitatively assessing the energy security of Malaysia and other southeast Asian countries. Energy Policy 2014, 65, 574–582. [Google Scholar] [CrossRef]
  73. Erahman, Q.F.; Purwanto, W.W.; Sudibandriyo, M.; Hidayatno, A. An assessment of Indonesia’s energy security index and comparison with seventy countries. Energy 2016, 111, 364–376. [Google Scholar] [CrossRef]
  74. Zhang, L.; Yu, J.; Sovacool, B.K.; Ren, J. Measuring energy security performance within China: Toward an inter-provincial prospective. Energy 2017, 125, 825–836. [Google Scholar] [CrossRef]
  75. Zhang, L.; Bai, W.; Xiao, H.; Ren, J. Measuring and improving regional energy security: A methodological framework based on both quantitative and qualitative analysis. Energy 2021, 227, 120534. [Google Scholar] [CrossRef]
  76. Kosai, S.; Unesaki, H. Quantitative evaluation of security of nuclear energy supply: United States as a case study. Energy Strategy Rev. 2020, 29, 100491. [Google Scholar] [CrossRef]
  77. Asbahi, A.A.M.H.A.; Gang, F.Z.; Iqbal, W.; Abass, Q.; Mohsin, M.; Iram, R. Novel approach of Principal Component Analysis method to assess the national energy performance via Energy Trilemma Index. Energy Rep. 2019, 5, 704–713. [Google Scholar] [CrossRef]
  78. Martchamadol, J.; Kumar, S. The Aggregated Energy Security Performance Indicator (AESPI) at national and provincial level. Appl. Energy 2014, 127, 219–238. [Google Scholar] [CrossRef]
Figure 1. The procedures of energy system decarbonization pathways (simulation).
Energies 15 07443 g001
Figure 2. The modeling framework of municipal decarbonization pathway planning.
Energies 15 07443 g002
Figure 3. The primary energy demand and energy intensity from 2010 to 2020.
Energies 15 07443 g003
Figure 4. Sankey diagram of energy flow in 2020. Services industry consists of transportation and commercial sectors.
Energies 15 07443 g004
Figure 5. The CO2 emissions and CO2 emission intensity from 2010 to 2020.
Energies 15 07443 g005
Figure 6. The fuel energy demand forecast for the three scenarios: (a) conservative scenario; (b) carbon neutrality scenario; (c) carbon-negative scenario.
Energies 15 07443 g006
Figure 7. The CO2 emission forecast for the three scenarios.
Energies 15 07443 g007
Figure 8. The CO2 emissions and net emissions forecast for the sectors and carbon sink in the three scenarios: (a) conservative scenario; (b) carbon neutrality scenario; (c) carbon-negative scenario.
Energies 15 07443 g008
Figure 9. The overall coordination degree of MES from 2011 to 2060.
Energies 15 07443 g009
Figure 10. The coordination degree of each dimension for the three scenarios: (a) conservative scenario; (b) carbon neutrality scenario; (c) carbon-negative scenario.
Energies 15 07443 g010
Table 1. The expressions for energy demand in different sectors [59,60,61].
SectorSubsectorEnergy DemandExplanations
IndustryAll P t , s E F i , t , s Pt,s = annual production
EFi,t,s = energy-use coefficient per unit output
G O V t , s E F V i , t , s GOVt,s = industrial output value
E F V i , t , s = energy-use coefficient per unit output value
TransportationRoad ( P s , t u r n o v e r + F s , t u r n o v e r ) F E t , s ρ i , t , s δ i , t , s Ps,turnover = passenger turnover
Fs,turnover = freight turnover
FEt,s = fuel economy
ρ i , t , s = density of fuel i
δ i , t , s = conversion coefficient of standard coal
Rail
Waterborne
Air
BuildingResidential S t , s E F A i , t , s St,s = building space
EFAi,t,s = energy consumption per unit area
Public
Construction
AgricultureAll A t , s E F I i , t , s A t , s = area of agricultural production activity
E F I i , t , s = energy-use coefficient per unit area
PowerElectricity demand s t E L E s , t Sum of electricity demand of all sectors
Energy demand E L E i λ e l e , i E L E i = electricity generation by fuel i
λ e l e , i = fuel i consumption for power supply
Table 2. The 3E–S evaluation system for municipal sustainable development.
DimensionIndicatorsUnitRef.
EnergyEnergy demandtce[63,64]
Energy demand per capitatce/capita[65]
Electricity consumptionkWh[66]
Electricity consumption per capitakWh/capita[66]
Shortage of energy demandtce[66]
Percentage of fossil fuels in total energy demand%[67]
Ratio of energy demand to production growth rate%[66]
Elasticity coefficient of energy demand%[66]
Energy demand intensitytce/RMB[63,65]
Proportion of RE in total energy demand%[58,59,60,61,62,63,64,65,66,67,68]
EconomyGDPRMB[69,70]
GDP per capitaRMB/capita[63,69]
GDP per ton of standard coalRMB/tceDefined
GDP growth rate%[46]
Land area per capitam2/capita[66]
Road densitykm/km2[66]
EnvironmentCO2 emissionst[46,47,48,49,50,63,64,65,66,67,68,69,70]
CO2 emissions per capitat/capita[63,69]
CO2 emissions intensityt/RMBDefined
SO2 emissionst[46,47,48,49,50,63,64,65,66,67,68,69,70]
SO2 emissions per squaret/km2[66]
SO2 emissions per capitat/capita[66]
NOx emissionst[46,47,48,49,50,63,64,65,66,67,68,69,70]
NOx emissions per capitat/capita[66]
SecurityPrimary energy production per capitatce/capita[71,72,73,74,75]
Self-sufficiency rate%[71,72,73,74,75]
Proportion of electricity consumption%[71,72,73,74,75]
Diversity of energy demand 1-[71,72,73,74,75]
Energy conversion loss%[65,66]
Power plant utilization%[71,72,73,74,75]
Forest coverage%[71,72,73,74,75]
1 Using the Shannon–Weiner index.
Table 3. Main decarbonization solutions for the five sectors in the case municipal city.
SectorsDecarbonization Solutions
Industry
  • Controlling product output of carbon-intensive subsectors, such as iron and steel and cement.
  • Replacement of long-term steel production process.
  • Reducing E F   and   E F V i , t , s .
Transportation
  • Electrification.
  • Replacement of hydrogen energy.
  • Replacement of LNG carriers.
Building
  • Enhancement of energy saving in buildings.
  • Building electrification.
  • Application of RE in buildings.
Agriculture
  • Replacement of clean energy.
  • Application of biomass energy.
Power
  • Generation of electricity by RE, including photovoltaics (PV), wind turbines (WTs), and hydropower.
  • Control of installation capacity and annual operating hours of coal-fired power plants.
  • Development of advanced and highly efficient power generation units.
Publisher’s Note: MDPI stays neutral with regard to jurisdictional claims in published maps and institutional affiliations.

