1. Introduction
The current political crisis has caused a steep increase in oil price, returning to costs comparable to the those in 1973 (the year of the Yom-Kippur war). Since then, European countries have been implementing concrete strategies and policies to improve their energy efficiency and reduce the energy dependence on fossil fuels [
1]. For these reasons, the decrease in the energy-need in buildings, through the reduction in their thermal losses, represents one of the most cost-effective actions to cope with such an issue.
Insulation techniques can actually act either jointly or singularly on the three possible ways of heat transfer: conduction, convection, and radiation. More generally, the total equivalent resistance of a material (R
tot) can be estimated as the sum of the conductivity resistance for solid conduction (R
solid), gas conduction (R
gas), radiation (R
rad), and eventually convection R
conv (1):
The higher each component, the higher the total resistance. Equation (1) frames all the possible strategies to reduce thermal losses. The parameter R
solid depends on the material thickness and on its thermal conductivity, defined as a measure of the ability of a substance to transfer heat by conduction. The measurement of this parameter can be carried out by means of either the guarded hot plate or the flow-meter methods [
2,
3].
A brief overview of the insulators available on the market and actually adopted in energy efficiency for buildings is presented.
Traditional thermal insulation materials (
Table 1) try to reduce as far as possible the term associated to conduction [
4,
5,
6]. A minimum limit value for this group of insulators can be found in the conductivity of motionless air (about 0.025 W/m K) [
7].
The family of
Vacuum insulated panels (VIPs), belonging to innovative insulators, rely on a layer with a vacuum inside where heat can only propagate by means of radiation. This strategy can lead to very low equivalent conductivities (about 0.01 W/mK) with a weak point where every cut or perforation seriously damages the panel, at least doubling its conductivity [
8]. Many works are available in the literature about the topic, starting from general reviews [
9,
10], and going more in detail with specific studies: e.g., influence of water inside the material [
11], variation of thermal conductivity with different materials filling the VIP [
12], and future development of VIPs [
13]. Usually, the most relevant flaw in these insulators consists of the aluminum layers put inside of the VIPs (or similar materials) which almost block the passage of water vapor with a consequent risk of interstitial condensation.
Gas-filled panels (GFPs) represent another family of insulators exploiting a principle similar to the one for VIPs, where the void is replaced by gases with a conductivity lower than air. Regardless, the VIP panels still seem to be preferable to the GFP for durability reasons [
14,
15].
On the other hand,
aerogel materials belong to a group where the improved conductivity is reached by the replacement of the liquid part of a gel with gases during a supercritical drying process. Aerogels lower the limit conductivity for traditional insulators (0.015 W/mK against 0.025 W/mK for motionless air) [
16] thanks to the so-called Knudsen effect, which is a reduction in thermal conductivity in gases when the size of the containing cavity is almost equal to the mean free path [
17]. A further improvement in the performance of aerogels can be reached with carbon black, which suppresses the radiative transfer as well [
18].
Nanotechnology-based materials try to exploit the same Knudsen effect adopted in aerogels with a dramatic decrease in the size of the pores and therefore in conductivity. Such technology could overcome the issue of excessively high vapor resistance highlighted for VIPs and any perforation would not decrease its performance. The Knudsen effect in very small pores (order of magnitude of nanometers) can be associated to the fact that gas molecules are more likely to hit the walls of the pores instead of other molecules. In this context, the sizes of the pores (compared to the mean free path of the gas molecules) determine the reduction in conductivity. In actual fact, an excessive decrease in the cavities size might cause a relevant increase in the radiation heat transfer, since they tend to be lower than the wavelength of infrared radiations (about three orders of magnitude, 10 nm as reference pore size against 10 μn for infrared radiations) [
19,
20]. The contribution of radiation heat transfer against the conduction/convection ones still has to be exhaustively estimated and tested [
20]. Regardless, if the conductive/convective mechanisms still remain dominant, the conductivity of the nanotechnology-based insulator can reach very low values (about 0.004 W/mK) with the consequent use of very thin layers to insulate buildings. This group is composed by mortars, resins, plasters, and paints containing nanoparticles, usually hollow glass or ceramic microspheres of variable size (between 20 and 120 μm of diameter), which are bonded by a mixture of synthetic rubber and other polymers granting the mechanical properties, flexibility, and water resistance as well. Their effective composition is under industrial secrecy and therefore different explanations are provided by the different manufacturers, leaving room for discussion about the reliability of the insulating mechanism and on the accuracy of the models available in the literature [
21,
22,
23,
24]. Moreover, the technical information about conductivity for nanotechnology materials is, most of the time, contradictory, and very different values can be found on the market, differing even of two orders of magnitude, e.g., from 0.001 W/mK [
21] up to 0.14 W/mK [
22]. No CE marking, neither compulsory nor voluntary, is available for nanotechnology-based materials since there is neither a harmonized standard nor a manufacturer’s voluntary adoption of ETA (European Technical Assessment). The performance needs to be tested in authorized laboratories within one of the member countries of the European community [
25] to adopt the declared conductivity reported in the technical sheet. Moreover, the evaluation has to be conducted following a statistical approach (i.e., a single test is not sufficient), following the methodology reported in UNI ISO 10456 [
26].
Ultimately,
heat-reflective materials can be found: The thermal insulation system is made of one or more low-emissivity reflective surfaces, in contact with one or more cavities filled with air. They work with a range of wavelengths between about 5 μm and 50 μm (infra-red field) because the radiation heat exchange occurs between bodies at room temperature. The reference standard for materials exploiting the contribution of either reflective or low-emissivity surfaces in contact with an air cavity can be found in [
27]. One of the most effective applications of reflective materials can be found in [
28], where the simple application of a reflective panel between a radiator and the perimetral wall (common pattern in residential applications) leads to an energy saving of 3.50% in the worst insulation conditions. Several studies were developed in the past regarding heat reflective insulators and were mainly divided into two groups: numerical approaches, with the aim to be implemented into simulation software [
29,
30,
31,
32,
33,
34,
35,
36,
37,
38,
39,
40,
41,
42], and experimental approaches to characterize their properties [
43,
44,
45,
46,
47,
48,
49]. A research review about heat-reflective materials [
50] estimates that about 59% of the studies were concerned with experimental approaches (either field measurement or indoor test rigs) whereas only 41% regarded numerical simulations (e.g., building performance or CFD).
To the best of the authors’ knowledge, no relevant study about the reliability of the declared performance of reflective material has been conducted. In addition, most of scientific literature does not account for the compatibility of the heat-reflective materials with the required thermal resistance. The economic aspects are lacking as well, neglecting the cost effectiveness of these materials compared to other traditional insulating solutions. The present study aims to cover these topics, by means of the following steps:
Firstly, the thermal resistance of the insulator has been computed by means of the theoretical approach contained in the UNI EN ISO 6946:2018 standard [
51]. The results have been compared with the values reported in the declared transmittance data of different heat reflecting materials available on the market. A substantial good agreement with most of materials has been found. The names of the different brands considered are kept anonymous. The numerical approach has been intentionally chosen instead of experimental tests in order to test the reliability of the measured values declared by the producers by means of a predictive numerical approach.
The most effective position for heat reflective insulators when considering cavity, brick and stone walls has been investigated. Indeed, the thermal resistance of such insulators is influenced by their position in a multilayer wall.
Then, the insulation of the main and most common walls in Italy with heat-reflective materials has been examined. In particular, cavity, stone, and brick walls were considered, assuming three different locations in Italy (Genoa—climatic zone D, Milan—climatic zone B, and Naples—climatic zone C). The limits set by the Italian laws in terms of transmittance and interstitial condensation have been checked.
A simplified economic analysis is proposed to identify the insulating material which grants a required performance (in terms of thermal transmittance) at the lowest possible price. Clearly, the conclusions on this topic do depend on the market price fluctuations of thermal insulation materials, which have been experiencing a steep increase since the “Superbonus” [
52] tax incentives came into force. In fact, it is preliminary estimated that an increase in the prices for building insulation of about 35% has occurred in the past couple of years. Although the analyses refer to a period former to 2020, the results still provide interesting conclusions because the increase in the prices has affected almost homogenously the group of heat reflective thermal insulation materials.
2. Materials and Methods
This section proposes a first recall on the numerical method used to assess the thermal resistance of reflective insulators. Then, the walls used in the simulations are presented, recalling also for the mandatory energetic efficiency Italian limits (i.e., total thermal resistance of walls according to the different Italian climatic zones).
2.1. Thermal Resistance in Cavity Walls—Reflective Insulators
The thermal resistance associated to a cavity filled with air can be carried out by means of the approach reported in the UNI EN ISO 6946:2018 standard [
51] and previous numerical studies [
2,
3,
26,
27,
50,
53] which can be applied both to air voids (i.e., the width/length are comparable to the thickness) and to air layers (i.e., the width/length are more than 10 times the thickness along the heat flow direction). In particular, the adopted approach applies to unventilated airspaces with length and width which both exceed 10 times the thickness. Even airspaces with openings which allow no airflow through the layer and do not have an extended area (500 mm
2 per meter of length for vertical air layers or 500 mm
2 per square meter of surface area for horizontal air layers) can be considered as unventilated. Assuming that the heat exchange between two opposite emitting surfaces with an interposed air layer depends on the mean surface temperature, the thermal resistance can be expressed as:
where:
Rg is the thermal resistance of the air cavity, [m2K/W];
ha is the convective heat transfer coefficient, [W/m2K];
hr is the radiative coefficient, [W/m2K].
In turn, h
a can be determined according to the direction of the heat flow and the temperature difference (
Table 2 and
Table 3). Indeed, the convective heat transfer is assumed to be either constant or function of the width of the air gap with low temperature differences (<5 K), then it depends on temperature as the difference increases (>5 K).
On the other hand, the radiative coefficient (h
r) can be represented as:
with:
hr0 radiative coefficient for a black body surface [W/m2K], as reported in Equation (4);
E surface-to-surface emittance, formulated in Equation (5).
The radiative coefficient for a black body surface has been expressed assuming unit values for the view factors, since the airspace is usually large and thin
where:
σ is the Stefan-Boltzmann constant (5.67 × 10⁻⁸ W/m2K4);
Tm is the average temperature of the surface and of its surroundings, assumed to be at 282 K for the case study. Therefore, the radiative coefficient for the black body surface is 5.1 W/m2K.
Finally, the emittance is given by:
where ε
1 and ε
2 are the hemispherical emissivities of the surfaces bounding the airspace. These values should account for the effects of deterioration and dust as well.
The so-estimated thermal resistance of a cavity can be accounted in the global transmittance for a multilayer wall by means of Equation (6):
where:
R
si and R
se are the surface resistances determined according to the direction of the heat flow (m
2K/W) [
51];
sj and λj represent respectively the thickness (m) and the conductivities (W/m K) of the jth layer;
Rgk is the thermal resistance of the kth cavity (m2K/W).
The values for the materials were taken from the UNI/TR 11552:2014 Italian standard [
54].
2.2. Type Walls Adopted in the Simulations and Computation of the Global Transmittance
The carried-out simulations apply the reflective insulation to different kinds of walls which represent some of the most common construction typologies in the Italian building stock. Eight configurations have been evaluated, including brick, cavity, and stone walls. The results for all the simulations can be found in
Appendix A, whereas three relevant cases are analyzed in detail as follows:
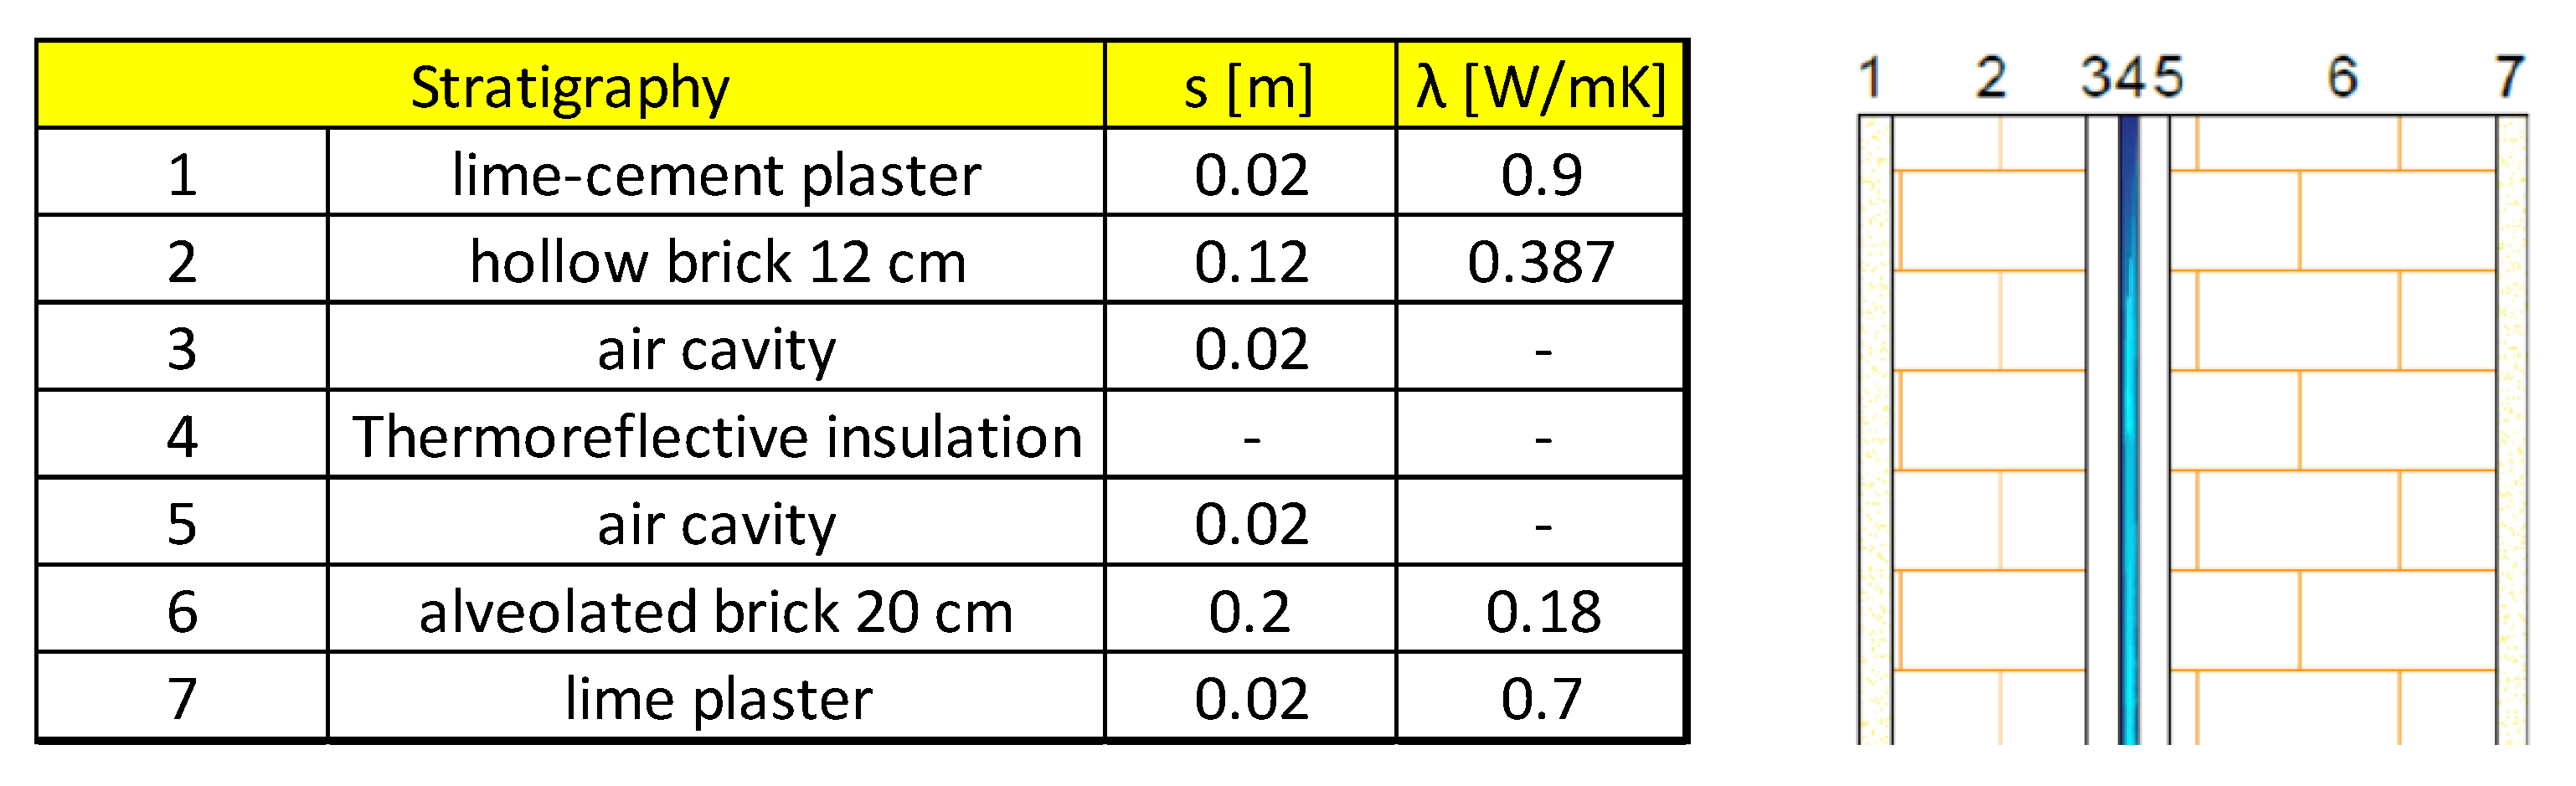
cavity walls (
Figure 1a): typical of the post-war buildings with reinforced concrete structure. Usually, two layers of bricks (respectively 8 and 12 cm) are separated by an air cavity which can be from 4 cm up to 16–18 cm wide. The contribution of the air cavity to the global thermal performance of the wall shows a very weak dependence on the thickness. Indeed, the thermal resistance of unventilated air cavities at least 25 mm wide, with high emissivity surfaces, are associated to constant thermal resistances [
51]. The total transmittance associated to such walls (without reflective insulation) is usually between 1 and 1.2 W/m
2K. The reflective insulator shall be simulated within the air cavity in the most effective position (i.e., either in the middle of the air cavity or on one of the two faces between bricks). The average temperature of the cavity surfaces is assumed to be at 10 °C, representative of a winter steady-state condition common in Italian climatic zones from A to E;
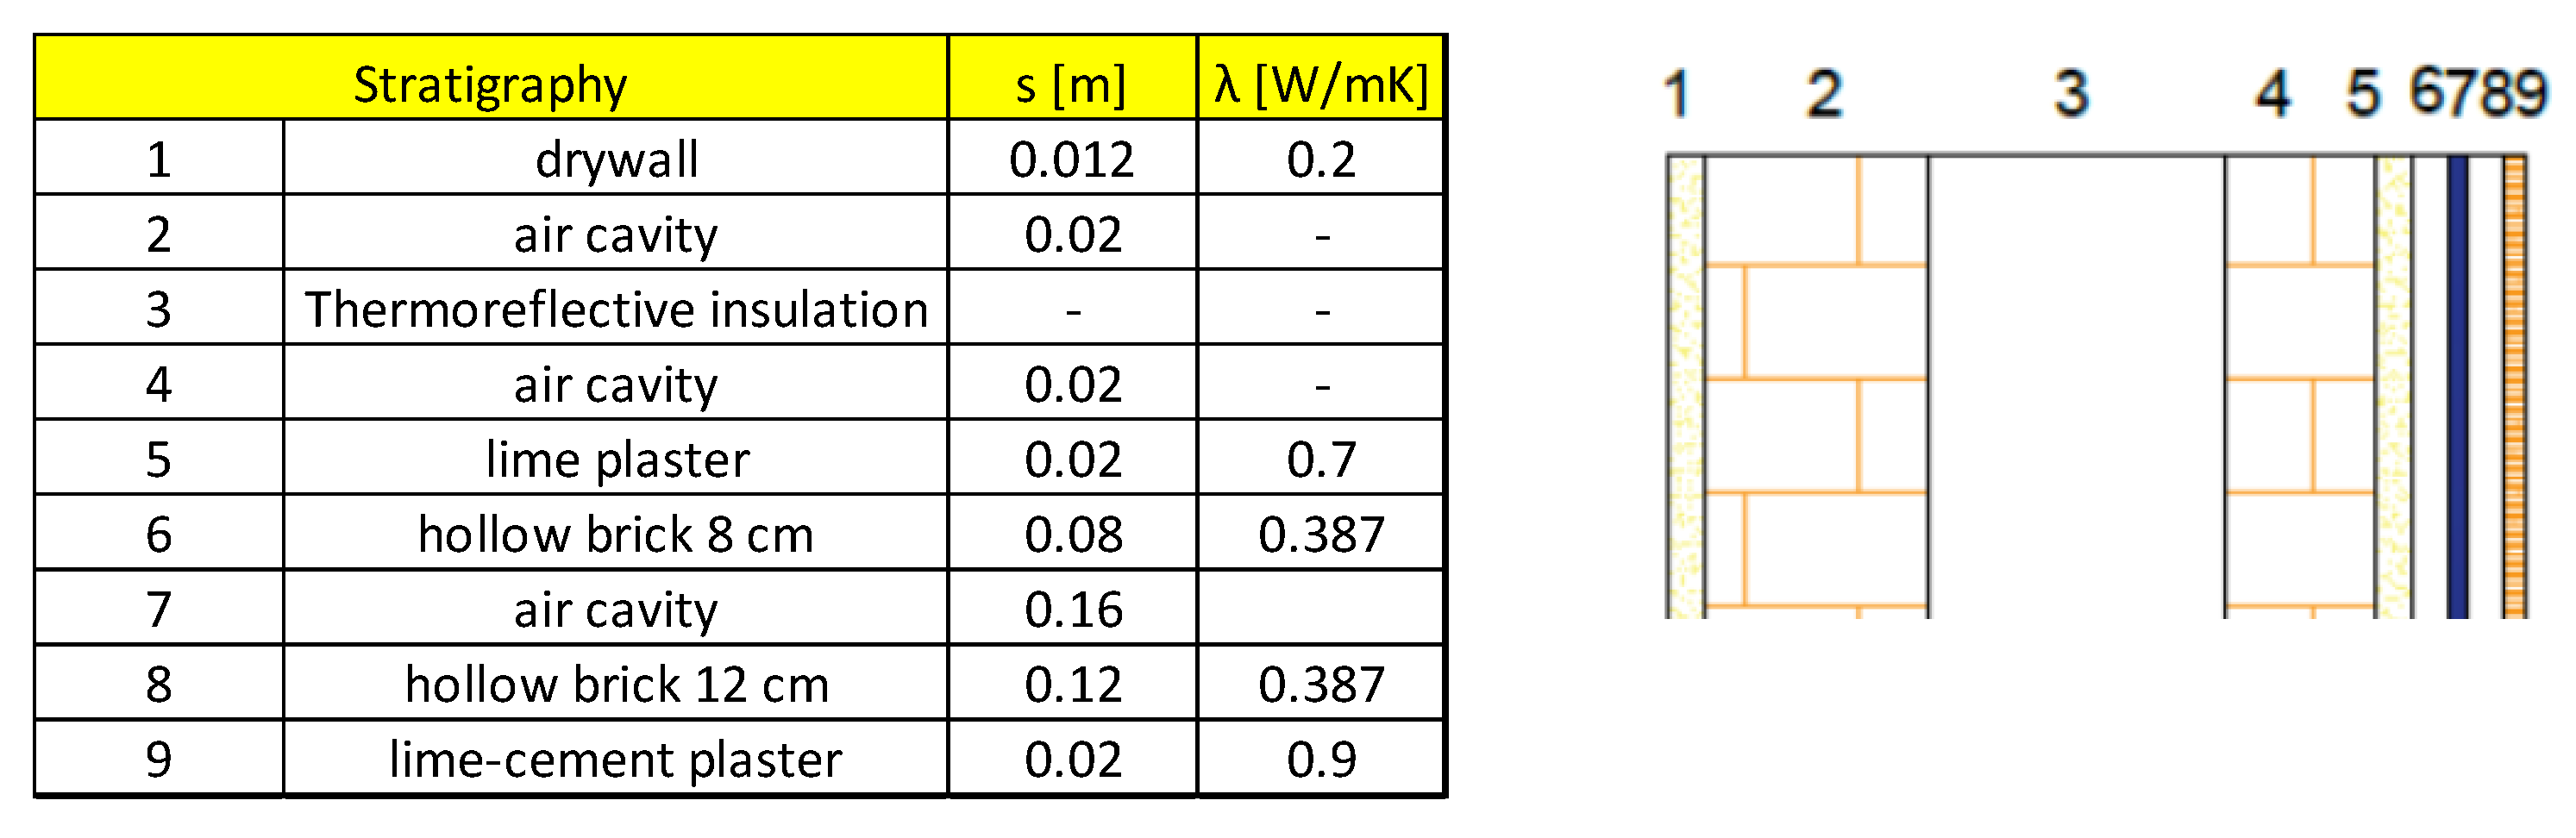
brick walls with a low insulation layer (built between 1976 and 1990) (
Figure 1b): the wall is entirely made of bricks and an insufficient external insulation was applied for instance to avoid interferences; for instance, the reduction in the width of the balconies. The global initial transmittance of the wall is assumed to be 0.39 W/m
2K;
stone walls (
Figure 1c): such typology is common, especially in historical buildings, which are in turn subjected to architectural constraints and therefore a classical external coating is not feasible. The global transmittance of these walls depends on the total thickness, and an average of 2.33 W/m
2K could be considered representative of this kind of walls.
2.3. Maximum Legislative Limits for the Total Trasmittance
The simulations were performed assuming three different climatic zones among the Italian zones: E (e.g., Milan), C (e.g., Naples) and D (e.g., Genoa). The other climatic zones were preliminary neglected because they are associated to a smaller part of the Italian territory.
Table 4 recalls the legislative limits according to the different climatic zones.
2.4. Economic Analysis–Cost Effectiveness
The “cost-effectiveness analysis” allows the comparison of several alternatives according to their cost and a measured (not economic) useful effect (e.g., thermal transmittance for the present study) [
56]. The cost-effectiveness index for the i-th alternative can be expressed by means of Equation (7):
where:
Ci is the cost of the ith alternative [€/m2], for our case the cost of both the materials and the installation.
Ei is the related benefit, i.e., the thermal resistance for the present study [m2K/W].
As a consequence, the unit measure for the cost effectiveness (CE) depends on the related benefit. In this case CE can be measured in [€W/Km4].
As regards to the costs for heat-reflective materials, most of them were declared by the producers, except for material 1, where the manufacturer did not reply to the question and therefore was excluded from this part of the study. On the other hand, the cost of installation, when not declared, was estimated basing on the regional price list carried out by Regione Liguria. The installation cost obtained by means of the regional price list leads to values comparable to the declared ones.
The cost-effectiveness approach was carried out twice: at first, it was applied to the heat-reflective materials under study, and then it was applied for a comparison among different thermal insulation materials.
3. Results
The present section presents the main results obtained following the approach illustrated above.
Firstly, the thermal resistance is computed following the numerical approach illustrated before, comparing the results with the declared, tested performance of the heat-reflective materials on the market.
Secondly, the most effective position of the reflective insulator in multilayer walls (especially cavity walls) is investigated to justify the chosen stratigraphy adopted in the following simulations. This issue is not trivial because the best, ideal position may not be always feasible or the same for different, existing walls.
In conclusion, the reflective insulators formerly verified are applied to the chosen walls to enquire their convenience from the point of view of both thermal performance and cost effectiveness.
3.1. Comparison between Declared and Computed Thermal Resistence for Heat Reflective Insulators
Table 5 presents the main results about the calculation performed to compute the expected total thermal resistance for each of the eight, heat reflective insulators considered, according to the numerical approach illustrated above. The materials are kept anonymous, but the samples here examined represent quite a complete range of heat-reflective materials available on the market.
The total thermal transmittance referred to in
Table 5 is associated to a horizontal heat flow of two air gaps 20 mm thick each, divided by the reflective insulation (
Figure 2). The information required (i.e., emissivity, conductivity, and thickness) was taken from the data sheets of the materials to ensure the comparability of the results whereas the convective heat transfer coefficient has been assumed according to
Table 2.
Then, a comparison between the computed and measured thermal resistances declared by the producers is provided in
Table 6.
In general, predicted and declared values are in good agreement, with a variation below 5%. Only one case differs (about 13%-material 8) and the manufacturer, when informed about this result, admitted that the value needed to be certified again.
3.2. Best Position of the Heat Reflective, Insulating Layer
The effectiveness of the reflective insulating layer changes according to its position inside a multilayer element. Although common insulators (acting mainly on conductivity) work better (or equally) when applied from the outside, heat-reflective materials need to be installed on the inner side of the wall for winter insulation because their effectiveness depends on the direction of the heat flow. Clearly, such a pattern might act negatively during summer, as it prevents the heat inside to flow through the wall instead of reflecting the heat coming from the outside. The risk of interstitial condensation recalled in the introductory section may be influenced in addition by the position of the insulator.
In the simulations carried out, the reflective materials have been assumed as applied on the inner side of the stone and brick walls by means of frames and pins in aluminum or wood. This pattern leads to two benefits: firstly, the insulator can work on both sides because it is not in direct touch with the wall. Secondly, the issue of interstitial condensation loses importance if the supporting frame is provided with openings on the top and on the bottom to allow ventilation. Unluckily, this feature is not very common in ordinary cavity walls. Among the examined types, the cavity wall deserves an additional remark, because the air gap between the two layers of bricks represents one of the most effective positions for the heat reflective material. This configuration avoids the increase in the total thickness of the wall, unlike the cases of solid multilayer walls (e.g., brick or stone walls).
Figure 3 shows the effect of the different positions of the heat reflective layer (i.e., adherent to the layer of bricks; on the inner side of the wall; in the middle of the air cavity) on the total wall transmittance.
Figure 3 illustrates the obtained transmittance for a cavity wall applying singularly the seven heat-reflective materials considered (horizontal axis) in three different conditions: in the middle of the air cavity (blue columns), in adherence to the layer of bricks within the cavity (orange column), and on the inner side of the wall (grey columns). Clearly, the highest transmittance is always reached in the case of insulator inside the cavity but in contact with one of the two layers of bricks. This result is due to the loss of the heat reflective contribution of the insulator side in contact with the bricks.
On the other hand, the cases of insulation in the middle of the air cavity are quite similar to the ones with insulation on the inner side of the wall. The slight improvement in this last case (grey columns) is due to the additional thermal resistance provided by the additional drywall, necessary to protect the heat reflective insulating layer from shocks.
3.3. Application of the Heat Reflective Thermal Insulation Materials to the Case Study Walls
In this section, the eight heat-reflective materials previously compared with the numerical results are applied to the walls described in
Section 2 (Materials and Methods). A comparison with the limits imposed by the law for three Italian climatic zones (i.e., maximum transmittance) is performed, with a brief recall to the issue of interstitial condensation.
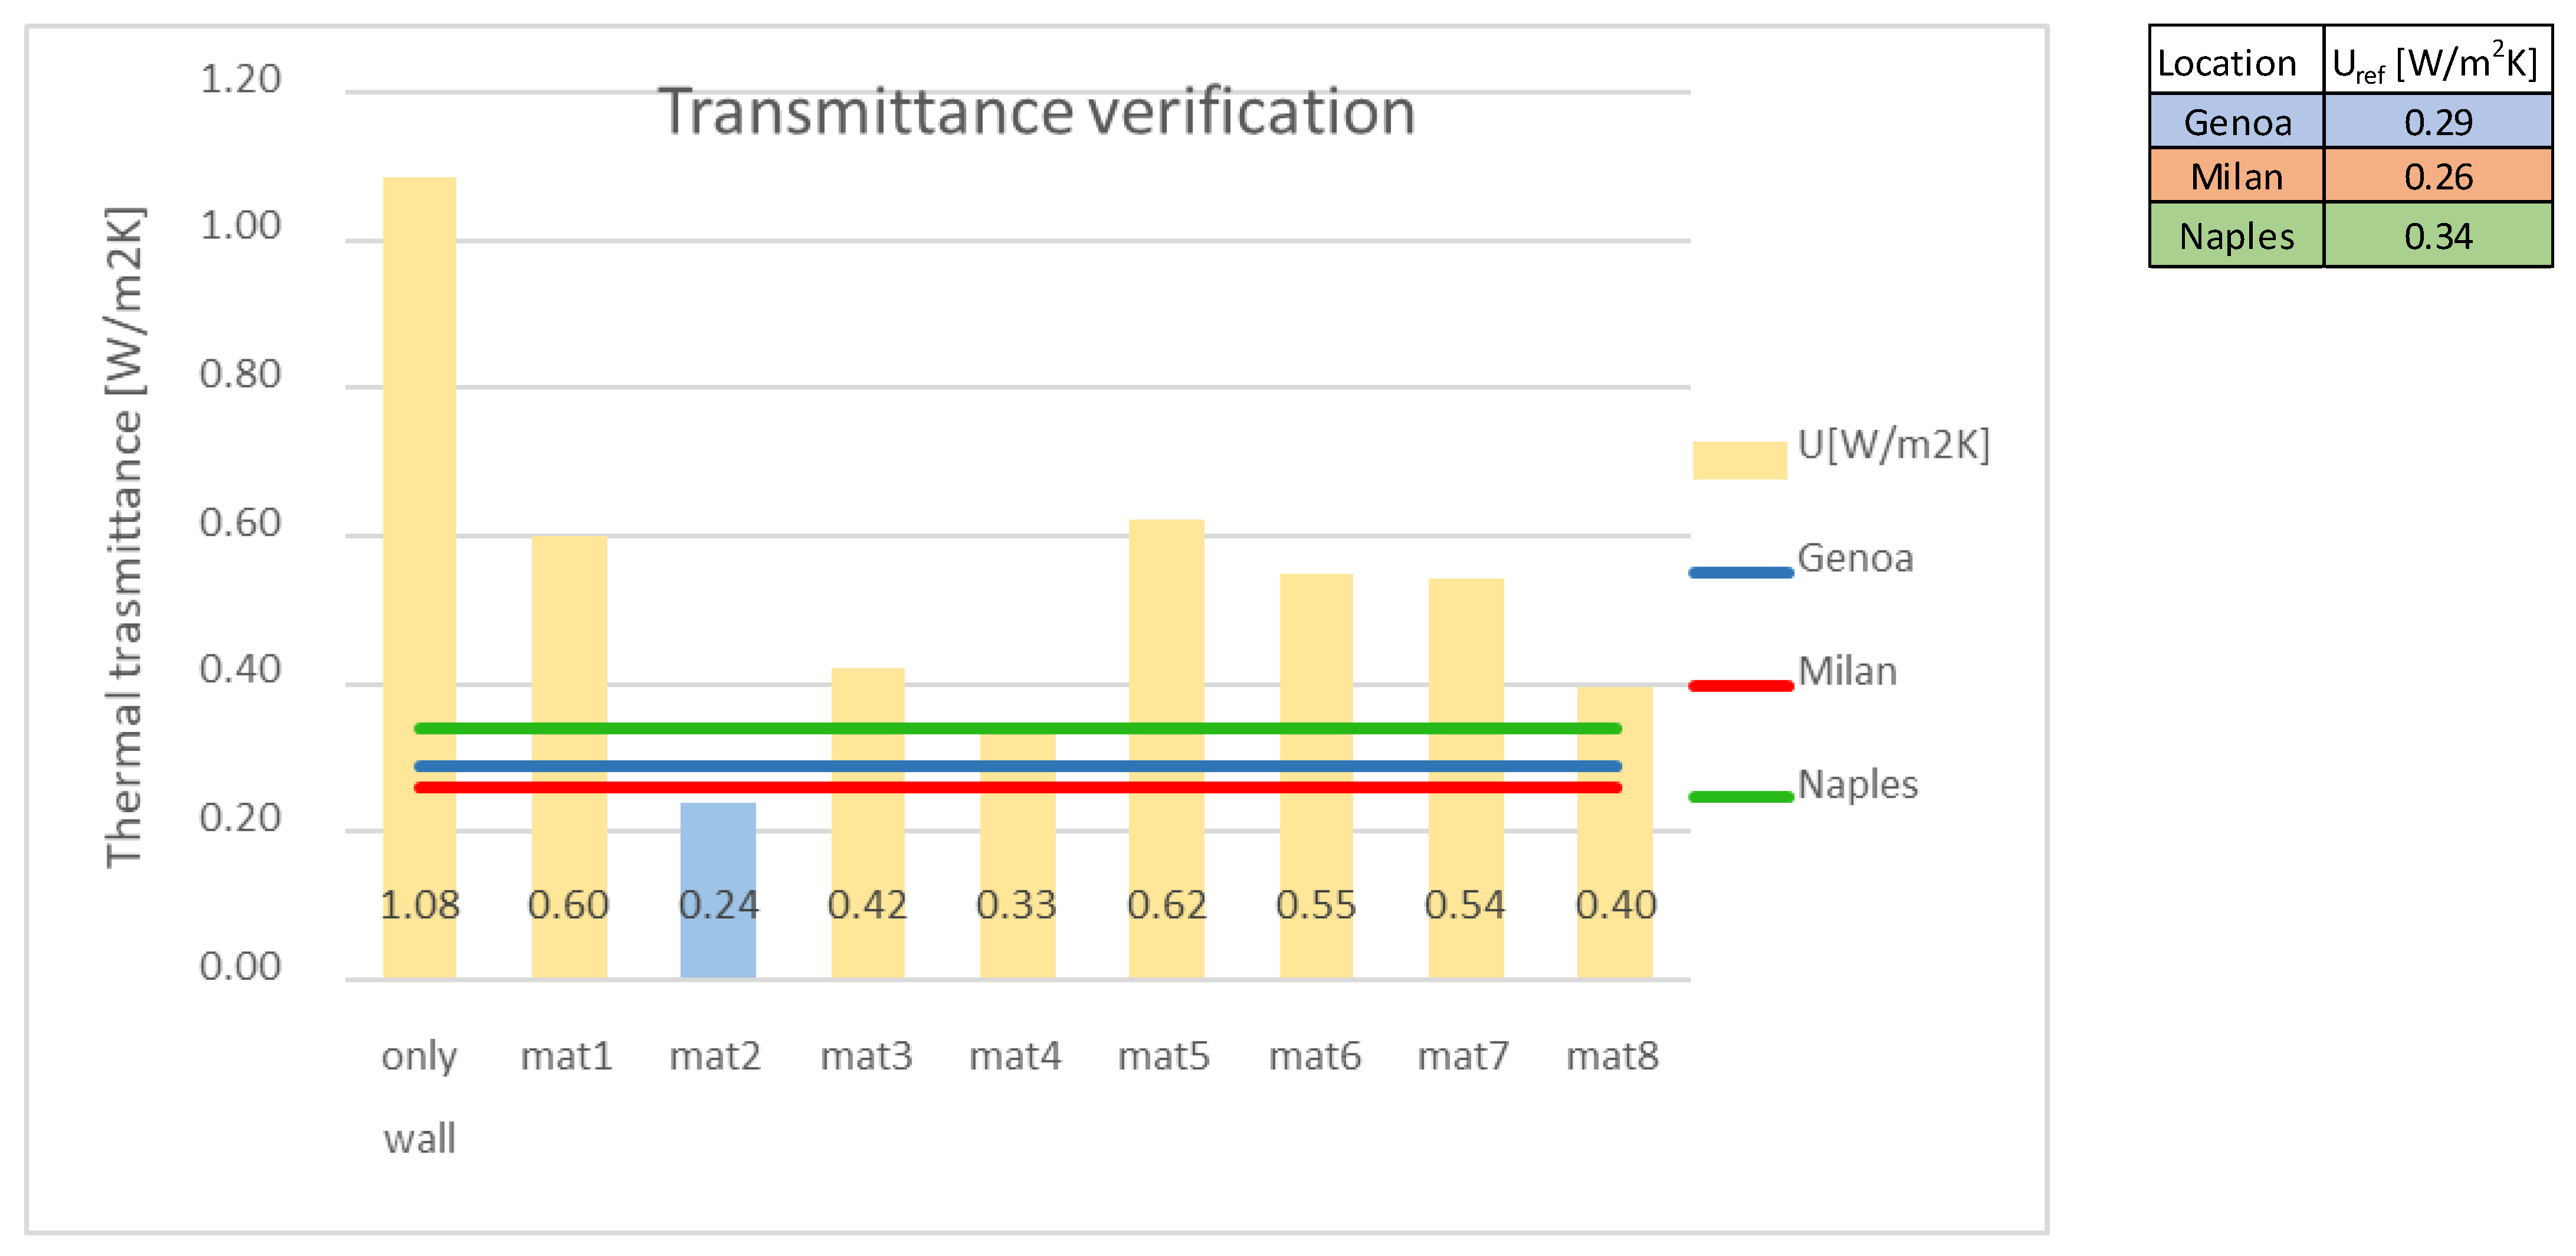
Cavity wall:
Figure 4 and
Figure 5 show, respectively, the application in the middle of the air cavity and in touch with one of the layers of bricks. Only one of the eight heat-reflective materials leads to a total transmittance within the limit for the climatic zones associated to Genoa (i.e., D) and Milan (i.e., E). As far as the climatic zone C (Naples) is considered, just four materials are eligible to respect the threshold. Clearly, the case in
Figure 5 with respect to
Figure 4 slightly worsens due the installation of the insulator in touch with the layer of bricks (and the consequent partial loss of the reflective insulation on one side).
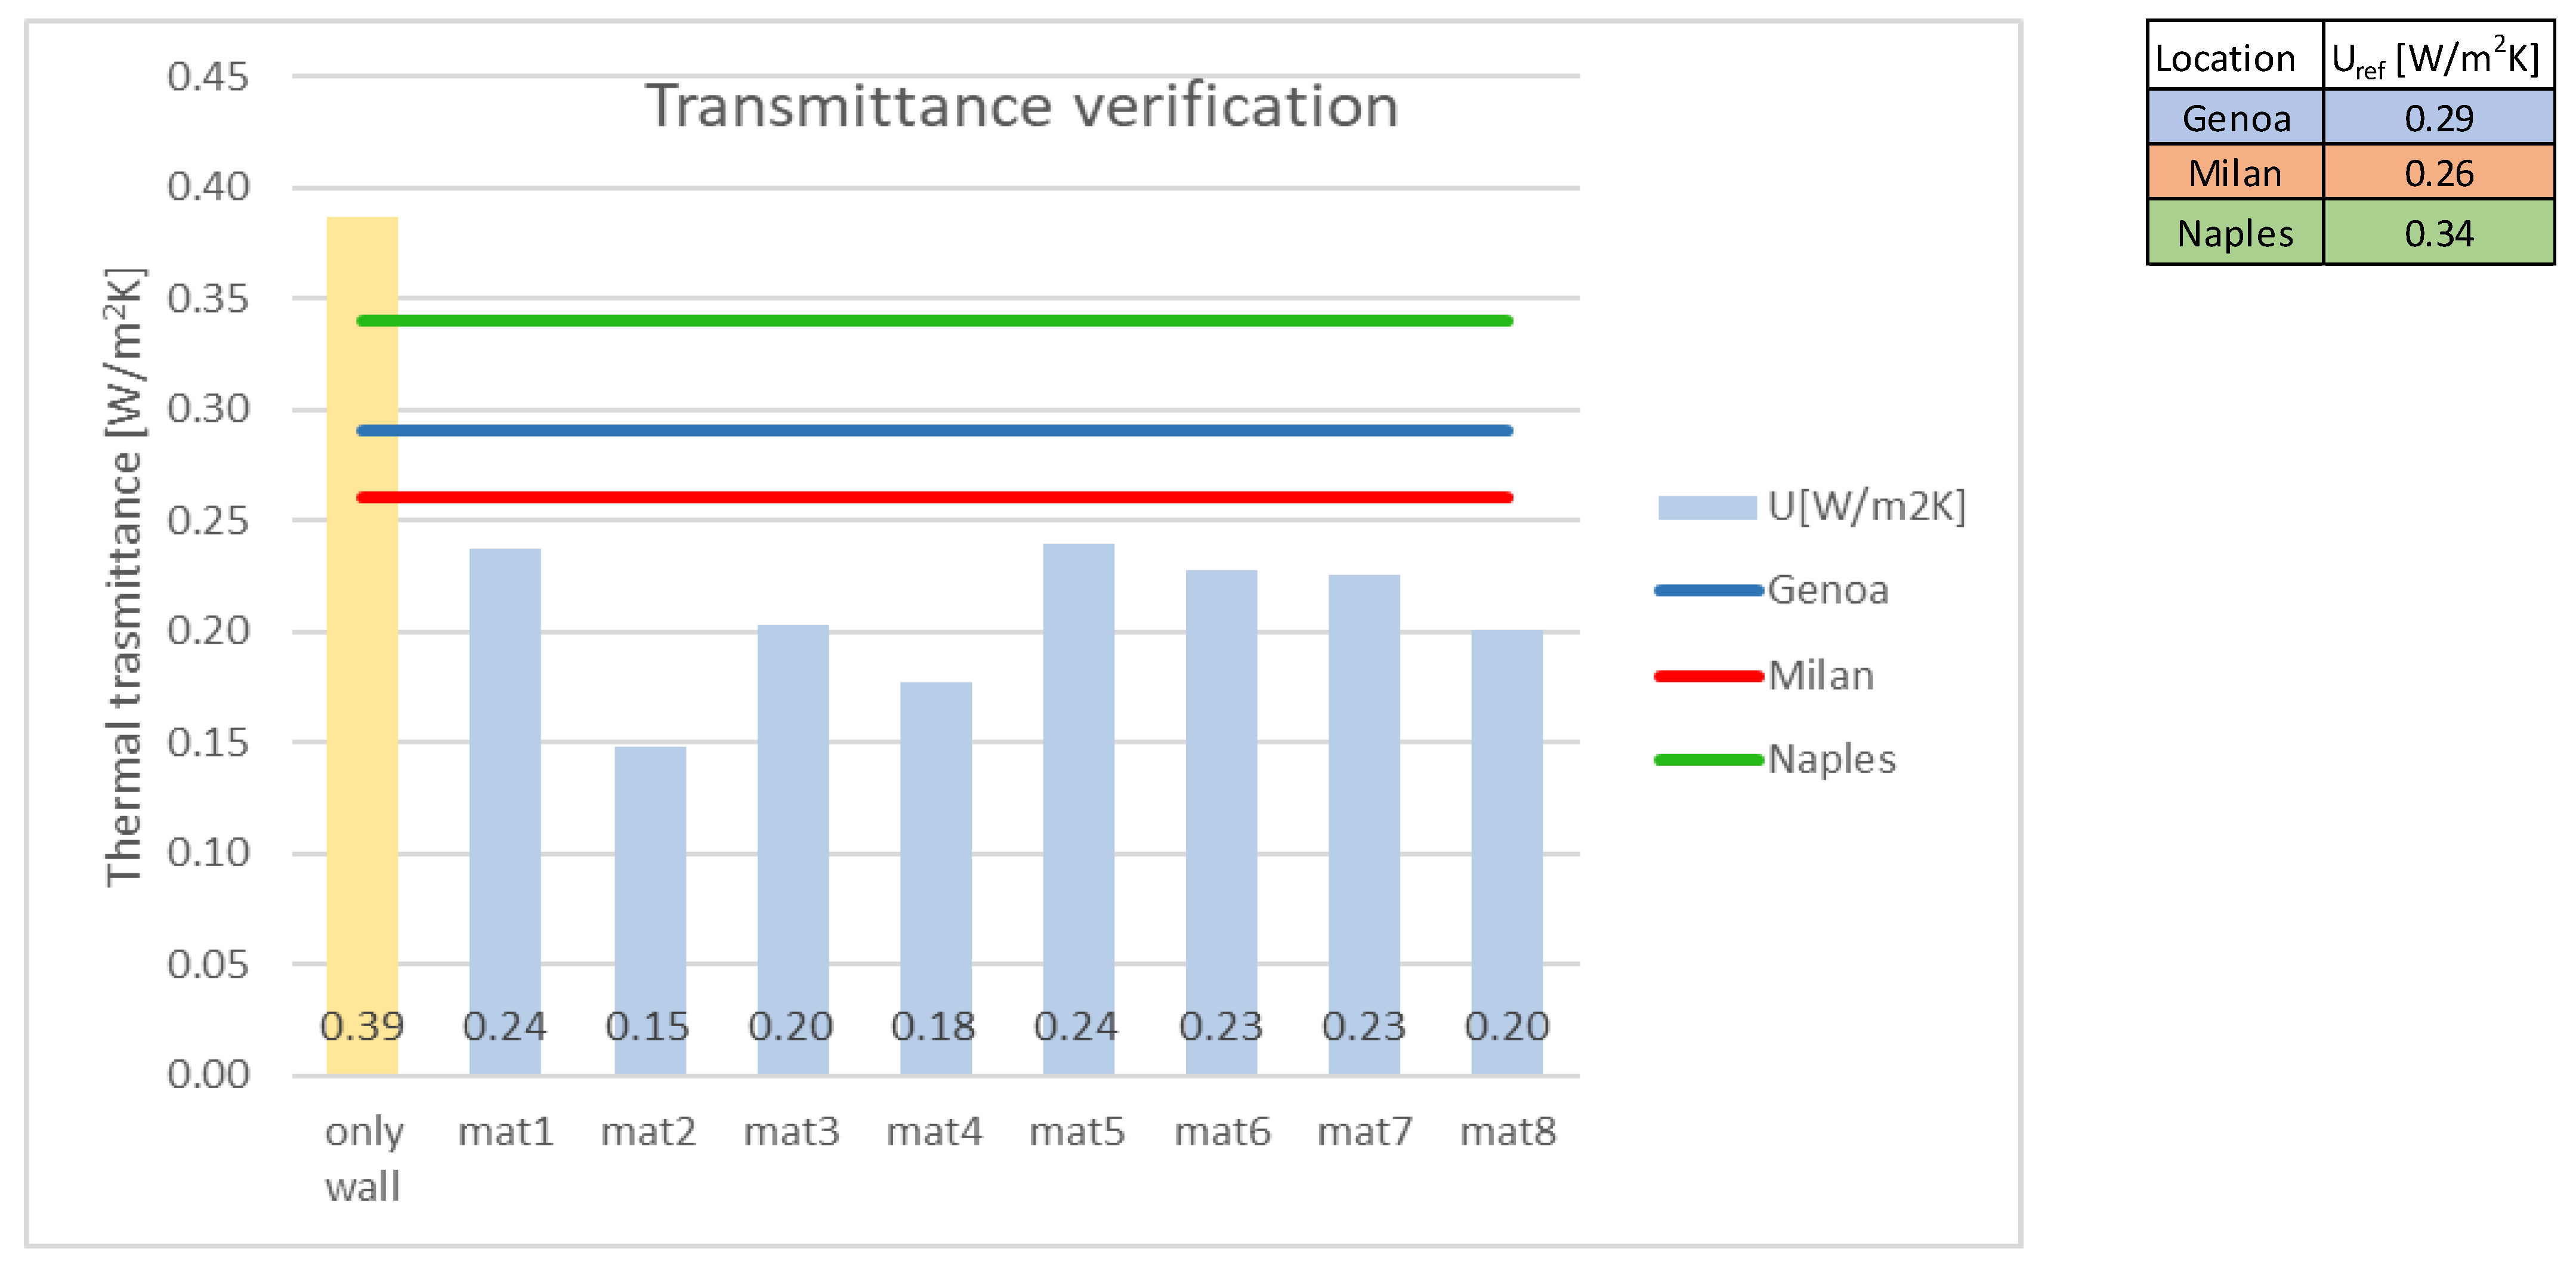
Brick wall: the contribution provided by means of the heat reflective insulator to the existing/reduced insulating coating allows the limits to be respected independently from the material (
Figure 6).
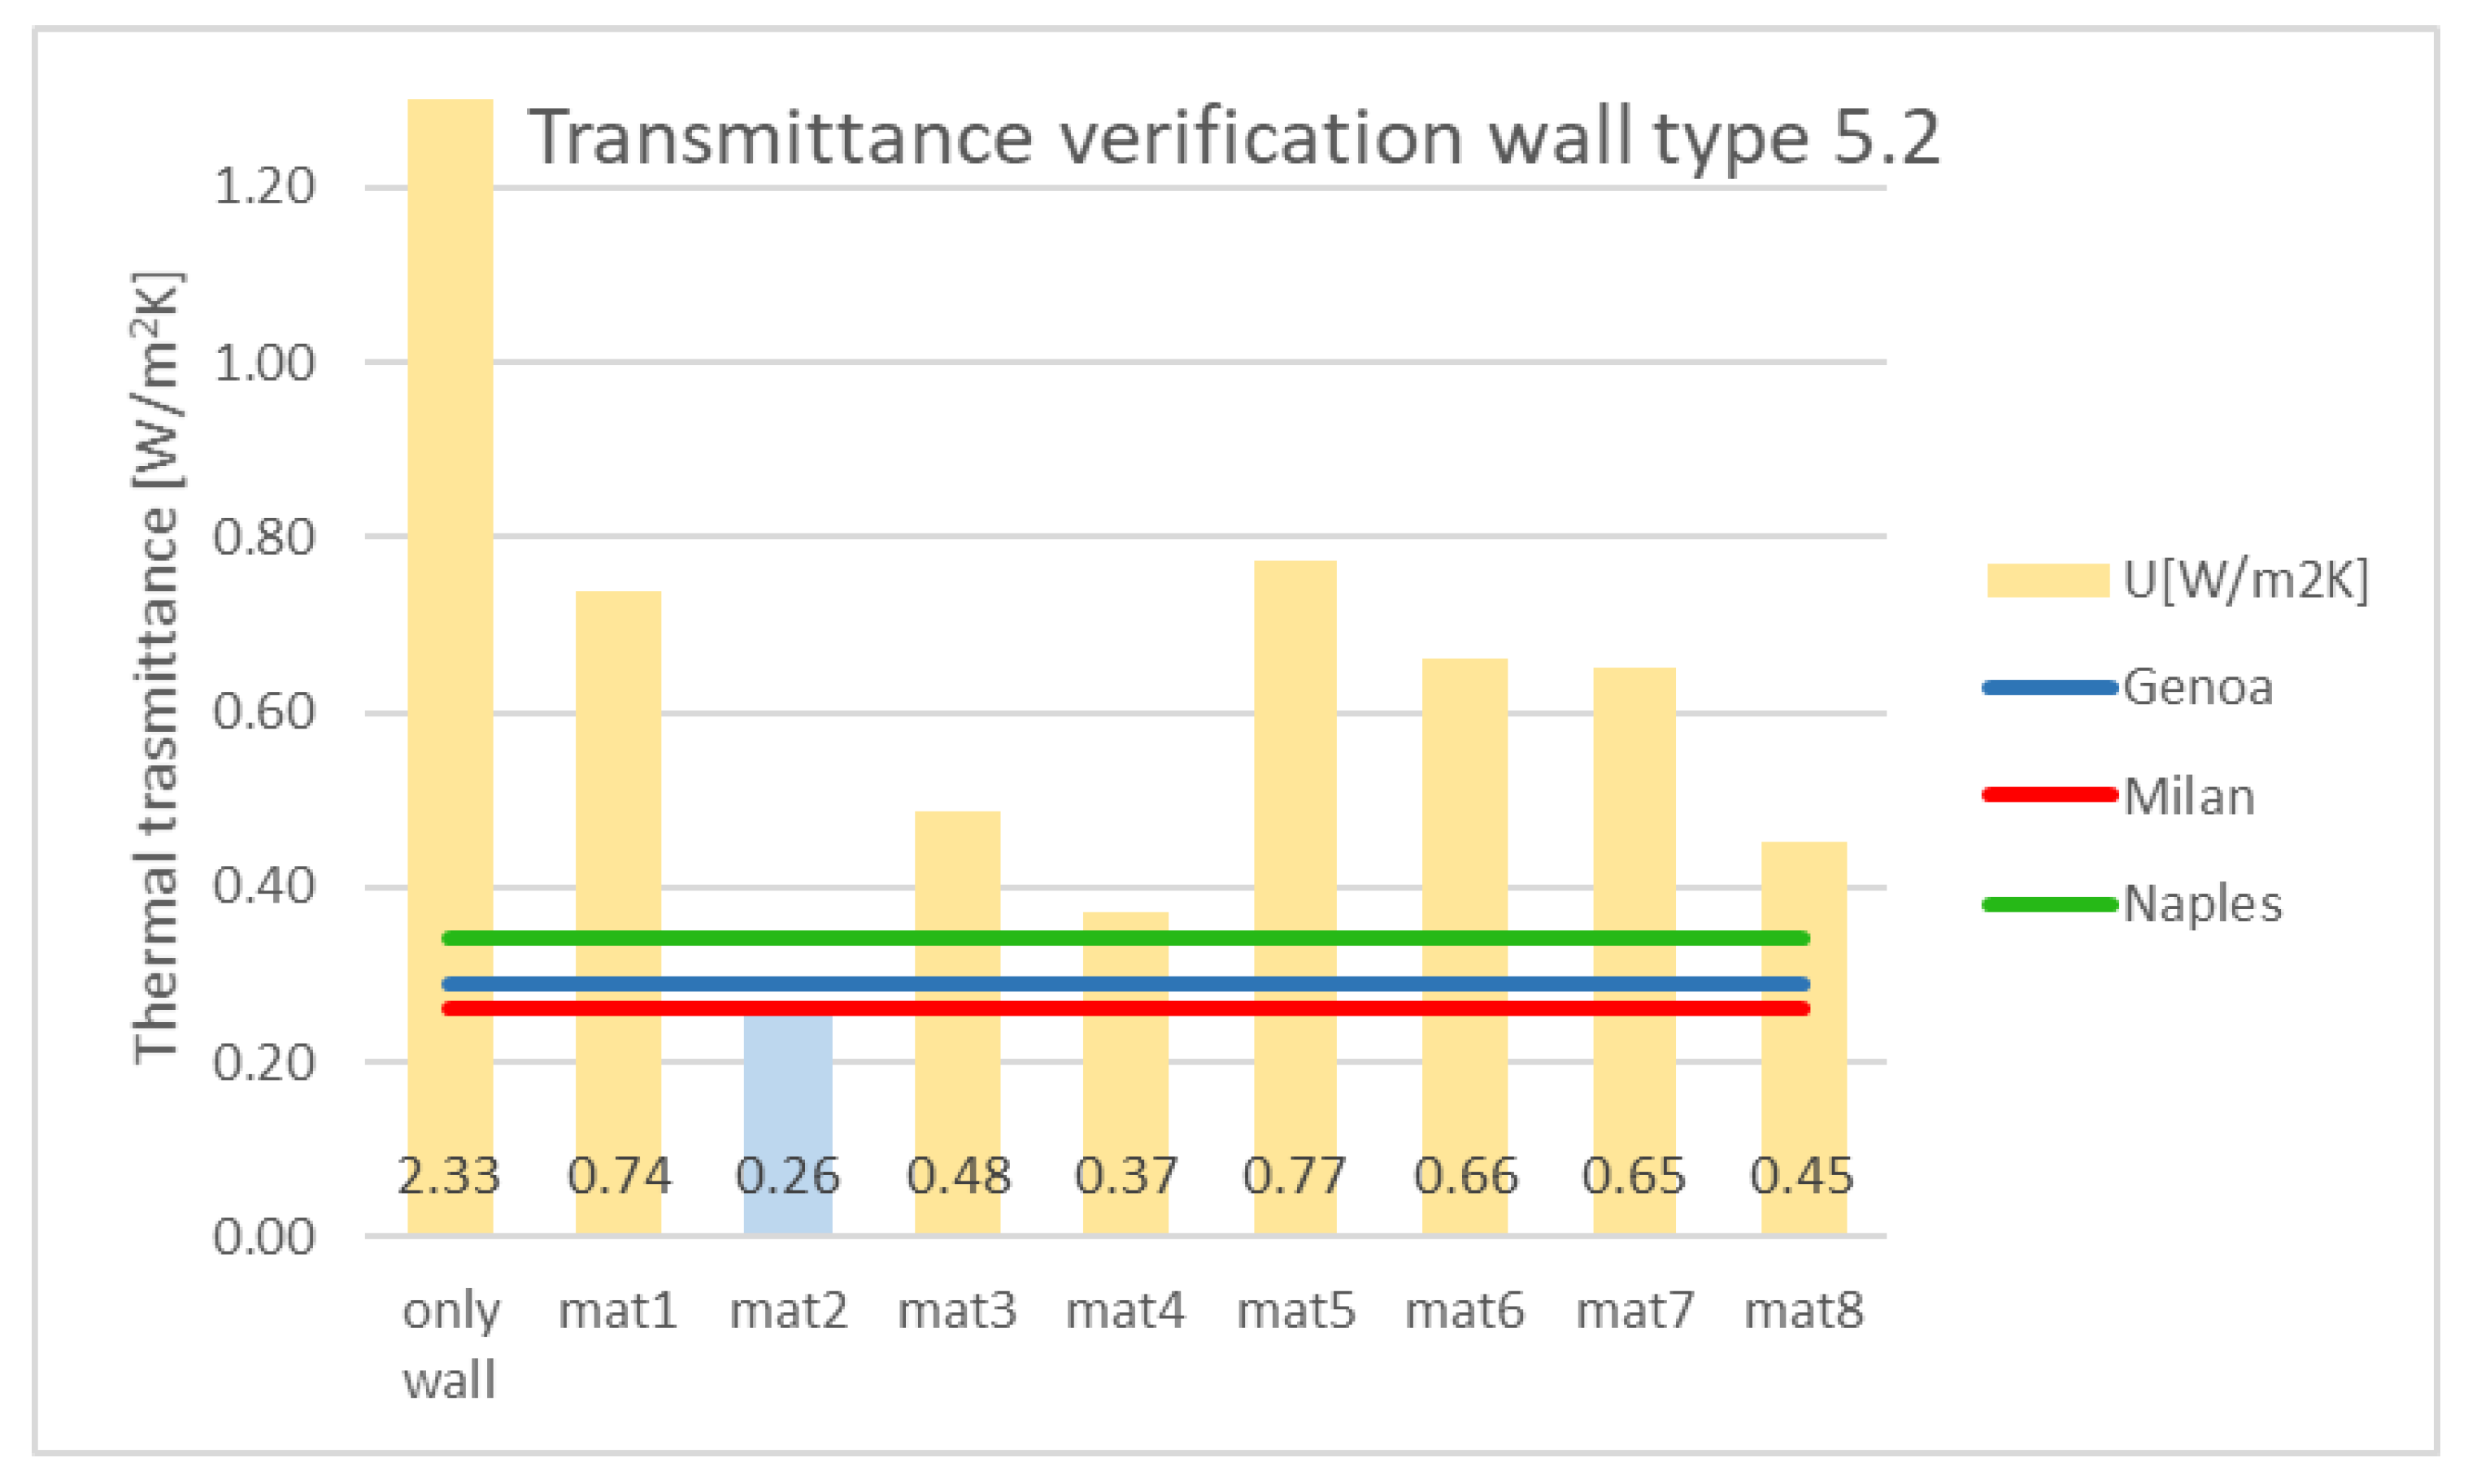
Stone wall (
Figure 7): only one material grants the limit transmittance for climatic zones D and E (Genova and Milan, respectively). On the other hand, only two reflective insulators grant the limits for climatic zone C (Naples).
More generally, all the configurations concerning the inner insulation determined an increase in the wall thickness of about 6 cm, and accounted for finishes such as plasters and drywalls. This in turn implies a not negligible reduction in the useful surface of the flats in existing buildings. Only the case of heat reflective insulator inside the cavity wall could overcome such an issue, but it clearly represents a solution suitable only for new constructions.
On the other hand, assuming an expanded polyurethane with an average conductivity of 0.023 W/mK, 6 cm thick (the same thickness of the heat reflective insulating package) provides a thermal resistance of about 2.6 m
2K/W which is equal or higher than the declared one of 6 out of 8 heat-reflective materials investigated (
Table 6). In addition, the heat reflective insulators are usually provided with at least an aluminum layer which acts on the reflection mechanism, but it has the side effect of a very high vapor resistance (order of magnitude 300.000).
As a consequence, problems about interstitial condensation might arise when adopting heat reflective insulators, whereas other solutions (e.g., expanded polyurethane) are very likely to bypass the problem (a vapor resistance of about 100 for such insulators). In the case studies considered above, no condensation occurred, except for the stone wall, where this issue might become relevant also according to the standard use of the building, the climatic zone, and the vapor resistance of the heat reflective material.
Indeed, each stratigraphy was tested by means of a commercial program implementing Glaser’s method. For reasons of synthesis, the full results are omitted in the present work, and the case in which condensation occurred is reported on only (
Figure 8). In any case, the issue of interstitial condensation shall be the topic of further, specific studies.
3.4. Cost-Effectiveness Analysis
3.4.1. Heat-Reflective Materials
Table 7 and
Figure 9 present the costs for each material and its installation, with the correspondent cost-effectiveness index. The installation cost accounts for the case of internal insulation with a plasterboard covering:
The cost for the materials varies from a minimum of 4.46 €/m
2 (material number 5) up to a maximum of 30 €/m
2 (material number 2) whereas the costs for installation are within the range between 40 and 49 €/m
2. The most convenient heat reflective insulators among the ones under study is material number 2. Besides the highest material cost, the relevant contribution to the total thermal resistance makes it the most eligible material (4 m
2K/W against an average of 2 m
2K/W for other heat reflective insulators, see
Table 6 for more information). On the other hand, cases number 5, 6, and 7 have to be discarded due to their poor convenience.
Figure 10 plots the total cost against the obtainable thermal resistance, superposing a second-degree polynomial approximation. The yellow region identifies the minimum of the plot where a thermal resistance between about 2.3 and 2.6 m
2K/W corresponds to a minimum total cost between about 55 and 62 €/m
2. Such a region can be conceived as a starting point to compare heat reflective insulators to most diffused ones such as EPS. Indeed, the value of the range between 2.3 and 2.6 m
2K/W can be obtained with 6 cm thick EPS with a maximum thermal conductivity of 0.023 W/mK. Such thickness is comparable to the required one by the heat reflective insulators, including the air cavity, the frames, and the finishes. Even from an economical point of view, the total costs can be considered as comparable.
From this starting point, the materials falling on the left of the yellow region have to be discarded because they provide a lower thermal resistance and require a higher total cost.
On the contrary, the materials on the right (e.g., 4 and 2) present a higher total cost (up to 25% higher than the minimum obtained cost) in front of a thermal resistance which is almost doubled, resulting in the most convenient ones, as already outlined by the cost-effectiveness index (
Table 7).
The polynomial approximation provides a useful tool to assess the cost effectiveness of other thermal insulators not investigated in the study by entering the graph with the total cost and the thermal resistance.
3.4.2. Traditional and Heat Reflective Thermal Insulation Materials–Cost Comparison
This paragraph describes the cost comparison between traditional and reflective thermal insulation materials by means of the cost-effectiveness approach.
The information about heat-reflective materials is the average of the costs reported in the previous
Table 7, whereas the costs for traditional materials in
Table 8 have been estimated referring to the regional price lists and the manufacturers’ data.
Figure 11 shows that the total cost for heat reflective insulation is on average comparable to a traditional insulating solution. Therefore, the cost effectiveness of heat-reflective materials needs to be computed case by case and in accordance with the required thermal resistance.
4. Conclusions and Future Developments
The energy efficiency strategy concerning insulating coatings in existing buildings introduces many issues (e.g., limited space for insulating coating and maximum limit transmittance) which require the use of innovative insulators, instead of traditional ones.
This present work provides a general overview about the available thermal insulation materials, with a specific insight into heat reflective ones. Their theorical thermal resistance was computed by means of the presented numerical approach and was used to verify the accuracy of the measured performances declared by the producers. A very good agreement with different anonymized brands has been found. Only one out of eight investigated materials, representing the main heat reflective insulators on the market, presented a variation higher than 5% between declared and estimated performance.
Then, the application of the heat reflective thermal insulation materials to different walls in the most common Italian climatic zones (C, D, and E) was simulated. According to the results, most of the reflective insulators cannot satisfy the required limits in terms of transmittance themselves, almost independently from the climatic zone. The use of reflective materials only as an integration into a thinner external coating is the most effective strategy (
Figure 5,
Figure 6,
Figure 7 and
Figure 8). Indeed, all considered heat-reflective materials lead to transmittances below the limits for all considered climatic zones. Concerning the external integration insulator, the required thickness (about 3 cm) reduces the impact of the insulation on the external façade, whereas the maximum conductivity (about 0.04 W/mK) is highly compatible with most traditional and cheap insulators. Regardless, all considered reflective materials present an intrinsic flaw concerned with the risk of interstitial condensations due to the aluminum layers inside. The reported case studies have shown only one case (stone wall) where interstitial condensation occurred.
A cost-effectiveness analysis has been carried out on the investigated materials, highlighting that the most eligible heat reflective insulator in terms of costs and performance is not always the cheapest one. The results are not relevantly influenced by the steep increase in prices for building materials occurred in Italy in the past months because the rise affected the cost of the insulators in a very similar way. The cost-effectiveness analyses also provided a comparison with the traditional insulators, showing that some heat-reflective materials (30% of the enquired ones, two out of seven materials) are never convenient due to their high cost compared to the low, provided thermal resistance. About 40% of the materials (three out of seven) resulted in being comparable to traditional insulating solutions from the points of view of the total cost, thermal resistance, and required thickness. Only 30% of the investigated materials (two out of seven) almost doubled the thermal resistance at an increase in the total price of about 25%. As a consequence, the adoption of the heat reflective insulators is not always preferable to other classic solutions and needs to be evaluated according to the specific case study.
In future developments, the remaining Italian climatic zones and other kinds of walls should be included in the simulations. Indeed, these solutions would result as being highly effective in buildings where the external outline cannot be modified, (e.g., ancient mansions, castles, or heritage-protected buildings). Another very common case is represented by buildings where there is not enough space to install an external coating and, therefore, internal insulation might result mandatory. In addition, innovative strategies to cope with the interstitial condensation should be investigated because the heat reflective mechanism is typically based on material with a very high vapor resistance (i.e., aluminum layers inside the materials). An instance might be represented by ventilation inside the cavities whereas a more interesting approach concerns the coupling of internal heat reflective insulators to mechanized ventilation systems.


