Article

Stable Carbon Isotopic Composition of Selected Alkylnaphthalenes and Alkylphenanthrenes from the Tarim Oilfields, NW China

by
N’Guessan Francois De Sales Konan
1,
Meijun Li
1,2,*,
Shengbao Shi
1,
Amoako Kojo
1,
Abdulkareem Toyin
1,
Nancy Pearl Osei Boakye
1 and
Tiantian Li
1
1
State Key Laboratory of Petroleum Resources and Prospecting, College of Geosciences, China University of Petroleum (Beijing), Beijing 102249, China
2
Key Laboratory of Petroleum Resources and Exploration Technology, Ministry of Education, Yangtze University, Wuhan 430100, China
*
Author to whom correspondence should be addressed.
Energies 2022, 15(19), 7145; https://doi.org/10.3390/en15197145
Submission received: 10 July 2022 / Revised: 22 September 2022 / Accepted: 25 September 2022 / Published: 28 September 2022
(This article belongs to the Special Issue Advances in Petroleum Exploration and Production)

Abstract

:
The present study aimed firstly to use a set of crude oil samples and a dataset to provide new evidence for source input contribution in selected aromatic isomers for discrimination of oils from three oilfields from Tarim Basin and identify the key factor (s) controlling the isotope composition. Thus, the present research showed that the δ13C values of alkylnaphthalenes and alkylphenanthrenes plotted against P/DBT and Ga/C30H ratios is a reliable and convenient tool for discrimination of organic matter variations in different oilfields. More importantly, molecular ratios and different diagram plots revealed that the selected oil samples would be derived from a mixing of indigenous organic matter from the terrestrial (in Kuqa area) and marine (in the cratonic area) depositional environments prior the apparition of the Yakela Faulted Uplift. Thus, Daolaoba, Yakela, and Tahe oils were made up of organic materials from both marine and terrestrial sources. Furthermore, marine organic matter input dominates oils from the Tahe and Yakela, with a minor input from terrestrial sources. The oils from Daolaoba were assigned to be from a mixing of marine and terrestrial material inputs. The controlling factors assessment revealed that biodegradation has an insignificant effect on the set of oils; however, the source input and the thermal maturity together control the isotopic compositions of individual aromatic isomers from these three oilfields.

1. Introduction

In general, source rock and oil classifications are based on biological marker characteristics [1,2,3,4,5,6,7,8]. Aromatic molecular markers have been proven by several researchers to provide details and complementary information [9,10,11,12,13,14]. As research progresses, better tools are needed to improve our understanding of distinct basins. For example, Sofer [15] used the isotopic composition of saturate and aromatic fractions to identify source rock deposition and expand oil–oil correlation. As for Xinjian et al. [16], the carbon isotopic compositions of paleozoic oils were used to identify the major source rock. Sofer [15] distinguished marine-originated oils from terrestrial-originated oils by graphing the bulk isotope compositions of the fraction of saturated compounds against one of the isotope compositions of the aromatic compound fractions [16].
Compound Specific Isotope Investigation (CSIA) has been employed in various studies to measure the isotope composition of specific polycyclic aromatic hydrocarbons (PAHs). Maslen et al. [17], for instance, used a combination of molecular and compound-specific isotope (CSIA) techniques to differentiate source inputs of particular aromatic components in crude oils from the western part of Australia. According to the authors, the molecular ratios and the stable carbon isotope ratios of individual PAHs ensure a new and reliable tool to establish distinctions in oil samples from different environments that hold various concentrations of both marine and terrestrial materials. Thus, connections between the isotope compositions of low-molecular-weight aromatic hydrocarbons (LMWAHs), the maturity level, and the organic matter source input are mainly discussed by some research. The source input has been defined as a main factor in the determination of the δ13C values of LMWAHs. Indeed, the isotope compositions of the mixtures of alkylphenanthrene isomers are revealed being dependent generally on organic material type [18]. In addition, the δ13C values of alkylnaphthalene isomers such as 1,6-DMN, 1,2,5-TMN, or 1,2,5,6-TeMN present wide variations that is assigned to the variation of the source origins [9]. However, the depletion of the isotope compositions of alkylnaphthalenes was also assigned to the maturity level [18]. Chen et al. [19] attested that the variation in isotope composition of individual unsubstituted PAHs with increasing maturity (naphthalene and phenanthrene) is insignificant contrary to the substituted isomers. Thus, the isotope compositions these compounds are revealed as useful for discriminating oil source inputs as well as to establish the correlation between oils and source rocks [19].
The Tarim Basin, localized in the northwest part of China, is a complex basin based on the geological setting, with several source rock intervals deeply located and different charge phases. Caledonian, Hercynian, Indosinian, Yanshannian, and Himalayan are the five tectonic cycles identified in the Tarim Basin in the course of its development. These cycles are mainly characterized by features such as faults, folds, uplifts, and erosions [20,21,22]. Researchers identified two principal source rocks in the Lower Palaeozoic of the cratonic region of the basin (Cambrian–Lower Ordovician and Middle–Upper Ordovician) [23,24,25].
In the Tarim Basin, stable carbon isotopic composition ratios were employed to relate oils to their source rocks and to determine families of crude oils. For example, Xinjian et al. [16] concluded that the Lower Cambrian hydrocarbon source has been revealed to have lower kerogen isotope values (δ13C values between −36.0‰ and −34.0‰) than the Middle-Upper Cambrian hydrocarbon source (with δ13C values between −30.0‰ and −27.0‰). Therefore, the mixing oils derived these two Cambrian rocks may have the isotope compositions in the range of −33‰ to −30‰. As a result, neither the likelihood of Type III oil being obtained from Cambrian source rock nor the contribution of Ordovician source rock can be ruled out [16]. Cui et al. [26] classified Markit Slope crude oils into two oil families of which Bashituo oils from the western part of the Markit Slope (<−34.0‰ and <−32.0‰, respectively, for saturated hydrocarbons and aromatic components) and Hetian River condensate oils from the eastern part (δ13C >−32‰ and > −30.6‰, for saturated hydrocarbons and aromatic components, respectively).
Based on molecular parameters and isotope values of bulk oils, Song et al. [27] classified Yakela Faulted-Uplift crude oils into two main types. Yakela and Donghetang oils have similar compositions and isotope compositions as Tahe oils with relatively lighter δ13C values. In contrast, Daolaoba and Luntai oils have a chemical composition and stable carbon isotope ratios that are similar to Kuqa oils, indicating that they may not be marine-sourced oils. However, the bulk isotopic composition has been shown to not be reliable. In fact, oils revealed being generated by a marine source rock were showed to be of terrestrial origin on a Sofer plot, whereas crude oils identified as terrestrially sourced are assigned as marine oils [28]. Because the changing nature of different molecules might influence bulk isotopic measurements of whole oil, aliphatic, and aromatic fractions, recent studies have focused on stable carbon isotope ratios of specific molecules [24,29,30,31,32]. The isotope compositions of n-alkanes and total oils were precisely used to separate Tarim Basin marine sourced oils into two different groups, according to Wanglu et al. [29] and Jia et al. [24,30]. This classification correlates well with Li et al. [33], whose classification based on their biomarker characteristics attested that the major part of oils from Tarim were marine sourced while minor oils were predominantly terrestrial sourced. Thus, a combination of molecular compositions and isotope compositions for low-molecular-weight saturated components as well as those from high molecular weight asphaltenes in tar sands could provide significant information about the biodegradation level, the oil charge pattern, and the in-reservoir mixing in an old basin. Cai et al. [31] used individual n-alkanes δ13C values firstly to characterize two Cambrian source rocks, and then establish an oil–source rock correlation for identifying their related oils. Huang et al. [32] found that the isotope compositions of specific light hydrocarbon components and n-alkanes, particularly for methylcycloalkanes, cycloalkanes, and aromatics, are effective oil–oil correlation metrics.
While the bulk isotope compositions of crude oils, oil fractions, and individual n-alkanes isotope compositions have been used to study the organic matter source variations in oils from Tarim Basin [24,29,30,31,32], the isotope compositions of individual polycyclic aromatic hydrocarbons (PAHs) of these oils remain unstudied. An investigation on these compounds (especially Low-Molecular-Weight PAHs) could provide novel insights for oils’ organic matter source input discrimination. Furthermore, the use of the CSIA has provided helpful information about source origins of individual hydrocarbons [17]. In addition to the source inputs, it has been shown that factors such as biodegradation and thermal maturity can affect the isotope values of individual aromatic hydrocarbon [18,19,34]. Firstly, by quantifying for the changes in δ13C of selected individual alkylnaphthalenes and alkylphenanthrenes identified in Tarim Basin crude oils, we use an oil sample set and dataset to provide new evidence for source input contribution for selected aromatic isomers in order to classify oils for discrimination of three oilfields from Tarim Basin. Secondly, identifying the key factor(s) controlling the isotope compositions of the selected aromatic isomers. Thus, this study reveals important insights because it provides a new approach for the evaluation of the organic source contribution in Tarim Basin. Thus, the research provides a hypothetical mechanism that could have led to the formation of the oilfields near the Yakela Faulted Uplift and affected the organic matter distribution in the three different fields.

2. Geological Setting

Several authors have summarized the geological structure and Tarim Basin system [21]. The Tarim Basin (Figure 1) covers a surface of about 56 × 104 km2 and is the most significant petroleum basin in China [35]. The basin is localized in the northwestern part of the country and it is composed of a cratonic basin (Paleozoic) covered by a foreland basin (Mesozoic–Cenozoic). Ten depressions belong to the Tarim Basin among which the Kuqa, Northern, Southwest, and South-eastern Depressions are the principal depressions [35]. To these depressions, 10 uplifts are associated of which the Northern, Central, and Southern Uplifts are the main ones [36]. The thickness (up to 15,000 m) of the successive deposition from the Sinan to the Cenozoic sediments together with the Northern Depression is the highest in the basin [37]. The layers of the Lower Paleozoic are deposited in the marine environment, while in mixed marine, transitional, and terrestrial environments those of the Upper Paleozoic, Mesozoic, and Cenozoic strata are present. Caledonian, Hercynian, Indosinian, Yanshannian, and Himalayan are the five tectonic cycles identified in Tarim Basin in the course of its development. These cycles are mainly characterized by features such as faults, folds, uplifts, and erosions [20,21,38]. The principal stocks of oil and gas in the cratonic basin are mainly identified in the Tabei, Tazhong uplifts, and the southwest areas of the Tarim Basin [39]. The lower Paleozoic, upper Paleozoic, and Mesozoic–Cenozoic provincial unconformities separated oil and gas traps into three different successions.
Diverse ages of condensates were discovered in Tarim Basin of which those were from the Ordovician, Carboniferous, Triassic, Cretaceous, Eocene, and Neogene. The Ordovician condensates are located the Lungu, Tazhong, and Hetianhe fields [27], whereas the Neogene condensates are mainly identified in the Kekeya field [40] and the Jurassic condensates in the Yingnan 2 field [41]. In the Tabei and Tazhong uplifts, petroleum of the basin was principally detected in different ages and types of reservoirs (Ordovician carbonate and Carboniferous, Silurian, Triassic, and Jurassic clastic). In the basin, heavy, normal, light, and waxy oils discovered from these reservoirs represent the marine petroleum [24].
Yakela Faulted-Uplift is limited by Luntai and Yanan faults in the northern part of the Tarim Basin directed from East to West and covers a surface of approximately 4400 km2 [27]. The Tahe oilfield is localized at the southern inclination of the Ackule Uplift and on the south sideof Yakela Faulted-Uplift area. As for Daolaoba and Yakela fields, both are respectively located in the northern and the southern parts of the Tarim Basin separated by the Yakela Faulted Uplift (Figure 2).

3. Material and Methods

3.1. Samples

Twenty oil samples were collected from Tarim Basin localized in the northwest of China (see Table 1). This group of crude oil samples includes oils generated from different types of source rocks. From this set of oils, 14 oil samples were from Tahe field, 4 oil samples from Daolaoba field, and 2 crude oil samples from Yakela field (Figure 2).

3.2. Fractionation

The entire procedure is detailed in Konan et al. [42]. In short, four main fractions were removed from the crude oils (between 80 and 100 mg). The first were the asphaltenes before saturated, aromatic, and non-hydrocarbon fractions were successively separated. First, the petroleum ether was used for collecting the de-asphaltened saturated, aromatic, and non-hydrocarbon mixture. Then, using filtration the asphaltene remaining in the cotton was eluted using dichloromethane. The de-asphaltened mixture was separated into saturated, aromatic, and non-hydrocarbon fractions with a chromatographic column (6 cm) made up of silica gel and alumina (3:2). The saturated one was separated with 40 mL of petroleum ether, followed by the aromatics with petroleum ether and dichloromethane mixture (1:2, 20 mL), and finally, the non-hydrocarbon components with the mixture dichloromethane: methanol (99:1, 20 mL). The GC-MS analyses of the aromatic fractions were completed; they were separated into sub-fractions of which each one would undergo another GC-MS analysis before the GC-IRMS analyses of individual aromatic compounds were carried out. Thus, the separation of mono-aromatic, di-aromatic, tri-aromatic, and more than 3 ring sub-fractions were completed, respectively, with four different volumes and mixtures of petroleum ether and dichloromethane on silica-alumina (1:1) [42].

3.3. Gas Chromatography-Mass Spectrometry (GC-MS)

The gas chromatography appliances (Agilent 6890) fused to N-5975 IMSD were employed for identifying individual aromatic compound from the sub-fractions. The HP-5 MS (60 m × 0.25 mm, i.d., 0.25 µm thick) was used as the column and the helium (He) was utilized at a flow regime of one milliliter per minute. The degree of the inlet was established at 300 °C and the injection completed in the split mode. The level of heat from the chromatographic gas stove at starting was established at 80 °C, and remained for 1 min; the temperature raised at 3 °C/min until it attained 310 °C. The energy of the electron ionization (EI) mode of the mass spectrometry was 70-eV. For the acquisition and the identification of each polycyclic aromatic hydrocarbon family, the full scan mode (50–600 Da) associated to the selective ion acquisition was used. The retention time of each aromatic compound was compared to the compound references as obtained from previous works [10,25,43].

3.4. Gas Chromatography-Isotopic Ratio Mass Spectrometry (GC-IRMS)

The entire aromatic sub-fraction volume (0.5 μL) was squirted into the inlet in the split mode of the Agilent 7890 GC-GC5 Gas Chromatographic Interface -PrecisION IRMS (Elementar Analyzer system GmbH, Langenselbold, Germany). The initial injection mode was maintained at a ratio of 1 min 30 at 50 °C and reached 300 °C with a regime of 700 °C/min for the remainder of the analysis with helium as the carrier gas. The separation was completed using an HP-5 MS column (30 m × 0.25 mm i.d., 0.25 µm thick, USA). The gas chromatography stove was initially set at 80 °C for 6 min, and then a 15 °C/min raise up to 80 °C was used, 5 °C/min to 200 °C and kept at this step for 30 min. Thus, the isotope composition data of the different selected compounds analyzed typically had a standard deviation of 0.5‰ on average.

4. Results and Discussion

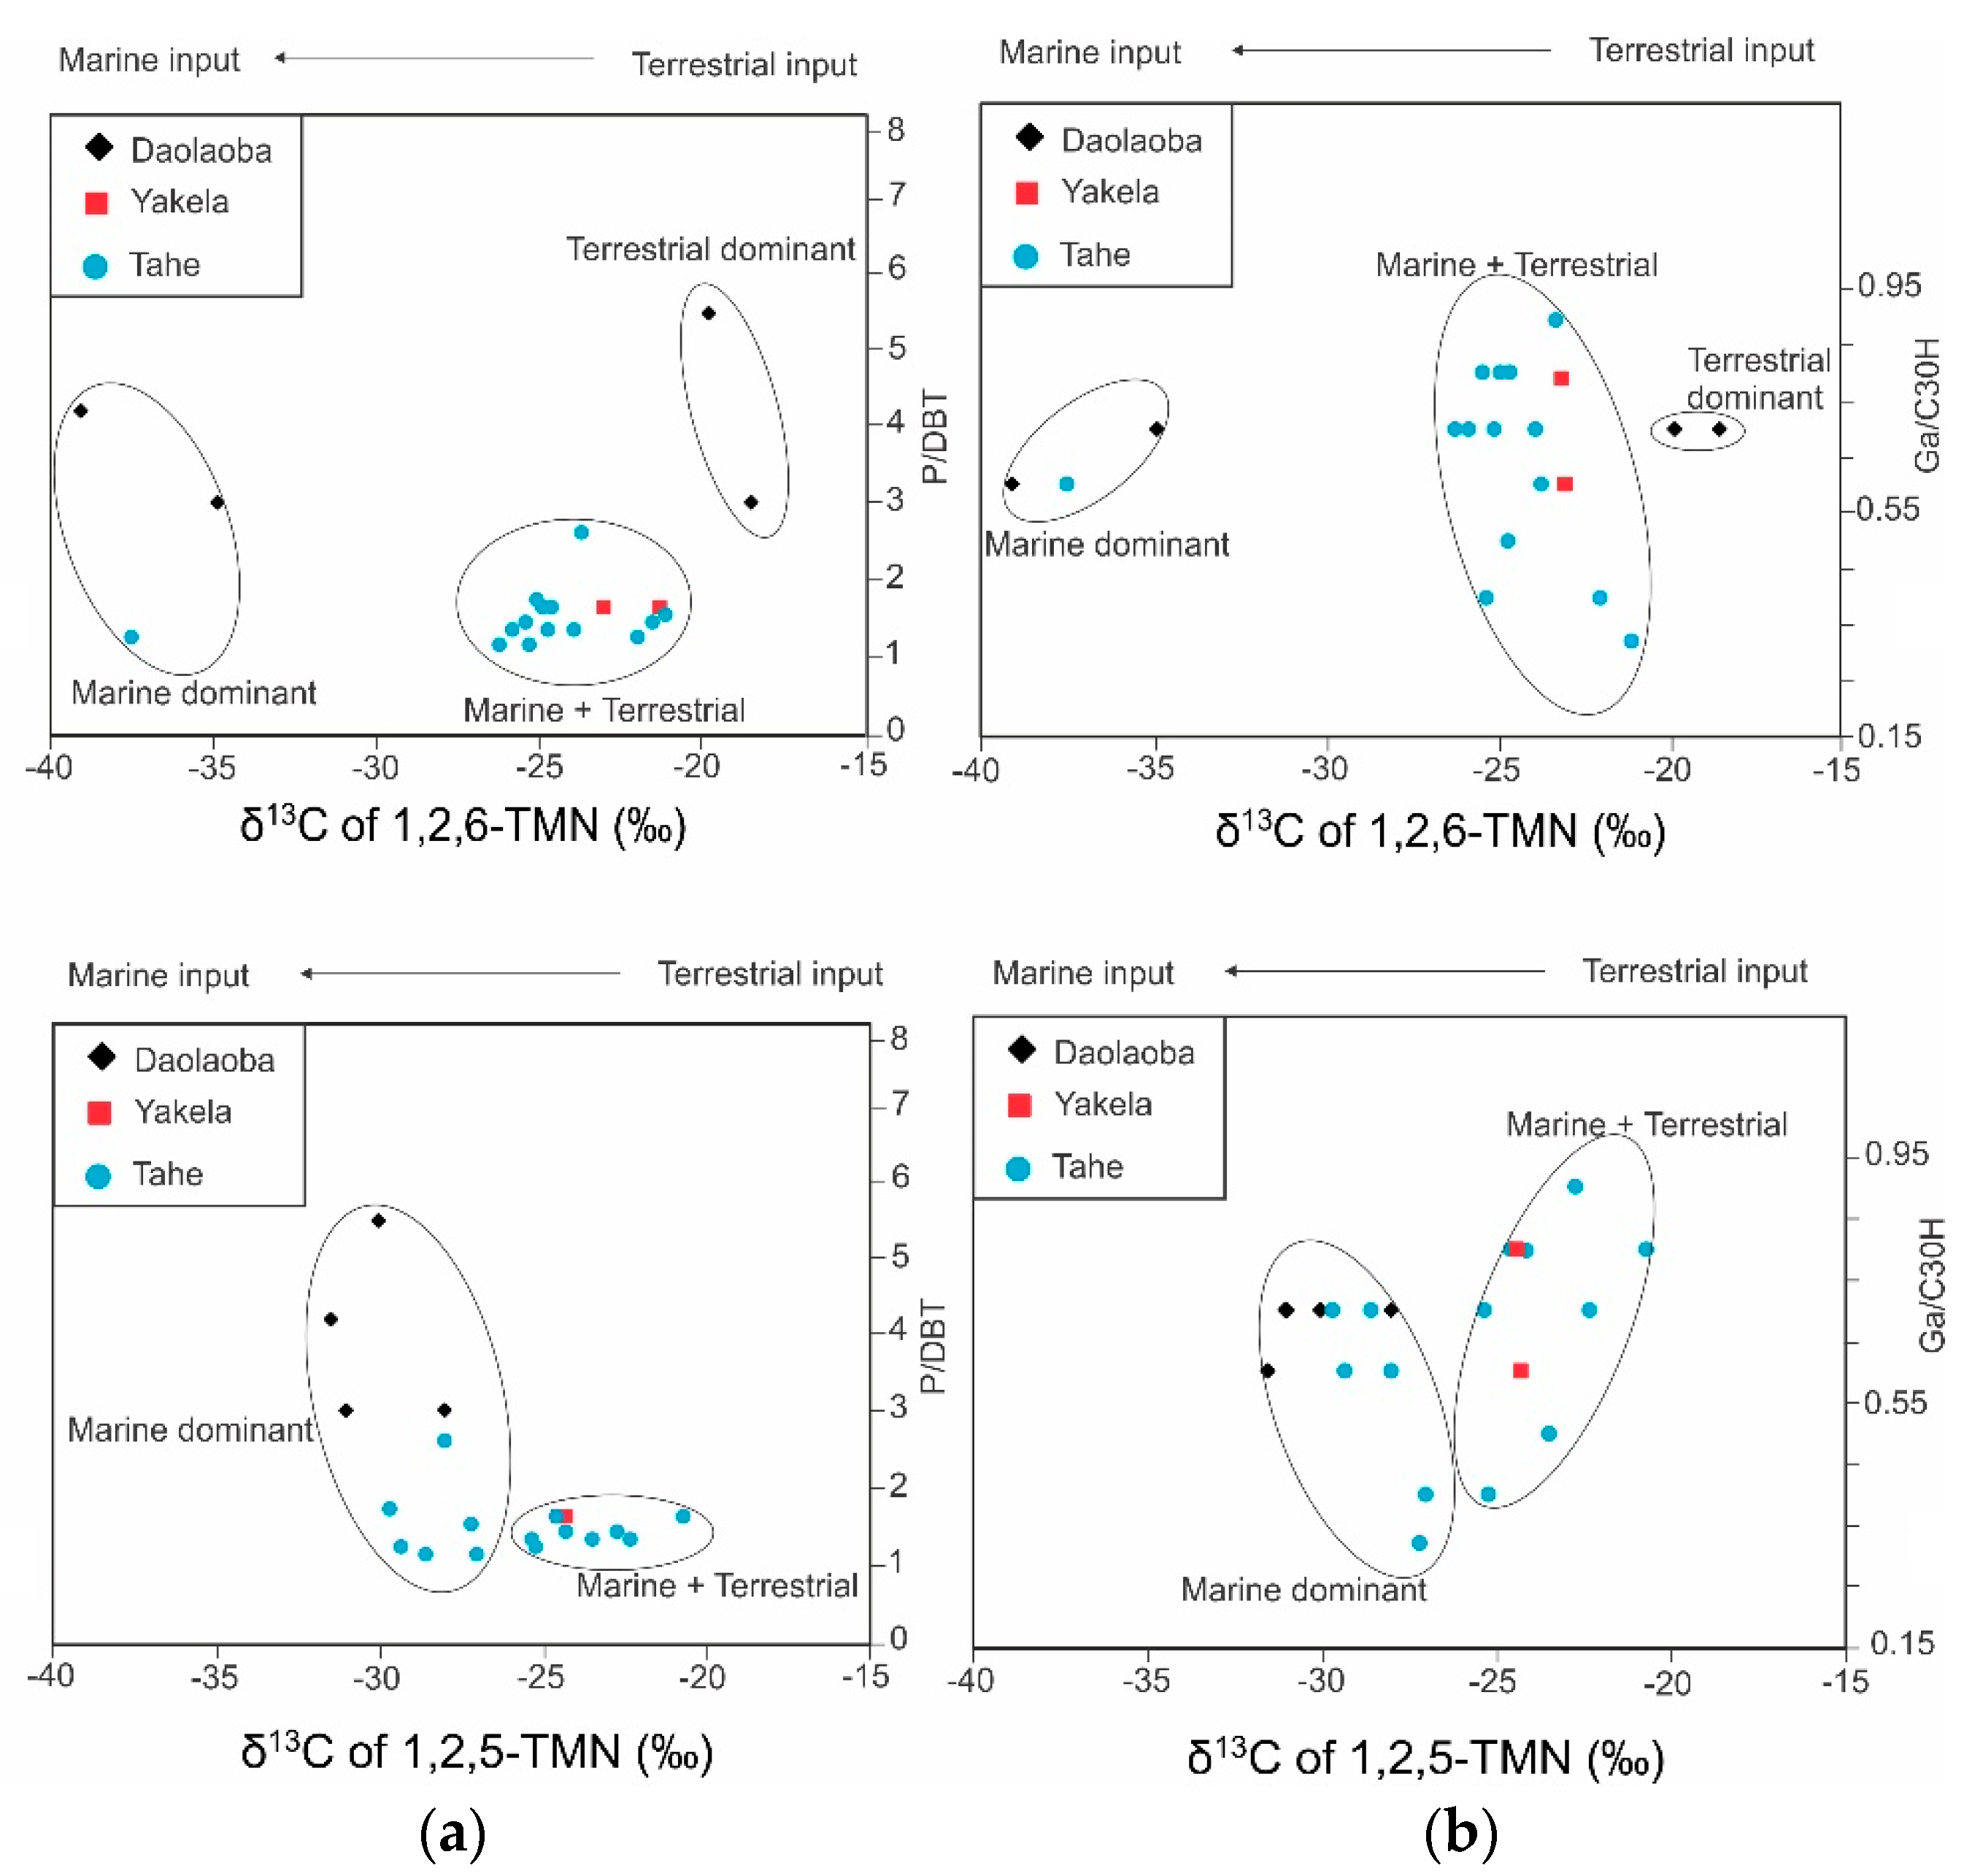
4.1. Organic Matter Source Contribution

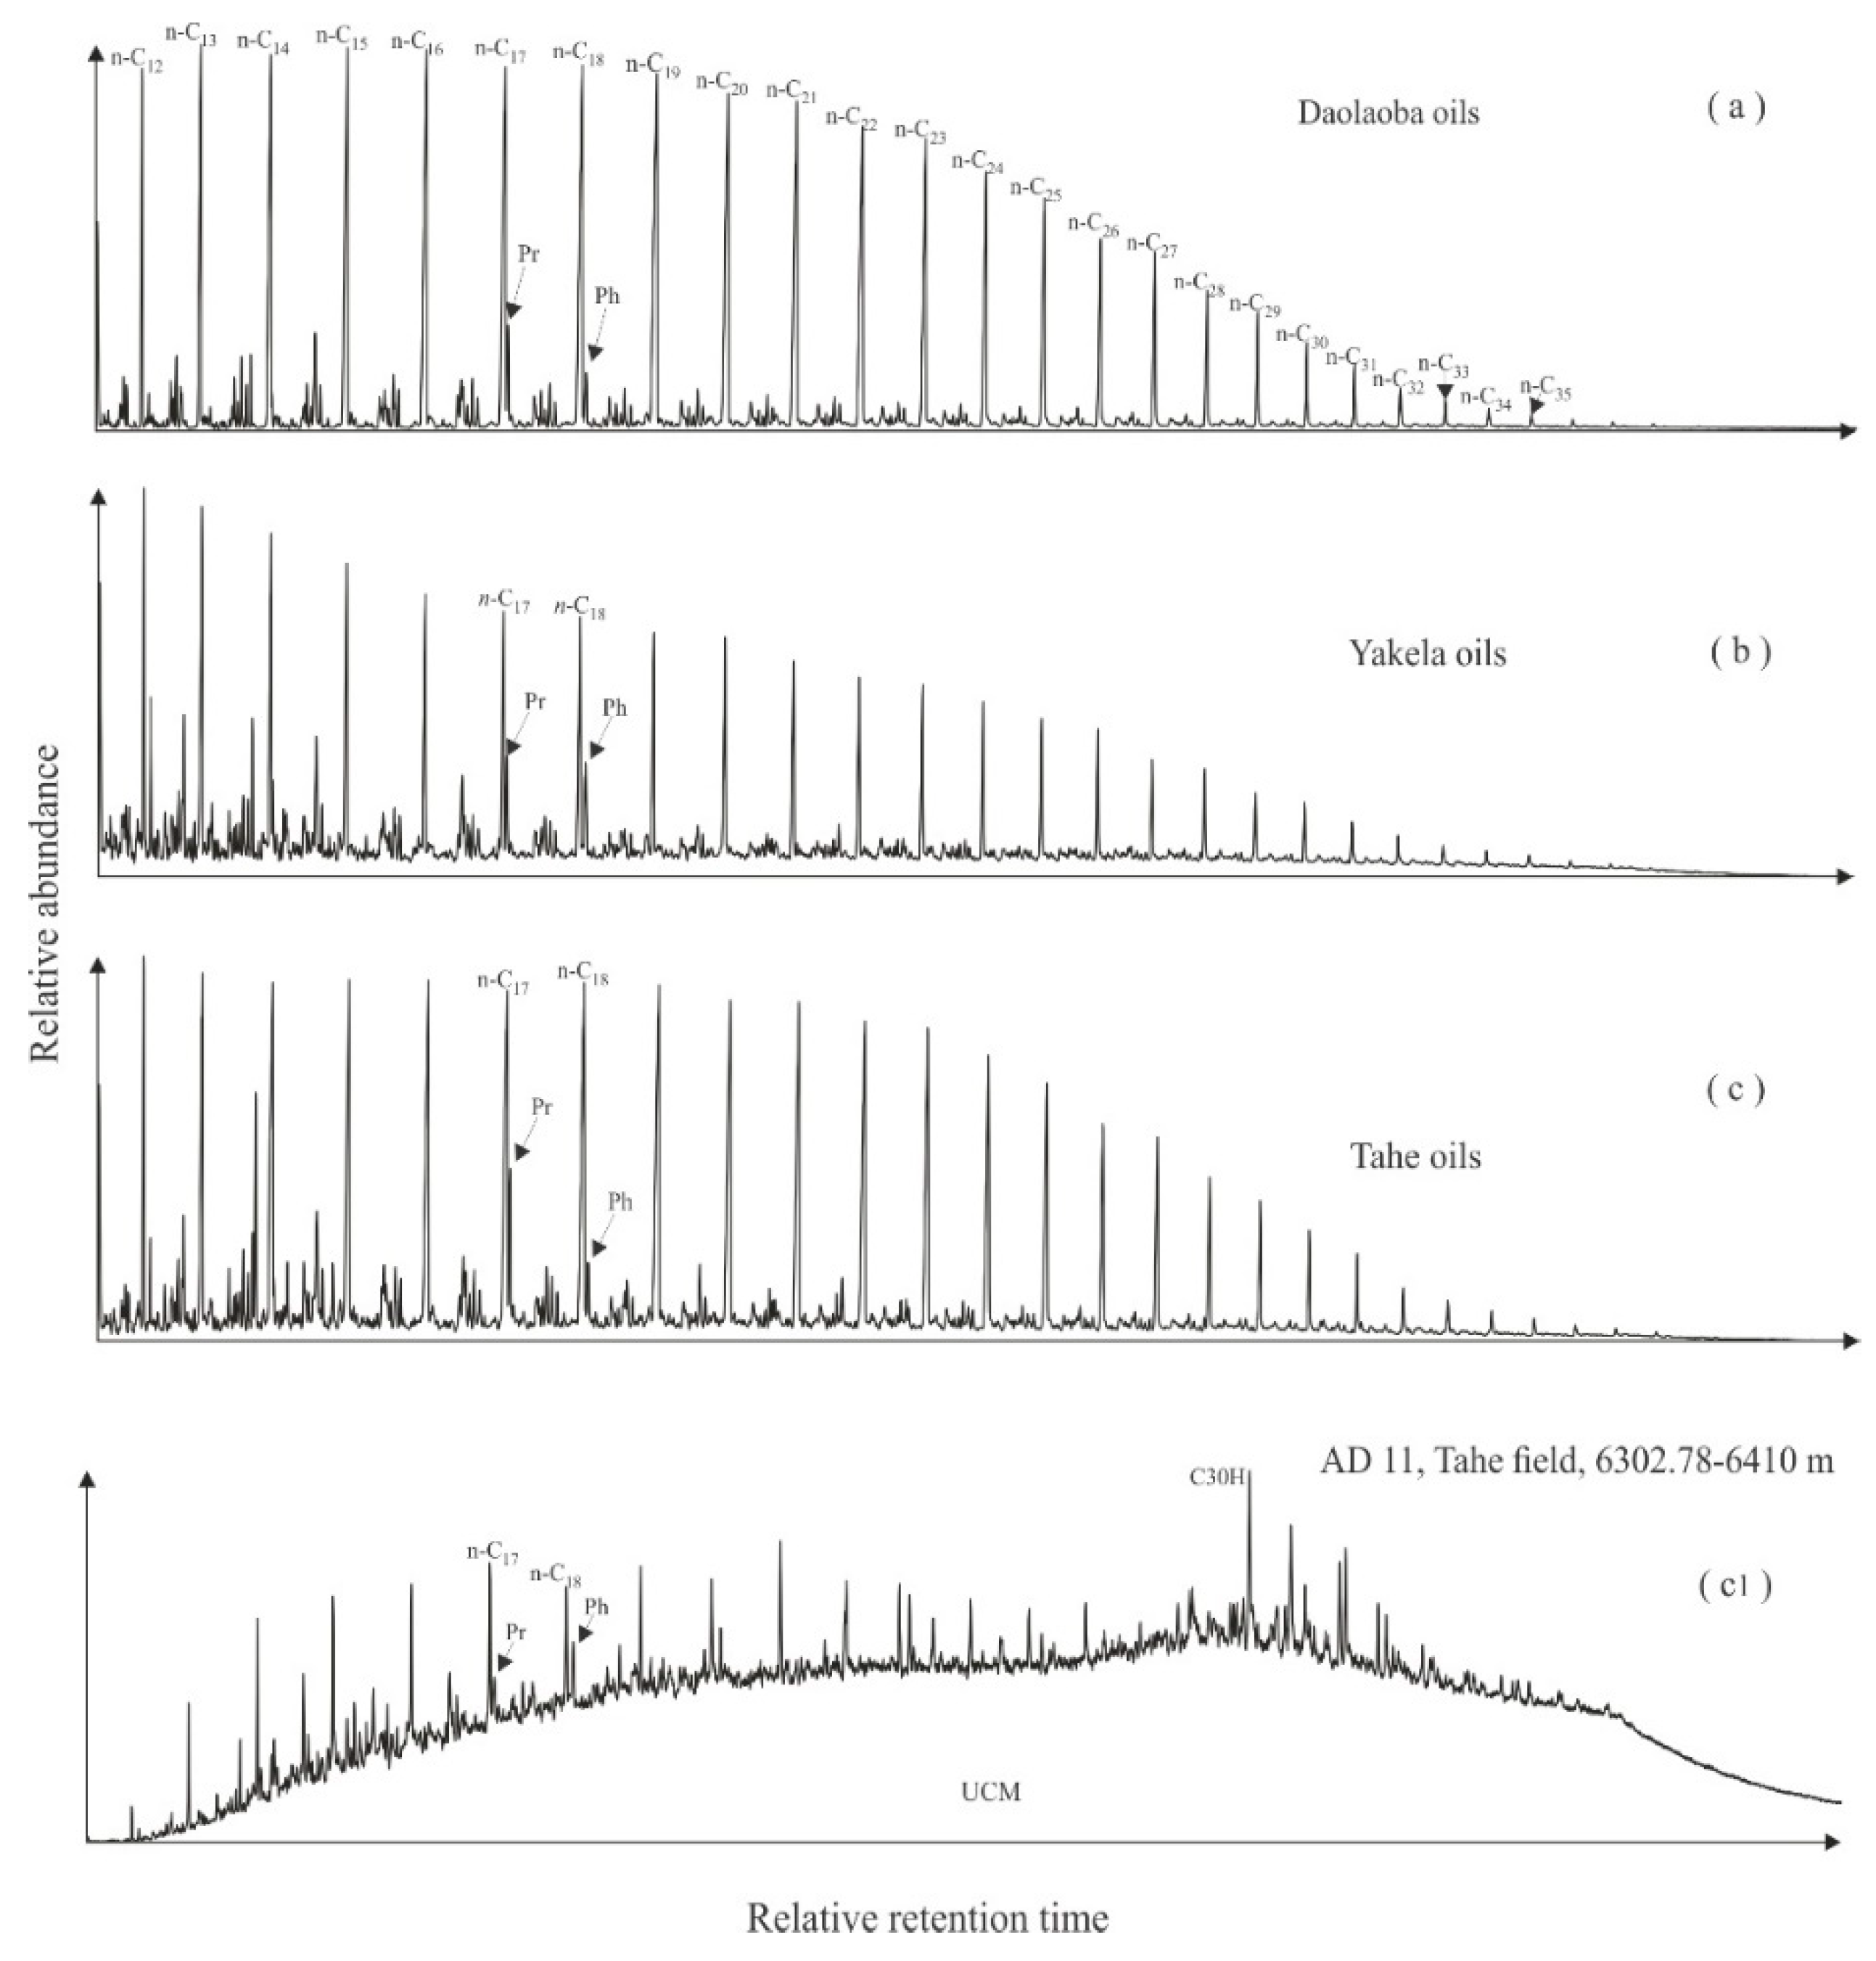
4.1.1. Normal Alkane and Isoprenoid Compounds

The assessment of the identification the pristane and phytane compounds in crude oils is one of the most common parameters used for determining the different source inputs and their related environments. The presence of a high concentration of normal alkanes is noticed in all crude oil samples, suggesting that n-alkanes are not altered or, if so, altered little by biodegradation. Thus, for all crude oils from the Tahe oilfield and Yakela gas/oilfield, the pristane/phytane ratio (Pr/Ph) is less than 1.2 and defined by a Ph/n-C18-Pr/n-C17 higher than 0.0, implying a marine origin of the organic matter input deposited in an anoxic environment (see Figure 3). In addition, these samples characterized by ADBT/ADBF (alkyldibenzothiophene/alkyldibenzofuran) ratios higher than 6.5 (Table 1) suggest an anoxic depositional environment [33,44]. The crude oils of the Daolaoba gas/oilfield, with a Ph/n-C18-Pr/n-C17 ratio less than 0.0, have Pr/Ph ratios in between 1.2 and 3.0, implying that the organic matter is deposited in a suboxic environment [41]. This result suggests that Daolaoba oils would be from a mixture of marine and terrestrial organic material with a higher terrestrial contribution (Figure 3). This is coherent with the low Pr/n-C17 and Ph/n-C18 ratios. Yakela and Tahe oils having higher ratios fall in the algal kerogen zone, indicating that these oils were genetically related and derived from a high contribution of marine input with minor terrestrial organic material (Figure 3) [45]. Two Tahe oils show somewhat lower Pr/n-C17 ratio than other oils plotted in this region, presumably indicating the involvement of another factor such as biodegradation, mixing of multiple source inputs, or thermal maturity level, which also falls in the algal kerogen area. Daolaoba oils, which have low Pr/n-C17 and Ph/n-C18 ratios, fall within the humic kerogen area, which is consistent with the terrestrial origin of the organic material [46]. These oils are characterized by Pr/Ph ratios in the range of 1.8–2, and low isoprenoid/n-alkane ratios (Pr/n-C17 < 2.5 and Ph/n-C18 < 1.5) (Figure 2). The good correlation between Pr/n-C17 and Ph/n-C18 ratios (R2:0.91) of the 20 oils agrees with the enhancing tendency of the maturity level (Figure 2) [24].

4.1.2. δ13C Values of Aromatic Hydrocarbon Sub-Classes

Table 1 and Table 2 show the molecular parameters P/DBT (Phenanthrene/Dibenzothiophene), Ga/C30H (Gammacerane/Hopane), and δ13C values for different aromatic hydrocarbons determined for the three Tarim Basin oilfields used in this work. Almost all the crude oils used for this study have a high abundance of aromatic compounds detected. The δ13C values were determined for some aromatic sub-classes among which are TMNs (trimethylnaphthalenes), TeMNs (tetramethylnaphthalenes), MPs (methylphenanthrenes), MFs (methylfluorenes), DMFs (dimethylfluorenes), MDBTs (methyldibenzothiophenes), DMDBTs (dimethyldibenzothiophenes), and some selected isomers such as 1,2,6-TMN (1,2,6-trmiethylnaphthalene), 1,2,5-TMN (1,2,5-trimethylnaphthalene), P (phenanthrene), 9-MP (9-methylphenanthrene), and 1-MP (1-methylphenanthrene). For simplicity due to the co-elution, Maslen et al. [17] proposed averaging the δ13C values of each isomer series for each field. Based on this logic, the plot of the δ13C values of the aromatic sub-classes for the three separate fields show a general depletion trend in Yakela gas/oilfield and Tahe oilfield with the increase in the methylation and increase in the aromatic rings in contrast to the Daolaoba gas/oilfield (Figure 3). However, each trend shows some similarities and differences. Indeed, 13C compositions of alkylfluorenes (AFs) deplete in the Tahe oilfield from MFs (methylfluorenes) to DMFs (dimethylfluorenes) whereas 13C compositions enrich from Yakela and Daolaoba gas/oilfields. The 13C compositions of alkylphenanthrenes (APs) enrich from P to MPs in the Tahe oilfield and Yakela gas/oilfield contrary to the Daolaoba gas/oilfield where it depletes. Likewise, the isotope compositions of alkyldibenzothiophenes (ADBTs) enrich in the Tahe oilfield and Yakela gas/oilfield from DBT to DMDBTs when in the Daolaoba gas/oilfield a depletion is observed (Figure 4). These similarities and differences between the general trends of each field from those of some sub-classes’ trends could suggest the influence of different controlling factors. Indeed, the source input and relative thermal maturity are likely to influence the relative concentrations and isotope compositions of particular aromatic components in oils [18,19]. It has been revealed that biodegradation as well as oils mixed in reservoirs and water washing have important influences on aromatic hydrocarbon compositions in oils [47,48,49]. The isotope compositions of alkylnaphthalenes were revealed to be heavily linked to thermal maturity, in contrast to alkybenzenes and alkylphenanthrenes [18]. However, Chen and co-authors who investigated the relationship individual compound isotope composition with maturity level revealed that the positive correlation is related to the fact that the higher the number of substituent groups, the higher the δ13C values [19].

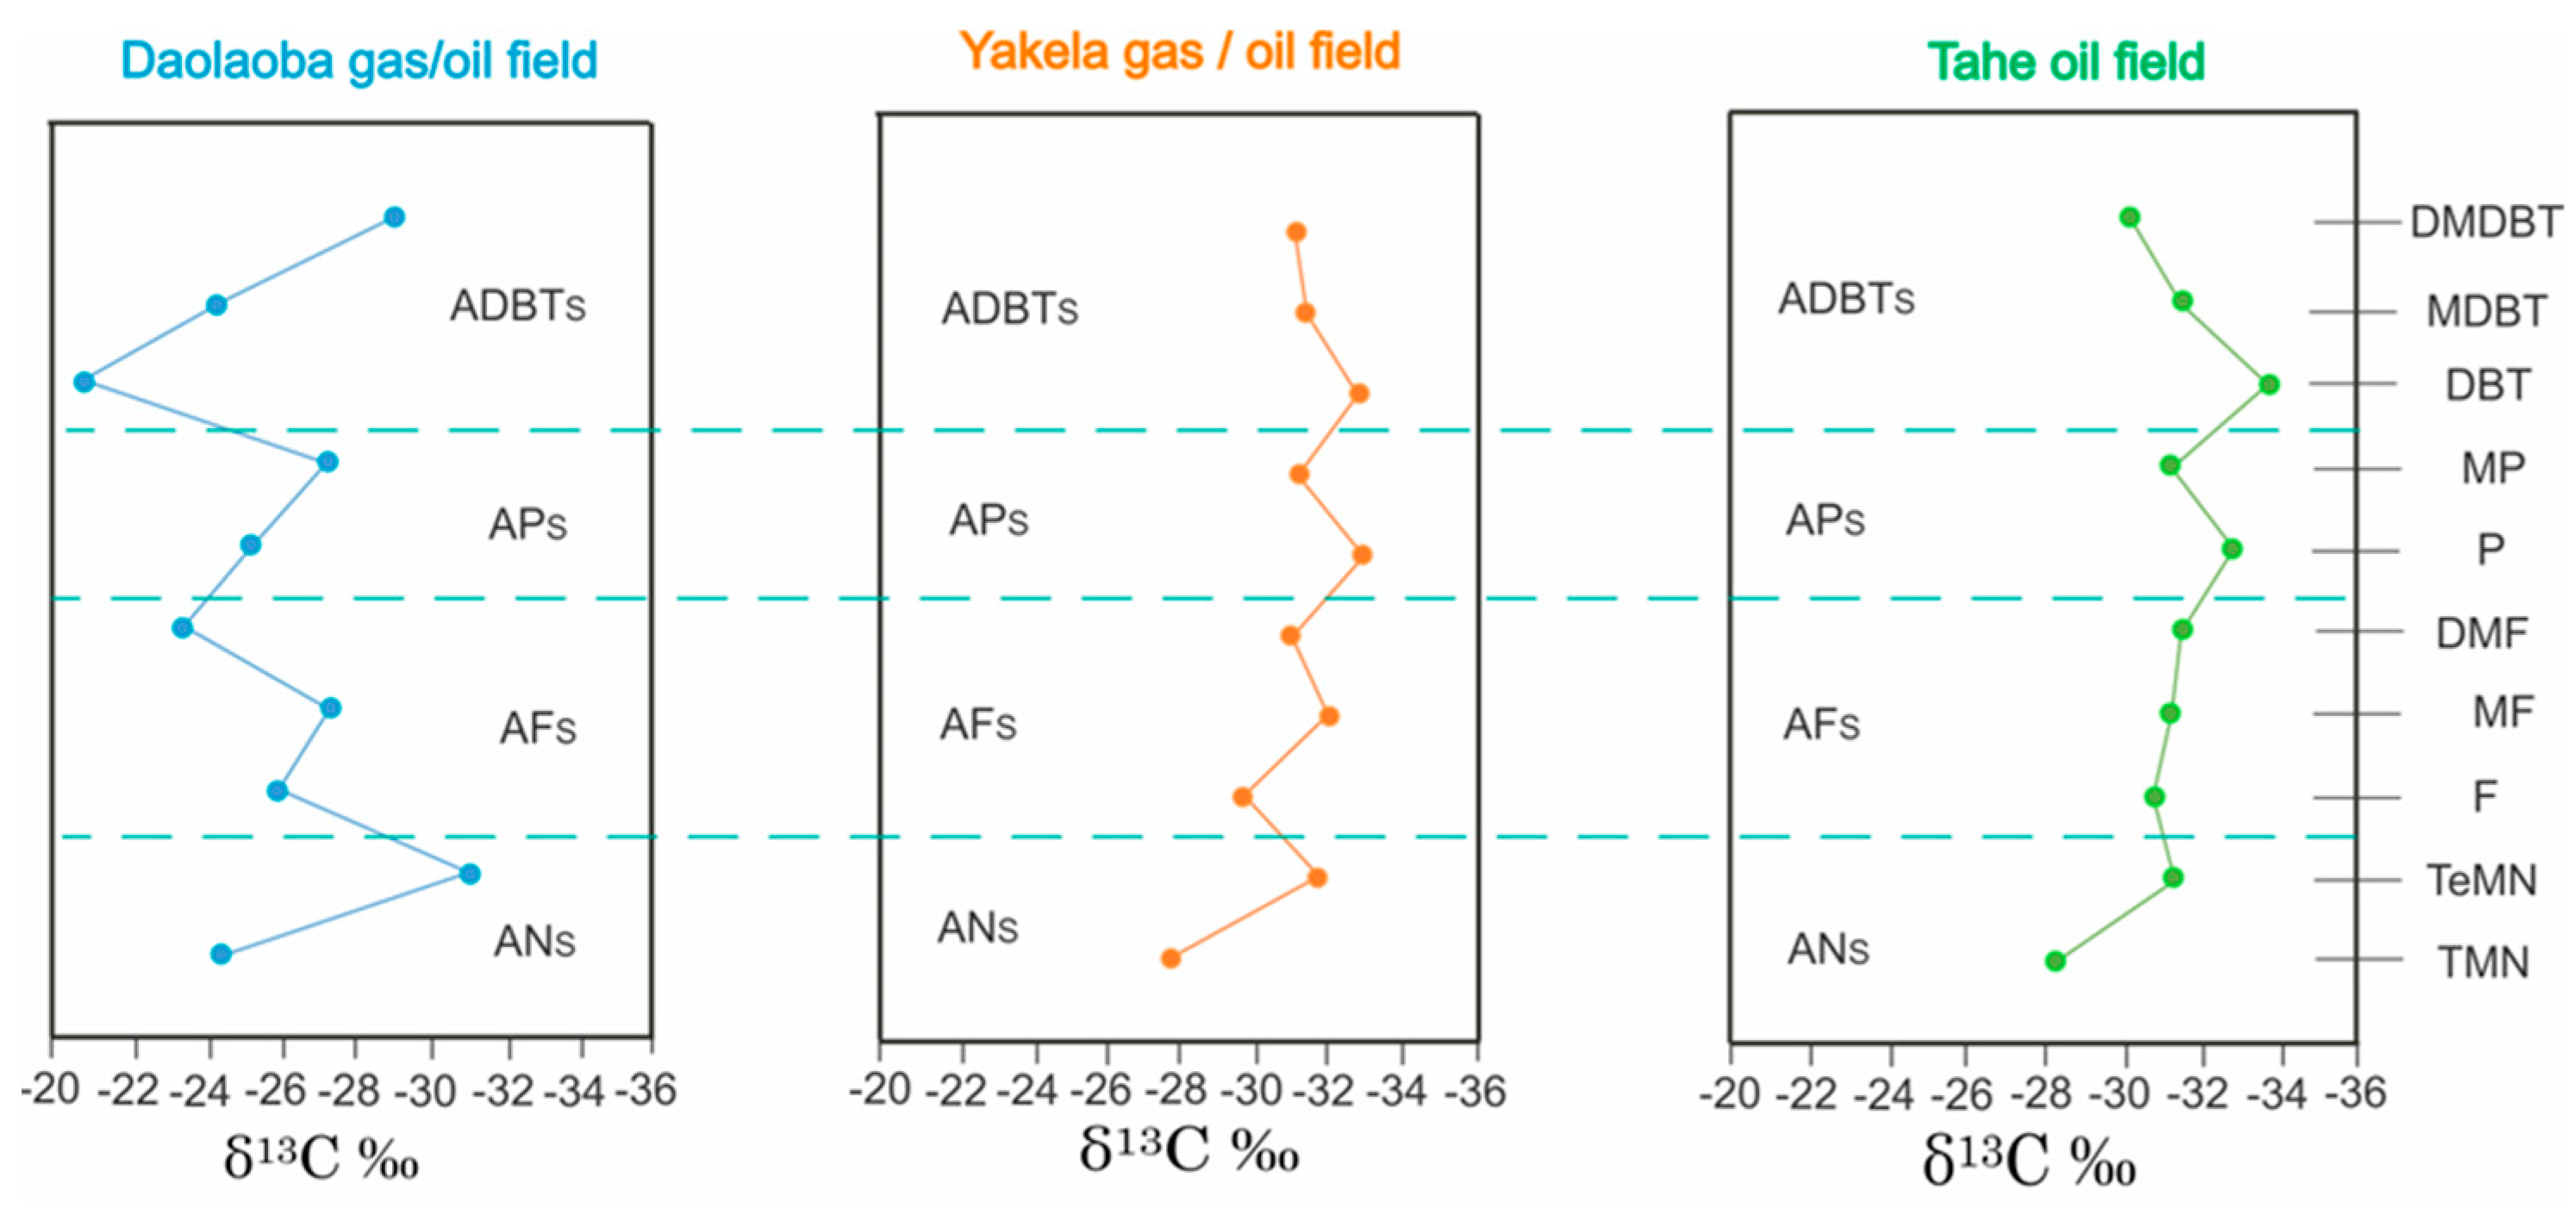
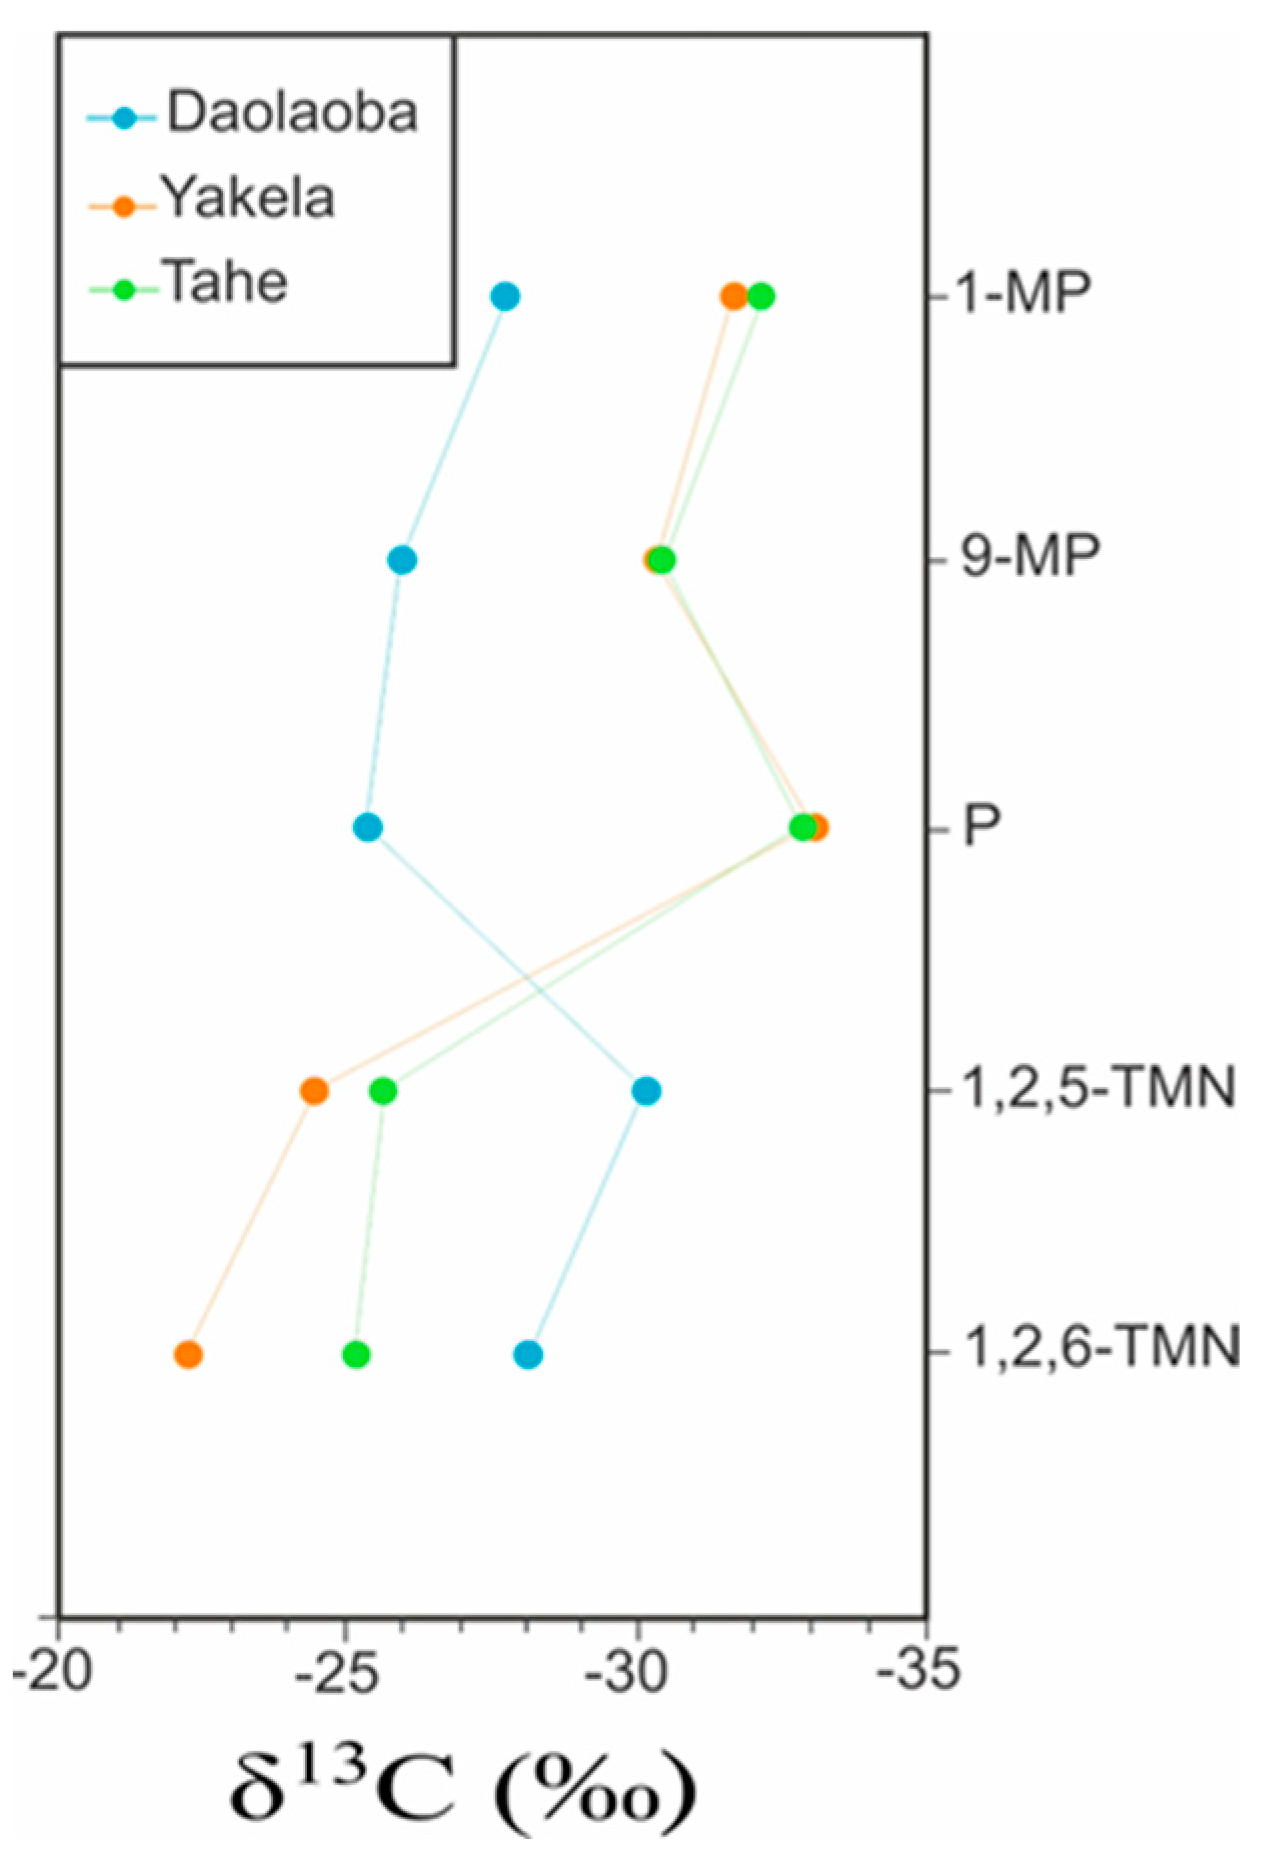
4.1.3. Averaged δ13C Values of Individual Aromatic Isomers

Some specific individual aromatic isomers are considered to serve as a marker for source origin and depositional environment. Individual isomers such as 1,6-DMN, 1,2,5-TMN, 1-MP, 1,9-DMP [17], and 9-MP [25] were used for oil correlation. Indeed, Maslen and co-authors [17] selected these specific isomers particularly because alkylnaphthalene concentrations generally depend on the organic origin. The high abundance of individual alkylated isomers such as 1,2,5-TMN and 1,2,6-TMN is generally related to the land plants [50]. Thus, 1,2,6-TMN could be used for oil and source correlations. The study of the effect of the biodegradation on the abundances of phenanthrene (P) in crude oils from Bongor Basin revealed that this compound can withstand biodegradation contrary to its alkylated isomers [49]. Likewise, naphthalene and phenanthrene isotope compositions have been found to be a good tool for oil–oil and oil–source correlations [19]. As a result, the isotopic composition of phenanthrene (P) can be utilized to analyze source input. Therefore, in addition to 1,2,5-TMN, 1-MP, and 9-MP, the present study will use for the first time 1,2,6-TMN and P for oil–oil correlation. Thus, the isotope values of these individual compounds were carried out for the 20 oil samples from Daolaoba, Yakela, and Tahe fields. For simplicity, the δ13C values of each individual isomer were averaged to represent each field. In general, higher organic matter δ13C values indicate a higher terrestrial material input compared to the marine organic matter contribution [17].
In Figure 5, the narrow distribution represents the increase in terrestrial input for the oils. The isotope compositions of 1,2,6-TMN for each oil sample are presented in Table 2. The highest variance of values for 1,2,6-TMN (5.9‰) is noticed in between Daolaoba and Yakela. The oils from Daolaoba, where the δ13C values of 1,2,6-TMN are the lowest (−28.1‰), are assigned to be from marine material for the 1,2,6-TMN contribution, whereas the oils from Yakela, where the δ13C values are the highest (−22.2‰), are generated mostly from terrestrial sources for 1,2,6-TMN. It can be argued that Daolaoba crude oils are depleted in 1,2,6,-TMN when Yakela crude oils with the highest isotope values are most enriched in the 13C composition of 1,2,6-TMN. Tahe crude oils with the δ13C values of 1,2,6-TMN (−25.1‰) are from a mixture of marine and terrestrial source inputs (Table 2, Figure 5).
The isotope compositions of 1,2,5-TMN for each crude oil are presented in Table 2. The highest variance of values for 1,2,5-TMN (5.7‰) is noticed in between Daolaoba and Yakela. The oils from Daolaoba have the lowest δ13C values of 1,2,5-TMN (−30.1‰) characterizing a marine origin for 1,2,5-TMN, whereas the oils from Yakela have the highest δ13C values of 1,2,5-TMN (−24.4‰) signifying a terrestrial origin for 1,2,5-TMN. Because of the disparity in marine and terrestrial inputs to the source rock, the oils from Tahe have δ13C values of 1,2,5-TMN (−25.6‰) (Table 2, Figure 5).
The δ13C values of P for each crude oil are presented in Table 2. The highest variance of values for P (7.7‰) is observed between Yakela and Daolaoba. The oils from Yakela recorded the lowest δ13C values of P (−33.0‰), implying a marine source for P contribution, whereas the oils from Daolaoba recorded the highest δ13C values of P (−25.3‰), revealing a mixed marine and terrestrial sources contribution. The δ13C value of P in Tahe crude oils differs somewhat from that of Yakela crude oils (−32.8‰), indicating that the phenanthrene (P) contribution comes from the marine sources (Table 2, Figure 5).
In Figure 5, the δ13C values of 9-MP and 1-MP in the Tahe oilfield range from −33.5‰ to −27.2‰ and −34.3‰ to −27.0‰, respectively. For Yakela oils, the δ13C values of 9-MP and 1-MP range from −31.6‰ to −29.0‰ and −31.8‰ to −31.4‰. The values point to a marine origin for 9-MP and 1-MP contributions in those two fields. As for the oils from Daolaoba gas/oilfield, the isotopic compositions of 9-MP and 1-MP are in the range of −27.0‰ to −23.2‰ and −29.0‰ to −26.3‰, respectively. The δ13C values are less negative due to the varying contribution of the marine and terrestrial inputs with a predominant marine organic matter input (Figure 5).

4.1.4. Individual Aromatic Isomers Isotope Compositions

As an environmental biomarker, gammacerane has been widely used to identify the organic matter depositional environment as well as the source input contribution [30,51]. Thus, a high gammacerane index (Ga/C30H) ranging between 0.23 and 0.58 suggests suboxic to anoxic conditions with predominance of algal aquatic organisms’ input while a gammacerane index between 0.07 and 0.28 suggests anoxic to suboxic conditions [7]. Table 1 shows that the 20 oils from Tarim Basin have a gammacerane index ranging between 0.3 and 0.9 suggesting a marine depositional environment with a predominance of algal aquatic organisms’ input. Indeed, the plots of isotope values of individual aromatic compounds with a P/DBT ratio revealed that marine-derived oils from rich carbonate source rock had low P/DBT ratios (<10) whereas oils from terrigeneous siliciclastic source rock had a high P/DBT (>10) [17]. Our results attest that phenanthrene/dibenzothiophene (P/DBT) ratios of the selected oils are lower than 10, suggesting that the oils are mainly dominated by organic matter, therefore, would be from marine carbonate source rock (Table 1).
Thus, the P/DBT and Ga/C30H ratios of Daolaoba, Yakela, and Tahe oils and δ13C values of individual aromatic isomers (1,2,6-TMN, 1,2,5-TMN, P, 9-MP, and 1-MP) are presented in Table 2. The plots reveal some unique and interesting results.
The plot of 1,2,6-TMN and P/DBT and Ga/C30H showed that the oils with dominant organic input from marine origin are identified by the lowest δ13C values (<−27.0‰) while the oils with dominant organic input from terrestrial origin are identified by the highest δ13C values (>−20.0‰). Oils derived from mixed marine and terrestrial source inputs have δ13C values between −27.0‰ and −20.0‰ (Table 1 and Table 2, Figure 6). The oils from Daolaoba are split into two halves by the δ13C values of 1,2,6-TMN. The first group of oils is distinguished by the lowest δ13C values of 1,2,6-TMN (<−27‰), corresponding to the group dominated by marine source input, while the second group is distinguished by the highest δ13C values of 1,2,6-TMN (>−20‰) that corresponds to the group dominated by terrestrial input. This result shows that while deposited in a marine environment the contribution in 1,2,6-TMN of oils from the Daolaoba gas/oilfield was derived from both marine and terrestrial sources but was dispersed unevenly among the oil samples. Yakela and Tahe oils constitute the major group characterized by the δ13C values of 1,2,6-TMN ranging between −27.0‰ and −23.0‰ attesting that, deposited in a marine environment, the contribution of 1,2,6-TMN from these oilfields was derived from a mixture of marine and terrestrial materials with different degrees of terrestrial input (Table 1 and Table 2, Figure 6).
The plot of the δ13C values of 1,2,5-TMN with P/DBT and Ga/C30H ratios suggest two separated groups. Oils derived from a dominant marine source input have the lowest δ13C values of 1,2,5-TMN (< −27‰) whereas the oils from mixed marine and terrestrial sources have the δ13C values of 1,2,5-TMN between −27‰ and −20‰ (Table 2, Figure 6). The oils from Daolaoba fall within the first category with the δ13C values of 1,2,5-TMN ranging from −31.5‰ to −28‰ revealing that the contribution in 1,2,5-TMN for oils from the Daolaoba field are derived predominantly from a marine source input. As for Tahe oils, a small number of samples have δ13C values of 1,2,5-TMN lower than −27.0‰ (−27.0‰ to −29.7‰), while the major part of the samples, together with Yakela oils, is characterized by a δ13C value of 1,2,5-TMN ranging from −25.3‰ to −20.7‰. This observation attests that the 1,2,5-TMN contribution for oils from Tahe and Yakela fields was from mixed marine and terrestrial organic matter (Table 2, Figure 6).
Amongst aromatic alkylated isomers, the methylphenanthrenes are identified to be the most useful source input indicators [17]. The δ13C values of P and the δ13C values of 1-MP plotted against P/DBT and Ga/C30H ratios enable the discrimination of the source variations in Tarim Basin oils. As already noticed, oils from a marine source input (mainly Tahe and Yakela oils) group together with the δ13C values of P and 1-MP lower than <−28.0‰, and those from a mixed marine and terrestrial source input (dominantly Daolaoba oils) group together with the δ13C values of P and 1-MP varying between −28‰ and −20‰ (Table 2 and Figure 7). However, compared to the other plots where a part of the oil samples shows a greater marine contribution when others show a mixed marine and terrestrial contribution (Table 2 and Figure 7), oils from the Tahe oilfield are predominantly marine sourced for the contribution in P and 1-MP. Likewise, the oils from the Daolaoba gas/oilfield are all from a mixture of marine and terrestrial contributions for P and 1-MP (Table 2 and Figure 7). Plots of δ13C values of 9-MP against P/DBT and Ga/C30H ratios can discriminate the organic matter source input in the selected Tarim oils. Almost all the oil samples from Tahe oilfield, Yakela and Daolaoba gas/oilfields are classified as marine with δ13C values of 9-MP lower than (<−27.0‰) (Table 2 and Figure 7). In the only oil sample from the Daolaoba gas/oilfield classified as from a mixed marine and terrestrial organic material input for the contribution in 9-MP, the increase in the terrestrial input to the marine source rock is indicated by the δ13C value of 9-MP ranging between −27.0‰ and −20‰ (Table 2 and Figure 7).
A comparison of the different plots of the δ13C values of 1,2,6-TMN, 1,2,5-TMN, P, 1-MP, and 9-MP with P/DBT and Ga/C30H ratios reveals that oils from Tahe and Yakela fields show the same tendency based on the δ13C value of individual aromatic compounds (marine originated with minor terrestrial input). On the other hand, Daolaoba oils give some marine signatures based on the δ13C value of individual compounds attesting a mixed marine and terrestrial input with different degrees of terrestrial organic matter input.
The isotope compositions of selected aromatic hydrocarbons provide better interpretation of the organic matter variations in the oils from Tahe oil-, Yakela gas/oil-, and Daolaoba gas/oilfields from Tarim Basin.

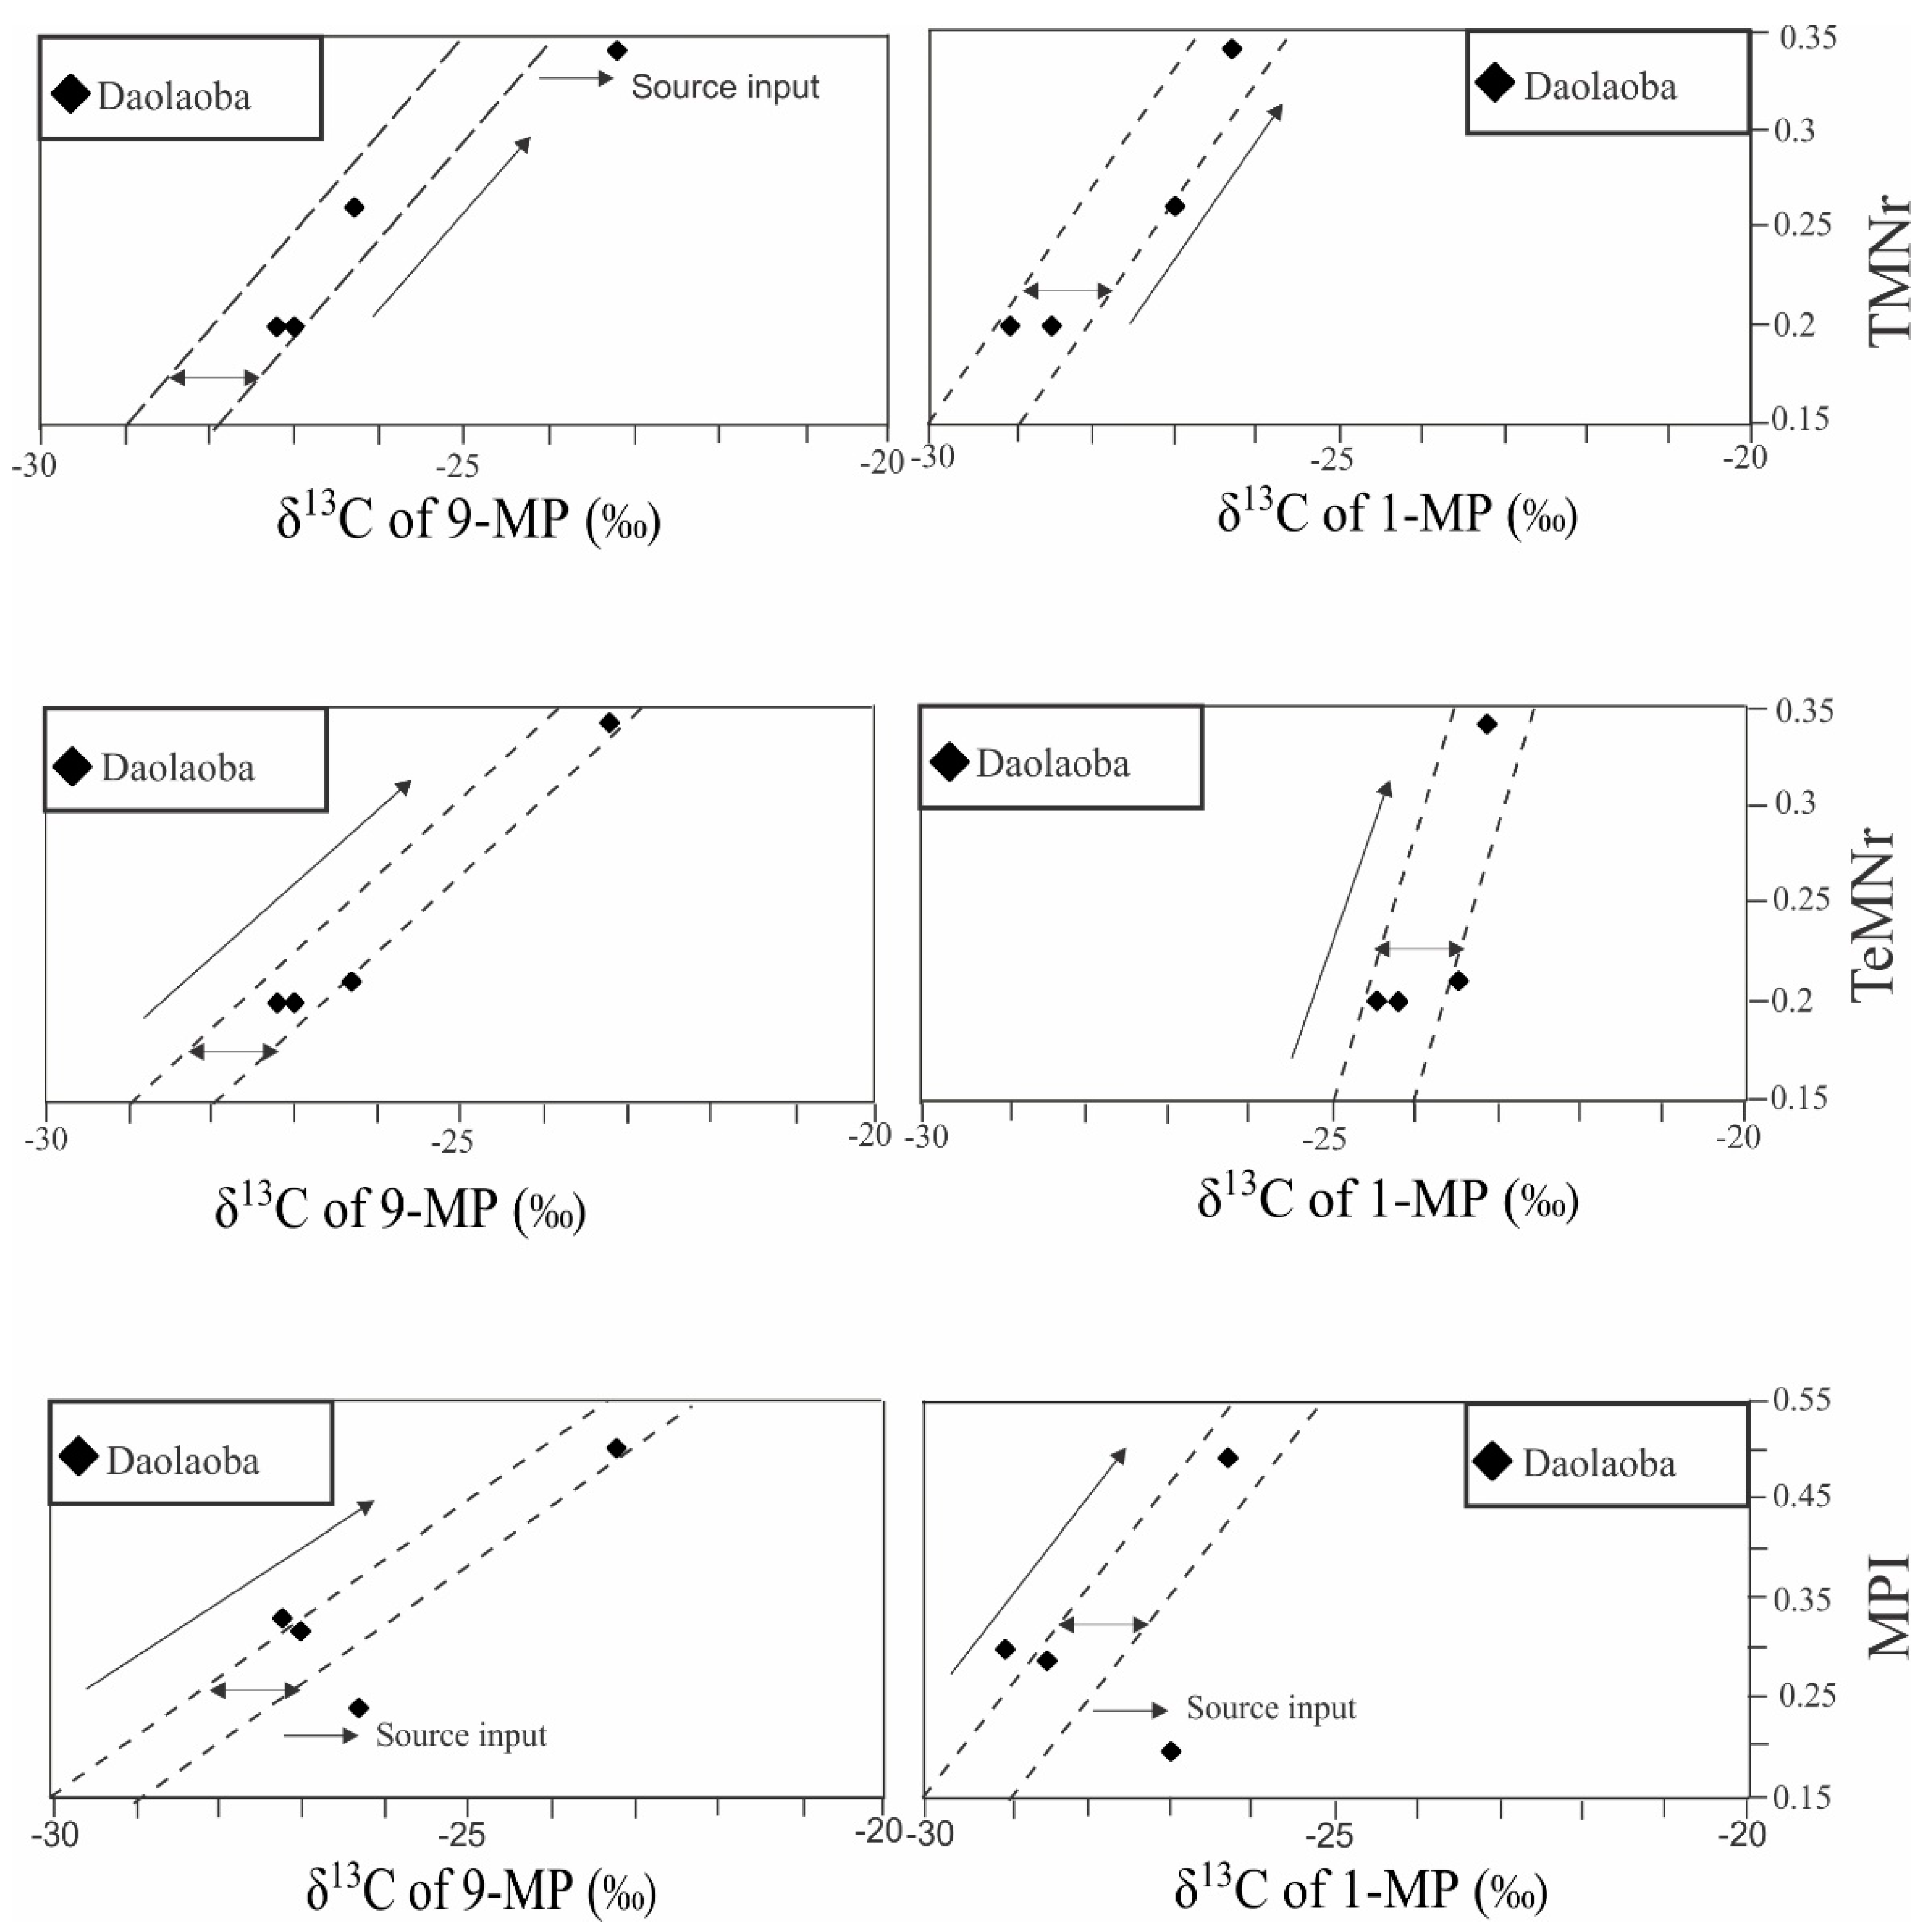
4.1.5. Geochemical Significance of δ13C Values of Individual Aromatic Isomers

Figure 6 and Figure 7 show that while several studies revealed that Tarim Basin is deposited in a marine environment, the basin organic matter fulfilment was also from terrestrial contribution. The results provided suggest a major input from marine organic matter with different degrees of contribution from terrestrial origin for the 20 selected oils, revealing an unequal distribution of the organic matter input in Daolaoba gas/oil-, Yakela gas/oil-, and Tahe oilfields.
Indeed, the relationship between δ13C values of selected aromatic isomers and depositional environment/source input parameters revealed that the contribution of the organic matter in Tahe oilfield and Yakela gas/oilfield is majorly from a marine source with a minor contribution from terrestrial input. However, whereas deposited in a marine environment, the principal organic matter source in oils from the Daolaoba gas/oilfield is from a terrestrial source with a significant marine input. The oil and source characterization from the plot of δ13C values of 9-MP and Ga/C30H characterized the Upper Ordovician source rocks in the Tarim Basin with negative δ13C values of 9-MP (<−28.0‰) and the source rocks from the Cambrian–Lower Ordovician with positive δ13C values (>−28.0‰) [25]. In this present study, our results attest that Tahe and Yakela oils would be from the Upper Ordovician rocks with average δ13C values of 9-MP of −30.4‰ and −30.3‰, respectively. For oils from the Daolaoba gas/oilfield, characterized by an average δ13C value of 9-MP of −25.9‰ they would be from Cambrian–Lower Ordovician rocks. Thus, the evidence of mixing from marine and terrestrial origin for such old oils could have two main explanations. One explanation could be an in-reservoir mixing of oils. Indeed, the Daolaoba gas/oilfield and Yakela gas/oilfield are located in the Yakela Faulted Uplift, however, any original source rocks have been identified in the Yakela Faulted Uplift [33].
The bidirectional charge of oils is generally accepted to be due to the marine and terrestrial mixed origin of the organic matter from the south (cratonic region) and the north (Kuqa Depression) [52,53,54]. However, this reason cannot explain the presence of terrestrial organic matter in some extent in oils from the Tahe oilfield, which is proved to be related to the marine source rock in the cratonic area [27,46]. On another hand, the more reasonable explanation could be a mixing of indigenous organic matter. In fact, Li et al. [33] attested that Daolaoba and Kuqa oils were derived from terrestrial organic matter from an oxic environment while Yakela oils were typical marine originated from an anoxic environment sharing similar molecular and isotope compositions with Tahe oils [27]. Most of the oil accumulations of terrestrial origin from the Tarim Basin have been discovered in the north of the basin (Kuqa Foreland Depression) [51] whereas the accumulations of crude oils discovered in the south part (cratonic region) are mainly marine originated [34,35,37]. Located in the north of the Tarim Basin, Yakela Faulted Uplift is the transitional zone between the marine environment (cratonic oil province) from the non-marine environment (Kuqa Foreland Depression oil province) [27,33]. In fact, the location of both fields, Daolaoba and Yakela gas/oilfields in Figure 1, suggests that those oilfields could have been a unique and similar gas/oilfield before the apparition of the Yakela Fault. Thus, this assumption would suggest that oilfields in Tarim Basin were supplied by organic matter from both depositional environments (terrestrial environment in the north and marine environment in the south of Yakela Faulted Uplift). The apparition of the Yakela Fault Uplift would have divided this unique gas/oilfield into Daolaoba and Yakela gas/oilfields, limiting at the same time the supply in organic matter from the terrestrial environment from the north of the fault for the Yakela gas/oilfield. Thus, sharing in this case the same marine origins Tahe oils of which the major part organic input only was provided by the marine environment, the oils from the Yakela gas/oilfield therefore would have been filled mainly by marine organic matter.
Contrary to the Yakela gas/oilfield, the Yakela Faulted Uplift has limited the supply in organic matter from the marine environment from the south for the Daolaoba gas/oilfield that in this case would have been supplied only in organic matter from the terrestrial environment that relates the Daolaoba gas/oilfield to the terrestrial environment rather than the marine environment (Figure 2).

4.2. Assessment of Biodegradation

4.2.1. Normal Alkanes and Isoprenoids Repartition

Figure 8 illustrates the chromatograms of the distribution of n-alkanes, pristane, and phytane from selected oil samples from the Tarim Basin. The repartitions of the hydrocarbons were investigated using the normal alkane and isoprenoid compounds (Figure 8). The analyses of all the chromatograms revealed that tested oils show a full range of alkane components from C12 to C35 n-alkanes (Figure 8). The repartition of the hydrocarbon compounds in the analyzed oils showed a typical non-biodegraded profile with dominant normal alkanes with short and medium chains (C12–C22) compared to normal alkanes with long chains (C23–C35) with the highest peaks of normal alkane represented by C12 and C13 characterizing unimodal n-alkane repartitions. Almost all the normal alkane series of the oils are not affected by biodegradation (Figure 8a–c). However, one oil sample from the Tahe oilfield (AD 11, 6302.78–6410 m) shows an important increment in the concentration of the unresolved complex mixture (UCM), the normal alkanes are significantly low in concentration compared to other samples from this field and there is a low abundance of isoprenoids (Figure 8c1). These characteristics reveal a low biodegradation effect on this oil sample from the Tahe oilfield [3,10].
It has been shown that Pr/n-C17 and Ph/n-C18 ratios were reliable indicators of biodegradation [3,10]. Indeed, the normal alkanes present a different spectrum of origin and are mostly in relative high concentrations compared to isoprenoids in mature non-biodegraded oils [10]. Wan and co-authors attribute to a moderate biodegradation level oils with Pr/n-C17 and Ph/n-C18 higher than 0.7 [3]. In this study, the set of oils is in the range of 0.1–0.6 for Pr/n-C17 and 0.1–0.7 for Ph/n-C18, confirming the very limited effect of the biodegradation (Figure 3). More importantly, Pr/n-C17 and Ph/n-C18 ratios of individual oil samples could seem to characterize the source origin instead of the biodegradation level. In fact, oils from the Daolaoba gas/oilfield have low Pr/n-C17 and Ph/n-C18 ratios (<0.3 and <0.2) while oils from Yakela and Tahe fields have their Pr/n-C17 and Ph/n-C18 ratios higher than 0.3 and 0.2, respectively (Figure 3). In addition, none of the samples from the Tahe oilfield (including the AD 11 oil sample) have ratios out of this range revealing the insignificant effect of biodegradation.

4.2.2. Alkylnaphthalenes’ Parameters

The evaluation of the biodegradation effect on PAHs is generally difficult for analyzing and determining a reasonable and logical interpretation compared the assessment based on saturated components. Certain aromatic isomers are more susceptible than others [48,55]. Demethylation of an alkyl isomer compound was revealed to be a fundamental step in the biodegradation procedure of aromatic hydrocarbon compounds whereas the rule of the level of the alkylation effect could continue working at PM (Peter and Moldovan) level 8 before total removal of the component. Therefore, a not constant behavior of the biodegradation could be expected under different basin regimes and conditions [49]. Consequently, aromatic ratios proposed by previous studies [10,56] would be useful in our case. Indeed, Fisher et al. [56] studied the effect of biodegradation on different alkylnaphthalenes and concluded by proposing different biodegradation ratios of DBR, TBR, and TeBR using, respectively, dimethyl-, trimethyl-, and tetramethylnaphthalene isomers. These ratios (DBR:1,6/1,5-DMN, TBR:1,3,6/1,2,4-TMN, and TeBR:1,3,6,7/1,3,5,6-TeMN) can be used for assessing a biodegradation level of up to about level 6. Likewise, Asif et al. [10] proposed three different biodegradation ratios based on alkylnaphthalenes (DNBR:1,6/1,2-DMN, TNBR:1,3,7/1,2,7-TMN, and TeNBR: 1,3,6,7/1,3,5,7-TeMN) for evaluating the low degree of the biodegradation effect, up to about a level of 3. In the present research, the result discussed above suggests almost no biodegradation effect. In Figure 9, the plot of DNBR, TNBR, and TeNBR biodegradation ratios correlate poorly with Pr/n-C17 (R2 for DNBR: 0.48; TNBR: 0.11; and TeNBR: 0.39) revealing no effect of the biodegradation on the set of oils.
Van Aarssen et al. [9] proposed a ternary plot to assess the effect of the in-reservoir mixing, biodegradation, and mixing of indigenous organic material. The in-reservoir mixing is the mixture of oils of different levels of maturity. The result of this is that the relations between the three parameters in the mixing are deformed [9]. Van Aarssen et al. [9] attested that when TeMNs and PMNs are not impacted by the biodegradation at early phases, an oil that is moderately affected by biodegradation plots the ternary plot center, in towards the TMNr ratio corner. However, the oils plotting close to or in the maturity center probably indicate different degrees of mixing [9]. Figure 10 shows the plot of the set of 20 oil samples used for this study in the ternary diagram and it reveals that the relationships between these three parameters are not distorted. In addition, any of the oil samples plot toward TMNr corner, attesting the insignificant effect of the biodegradation. However, all the 20 crude oils fall near or in the maturity center of the ternary plot. This result correlates well with the conclusion of van Aarssen and co-authors attesting that the 20 oils are not affected by the biodegradation but rather are derived from different degrees of mixing of organic matters, that could be probably derived from the terrestrial Kuqa environment and the marine cratonic environment.

4.3. Thermal Maturity Effect on Isotope Compositions of Individual Isomers

Individual n-alkane isotope compositions showed to raise with the increase in the source rock maturity level and at the oil cracking stage and many maturity parameters present good relationships with weighted mean δ13C values of Tarim Basin oils’ n-alkanes. This observation indicates that the maturity level does affect the isotope compositions of individual n-alkanes and oils [24]. The isotope compositions of alkylated aromatic compounds are revealed to increase with increasing maturity level. Therefore, the more alkylated the compounds are, the more the δ13C values increase [19]. Two main maturity levels are evident. The first level is represented by Daolaoba oils with a low maturity level characterized by MPI-1 < 0.5, TMNr < 0.35, and TeMNr < 0.35. The second is represented by Tahe and Yakela oils with an MPI-1 > 0.5, TMNr > 0.35, and TeMNr > 0.35 (Table 1). Indeed, Dalaoba oils’ PhNR and MPI-1 values are very low and their Trp1 and Trp2 values are generally 1.0 and 4.0, respectively, indicating their low maturation levels. In contrast, Yakela oils more mature have relatively higher MPI-1 and TrP2 values [33]. Jia et al. [24] concluded that both source input and maturity level affect the isotopic composition change in the Tabei uplift and the Tazhong uplift. In addition, isotope compositions of alkylnaphthalenes and alkylphenanthrenes have been shown to have a positive trend with increasing maturity, which means that as the maturity level enhances the isotope values of the alkyl isomer show an increasing trend [19].
The plots of the maturity parameters with the δ13C values for individual polycyclic aromatic isomers are presented in Figure 11. The maturity indicators show with the δ13C values of individual aromatic isomers in Daolaoba, Yakela, and Tahe oils that the isotope compositions of individual aromatic isomers are controlled by two combined factors in these three Tarim Basin fields. In the plot of the isotope compositions of individual isomers of 1,2,6-TMN, 1,2,5-TMN, 9-MP, and 1-MP with TMNr, TeMNr, and MPI-1 the maturity parameters are realized. The plots of 9-MP and 1-MP that summarize the general observations are presented in this study. The results revealed that Yakela and Tahe oils of moderate-to-high maturity level group together. Whereas oils from Daolaoba field affected by a low maturity level group together. This observation suggests that source input as well as thermal maturity control the isotope compositions of individual aromatic isomers of Daolaoba, Yakela, and Tahe oils (Figure 11).
Indeed, Peters et al. [57] attested that this small difference (less than or approximately 1‰) suggests that the oils are genetically related. In our case, Figure 12 and Figure 13 show a positive correlation between the isotope compositions of individual isomers in oil samples in this range of 1‰. The δ13C values increase with the increasing in the thermal maturity [24]. This reveals that not only are the samples in this range genetically related but are also controlled by both factors simultaneously (Figure 12 and Figure 13). However, the plot of oil samples out of this range suggests that these samples are either mainly controlled by the source input or by the thermal maturity level. Figure 12 and Figure 13 show that the thermal maturity effect on oils plotted out of the 1‰ range is less evident contrary to the source input. Oils affected by the marine source input have lower δ13C values than oils plotted in the range whereas oils affected by terrestrial source input have higher δ13C values than oils in plotted in the range (Figure 12 and Figure 13). Thus, the source input is revealed as the primary factor controlling the isotope compositions of individual aromatic isomer in oils from Daolaoba, Yakela, and Tahe fields combined with the thermal maturity level. Therefore, the thermal maturity effect is not predominant for isotope compositions of individual aromatic compounds from Daolaoba gas/oil, Yakela gas/oil, and Tahe oilfields.
In their study, Clayton and co-authors showed that δ13C values of individual compound increase with enhanced maturity during the cracking [58]. As presented in this research, the low thermal maturity level from Daolaoba oils and moderate to high maturity level from Yakela and Tahe oils revealed that the increasing tendency in Tarim Basin is from the northern part to the southern part of the basin (Figure 11). Thus, for the positive correlation of the thermal level with the increase in the individual selected PAH compound (Figure 12 and Figure 13), Jia and co-workers revealed that the enrichment in 13C with the maturity level would be due the kinetic isotopic fractionations with a raising of the thermal maturity level of oil sources [24]. Chen et al. [19] attested that this enrichment of 13C could be the effect of a low energy of activation of the bonds C-C with a half of 12C methyl, contrary to those with a 13C methyl moiety. Therefore, methyl groups with light isotope compositions were carried away at a fast rate and were implicated in the relocation of the methyl move more easily than methyl groups with heavy isotope compositions, conducing to the isotopic enrichment of residual products [19].

5. Conclusions

The present research showed that the δ13C values of 1,2,6-TMN, 1,2,5-TMN, P, 9-MP, and 1-MP plotted against P/DBT and Ga/C30H ratios is a good tool for oil classification. It allowed to distinguish the source of the organic matter input from the Tahe oilfield, Yakela gas/oilfield, and Daolaoba gas/oilfield. Thus, the selected oils are from a mixing of indigenous organic matter from the terrestrial (in Kuqa area) and marine (in the cratonic area) depositional environments prior the apparition of the Yakela Faulted Uplift. The findings revealed that all oils from the Tarim Basin are deposited in a marine depositional environment with a low P/DBT (<10) and a high Ga/C30H (>0.30) ratio. The isotope compositions of individual compound attest that Tahe and Yakela oils related to the algal kerogen (Pr/n-C17 > 0.30 and Ph/n-C18 > 0.30) from marine origin organic matter (Pr/Ph < 1.2) deposited in an anoxic environment are dominantly marine sourced with minor terrestrial input. In contrast, Daolaoba oils related to the humic kerogen (Pr/n-C17 < 0.30 and Ph/n-C18 < 0.30) from non-marine organic matter (Pr/Ph = 1.8–2) are from a mixed marine and terrestrial organic source input. The study attests that the δ13C values of individual aromatic isomers are controlled by both source input (from the terrestrial Kuqa area and the marine cratonic area) and thermal maturity. However, although the control of the thermal maturity is not predominant, it shows a positive correlation with the isotope values of individual aromatic compounds from Daolaoba, Yakela, and Tahe oil samples.

Author Contributions

Conceptualization, N.F.D.S.K. and M.L.; data curation, N.F.D.S.K.; formal analysis, N.F.D.S.K., S.S., A.K., A.T., N.P.O.B. and T.L.; funding acquisition, M.L.; investigation, N.F.D.S.K.; methodology, N.F.D.S.K.; project administration, M.L.; resources, M.L.; software, S.S. and T.L.; supervision, M.L.; validation, N.F.D.S.K., M.L., S.S., A.K., A.T., N.P.O.B. and T.L.; writing—original draft, N.F.D.S.K.; writing—review and editing, M.L., S.S., A.K., A.T., N.P.O.B. and T.L. All authors have read and agreed to the published version of the manuscript.

Funding

This work was funded by the National Natural Science Foundation of China (Grant No. 42173054), the National Key R&D Program of China (Grant No. 2017YFC0603102), and the Foundation of the State Key Laboratory of Petroleum Resources and Prospecting, China University of Petroleum, Beijing (No. PRP/open-1906).

Data Availability Statement

Not applicable.

Acknowledgments

The authors especially want to thank Lei Zhu for simplifying the access to the materials of the laboratory for better progress of the different research steps.

Conflicts of Interest

The authors declare no conflict of interest.

References

  1. Tuo, J.; Wang, X.; Chen, J.; Simoneit, B. Aliphatic and diterpenoid hydrocarbons and their individual carbon isotope compo-sitions in coals from the Liaohe Basin, China. Org. Geochem. 2003, 34, 1615–1625. [Google Scholar] [CrossRef]
  2. Harouna, M.; Philp, R. Potential petroleum source rocks in the Termit Basin, Niger. J. Pet. Geol. 2012, 35, 165–185. [Google Scholar] [CrossRef]
  3. Wan, L.; Liu, J.; Mao, F.; Lv, M.; Liu, B. The petroleum geochemistry of the Termit Basin, Eastern Niger. Mar. Pet. Geol. 2014, 51, 167–183. [Google Scholar] [CrossRef]
  4. Li, N.; Huang, H.; Jiang, W.; Wu, T.; Sun, J. Biodegradation of 25-norhopanes in a Liaohe Basin (NE China) oil reservoir. Org. Geochem. 2015, 78, 33–43. [Google Scholar] [CrossRef]
  5. Chen, Z.; Wang, T.-G.; Li, M.; Yang, F.; Cheng, B. Biomarker geochemistry of crude oils and Lower Paleozoic source rocks in the Tarim Basin, western China: An oil-source rock correlation study. Mar. Pet. Geol. 2018, 96, 94–112. [Google Scholar] [CrossRef]
  6. Xiao, H.; Li, M.; Wang, W.; You, B.; Liu, X.; Yang, Z.; Liu, J.; Chen, Q.; Uwiringiyimana, M. Identification, distribution and geochemical significance of four rearranged hopane series in crude oil. Org. Geochem. 2019, 138, 103929. [Google Scholar] [CrossRef]
  7. Xiao, H.; Wang, T.-G.; Li, M.; Lai, H.; Liu, J.; Mao, F.; Tang, Y. Geochemical characteristics of Cretaceous Yogou Formation source rocks and oil-source correlation within a sequence stratigraphic framework in the Termit Basin, Niger. J. Pet. Sci. Eng. 2019, 172, 360–372. [Google Scholar] [CrossRef]
  8. Lu, X.; Li, M.; Wang, X.; Wei, T.; Tang, Y.; Hong, H.; Wu, C.; Yang, X.; Liu, Y. Distribution and Geochemical Significance of Rearranged Hopanes in Jurassic Source Rocks and Related Oils in the Center of the Sichuan Basin, China. ACS Omega 2021, 6, 13588–13600. [Google Scholar] [CrossRef]
  9. Van Aarssen, B.G.; Bastow, T.P.; Alexander, R.; Kagi, R.I. Distributions of methylated naphthalenes in crude oils: Indicators of maturity, biodegradation and mixing. Org. Geochem. 1999, 30, 1213–1227. [Google Scholar] [CrossRef]
  10. Asif, M.; Grice, K.; Fazeelat, T. Assessment of petroleum biodegradation using stable hydrogen isotopes of individual saturated hydrocarbon and polycyclic aromatic hydrocarbon distributions in oils from the Upper Indus Basin, Pakistan. Org. Geochem. 2009, 40, 301–311. [Google Scholar] [CrossRef]
  11. Li, M.; Wang, T.; Zhong, N.; Zhang, W.; Sadik, A.; Li, H. Ternary Diagram of Fluorenes, Dibenzothiophenes and Dibenzofurans: Indicating Depositional Environment of Crude Oil Source Rocks. Energy Explor. Exploit. 2013, 31, 569–588. [Google Scholar] [CrossRef]
  12. Li, M.; Zhong, N.; Shi, S.; Zhu, L.; Tang, Y. The origin of trimethyldibenzothiophenes and their application as maturity indicators in sediments from the Liaohe Basin, East China. Fuel 2013, 103, 299–307. [Google Scholar] [CrossRef]
  13. Fang, R.; Li, M.; Wang, T.-G.; Zhang, L.; Shi, S. Identification and distribution of pyrene, methylpyrenes and their isomers in rock extracts and crude oils. Org. Geochem. 2015, 83-84, 65–76. [Google Scholar] [CrossRef]
  14. Fang, R.; Wang, T.-G.; Li, M.; Xiao, Z.; Zhang, B.; Huang, S.; Shi, S.; Wang, D.; Deng, W. Dibenzothiophenes and benzo [b] naphthothiophenes: Molecular markers for tracing oil filling pathways in the carbonate reservoir of the Tarim Basin, NW China. Org. Geochem. 2016, 91, 68–80. [Google Scholar] [CrossRef]
  15. Sofer, Z. Stable Carbon Isotope Compositions of Crude Oils: Application to Source Depositional Environments and Petroleum Alteration. AAPG Bull. 1984, 68, 31–49. [Google Scholar] [CrossRef]
  16. Xinjian, Z.; Jianfa, C.; Jianjun, W.; Yifan, W.; ZHANG, B.; ZHANG, K.; Liwen, H. Carbon isotopic compositions and origin of Paleozoic crude oil in the platform region of Tarim Basin, NW China. Pet. Explor. Dev. 2017, 44, 1053–1060. [Google Scholar]
  17. Maslen, E.; Grice, K.; Le Métayer, P.; Dawson, D.; Edwards, D. Stable carbon isotopic compositions of individual aromatic hydrocarbons as source and age indicators in oils from western Australian basins. Org. Geochem. 2011, 42, 387–398. [Google Scholar] [CrossRef]
  18. Le Métayer, P.; Grice, K.; Chow, C.; Caccetta, L.; Maslen, E.; Dawson, D.; Fusetti, L. The effect of origin and genetic processes of low molecular weight aromatic hydrocarbons in petroleum on their stable carbon isotopic compositions. Org. Geochem. 2014, 72, 23–33. [Google Scholar] [CrossRef]
  19. Chen, Y.; Tian, C.; Li, K.; Cui, X.; Wu, Y.; Xia, Y. Influence of thermal maturity on carbon isotopic composition of individual aromatic hydrocarbons during anhydrous closed-system pyrolysis. Fuel 2016, 186, 466–475. [Google Scholar] [CrossRef]
  20. Huang, D.; Liu, B.; Wang, T.; Xu, Y.; Chen, S.; Zhao, M. Genetic type and maturity of Lower Paleozoic marine hydrocarbon gases in the eastern Tarim Basin. Chem. Geol. 1999, 162, 65–77. [Google Scholar] [CrossRef]
  21. Jin, Z.; Zhu, D.; Hu, W.; Zhang, X.; Zhang, J.; Song, Y. Mesogenetic dissolution of the middle Ordovician limestone in the Tahe oilfield of Tarim basin, NW China. Mar. Pet. Geol. 2009, 26, 753–763. [Google Scholar] [CrossRef]
  22. Li, Y.; Liu, Y.; Jiang, D.; Xu, J.; Zhao, X.; Hou, Y. Effects of weathering process on the stable carbon isotope compositions of polycyclic aromatic hydrocarbons of fuel oils and crude oils. Mar. Pollut. Bull. 2018, 133, 852–860. [Google Scholar] [CrossRef] [PubMed]
  23. Li, M.; Wang, T.-G.; Lillis, P.G.; Wang, C.; Shi, S. The significance of 24-norcholestanes, triaromatic steroids and dinosteroids in oils and Cambrian—Ordovician source rocks from the cratonic region of the Tarim Basin, NW China. Appl. Geochem. 2012, 27, 1643–1654. [Google Scholar] [CrossRef]
  24. Jia, W.; Wang, Q.; Peng, P.; Xiao, Z.; Li, B. Isotopic compositions and biomarkers in crude oils from the Tarim Basin: Oil maturity and oil mixing. Org. Geochem. 2013, 57, 95–106. [Google Scholar] [CrossRef]
  25. Zhang, M.; Zhao, H.; Hong, Y.; Chen, Z.; Lin, J. The distribution characteristic and its significance of compound specific isotopic composition of aromatic hydrocarbon from marine source rock and oil in the Tarim Basin, western China. Sci. China Earth Sci. 2014, 57, 2791–2798. [Google Scholar] [CrossRef]
  26. Cui, J.; Wang, T.; Li, M. Geochemical characteristics and oil family classification of crude oils from the Markit Slope in the southwest of the Tarim Basin, Northwest China. Chin. J. Geochem. 2011, 30, 359–365. [Google Scholar] [CrossRef]
  27. Song, D.; Wang, T.-G.; Li, H. Geochemical characteristics and origin of the crude oils and condensates from Yakela Fault-ed-Uplift, Tarim Basin. J. Pet. Sci. Eng. 2015, 133, 602–611. [Google Scholar] [CrossRef]
  28. Edwards, D.; Zumberge, J. The Oils of Western Australia II. Regional Petroleum Geochemistry and Correlation of Crude Oils and Condensates from Western Australia and Papua New Guinea. Interpretation Report. Australian Geological Survey Organization; 515p, unpublished.
  29. Wanglu, J.; Ping’An, P.; Chiling, Y.; Zhongyao, X. Source of 1,2,3,4-tetramethylbenzene in asphaltenes from the Tarim Basin. J. Southeast Asian Earth Sci. 2007, 30, 591–598. [Google Scholar] [CrossRef]
  30. Jia, W.; Xiao, Z.; Yu, C.; Peng, P. Molecular and isotopic compositions of bitumens in Silurian tar sands from the Tarim Basin, NW China: Characterizing biodegradation and hydrocarbon charging in an old composite basin. Mar. Pet. Geol. 2010, 27, 13–25. [Google Scholar] [CrossRef]
  31. Cai, C.; Zhang, C.; Worden, R.H.; Wang, T.; Li, H.; Jiang, L.; Huang, S.; Zhang, B. Application of sulfur and carbon isotopes to oil–source rock correlation: A case study from the Tazhong area, Tarim Basin, China. Org. Geochem. 2015, 83, 140–152. [Google Scholar] [CrossRef]
  32. Huang, S.; Fang, C.; Peng, W.; Jiang, Q.; Feng, Z. Stable carbon isotopic composition of light hydrocarbons and n-alkanes of condensates in the Tarim Basin, NW China. J. Nat. Gas Geosci. 2017, 2, 165–177. [Google Scholar] [CrossRef]
  33. Li, M.; Wang, T.-G.; Li, H.; Fang, R.; Yang, L.; Shi, S.; Kuang, J. Occurrence and Geochemical Significance of Phenylnaphthalenes and Terphenyls in Oils and Condensates from the Yakela Faulted Uplift, Tarim Basin, Northwest China. Energy Fuels 2016, 30, 4457–4466. [Google Scholar] [CrossRef]
  34. Kim, M.K. Stable Carbon Isotope Ratio of Polycyclic Aromatic Hydrocarbons (PAHs) in the Environment: Validation of Isolation and Stable Carbon Isotope Analysis Methods. Ph.D. Thesis, Texas A&M University, College Station, TX, USA, 2004. [Google Scholar]
  35. Liang, D.; Zhang, S.; Chen, J.; Wang, F.; Wang, P. Organic geochemistry of oil and gas in the Kuqa depression, Tarim Basin, NW China. Org. Geochem. 2003, 34, 873–888. [Google Scholar] [CrossRef]
  36. Liu, H.; Liao, Z.; Zhang, H.; Tian, Y.; Cheng, B.; Yang, S. Stable isotope (δ13Cker, δ13Ccarb, δ18Ocarb) distribution along outcrop section in the eastern Tarim Basin, NW China and its geochemical significance. Geosci. Front. 2016, 30, 1–8. [Google Scholar] [CrossRef]
  37. Kang, Y.; Kang, Z. Tectonic evolution and oil and gas of Tarim Basin. J. Southeast Asian Earth Sci. 1996, 3, 317–325. [Google Scholar]
  38. Jia, C.; Wei, G. Structural characteristics and petroliferous features of Tarim Basin. Chin. Sci. Bull. 2002, 47, 1–11. [Google Scholar] [CrossRef]
  39. Hu, S.; Wilkes, H.; Horsfield, B.; Chen, H.; Li, S. On the origin, mixing and alteration of crude oils in the Tarim Basin. Org. Geochem. 2016, 97, 17–34. [Google Scholar] [CrossRef]
  40. Li, M.; Lin, R.; Liao, Y.; Snowdon, L.R.; Wang, P.; Li, P. Organic geochemistry of oils and condensates in the Kekeya Field, Southwest Depression of the Tarim Basin (China). Org. Geochem. 1999, 30, 15–37. [Google Scholar] [CrossRef]
  41. Zhao, W.; Zhang, S.; Wang, F.; Chen, J.; Xiao, Z.; Song, F. Gas accumulation from oil cracking in the eastern Tarim Basin: A case study of the YN2 gas field. Org. Geochem. 2005, 36, 1602–1616. [Google Scholar] [CrossRef]
  42. Konan, N.; Li, M.; Shi, S.; Liu, X.; Tang, Y.; Kojo, A.; Toyin, A. Simple column chromatography separation procedure for polycyclic aromatic hydrocarbons: Controlling factor (s). Arab. J. Geosci. 2022, 15, 1350. [Google Scholar] [CrossRef]
  43. Jiang, A.; Zhou, P.; Sun, Y.; Xie, L. Rapid column chromatography separation of alkylnaphthalenes from aromatic components in sedimentary organic matter for compound specific stable isotope analysis. Org. Geochem. 2013, 60, 1–8. [Google Scholar] [CrossRef]
  44. Huang, S.-Y.; Li, M.-J.; Zhang, K.; Wang, T.-G.; Xiao, Z.-Y.; Fang, R.-H.; Zhang, B.-S.; Wang, D.-W.; Zhao, Q.; Yang, F.-L. Distribution and geochemical significance of phenylphenanthrenes and their isomers in selected oils and rock extracts from the Tarim Basin, NW China. Pet. Sci. 2016, 13, 183–191. [Google Scholar] [CrossRef] [Green Version]
  45. Hakimi, M.H.; Al-Matary, A.M.; Ahmed, A.F. Bulk geochemical characteristics and carbon isotope composition of oils from the Sayhut sub-basin in the Gulf of Aden with emphasis on organic matter input, age and maturity. Egypt. J. Pet. 2018, 27, 361–370. [Google Scholar] [CrossRef]
  46. Zhang, S.; Huang, H. Geochemistry of Palaeozoic marine petroleum from the Tarim Basin, NW China: Part 1. Oil family classification. Org. Geochem. 2005, 36, 1204–1214. [Google Scholar] [CrossRef]
  47. Trolio, R.; Grice, K.; Fisher, S.J.; Alexander, R.; Kagi, R.I. Alkylbiphenyls and alkyldiphenylmethanes as indicators of petroleum biodegradation. Org. Geochem. 1999, 30, 1241–1253. [Google Scholar] [CrossRef]
  48. Huang, H.; Bowler, B.F.; Oldenburg, T.B.; Larter, S.R. The effect of biodegradation on polycyclic aromatic hydrocarbons in reservoired oils from the Liaohe basin, NE China. Org. Geochem. 2004, 35, 1619–1634. [Google Scholar] [CrossRef]
  49. Huang, H.; Li, Z.; Wen, Z.; Han, D.; Pan, R. Biodegradation influence on alkylphenanthrenes in oils from Bongor Basin, SW Chad. Sci. Rep. 2019, 9, 12960. [Google Scholar] [CrossRef] [PubMed]
  50. Asif, M.; Nazir, A.; Fazeelat, T.; Grice, K.; Nasir, S.; Saleem, A. Applications of Polycyclic Aromatic Hydrocarbons to Assess the Source and Thermal Maturity of the Crude Oils from the Lower Indus Basin, Pakistan. Pet. Sci. Technol. 2011, 29, 2234–2246. [Google Scholar] [CrossRef]
  51. He, T.; Lu, S.; Li, W.; Wang, W.; Sun, D.; Pan, W.; Zhang, B. Geochemical characteristics and effectiveness of thick, black shales in southwestern depression, Tarim Basin. J. Pet. Sci. Eng. 2020, 185, 106607. [Google Scholar] [CrossRef]
  52. Geng, Y.; Li, J.; He, D. Trap types, distribution and the law of spatial combination in the west Tabei uplift, Tarim Basin. Acta Sci. Nat. Univ. Pekin. 2008, 44, 193. [Google Scholar]
  53. Xiuxiang, L.; Jianjiao, L.; Fengyun, Z.; Ning, Y.; Qiucha, Z. North-south Differentiation of the Hydrocarbon Accumulation Pattern of Carbonate Reservoirs in the Yingmaili Low Uplift, Tarim Basin, Northwest China. Acta Geol. Sin. 2008, 82, 499–508. [Google Scholar] [CrossRef]
  54. Luo, X.; Tang, L.; Xie, D.; Qiu, H.; Jiang, H.; Yang, Y.; Chen, X.; Zhang, Y. Structural styles and hydrocarbon accumulation in Yakela fault-convex, Tarim Basin. Petrol. Geol. Recov. Effic. 2012, 19, 38–41. [Google Scholar]
  55. Chengzao, J.; Qiming, L. Petroleum geology of Kela-2, the most productive gas field in China. Mar. Pet. Geol. 2008, 25, 335–343. [Google Scholar] [CrossRef]
  56. Fisher, S.; Alexander, R.; Kagi, R.; Oliver, G. Aromatic hydrocarbons as indicators of biodegradation in North Western Aus-tralian reservoirs. In The Sedimentary Basins of Western Australia; PESA Energy Geoscience: Perth, Australia, 1998. [Google Scholar]
  57. Peters, K.E.; Walters, C.C.; Moldowan, J. The Biomarker Guide; Cambridge University Press: Cambridge, UK, 2005. [Google Scholar]
  58. Clayton, C.J. Effect of maturity on carbon isotope ratios of oils and condensates. Org. Geochem. 1991, 17, 887–899. [Google Scholar] [CrossRef]
Figure 1. Tarim Basin limit and faults map.
Energies 15 07145 g001
Figure 2. Tarim Basin tectonic units and Yakela Faulted Uplift localization.
Energies 15 07145 g002
Figure 3. (a) Pristane/Phytane ratios vs. Phytane/n-C18–Pristane/n-C17 values plot of the oils from Tarim Basin (Modified after Song et al., 2015 [27]). (b) Pr/n-C17 versus Ph/n-C18 of 20 selected oils from the Tarim Basin.
Energies 15 07145 g003
Figure 4. Tendencies of individual aromatic δ13C values in oilfields from Tarim Basin (ANs: alkylnaphthalenes; AFs: alkylfluorenes; APs: alkylphenanthrenes; ADBTs: alkyldibenzothiophenes).
Energies 15 07145 g004
Figure 5. Repartition of δ13C of 1,2,6-TMN (trimethylnaphthalene), 1,2,5-TMN (trimethylnaphthalene), P (Phenanthrene), 9-MP (methylphenanthrene), and 1-MP (methylphenanthrene) in 20 selected oils of Tarim basin.
Energies 15 07145 g005
Figure 6. Plots of δ13C of 1,2,6-TMN and 1,2,5-TMN versus (a) P/DBT and (b) Ga/C30H ratios of 20 selected oils from Tarim Basin. Similar captions are used in Figure 6 and Figure 7.
Energies 15 07145 g006
Figure 7. Plots of δ13C of P (phenanthrene), 9-MP, and 1-MP (MP: methylphenanthrene) versus (a) P/DBT (P: phe-nanthrene; DBT: dibenzothiophene) and (b) Ga/C30H (Ga: gammacerane; C30H: Hopane) ratios of 20 selected oils from Tarim Basin. Similar captions are used in Figure 6 and Figure 7.
Energies 15 07145 g007
Figure 8. Chromatograms representing normal alkanes and acyclic isoprenoids repartition in Tarim Basin oils. (a) Chromatogram from Daolaoba oils, (b) Chromatogram from Yakela oils, (c) Chromatogram from majority of Tahe oils, (c1) Chromatogram from AD 11 oil sample from Tahe.
Energies 15 07145 g008
Figure 9. DNBR (DNBR:1,6/1,5), TNBR (TNBR:1,3,7/1,2,7), and TeNBR (TeNBR:1,3,6,7/1,3,5,7) biodegradation ratios vs. Pr/n-C17 of 20 oil samples from Tarim Basin.
Energies 15 07145 g009
Figure 10. TMNr, TeMNr, and PMNr ternary diagrams of 20 selected oils from the Tarim Basin.
Energies 15 07145 g010
Figure 11. Cross plots of weighted mean δ13C values of 9-MP and 1-MP from crude oils’ sub-fractions versus maturity indicator parameters TMNr (1,3,7/1,3,7 + 1,2,5)-TMN, TeMNr (1,3,6,7/1,3,6,7 + (1,2,5,6 + 1,2,3,5))-TeMN and MPI: 1.5 (2-MP + 3-MP)/(P + 1-MP + 9-MP).
Energies 15 07145 g011
Figure 12. Cross plots of weighted mean δ13C values of individual aromatic isomers from the Daolaoba field versus maturity indicator parameters.
Energies 15 07145 g012
Figure 13. Cross plots of weighted mean δ13C values of individual aromatic isomers from Yakela and Tahe fields versus maturity indicator parameters.
Energies 15 07145 g013
Table 1. List of crude oils and related geochemical parameters.
SamplesWellDepth (m)LocationP/DBTPr/PhPh/n-C18-Pr/n-C17Ga/C30HADBT/ADBFPr/n-C17Ph/n-C18DNBRTNBRTeNBRMPI-1TMNrTeMNrPMNr
1XH 15750–5870Daolaoba gas/oilfield5.61.81−0.080.71.20.180.101.041.121.840.500.340.570.67
2DLK 3/Daolaoba gas/oilfield3.11.90−0.090.70.90.200.101.121.391.340.330.200.490.56
3DLK 2/Daolaoba gas/oilfield4.31.92−0.110.60.80.220.111.111.121.260.240.260.540.64
4DLK 1/Daolaoba gas/oilfield3.11.99−0.110.70.70.220.111.631.411.670.320.200.200.14
5YK 115415–5431Yakela gas/oilfield1.70.890.110.63.50.560.671.210.761.891.030.540.500.62
6YK 125361–5376Yakela gas/oilfield1.80.990.060.84.90.540.601.482.401.791.050.490.510.69
7TP 17/Tahe oilfield1.80.890.050.77.90.470.521.100.342.320.770.470.570.56
8TP 27X/Tahe oilfield1.20.950.050.46.20.530.581.150.372.670.750.360.600.49
9S 945884–5960Tahe oilfield2.70.810.110.62.10.460.571.070.602.090.790.400.500.47
10TP 206338–6410Tahe oilfield1.51.050.070.86.70.540.611.110.383.120.790.490.550.61
11TP 245/Tahe oilfield1.40.820.140.55.20.440.611.300.332.330.690.410.570.60
12TP 311/Tahe oilfield1.70.890.050.86.60.480.541.430.452.160.780.510.210.14
13TP 15X6445–6511Tahe oilfield1.20.880.110.77.30.560.671.190.203.410.980.320.500.50
14TP 218X6536–6662Tahe oilfield1.40.820.110.77.30.540.641.020.252.940.810.390.520.70
15S 1256241–6255Tahe oilfield1.40.850.130.79.80.480.621.090.682.220.820.550.550.68
16S 111/Tahe oilfield1.61.160.010.34.30.370.391.671.071.730.950.510.200.13
17TASHEN5220–5225Tahe oilfield1.51.010.050.95.00.490.541.022.001.550.800.530.500.59
18RP 3-5/Tahe oilfield1.31.040.010.410.20.400.421.230.962.120.980.560.420.46
19XQ 96797–6936Tahe oilfield1.70.880.090.88.60.480.581.210.342.530.840.460.340.18
20AD 116302–6410Tahe oilfield1.30.700.240.65.80.430.670.960.243.091.040.340.350.51
Table 2. List of crude oils and related individual and sub-classes’ carbon isotopes.
SamplesWellDepth (m)LocationTMNsTeMNsMDBFsMFsDMFsMPsMDBTsDMDBTs1,2,6-TMN1,2,5-TMNFP9-MP1-MPDBT
1XH 15750–5870Daolaoba gas/oilfield−26.7−29.6−24.1−24.8−24.6−25.7−22.0−30.0−19.8−30.0−28.6−26.0−23.2−26.3−24.7
2DLK 3/Daolaoba gas/oilfield−23.8−32.5−21.7−29.0−22.2−28.8-−28.1−18.5−28.0-−24.3−27.2−29.0−22.3
3DLK 2/Daolaoba gas/oilfield−21.9−31.4−23.9−27.3 −26.7−23.8-−39.1−31.5-−24.5−26.3−27.0−23.4
4DLK 1/Daolaoba gas/oilfield−25.5−30.8−19.9−28.3−23.7−27.8−28.0-−34.9−31.0−23.4−26.4−27.0−28.5−16.7
5YK 115415–5431Yakela gas/oilfield−28.4−31.0−30.6−30.8−30.3−30.9−31.3−32.1−23.0−24.3−30.5−32.7−29.0−31.8−32.6
6YK 125361–5376Yakela gas/oilfield−27.3−32.6−33.2−33.4−31.9−31.7−31.7−30.2−21.3−24.5−29.1−33.3−31.6−31.4−33.1
7TP 17/Tahe oilfield−29.7−27.7−30.0−31.3−30.4−31.3−33.5−30.7−25.1−29.7−33.0−32.8−30.7−32.6−34.5
8TP 27X/Tahe oilfield−28.3−30.9−30.5−31.4−32.9−31.5−30.0−30.1−25.3−27.0−32.7−33.0−31.2−32.9−33.9
9S 945884–5960Tahe oilfield−26.4−32.6−27.1−30.6−29.6−31.4−30.3−29.3−23.7−28.0−30.6−27.6−27.8−32.2−32.3
10TP 206338–6410Tahe oilfield−27.6−31.3−30.7−30.9−34.4−31.5−33.9−31.5−25.4−24.3−30.6−33.3−31.0−32.6−34.5
11TP 245/Tahe oilfield−25.2−32.0−31.1−31.1−33.6−31.6−31.0−30.0−24.7−23.5−28.3−33.3−31.1−33.1−35.1
12TP 311/Tahe oilfield−29.7−33.5−31.5−31.6−32.6−31.4−31.4−29.6−24.6−20.7−32.1−33.7−30.5−32.3−35.9
13TP 15X6445–6511Tahe oilfield−30.7−33.6−30.7−31.0−29.9−32.1−31.0−30.9−26.2−28.6−30.5−33.2−31.7−33.5−34.6
14TP 218X6536–6662Tahe oilfield−30.0−29.3−31.7−30.9−31.7−31.6−30.2−28.1−25.8−25.3−32.8−32.7−31.1−32.8−33.3
15S 1256241–6255Tahe oilfield−26.8−31.8−30.4−31.4−28.1−30.5−33.8−28.5−23.9−22.3−32.4−32.4−29.9−31.1−31.8
16S 111/Tahe oilfield−27.2−29.2−32.2−28.7−31.0−27.7−30.9−30.8−21.1−27.2−30.3−31.4−27.3−27.0−33.1
17TASHEN5220–5225Tahe oilfield−25.1−31.4−31.5−30.3−31.6−30.9−30.1−30.9−21.5−22.7−28.1−32.3−29.7−31.3−31.9
18RP 3-5/Tahe oilfield−27.4−34.1−30.4−30.6−31.3−29.7−31.1−29.2−22.0−25.2−27.8−32.5−28.8−30.5−31.7
19XQ 96797–6936Tahe oilfield−28.3−29.8−35.2−31.4−32.3−31.8−31.3−31.0−24.9−24.6−33.5−33.6−30.8−32.6−32.7
20AD 116302–6410Tahe oilfield−33.2−30.7−35.1−34.9−31.9−33.8−32.8−32.1−37.5−29.3−29.1−37.2−33.5−34.3−36.3
Publisher’s Note: MDPI stays neutral with regard to jurisdictional claims in published maps and institutional affiliations.

