

Determinants of Renewable Energy Development: Evidence from the EU Countries

Abstract
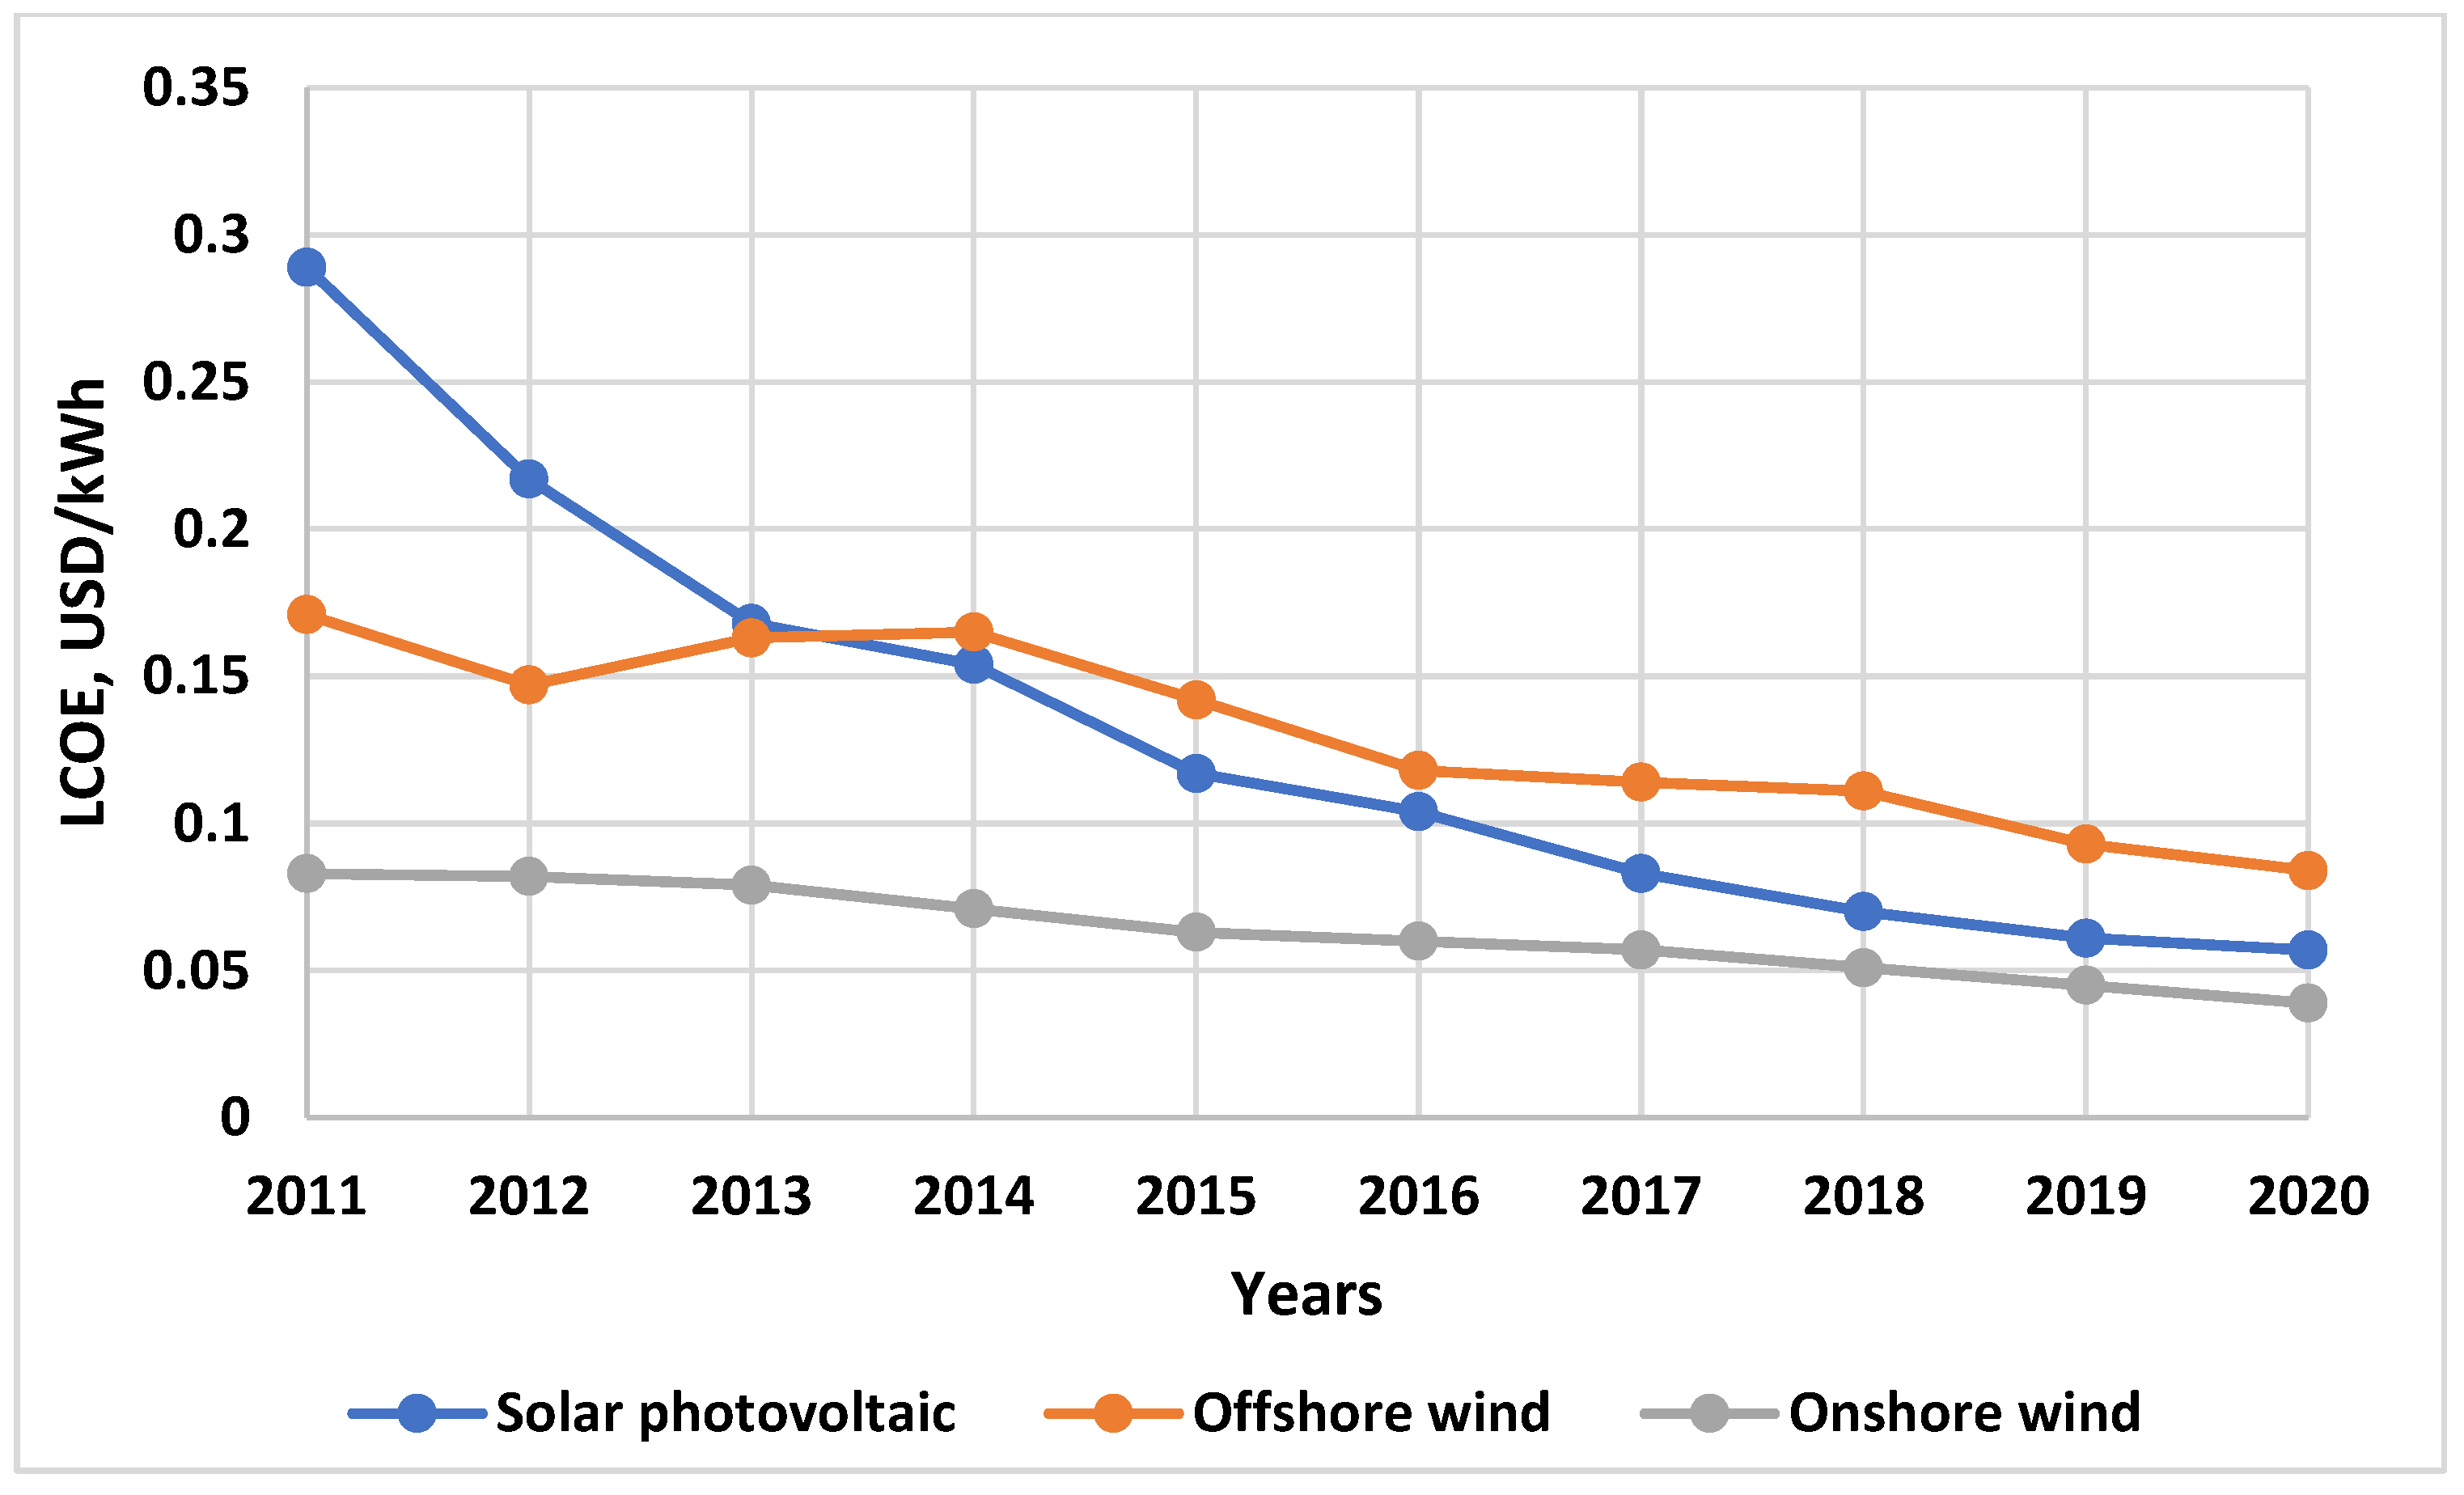
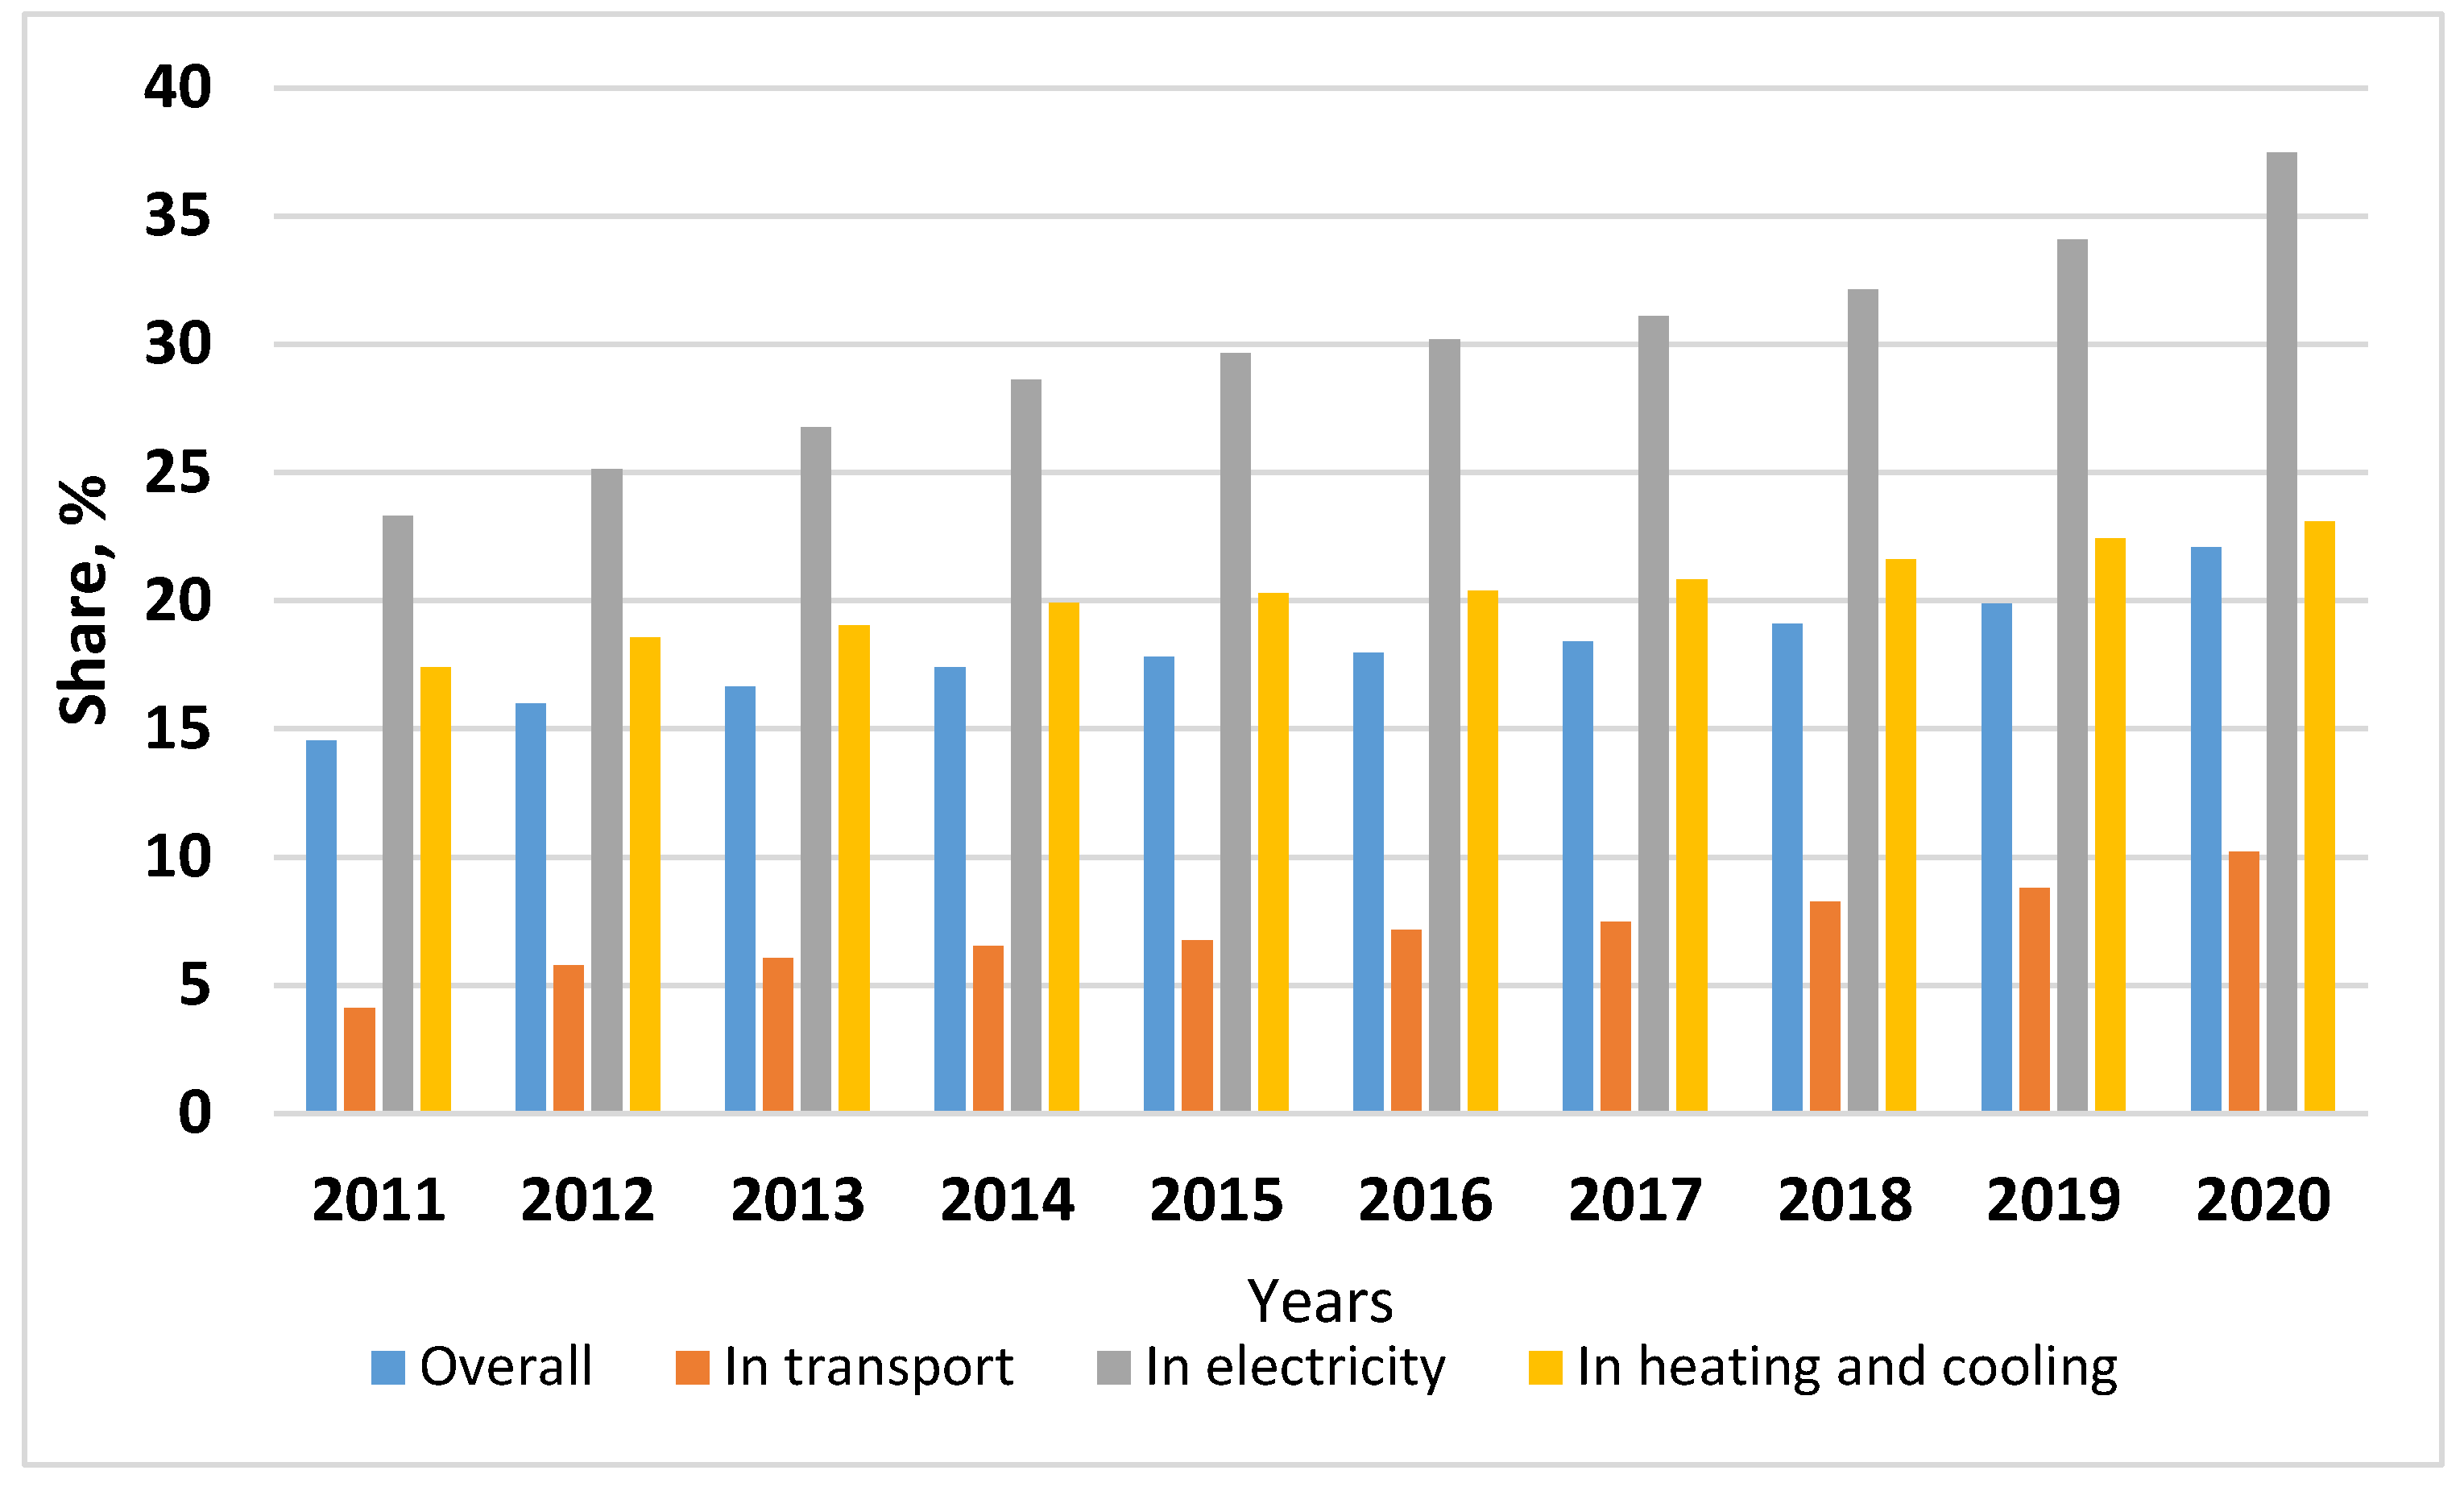
:1. Introduction
- A higher level of economic development (expressed by GDP per capita) stimulates the RE sector.
- Higher costs of business start-up procedures (% of GNI per capita) discourage RE development because the necessity to obtain a lot of licenses and permits makes it more difficult for entrepreneurs to launch a new business or project in this sphere.
- Total unemployment (% of the total labor force) has an unknown effect since it is needed to determine whether the unemployed labor force will find a job in the RE sector (especially during an economic recession). Employment in advanced technology manufacturing and knowledge-intensive services (% of total employment) is thought to influence the RE sector positively.
- RE consumption may be promoted by a high level of institutional quality (expressed by such factors as democracy, political participation, low level of corruption, and economic freedom).
- Favorable geographic location (good climate or water access) is positively correlated with RE sector growth, whereas plenty of natural resources (oil and natural gas) is an obstacle to its development.
2. Literature Review
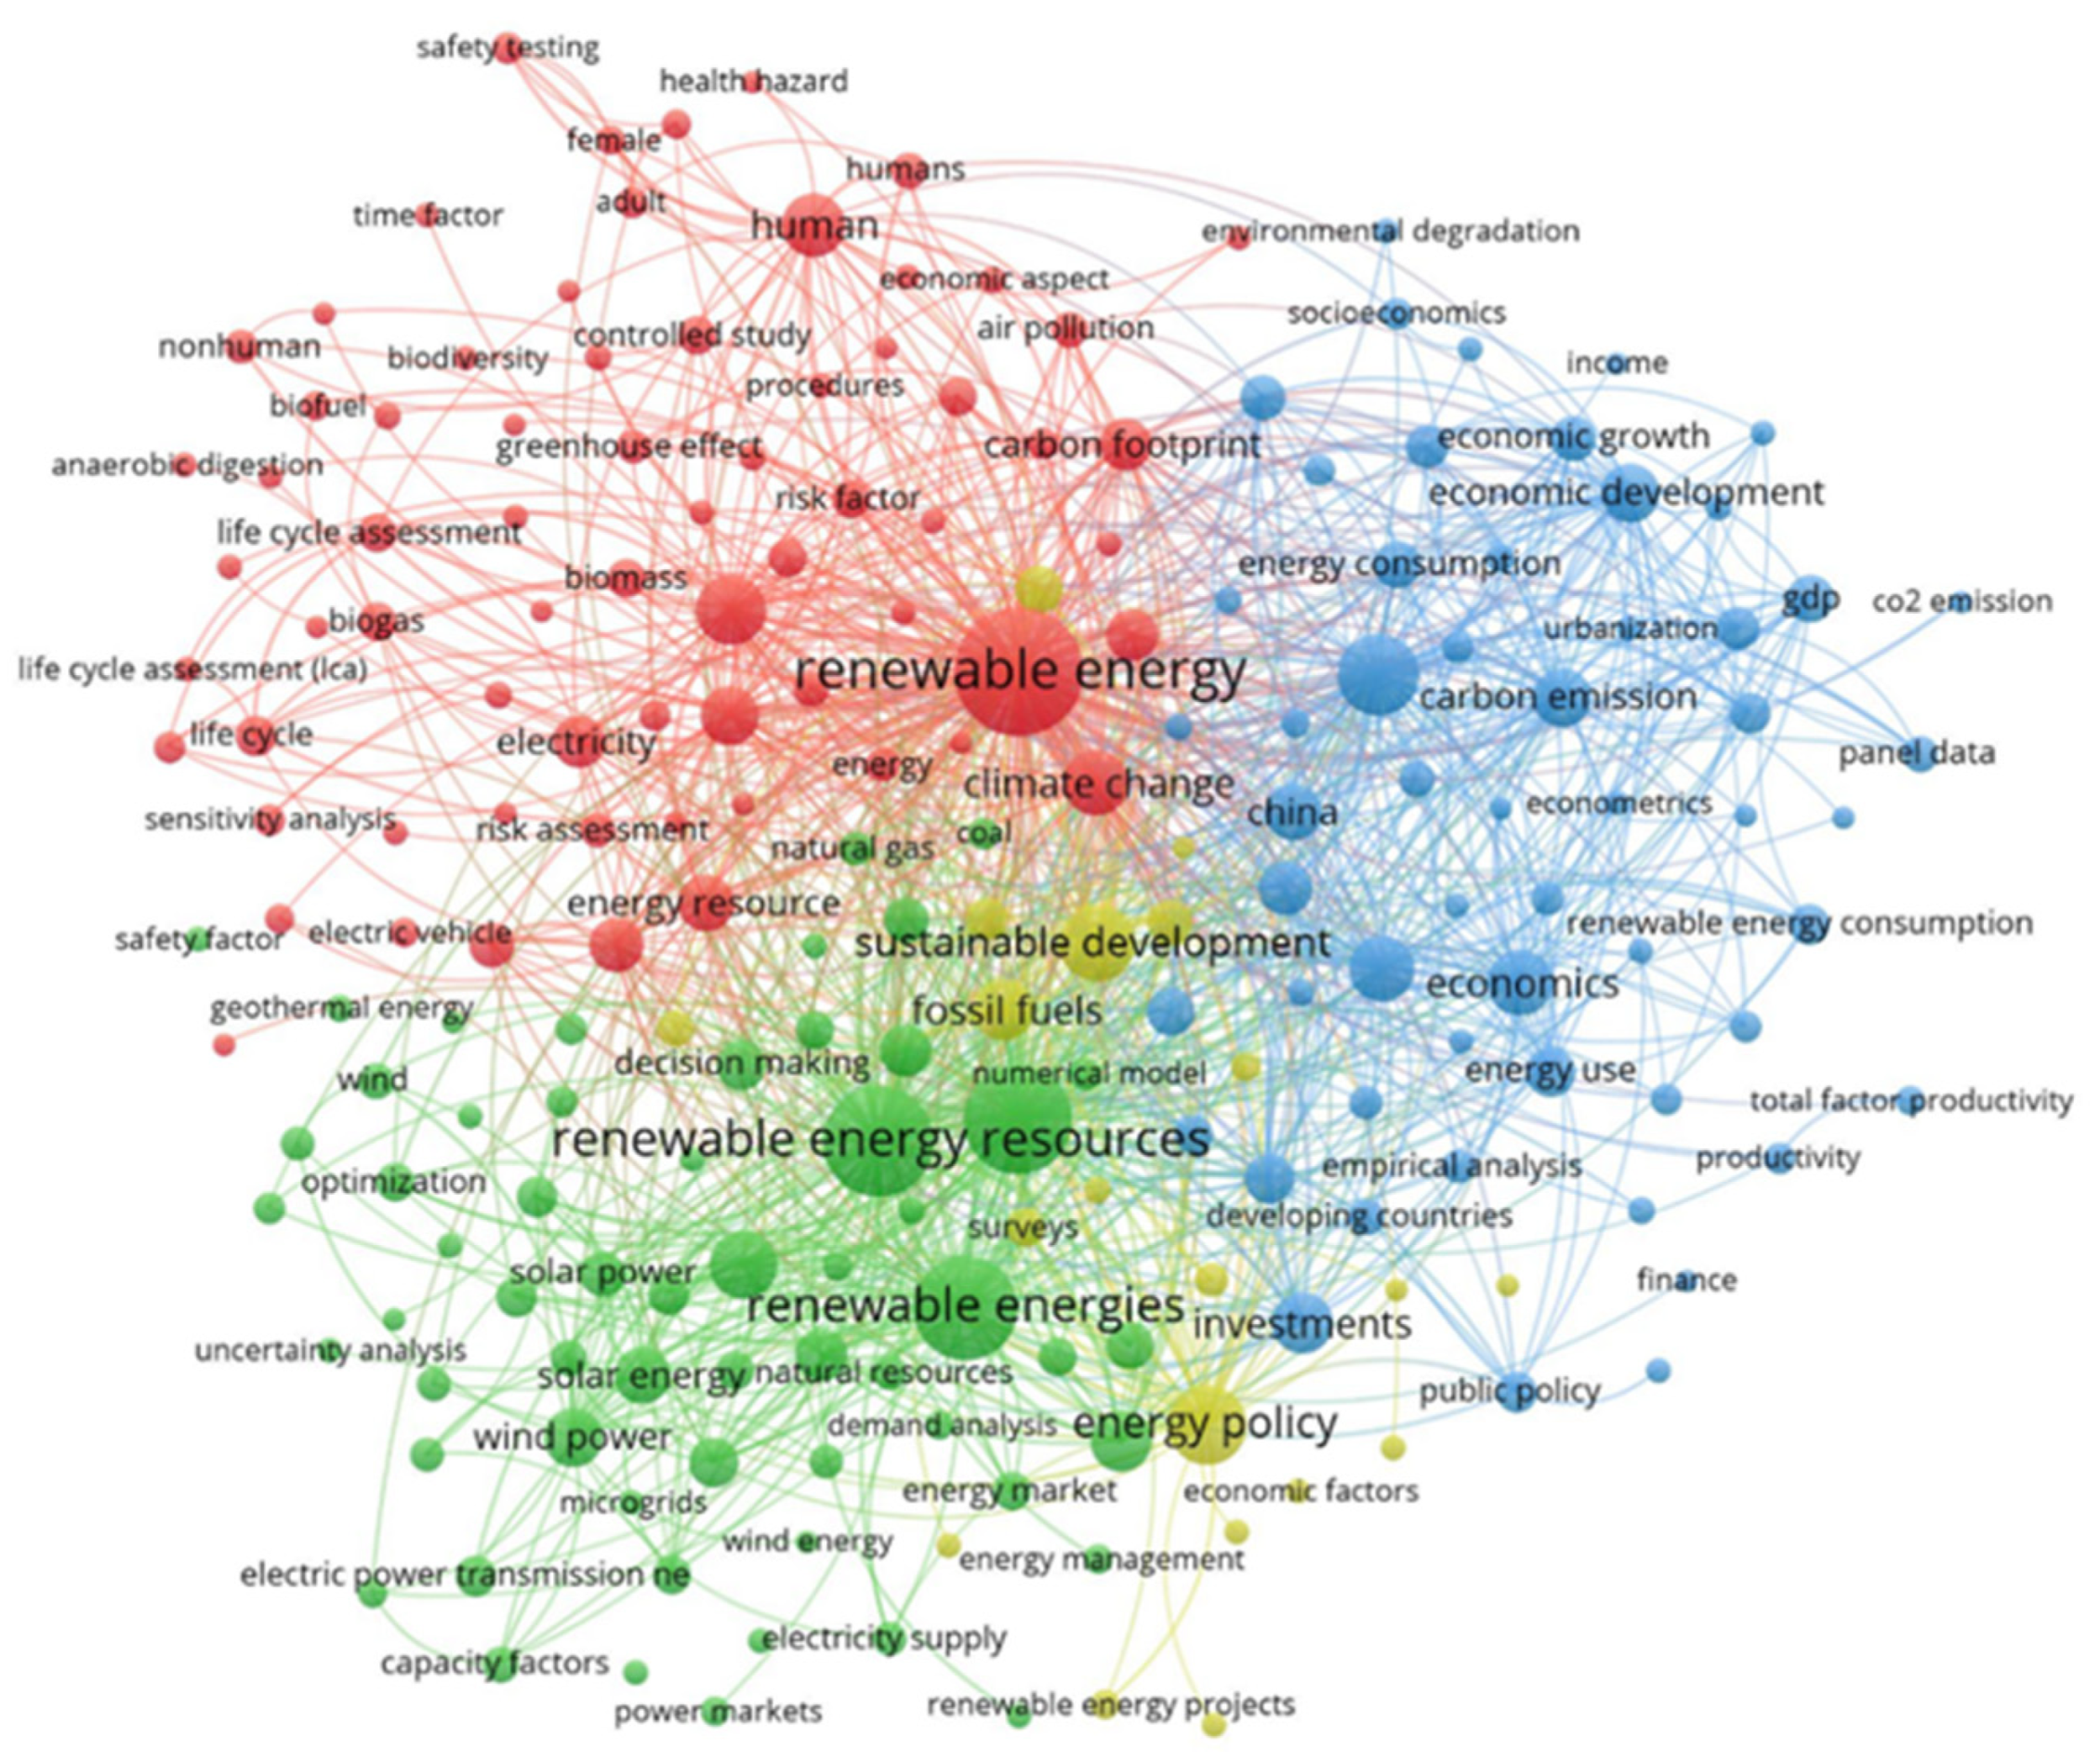
- -
- The first (red) cluster (69 items) includes publications concerning the impact of environmental factors on RE development.
- -
- The second (green) cluster (59 items) involves papers on energy and technical issues of renewable usage.
- -
- The third (blue) cluster (56 items) includes papers about economic, social, and institutional factors affecting RE development. They include GDP, national income, economic growth, public policy quality, etc.
- -
- The fourth (yellow) cluster (20 items) includes technological aspects of RE development.
- -
- Although there are a variety of publications on economic determinants, scientists have not still reached a consensus about their impact on RE development. Papers have different results concerning these determinants even when analyzing the same regions and/or time frames.
- -
- The role of institutional and political factors is often underestimated in studies. Most existing research concerning this issue is theoretically based and does not use any econometric models.
- -
- There is a lack of research on the relationship between oil and gas reserves and RE deployment. Most studies concentrate only on the nexus between fossil fuel usage and environmental sustainability.
3. Methods and Data
- dependent variables:
- REt—share of RE in the total energy consumption (%);
- RECt—renewable electricity consumption per capita (in GWh).
- independent variables:
- gdpt—GDP per capita (constant 2015 USD);
- cbt—cost of business start-up procedures (% of GNI per capita);
- unt—total unemployment (% of total labor force);
- htet—employment in high- and medium-high technology manufacturing and knowledge-intensive services (% of total employment);
- demt—Democracy Index (by the Economist Intelligence Unit, in points (0—totally authoritarian regime, 100—full democracy));
- ppit—Political Participation Index (by the Economist Intelligence Unit, in points (0—the lowest level of participation, 10—the highest one);
- cort—Corruption Perception Index (by Transparency International, in points (0—highly corrupt, 100—least corrupt);
- eft—Economic Freedom Index (by Heritage Foundation, in points (0—totally unfree, 100—absolutely free));
- rest—dummy variable (1—countries with significant oil and natural gas reserves, 0—countries with less or no reserves);
- clt—dummy variable (1—countries with more favorable geographical conditions (located in the southern or northern part of Europe or water access), 0—countries with less favorable climatic conditions).
4. Results and Discussion
5. Conclusions
Author Contributions
Funding
Data Availability Statement
Conflicts of Interest
Appendix A

| ---- Coefficients ---- | ||||
| (b) | (B) | (b-B) | sqrt(diag(V_b-V_B)) | |
| fe | re | Difference | S.E. | |
| gdp | 0.0002557 | 0.0001222 | 0.0001335 | 0.0000289 |
| cb | −0.2326486 | −0.2588386 | 0.0261901 | . |
| un | −0.1147809 | −0.2011204 | 0.0863396 | 0.0145427 |
| the | 0.5414455 | 0.3737256 | 0.1677199 | 0.034857 |
| dem | 0.0074234 | −0.0597961 | 0.0672194 | 0.009444 |
| ppi | 0.0606193 | 0.0861466 | −0.0255273 | . |
| cor | −0.0103681 | −0.0350046 | 0.0246365 | 0.0018912 |
| ef | 0.2060948 | 0.2142435 | −0.0081488 | . |
| ---- Coefficients ---- | ||||
| (b) | (B) | (b-B) | sqrt(diag(V_b-V_B)) | |
| fe | re | Difference | S.E. | |
| gdp | 5.70 × 10⁻⁸ | 5.20 × 10⁻⁸ | 4.93 × 10⁻⁹ | 2.35 × 10⁻⁹ |
| cb | −0.0000118 | −0.0000129 | 1.06 × 10⁻⁶ | . |
| un | −2.32 × 10⁻⁶ | −5.13 × 10⁻⁶ | 2.81 × 10⁻⁶ | 1.38 × 10⁻⁶ |
| the | 0.0000477 | 0.000044 | 3.71 × 10⁻⁶ | 2.95 × 10⁻⁶ |
| dem | −0.0000136 | −0.0000138 | 2.15 × 10⁻⁷ | 1.29 × 10⁻⁶ |
| ppi | 9.50 × 10⁻⁶ | 0.0000105 | −1.02 × 10⁻⁶ | . |
| cor | 1.75 × 10⁻⁶ | 1.64 × 10⁻⁶ | 1.18 × 10⁻⁷ | 5.72 × 10⁻⁷ |
| ef | 0.0000191 | 0.0000187 | 4.71 × 10⁻⁷ | . |
Appendix B
| Breusch and Pagan Lagrangian multiplier test for random effects | ||
| re[id,t] = Xb + u[id] + e[id,t] | ||
| Estimated results: | ||
| Var | sd = sqrt(Var) | |
| re | 133.9228 | 11.5725 |
| e | 3.671963 | 1.916237 |
| u | 89.35588 | 9.452824 |
| Breusch and Pagan Lagrangian multiplier test for random effects | ||
| rec[id,t] = Xb + u[id] + e[id,t] | ||
| Estimated results: | ||
| Var | sd = sqrt(Var) | |
| rec | 3.97 × 10⁻⁶ | 0.0019916 |
| e | 4.56 × 10⁻⁸ | 0.0002136 |
| u | 2.96 × 10⁻⁶ | 0.0017202 |
References
- Przychodzen, W.; Przychodzen, J. Determinants of Renewable Energy Production in Transition Economies: A Panel Data Approach. Energy 2020, 191, 116583. [Google Scholar] [CrossRef]
- Data & Statistics. Available online: https://www.irena.org/Statistics (accessed on 15 July 2022).
- Elia, A.; Kamidelivand, M.; Rogan, F.; Gallachóir, Ó.B. Impacts of Innovation on Renewable Energy Technology Cost Reductions. Renew. Sust. Energ. Rev. 2021, 138, 110488. [Google Scholar] [CrossRef]
- Gielen, D.; Boshell, F.; Saygin, D.; Bazilian, M.D.; Wagner, N.; Gorini, R. The Role of Renewable Energy in the Global Energy Transformation. Energy Strategy Rev. 2019, 24, 38–50. [Google Scholar] [CrossRef]
- Sotnyk, I.; Kurbatova, T.; Kubatko, O.; Prokopenko, O.; Prause, G.; Kovalenko, Y.; Trypolska, G.; Pysmenna, U. Energy Security Assessment of Emerging Economies under Global and Local Challenges. Energies 2021, 14, 5860. [Google Scholar] [CrossRef]
- Share of Renewable Energy in Gross Final Energy Consumption. Available online: https://ec.europa.eu/eurostat/databrowser/view/t2020_rd330/default/table?lang=en (accessed on 25 June 2022).
- Share of Energy from Renewable Sources. Available online: https://ec.europa.eu/eurostat (accessed on 25 June 2022).
- Narayan, S.; Doytch, N. An Investigation of Renewable and Non-Renewable Energy Consumption and Economic Growth Nexus Using Industrial and Residential Energy Consumption. Energy Econ. 2017, 68, 160–176. [Google Scholar] [CrossRef]
- Bilan, Y.; Streimikiene, D.; Vasylieva, T.; Lyulyov, O.; Pimonenko, T.; Pavlyk, A. Linking between Renewable Energy, CO2 Emissions, and Economic Growth: Challenges for Candidates and Potential Candidates for the EU Membership. Sustainability 2019, 11, 1528. [Google Scholar] [CrossRef]
- Klymchuk, O.; Khodakivska, O.; Kovalov, B.; Benetyte, R.; Momotenko, I. World trends in bioethanol and biodiesel production in the context of sustainable energy development. Int. J. Glob. Environ. Issues 2020, 19, 90–108. [Google Scholar] [CrossRef]
- Hens, L.; Karintseva, O.; Kharchenko, M.; Matsenko, O. The State’s Structural Policy Innovations Influenced by the Ecological Transformations. Mark. Manag. Innov. 2018, 3, 290–301. [Google Scholar] [CrossRef]
- Benetyte, R.; Rubio, J.G.; Kovalov, B.; Matviychuk-Soskina, N.; Krusinskas, R. Role of R&D expenditure, CEO compensation and financial ratios for country’s economic sustainability and innovative growth. Int. J. Glob. Energy Issues 2021, 43, 228–246. [Google Scholar] [CrossRef]
- Khan, A.; Chenggang, Y.; Hussain, J.; Kui, Z. Impact of Technological Innovation, Financial Development and Foreign Direct Investment on Renewable Energy, Non-Renewable Energy and the Environment in Belt & Road Initiative Countries. Renew. Energy 2021, 171, 479–491. [Google Scholar] [CrossRef]
- Ragosa, G.; Warren, P. Unpacking the Determinants of Cross-Border Private Investment in Renewable Energy in Developing Countries. J. Clean. Prod. 2019, 235, 854–865. [Google Scholar] [CrossRef]
- Pavlyk, V. Assessment of Green Investment Impact on the Energy Efficiency Gap of the National Economy. FMIR 2020, 4, 117–123. [Google Scholar] [CrossRef]
- Rapsikevicius, J.; Bruneckiene, J.; Lukauskas, M.; Mikalonis, S. The Impact of Economic Freedom on Economic and Environmental Performance: Evidence from European Countries. Sustainability 2021, 13, 2380. [Google Scholar] [CrossRef]
- Salim, R.A.; Rafiq, S. Why Do Some Emerging Economies Proactively Accelerate the Adoption of Renewable Energy? Energy Econ. 2012, 34, 1051–1057. [Google Scholar] [CrossRef]
- Zhao, P.; Lu, Z.; Fang, J.; Paramati, S.R.; Jiang, K. Determinants of Renewable and Non-Renewable Energy Demand in China. Struct. Chang. Econ. Dyn. 2020, 54, 202–209. [Google Scholar] [CrossRef]
- He, S. The Impact of Trade on Environmental Quality: A Business Ethics Perspective and Evidence from China. BEL 2019, 3, 43–48. [Google Scholar] [CrossRef]
- Omri, A.; Nguyen, D.K. On the Determinants of Renewable Energy Consumption: International Evidence. Energy 2014, 72, 554–560. [Google Scholar] [CrossRef]
- Ohler, A.M. Factors Affecting the Rise of Renewable Energy in the U.S.: Concern over Environmental Quality or Rising Unemployment? Energy J. 2015, 36, 97–115. [Google Scholar] [CrossRef]
- Delmas, M.A.; Montes-Sancho, M.J. U.S. State Policies for Renewable Energy: Context and Effectiveness. Energy Policy 2011, 39, 2273–2288. [Google Scholar] [CrossRef]
- Rivers, N. Renewable Energy and Unemployment: A General Equilibrium Analysis. Resour. Energy Econ. 2013, 35, 467–485. [Google Scholar] [CrossRef]
- Bamati, N.; Raoofi, A. Development Level and the Impact of Technological Factor on Renewable Energy Production. Renew. Energy 2020, 151, 946–955. [Google Scholar] [CrossRef]
- Ivanovski, K.; Marinucci, N. Policy Uncertainty and Renewable Energy: Exploring the Implications for Global Energy Transitions, Energy Security, and Environmental Risk Management. Energy Resour. Soc. Sci. 2021, 82, 102415. [Google Scholar] [CrossRef]
- Strunz, S.; Gawel, E.; Lehmann, P. The Political Economy of Renewable Energy Policies in Germany and the EU. Util. Policy 2016, 42, 33–41. [Google Scholar] [CrossRef]
- Dkhili, H.; Ben Dhiab, L. Environmental Management Efficiency of GCC Countries: Linking Between Composite Index of Environmental Performance, Socio-Political and Economic Dimensions. Mark. Manag. Innov. 2019, 1, 57–69. [Google Scholar] [CrossRef]
- Gawel, E.; Strunz, S.; Lehmann, P. A Public Choice View on the Climate and Energy Policy Mix in the EU—How Do the Emissions Trading Scheme and Support for Renewable Energies Interact? Energy Policy 2014, 64, 175–182. [Google Scholar] [CrossRef]
- Uzar, U. Is Income Inequality a Driver for Renewable Energy Consumption? J. Clean. Prod. 2020, 255, 120287. [Google Scholar] [CrossRef]
- Belaïd, F.; Elsayed, A.H.; Omri, A. Key Drivers of Renewable Energy Deployment in the MENA Region: Empirical Evidence Using Panel Quantile Regression. Struct. Chang. and Econ. Dyn. 2021, 57, 225–238. [Google Scholar] [CrossRef]
- Chen, C.; Pinar, M.; Stengos, T. Determinants of Renewable Energy Consumption: Importance of Democratic Institutions. Renew. Energy 2021, 179, 75–83. [Google Scholar] [CrossRef]
- Adams, S.; Klobodu, E.K.M.; Apio, A. Renewable and Non-Renewable Energy, Regime Type and Economic Growth. Renew. Energy 2018, 125, 755–767. [Google Scholar] [CrossRef]
- Huang, P.; Liu, Y. Toward Just Energy Transitions in Authoritarian Regimes: Indirect Participation and Adaptive Governance. J. Environ. Plan. Manag. 2021, 64, 1–21. [Google Scholar] [CrossRef]
- Karintseva, O.; Kharchenko, M.; Boon, E.K.; Melnyk, V.; Kobzar, O. Environmental determinants of energy-efficient transformation of national economies for sustainable development. Int. J. of Glob. Energy Issues 2021, 43, 262–274. [Google Scholar] [CrossRef]
- Hvelplund, F. Innovative Democracy, Political Economy, and the Transition to Renewable Energy. A Full-Scale Experiment in Denmark 1976-2013. Environ. Res. Eng. Manag. 2013, 66, 5–21. [Google Scholar] [CrossRef]
- Cadoret, I.; Padovano, F. The Political Drivers of Renewable Energies Policies. Energy Econ. 2016, 56, 261–269. [Google Scholar] [CrossRef]
- Amri, A.E.; Boutti, R.; Oulfarsi, S.; Rodhain, F.; Bouzahir, B. Carbon Financial Markets Underlying Climate Risk Management, Pricing and Forecasting: Fundamental Analysis. FMIR 2020, 4, 31–44. [Google Scholar] [CrossRef]
- Apergis, N.; Payne, J.E. The Causal Dynamics between Renewable Energy, Real GDP, Emissions and Oil Prices: Evidence from OECD Countries. Appl. Econ. 2014, 46, 4519–4525. [Google Scholar] [CrossRef]
- Troster, V.; Shahbaz, M.; Uddin, G.S. Renewable Energy, Oil Prices, and Economic Activity: A Granger-Causality in Quantiles Analysis. Energy Econ. 2018, 70, 440–452. [Google Scholar] [CrossRef]
- Bernal, B.; Molero, J.C.; Perez De Gracia, F. Impact of Fossil Fuel Prices on Electricity Prices in Mexico. JES 2019, 46, 356–371. [Google Scholar] [CrossRef]
- Ergun, S.J.; Owusu, P.A.; Rivas, M.F. Determinants of Renewable Energy Consumption in Africa. Environ. Sci. Pollut. Res. 2019, 26, 15390–15405. [Google Scholar] [CrossRef]
- Melnyk, L.; Kubatko, O.; Piven, V. Renewable Energy Promotion with Economic Incentives: The Case of the EU. SCEE 2022, 62, 32–38. [Google Scholar] [CrossRef]
- Alola, A.A.; Alola, U.V.; Akdag, S.; Yildirim, H. The Role of Economic Freedom and Clean Energy in Environmental Sustainability: Implication for the G-20 Economies. Environ. Sci. Pollut. Res. 2022, 29, 36608–36615. [Google Scholar] [CrossRef]
- Cheng, Z.; Li, X.; Wang, M. Resource Curse and Green Economic Growth. Resour. Policy. 2021, 74, 102325. [Google Scholar] [CrossRef]
- Wang, S.; Wang, X.; Lu, B. Is Resource Abundance a Curse for Green Economic Growth? Evidence from Developing Countries. Resour. Policy 2022, 75, 102533. [Google Scholar] [CrossRef]
- Qian, X.; Wang, D.; Wang, J.; Chen, S. Resource Curse, Environmental Regulation and Transformation of Coal-Mining Cities in China. Resour. Policy 2021, 74, 101447. [Google Scholar] [CrossRef]
- Energy Policy: General Principles | Fact Sheets on the European Union|European Parliament. Available online: https://www.europarl.europa.eu/factsheets/en/sheet/68/energy-policy-general-principles (accessed on 17 July 2022).
- Employment in High- and Medium-High Technology Manufacturing and Knowledge-Intensive Services. Available online: https://ec.europa.eu/eurostat/databrowser/view/sdg_09_20/default/table?lang=en (accessed on 17 July 2022).
- Cost of Business Start-up Procedures (% of GNI per Capita). Available online: https://data.worldbank.org/indicator/IC.REG.COST.PC.ZS (accessed on 17 July 2022).
- Democracy Index. Available online: https://www.eiu.com/n/campaigns/democracy-index-2021/ (accessed on 17 July 2022).
- Corruption Perceptions Index. Available online: https://www.transparency.org/en/cpi/2021 (accessed on 17 July 2022).
- Index of Economic Freedom: Promoting Economic Opportunity and Prosperity by Country. Available online: //www.heritage.org/index/ (accessed on 17 July 2022).
- U.S. Energy Information Administration (EIA). Available online: https://www.eia.gov/index.php (accessed on 17 July 2022).
- Simionescu, M.; Bilan, Y.; Krajňáková, E.; Streimikiene, D.; Gędek, S. Renewable Energy in the Electricity Sector and GDP per Capita in the European Union. Energies 2019, 12, 2520. [Google Scholar] [CrossRef]
- Sadorsky, P. Renewable Energy Consumption, CO2 Emissions and Oil Prices in the G7 Countries. Energy Econ. 2009, 31, 456–462. [Google Scholar] [CrossRef]
- Kang, X.; Khan, F.U.; Ullah, R.; Arif, M.; Rehman, S.U.; Ullah, F. Does Foreign Direct Investment Influence Renewable Energy Consumption? Empirical Evidence from South Asian Countries. Energies 2021, 14, 3470. [Google Scholar] [CrossRef]
- Data and Statistics (International Energy Agency). Available online: https://www.iea.org/data-and-statistics (accessed on 18 July 2022).
- Antonyuk, N.; Plikus, I.; Jammal, M. Sustainable Business Development Vision under the Covid-19 Pandemic. Health Econ. Manag. Rev. 2021, 2, 37–43. [Google Scholar] [CrossRef]
- Country Rankings (IRENA). Available online: https://www.irena.org/Statistics/View-Data-by-Topic/Capacity-and-Generation/Country-Rankings (accessed on 18 July 2022).
- The SustainAbility Institute by ERM. Available online: https://www.sustainability.com/ (accessed on 14 July 2022).
- Jacqmin, J. The Role of Market-Oriented Institutions in the Deployment of Renewable Energies: Evidences from Europe. Appl. Econ. 2018, 50, 202–215. [Google Scholar] [CrossRef] [Green Version]


| Random-effects (RE) GLS regr. R-squared: within = 0.4293 between = 0.1332 overall = 0.1422 Correlat.(u_i, X) = 0 (assumed) | Numb. of observations = 270 Numb.of groups = 27 Observ. per group: minimum = 10 averg = 10.0 maximum = 10 Wald chi2(10) = 170.66 Probab. > chi^2 = 0.0000 | |||||
| RE | Coefic. | Stand.Er. | z(st) | P > |z| | 95% Confidence Interval | |
| gdp | 0.0001222 | 0.0000634 | 1.93 | 0.054 | −1.99 × 10⁻⁶ | 0.0002464 |
| cb | −0.2588386 | 0.0715791 | −3.62 | 0.000 | −0.399131 | −0.1185463 |
| un | −0.2011204 | 0.0654852 | −3.07 | 0.002 | −0.329469 | −0.0727719 |
| hte | 0.3737256 | 0.100829 | 3.71 | 0.000 | 0.1761045 | 0.5713468 |
| dem | −0.0597961 | 0.0939434 | −0.64 | 0.524 | −0.2439217 | 0.1243296 |
| ppi | 0.0861466 | 0.0359093 | −2.40 | 0.016 | 0.0157658 | 0.1565275 |
| cor | −0.0350046 | 0.0490036 | −0.71 | 0.475 | −0.13105 | 0.0610408 |
| ef | 0.2142435 | 0.0854286 | 2.51 | 0.012 | −0.0468066 | 0.3816805 |
| res | −0.8915666 | 4.229338 | −0.21 | 0.833 | −9.180917 | 7.397783 |
| cl | 10.91367 | 4.0251 | 2.71 | 0.007 | 3.02462 | 18.80272 |
| _cons | −0.0081798 | 9.830657 | −1.47 | 0.141 | −33.74438 | 4.791089 |
| Random-effects (RE) GLS regr. R-squared: within = 0.4699 between = 0.2140 overall = 0.2181 Correlat.(u_i, X) = 0 (assumed) | Numb. of observations = 270 Numb.of groups = 27 Observ. per group: minimum = 10 averg = 10.0 maximum = 10 Probab. > chi^2 = 0.0000 Wald chi2(10) = 210.29 | |||||
| REC | Coefic. | Stand.Er. | z(st) | P > |z| | 95% Confidence Interval | |
| gdp | 5.20 × 10⁻⁸ | 7.40 × 10⁻⁹ | 7.03 | 0.000 | 3.75 × 10⁻⁸ | 6.65 × 10⁻⁸ |
| cb | −0.0000129 | 7.85 × 10⁻⁶ | −1.64 | 0.100 | −0.0000283 | 2.48 × 10⁻⁶ |
| un | −5.13 × 10⁻⁶ | 7.35 × 10⁻⁶ | −0.70 | 0.485 | −0.0000195 | 9.27 × 10⁻⁶ |
| hte | 0.000044 | 0.0000115 | 3.82 | 0.000 | 0.0000214 | 0.0000666 |
| dem | −0.0000138 | 0.0000104 | −1.32 | 0.187 | −0.0000342 | 6.70 × 10⁻⁶ |
| ppi | 0.0000105 | 3.95 × 10⁻⁶ | 2.66 | 0.008 | 2.78 × 10⁻⁶ | 0.0000183 |
| cor | 1.64 × 10⁻⁶ | 5.44 × 10⁻⁶ | 0.30 | 0.763 | −9.02 × 10⁻⁶ | 0.0000123 |
| ef | 0.0000187 | 9.38 × 10⁻⁶ | 1.99 | 0.047 | 2.81 × 10⁻⁷ | 0.0000371 |
| res | −0.0002587 | 0.0007493 | −0.35 | 0.730 | −0.0017273 | 0.0012098 |
| cl | 0.0011025 | 0.0007117 | 1.55 | 0.121 | −0.0002925 | 0.0024974 |
| _cons | −0.0025569 | 0.0012216 | −2.09 | 0.036 | −0.0049512 | −0.0001626 |
Publisher’s Note: MDPI stays neutral with regard to jurisdictional claims in published maps and institutional affiliations. |
© 2022 by the authors. Licensee MDPI, Basel, Switzerland. This article is an open access article distributed under the terms and conditions of the Creative Commons Attribution (CC BY) license (https://creativecommons.org/licenses/by/4.0/).
Share and Cite
Tu, Y.-X.; Kubatko, O.; Piven, V.; Sotnyk, I.; Kurbatova, T. Determinants of Renewable Energy Development: Evidence from the EU Countries. Energies 2022, 15, 7093. https://doi.org/10.3390/en15197093
Tu Y-X, Kubatko O, Piven V, Sotnyk I, Kurbatova T. Determinants of Renewable Energy Development: Evidence from the EU Countries. Energies. 2022; 15(19):7093. https://doi.org/10.3390/en15197093
Chicago/Turabian StyleTu, Yu-Xia, Oleksandr Kubatko, Vladyslav Piven, Iryna Sotnyk, and Tetiana Kurbatova. 2022. "Determinants of Renewable Energy Development: Evidence from the EU Countries" Energies 15, no. 19: 7093. https://doi.org/10.3390/en15197093