
Optimal Powertrain Sizing of Series Hybrid Coach Running on Diesel and HVO for Lifetime Carbon Footprint and Total Cost Minimisation

Abstract
:1. Introduction
2. Coach Use Case
2.1. Series Hybrid Powertrain
2.2. Drive Cycle
2.3. Fuel
3. Powertrain Sizing Optimisation
3.1. Optimisation Methodology
3.2. Design Variables
3.3. Minimisation Objectives
3.3.1. Equivalent Fuel Consumption
3.3.2. Lifetime Carbon Footprint Minimisation ()
3.3.3. Total Cost Minimisation ()
3.3.4. Carbon Footprint and Total Cost Balanced Minimisation ()
3.4. Modelling Approach
3.4.1. Vehicle Resistances, Wheels and Differential
3.4.2. Multi-Speed Transmission and eDrive
3.4.3. Hv Battery
3.4.4. Generator and ICE
4. Results and Discussion
4.1. Comparison of Baseline Vehicle Running on Diesel and HVO
4.2. Optimal Powertrain Sizing for Fuel Consumption Minimisation
4.3. Optimal Powertrain Sizing for Carbon Footprint Minimisation (pCO2)
4.4. Optimal Powertrain Sizing for Lifetime Cost Minimisation (pTCO)
4.5. Environmental–Economic Balanced Optimal Sizing ()
4.6. Comparison of Powertrain Operation
4.7. Comparison of eDrive Operation
5. Conclusions
- For a baseline powertrain manually sized to satisfy vehicle key performance requirements and set rules (ZUEZ range), HVO fuel offered a 62.46% reduction in lifetime carbon footprint at the expense of 12.64% higher overall expenditure over conventional diesel. Integration of alternative HVO can thus significantly lower carbon footprint at the expense of some lifetime costs, which could be balanced by government incentives.
- When aiming for fuel efficiency, optimal sizing for diesel and HVO cases gave 1.5% and 1.45% consumption reductions over baseline but with marginal lowering of emissions (1.28% and 0.57%) at the expense of highly elevated total costs (4.06% and 6.04%) from the production of larger components. This indicates that the conventional approach to powertrain sizing aimed at efficiency improvement may not be the best solution from an environmental or even an economic point of view, especially for new upcoming electrified powertrains such as the current unconventional plug-in series-HEV coach running on alternative HVO.
- With lifetime cost as the minimisation objective, TCO reductions of 8.88% and 7.86% over baseline were achieved for diesel and HVO with some improvement on carbon footprint (1.38% and 4.89%) even after consuming more fuel (0.74% and 0.76%), showing considerable dependency of the overall environmental impact on vehicle production emissions. Due to the environmentally friendly nature of HVO, this TCO-focused sizing (highly dependent on production aspects) gave much greater benefits in emission reduction than the diesel case, which signifies the decreasing importance of powertrain efficiency over production aspects in lowering emissions for unconventional vehicle topologies and especially for alternative fuels. Singular focus on overall carbon footprint minimisation in the case of diesel and HVO gave 2.93% and 5.95% reductions and also generated favourable outcomes on other targets such as TCO with 3.43% and 4.41% or fuel consumption minimisation with 1.12% and 0.97% benefits, respectively.
- Finally, considering a balanced objective with equal weighting on and TCO minimisation against the baseline, substantial benefits for diesel and HVO cases were obtained with lifetime carbon footprint reductions of 2.17% and 5.7%, and total cost reductions of 8.8% and 7.75%, respectively. For calculating the absolute minimum of this combined equally weighted objective, the considered optimisation approach slightly favoured TCO reduction over emissions in comparison to the previous -focused sizing case, which also generated balanced results. When comparing fuel consumption reduction results with the -focused case (0.12% against 1.12% for diesel and 0.28% against 0.97% for HVO), the importance of production aspects over powertrain efficiency in balanced minimisation of both lifetime environmental impact and overall expenditure becomes further evident for the current plug-in series-HEV powertrain topology and especially HVO fuel. On comparing carbon footprint and total costs with -focused and TCO-focused solutions, it can be seen that the balanced solution offered a substantial lowering of emissions for only a slight increase in TCO. It can be concluded that such unconventional powertrain architectures running on different fuels present a greater degree of freedom over their design optimisation, requiring application-specific and balanced design goals to achieve the best outcomes.
- Among various powertrain components for the given series-HEV coach use case, eDrive sizing has been found to give the highest and cost‒benefit through efficiency improvement against increasing production impact owing to better eDrive operation, the improved scope of regenerative braking and the added possibility of gear ratio tuning with the larger size. ICE range extender size showed less effect on overall powertrain efficiency against its corresponding production impact. At the same time, the HV battery gave the least efficiency improvement favouring the selection of the smallest battery size in case of most optimisation objectives due to its dominant production aspect.
- Optimal powertrain sizing considering plug-in charging with SoC depleting mode (plug-in HEV) or ZUEZ running with electric-only operation in the urban part of the VECTO interurban cycle could also be considered in the future.
- The current optimal sizing solutions for various minimisation objectives have been generated considering urban and interurban driving scenarios (VECTO interurban cycle). Another aspect of coach vehicles involves continuous driving on highways at sustained speeds. Actual anticipated use could be further considered by combining different mission profiles or even using real-world routes.
- The effect of changing component size on vehicle mass and the corresponding variation in vehicle tractive resistance, power consumption and optimally sized powertrain solutions could be explored.
Author Contributions
Funding

Institutional Review Board Statement
Informed Consent Statement
Data Availability Statement
Acknowledgments
Conflicts of Interest
Abbreviations
| APSO | Accelerated Particle Swarm Optimisation |
| A-ECMS | Adaptive Equivalent Consumption minimisation Strategy |
| BEV | Battery Electric Vehicle |
| Carbon Dioxide | |
| CNG | Compressed Natural Gas |
| CAPSO | Chaos-enhanced Accelerated Particle Swarm optimisation |
| ECMS | Equivalent Consumption Minimisation Strategy |
| EU | European Union |
| eDrive | Electric Drive |
| EM | Electric Machine |
| FCEV | Fuel Cell Electric Vehicle |
| GHG | Green House Gases |
| HD | Heavy-Duty |
| HVO | Hydrotreated Vegetable Oil |
| HVAC | Heat, Ventilation and Air conditioning |
| HEV | Hybrid Electric Vehicle |
| HV | High Voltage |
| ICE | Internal Combustion Engine |
| LV | Low Voltage |
| Nitrous Oxide | |
| PMP | Pontryagin’s Minimisation Principle |
| PSO | Particle Swarm Optimisation |
| Powertrain lifetime carbon dioxide emissions | |
| Powertrain Total Cost of Ownership | |
| pCAPEX | Powertrain Capital Expenditure |
| pOPEX | Powertrain Operating Expenditure |
| S-HEV | Series Hybrid Electric Vehicle |
| SoC | State of Charge |
| TCO | Total Cost of Ownership |
| TTW | Tank To Wheel |
| VECTO | Vehicle Energy Consumption calculation TOol |
| WTW | Well To Wheel |
| WTT | Well To Tank |
| ZUEZ | Zero Urban Emission Zone |
Appendix A. Optmised Gear Shifting Based on eDrive Loss Minimisation

References
- European Commission. Reducing CO2 Emissions from Heavy-Duty Vehicles. Available online: https://ec.europa.eu/clima/eu-action/transport-emissions/road-transport-reducing-co2-emissions-vehicles/reducing-co2-emissions-heavy-duty-vehicles_en#ecl-inpage-530 (accessed on 18 September 2022).
- European Commission. Regulation (EU) 2019/1242 Setting CO2 Emission Performance Standards for New Heavy-Duty Vehicles and Amending Regulations (EC) No 595/2009 and(EU)2018/956 of the European Parliament and of the Council and Council Directive 96/53/EC. 2019. Available online: http://data.europa.eu/eli/reg/2019/1242/oj (accessed on 18 September 2022).
- Clean Technica. Green Trucking Watershed Moment As EU Adopts New Tolling Rules. Available online: https://cleantechnica.com/2022/02/17/green-trucking-watershed-moment-as-eu-adopts-new-tolling-rules/amp/ (accessed on 18 September 2022).
- Verbruggen, F.; Hoekstra, A.; Hofman, T. Evaluation of the state-of-the-art of full-electric medium and heavy-duty trucks. In Proceedings of the 31st International Electric Vehicle Symposium and Exhibition, EVS 2018 and International Electric Vehicle Technology Conference 2018, EVTeC 2018, Kobe, Japan, 30 September–10 October 2018. [Google Scholar]
- Wilkins, S. Challenges and Opportunities for Highly Electrified Heavy Duty Vehicles. 2020. Available online: https://ec.europa.eu/jrc/sites/jrcsh/files/steven_wilkins_challenges_and_opportunities_for_highly_electrified_heavy_duty_vehicles_public.pdf (accessed on 1 April 2022).
- Gao, Z.; LaClair, T.J.; Smith, D.E.; Daw, C.S. Exploring Fuel-Saving Potential of Long-Haul Truck Hybridization. Transp. Res. Rec. 2015, 2502, 99–107. [Google Scholar] [CrossRef]
- Rupp, M.; Schulze, S.; Kuperjans, I. Comparative Life Cycle Analysis of Conventional and Hybrid Heavy-Duty Trucks. World Electr. Veh. J. 2018, 9, 33. [Google Scholar] [CrossRef]
- Hulkkonen, T.; Tilli, A.; Erkkilä, K.; Nylund, N.O.; Mikkonen, S.; Saikkonen, P.; Makinen, R.; Amberla, A. Emission performance of paraffinic HVO diesel fuel in heavy duty vehicles. In Proceedings of the SAE International Powertrains, Fuels and Lubricants Meeting, Kyoto, Japan, 30 August–2 September 2011. [Google Scholar] [CrossRef]
- Aatola, H.; Larmi, M.; Sarjovaara, T.; Mikkonen, S. Hydrotreated Vegetable Oil (HVO) as a Renewable Diesel Fuel: Trade-off between NOx, Particulate Emission, and Fuel Consumption of a Heavy Duty Engine. SAE Int. J. Engines 2008, 1, 1251–1262. [Google Scholar] [CrossRef]
- Pourabdollah, M.; Murgovski, N.; Grauers, A.; Egardt, B. Optimal Sizing of a Parallel PHEV Powertrain. IEEE Trans. Veh. Technol. 2013, 62, 2469–2480. [Google Scholar] [CrossRef]
- Nüesch, T.; Ott, T.; Ebbesen, S.; Guzzella, L. Cost and fuel-optimal selection of HEV topologies using Particle Swarm Optimization and Dynamic Programming. In Proceedings of the 2012 American Control Conference (ACC), Montreal, QC, Canada, 27–29 June 2012; pp. 1302–1307. [Google Scholar] [CrossRef]
- Uniresearch. h2020-LONGRUN Homepage. Available online: https://h2020-longrun.eu/ (accessed on 18 September 2022).
- Spano, M.; Anselma, P.G.; Misul, D.A.; Belingardi, G. Exploitation of a Particle Swarm Optimization Algorithm for Designing a Lightweight Parallel Hybrid Electric Vehicle. Appl. Sci. 2021, 11, 6833. [Google Scholar] [CrossRef]
- Kim, K.; Kim, N.; Jeong, J.; Min, S.; Yang, H.; Vijayagopal, R.; Rousseau, A.; Cha, S.W. A Component-Sizing Methodology for a Hybrid Electric Vehicle Using an Optimization Algorithm. Energies 2021, 14, 3147. [Google Scholar] [CrossRef]
- Verbruggen, F.J.R.; Silvas, E.; Hofman, T. Electric Powertrain Topology Analysis and Design for Heavy-Duty Trucks. Energies 2020, 13, 2434. [Google Scholar] [CrossRef]
- Landersheim, V.; Tran, D.D.; Pham, T.; Manushyna, D.; Geury, T.; Wilkins, S.; Hegazy, O. Emissions and Total Cost of Ownership Assessment of Hybrid Propulsion Concepts for Bus Transport with CNG or Diesel Engine. In Proceedings of the 2021 Sixteenth International Conference on Ecological Vehicles and Renewable Energies (EVER), Monte-Carlo, Monaco, 5–7 May 2021; pp. 1–12. [Google Scholar] [CrossRef]
- Tran, D.D.; Hegazy, O.; Van Mierlo, J.; Klüppel Smijtink, R.; Hellgren, J.; Lindgarde, O.; Pham, T.; Wilkins, S. Modeling and Co-design Optimization for Heavy Duty Trucks. In Proceedings of the 31st International Electric Vehicles Symposium and Exhibition, EVS31, Kobe, Japan, 1–3 October 2018. [Google Scholar]
- Pourabdollah, M.; Egardt, B.; Murgovski, N.; Grauers, A. Convex Optimization Methods for Powertrain Sizing of Electrified Vehicles by Using Different Levels of Modeling Details. IEEE Trans. Veh. Technol. 2018, 67, 1881–1893. [Google Scholar] [CrossRef]
- Junco, S.; Orbaiz, P.; Nigro, N.; Carignano, M. Hybridisation effect on operating costs and optimal sizing of components for hybrid electric vehicles. Int. J. Simul. Process Model. 2017, 12, 221. [Google Scholar] [CrossRef]
- Murgovski, N.; Johannesson, L.; Sjöberg, J.; Egardt, B. Component sizing of a plug-in hybrid electric powertrain via convex optimization. Mechatronics 2012, 22, 106–120. [Google Scholar] [CrossRef]
- Zhou, Q.; Zhang, W.; Cash, S.; Olatunbosun, O.; Xu, H.; Lu, G. Intelligent sizing of a series hybrid electric power-train system based on Chaos-enhanced accelerated particle swarm optimization. Appl. Energy 2017, 189, 588–601. [Google Scholar] [CrossRef]
- Fontaras, G.; Rexeis, M.; Dilara, P.; Hausberger, S.; Anagnostopoulos, K. The Development of a Simulation Tool for Monitoring Heavy-Duty Vehicle CO2 Emissions and Fuel Consumption in Europe. In Proceedings of the 11th International Conference on Engines & Vehicles, Capri, Italy, 12–16 September 2013. [Google Scholar] [CrossRef]
- European Commission. Vehicle Energy Consumption Calculation TOol—VECTO, Climate Action. Available online: https://ec.europa.eu/clima/policies/transport/vehicles/vecto_en (accessed on 18 September 2022).
- Bhardwaj, O.P.; Holderbaum, B.; Omari, A.; Pischinger, S.; Nuottimäki, J.; Honkanen, M. Improving Engine Efficiency and Emission Reduction Potential of HVO by Fuel-Specific Engine Calibration in Modern Passenger Car Diesel Applications. SAE Int. J. Fuels Lubr. 2017, 10, 756–767. [Google Scholar]
- Staffel, L. The Energy and Fuel Data Sheet. 2011. Available online: https://www.claverton-energy.com/wordpress/wp-content/uploads/2012/08/the_energy_and_fuel_data_sheet1.pdf (accessed on 18 September 2022).
- European Commission. Technical Guidelines for the Preparation of Applications for the Approval of Innovative Technologies pursuant to Regulation (EC) No 443/2009 and Regulation (EU) No 510/2011. 2015. Available online: https://circabc.europa.eu/sd/a/bbf05038-a907-4298-83ee-3d6cce3b4231/technical (accessed on 18 September 2022).
- Engman, A.; Gauthier, Q.; Hartikka, T. Neste Renewable Diesel Handbook. 2020. Available online: https://www.neste.com/sites/default/files/attachments/neste_renewable_diesel_handbook.pdf (accessed on 18 September 2022).
- Schmied, M.; Knörr, W. Calculating GHG Emissions for Freight Forwarding and Logistics Services in Accordance with EN 16258. 2012. Available online: https://www.clecat.org/news/press-releases/clecat-publishes-guide-on-calculating-ghg-emission (accessed on 18 September 2022).
- European Commission; Joint Research Centre; Prussi, M.; Yugo, M.; De Prada, L.; Padella, M.; Edwards, R.; Lonza, L. JEC Well-to-Tank Report V5: JEC Well-to-Wheels Analysis: Well-to-Wheels Analysis of Future Automotive Fuels and Powertrains in the European Context; Publications Office: Luxembourgish, 2020. [Google Scholar] [CrossRef]
- Flach, B.; Lieberz, S.; Bolla, S. EU Biofuels Annual Report 2019. 2019. Available online: https://apps.fas.usda.gov/newgainapi/api/report/ (accessed on 1 April 2022).
- Nguyen, C.T.; Walker, P.D.; Zhou, S.; Zhang, N. Optimal sizing and energy management of an electric vehicle powertrain equipped with two motors and multi-gear ratios. Mech. Mach. Theory 2022, 167, 104513. [Google Scholar] [CrossRef]
- Verbruggen, F.; Rangarajan, V.; Hofman, T. Powertrain design optimization for a battery electric heavy-duty truck. In Proceedings of the 2019 American Control Conference (ACC), Philadelphia, PA, USA, 10–12 July 2019; pp. 1488–1493. [Google Scholar] [CrossRef]
- Lee, T.; Kim, Y.; Nam, K. Loss minimizing gear shifting algorithm based on optimal current sets for IPMSM. In Proceedings of the 2017 IEEE Transportation Electrification Conference and Expo (ITEC), Chicago, IL, USA, 22–24 June 2017; pp. 135–140. [Google Scholar] [CrossRef]
- Pathak, A.; Sethuraman, G.; Krapf, S.; Ongel, A.; Lienkamp, M. Exploration of Optimal Powertrain Design Using Realistic Load Profiles. World Electr. Veh. J. 2019, 10, 56. [Google Scholar] [CrossRef] [Green Version]
- Pardhi, S. Simulation and Analysis of 48v Mild Hybrid, CVT, and Upcoming Powertrain Control Strategies for Increasing Light Vehicle Fuel Efficiency. Int. J. Eng. Res. Technol. (IJERT) 2020, 9, 620–634. [Google Scholar] [CrossRef]
- Vafaeipour, M.; El Baghdadi, M.; Verbelen, F.; Sergeant, P.; Van Mierlo, J.; Hegazy, O. Experimental Implementation of Power-Split Control Strategies in a Versatile Hardware-in-the-Loop Laboratory Test Bench for Hybrid Electric Vehicles Equipped with Electrical Variable Transmission. Appl. Sci. 2020, 10, 4253. [Google Scholar] [CrossRef]
- Shabbir, W. Control Strategies for Series Hybrid Electric Vehicles. Imperial College London: Electrical and Electronic Engineering. Ph.D. Thesis, Imperial College London, London, UK, 2015. [Google Scholar] [CrossRef]
- Wang, J.; Wang, Q.N.; Wang, P.Y.; Zeng, X. The Development and Verification of a Novel ECMS of Hybrid Electric Bus. Math. Probl. Eng. 2014, 2014, 981845. [Google Scholar] [CrossRef]
- Paganelli, G.; Delprat, S.; Guerra, T.; Rimaux, J.; Santin, J. Equivalent consumption minimization strategy for parallel hybrid powertrains. In Proceedings of the Vehicular Technology Conference, IEEE 55th Vehicular Technology Conference, VTC Spring 2002 (Cat. No.02CH37367), Birmingham, AL, USA, 6–9 May 2002; Volume 4, pp. 2076–2081. [Google Scholar] [CrossRef]
- Nüesch, T.; Cerofolini, A.; Mancini, G.; Cavina, N.; Onder, C.; Guzzella, L. Equivalent Consumption Minimization Strategy for the Control of Real Driving NOx Emissions of a Diesel Hybrid Electric Vehicle. Energies 2014, 7, 3148–3178. [Google Scholar] [CrossRef]
- Tran, D.D.; Vafaeipour, M.; El Baghdadi, M.; Barrero, R.; Van Mierlo, J.; Hegazy, O. Thorough state-of-the-art analysis of electric and hybrid vehicle powertrains: Topologies and integrated energy management strategies. Renew. Sustain. Energy Rev. 2020, 119, 109596. [Google Scholar] [CrossRef]
- Sivertsson, M.; Sundström, C.; Eriksson, L. Adaptive Control of a Hybrid Powertrain with Map-based ECMS. IFAC Proc. Vol. 2011, 44, 2949–2954. [Google Scholar] [CrossRef]
- Rezaei, A.; Burl, J.; Zhou, B.; Rezaei, M. A New Real-Time Optimal Energy Management Strategy for Parallel Hybrid Electric Vehicles. IEEE Trans. Control. Syst. Technol. 2017, 830–837. [Google Scholar] [CrossRef]
- Zhang, F.; Xi, J.; Langari, R. Adaptive Equivalent Consumption Minimization Strategy for Hybrid Electric Vehicles. In Proceedings of the ASME 2010 Dynamic Systems and Control Conference, Gothenburg, Sweden, 19–22 June 2016; Volume 1. Available online: http://xxx.lanl.gov/abs/https://asmedigitalcollection.asme.org/DSCC/proceedings-pdf/DSCC2010/44175/499/2704009/499_1.pdf (accessed on 1 April 2022). [CrossRef] [Green Version]
- Ebbesen, S.; Dönitz, C.; Guzzella, L. Particle swarm optimisation for hybrid electric drive-train sizing. Int. J. Veh. Des. 2012, 58, 181–199. [Google Scholar] [CrossRef]
- Hegazy, O.; Van Mierlo, J. Particle Swarm Optimization for optimal powertrain component sizing and design of fuel cell hybrid electric vehicle. In Proceedings of the 2010 12th International Conference on Optimization of Electrical and Electronic Equipment, Brasov, Romania, 20–22 May 2010; pp. 601–609. [Google Scholar] [CrossRef]
- Kennedy, J.; Eberhart, R. Particle swarm optimization. In Proceedings of the ICNN’95—International Conference on Neural Networks, Perth, WA, USA, 27 November–1 December 1995; Volume 4, pp. 1942–1948. [Google Scholar] [CrossRef]
- Pereira, G. Particle Swarm Optimization. 2011. Available online: https://citeseerx.ist.psu.edu/viewdoc/download?doi=10.1.1.927.8361&rep=rep1&type=pdf (accessed on 18 September 2022).
- Li, Y.; Zhu, B.; Zhang, N.; Peng, H.; Chen, Y. Parameters optimization of two-speed powertrain of electric vehicle based on genetic algorithm. Adv. Mech. Eng. 2020, 12, 1687814020901652. [Google Scholar] [CrossRef]
- Naunheimer, H.; Bertsche, B.; Ryborz, J.; Novak, W. Automotive Transmissions; Springer: Berlin/Heidelberg, Germany, 2011. [Google Scholar] [CrossRef]
- Wernet, G.; Bauer, C.; Steubing, B.; Reinhard, J.; Moreno Ruiz, E.; Weidema, B. The ecoinvent database version 3 (Part I): Overview and methodology. Int. J. Life Cycle Assess. 2016, 21, 1218–1230. [Google Scholar] [CrossRef]
- Philippot, M.; Alvarez, G.; Ayerbe, E.; Van Mierlo, J.; Messagie, M. Eco-Efficiency of a Lithium-Ion Battery for Electric Vehicles: Influence of Manufacturing Country and Commodity Prices on GHG Emissions and Costs. Batteries 2019, 5, 23. [Google Scholar] [CrossRef]
- Lutsey, N.; Hall, D. Effects of Battery Manufacturing on Electric Vehicle Life-Cycle Greenhouse Gas Emissions. 2018. Available online: https://theicct.org/wp-content/uploads/2021/06/EV-life-cycle-GHG_ICCT-Briefing_09022018_vF.pdf (accessed on 18 September 2022).
- Wautrin, M.; Tran, D.; El Baghdadi, M.; Van Mierlo, J.; Hegazy, O. Co-design Approach and Optimization for Plug-In Hybrid Buses. Master’s Thesis, Faculty of Economic and Social Sciences and Solvay Business School Faculty of EngineeringElectrical Engineering and Power ElectronicsMobility, Logistics and Automotive Technology Research Centre, Ixelles, Belgium, 2019. Available online: https://researchportal.vub.be/en/studentTheses/co-design-approach-and-optimization-for-plug-in-hybridbuses (accessed on 4 August 2022).
- König, A.; Nicoletti, L.; Schröder, D.; Wolff, S.; Waclaw, A.; Lienkamp, M. An Overview of Parameter and Cost for Battery Electric Vehicles. World Electr. Veh. J. 2021, 12, 21. [Google Scholar] [CrossRef]
- Biofuel-Express. List Prices from Biofuel Express. Available online: https://www.biofuel-express.com/en/hvo-renewable-diesel-ensures-fresh-food-and-cleaner-air-to-the-cities/ (accessed on 18 September 2022).
- European Commission; Directorate-General for Mobility and Transport; Maniatis, K.; Landälv, I.; Heuvel, E.; Kalligeros, S.; Waldheim, L. Building up the Future, Cost of Biofuel: Sub Group on Advanced Biofuels: Sustainable Transport Forum; Publications Office: Luxembourgish, 2018. [Google Scholar] [CrossRef]
- FuelsEurope. Fuel Price Breakdown. Available online: https://www.fuelseurope.eu/knowledge/refining-in-europe/economics-of-refining/fuel-price-breakdown/ (accessed on 18 September 2022).
- Guzzella, L.; Sciarretta, A. Vehicle Propulsion Systems: Introduction to Modeling and Optimization; Springer: Berlin/Heidelberg, Germany, 2007. [Google Scholar] [CrossRef]
- Gaines, L.; Rask, E.; Keller, G. Which Is Greener: Idle, or Stop and Restart? Comparing Fuel Use and Emissions for Short Passenger-Car Stops. Available online: https://www.anl.gov/taps/idle-reduction-publications (accessed on 18 September 2022).
- Fonseca, N.; Casanova, J.; Valdés, M. Influence of the stop/start system on CO2 emissions of a diesel vehicle in urban traffic. Transp. Res. Part D Transp. Environ. 2011, 16, 194–200. [Google Scholar] [CrossRef] [Green Version]


| Specification | Value |
|---|---|
| Acceleration 0–100 km/h (s) | 45 |
| Gradeability from standstill (%) | 30 |
| Gradeability at 15 km/h (%) | 13 |
| Gradeability at 70 km/h (%) | 3 |
| Gradeability at 100 km/h (%) | 2 |
| Maximum speed (km/h) | 100 (80 in ZUEZ) |
| Specification | Value |
|---|---|
| Vehicle mass (kg) | 19,500 |
| Drag coefficient × front area Cd.A (-m) | 4.35 |
| No of wheels (-) | 6 |
| Wheel radius (m) | 0.51 |
| Wheel rotational inertia (kgm) | 15.5 |
| Wheel rolling resistance coefficient (-) | 0.0056 |
| Nominal HV battery, DC link voltage (V) | 650 |
| Differential torque drop (Nm) | VECTO map |
| Differential rotational inertia (kgm) | 1.25 |
| Differential reduction ratio (-) | 2.71:1 |
| Gearbox inertia (kgm) | 1.45 |
| Cell type (-) | Li-ion NMC |
| Cells in series (-) | 180 |
| Cell charge capacity (Ah) | 50 |
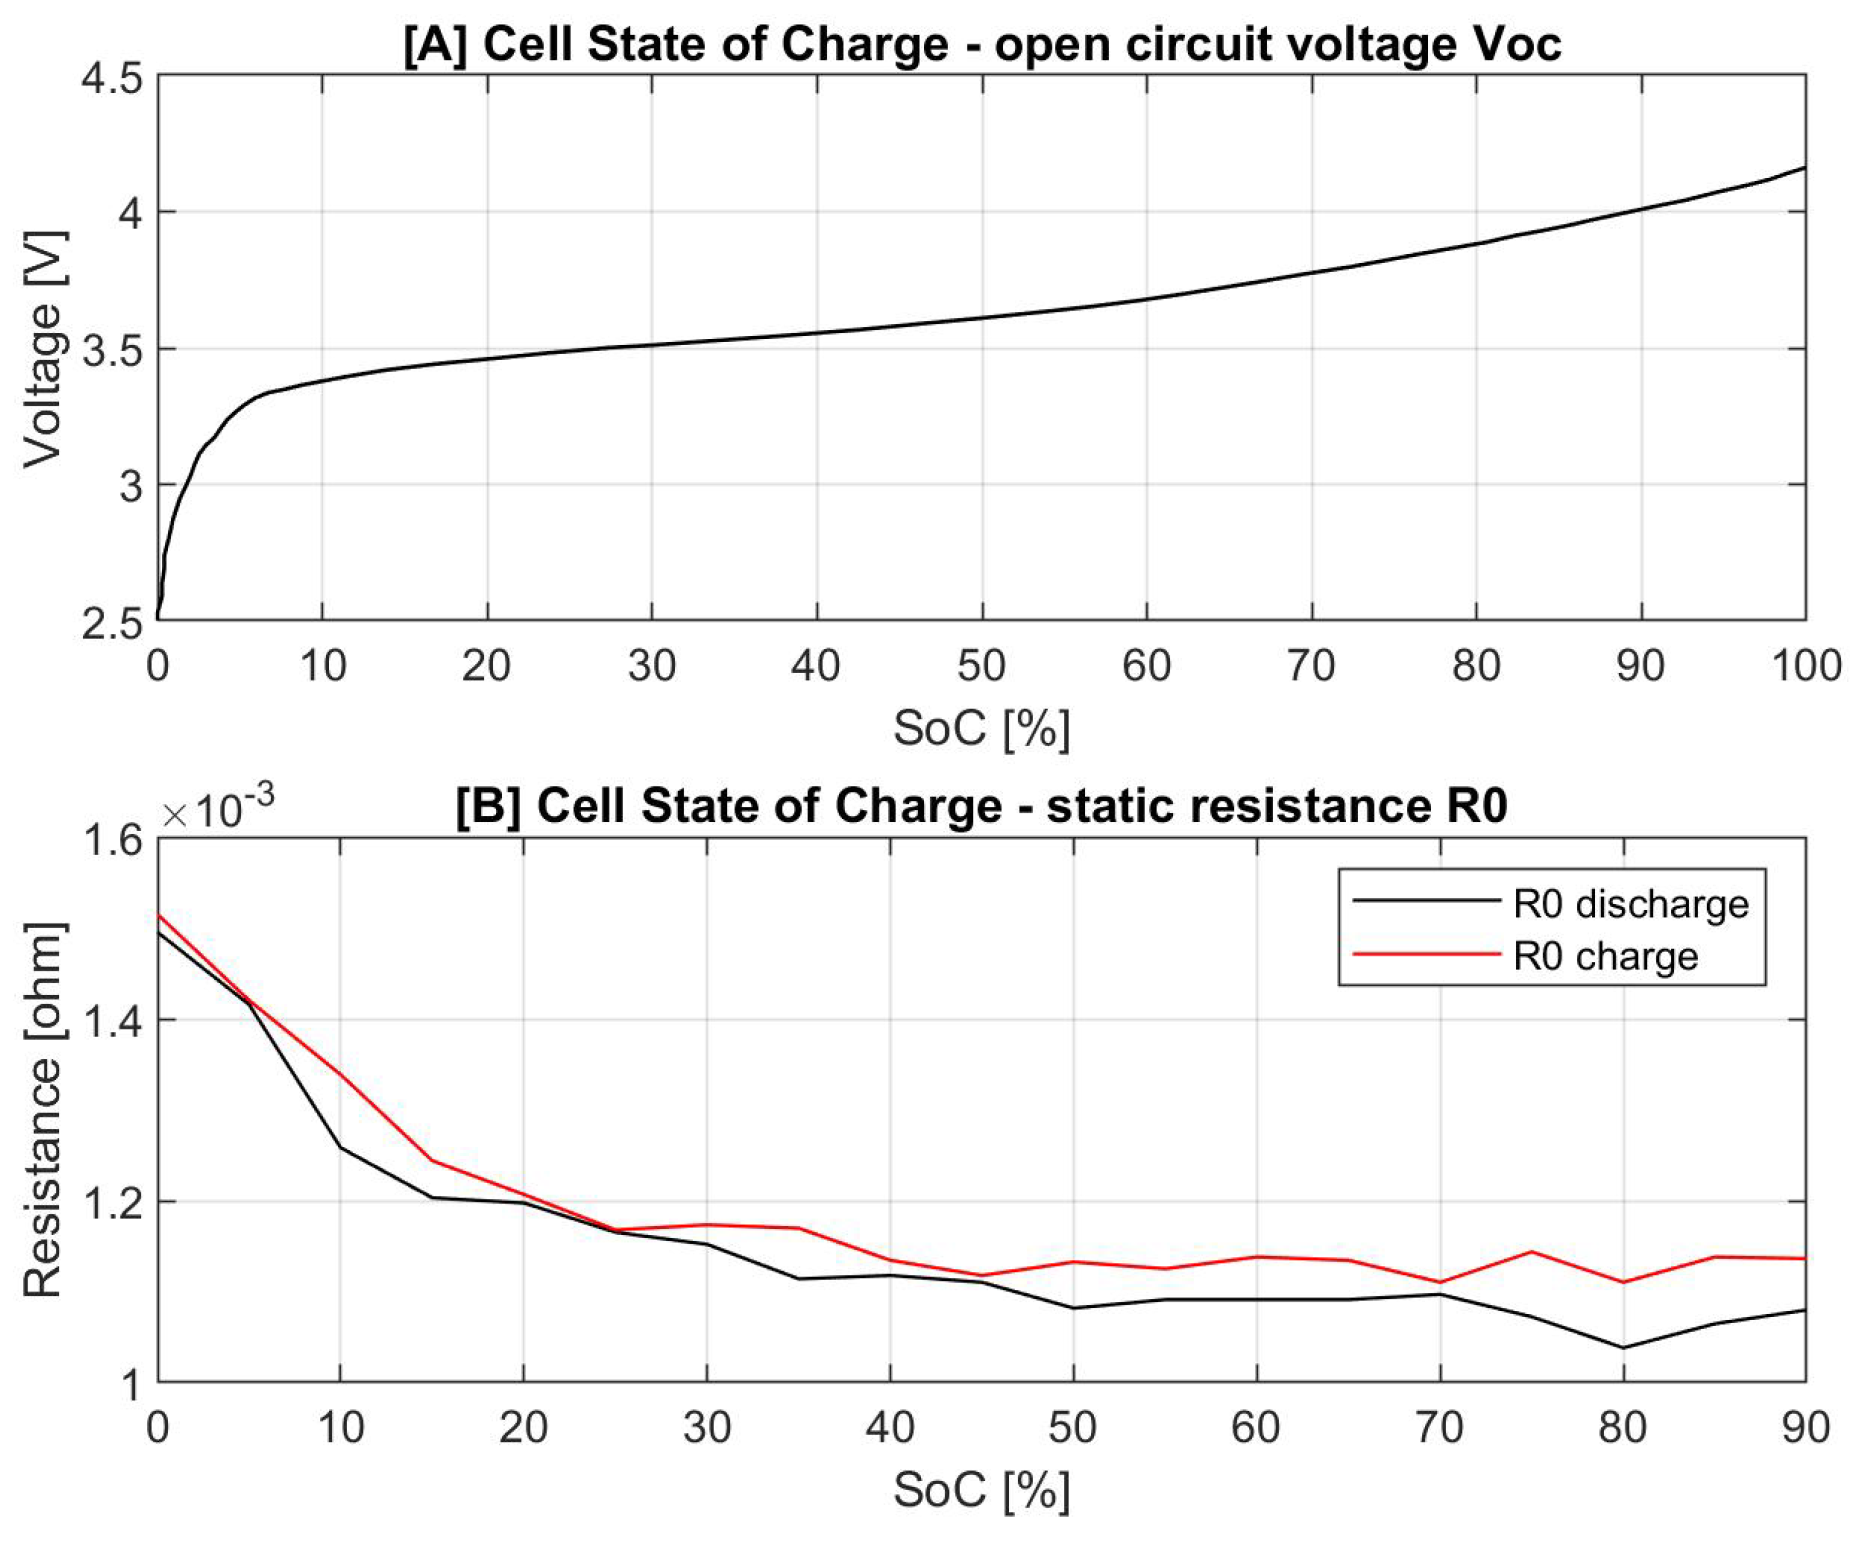
| Cell open circuit voltage (V) | Figure 1 |
| Cell internal resistance () | Figure 1 |
| Cabin volume (m) | 50 |
| No of passengers (-) | 60 |
| HVAC recirculation rate (%) | 90 |
| HVAC blower flow rate (m/s) | 0.75 |
| Property | Diesel | HVO |
|---|---|---|
| Density (g/L) | 837 [25,26] | 781 [9,27] |
| Lower heating value (MJ/kg) | 42.75 [25,28] | 43.81 [9,27] |
| Production WTT (gCO/L) | 762.15 [29] | 1094.9 [29,30] |
| Consumption TTW (gCO/L) | 2640 [26] | 0 |
| Component | Lower Bound | Upper Bound |
|---|---|---|
| ICE-range extender (kW) | 120 | 480 |
| battery (kWh) | 160 | 240 |
| eDrive (kW) | 240 | 480 |
| Gear ratio 1 (-) | 17.269:1 | 22:1 |
| Gear ratio 2 (-) | 7:1 | 10:1 |
| Gear ratio 3 (-) | 4:1 | 5.055:1 |
| Component | Carbon Footprint (gCO/-) | Power/Weight Ratio (kW/kg) |
|---|---|---|
| ICE (gCO/kg) | 7778 [51] | 0.92 |
| eDrive (gCO/kg) | 8462 [51] | 2 |
| Generator (gCO/kg) | 8462 [51] | 2 |
| Battery (gCO/kWh) | 80,000 [52,53] | - |
| Parameter Cost | Value |
|---|---|
| ICE production (EUR/kW) | 90 [17] |
| HV battery production (EUR/kWh) | 200 [52,55] |
| eDrive production (EUR/kW) | 150 [16] |
| Generator production (EUR/kW) | 150 [16] |
| Diesel production (EUR/L) | 1.54 [56,57,58] |
| HVO production (EUR/L) | 1.81 [56,57] |
Publisher’s Note: MDPI stays neutral with regard to jurisdictional claims in published maps and institutional affiliations. |
© 2022 by the authors. Licensee MDPI, Basel, Switzerland. This article is an open access article distributed under the terms and conditions of the Creative Commons Attribution (CC BY) license (https://creativecommons.org/licenses/by/4.0/).
Share and Cite
Pardhi, S.; El Baghdadi, M.; Hulsebos, O.; Hegazy, O. Optimal Powertrain Sizing of Series Hybrid Coach Running on Diesel and HVO for Lifetime Carbon Footprint and Total Cost Minimisation. Energies 2022, 15, 6974. https://doi.org/10.3390/en15196974
Pardhi S, El Baghdadi M, Hulsebos O, Hegazy O. Optimal Powertrain Sizing of Series Hybrid Coach Running on Diesel and HVO for Lifetime Carbon Footprint and Total Cost Minimisation. Energies. 2022; 15(19):6974. https://doi.org/10.3390/en15196974
Chicago/Turabian StylePardhi, Shantanu, Mohamed El Baghdadi, Oswin Hulsebos, and Omar Hegazy. 2022. "Optimal Powertrain Sizing of Series Hybrid Coach Running on Diesel and HVO for Lifetime Carbon Footprint and Total Cost Minimisation" Energies 15, no. 19: 6974. https://doi.org/10.3390/en15196974