Article

Indoor Air CO2 Sensors and Possible Uncertainties of Measurements: A Review and an Example of Practical Measurements

by
Anatolijs Borodinecs
*,
Arturs Palcikovskis
and
Vladislavs Jacnevs
Department of Heat Engineering and Technology, Riga Technical University, Kipsalas Street 6 A, 1048 Riga, Latvia
*
Author to whom correspondence should be addressed.
Energies 2022, 15(19), 6961; https://doi.org/10.3390/en15196961
Submission received: 21 August 2022 / Revised: 20 September 2022 / Accepted: 21 September 2022 / Published: 22 September 2022

Abstract

:
Since the COVID-19 outbreak, special attention has been paid to proper ventilation and building management systems. The indoor air CO2 concentration level is still used as an effective indicator to evaluate indoor air quality. Many different sensors have appeared on the market in the last two years. However, calibration procedures and guidance on proper installation have not been well described by manufacturers. The research method is based on a review of technical parameters. The practical measurements of CO2 concentration were taken using different sensors. For these purposes three different premises were selected. It was found that CO2 measurement failure happened in residential buildings without mechanical ventilation. Meanwhile, in well ventilated buildings all sensors have shown similar results and the difference between sensors located in different zones was minimal.

1. Introduction

Indoor air quality monitoring has become a very important subject since the mid 1970s of the last century, when the first energy crisis hit Europe and EU directives aimed at improving energy efficiency in the building sector [1]. The energy to keep an optimal ventilation and thermal comfort plays a crucial role in overall energy balance [2,3,4]. Since then, particular attention has been paid to building energy consumption and subsequently to buildings airtightness. Ventilation plays an important role in all climatic zones [5,6,7] and must be properly operated to ensure buildings’ energy efficiency as well as optimal indoor air quality and thermal comfort. Several studies have reported a significant decrease in indoor air quality over the past decades. On the contrary, the severe acute respiratory syndrome coronavirus-2/coronavirus disease 2019 (COVID-19) pandemic has highlighted the importance of maintaining a sufficient indoor air exchange rate [8]. The CO2 is being commonly used as a general parameter, which characterizes the level of indoor pollution [9,10,11]. Control of ventilation and air condition systems based on CO2 monitoring have been reported as one of the most energy efficient and economically viable solutions [12,13]. It allows for keeping the balance between energy consumption and indoor air quality [3,14,15]. For example, optimization of ventilation systems in a single family house can ensure a reduction of energy consumption by 38% in Latvian climatic conditions [16]. However, reliability of modern CO2 sensors is still under investigation. In addition, ASHRAE’s Position Document on Indoor Carbon Dioxide [17] concludes that CO2 concentration does not provide general information on indoor air quality, yet it can be a useful tool in the assessment of indoor air quality if users understand the limitations of the use of this method. An important step to understand CO2 monitoring and its integration into Building Information Modeling (BIM) is to select proper sensors and position them with respect to the human occupancy zones.
In addition, to decreasing the spread of infections, a solution is needed to measure the density of people per m2. It can be accomplished with the help of computer vision [18]. The use of cameras and computer vision will also allow for controlling the number of people in a closed area room, thus obeying pandemic legislation, as well as will training the computer vision to detect whether masks are being worn in the office space. The safety guidelines suggest maintaining distance between people when performing daily duties [19]. The usage of beacons would give a precise understanding of the placement of employees and would provide notification if the distance between them was less than 2 m.
The COVID-19 pandemic caused by the SARS-CoV-2 virus reached Latvia in March 2020, with an average of 7.4 new cases daily and an average 14-day cumulative incidence of 3.1 ± 4.5 until late September 2020 [20]. In the last two years, the outbreak of novel coronavirus SARS-CoV-2 has posed a significant effect on global health having a negative impact also on social and economic fields in different parts of the world, including Latvia [21].
The paper describes the workplace specific COVID-19 risks and identifies required sensing capabilities to assess and to minimize these risks. One of the distinctive features of the paper is combination of various Internet of Things (IoT) sensing. While many of the solutions rely on massive testing, wearable devices, and other intrusive methods or do not provide timely identification of threats and response [22,23,24,25], this study proposes to combine various sensing technologies to achieve timely and non-intrusive detection of infection threats and to enact suitable response mechanisms. The paper is structured as follows: Section 2 presents the air quality sensors review, calibration specifics of commercially available sensors, including details of the operation of ventilation systems and sensors placement. Section 3 presents the results of the field tests of three different buildings. Section 4 discusses the results, and Section 5 summarizes the paper results.
The preventive and prescriptive activities are triggered on the basis of monitoring performed using IoT technologies. The IoT technologies considered are air quality monitoring sensors, cameras, and Bluetooth beacons.
This article focuses on the analysis of different CO2 sensors and its measurements in the room in real occupancy conditions.

2. Materials and Methods

The study concerns identification of required data sets, sensors needed for data gathering and data retrieval methods to obtain comprehensive information about the work environment from the COVID-19 perspective. The present work aims to analyze air quality monitoring sensor models to compare CO2 measurements taken by different sensors and to address their location and data exchange techniques. The necessary actions will also be identified to improve workplace conditions. These include integration with building management systems to adjust ventilation according to the number of people and risk level, adaptive planning, and reactive notifications to employees.

2.1. Air Quality Sensors

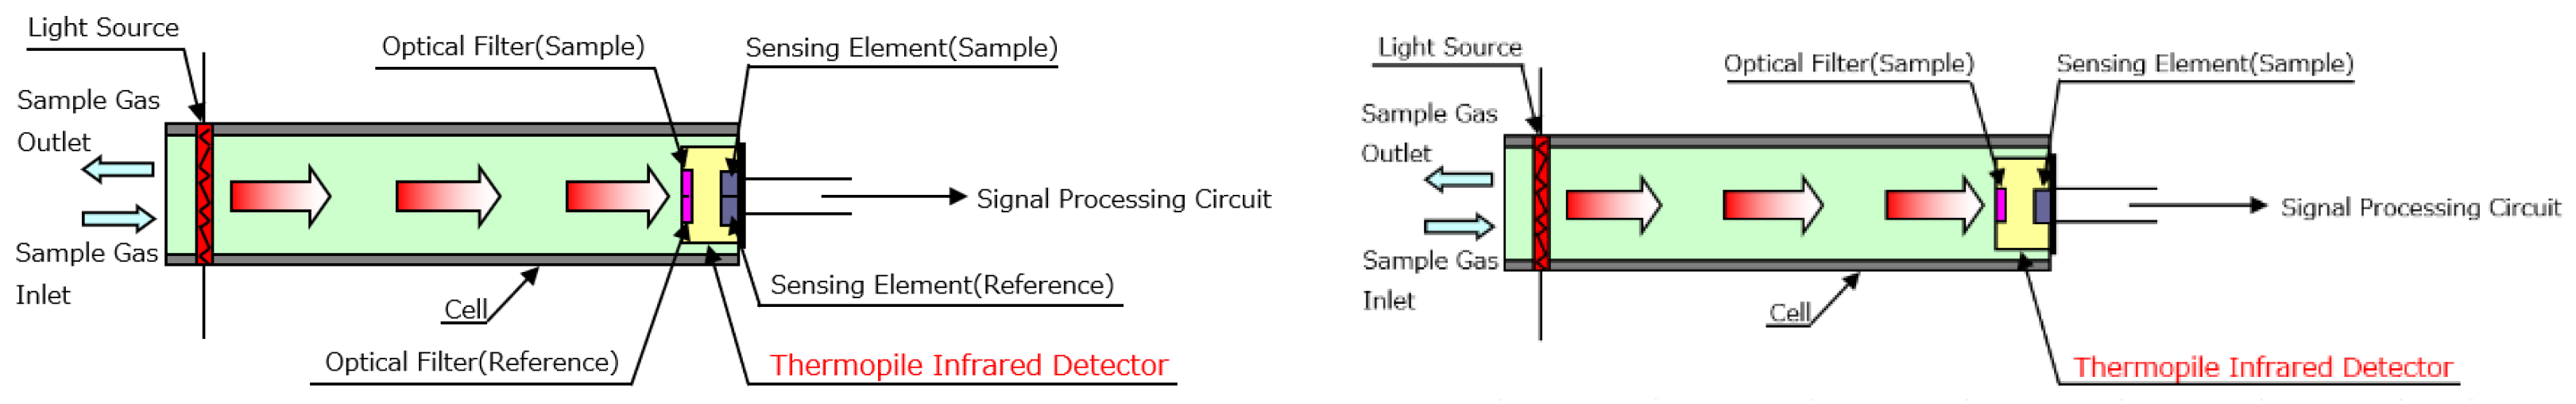
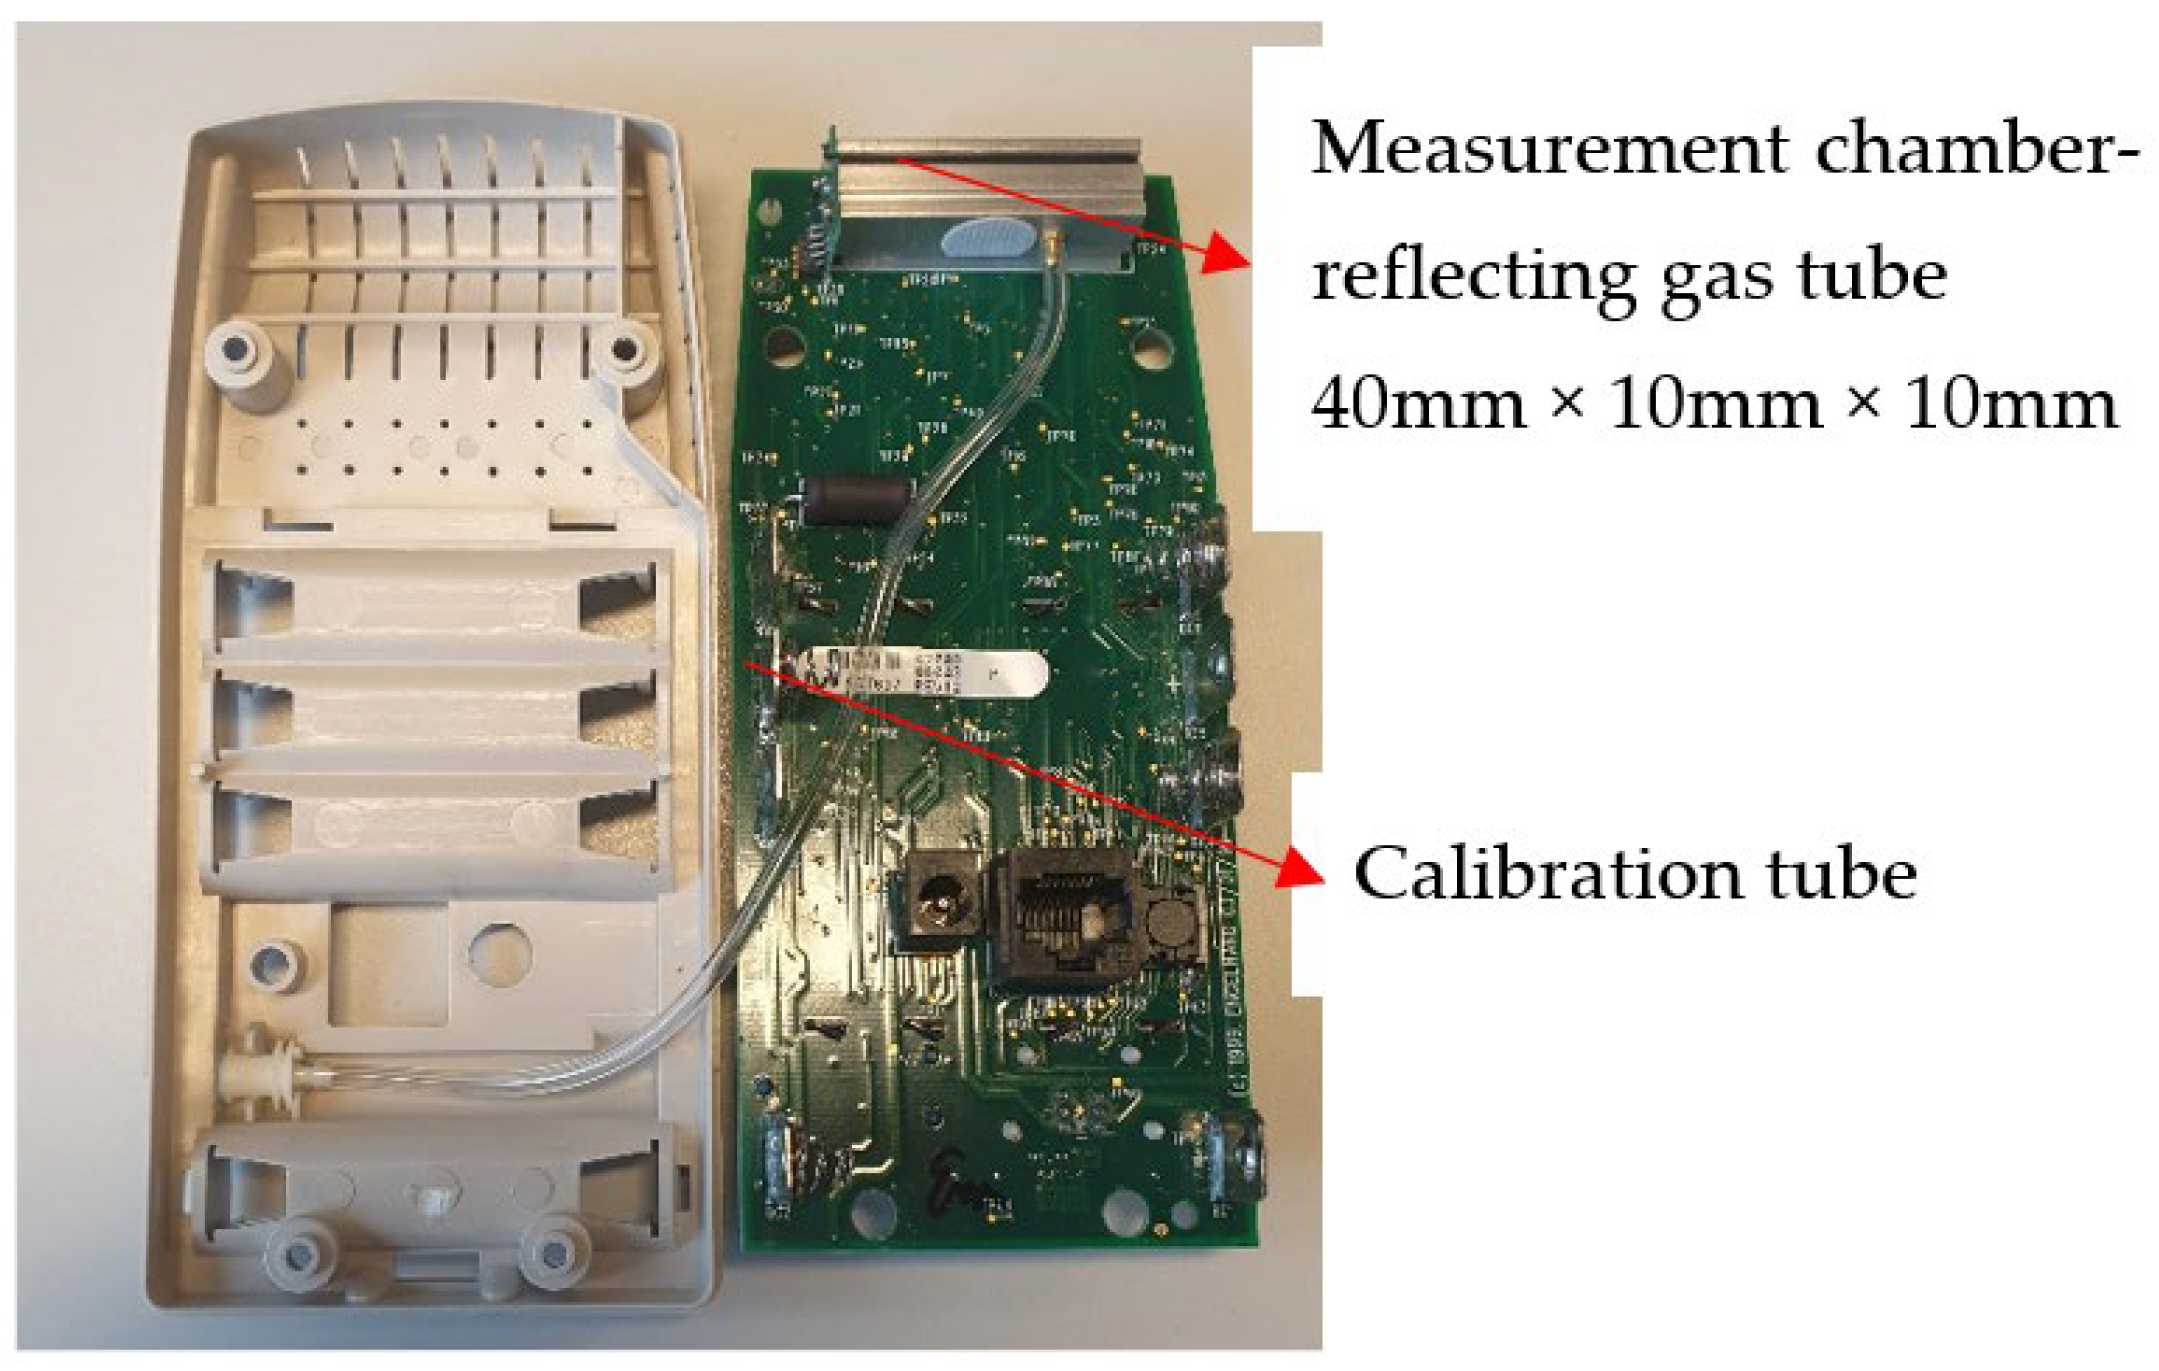
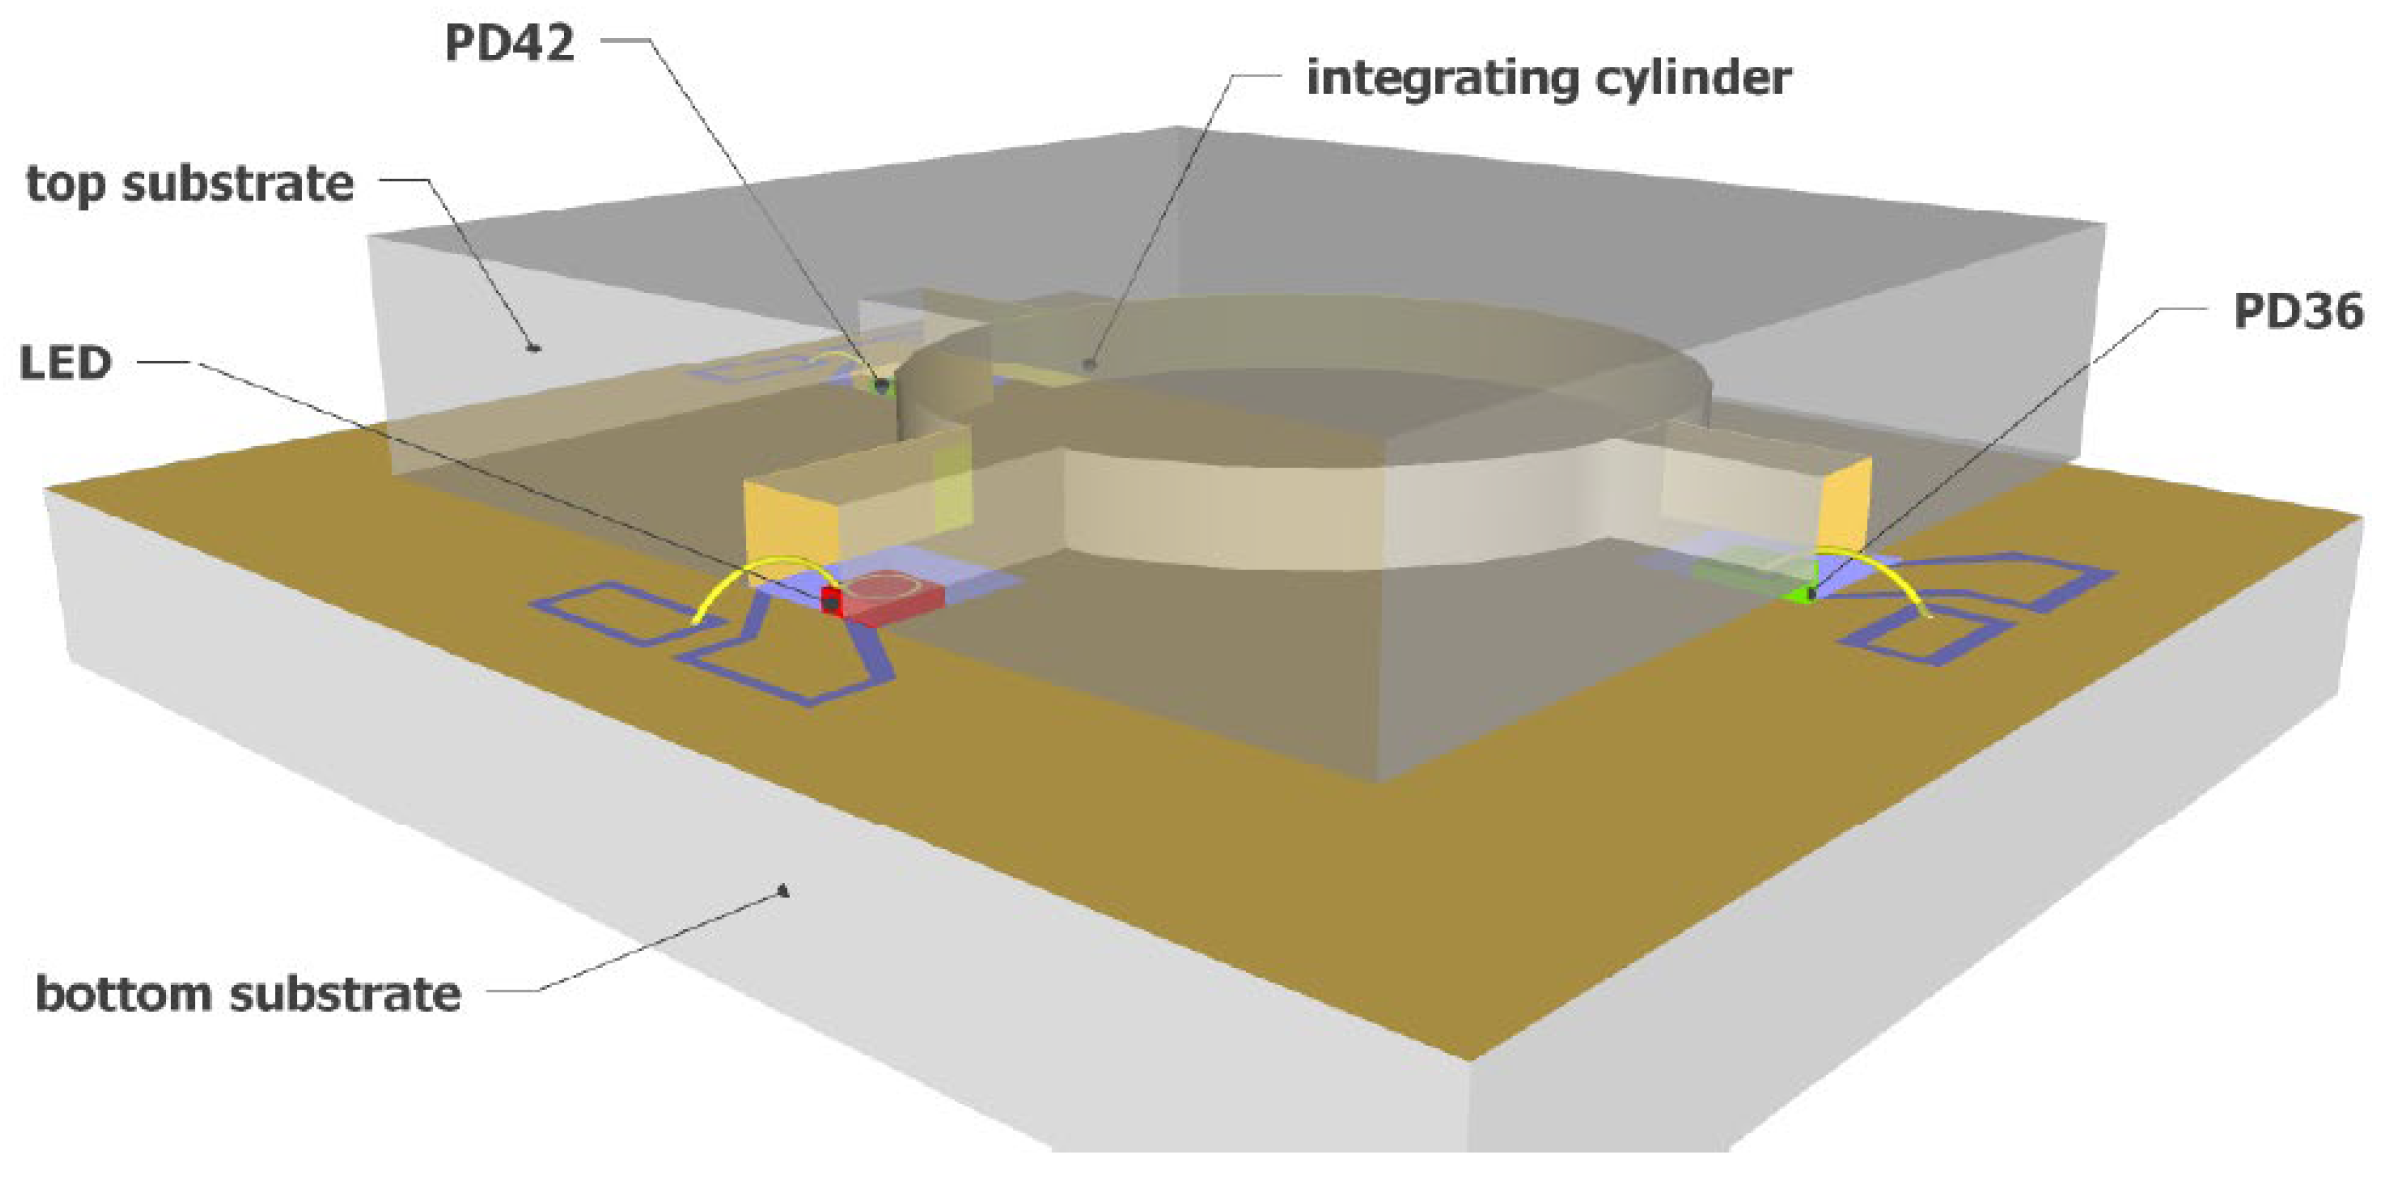
2.1.1. Review of Existing NDIR Sensors

There are four main types of CO2 sensors:
  • Non-dispersive infrared (NDIR).
  • Electrochemical.
  • Semiconductor.
  • Catalytic combustion.
Semiconductor sensors can be used to measure the concentration of greenhouse gases [26]. Such sensors allow for a wide application for different needs. Some types of electrochemical Li+-garnet-based sensors can reach a one minute response time at low temperatures in the surrounding environment to track 400–4000 ppm levels of CO2 [27].
Catalytic combustion CO2 sensors uses the catalyst coating on the surface of a specific type of resistor [28]. The measurements are based on gas catalytically burning on the surface.
The most common principles for CO2 sensors are infrared gas sensors (NDIR) (Figure 1) and chemical gas sensors. The main benefit of modern NDIR sensors compared to older sensors is a lower energy consumption. According to the existing data, modern sensors consume only 3 mW of power, while typical incandescent IR sensors consume between 50 to 200 mW [29]. CO2 sensors based on rigid ceramic materials feature the highest energy consumption-up to 200 W [30]. New sensors allow for long term operation using typical AA type batteries. For example, the operation of a Telaire 7001 IAQ monitoring sensor (Figure 2) on four AA batteries was approximately 70 h. Some professional sensors have a special calibration probe, while household sensors are calibrated mainly by using general assumption on outdoor air CO2 concentration.
Dual light sensors are characterized by little changed value even in long-term use and are suitable for the IAQ monitoring and installation in building management systems. Single light wavelength sensors are relatively cheap but can have a large deviation when in long-term use.
Previously, widely used sensors used a reflecting gas tube, which required an extra installation place. Alternative solutions that allow for the reduction of the overall size of sensors propose to use fully integrated on-chip sensors, which use an integrating cylinder as a sensing cavity (see Figure 3).
Before mentioned, CO2 sensor has a footprint of ~7 mm2 with a radius = 2.6 mm. Equivalent optical path length is equal to 3.4 cm.
Table 1, Table 2 and Table 3 present a brief summary of working parameters of commercially available CO2 sensors. Two types of sensors were considered for the analysis-“ready to use” and modules. Modules can be integrated in any shell according to the chosen design approach.
“Ready to use” sensors means that they are ready to make measurements and record data, and they have the necessary control interface, while modules are used by final product producers and are integrated in the final product.
As can be seen, all commercially available modern sensors use the NDIR technology. However, it should be mentioned that precision of CO2 measurements of older models were strictly dependent on air temperature [33,34]. Recent study [35] has shown good performance of low-cost sensors. However, the performance of used sensors was not compared to calibrated sensors.
Other studies made a comparison of wireless air quality sensors [36,37]. The results have shown that the analyzed sensors performed satisfactorily in terms of temperature measurement. It was concluded that significant improvements in CO2 concentration measurement should be done before using them as an HVAC unit management signal. It should be noted that the reviewed study focuses on wireless sensors analysis.

2.1.2. Calibration Specifics of Commercially Available Sensors

Calibration specifics of the previously described air quality sensors were summarized in Table 4 “Ready to use sensors” and in Table 5 “Modules”.
As can be seen, almost all analyzed sensors use the lowest measurement as a reference for the outdoor air CO2 concentration. Some of them require to be brought outdoors and to be calibrated. In general, such calibration could be accepted. However, such calibration should be done with respect to the surrounding environment. Nearby traffic specifics and wind direction could affect the precision of calibration.

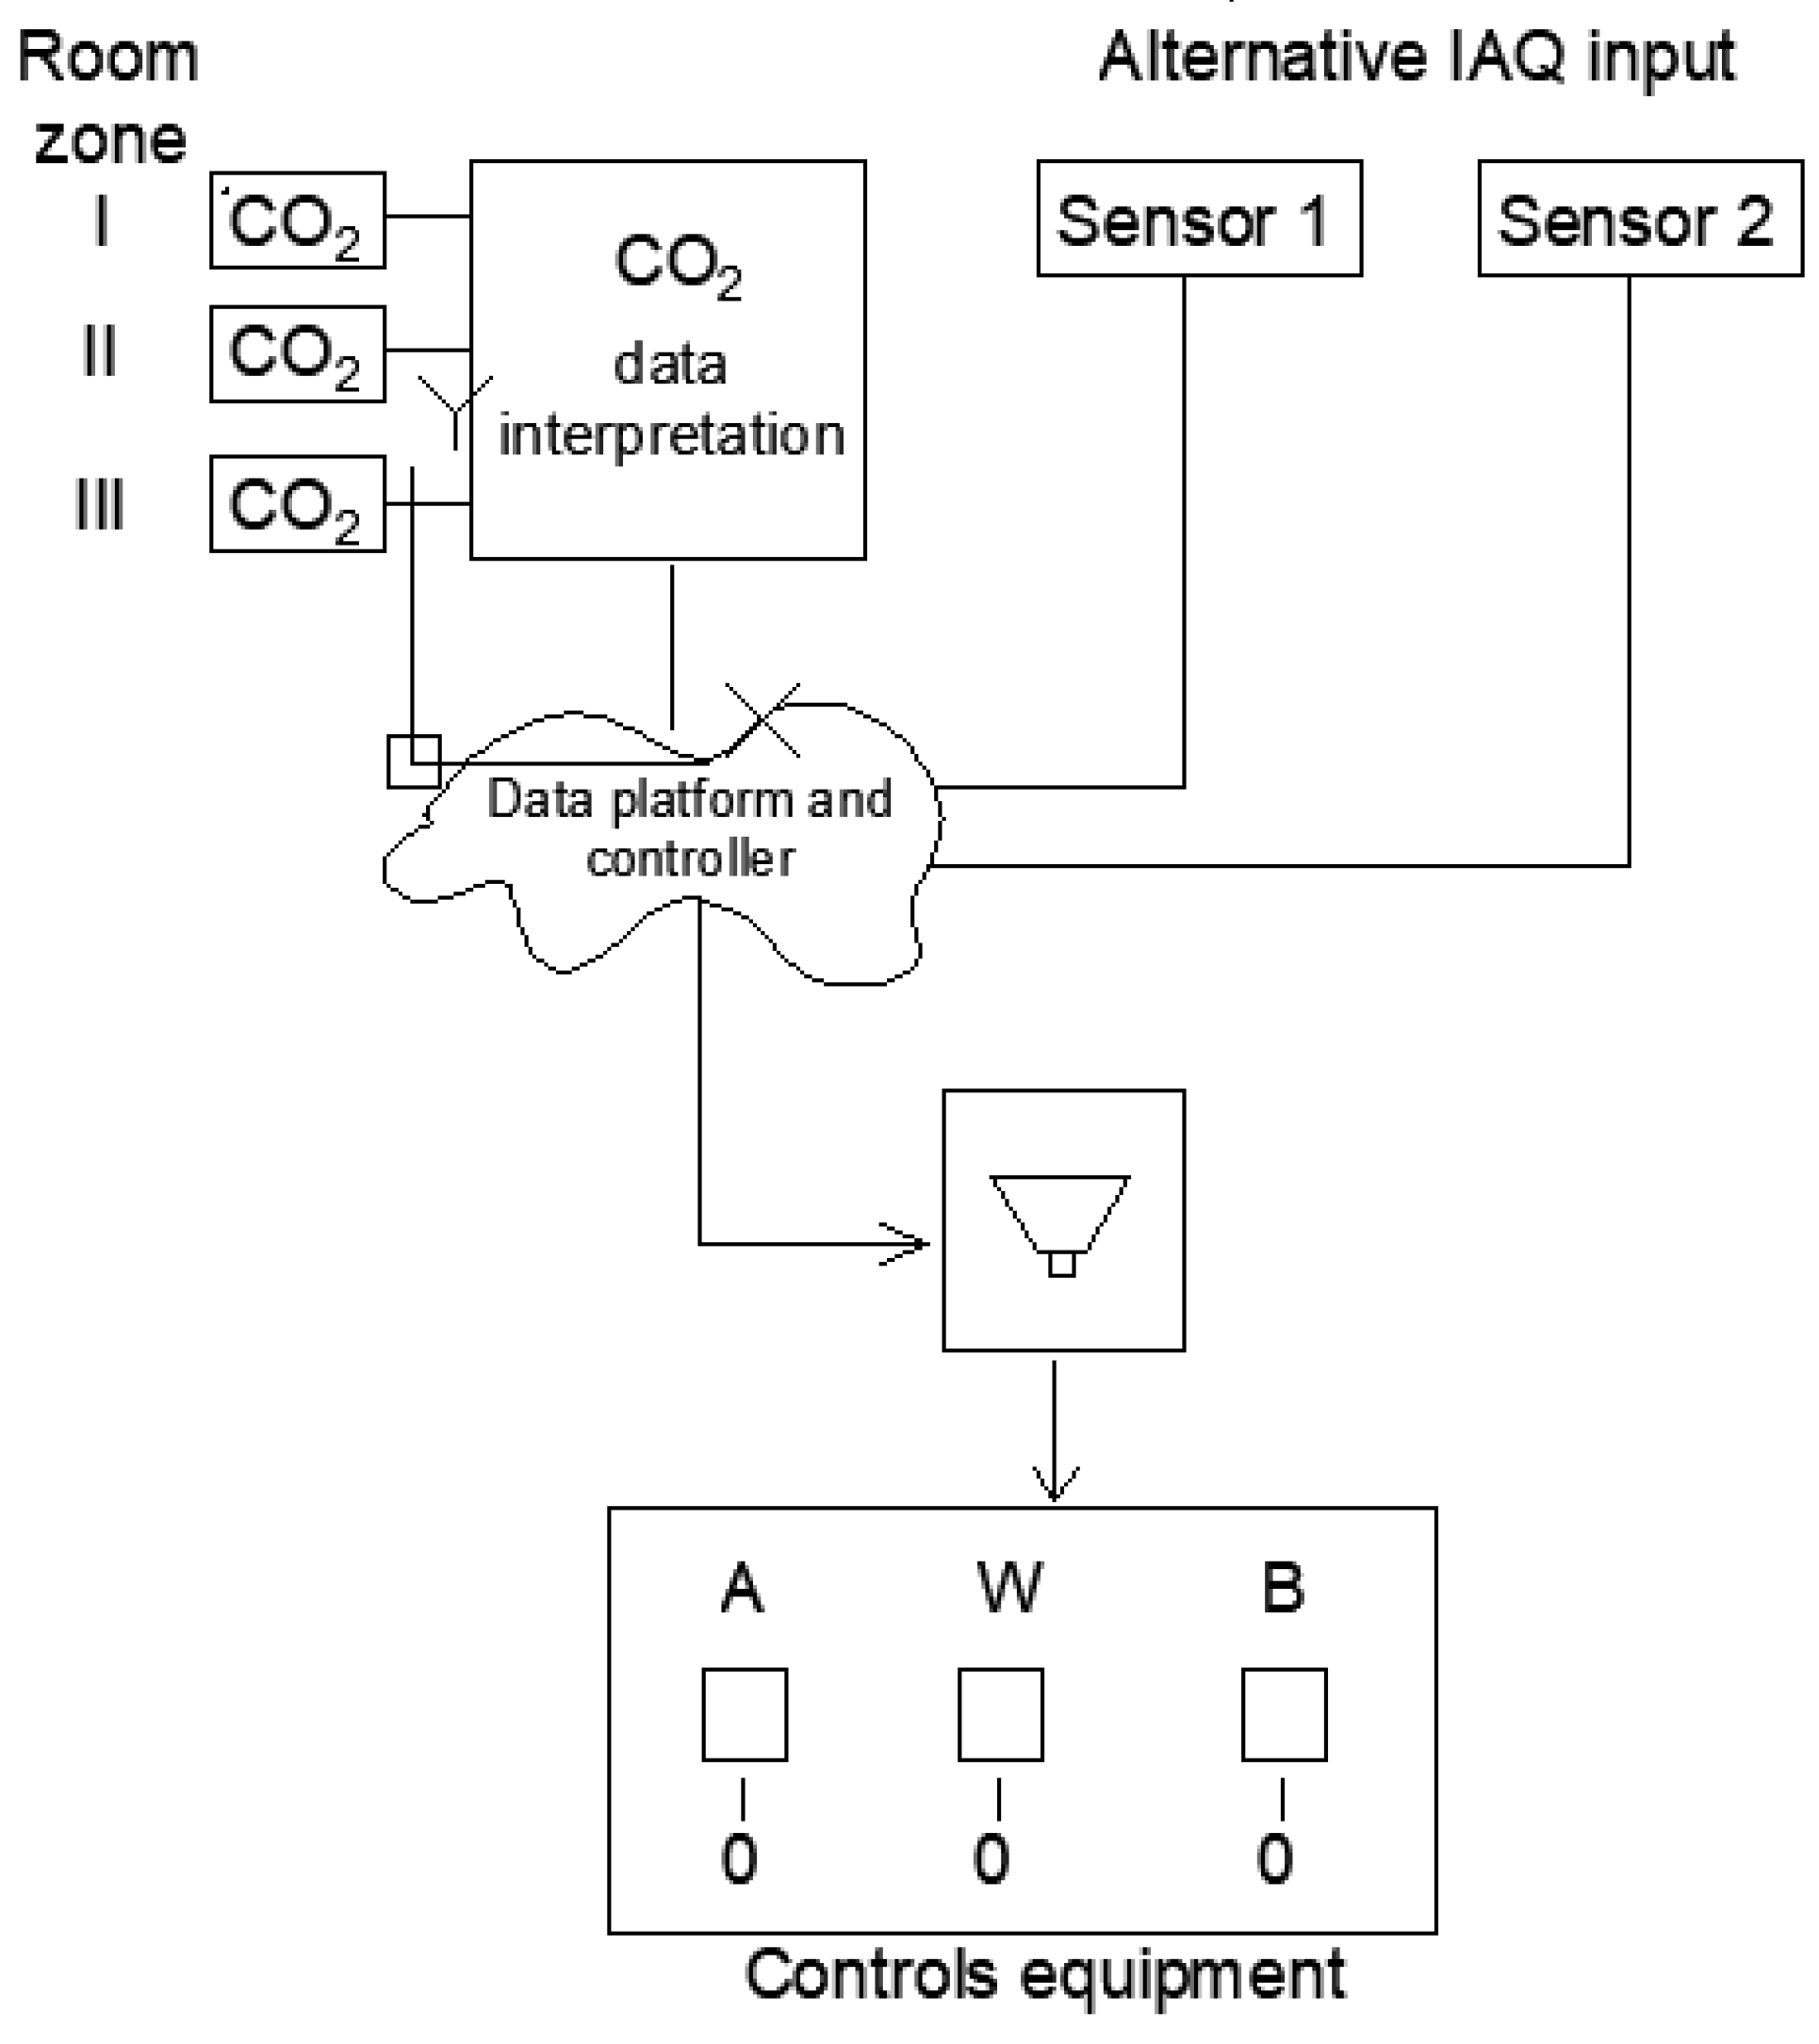
2.2. Building Management System

The proper operation of ventilation systems will ensure optimal air exchange and air distribution with respect to buildings’ energy efficiency. Ventilation of office buildings and modern apartments buildings is generally provided by mechanical ventilation. Considering growing energy prices, more detailed attention must be paid to building management systems (BMS). In scope of this task the different control measures have been considered to understand how ventilation systems could be managed to reach the best energy efficiency without compromising indoor air quality.
One of the simplest solutions to optimize air supply is variable air volume (VAV). VAV systems (Figure 4) allow precise control of supply air based on indoor air pollution. These systems increase the ventilation rate mainly according to carbon dioxide (CO2). However, temperature and humidity sensors could also be used to control air supply.
The sensor’s correct placement has an important function in obtaining correct measurements (see Section 2.3).
Mui et al. [38] have measured the CO2 concentration at 12 different locations in an office room with a VAV system. The results showed that 75% of the 12 locations had an acceptable CO2 concentration, i.e., controlled below the setpoints. This could be explained by non-even human location in the room as well as by non-even air distribution.
Additionally, it should be mentioned that CO2 based VAV systems do not take into account moisture content and temperature. BMS can allow more precise control of a VAV system by programming an HVAC operation longer than CO2 sensors show; thus, providing room ventilation before and after occupancy. This will allow moisture and outdoor removal for pre- and post-occupancy periods, especially during the rooms’ cleaning procedure.
The control of CO2 using only VAV systems without extra advanced control can cause difficulties in ensuring precise control of CO2 and especially maintaining an optimal balance between all major IAQ parameters [39]. According to this study, a user-friendly BMS, which ensures long-term monitoring, can be used for fine ventilation, tuning of air conditioning systems, and prioritization of energy strategies.

2.3. Placement of Sensors

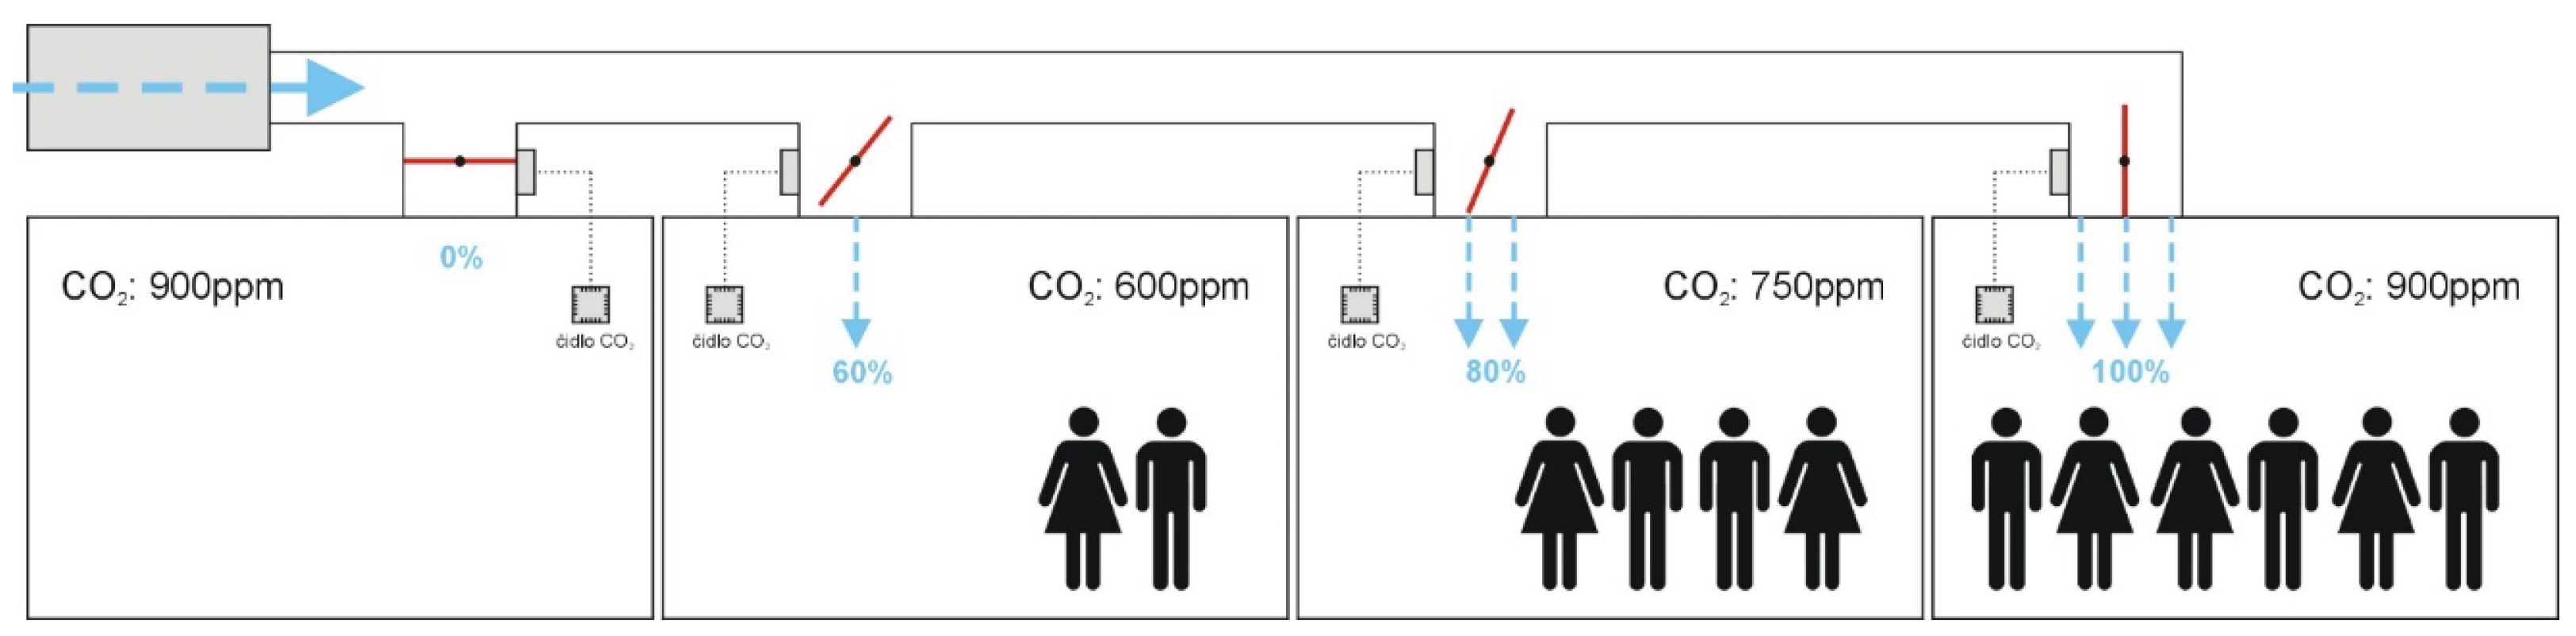
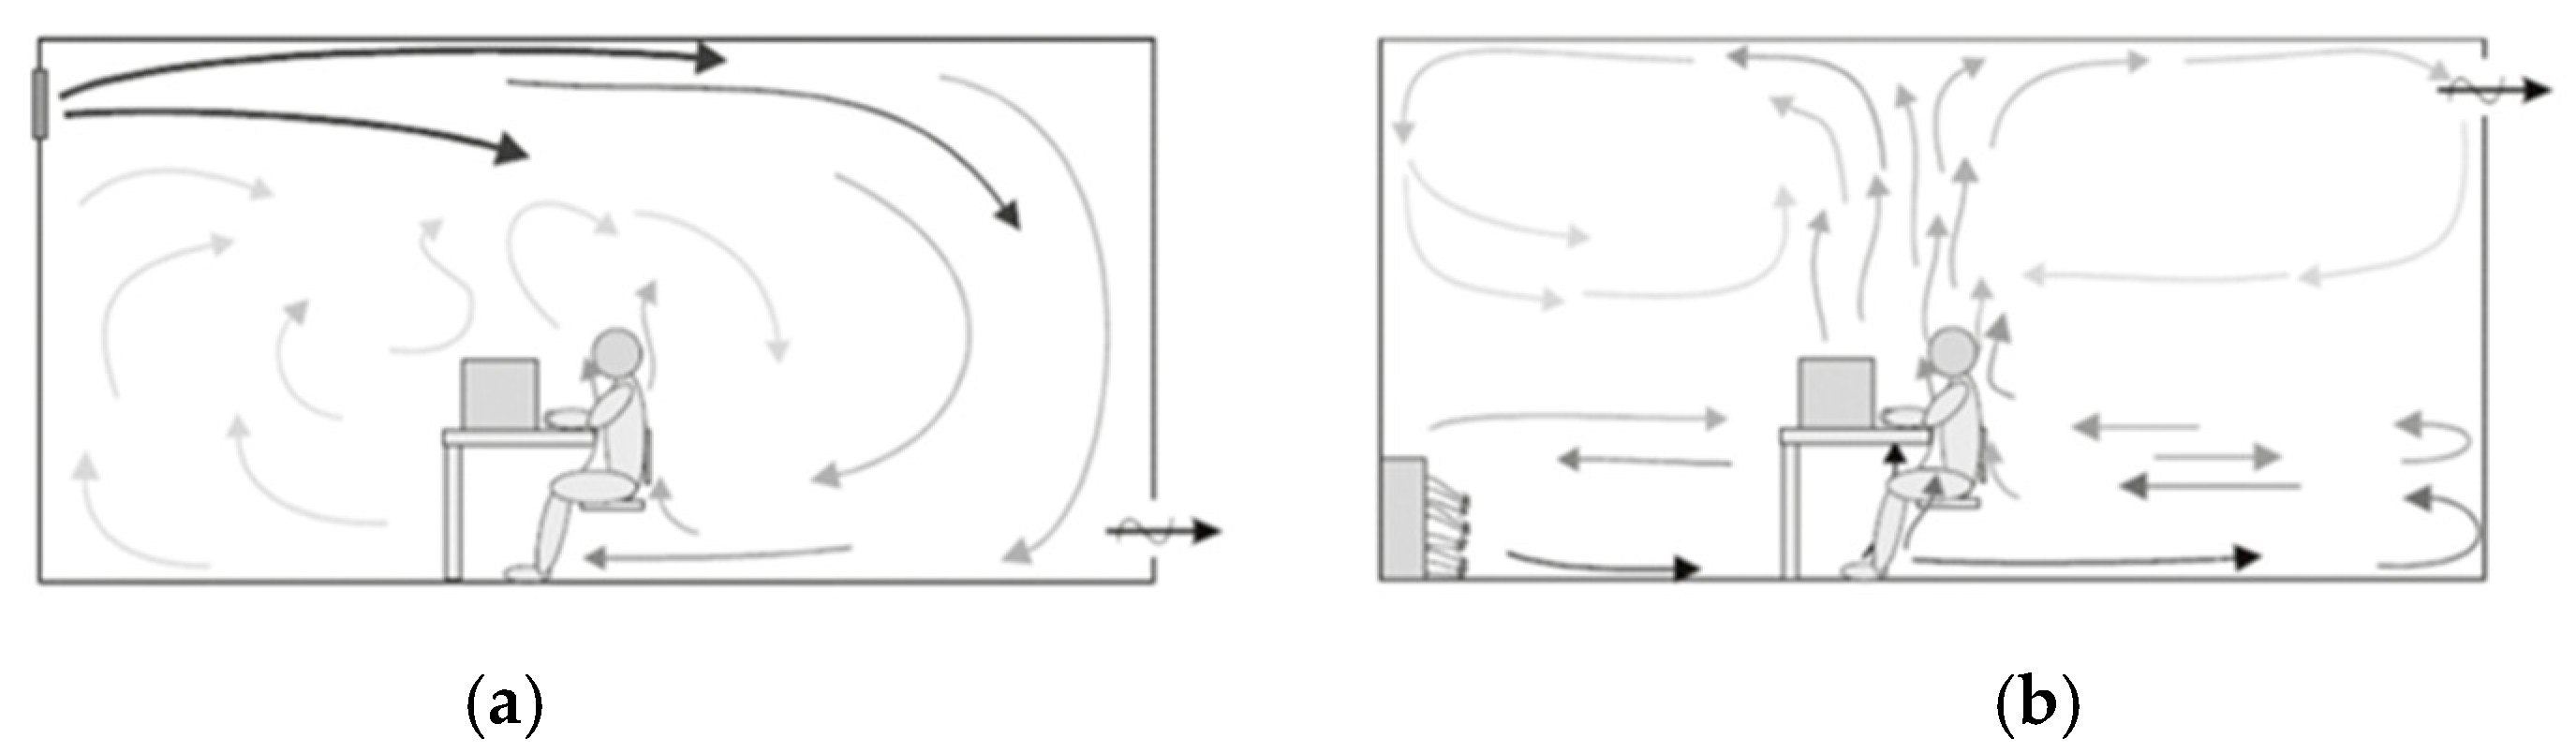
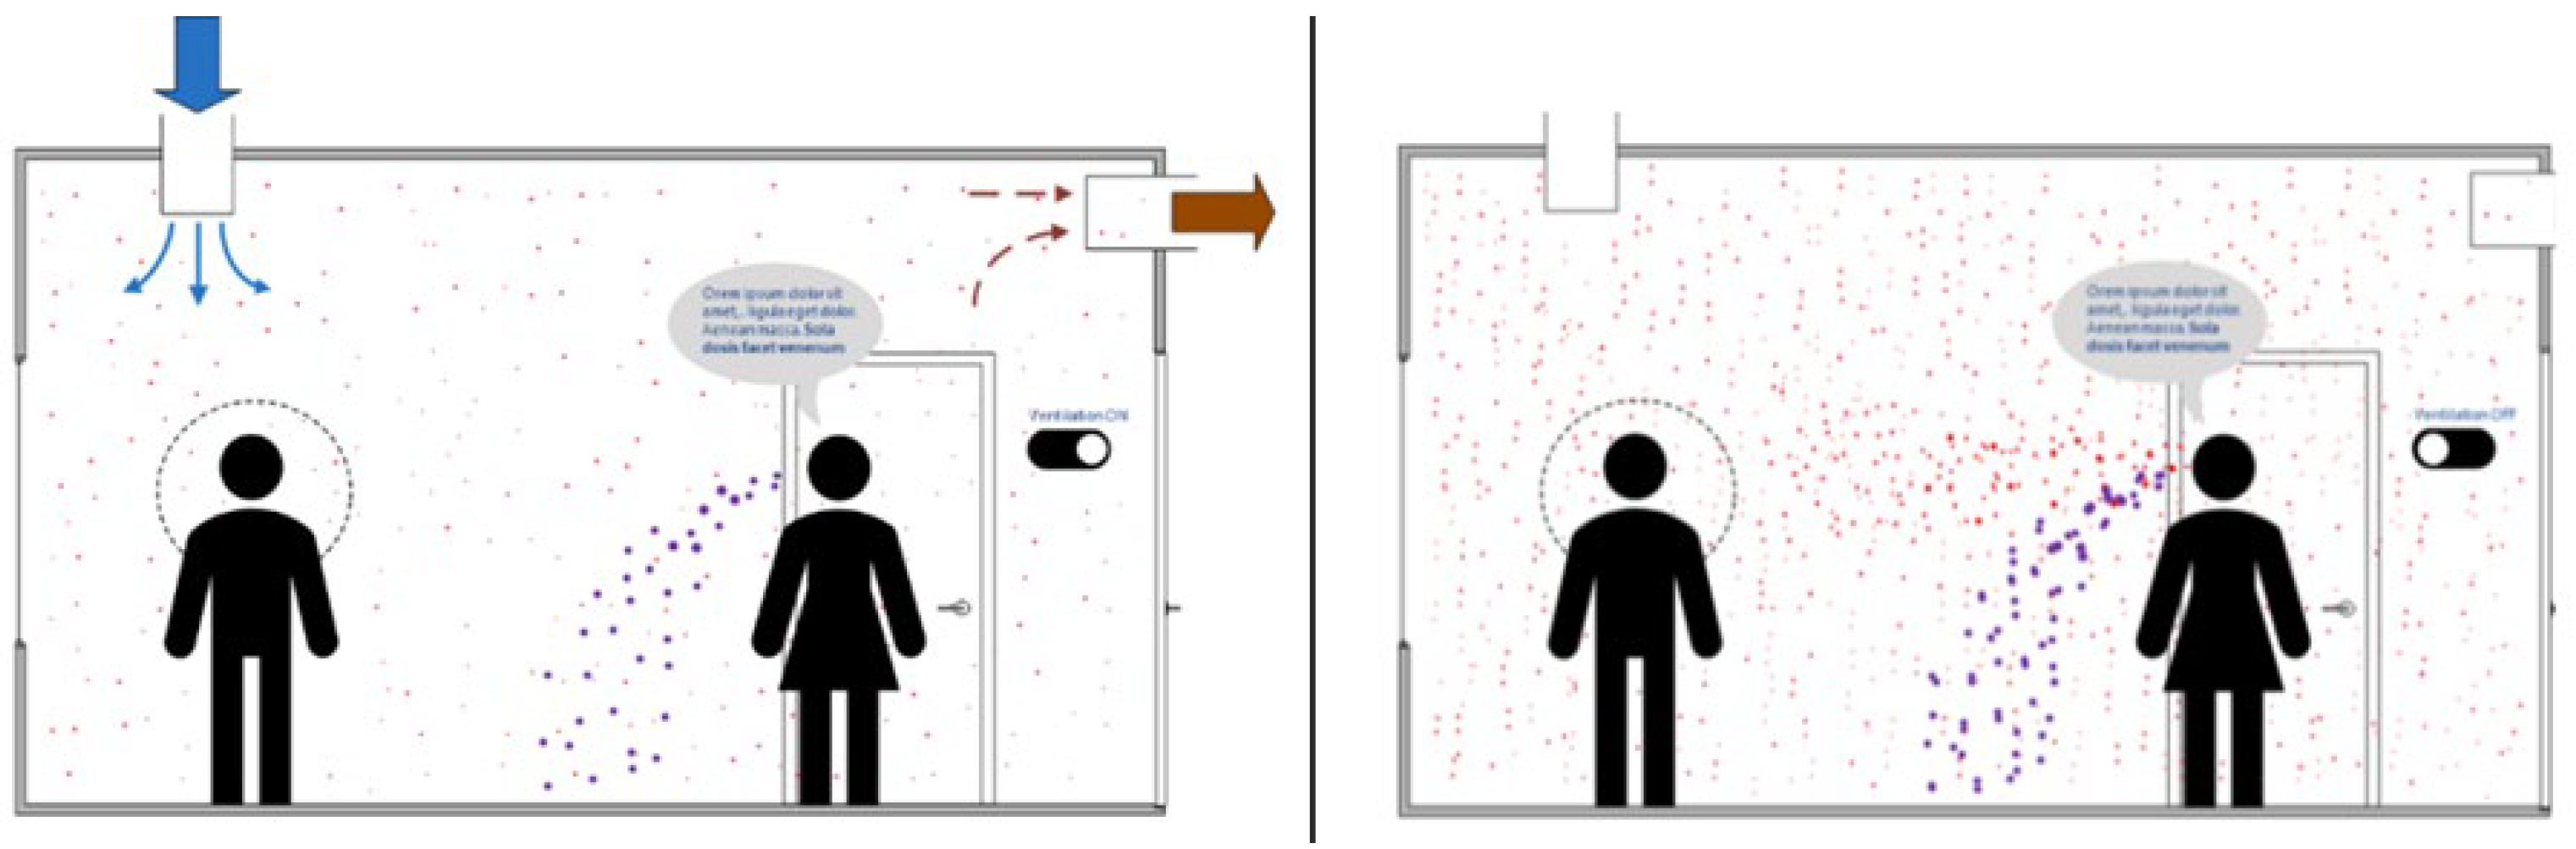
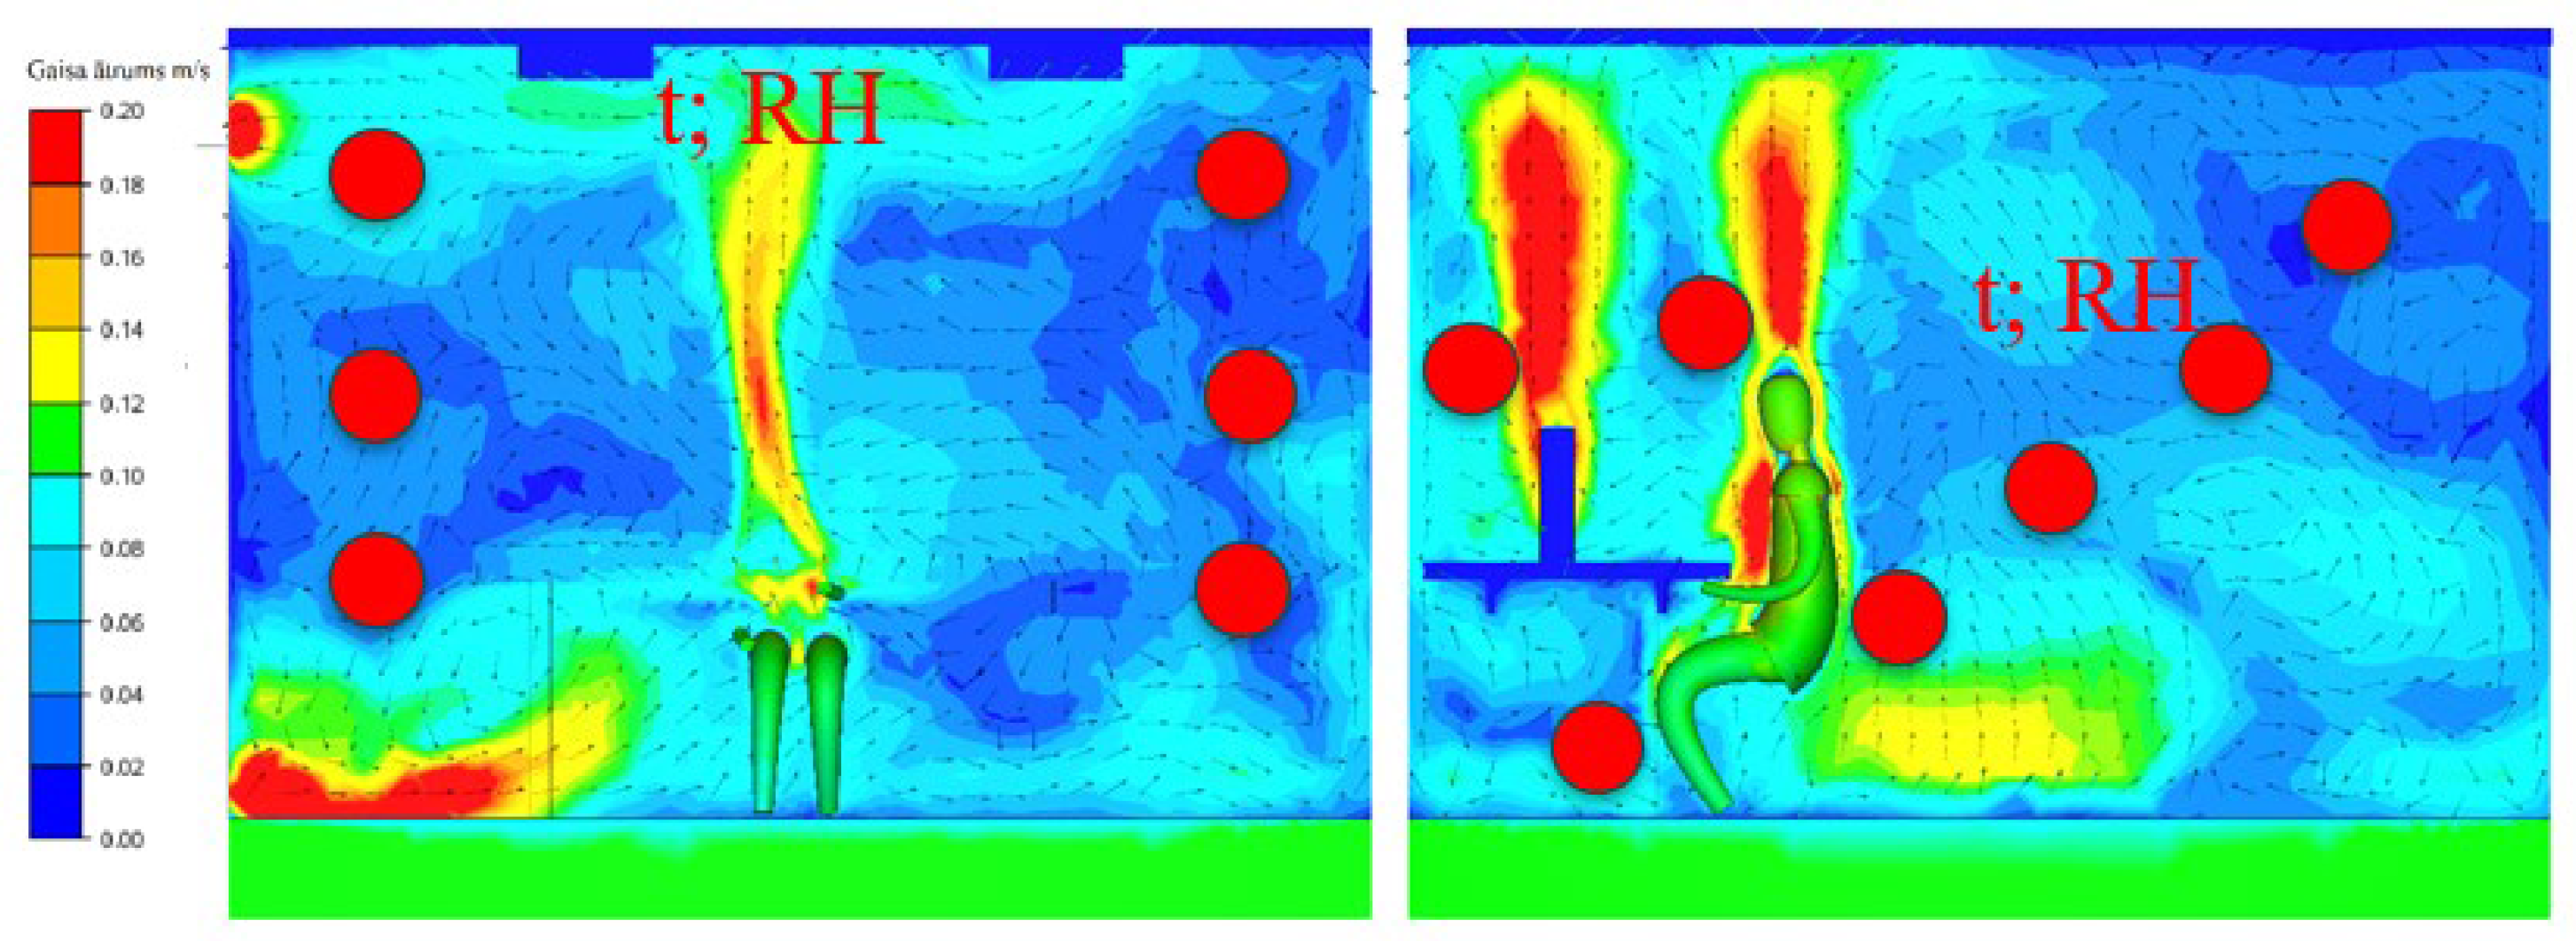
2.3.1. General Description of Air Distribution

Traditional mixing ventilation systems (Figure 5a) have a medium ventilation effectiveness and low energy efficiency. However, such a type of ventilation is still dominant on the market and widely used by engineers. The main benefits of mixing ventilation are well known: standardized design procedure, easy to fit in any room layout, and simple installation. Better efficiency and removal of pollution from a working zone ensures displacement ventilation (Figure 5b).
Displacement ventilation allows air removal from a working zone directly to the exhaust without passing through another working zone. However, this requires a more precise design and the planning of ventilation systems and supply vents.
The latest COVID-19 outbreak has highlighted the overall importance of ventilation and air distribution in indoor spaces (Figure 6).
As can be seen, placement of supply and exhaust diffusors have a significant role in air distribution and movement of pollutants from person to person. Thus, indoor air quality sensors should be placed cogently in accordance with air distributing patterns.
Relevant technical guidance is available from ASHRAE’s Position Document on Infectious Aerosols [41] and relevant online technical resources regarding transmission of SARS-CoV-2 and the operation of HVAC systems during the COVID-19 pandemic [42].

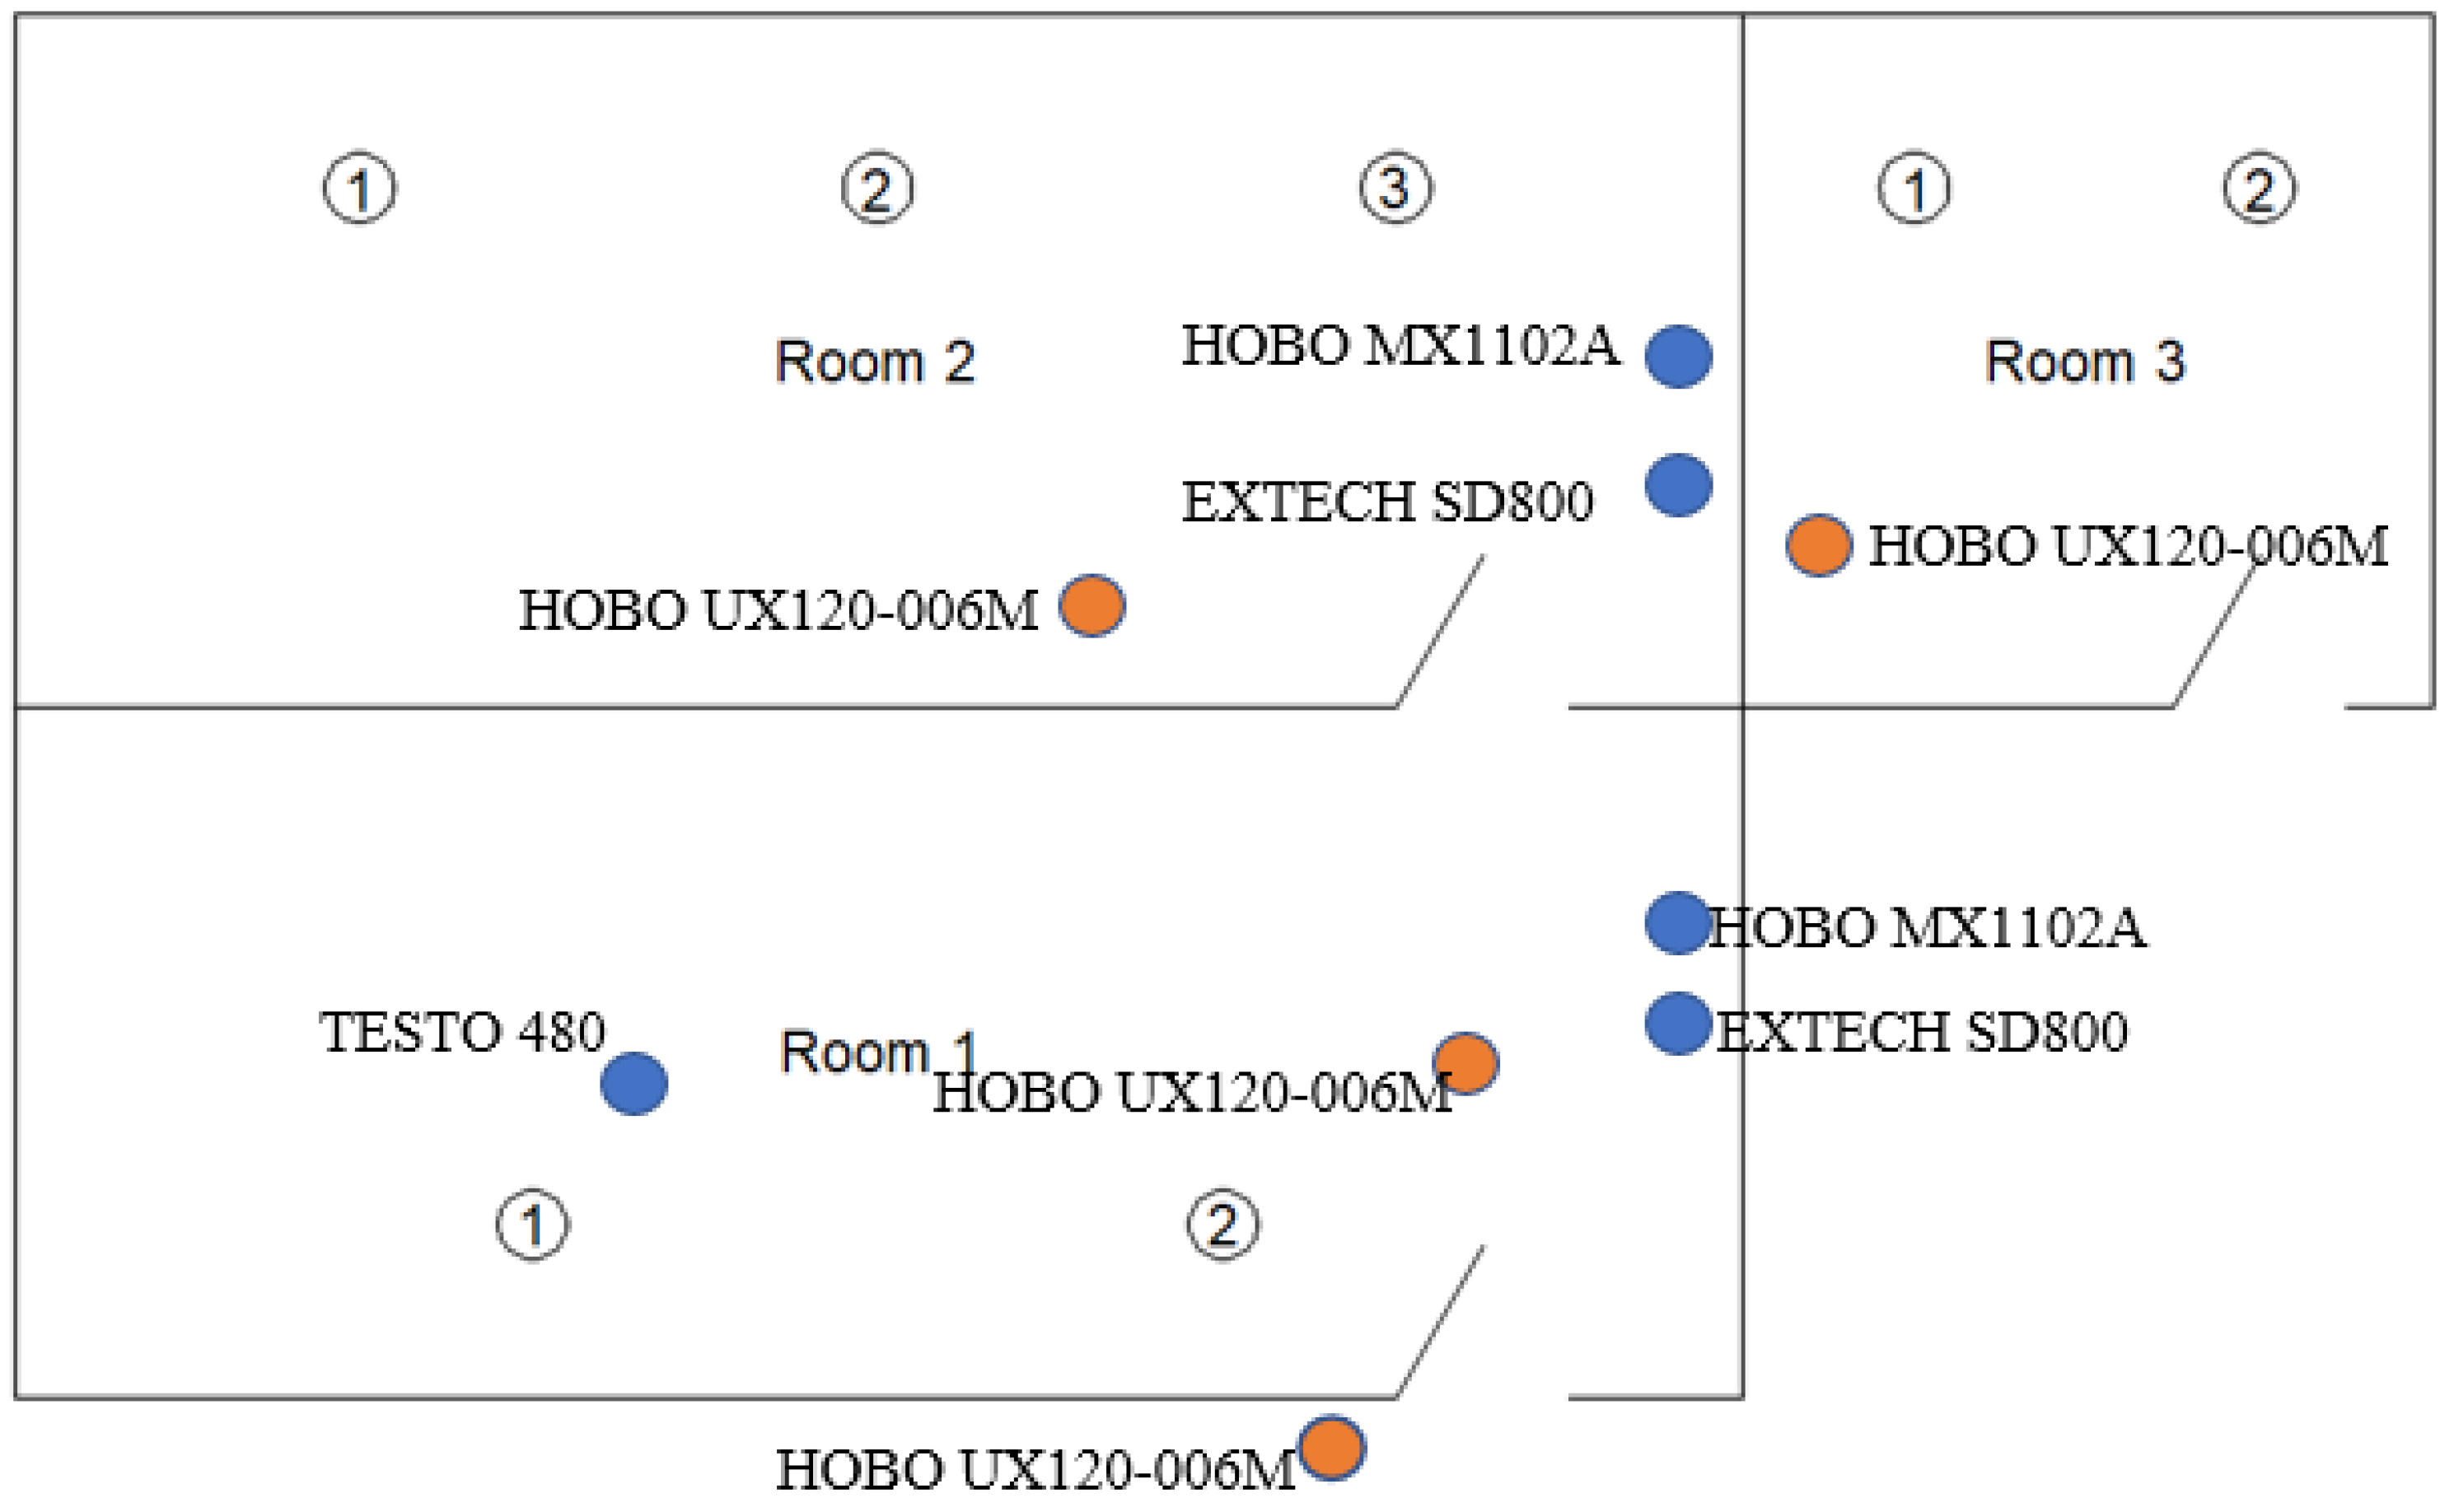
2.3.2. Indoor Air Quality Sensors Placement

Considering that indoor spaces do not have a constant load and that people constantly move, use of only one sensor could provide misleading information on CO2 concentration in a working zone. The simulation of air distribution in the rooms can be precisely done using computational fluid dynamics (CFD) simulation. Such a type of simulation continuously improves for more than 60 years [43]. Nowadays, CFD is a reliable tool even for estimation of air distribution in very specific cases, such as hospitals, clean rooms etc. [44,45,46]. Thus, CFD calculation during the design stage can help engineers to choose optimal locations for sensor placement and to provide more precise balancing and tuning for ventilation systems during operation based on the CFD model and real measurements data.
Figure 7 shows the future possible solution for BMS that can include multi sensor placement in all rooms.
The red dots show the possible placement of indoor air quality sensors to ensure precise measurements of air distribution and provide data on CO2 concentration exactly in working zone. The increasing number of sensors placed in the buildings will require enhanced solution for data collection and analysis. Internet of Things (IoT) should be considered for future building operation [48], especially in large-scale buildings.

3. Results

Placement of IAQ Sensors in Office Building

As a test bed, several locations in Riga (Latvia) were chosen. The focus was paid to three case studies: office building with several rooms (Case 1), separate university staff room (Case 2), and apartment bedroom (Case 3).
Figure 8 presets placement of TESTO 480 measurement equipment, the supply air flow measurement from diffusers was held in several rooms of the corresponding office.
At the beginning of the study, performance of the ventilation system was measured. As a result, it was found that Room 1 has an air flow rate equal to 73 m3/h. This room is constantly occupied presumably by four employees, but Room 2 has the minimum and maximum air flow rate equal to 127 and 320 m3/h, respectively, (depending on a used speed of the fan). This room has 3 workplaces.
According to LVS EN 16798-1:2019 [49], Room 1 does not fulfil even the requirements of the worst, IV, comfort level, which is 21.6 m3/h per person or 86.4 per 4 persons.
At the minimum fan speed, the air flow in Room 2 is sufficient for comfort level III (86.4 m3/h according standard against 127 m3/h in the room), but at the maximum fan speed, the air flow is significantly higher than required for comfort level I (216 m3/h according to the standard against 320 m3/h in the room).
Figure 9 shows the total air flow rates for Room 1 and Room 2.
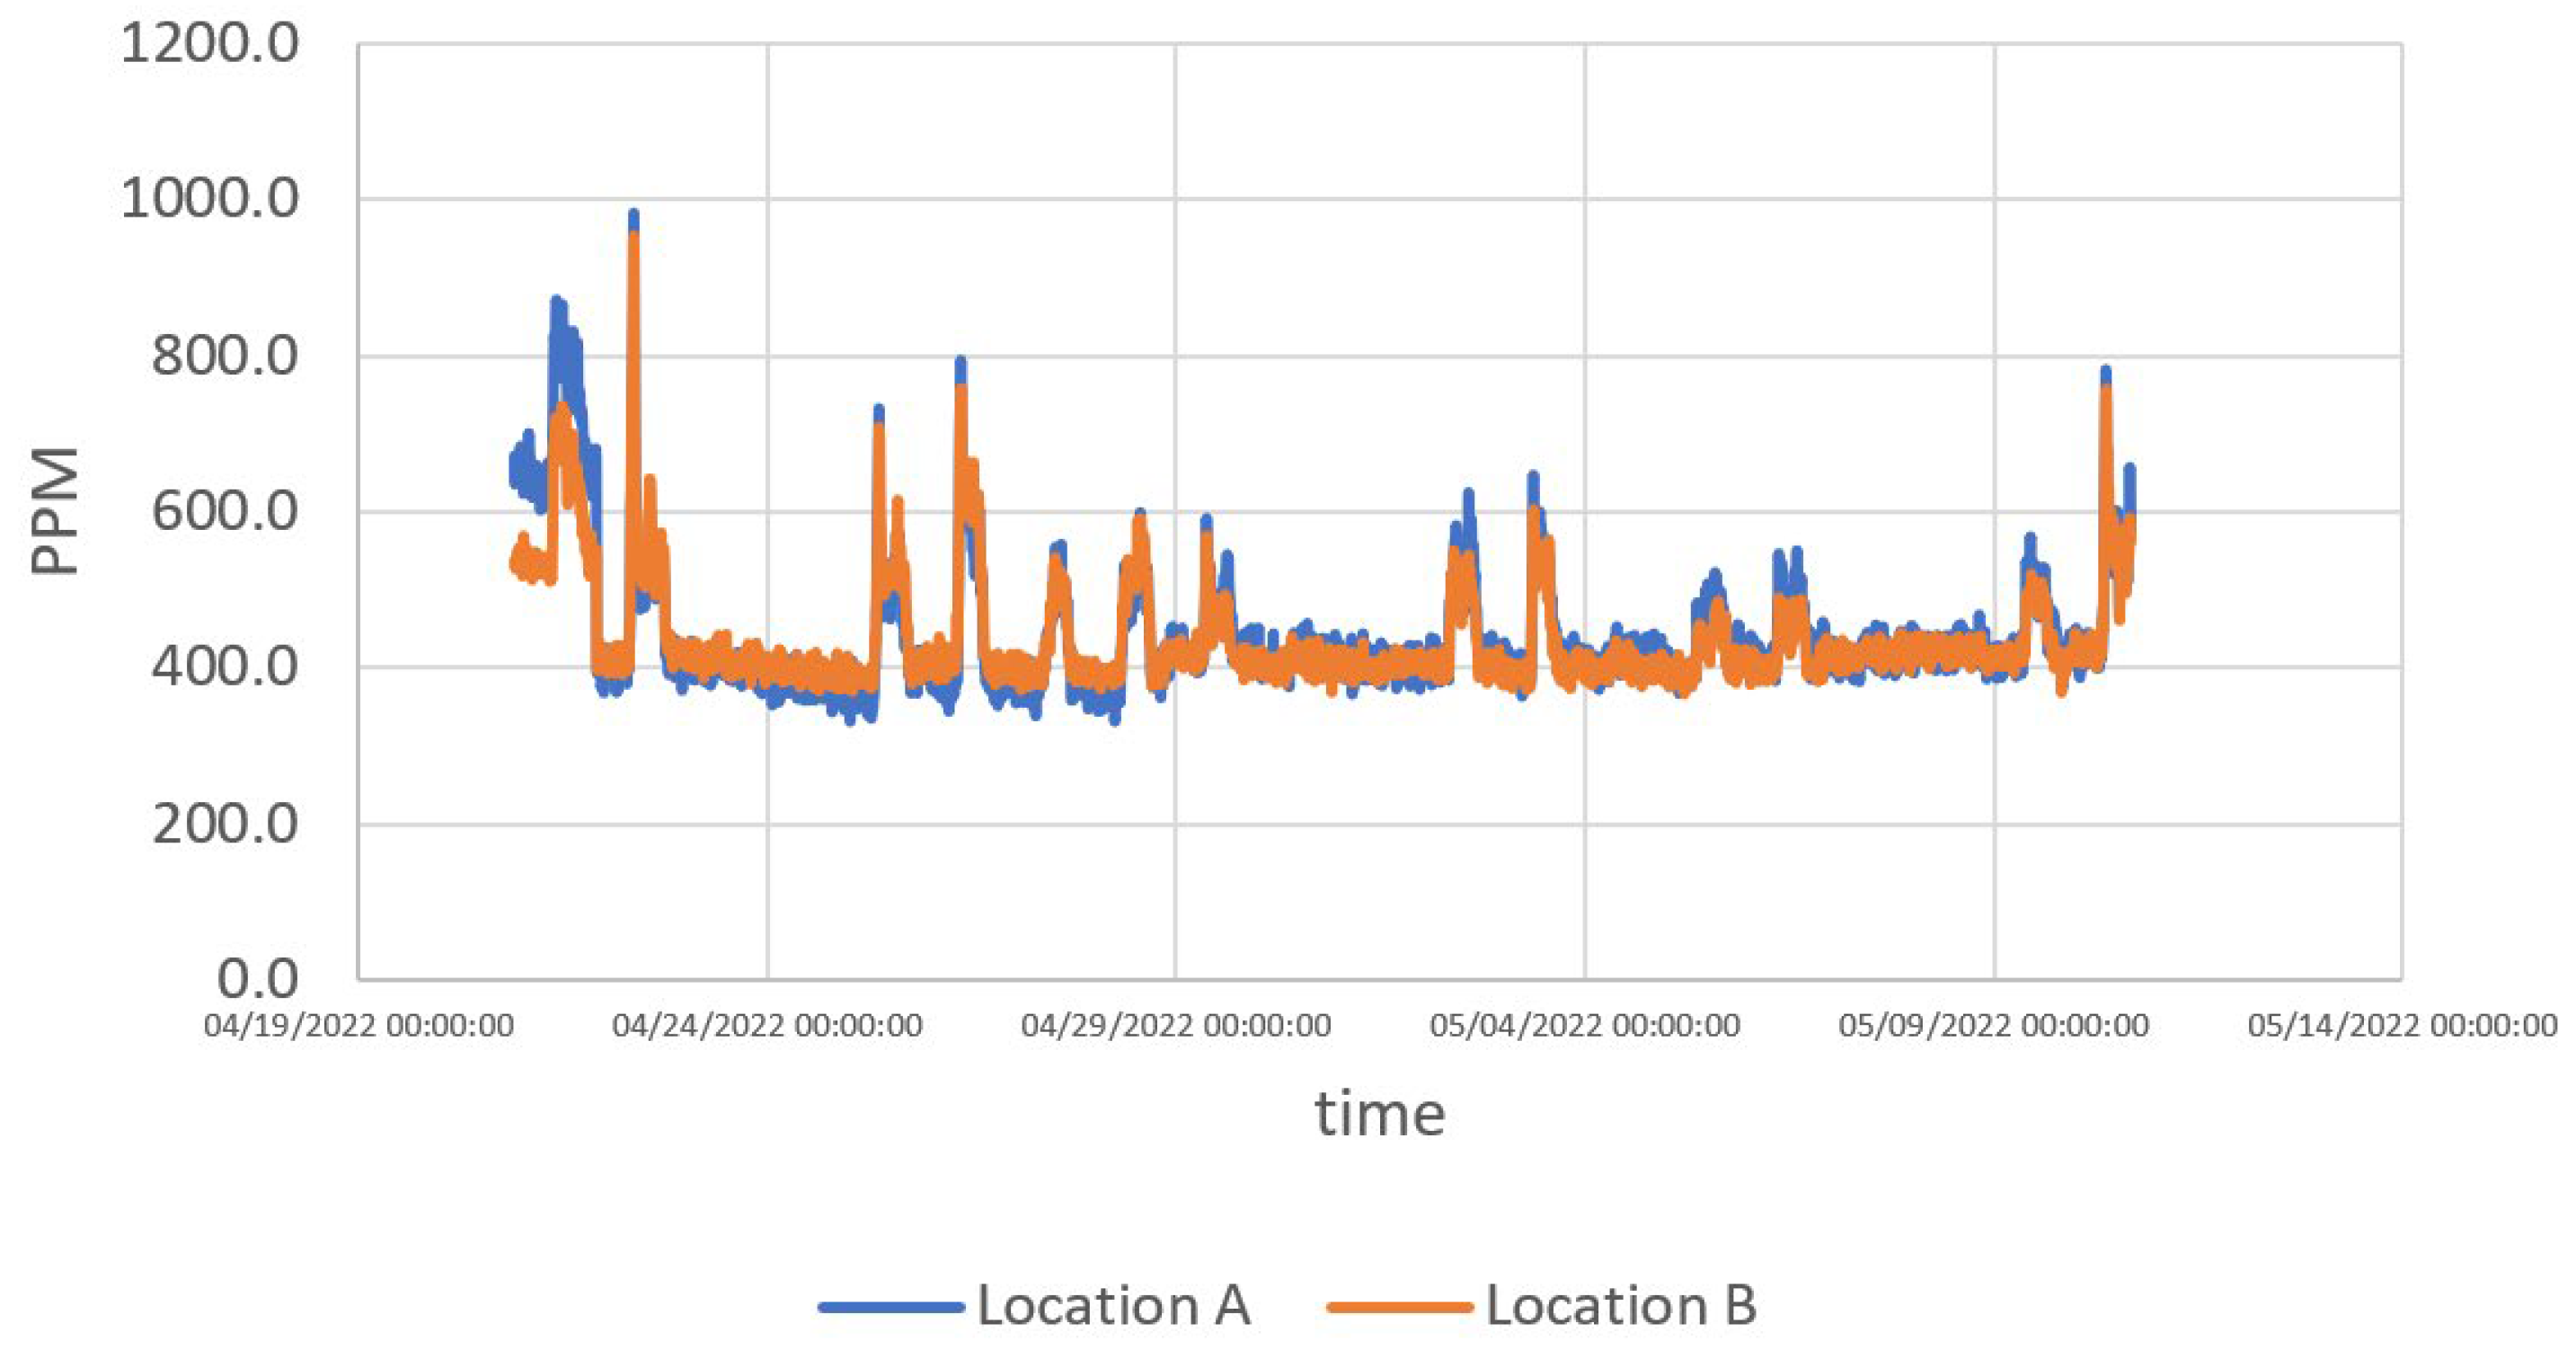
  • Preliminary IAQ measurement data
The first conclusion of the measurement is that it is vitally necessary to increase the air flow in Room 1.
In order to evaluate the working parameter in different CO2 sensors (Extech and Testo models), both sensors were placed in the same location and were left to register CO2 concentration for 8 days (Figure 10).
Both sensors were in use for several years and have not been calibrated. The next figure presents CO2 measurements made by two identical brand-new sensors placed in the same room but in different locations. The room has four workstations and is used as a hall between other rooms.
As can be seen, both sensors showed almost equal results. The maximum difference between the sensors was 207 PPM. The measurements will be continued in order to get more data on CO2 concentration distribution across the room. Current measurements were done during the summer when workers could open windows and leave them open during the night. Further research will cover more rooms with different occupancy profiles and will include wintertime when window opening is limited.
Further data presents CO2 measurements done by completely brand-new logger-ONSET HOBO MX CO2. One sensor was installed in an apartment without mechanical ventilation (Figure 11) and another in office building premises. Measurements in the apartment were performed in this report (Figure 12), as a case where CO2 sensors provided misleading information which can cause incorrect management of HVAC systems.
As can be seen, the new CO2 logger has measured CO2 concentration as 810 PPM (on average), while the room was unoccupied. Once the room was occupied, CO2 readings dropped to 50 PPM. If this sensor were connected to BMS, the ventilation systems would be malfunctioning. The measurement failure was also identified during the other periods. Such a situation repeated three times during the measurements.
This issue should be investigated in more detail in future works. Probably this happens due to a failure during the sensor’s automatic calibration, or it is impacted by other household pollutants. For example, cleaning sprays, fragrances, etc. Currently almost 90% of multiapartment buildings are not renovated and do not have any mechanical ventilation. The further possible retrofitting of existing buildings and installation of a mechanical system can significantly improve air exchange [50], as a result obtaining more precise measurements of CO2 concentration.
The next two sensors were placed in the university staff room equipped with mechanical supply and exhaust ventilation. Figure 13 presents ONSET HOBO MX CO2 loggers monitoring data in the university staff room with mechanical ventilation.
Both sensors were placed symmetrically close to the air exhaust terminal.
As some sensors may show incorrect information spatially in case people move and workspaces are not evenly distributed across the room, the HVAC systems can be managed by several sensors integrated in one platform (Figure 14).
The enhanced systems will allow connection of several CO2 sensors or any other types of sensors from one room. They can be programmed as one main sensor, and two as control sensors. For example, the weighted average can be set up taking into consideration the room load profile. In addition, it could be used to control the air supply in different room zones.

4. Discussion

The share of energy consumption, both electric and thermal energy, for ventilation needs could reach up to 60% in overall energy consumption. Thus, optimization of supply and exhaust air flows have a significant function in achieving reduction of energy consumption without the need to compromise on indoor air quality during occupation hours. One of the most popular and widely available methods is variable air flow based on indoor air CO2 concentration. However, sensors must provide a precise measurement during the whole period of operation.
Nowadays, the sensor industry is growing rapidly. In order to ensure wide installation of sensors and to make it affordable for all types and sizes of ventilation systems, manufacturers are constantly looking for alternative low cost technologies. The new low-price sensors constantly appear on the market. In order to reduce maintenance costs, the majority of available sensors do not have a manual mechanical calibration option using the reference gases. Almost all sensors use the lowest CO2 values as an outdoor air reference. Thus, they should be placed outdoor for calibration or the room should be unoccupied for some time. Consequently, some risk may occur if during automatic calibration the room is occupied.
However, performed measurements did not show any significant difference in CO2 sensors within the same room, a future study should be done in order to investigate offices with different occupation profiles and ventilation types.
This study was performed during COVID-19 pandemic when ventilation systems were switch on to maximum capacities and the room occupancy was reduced.
There are several alternative indoor air cleaning solutions [51], which can help to reduce the concentration of CO2 without increasing the ventilation rate.

5. Conclusions

Some professional sensors have a special calibration probe, while sensors widely available on the market are calibrated mainly by using general assumption on outdoor air CO2 concentration. This has some limitations for practical application in rooms without mechanical ventilation and/or with a variable room occupancy profile.
According to existing studies, the most reliable sensors are temperature sensors. In the scope of this study, identical CO2 sensors were used to measure CO2 concentration in different rooms. In rooms with mechanical ventilation all CO2 sensors have shown the same result and no failure was detected during the whole measurement period. While CO2 sensors in rooms with natural ventilation has shown misleading readings when measured, CO2 concentration has dropped to 50 PPM.
Since all NDIR sensors measure CO2 concentration based on laser reflection, the future study will focus on household chemicals impact on CO2 sensors measurement uncertainties. In addition, dust and candle burning can cause a misleading measurement.

Author Contributions

Conceptualization, A.B.; methodology, A.B.; validation, A.P.; formal analysis, A.B.; investigation, V.J.; resources, A.B.; data curation, A.B.; writing—original draft preparation, A.B.; writing—review and editing, V.J. All authors have read and agreed to the published version of the manuscript.

Funding

This research was funded by European Regional Development Fund specific objective 1.1.1 «Improve research and innovation capacity and the ability of Latvian research institutions to attract external funding, by investing in human capital and infrastructure», grant number 1.1.1.1/21/A/011, Project “Platform for the COVID-19 safe work environment”. The project is co-financed by REACT-EU funding for mitigating the consequences of the pandemic crisis.

Data Availability Statement

Not applicable.

Conflicts of Interest

The authors declare no conflict of interest.

References

  1. Krumins, A.; Lebedeva, K.; Tamane, A.; Millers, R. Possibilities of Balancing Buildings Energy Demand for Increasing Energy Efficiency in Latvia. Environ. Clim. Technol. 2022, 26, 98–114. [Google Scholar] [CrossRef]
  2. Deshko, V.I.; Bilous, I.Y.; Buyak, N.A. Influence of periodic heating modes on the dynamics of energy need and human thermal comfort for buildings with different thermal protection. KPI Sci. News 2019, 4, 7–16. [Google Scholar] [CrossRef]
  3. Bilous, I.; Deshko, V.; Sukhodub, I. Building inside air temperature parametric study. Mag. Civ. Eng. 2017, 68, 65–75. [Google Scholar] [CrossRef]
  4. Szodrai, F.; Lakatos, Á.; Kalmár, F. Analysis of the change of the specific heat loss coefficient of buildings resulted by the variation of the geometry and the moisture load. Energy 2016, 115, 820–829. [Google Scholar] [CrossRef]
  5. Sung, W.-P.; Chen, T.-Y.; Liu, C.-H. Strategy for Improving the Indoor Environment of Office Spaces in Subtropical Cities. Buildings 2022, 12, 412. [Google Scholar] [CrossRef]
  6. Narayanan, R.; Al Anazi, A.A.; Pippia, R.; Rasul, M.G. Solar Desiccant Cooling System for a Commercial Building in Kuwait’s Climatic Condition. Energies 2022, 15, 4102. [Google Scholar] [CrossRef]
  7. Zhao, Q.; Li, J.; Fediuk, R.; Klyuev, S.; Nemova, D. Benefit Evaluation Model of Prefabricated Buildings in Seasonally Frozen Regions. Energies 2021, 14, 7119. [Google Scholar] [CrossRef]
  8. Fan, M.; Fu, Z.; Wang, J.; Wang, Z.; Suo, H.; Kong, X.; Li, H. A review of different ventilation modes on thermal comfort, air quality and virus spread control. Build. Environ. 2022, 212, 108831. [Google Scholar] [CrossRef]
  9. Zemitis, J.; Bogdanovics, R.; Bogdanovica, S. The Study of CO2 Concentration in a Classroom during the COVID-19 Safety Measures. E3S Web Conf. 2021, 246, 1004. [Google Scholar] [CrossRef]
  10. Bogdanovica, S.; Zemitis, J.; Bogdanovics, R. The Effect of CO2 Concentration on Children’s Well-Being during the Process of Learning. Energies 2020, 13, 6099. [Google Scholar] [CrossRef]
  11. Fantozzi, F.; Lamberti, G.; Leccese, F.; Salvadori, G. Monitoring CO2 concentration to control the infection probability due to airborne transmission in naturally ventilated university classrooms. Arch. Sci. Rev. 2022, 65, 306–318. [Google Scholar] [CrossRef]
  12. Mathews, E.; Arndt, D.; Piani, C.; van Heerden, E. Developing cost efficient control strategies to ensure optimal energy use and sufficient indoor comfort. Appl. Energy 2000, 66, 135–159. [Google Scholar] [CrossRef]
  13. Franco, A.; Leccese, F. Measurement of CO2 concentration for occupancy estimation in educational buildings with energy efficiency purposes. J. Build. Eng. 2020, 32, 101714. [Google Scholar] [CrossRef]
  14. Tihana, J.; Zajacs, A.; Ivancovs, D.; Gaujena, B. Influence of Ventilation Operating Modes on Energy Efficiency. Buildings 2022, 12, 668. [Google Scholar] [CrossRef]
  15. Deshko, V.; Bilous, I.; Sukhodub, I.; Yatsenko, O. Evaluation of energy use for heating in residential building under the influence of air exchange modes. J. Build. Eng. 2021, 42, 103020. [Google Scholar] [CrossRef]
  16. Prozuments, A.; Staveckis, A.; Zemitis, J.; Bajare, D. Evaluation of Heating and Cooling Loads for a Well-Insulated Single-Family House under Variable Climate Pattern. Environ. Clim. Technol. 2021, 25, 750–763. [Google Scholar] [CrossRef]
  17. ASHRAE Position Document on Indoor Carbon Dioxide. Available online: https://www.ashrae.org/file%20library/about/position%20documents/pd_indoorcarbondioxide_2022.pdf (accessed on 20 September 2022).
  18. Bashir, A.; Izhar, U.; Jones, C. IoT based COVID-19 SOP compliance monitoring and assisting system for businesses and public offices. Eng. Proc. 2020, 2, 14. [Google Scholar] [CrossRef]
  19. Sun, C.; Zhai, Z. The efficacy of social distance and ventilation effectiveness in preventing COVID-19 transmission. Sustain. Cities Soc. 2020, 62, 102390. [Google Scholar] [CrossRef]
  20. Gudra, D.; Dejus, S.; Bartkevics, V.; Roga, A.; Kalnina, I.; Strods, M.; Rayan, A.; Kokina, K.; Zajakina, A.; Dumpis, U.; et al. Detection of SARS-CoV-2 RNA in wastewater and importance of population size assessment in smaller cities: An exploratory case study from two municipalities in Latvia. Sci. Total Environ. 2022, 823, 153775. [Google Scholar] [CrossRef]
  21. Anderson-Coughlin, B.L.; Shearer, A.E.; Omar, A.N.; Litt, P.K.; Bernberg, E.; Murphy, M.; Anderson, A.; Sauble, L.; Ames, B.; Damminger, O.; et al. Coordination of SARS-CoV-2 wastewater and clinical testing of university students demonstrates the importance of sampling duration and collection time. Sci. Total Environ. 2022, 830, 154619. [Google Scholar] [CrossRef]
  22. Margherita, A.; Heikkilä, M. Business continuity in the COVID-19 emergency: A framework of actions undertaken by world-leading companies. Bus. Horizons 2021, 64, 683–695. [Google Scholar] [CrossRef]
  23. Al-Humairi, S.N.S.; Kamal, A.A.A. Design a smart infrastructure monitoring system: A response in the age of COVID-19 pandemic. Innov. Infrastruct. Solutions 2021, 6, 144. [Google Scholar] [CrossRef]
  24. Correia, A.; Ferreira, L.M.; Coimbra, P.; Moura, P.; de Almeida, A.T. Smart Thermostats for a Campus Microgrid: Demand Control and Improving Air Quality. Energies 2022, 15, 1359. [Google Scholar] [CrossRef]
  25. Healthline. The Simple Science behind Why Masks Work. COVID-19. 2020. Available online: https://www.healthline.com/health-news/the-simple-science-behind-why-masks-work (accessed on 9 September 2022).
  26. Gautam, Y.K.; Sharma, K.; Tyagi, S.; Ambedkar, A.K.; Chaudhary, M.; Singh, B.P. Nanostructured metal oxide semiconductor-based sensors for greenhouse gas detection: Progress and challenges. R. Soc. Open Sci. 2021, 8, 201324. [Google Scholar] [CrossRef] [PubMed]
  27. Struzik, M.; Garbayo, I.; Pfenninger, R.; Rupp, J.L.M. A Simple and Fast Electrochemical CO2 Sensor Based on Li7La3Zr2O12 for Environmental Monitoring. Adv. Mater. 2018, 30, e1804098. [Google Scholar] [CrossRef] [PubMed]
  28. CO2 Sensors: Definition, Types, and How to Choose?—Renke. Available online: https://www.renkeer.com/co2-sensors-types-and-choose (accessed on 18 September 2022).
  29. How Does an NDIR CO2 Sensor Work? | CO2Meter.com. Available online: https://www.co2meter.com/blogs/news/how-does-an-ndir-co2-sensor-work (accessed on 10 September 2022).
  30. Molina, A.; Escobar-Barrios, V.; Oliva, J. A review on hybrid and flexible CO2 gas sensors. Synth. Met. 2020, 270, 116602. [Google Scholar] [CrossRef]
  31. NDIR CO2 Sensor [Nippon Ceramic Co., Ltd]. Available online: https://www.nicera.co.jp/en/products/gas-sensor/about-gas-sensor (accessed on 18 September 2022).
  32. Jia, X.; Roels, J.; Baets, R.; Roelkens, G. A Miniaturised, Fully Integrated NDIR CO2 Sensor On-Chip. Sensors 2021, 21, 5347. [Google Scholar] [CrossRef] [PubMed]
  33. Marinov, M.; Nikolov, G.; Gieva, E.; Ganev, B. Improvement of NDIR carbon dioxide sensor accuracy. In Proceedings of the 2015 38th International Spring Seminar on Electronics Technology (ISSE), Eger, Hungary, 6–10 May 2015; pp. 466–471. [Google Scholar] [CrossRef]
  34. Petersen, J.; Kristensen, J.; Elarga, H.; Andersen, R.K.; Midtstraum, A. Accuracy and Air Temperature Dependency of Commercial Low-cost NDIR CO2 Sensors: An Experimental Investigation. In Proceedings of the International Conference on Building Energy and Environment of COBEE2018, Melbourne, Australia, 5–9 February 2018. [Google Scholar]
  35. Palmisani, J.; Di Gilio, A.; Viana, M.; de Gennaro, G.; Ferro, A. Indoor air quality evaluation in oncology units at two European hospitals: Low-cost sensors for TVOCs, PM2.5 and CO2 real-time monitoring. Build. Environ. 2021, 205, 108237. [Google Scholar] [CrossRef]
  36. Mylonas, A.; Kazanci, O.B.; Andersen, R.K.; Olesen, B.W. Capabilities and limitations of commercially available wireless indoor environment sensors. ASHRAE Trans. 2019, 125, 193–199. [Google Scholar]
  37. Mylonas, A.; Kazanci, O.B.; Andersen, R.K.; Olesen, B.W. Capabilities and limitations of wireless CO2, temperature and relative humidity sensors. Build. Environ. 2019, 154, 362–374. [Google Scholar] [CrossRef]
  38. Mui, K.-W.; Chan, W.-T. Pilot Study for the Performance of a New Demand Control Ventilation System in Hong Kong. J. Arch. Eng. 2005, 11, 110–115. [Google Scholar] [CrossRef]
  39. Schibuola, L.; Scarpa, M.; Tambani, C. Performance optimization of a demand controlled ventilation system by long term monitoring. Energy Build. 2018, 169, 48–57. [Google Scholar] [CrossRef]
  40. REHVA COVID-19 Guidance Document How to Operate HVAC and Other Building Service Systems to Prevent the Spread of the Coronavirus (SARS-CoV-2) Disease (COVID-19) in Workplaces. 2021. Available online: https://www.rehva.eu/fileadmin/user_upload/REHVA_COVID-19_guidance_document_V4.1_15042021.pdf (accessed on 20 October 2021).
  41. ASHRAE. ASHRAE Position Document on Infectious Aerosols. 2020. Available online: https://www.ashrae.org/file%20library/about/position%20documents/pd_infectiousaerosols_2020.pdf (accessed on 20 September 2022).
  42. ASHRAE. Coronavirus (COVID-19) Response Resources from ASHRAE and Others. Available online: https://www.ashrae.org/technical-resources/resources (accessed on 20 September 2022).
  43. Nielsen, P.V. Fifty years of CFD for room air distribution. Build. Environ. 2015, 91, 78–90. [Google Scholar] [CrossRef]
  44. Mohd Rosli, M.A.; Hiew, S.J.; Mohd Azhar, N.I.; Saputra, M.; Ali, S. A Simulation Study of Drying Chamber for Marine Product. Int. J. Integr. Eng. 2021, 13, 62–69. [Google Scholar] [CrossRef]
  45. Noh, A.M.; Mat, S.; Ruslan, M.H. CFD simulation of temperature and air flow distribution inside industrial scale solar dryer. J. Adv. Res. Fluid Mech. Therm. Sci. 2018, 45, 156–164. [Google Scholar]
  46. Yao, J.; Zhong, J.; Yang, N. Indoor air quality test and air distribution CFD simulation in hospital consulting room. Int. J. Low-Carbon Technol. 2021, 17, 33–37. [Google Scholar] [CrossRef]
  47. Staveckis, A.; Borodinecs, A. Impact of impinging jet ventilation on thermal comfort and indoor air quality in office buildings. Energy Build. 2021, 235, 110738. [Google Scholar] [CrossRef]
  48. Messan, S.; Shahud, A.; Anis, A.; Kalam, R.; Ali, S.; Aslam, M.I. Air-MIT: Air Quality Monitoring Using Internet of Things. Eng. Proc. 2022, 20, 45. [Google Scholar] [CrossRef]
  49. LVS. EN 16798-1:2019; Energy Performance of Buildings—Ventilation for Buildings—Part 1: Indoor Environmental Input Parameters for Design and Assessment of Energy Performance of Buildings Addressing Indoor Air Quality, Thermal Environment, Lighting and Acous. CEN: Brussels, Belgium, 2019.
  50. Mikola, A.; Hamburg, A.; Kuusk, K.; Kalamees, T.; Voll, H.; Kurnitski, J. The impact of the technical requirements of the renovation grant on the ventilation and indoor air quality in apartment buildings. Build. Environ. 2021, 210, 108698. [Google Scholar] [CrossRef]
  51. Mata, T.M.; Martins, A.A.; Calheiros, C.S.C.; Villanueva, F.; Alonso-Cuevilla, N.P.; Gabriel, M.F.; Silva, G.V. Indoor Air Quality: A Review of Cleaning Technologies. Environments 2022, 9, 118. [Google Scholar] [CrossRef]
Figure 1. Scheme of NDIR sensors [31].
Energies 15 06961 g001
Figure 2. Monitoring sensors architecture (Telaire 7001 (old type sensor)).
Energies 15 06961 g002
Figure 3. Schematic of the fully integrated on-chip NDIR CO2 sensor [32].
Energies 15 06961 g003
Figure 4. Supply air control solutions using variable air volume (VAV) units (source: https://www.careforair.eu/wp-content/uploads/2016/02/dcv.jpg (accessed on 9 September 2022)).
Energies 15 06961 g004
Figure 5. Indoor air distribution approaches in mechanical ventilation systems: (a) Mixing ventilation; (b) Displacement ventilation.
Energies 15 06961 g005
Figure 6. Influence of ventilation on the pollution distribution in a room [40].
Energies 15 06961 g006
Figure 7. Air distribution pattern in displacement ventilation system and possible sensor placement (adopted from [47]).
Energies 15 06961 g007
Figure 8. Schematic rooms layout in Case 1 (1 to 3 are room diffusers).
Energies 15 06961 g008
Figure 9. Total air flow rate for Room 1 and Room 2.
Energies 15 06961 g009
Figure 10. Comparison of measurement data of TESTO IAQ probe 0632 1543 and EXTECH SD800.
Energies 15 06961 g010
Figure 11. Comparison of CO2 simultaneous measurements in two different locations.
Energies 15 06961 g011
Figure 12. ONSET HOBO MX CO2 logger monitoring data in the apartment bedroom without mechanical ventilation.
Energies 15 06961 g012
Figure 13. ONSET HOBO MX CO2 loggers monitoring data in the university staff room with mechanical ventilation.
Energies 15 06961 g013
Figure 14. Overall structure of enhanced data management platform.
Energies 15 06961 g014
Table 1. List of analyzed LAQ sensors available on the market.
ModelType of Sensor
Ready to useHOBO MX1102NDIR self-calibrating
Extech SD800dual wavelength NDIR
Aranet4 HOMENDIR
Aranet4 PRONDIR
Testo 160 IAQNo data
Separate moduleMH-Z19BNDIR infrared gas module
CM1106H-NSNDIR
MH-Z14BNDIR infrared gas module
SCD30NDIR
Table 2. Working parameters of analyzed sensors.
ModelMeasurement ParametersMeasurement Range
CO2TemperatureRelative HumidityAtmosphere PressureCO2TemperatureRelative HumidityAtmosphere Pressure
Ready to useHOBO MX1102+++-0 to 5000 0 to 50 °C1% to 70% -
Extech SD800+++-0 to 40000 to 50 °C10 to 90% -
Aranet4 HOME++++0 to
9999
0 to 50 °C0 to
85%
600 to 1100
Aranet4 PRO++++0 to
9999
0 to 50 °C0 to
85%
600 to 1100
Testo 160 IAQ++++0 to 5000 0 to 50 °C0 to
100%
600 to 1100
ModulesMH-Z19B+---0 to
~10,000
- - -
CM1106H-NS+---0 to
2000
- - -
MH-Z14B+---0 to
~10,000
- - -
SCD30+++-0 to 40,000−40 °C to 70 °C0 to 100%-
Table 3. Measurement precision of analyzed sensors.
ModelMeasurements Precision
CO2TemperatureRelative HumidityAtmospheric Pressure
HOBO MX1102±50 ppm ± 5%±0.21 °C±2%-
Extech SD800±40 ppm (<1000 ppm); ±5% (>1000 ppm)±0.8 °C±4%-
Ready to useAranet4 HOME±30 ppm ± 3%±0.3 °C±3%−2 hPa/+3 hPa
Aranet4 PRO±30 ppm ± 3%±0.3 °C±3%−2 hPa/+3 hPa
Testo 160 IAQ±50 ppm + 3%±0.5 °C±2%; ±3%±3 mbar
ModulesMH-Z19B±50 ppm + 5%---
CM1106H-NS±30 ppm + 3%---
MH-Z14B±50 ppm + 5%---
SCD30±30 ppm ± 3%±0.4 °C±3%-
Table 4. Calibration specifics of ready to use sensors.
ModelCalibration Specifics
Manual CalibrationAutomatic CalibrationHeight Compensation
HOBO MX1102Outdoors, dry outdoor air. The sensor needs to stand in the fresh air for 5 min and then it has to be calibrated by pressing and holding the “Calibrate” button for 5 s and within 5 min the sensor will be recalibrated. Calibration value: 400 ppm.Sensors can also be calibrated automatically within the first 24 h and every 8 days. Calibration occurs after 3 CO2 measurements with the lowest indoor value during the first 24 h or day 8. Using this method, it is necessary to leave the room empty (without occupant presence) so that the CO2 level in the room evens out with the outdoor value.During the first configuration, it is necessary to enter the height value above the sea level (in meters). The deviation from the measurements to each mbar from 1.013 mbar can be 0.135%.
Extech SD800No calibration mode. Calibrated by the factory.
Aranet4 HOME/Aranet4 PROOutdoors in the fresh air, the sensor must be calibrated by moving the calibration switch from “Manual” to “Auto” and back to “Manual”. During calibration, the sensor should stand at a distance of at least 1 m from people and plants. Calibration progress will occur on the screen of the device.For calibration, it is necessary to take the device outdoors to fresh air conditions (CO2 ≤ 420 ppm.) for 8 h each month.-
Testo 160 IAQNo calibration mode. Calibrated by the factory.
Table 5. Calibration specifics of modules.
ModelCalibration Specifics
Manual CalibrationAutomatic CalibrationThrough the Command
MH-Z19BConnect sensor contact HD at 0 V for 7 s. Before calibration, the sensor must be held for 20 min in the environment of ~400 ppm CO2.Calibration is carried out daily, considering the lowest CO2 concentration value as 400 ppm.Through “Serial port” the user can send a command that the value of CO2 read is 400 ppm. Before calibration, the sensor must be held for 20 min in the environment of ~400 ppm CO2.
CM1106H-NSIn an environment of ~400 ppm. A calibration command must be sent to the CO2 level sensor.Calibrated automatically for the first 24 h and every 7 days. Calibration is carried out after CO2 measurements with the lowest indoor value during the first 24 h or on day 7. The method requires leaving the room empty (without occupant presence) so that the CO2 level in the room is leveled out with the outdoor concentration.-
MH-Z14BConnect sensor contact HD at 0 V for 7 s. Before calibration, the sensor must be held for 20 min in the environment of ~400 ppm CO2.Calibration is carried out daily, considering the lowest value as 400 ppm.Through “Serial port” the user can send a command that the value of CO2 read is 400 ppm. Before calibration, the sensor must be 20 min in the environment at 400 ppm CO2.
SCD30FRC Field-Calibration Algorithm. Sensor to be placed in a medium with known CO2 levels (400–2000 ppm.) or in fresh air (~400 ppm). Before calibration, the sensor must operate for 2 min in normal mode. The calibration can be done through Sensirion SEK EvalKit software.
ASC Field-Calibration Algorithm. Calibration is carried out daily, considering the lowest value per day as 400 ppm.
Publisher’s Note: MDPI stays neutral with regard to jurisdictional claims in published maps and institutional affiliations.

