1. Introduction
The threat of environmental change on health continues to be at the forefront of policy debates and is at the heart of the global agenda. For this reason, the notion of sustainable development is based on the three pillars of social, economic, and environmental quality sustainability, which have acquired great relevance for the survival of mankind. Disturbances are caused by extreme weather occurrences in ecosystem variability, water availability, infrastructure decline, disruptions in food production, and an increase in morbidity and death rates [
1]. Despite the fact that sustainable growth has been based on three mainstays, the importance of maintaining a healthy ecosystem has grown in this course due to the rapid dispersion of environmental variations and obstinate ecological circumstances [
2]. Meanwhile, the ecological footprint is widely recognized as a linchpin indicator of sustainable development, a standard gauge of environmental deficit and environmental sustainability [
1]. However, the literature explored the ecological footprint as an indication of environmental impact. It compelled researchers to examine the ecological dynamics resulting from human, social, geographical, and economic activity.
As a less polluting technology, nuclear energy ensures a pristine environment, hence enhancing human well-being. Nuclear energy provides and develops greater efficiency and adaptability. It provides access to low-cost, dependable, carbon-free energy for both industrialized and developing nations. Sixty gigatons of carbon emissions were avoided during the last 50 years due to nuclear energy [
3]. This sort of energy transmits a massive amount of energy without emitting a significant amount of pollutants while in operation [
3]. It is more economical to use nuclear power plants, provide dependable energy support, contribute to economic stability, and make a nation climate-resilient by protecting it from climate change. The initial capital expenses of the power plants are high, whereas their operational costs are low. As a result, costs associated with nuclear energy have, for the most part, been consistent and easy to anticipate throughout the last several decades. This is due to the fact that the cost structure of nuclear plants makes changes in nuclear power relatively unnoticeable. However, nuclear power plant energy production increased from 2563 to 2657 terawatt hours (TWh) in 2018 and 2019 [
4]. Nuclear energy may also be used to reinstall non-renewable energy sources in a predictable, safe, secure, and economically sustainable way; hence, nuclear energy will be an essential component in the overall energy transition [
5,
6].
The benefits derived from nuclear power have raised the level of scrutiny of the environmental effect of nuclear energy use. Following the proclamation of the Paris Agreement (PA), nuclear energy use has reached a significant concentration. Several academics and experts [
7,
8] stated that using nuclear energy is a viable option that may be able to overcome the challenges of insufficient ecological resources and inadequate energy security. On the contrary, nuclear power plants need a significant amount of infrastructure construction [
9], as well as hefty capital expenditures, both of which are inadequate in rising nations [
10]. In spite of the fact that nuclear energy units are not directly responsible for a considerable amount of pollution, the relatively small infrastructure footprints of these facilities are superior to the environmental quality compensation they provide. In addition, nuclear power is a sham because of the various difficulties associated with it. Some of these difficulties include the off-site impacts of nuclear catastrophes, radiation disclosure, radioactive waste [
3], as well as explosions [
11]. Additionally, it was shown that conventional energy usage and reliance on foreign sources of energy do little to mitigate pollution when compared to the use of nuclear energy sources [
12].
The endogenous growth theory elucidated the effects of technological advancements on the evolution of the link between economic growth and environmental deterioration. According to this theory, production procedures are improved by increasing the capacity of emission-free and environmentally friendly resources to replace emitting/dirty resources [
13]. Such functions rely on residents’ commitment to the environment; if their real income rises, they may devote more assets and resources to defense. If pollution levels fall as actual economic growth rises, technological breakthroughs will play a key role, and the drop in pollution would be the result of “induced innovation”, according to Hicks’s theory. Whether a patent application as a whole may be seen as a predictor of eco-friendly economic growth is a further challenge that arises in this circumstance from an ecological point of view. Most economic mediators are in agreement that the shift in technological innovation is the key to achieving sustainable economic and environmental growth. This has led to an increased focus on improvement/innovations and their support. In this situation, the question to ask is what impact technological advancement has on reducing the environmental pollution. There were a number of researchers who achieved success in the field of energy on global, sectoral, and national scales. According to Usman et al. [
1], technical breakthroughs are the primary engine of economic development, but their long-term effects on the environment remain uncertain. In one sense, a greater level of economic activity would lead to higher overall levels of energy consumption as well as perhaps increased levels of environmental degradation. As opposed to that, a groundbreaking innovation has the potential to make use of less energy resources, and as a result, it may help maintain the quality of the environment. The challenge is to determine which mesh result is the absolute one. In addition, fraudulent energy practices may be found in any business, not only the energy sector, indicating that energy theft is a problem across the board.
Thus far, many people have responded to the energy crisis by offering their own solutions. Among the most important non-renewables are conventional energy sources such as oil, coal, and natural gas, which have been formed over millions of years. However, due to rising economic growth and global population, non-renewable have been rapidly depleted and are predicted to run out in the not-too-distant future. In addition, non-renewable does serious harm to the environment; hence a shift back to greener energy sources is inevitable [
1]. Solar, geothermal, biomass, hydro, and wind power are only a few examples of renewable energy sources that may be used in their natural state [
14,
15]. Since cleaner energy supplies are both potentially unconstrained and vulnerable to the climate, they can be effectively utilized even while resources for non-renewable energy are scarce and the activities that can be made about non-renewable resources are likewise restricted. Furthermore, the use of renewable and alternative energy sources is seen as a top solution to issues related to energy improvement. Increased solar and wind energy competitiveness leads to a rapid expansion of the renewable energy sector [
16]. One of the most dynamic, rapidly shifting, and ever-evolving industries in the world at present is the cleaner and alternative energy industry. The sector is now the driving force of global economic growth because of technological advancements, decreased costs, and the tremendous impact of new financial institutions. In particular, nations reached a consensus on how to deal with the intimidating effects of climate change via the widespread use of renewable energy technology.
With this context in mind, our investigation contributes to the existing literature by means of the following. Scientists looked at the connection between technological progress, energy use, and environmental deterioration from a wide variety of angles, using a wide range of modeling techniques, and generating a wide range of findings. However, none of them have looked at the connections between nuclear power and other factors such as technical progress, the availability of renewable and non-renewable sources of power, the availability of natural resources, or a country’s carbon footprint. To my knowledge, no studies have looked at how technological progress may have contributed to this correlation. Because advances in technology could lead to the production of cleaner and alternative forms of energy at the same time that the risk of atmospheric contamination is reduced, the technological development parameter is one that should be evaluated as part of the relationship between nuclear energy utilization and carbon footprints. Therefore, the purpose of this research was to address this vacuum in the existing literature by responding to the following questions: If we want to lessen our impact on the environment, which is better: renewable energy or nuclear power among the leading nuclear power producers in the Asia Pacific region? Is there a substitutional or complementary relationship between nuclear power and renewable energy in lowering the carbon footprint? In order to find answers to these concerns, researchers use a wide range of estimating techniques in search of underlying long-term and causal relationships. A sustainable environment may ensure that the environment is protected over the long term, and the projected empirical results will help environmentalists, energy specialists, and development practitioners in rethinking and implementing policy implications that are environment-friendly and emission-free. Furthermore, central bodies and governments favoring investment in the nuclear energy industry will find the current study beneficial.
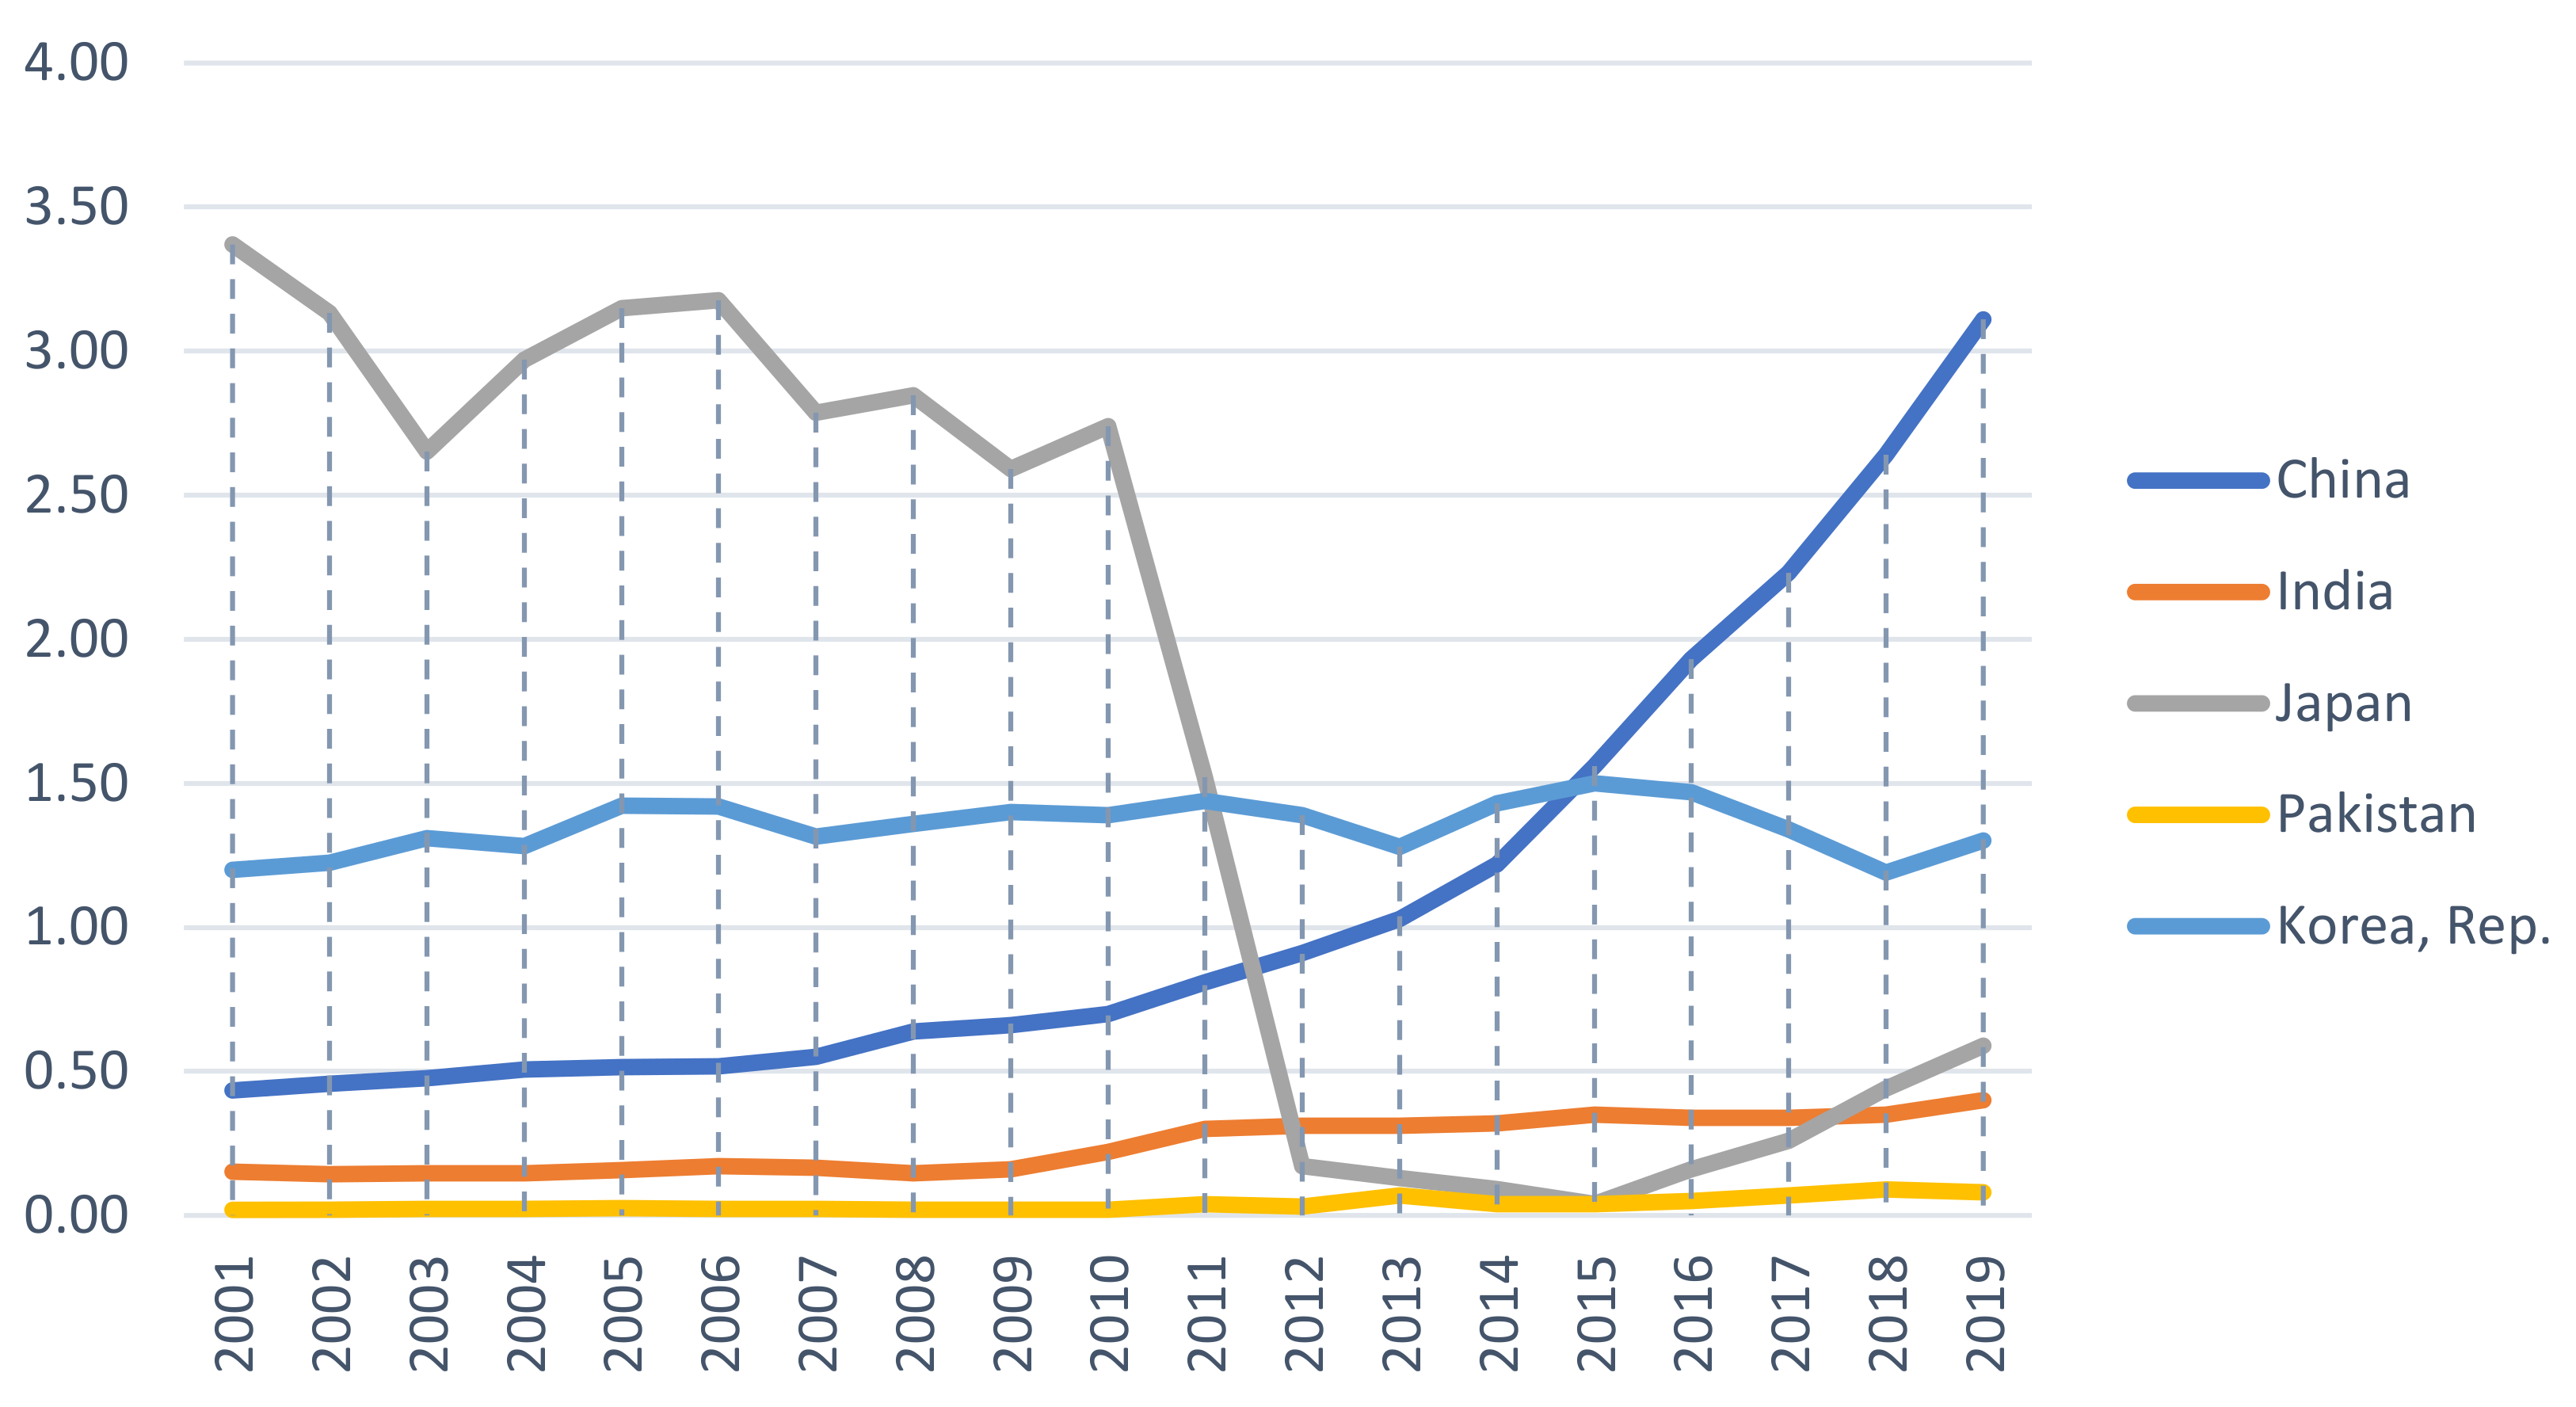
Figure 1 depicts the CO
2 emissions, and
Figure 2 depicts the nuclear energy consumption in the selected Asia Pacific countries.
The remaining sections of this article are as follows:
Section 2 discusses the literature review. Data sources and the econometrics methodology are discussed in the third section; empirical results make up the fifth section; and the conclusion, discussion, and policy recommendation are discussed in the final section.
4. Results and Discussion
This section gives detailed empirical results and discusses the outcomes of these results.
Table 2 provides the descriptive statistics of the variables.
The results of the variables’ unconditional correlations were the starting point of our results. According to
Table 3 results, the carbon footprint correlates positively with all independent factors (nuclear energy, technological innovation, renewable energy, non-renewable energy, and natural resources). Similarly, technical innovation has a positive link with nuclear energy, but nuclear energy has a negative correlation with natural resources, non-renewable energy, and renewable energy. In addition, a negative link exists between technical innovation and renewable energy and natural resources, but a positive association exists between technological innovation and non-renewable energy. Furthermore, renewable energy is related adversely to non-renewable energy and natural resources. Finally, non-renewable energy has a favorable correlation with natural resources.
The consistency and impartiality of traditional panel estimators may be compromised if the cross-sectional dependency is neglected due to geographical variables or particular unknown cofactors. These three methods from
Table 4 were used to verify the results of the cross-section dependency test in order to improve the accuracy of the test’s results. According to
Table 4, the favorable Pesaran CD test, the Pesaran scaled LM test, and Breusch and Pagan LM test are statistically significant at the 1% level. The importance of this potential CSD problem stems from the interconnectedness of nuclear energy-producing nations inside the global environment. In light of the spillover effects, the series is cross-sectionally dependent. All three applied approaches accept the alternate hypothesis, which indicates that there is no cross-sectional dependence.
This research then used panel unit root tests to determine the stationarity property of each data series. It is essential to examine the data series for unit root because using non-stationary data variables may result in skewed information and provides spurious results. Consequently, it is essential to examine the data series for unit roots. The study used three second-generation panel unit root tests, namely the favorable CIPS test, the Breitung and Das test, and the Pesaran CADF.
Table 5 displays the results of unit root tests conducted on panel data. The findings of the selected unit root tests have probability values of less than 5% at the first difference, which indicates that all the selected variables are at least significant at the first difference.
The results of panel unit root tests confirmed that all the variables are at least significant at the first difference; hence, the cointegration test was performed in this study. This research applied the Westerlund and Edgerton [
36] test, which is a dynamically based error correction panel cointegration test that can battle heterogeneity and cross-dependence. Due to the properties of the second-generation cointegration test, it provides trustworthy and more precise information on the cointegration relationship between the variables over the long term. The null hypothesis is the absence of cointegration between the variables, as opposed to the alternative hypothesis, which indicates the presence of a cointegration relationship between the variables. Since the Z-statistics probability value is smaller than the critical value, we adopted the cointegration alternative hypothesis.
Table 6 provides the results of the error correction panel cointegration test. The provided results conclude that the cointegration relationship exists.
The estimated results of the “panel fully modified ordinary least squares” (FMOLS) and “panel dynamic ordinary least squares” (PDOLS) models are shown in
Table 7. Both tests offer the size and sign of the association between the specified variables over the long term.
Nuclear energy and renewable energy have negative coefficients, while technical innovation, non-renewable energy, and natural resources have positive coefficients. In addition, nuclear energy and renewable energy are statistically significant at the 1 percent level, whereas technical innovation, non-renewable energy, and natural resources are statistically significant at the 5 percent level.
Based on the results of the aforementioned experiments, it can be stated that nuclear energy usage may have a negative impact on carbon footprint. This result shows that, since nuclear energy produces almost no carbon emissions, replacing traditional power plants that use non-renewable energy with nuclear power plants could help reduce environmental humiliation caused by nuclear energy use to a vast extent. These findings are consistent with those of [
9,
19,
21,
22]. However, it is imperative to note that, despite the fact that nuclear energy plays a significant role in reducing carbon emissions, organizing nuclear power units always involves a few risks. These risks are largely dependent on broad cross-country differences in political, economic, and social factors. Despite the fact that nuclear energy plays a significant role in reducing carbon emissions, organizing nuclear power units always involves a few risks [
18,
24]. When considering the effects on human health and the environment that nuclear power and other forms of energy consumption and production have, these risks should be evaluated, and efforts should be made to lessen their impact (e.g., renewables and non-renewable energy sources). Nonetheless, it is necessary to keep in mind that nuclear power demands protection and cost management to avoid any catastrophe that might possibly harm humans and the environment. Consequently, while making policy decisions about nuclear power, it is important to carefully evaluate not just its benefit/advantage in reducing carbon footprint but also a number of other features, such as its latent dangers. Moreover, the generation of power from nuclear sources necessitates an enormous concentration pact for safety precautions. In order to avoid unanticipated negative effects on human health and the natural environment, radioactive waste installation and management in nuclear power plants need to be handled with extreme caution [
8]. A further benefit of nuclear energy is that it has tremendous commercial potential [
1]. The spread of nuclear energy ensures economic prosperity and energy security. As part of this endeavor, the estimated evidence suggests that a strategy supporting the acquisition and promotion of nuclear energy utilization as well as the renewable energy deployment growth in the energy mix could assist these countries by achieving their energy security objectives as a complement to the Sustainable Development Goals as well as providing a signal of commitment.
This technological innovation result is consistent with [
38]. The findings demonstrate that the relationship between carbon footprint and technological development is beneficial in the long term. Due to rapid industrialization, it may be assumed that scientific advancements and environmental regulations in these nations are mostly geared toward achieving industrial growth, which is achieved at the expense of the environment by creating ambient environmental contamination. Real economic growth and environmental deterioration are both impacted by the technological modernity initiated in these nations, and it is expected that this will have a negative impact on sustainable development. That being said, the present tactics in these nations must be restructured to internalize the negative externalities caused by the actual trajectories of growth/expansion and ensure environmentally sound growth.
In addition, Carbon emissions are also negatively connected to renewable energy, despite its environmental benefits and its importance as a source of cleaner, greener energy. This implies that the consistent use of renewable energy sources is effective in reducing the carbon footprint in nations with a high nuclear energy production rate, hence preserving the quality of the natural environment. These outcomes are comparable to those of an earlier trial [
1]. Utilizing alternative and renewable energy entails emission-free characteristics; hence, it does not leave a carbon imprint on the environment. These highly nuclear energy-producing nations are on the correct track toward reaching sustainable development objectives via the inclusion and evolution of clean energy technology, as their usage of alternative and renewable energy sources is shown to have a negligible impact on the environment. In addition, these data demonstrate that these nations are transitioning from non-renewable energy sources to cleaner alternatives that are more effective at reducing their carbon footprint. For a sustainable environment, these nations must install cleaner technologies and provide cash for advanced technology to increase the consumption of renewable energy. At present, the nuclear energy-producing nations are focusing on achieving their clean energy goals by reducing the cost of financing, decreasing taxes, and increasing financial support for clean energy projects.
Non-renewable energy contributes to an increase in carbon footprint in nations with a high nuclear energy production rate. Non-renewable energy sources, such as coal, jet fuel, petroleum, etc., have long been acknowledged in the scientific literature as the primary contributor of carbon and other greenhouse gases to atmospheric pollution. In contrast to the unsustainable and limited nature of renewable energy sources, such as fossil fuels, which also contribute to the changing of the climate and global warming through increased greenhouse gas emissions, renewable energy sources are both abundant and widely available, and they also help to reduce environmental degradation. By considering the energy-intensive circumstances of countries that produce a great deal of nuclear energy, increasing one’s level of energy expertise in reducing carbon emissions by encouraging the use of energy-saving technologies is yet another policy choice, which is one of the most important green growth inputs for the countries [
34]. According to the works of [
39] for the United States, [
40] for BRICS countries, and [
1] for BRICS-T countries, continuing to use these fossil fuel energy sources may limit further ecological devastation due to carbon emissions. It was shown that there is a much larger positive magnitude of the use of non-renewable energy sources than there is a negative magnitude of the deployment of renewable and nuclear energy sources with regard to the carbon footprint of the area as a whole. This research indicates that the utilization of non-renewable energy decreases environmental quality.
Finally, it was discovered that the use of natural resources has a beneficial influence that is statistically significant and has a positive effect on the carbon footprint. This illustrates that the mining of natural resources causes environmental harm in nations with a high nuclear energy production rate. This is helpful because extracting natural resources enhances economic expansion directly, which in turn raises environmental damage. Refs. [
14,
41] found comparable results for the BRICS group and 16 European Union nations. According to recent research by [
14], the industrialization process leads to the overuse of natural resources, which significantly increases the region’s pollution levels. In addition, an increase in extractive activity has the potential to provide a number of benefits for economic development, but it also has a negative impact on the environment. Mineral mining, oil, coal, and natural gas may be to blame for biodiversity loss, environmental disparity, deforestation, and soil erosion in these nations, according to this research. Therefore, initiatives to increase the efficiency of natural resource exploitation and reduce their negative impact on the environment are vital.
Table 8 provides the findings of the Dumitrescu and Hurlin Causality approach. The empirical findings reveal only a unidirectional causality between nuclear energy usage and carbon footprint. This illustrates how even a little shift in nuclear energy use may have a noticeable impact on one’s ecological footprint. The results of long-run estimates, which are more important for policymaking authorities and governing, are also consistent with this estimated conclusion. The result is in line with the findings of [
6] for the United States, [
7] for 30 distinct economies, and [
19] for OECD nations. These nations may reduce environmental damage by efficiently managing nuclear energy extraction. In addition, unidirectional causal links were shown between nuclear energy use and renewable energy use, renewable and non-renewable energy use, and natural resources.
Furthermore, a bidirectional causal relationship was discovered between natural resources, renewable and non-renewable energy, and technological innovation with an ecological footprint. The results are consistent with the findings of [
40,
41] for the European Union and the BRICS area, respectively. From the empirical results, it is recommended that any increase in spending on technological innovations that replace fossil fuel energy sources with renewable energy use will drive the carbon footprint in the region.
5. Conclusions and Policy Implications
Globally, environmental contamination has become one of the most talked-about topics. As a consequence of this, practically every country in the world is being pressured to enact and adopt new environmental regulations to help them achieve environmental sustainability without compromising economic development. It is of the utmost importance for developing countries as well as developing economies to significantly reduce their levels of pollution. This is due to the fact that the selected countries are anticipated to substantially contribute to global production and, as a result, are projected to be responsible for a substantial portion of the environmental damage that occurs around the globe. Expansion of clean technology, carbon pricing, and green energy infrastructure are the pillars of eco-friendly initiatives that help decrease environmental exposure. This study aimed to investigate the impact of non-renewable nuclear energy, technological innovation, renewable and non-renewable energy use, and natural resources on the carbon footprint. The area of the study includes the top six nuclear energy countries by consumption in the Asia Pacific region and the time duration is 2001 to 2019. Due to the possibility of cross-sectional dependence, the current study used an estimating method of the second generation. The cointegration results investigated a long-term relationship between the series, and the findings of the Westerlund cointegration test confirmed the cointegration relationship between the series. In addition, the estimated results of the FMOLS and PDOLS models examined that substituting nuclear power plants for those that rely on fossil fuels would considerably lessen the environmental shame associated with using nuclear energy since nuclear power plants produce almost no carbon emissions [
9,
21,
22,
42]. Moreover, the primary motivation behind scientific progress and environmental regulations in major nuclear energy-producing countries is the promotion of industrial growth, which comes at the expense of the environment by producing ambient environmental contamination [
38]. Furthermore, it can be concluded that countries with a high rate of nuclear energy production may reduce their carbon footprint by switching to renewable energy sources such as nuclear energy, which is good for the environment [
1]. Comparatively, renewable energy sources are both sustainable and abundant, and they help to lessen environmental degradation, while non-renewable energy sources such as fossil fuels are limited and unsustainable, and their intensive deployment contributes to climate change and global warming by increasing greenhouse gas (GHG) emissions. Further ecological decline due to carbon emissions may be slowed if we keep using fossil fuels as a source of energy [
1,
39,
40]. Lastly, in countries that produce a lot of nuclear energy, extracting natural resources has negative effects on the environment. Therefore, we all win since natural resource exploitation has an immediate, positive impact on both economic growth and, by extension, environmental degradation [
14,
41].
Finally, the causality studies of Dumitrescu and Hurlin revealed a unidirectional relationship between nuclear energy and carbon footprint. In contrast, a bidirectional causal relationship was exposed between technical breakthroughs, renewable and non-renewable energy, and carbon-intensive natural resources. These findings suggest that these variables have a substantial impact on the carbon footprint of the leading nuclear energy-producing nations. According to these calculations, nuclear and other energy sources, as well as carbon pricing, might be used to further the decarbonization goal. In contrast, a lack of access to clean fuel and green technologies, as well as a small proportion of cleaner energy sources in the conventional energy mix, are expected to increase carbon reimbursement. As a result, the carbon footprint will be significantly affected by policy orientations toward all these explanatory indicators. Despite these benefits, the production of radioactive wastes such as uranium mill tailings and used reactor fuel raises various medical risks associated with nuclear energy usage. For millions of years, these substances may be radioactive and harmful to human health. It may result in radiation sickness, heart problems, cataracts, several forms of cancer, and even death.
In light of this study’s empirical findings, there are a number of policy-level recommendations that might help these nations advance their environmental and economic goals simultaneously. First, with regard to the significant role that nuclear energy plays, the findings of this study lend support to the argument that the consumption of nuclear energy can be utilized as an essential source of energy in the development of long-term environmental policies and energy sources that are capable of meeting the growing demands for energy all over the world. Increased investment in nuclear energy supply and fewer constraints on nuclear energy evaluation are two areas where businesses and governments might benefit from significant encouragement. Additionally, preliminary efforts should be made to develop and produce nuclear energy infrastructure. Promoting additional initiatives connected to Public–Private Partnerships (PPPs) and recognizing barriers to expanding investments in alternative and cleaner energy sources might also enable domestic private shareholders and investors to be more actively involved in the broad spectrum of cleaner energy movements. Concerns expressed by private investors regarding governance-related threats may increase the burden of revolution on national governments and politicians. We also found that the circumstances in each country that generates nuclear power are unique; thus, the Paris Agreement (PA) should leave room for nuclear power if enough countries want to use it, which would improve the efficiency and cost-effectiveness of their efforts to lessen the environmental pollution. Since nuclear power generation has such devastating long-term consequences for people and the environment, it necessitates stringent safety and security procedures. However, it is crucial to keep in mind that nuclear power production necessitates protection and safety controlling expenses to avoid any accident that may seriously hurt the environment and damage people. Therefore, policy decisions surrounding nuclear energy should be assessed carefully from a number of perspectives, including its value in reducing environmental pollution, as well as its prospective hazards.
Second, public policies must provide financial assistance for various technical innovation initiatives, particularly the development of associated technologies that can ensure complementarity between reduced high economic growth and pollution. Credit systems that favor the manufacturing sector in promoting improved nuclear resolutions should also put stock in technical progress as a means of gauging energy efficiency in order to encourage expanded nuclear resolves. In order to lessen the impact of the environmental effects of natural resource rent in these nations, it is also essential to increase the use of eco-friendly equipment. The authors believe that technical progress in both natural resources and nuclear energy produced promising outcomes, despite the fact that the literature may take into consideration a direct dynamic link between natural resource rent and environmental damages. Moreover, the governing bodies and policymakers of these nations must stimulate private industry initiatives for the development of improved nuclear energy solutions and, subsequently, environmental protection. This proposal will help these nations take the first step toward reaching SDGs 7, SDGs 8, SDGs 9, and SDGs 13.
Third, in order to reduce environmental pollution, governments and policymakers should implement regulatory tactics, increase energy modernization, and encourage investment in alternative energy resources. Cleaner energy use improves human well-being. The additional energy that is produced as a result of economic growth needs to be repurposed into more environmentally friendly energy sources, and the progression of technology ought to be mandated as a practical method for reducing one’s carbon footprint. In order to reduce environmental issues, governing bodies and policymakers in these nations should implement energy conservation strategies that are both timely and efficient. This might be accomplished by introducing low-carbon, clean, and reduced non-renewable energy usage in these nations. Regarding energy conservation, it is recommended that renewable and alternative energy sources be put into use to lessen reliance on aging power infrastructure and guarantee reliable supply in a few large-scale deployment areas. This should include the industrial, residential, and transportation sectors, among others. In addition, officials should publish guidelines about the pricing of renewable and cleaner energy to encourage companies and people to rapidly transition away from energy generated by fossil fuels and toward renewable and alternative sources of power.
Fourth, the governing bodies of these nations need to immediately begin deliberating on how to make the most of the positive environmental impact that can be caused by technological advances in order to promote the preservation of the natural atmosphere. Therefore, governments should make a significant effort to support technology initiatives and environmental improvement to encourage environmentally friendly policies.
Environmentally friendly technologies and technology policies have an obligation to guarantee that environmental and social problems may be addressed while simultaneously promoting environmentally and economically sustainable growth. In addition, it is essential to determine green and clean criteria for experts with the capacity to defend environmental excellence. The construction of a market podium by technological innovation enables businesses to profitably divide inventive technologies and remuneration while simultaneously establishing perceptive synergies. In addition, the benefits of sustainable economic growth will boost environmental awareness and educational administration policies.
The empirical analyses in this work were conducted at an aggregate level. This may be seen as the primary limitation of the research. A further disadvantage of the current research is its small sample size (only six nations) with the Asia Pacific region data (2001–2019). Future studies may be conducted on other samples and may include numerous additional nuclear energy-related parameters in order to investigate this association in depth. In the upcoming research, corruption, financial development indicators, governance, environmental-related technologies, human capital, institutional quality, income inequality, and poverty can all be included in this relationship. By using these metrics, policymakers may better safeguard environmental quality, foster economic growth, and promote a variety of other areas.

 ,
, 


