1. Introduction
Many years of development and the use of various technical solutions in electrified transport require the analysis of phenomena both in the power system and in the vicinity of electrified railway lines. This is due to the different types of electrical engineering used, which differs in the type and configuration of the power supply, the equipment of the main circuits and the propulsion of vehicles.
Electric vehicles in railway systems are the source of time-varying non-linear loads due to speed changes and operating conditions. Therefore, they generate a number of electrical disturbances, which affect power lines and stations, railway traction systems and other vehicles using the traction system lines [
1,
2,
3].
There are also known phenomena afftecting the quality of electric energy from the high voltage AC network to the lower voltage level of the railway traction [
4], which are of concern in the conversion of energy parameters between AC and DC power systems. As a result of the occurrence of AC harmonics, the phenomena of voltage fluctuations and dips in the DC system is induced [
5].
Voltage drops are also caused by transients that occur in the DC collection system, i.e., in the pantograph of electric traction vehicles [
6,
7]. The operation of the pantograph causes the appearance of an electric arc, which is a phenomenon that is inevitable during the consumption of direct current by the electric rolling stock [
8,
9].
In countries where more than one electric traction power supply system is used, the issue of the proper functioning of two, and sometimes more systems, has been around for a long time: e.g., a railway powered by 15 kV AC 16.7 Hz or 25 kV 50 Hz, metro powered by the 750 V DC third rail, and a tram powered from the overhead catenary system with a voltage of 600 V DC. There are different power supply systems for electric vehicles in Poland, but only DC voltage with a different rated value of 3 kV DC on the railroad, 750 V DC in the metro, 600 V DC in trams, and in Warsaw suburban access glue is used. All these systems, especially in cities, i.e., in highly urbanized areas and rich in technical infrastructure (also underground), are in contact and must function properly due to their proximity. The observed increase in interest in electric transport and the plans to build High Speed Railways in Poland will lead to the application of a new 25 kV 50 Hz alternating current power supply system. As in other countries, the contact areas of AC and DC systems will become inevitable [
10,
11]. Polish railways will face the issue of ensuring adequate compatibility, above all, of the 3 kV DC system used with other power supply systems in the area of contact, and in particular ensuring electromagnetic separation between AC and DC systems [
12].
The issues of the impact of power supply to railway means of transport and issues related to the power supply of the DC system are analyzed and discussed in many scientific publications. One of the ways to reduce the influence of traction vehicles on the supply network is to optimize the operation of the traction supply system with reversible substations. Converting the existing DC traction substations into reversible substations is aimed at improving the quality of energy, and in particular limiting the power consumed by traction vehicles and thus maintaining the appropriate operating voltage profile of the traction system [
13]. The proposed solutions include regenerative rectifiers and increasing energy efficiency thanks to energy quality conditioning and ending with the recovery of vehicle braking energy [
13,
14]. The analysis and assessment of the influence of DC electric traction on the quality parameters of the supplied electricity is also the subject of many articles and studies. One of the possibilities of eliminating unfavorable interactions is the use of substation and compensation-energy filters [
15,
16,
17]. A very important issue is also the determination of the scope of current and voltage harmonics propagation along the traction lines and to the power supply systems with higher voltage [
18,
19,
20,
21,
22].
The development of railway electrification also has an impact on the quality of the supplied energy, which in practice requires to frequent verification it by means of measurements in order to meet the requirements of the parameters of power supply system [
23]. PKP Energetyka S.A. when connecting individual consumers (e.g., municipal, commercial, etc.) to the line of non-traction needs, additional requirements regarding the quality of electricity are applied [
24].
There are also known measurement strategies for traction supply systems and traction substations, taking into account the large number of power electronic devices used in an electric locomotive [
19]. The conducted tests of harmonics generated by AC-DC and AC-DC-AC electric locomotives respectively confirm their nonlinear properties [
25,
26]. It turned out that electric locomotives in traction power systems constitute a huge non-linear load and adversely affect the quality of energy and the efficiency of the three-phase power grid [
27]. Traction vehicles are characterized by specific energy quality phenomena in which moving loads (trains, locomotives, etc.) interact with the supply network, which supplies electricity via the overhead contact line. Experimental studies have also proved a strong correlation between the operation of 3 kV DC, 2 × 25 kV 50 Hz and 15 kV 16.7 Hz railway networks with the operating conditions of the traction vehicle [
25,
26,
27].
Power quality is a well-recognized topic in conventional 50/60 Hz AC power systems, and many procedures, algorithms and measurement systems have been covered in international standards and widely discussed in the scientific literature. Power quality (PQ) assessment can be a valuable tool for increasing the efficiency of railway systems. The effect of typical DC transients in railway networks on the frequency characteristics of equipment installed on board trains and in AC substations for power quality (PQ) applications provides many new conclusions on disturbances generated by DC electric traction [
28]. A less studied area of research is the assessment of the quality of electricity in power supply systems of railway traction, through standardized monitoring techniques, in particular in relation to DC and 16.7 Hz systems [
29,
30]. In AC electric railways, a significant amount of active and reactive power can be associated with the generated harmonics. Electric railways are characterized by a mixture of moving loads in varying operating conditions with a significant superposition of different distortion patterns [
31,
32]. Connections of DC and AC traction systems will require the estimation of harmonic power for AC railways, and take into account real scenarios of its variability under the influence of operating conditions and moving loads, together with the uncertainty of energy consumption estimation [
33]. It will be necessary to develop new reactive power compensation strategies for the railway infrastructure in order to limit its impact on the supply voltage [
34]. Contrary to traditional traction supply systems, which enable the connection of an electrified railway traction substation to the power grid, new methods of cooperation are introduced based on the principle of phase rotation, using comparative traction transformers in the traction network. Traction vehicles are also modernized and are equipped with two-level and three-level DCAC traction inverters using the innovative DC/AC voltage balancing [
35,
36,
37,
38,
39,
40,
41].
The considered phenomena of propagation of disturbances generated by the traction of the 3 kV DC system are very complex and require a comprehensive approach with the use of measurement techniques, modeling, and computer simulations. Bearing in mind the complexity of the phenomena related to the impact of electric traction power supply systems, the main focus is on the phenomena causing disturbances generated by the traction system.
Research related to the influence of electricity supply on the functioning of transport [
42,
43] prompted the authors to analyze in more detail the issues related to the areas of railways powered by the DC traction system.
2. Methodology of Measurements
The results presented in the article come from over a dozen measurement sessions carried out by the authors. Registrations of electric energy quality indicators covered traction substation networks with six and twelve-pulse converters. Measurements were carried out in accordance with the guidelines contained in standards and regulations [
44,
45]. Electricity quality parameters were also registered in short measuring intervals (five seconds). The five-second measurement intervals allowed to assess the influence of dynamic load changes on the voltage parameters in the traction substation supply networks, non-traction lines and substation auxiliary circuits. For editorial reasons, the most interesting cases are presented.
Figure 1 shows the connection points of electricity quality analyzers.
Points A and A′ are located at the Main Supply Point (MSP). Point A is the primary side of a transformer with rated voltage Un = 110 kV. Point A′ is on the secondary side of a transformer with rated voltage Un = 30 kV. The traction substation is powered by two overhead lines with a voltage of Un = 30 kV. The primary power line with a length of l1 = 6.8 km connects the traction substation with MPS 1. The backup power supply is an overhead line with a length of l2 = 3.6 km supplied from MPS 2. The short-circuit powers are respectively: MPS 1 Scc = 1653/71 MVA and MPS 2 Scc = 1653/76 MVA.
At the traction substation, measurements were made at the following points: B—primary side of the transformer with rated voltage Un = 30 kV, Point C—non-traction needs line—Un = 6 kV, Point D—line of own needs of traction substation Un = 0.4 kV.
The selection of the measurement points presented in
Figure 1 resulted, among others, from z: assessment of the influence of a traction substation on the quality of energy in the power system from which it is supplied (points A, A′) and in the PCC (Point B). The propagation of disturbances (resulting from the characteristics of the traction substation) also takes place to the circuits (lines) of non-traction needs (point C) and own needs (point D). It is especially important to assess the quality of energy in the line of non-traction needs. These lines supply customers who purchase energy from PKP Energetyka. PKP Energetyka holds appropriate concessions allowing it to sell energy on the electricity market.
In the standard [
44] and the Polish regulation [
45] concerning the parameters of electricity quality, the acceptable ranges of changes of voltage changes are given as a percentage of the nominal voltage. For this reason, the authors present changes in voltages and currents in percentages, referring to the nominal values at given measurement points.
3. Main Supply Points
The traction substation is supplied from two independent Main Power Supply Points (MSP 1 and MSP 2) powered by lines with a nominal voltage—U
n = 30 kV—
Figure 1. In case of voltage interruption in MSP1 or power line failure, the substation is automatically supplied from the second Main Power Supply MSP 2).
In Main Power Supply Point (MSP 1), the registration of electricity quality indicators was made at the same time in point A (Un = 110 kV) and point A′ (Un = 30 kV). Sonel PQM-711 analyzers were used for the measurements. The main purpose of the measurements at the MSP was to estimate the influence of DC traction on the power quality.
Figure 2 shows the changes in the harmonic distortion of the voltage THD_U (a) and current THD_I (b) recorded in the three phases of the line feeding the main supply point of MPS 1 (Un = 110 kV). The waveforms are characterized by a significant correlation. Correlation coefficients are as follows:
Due to the significant correlation of the waveforms characterizing the voltage distortion and the current in individual phases, the changes in selected phases (the phase with the highest disturbance values) were analyzed in the following sections.
Figure 3 shows changes in THDU and THDI registered simultaneously in one of the MPS 1 phases at point A (110 kV)—(a) and A′ (30 kV)—(b).
Additionally,
Figure 4 compares the waveforms (changes) of the THDU (a) and THDI (b) harmonic distortion coefficients measured simultaneously at point A and point A′.
The degree of deformation of the current and voltage curve is influenced by the value of the short-circuit power of the network at point A (Scc = 1653 MVA) and point A′ (Scc = 71 MVA) in relation to the power consumed by the traction substation. The main cause of voltage distortion in MPS is the nature of devices installed on the traction substation, i.e., traction rectifiers. Currently, mainly 12-pulse rectifiers are installed, while in older solutions 6-pulse rectifiers are used.
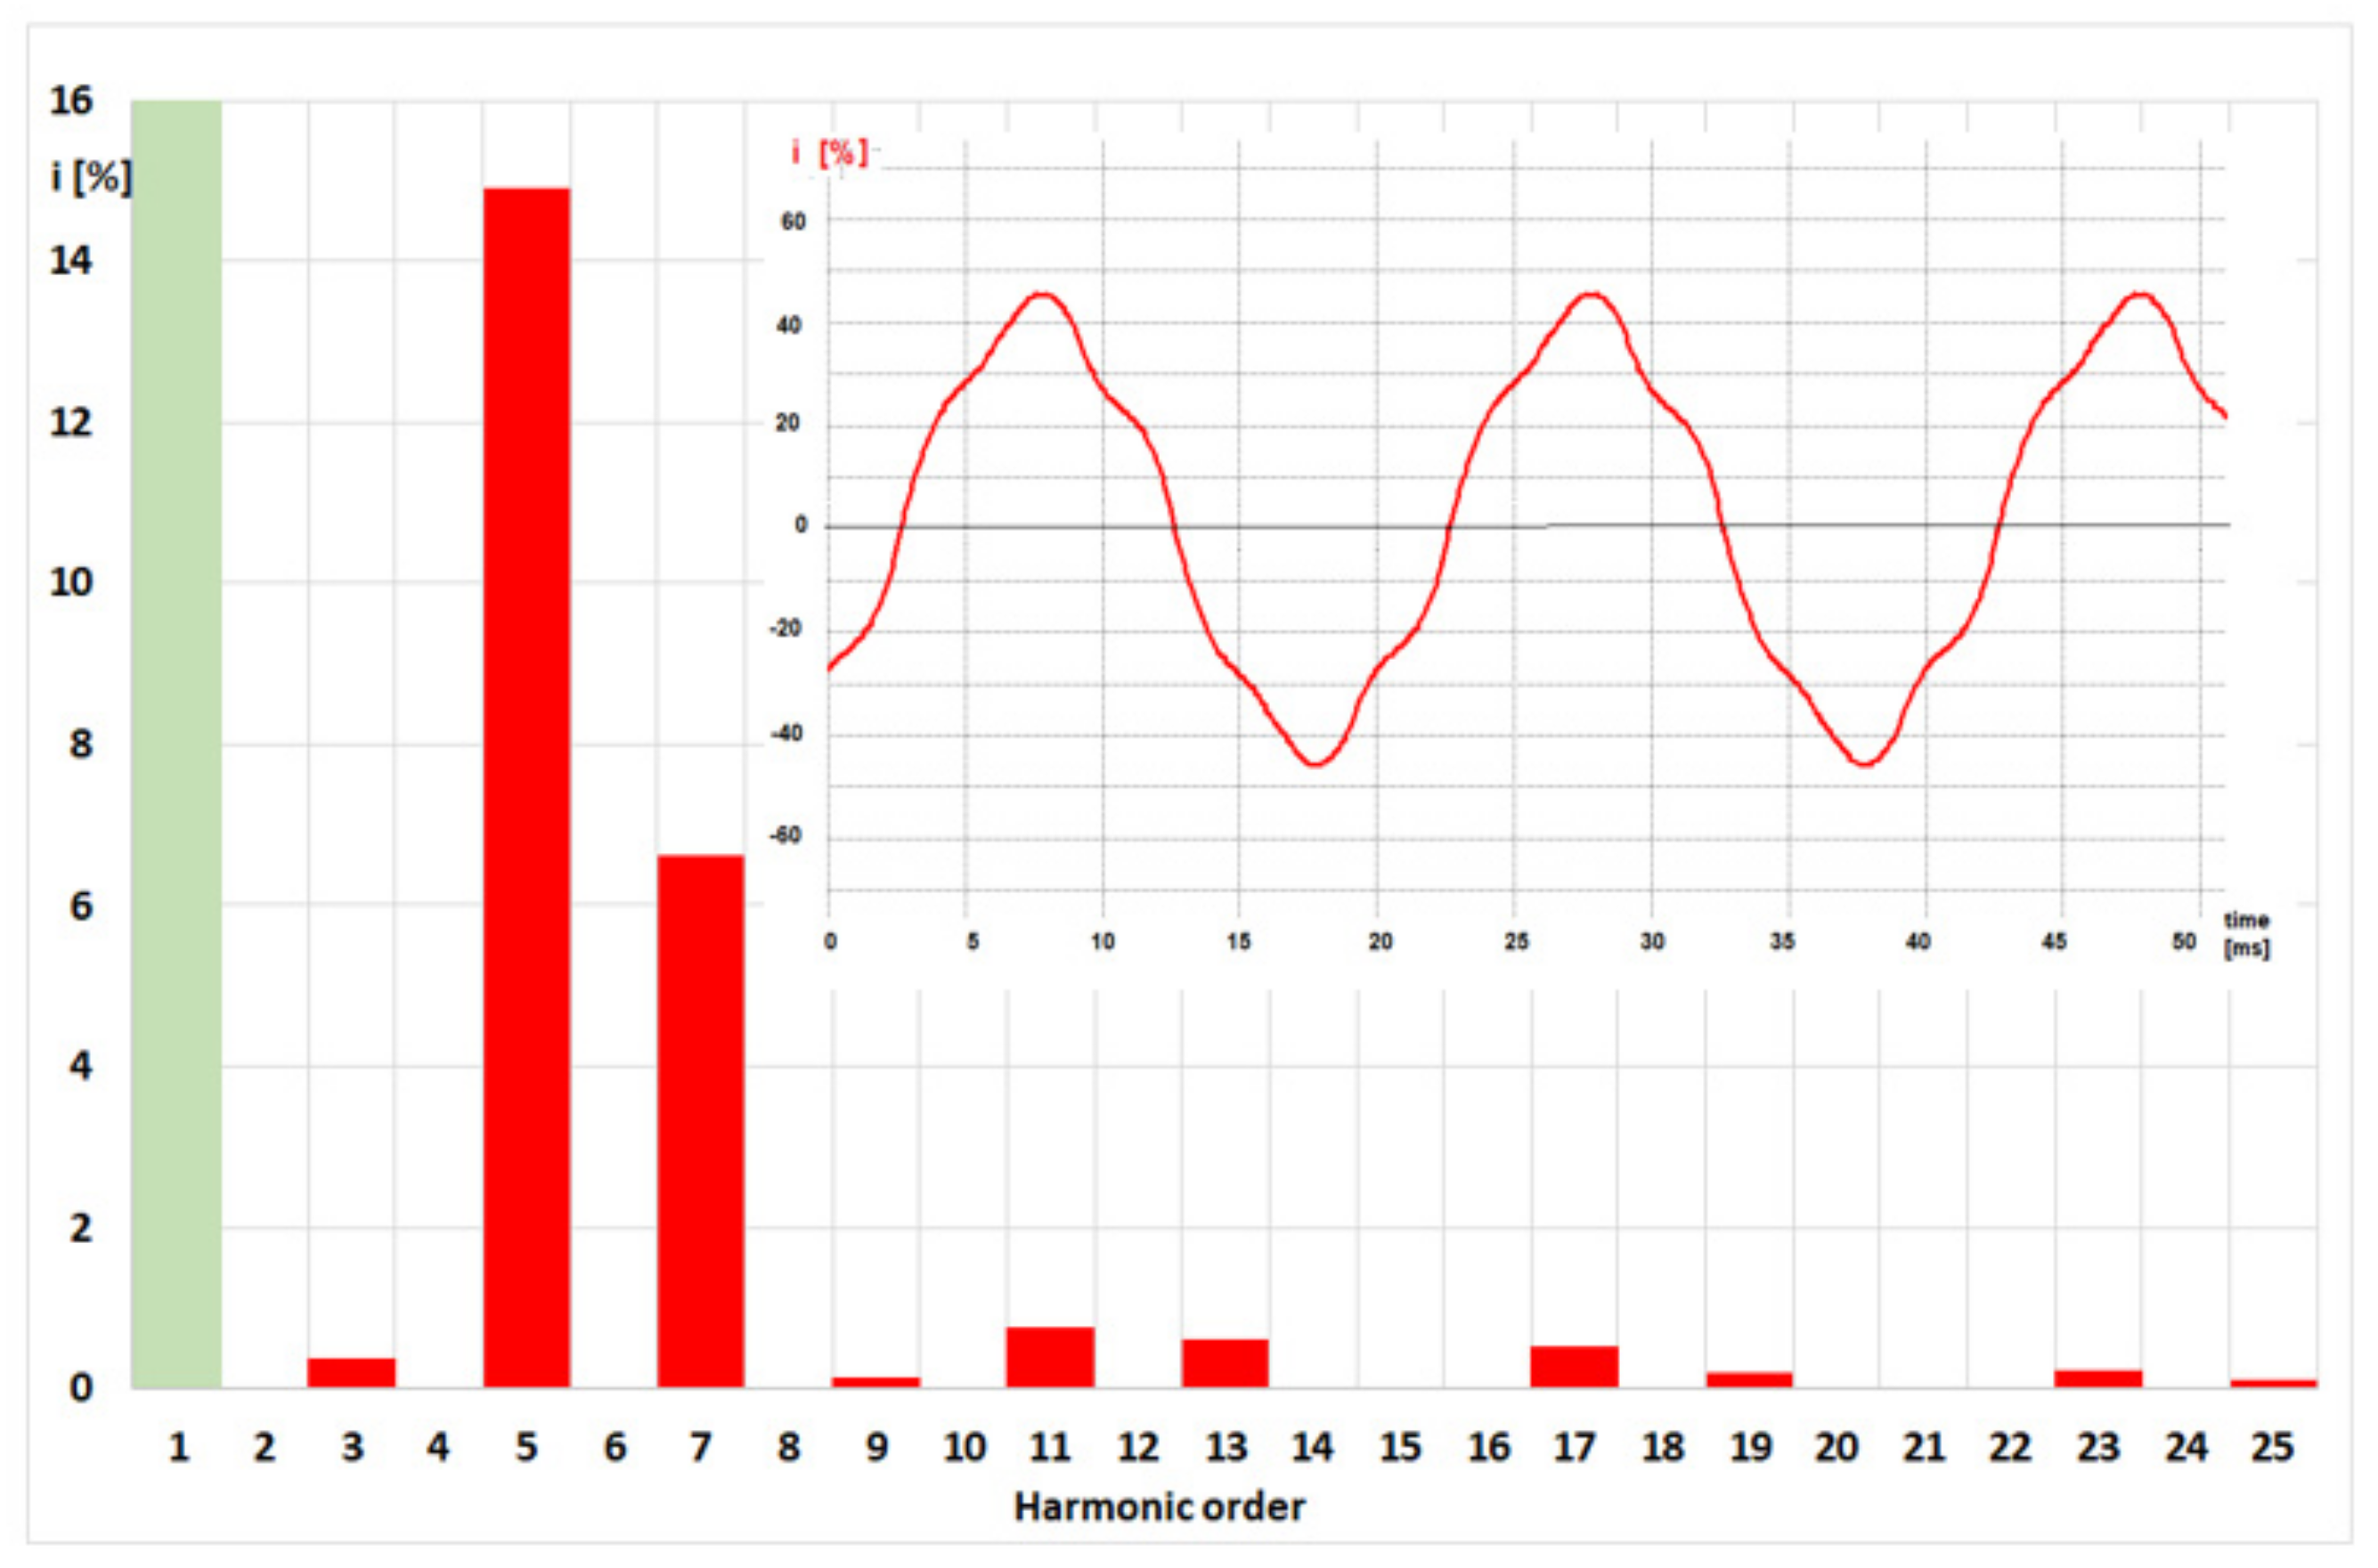
Figure 5 shows the spectrum of voltage harmonics and voltage and current waveforms recorded at point A. The presented current and voltage waveforms were recorded in the supply line of the traction substation with six-pulse rectifier sets.
The distorted current of the substation causes voltage distortion on both the primary and secondary sides of the MSP energy transformer. Spectrum of current harmonics and current waveform recorded at point A shows
Figure 6.
Much higher current distortion takes place at the level of voltage U
n = 30 kV. Spectrum of current harmonics and current waveform recorded at point A’ are shown in
Figure 7.
Point A′—is located on the secondary side of the 110/30 kV transformer installed at the Main Power Point (MSP-1). The short-circuit power of the mains at this point is S
CCA’ = 71 MVA. In relation to the short-circuit power on the primary side, it is over 23 times smaller. The ratio of the short-circuit power S
CCA/S
CCA′ is 23, 28. Such a significant reduction of the short-circuit power results in a significant current distortion—
Figure 7, in relation to the current distortion at point A—
Figure 6. In the publication [
46] it is recommended that in the case of substations with six-pulse converters, the S
nR/S
CCA′ < 0.006 condition should be met, and that using twelve-pulse transformers, the condition S
nR/S
CCA′ < 0.012, where S
nR is the power of the installed rectifier sets.
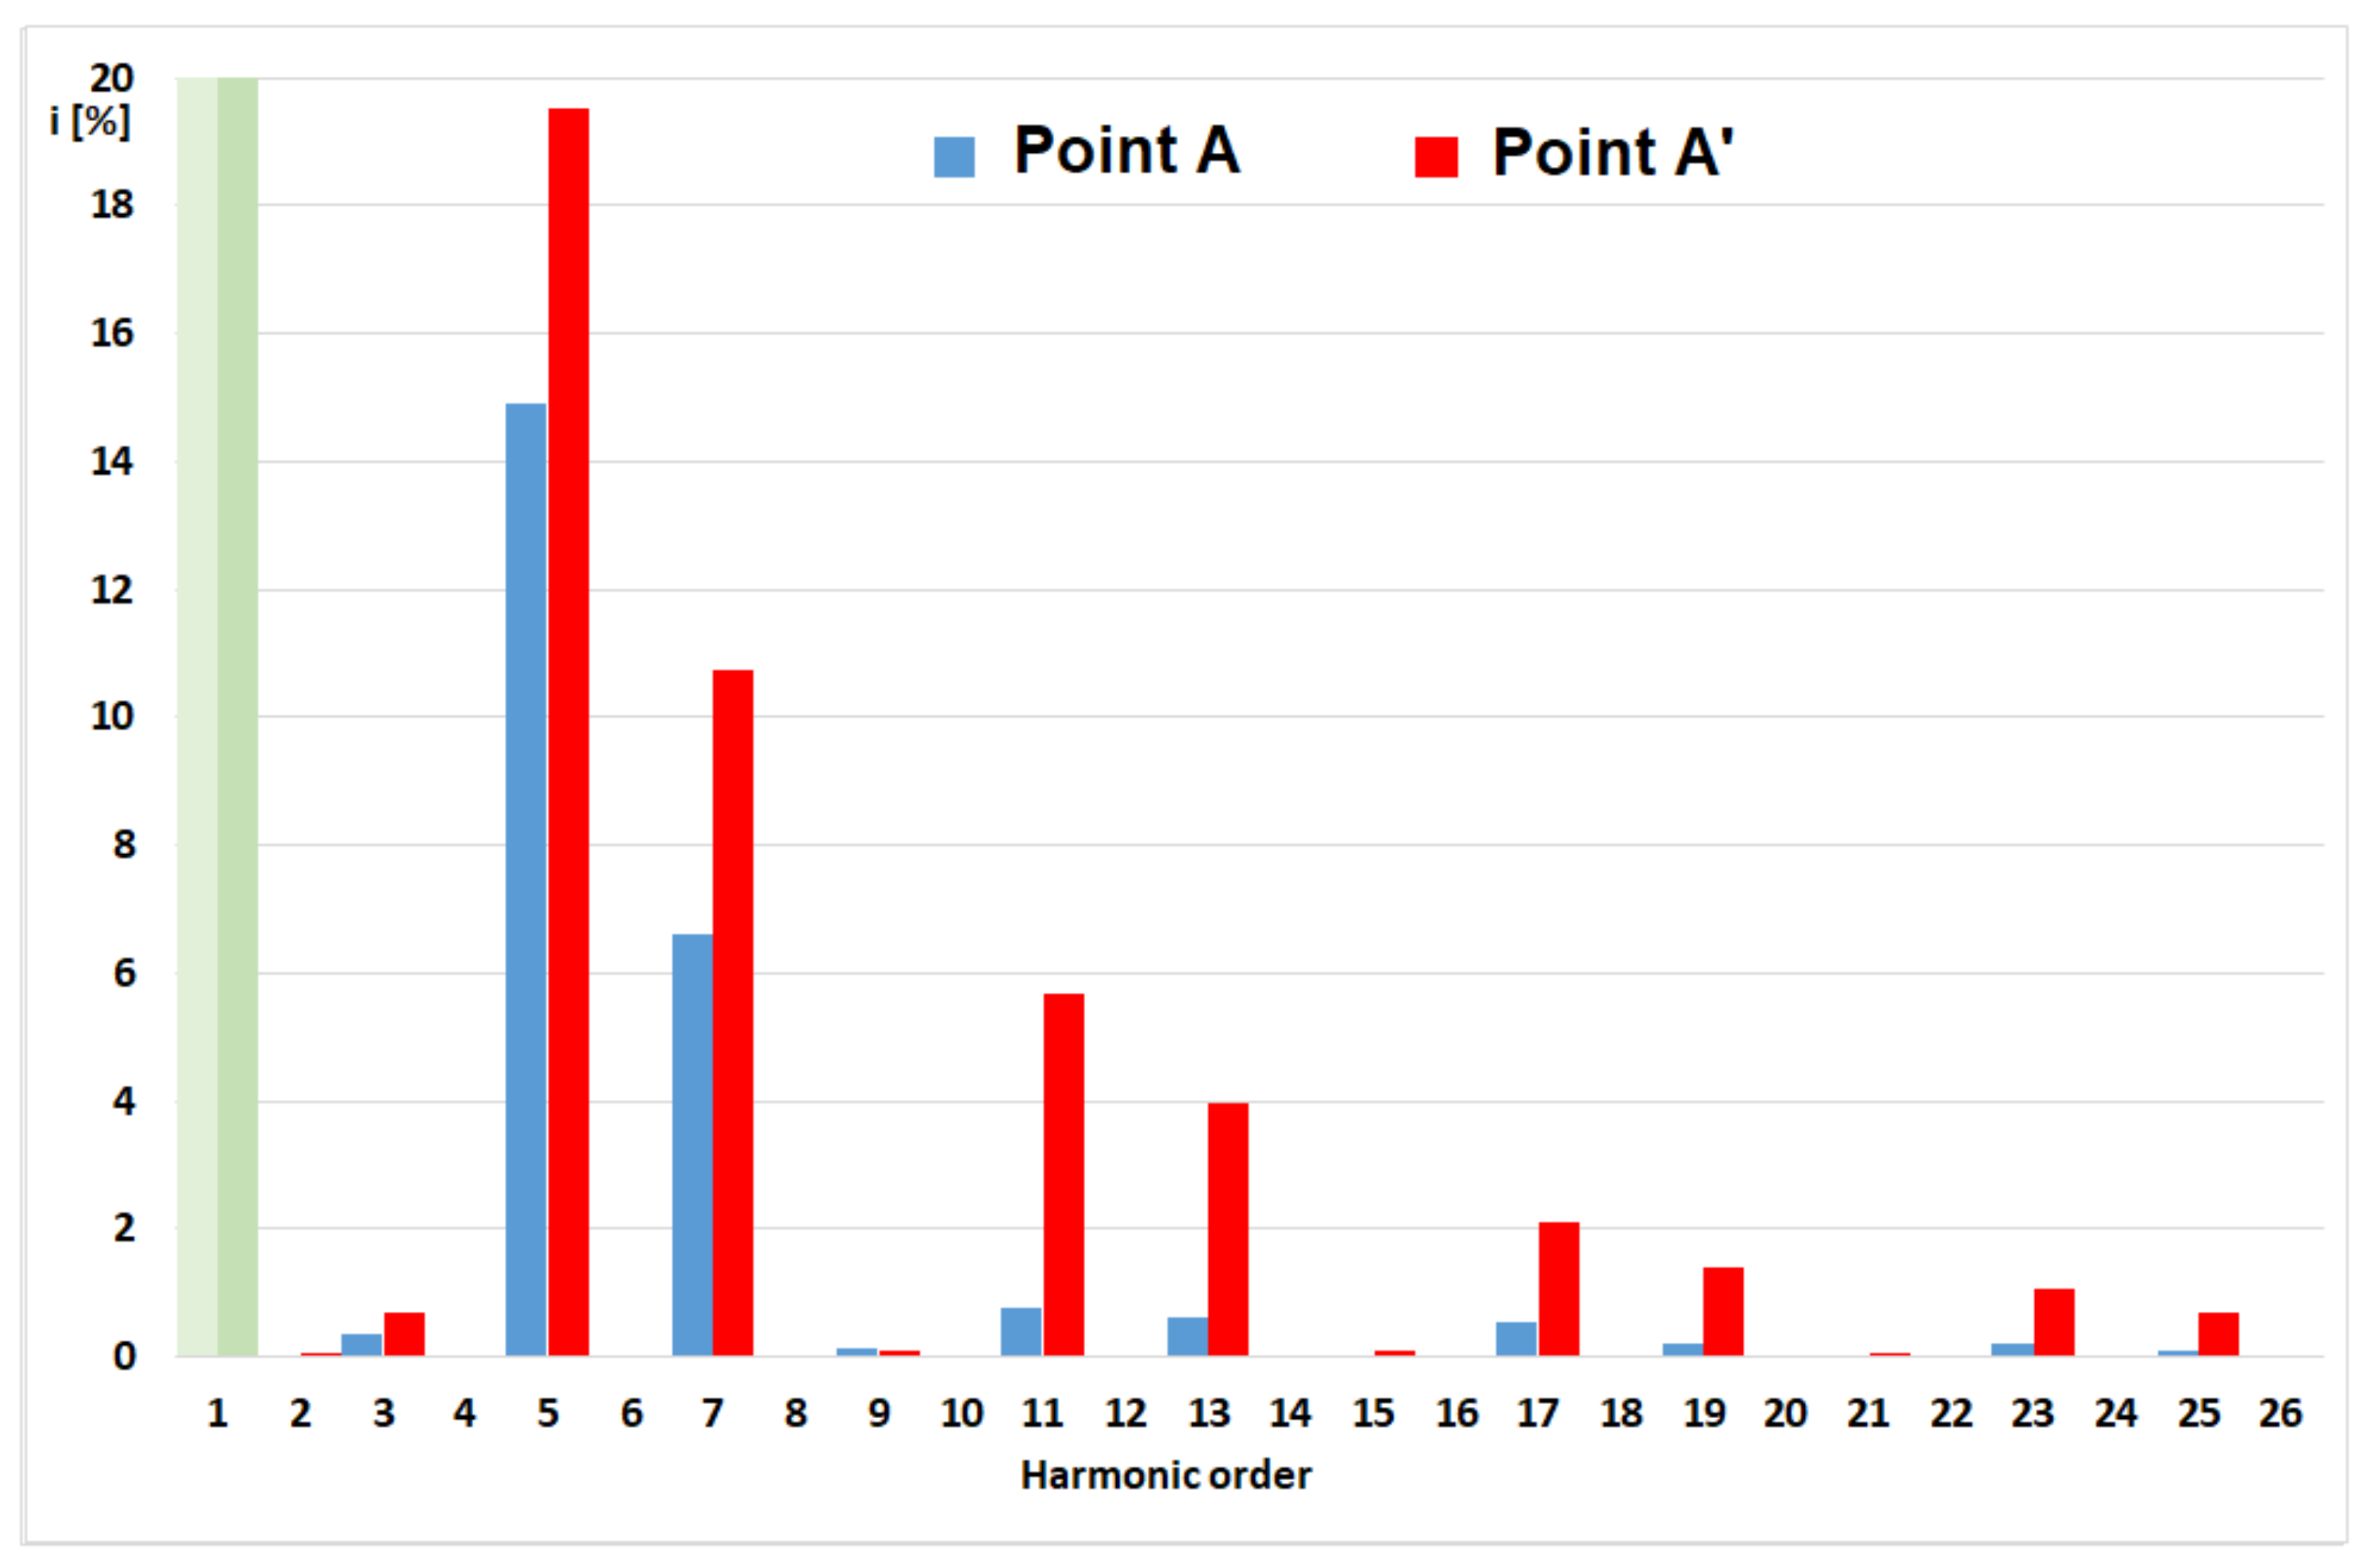
Comparing the percentage content of individual current harmonics recorded in points A and A′—
Figure 8, it was found: the presence of characteristic harmonics for six-pulse converters, i.e., 5, 7, 11, 13, 17, 19, 23, 24 etc., a significant reduction in the content of higher harmonics current with increasing short-circuit power (between points A and A′).
Distorted current causes voltage distortion.
Figure 9 shows spectrum of voltage harmonics measured at point A and point A′. The values of individual voltage harmonics are decisively influenced by the current distortion caused by the load character of the traction substation.
Data shown in
Figure 5,
Figure 6,
Figure 7,
Figure 8 and
Figure 9 are representative of the selected recording time points (with the highest THDU and THDI values). Analyzing the changes in the supply voltage deformation recorded during the week (points A and A′), significant changes during the day were found. The article presents the results of measurements during the greatest disturbances generated by traction substations. Of course, for a different recording time, the waveforms (curves) of currents and voltages as well as the harmonic spectrum distributions may differ.
4. Line Supplying Traction Substation
Parallel to the measurements at the Main Supply Point, energy quality parameters were recorded in the electric traction networks. The connection points of recorders are shown in
Figure 1.
Measurements were made in accordance with [
37]. The measurements were aimed at assessing the quality of electricity in relation to the applicable standards and regulations.
Figure 10 shows a graphical presentation of energy quality indicators measured in the supply line traction substation—Point B.
Individual bars correspond to the values of parameters characterizing the quality of electricity in particular phases. Maximum values are marked in blue, and 95% (95% percentiles) are marked in red. The absence of a red color in the figure means that the values of 95% have not been exceeded
Figure 11 summarizes the values of electricity quality indicators corresponding to the bar chart presented in
Figure 10.
The limit values according to PN-EN 50160 are not exceeded [
28]. The values of the index characterizing the deformation of the voltage curve (THD) and the flicker index (P
st, P
lt) are increased.
The disturbances recorded in point B (PCC of the traction substation and the power system) are also voltage fluctuations with an amplitude not exceeding 10% U
n and duration up to 20 ms (107 disturbances) and voltage dips with the highest value between 30 and 60% U
n—
Figure 12.
As shown in
Figure 10 and
Figure 11, the largest disturbances were recorded in the L2 phase. However, they did not differ significantly from disturbances in phases L1 and L3. The next part of the chapter presents an analysis of the disturbances occurring in the L2 phase.
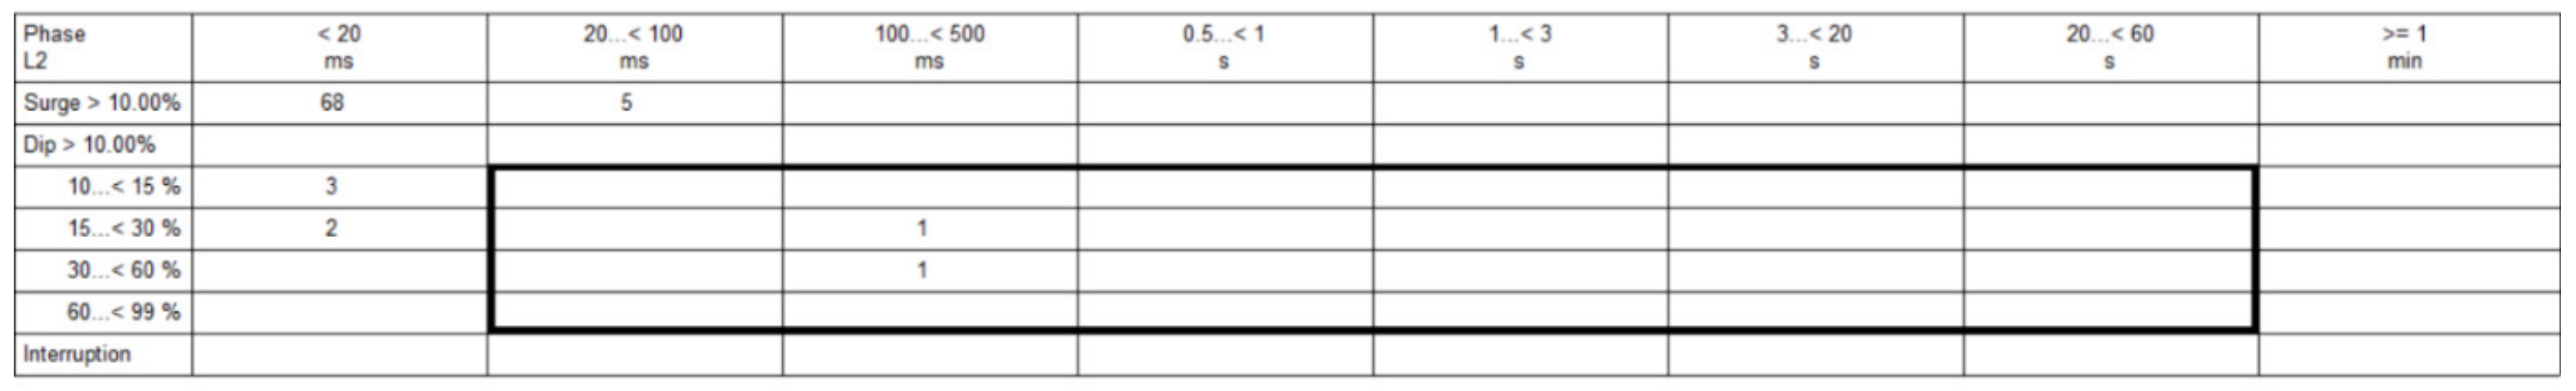
Figure 13 shows registered in the L2 phase voltage dips with the selected time of their length and the size of the individual dips. The area marked with a square shows dips with a time greater than 20 ms and an amplitude of more than 10% of the nominal voltage.
It was assumed that the main disturbance generated by traction substations is the voltage deformation resulting from converters converting alternating voltage to direct voltage. The research results presented in the article indicate that voltage fluctuations and sags are significant disturbances. Voltage fluctuations cause the phenomenon of flickering light. As a result of the performed several dozen measurement cycles, it can be stated that the flickering of light is not a disturbance negatively affecting light sources affecting people. Registered voltage dips may affect the correct operation of safety-related devices.
Contrary to typical disturbing loads causing rapid-changing voltage fluctuations (arc furnaces, welders,), the traction network generates voltage fluctuations resulting from short-circuits and switching overvoltage on the DC side, starts of heavy trains consuming variable power when switching individual stages of starting resistors—
Figure 13 and
Figure 14.
Figure 14 shows changes in the voltage values (U
max—maximum, U
mean—average, U
min—minimum) of the flicker indicators P
st and P
lt recorded during one week in the network supplying the traction substation. U
max and U
min are the smallest and largest values that occur in the ten-minute measuring interval, while U
mean represents the ten-minute mean value. During the measurements, voltage dips and increases were recorded. A particularly rapid increase in the voltage value may lead to damage to electric power devices installed at the traction substation.
Starts of electric trains with high unit powers also cause rapid changes (dips) in voltage. Rapid voltage changes (voltage dips and increases) are caused by activation of circuit breakers supplying individual DC traction lines. These disturbances often coincide with the time of tripping of traction switches. Starts of electric trains with high unit powers also cause rapid changes (dips) in voltage.
DC electric traction mainly causes distortion of the supply voltage.
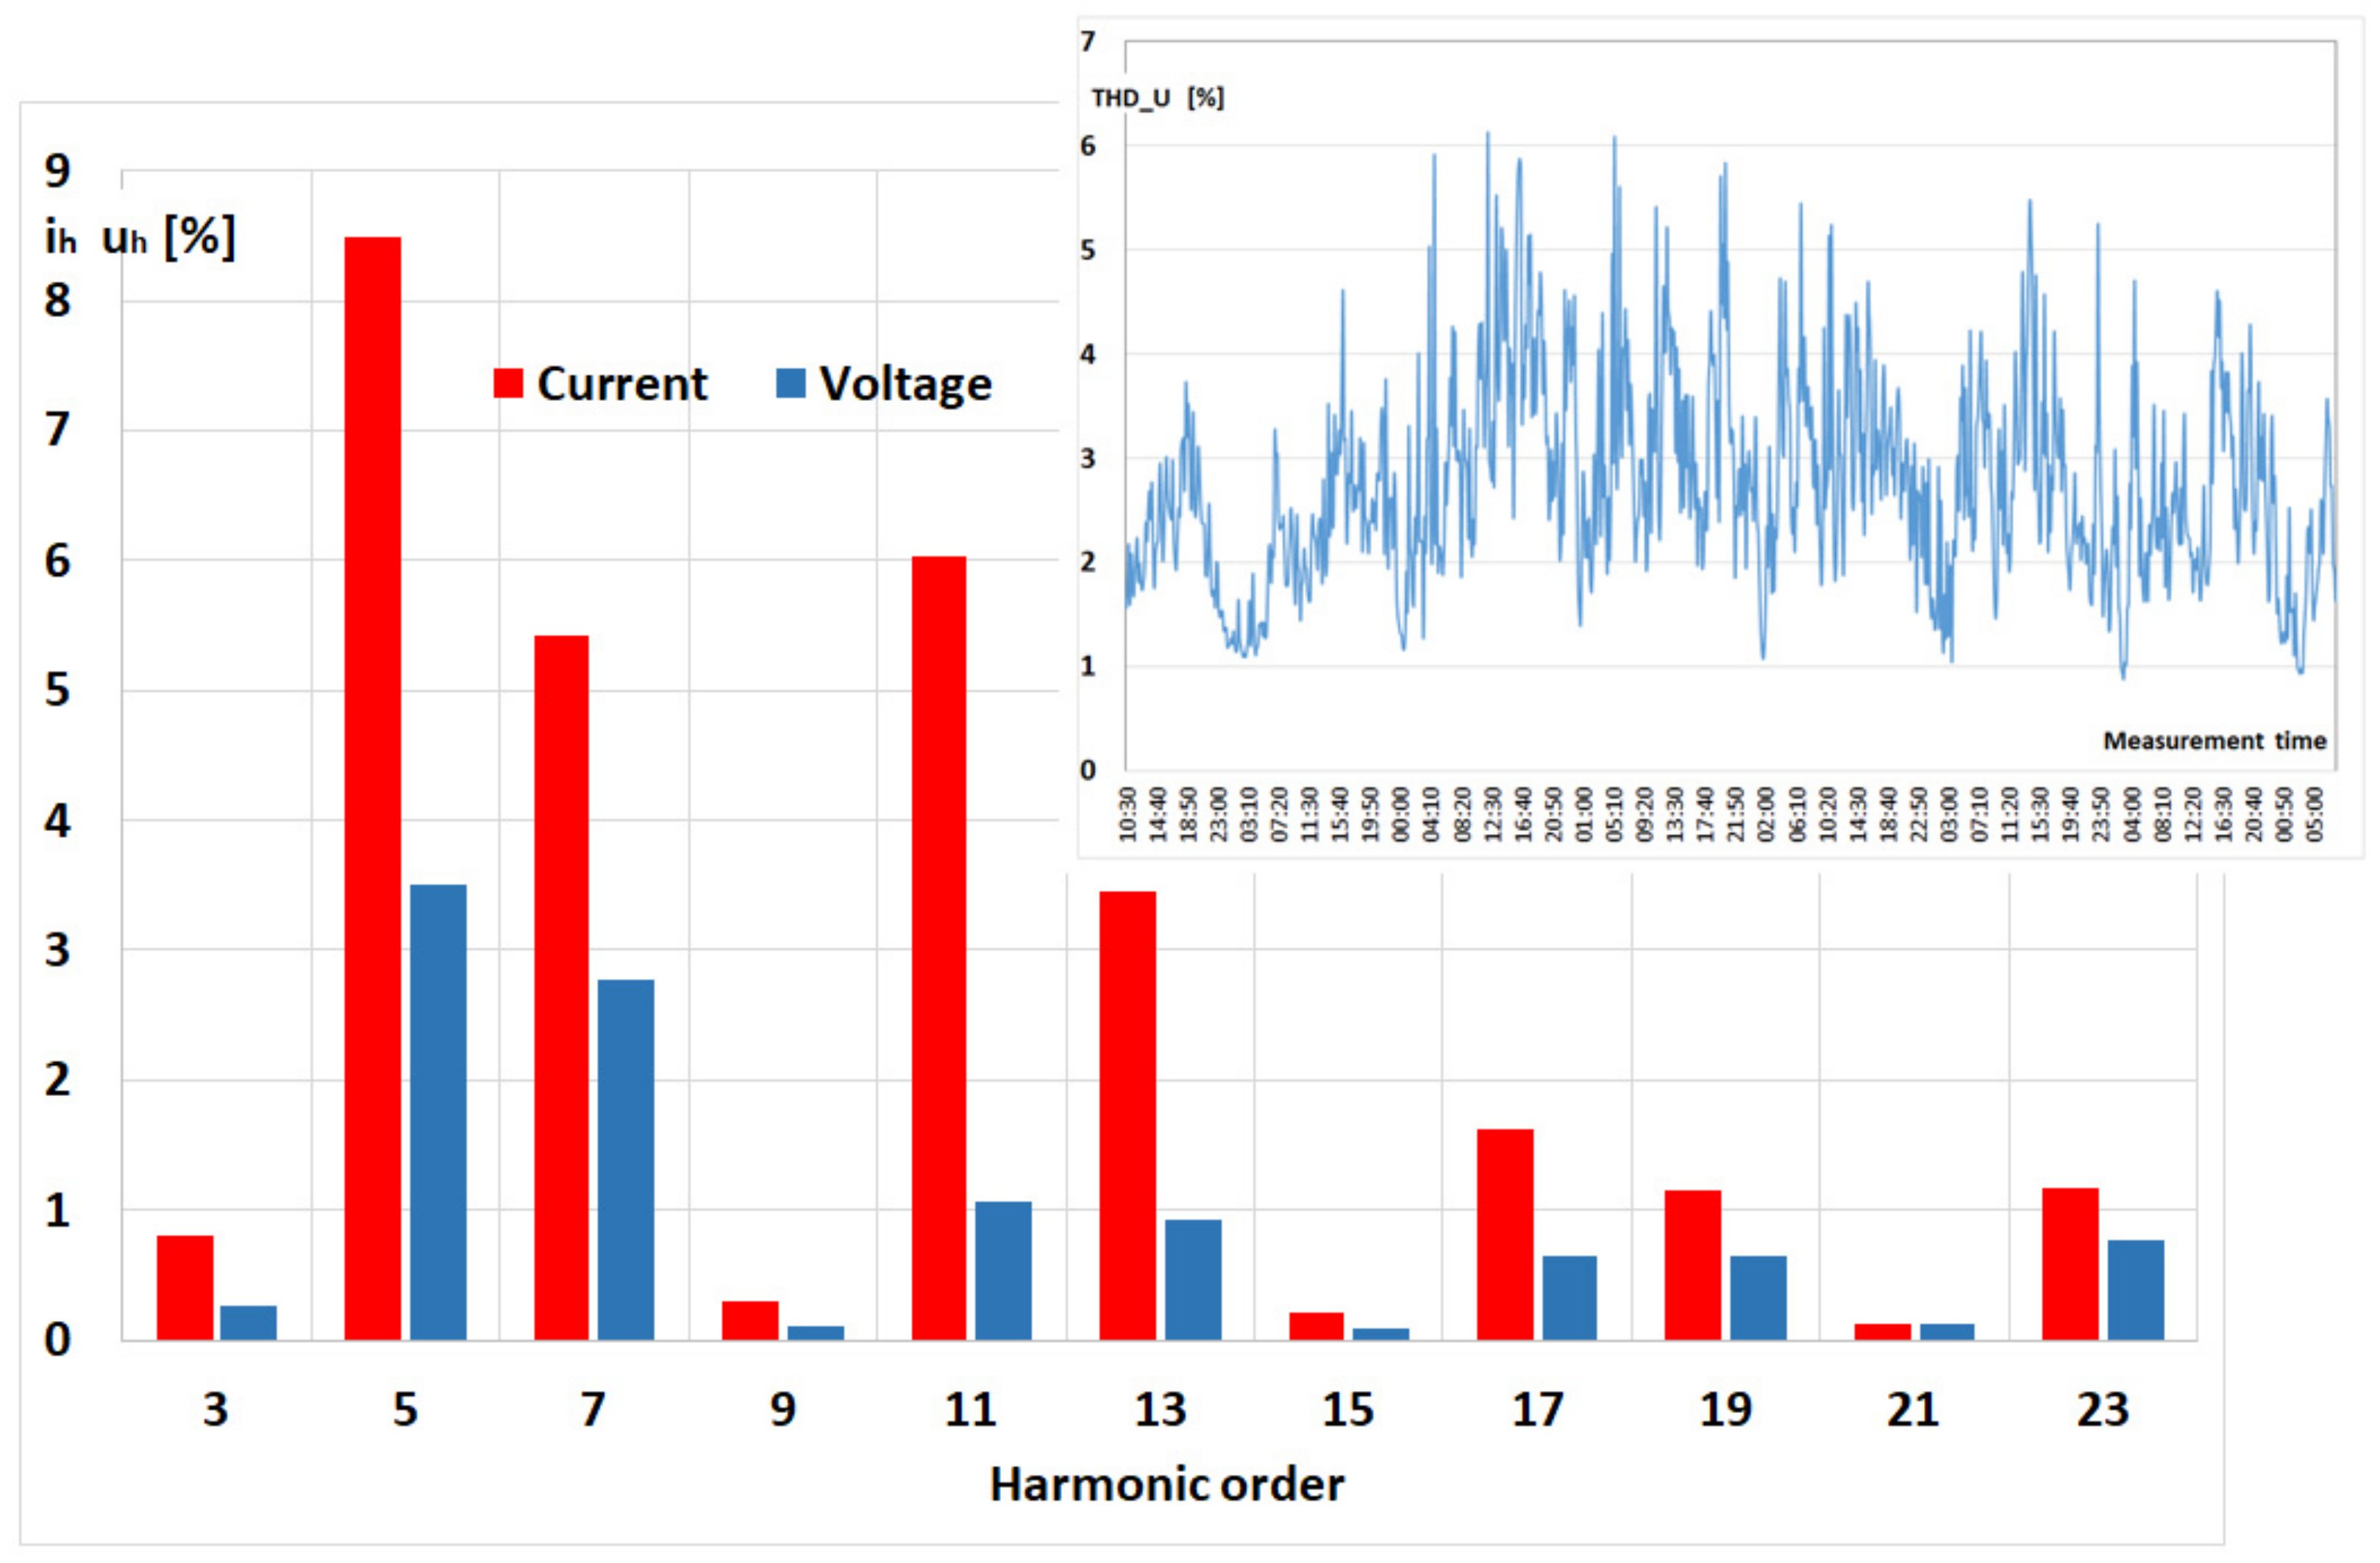
Figure 15 shows the spectrum of voltage and current harmonics measured in point B. The reduced THD_U coefficient was recorded during one week of measurements. The spectrum of voltage and current harmonics presented in
Figure 15 and
Figure 16 concerns the moment when THD_U reached the highest value (THD_Umax) during the week of measurements. In the spectrum of current and voltage, there are higher harmonics characteristic for the load supplied from a six-pulse rectifier. The THD_U values recorded during the week of measurements are characterized by high variability. By analyzing the weekly nature of THD_U changes, a superposition of disturbances generated by the traction substation and other receivers connected to the power system can be observed.
For comparison,
Figure 16 shows a typical course of daily THD_U changes and the harmonic voltage spectrum recorded in line of a municipal consumer. In this case, the THD_U changes are following a day-night pattern typical of traction operation. This means that single consumers do not cause such a large voltage distortion as in the case of a traction substation (
Figure 15).
The level of disturbances generated to the power system by electric traction is also influenced by the dynamics of load changes in the traction substation.
Figure 17 shows the course of the short-term flicker P
st, the voltage supplying the substation and the THD factor. Starting the train results in an immediate increase in the level of light flicker, which is related to the changes in the voltage level both on the DC side and on the side of the network supplying the traction substation.
There is also a relationship between the voltage deformation caused by the load change of the substation and the deformation of the voltage curve.
Figure 17 shows the changes in the voltage higher harmonics content measured with dynamic load changes in the supply line to the traction substation with a twelve-pulse rectifier unit—point B.
The starting of the train results in an increase in current, which is manifested by a simultaneous increase in the THD factor. The highest value of the THD coefficient was measured at the maximum value of the current consumed during the train start-up. During braking, when the current value decreases, the THD factor also decreases. Characteristic harmonics (11 and 13) generated by rectifier sets operating in a twelve-pulse system are visible—
Figure 18.
5. Lines for Non-Traction Loads
In Poland PKP Energetyka being a nationwide company, it ensures uninterrupted power supply to the traction network and non-traction power equipment. Thanks to the concessions of the Energy Regulatory Office for the distribution, transmission, and trade of electricity, it sells electricity, competing with other distribution companies, especially in those regions where the possibilities of devices and favorable location in the vicinity of electricity consumers allow it.
Contrary to devices connected to auxiliary circuits, receivers of very different nature (with variable power consumption, distorted currents, sensitive to interference) are supplied from the non-traction lines. For this reason, to a greater extent than in auxiliary circuits, appropriate parameters of the supply voltage should be ensured. As shown later in the article, also the non-traction needs circuits are influenced by disturbances resulting from the applied rectifier sets (limitation of the 5th and 7th harmonics in twelve-pole sets) and from changes in the substation load. Additionally, there are interferences caused by receivers connected to the circuits of non-traction needs. This is especially important in the case of low short-circuit powers at the PCC point.
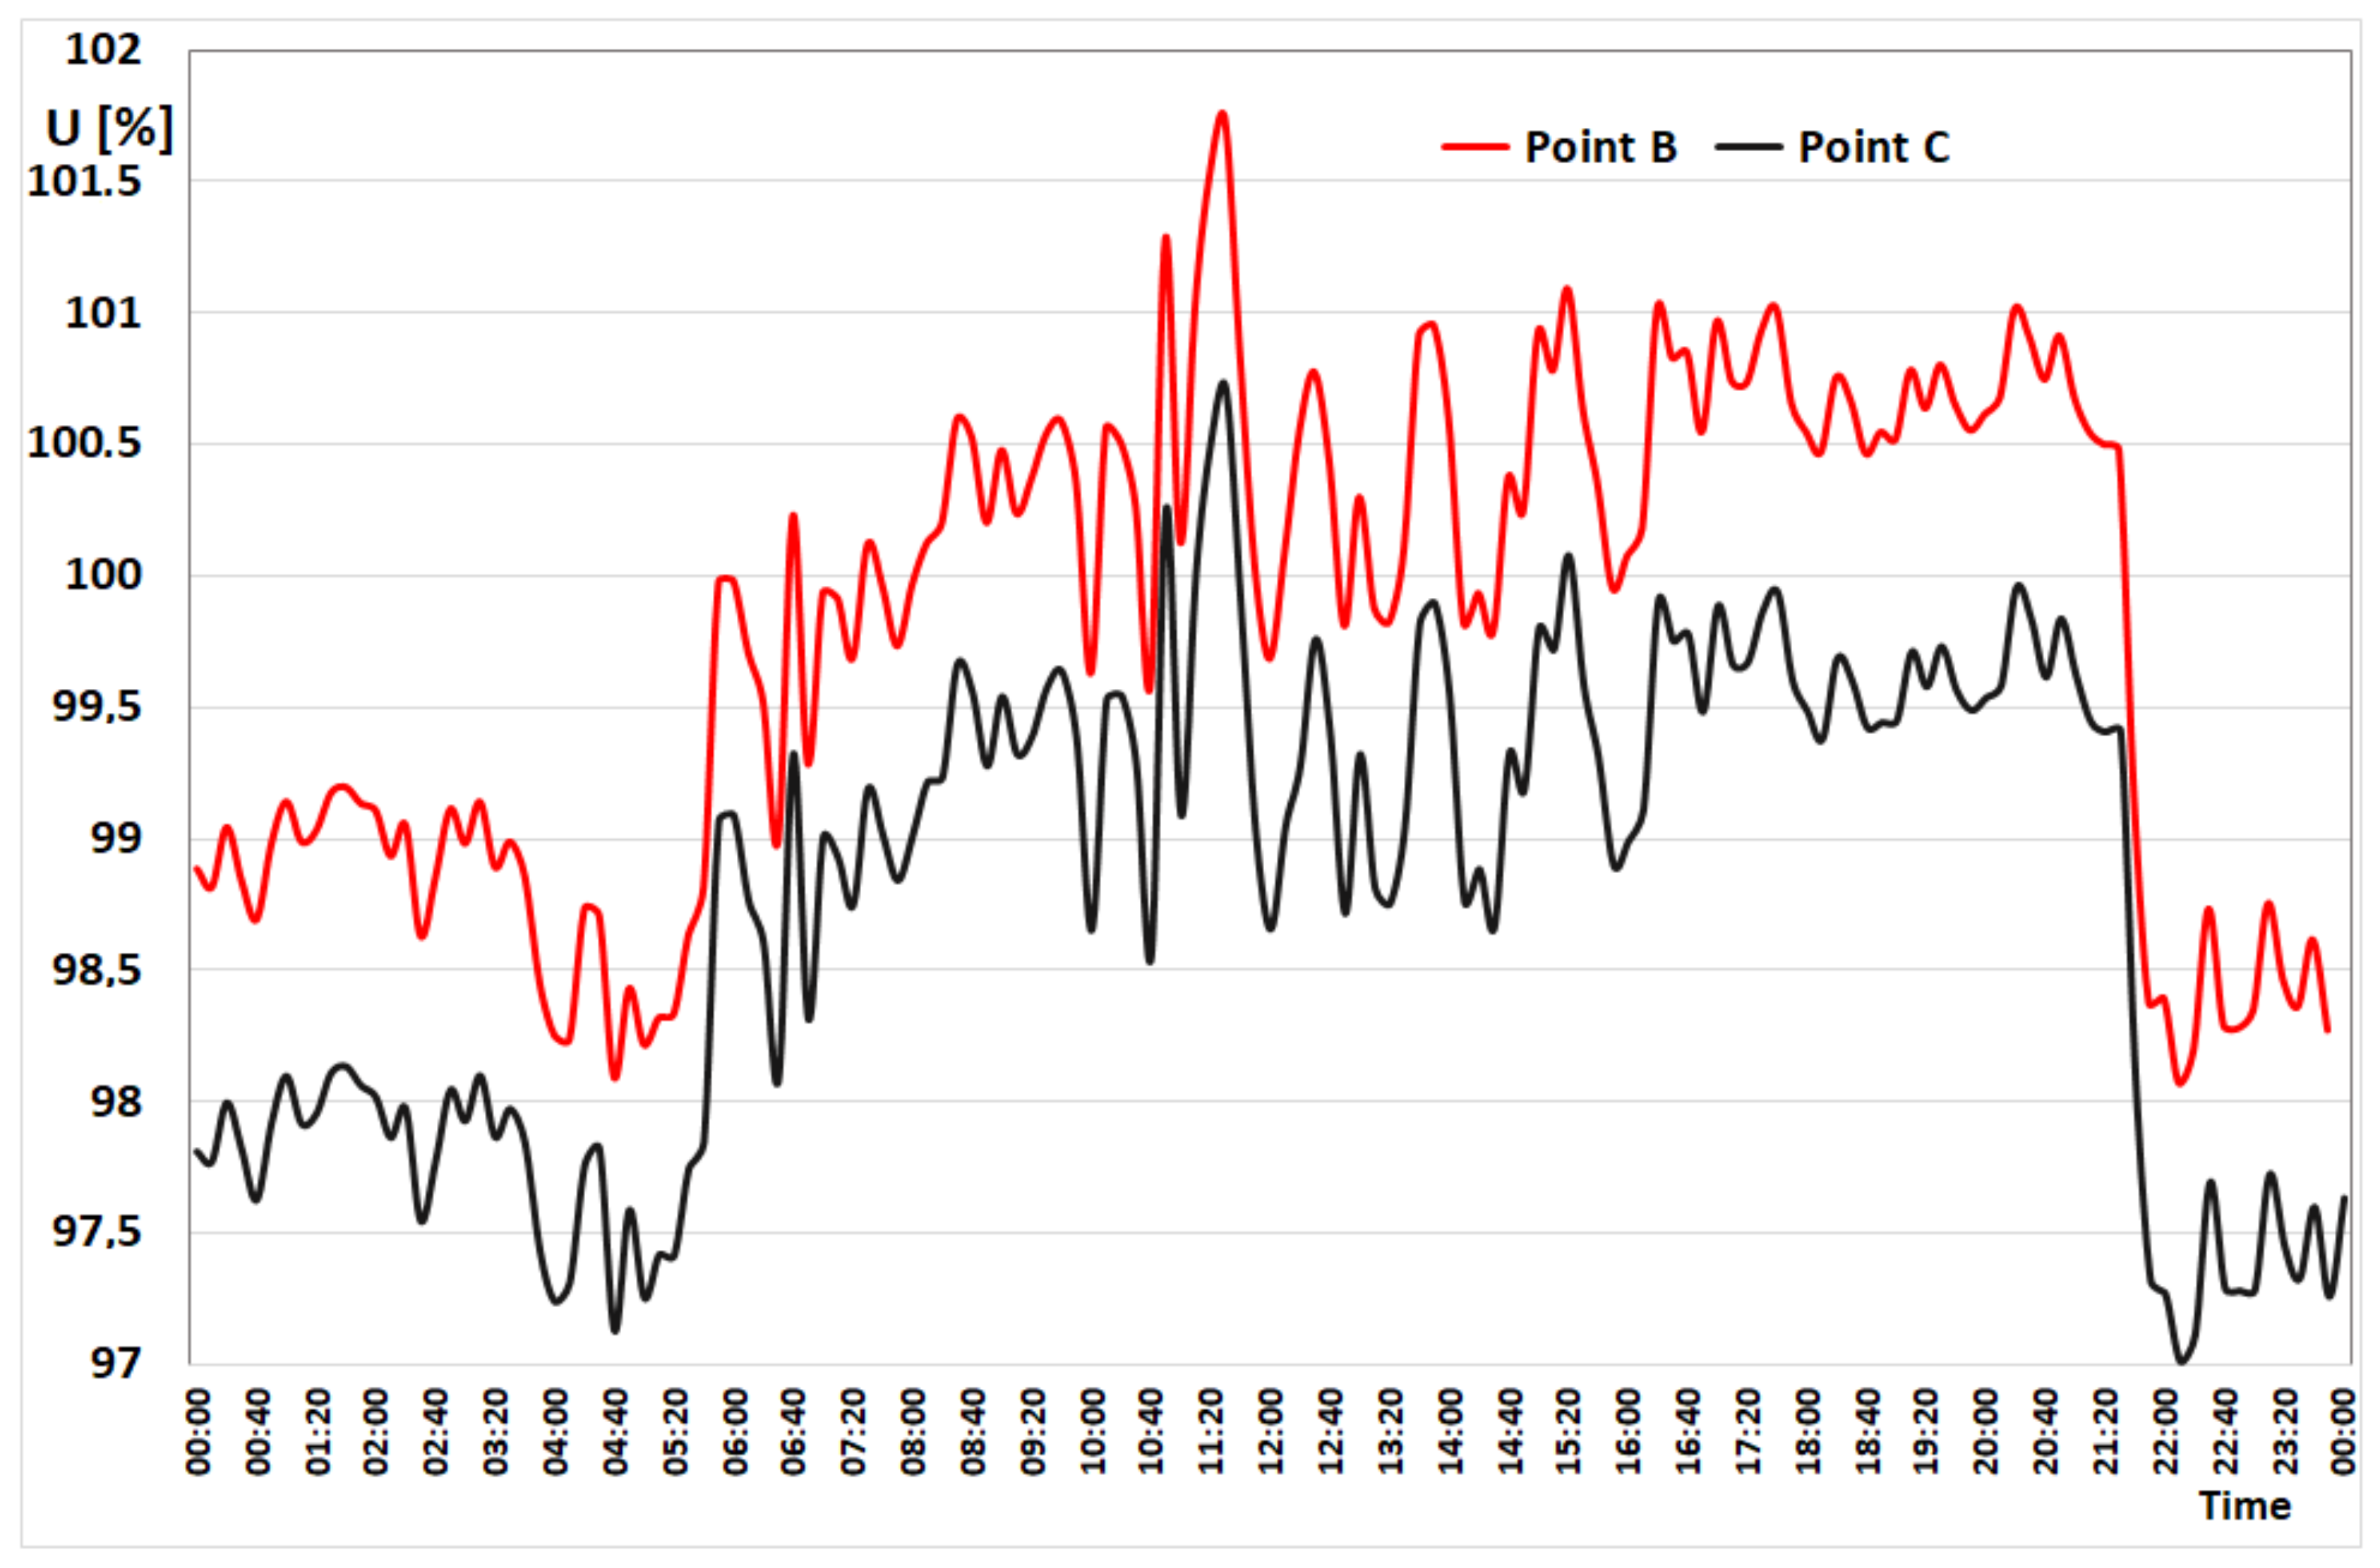
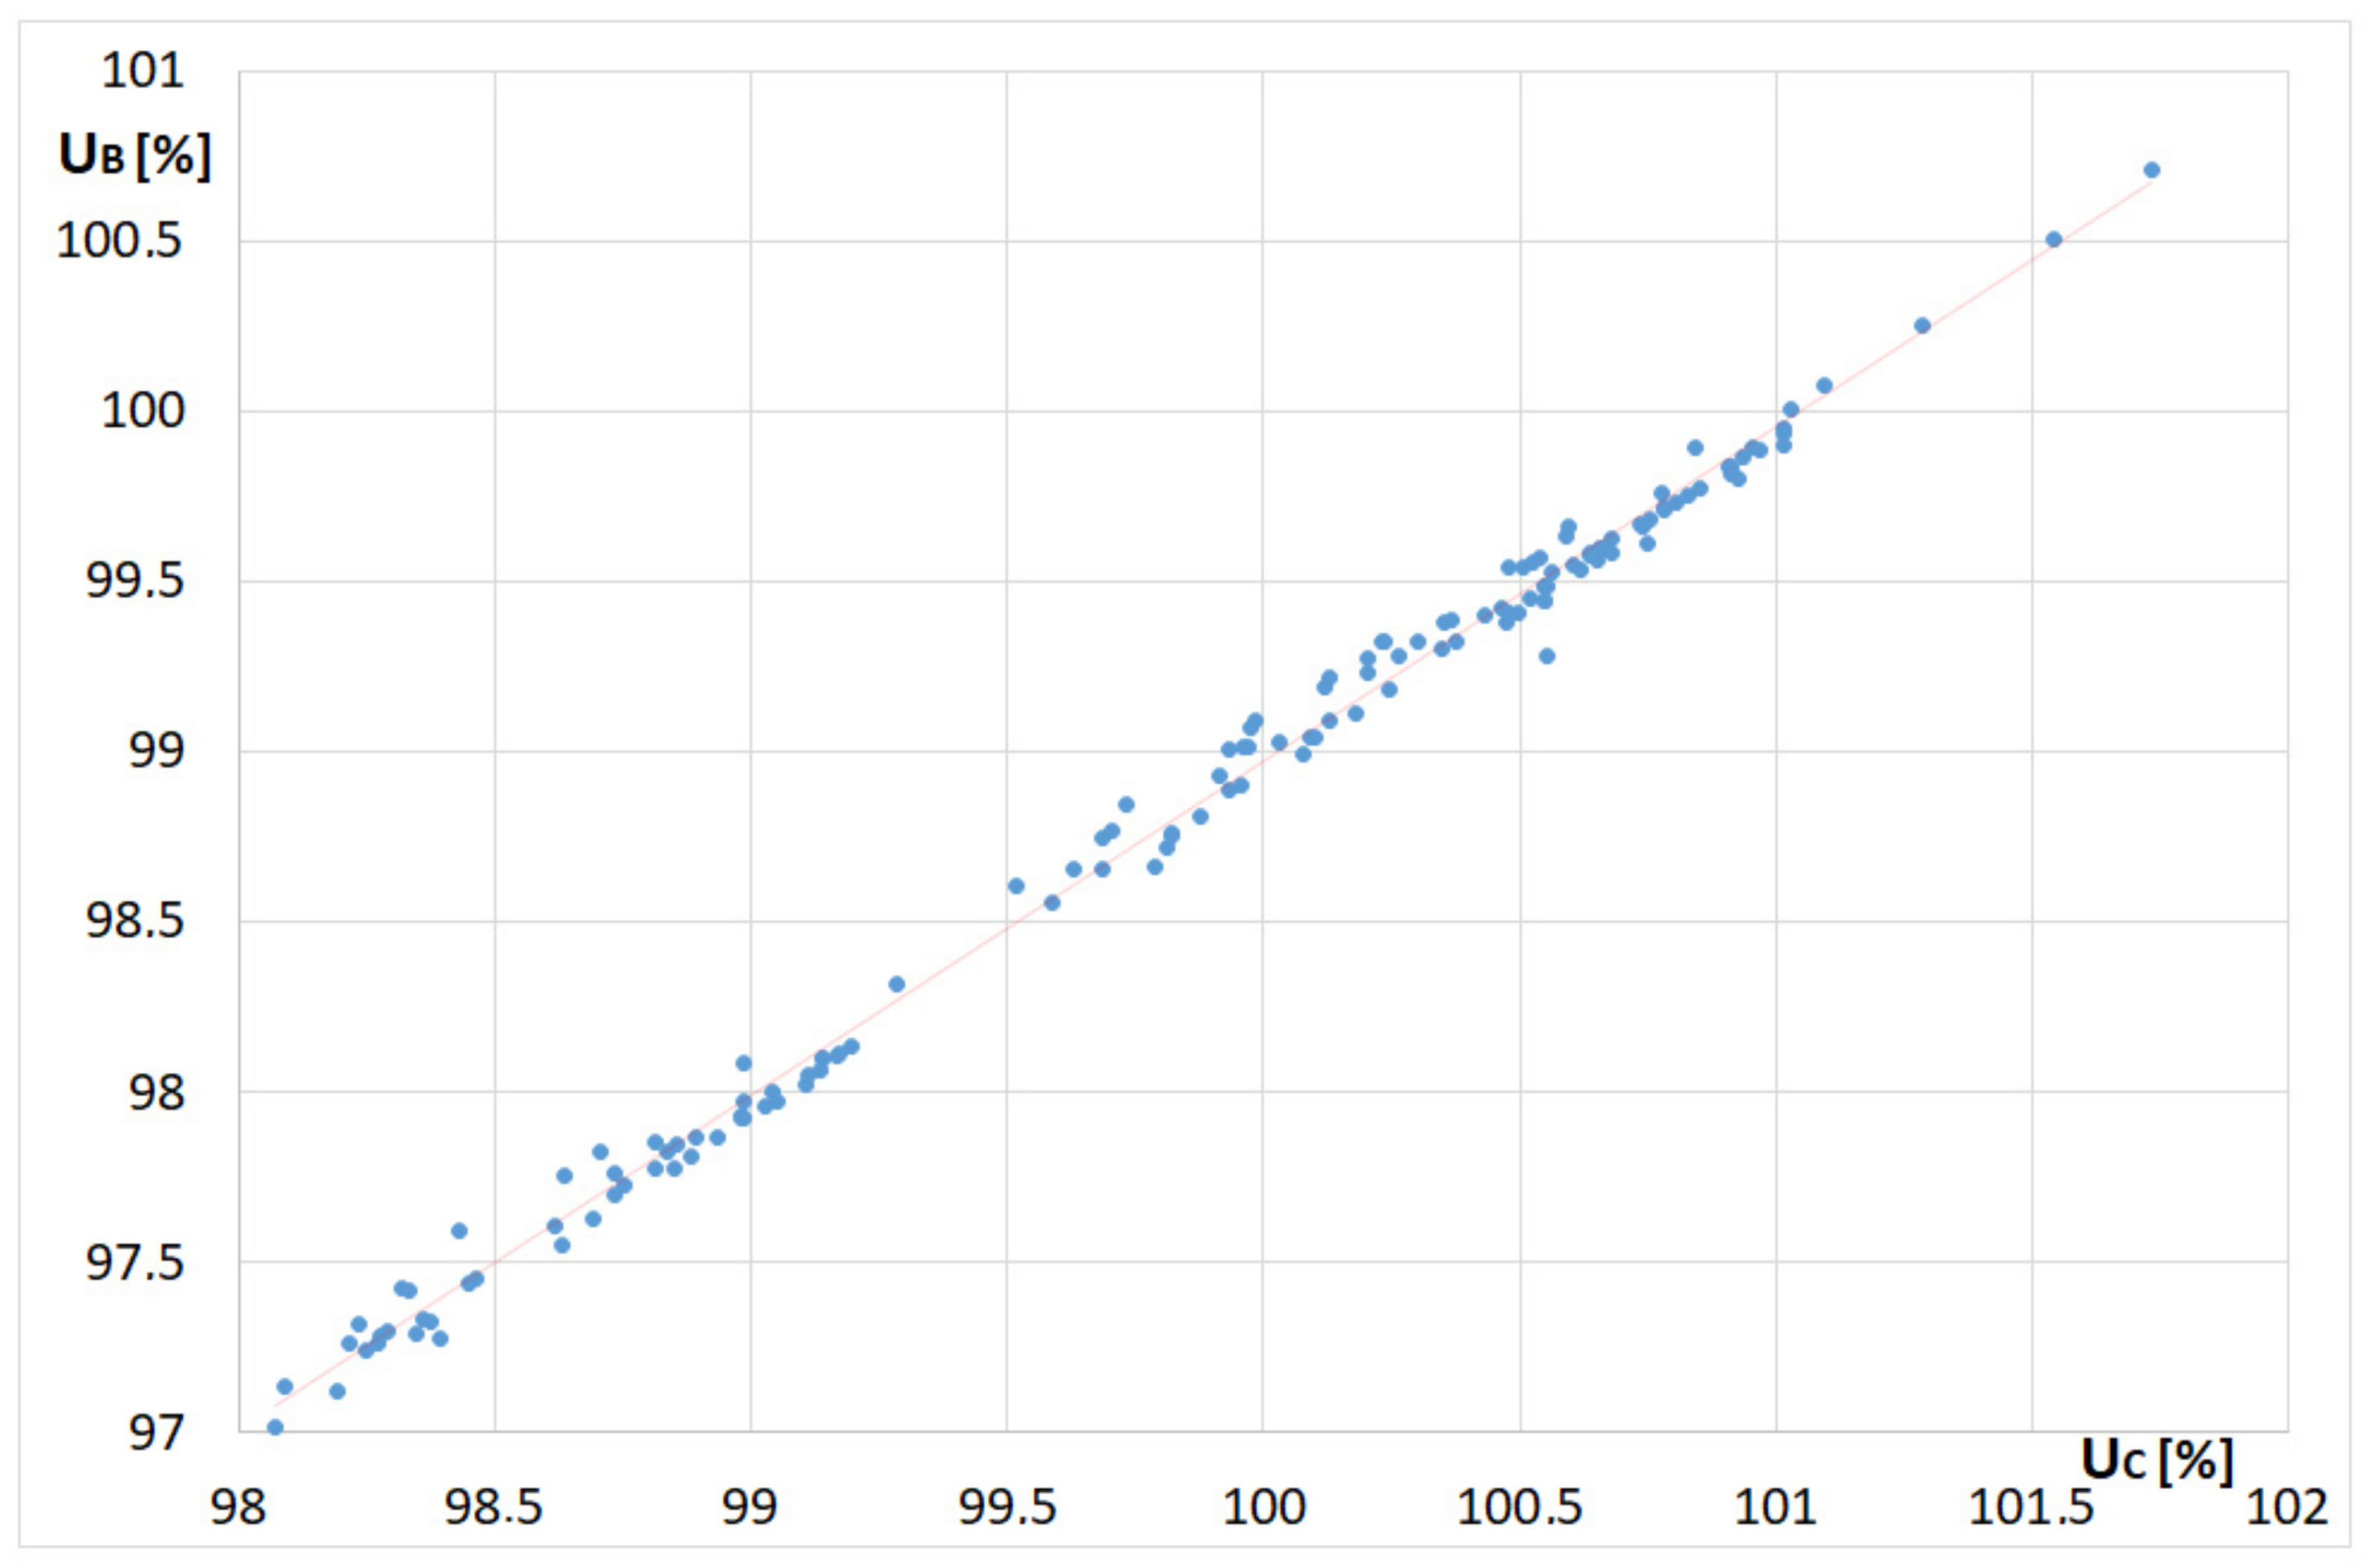
Figure 19 shows the changes in RMS voltage recorded at the same time in point B and point C.
Correlation coefficient, which determines the relationship between the voltages U
B and U
C, is
rUB,UC = 0.997—
Figure 20. The red line in
Figure 20 shows the trend line.
There is also a large correlation between the changes in THDUB and THDUC. In this case, the correlation coefficient is: rTHDUB,THDUC = 0.961.
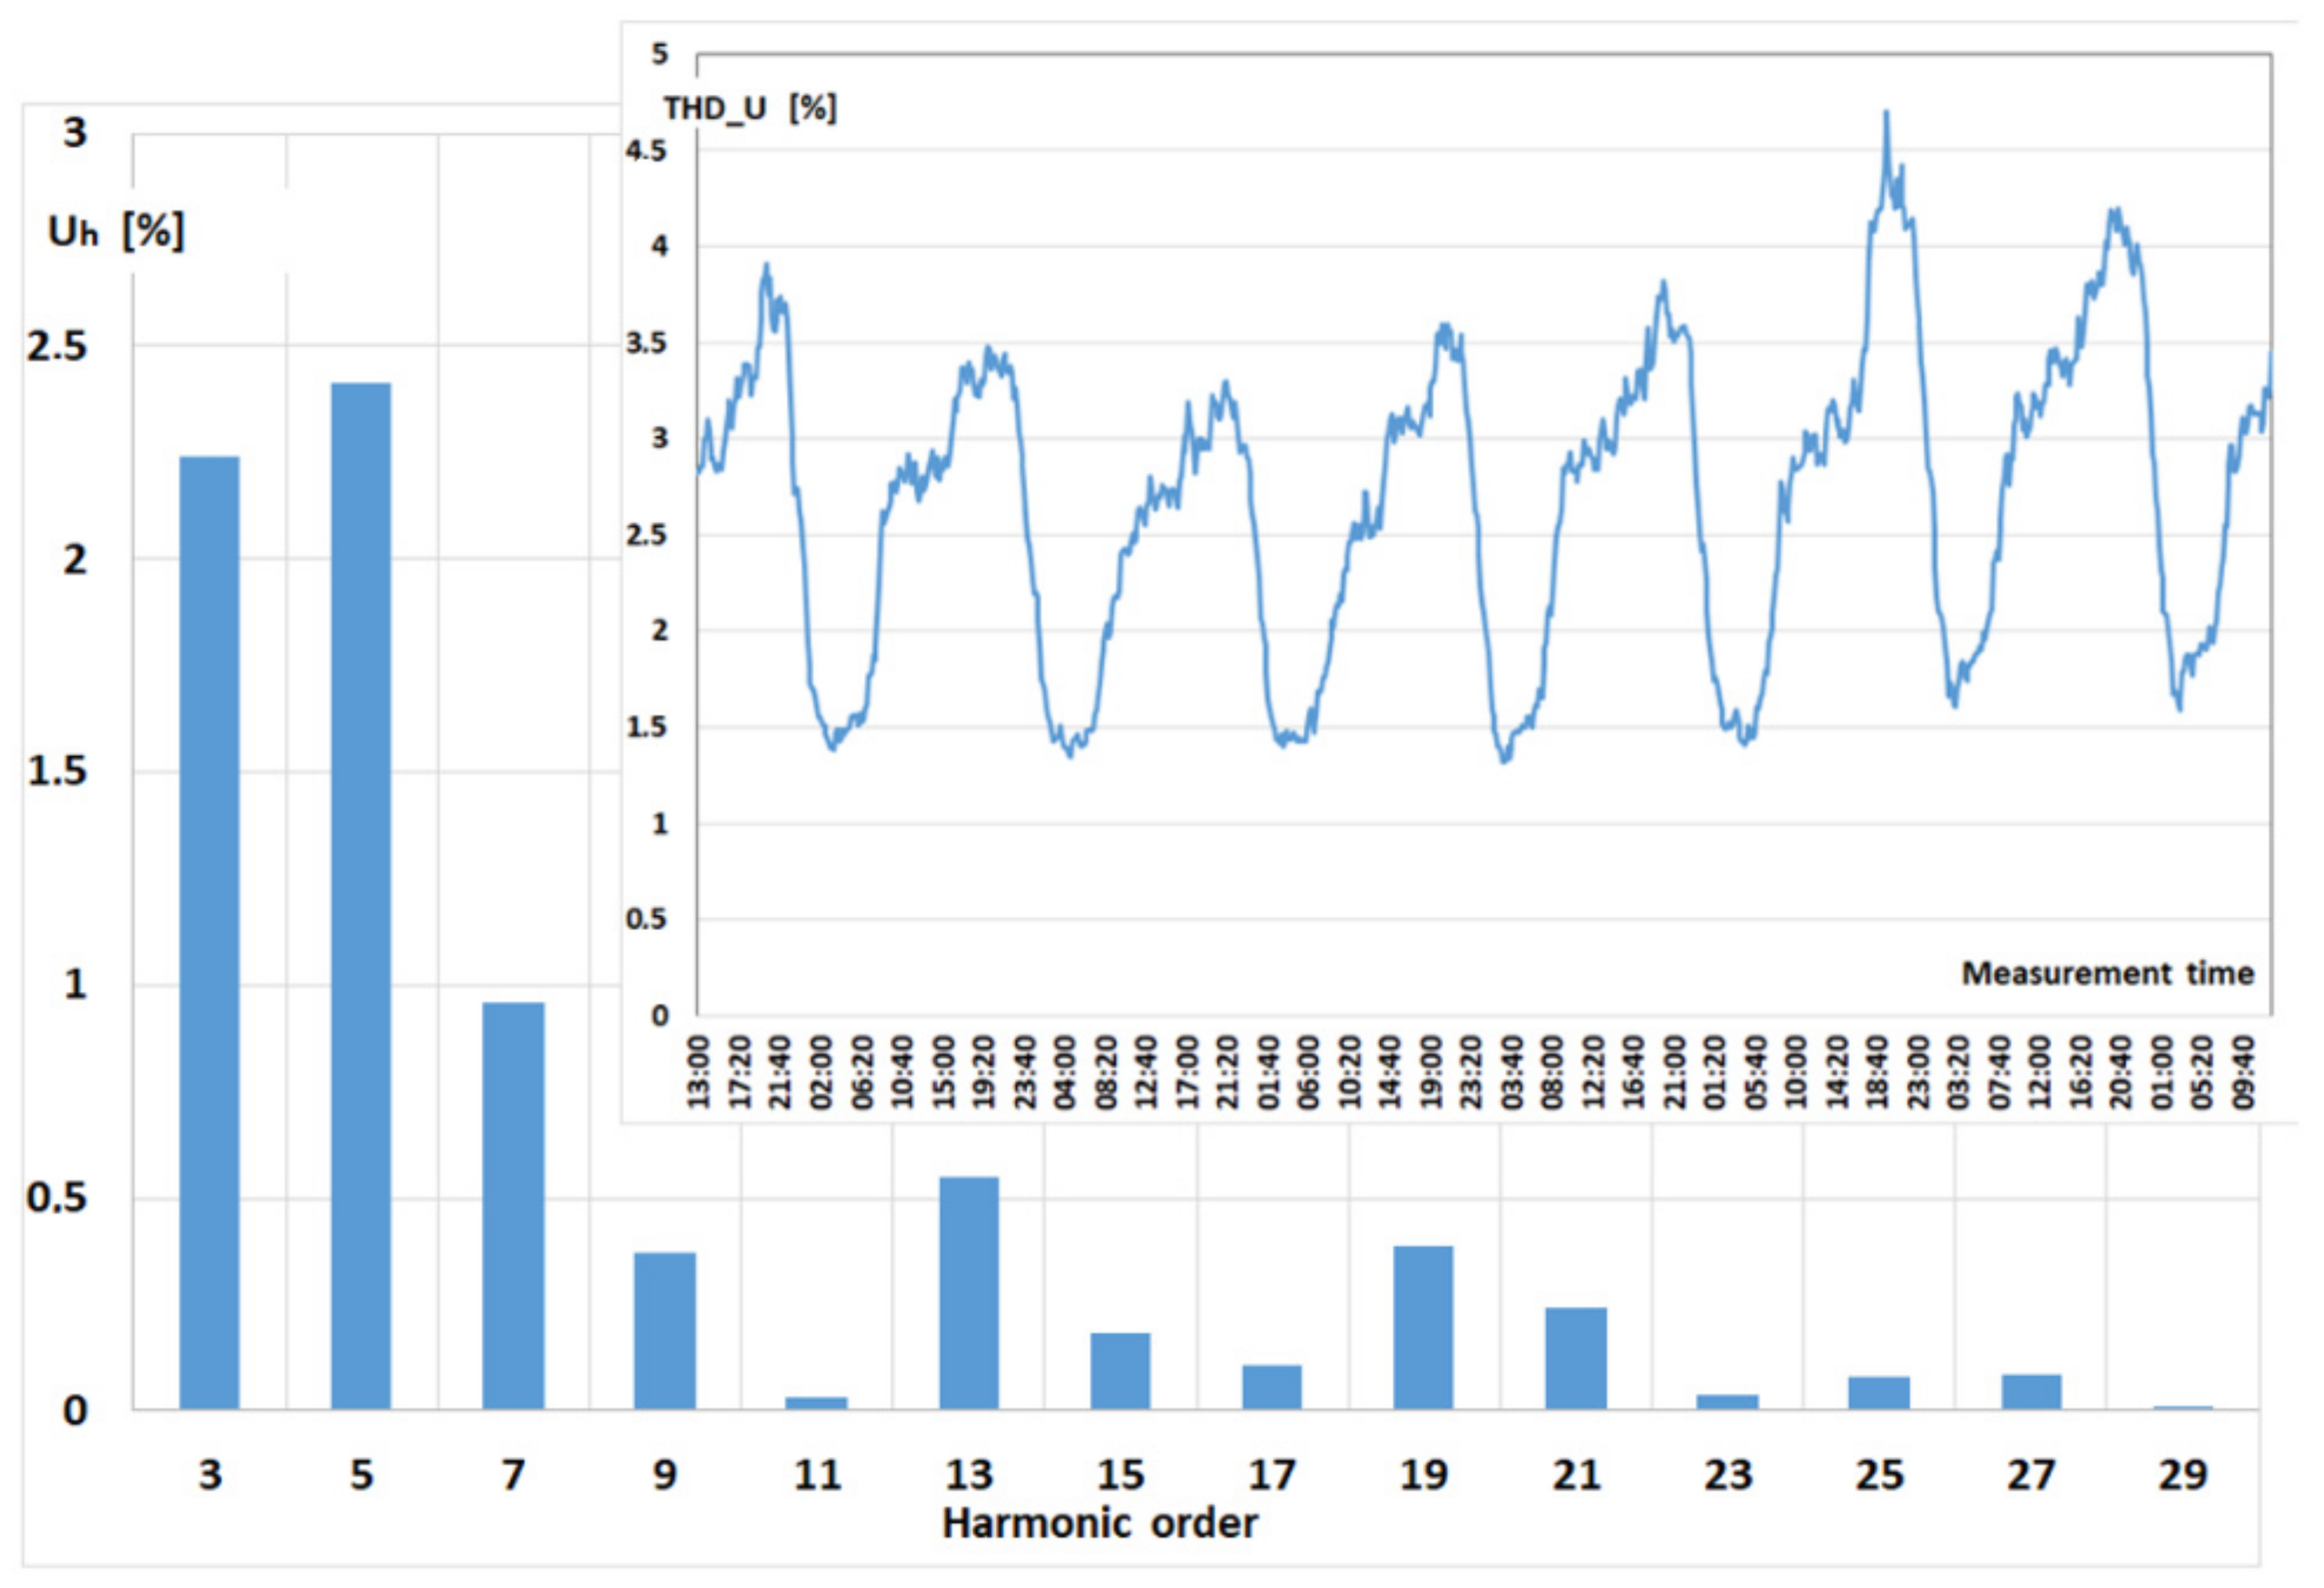
In the case of supplying the circuits of non-traction needs and DC electric traction, from the common supply—point B, significant voltage distortion in the lines of non-traction needs—point C was found. supplying individual consumers (b)—
Figure 21. In this case, the voltage distortion is decisively influenced by the rectifying devices installed at the traction substation, supplying the DC traction.
The increased content of higher harmonics may cause erroneous operation of devices supplied from the non-traction needs line. During the measurements, voltage dips in the non-traction needs circuits were also recorded.
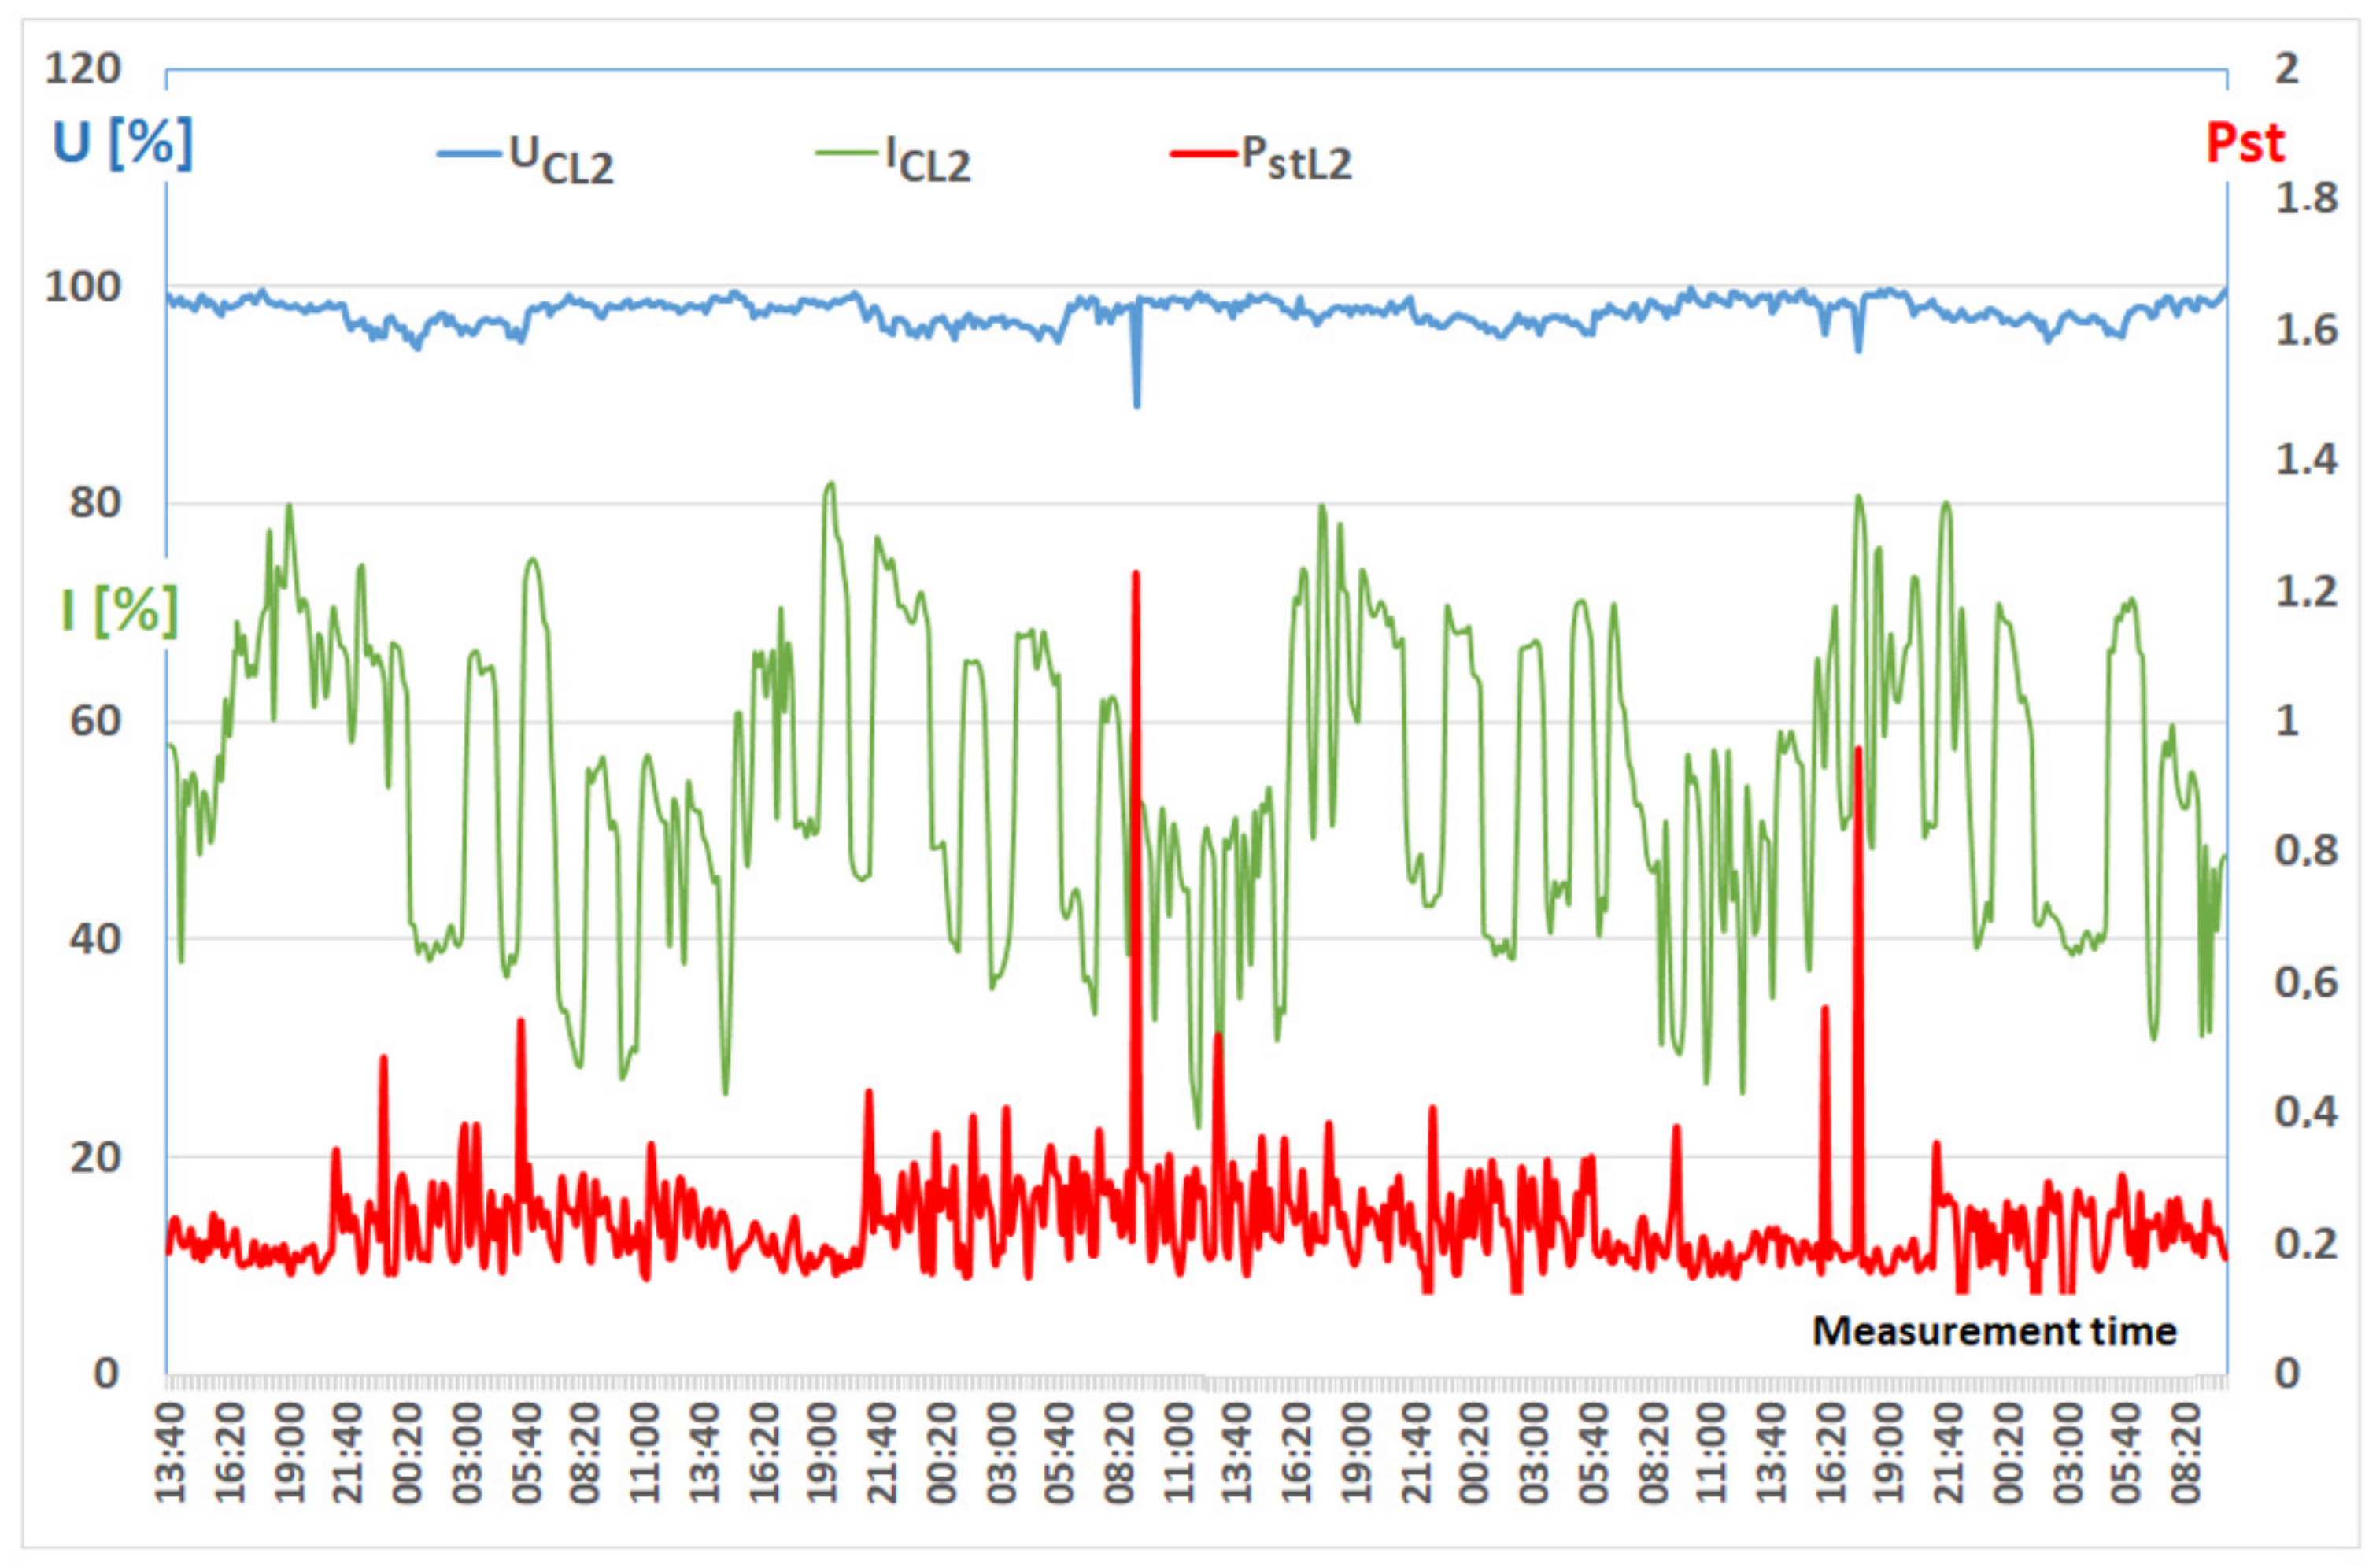
Figure 22 shows changes in voltage, flicker coefficient and current recorded in the non-traction needs circuits.
Figure 23 shows in detail one of the dips recorded in the supply lines for non-traction loads—Point C. Changes RMS voltage recorded in one of the phases are shown in
Figure 23a.
Figure 23b, the UNIPEDE table shows that during the recording cycle, there was one voltage dip. The value of the voltage dip amplitude is between 10–15% of Un. The duration of the dip according to the table is between 100 and 500 ms. During the dip, the minimum value of the voltage was 97% U
n Figure 23c shows the change of the RMS voltage and the time of the dip during the disturbance.
Disturbances occurring in the substation supply line directly affect the quality of electricity in non-traction circuits. Voltage dips are one of the most common disturbances in the power system, and their elimination is very difficult, especially when the power of disturbing receivers is high, and the load changes are irregular.
6. Circuits of Auxiliary Loads
The main task of the traction substation is to convert the alternating voltage to a constant voltage and deliver it to the railway traction network. An additional task of the traction substation is to supply various objects not related to electric traction, e.g., alternating current electricity with a voltage of 230/400 V. To supply auxiliary devices of substations-auxiliary needs, two auxiliary transformers are used, one of which is backup (
Figure 1—point D). These transformers supply auxiliary circuits which have a major impact on the operation of the traction substation (e.g., protection, control, and signaling circuits), most of which are supplied with direct voltage. The operation of these devices (especially of the older type) is slightly influenced by the quality of the power supplying the substation and the disturbances associated with the variable load of the substation. However, the introduction of modern security, control devices and data transmission devices raises the requirements of power quality.
Voltage changes in auxiliary circuits are closely related to voltage changes in the supply line to the substations.
Figure 24 shows the changes and voltages measured at the same time in the auxiliary circuits of the substation and the substation supply line. Correlation coefficient which determines the dependence of changes between the voltages U
B and U
C is
rUB,UD = 0.992. The red line in the
Figure 24b shows the trend line.
Based on the analysis of changes in the parameters of electric power quality, it can be concluded that disturbances in the lines supplying traction substations, non-traction lines and auxiliary circuits are caused mainly by the DC traction supply system.
The auxiliary power line supplies the devices installed at the traction substation. These are devices that ensure the operation of the DC electric traction power supply system. These are devices that ensure the operation of the DC electric traction power supply system. Due to the fact that the control devices are responsible for the safety of the movement of traction vehicles, they require electricity of appropriate quality. Voltage dips are the disturbances to which the information systems of train traffic supervision are sensitive.
Figure 25 shows the minimum changes of the RMS voltage (U
min) recorded in the phases L1, L2, L3 in point D.
Due to the nature of the substation load and the rectifier systems used, it can be clearly stated that the main disturbance caused by the DC system is the distortion (deformation) of the supply voltage. This disturbance is propagated to other circuits supplied from the traction substation.
Dips and rapid voltage changes are another disturbance registered in the networks supplying traction substations as well as auxiliary and non-traction lines. They are manifested by an increase in light flicker coefficients.
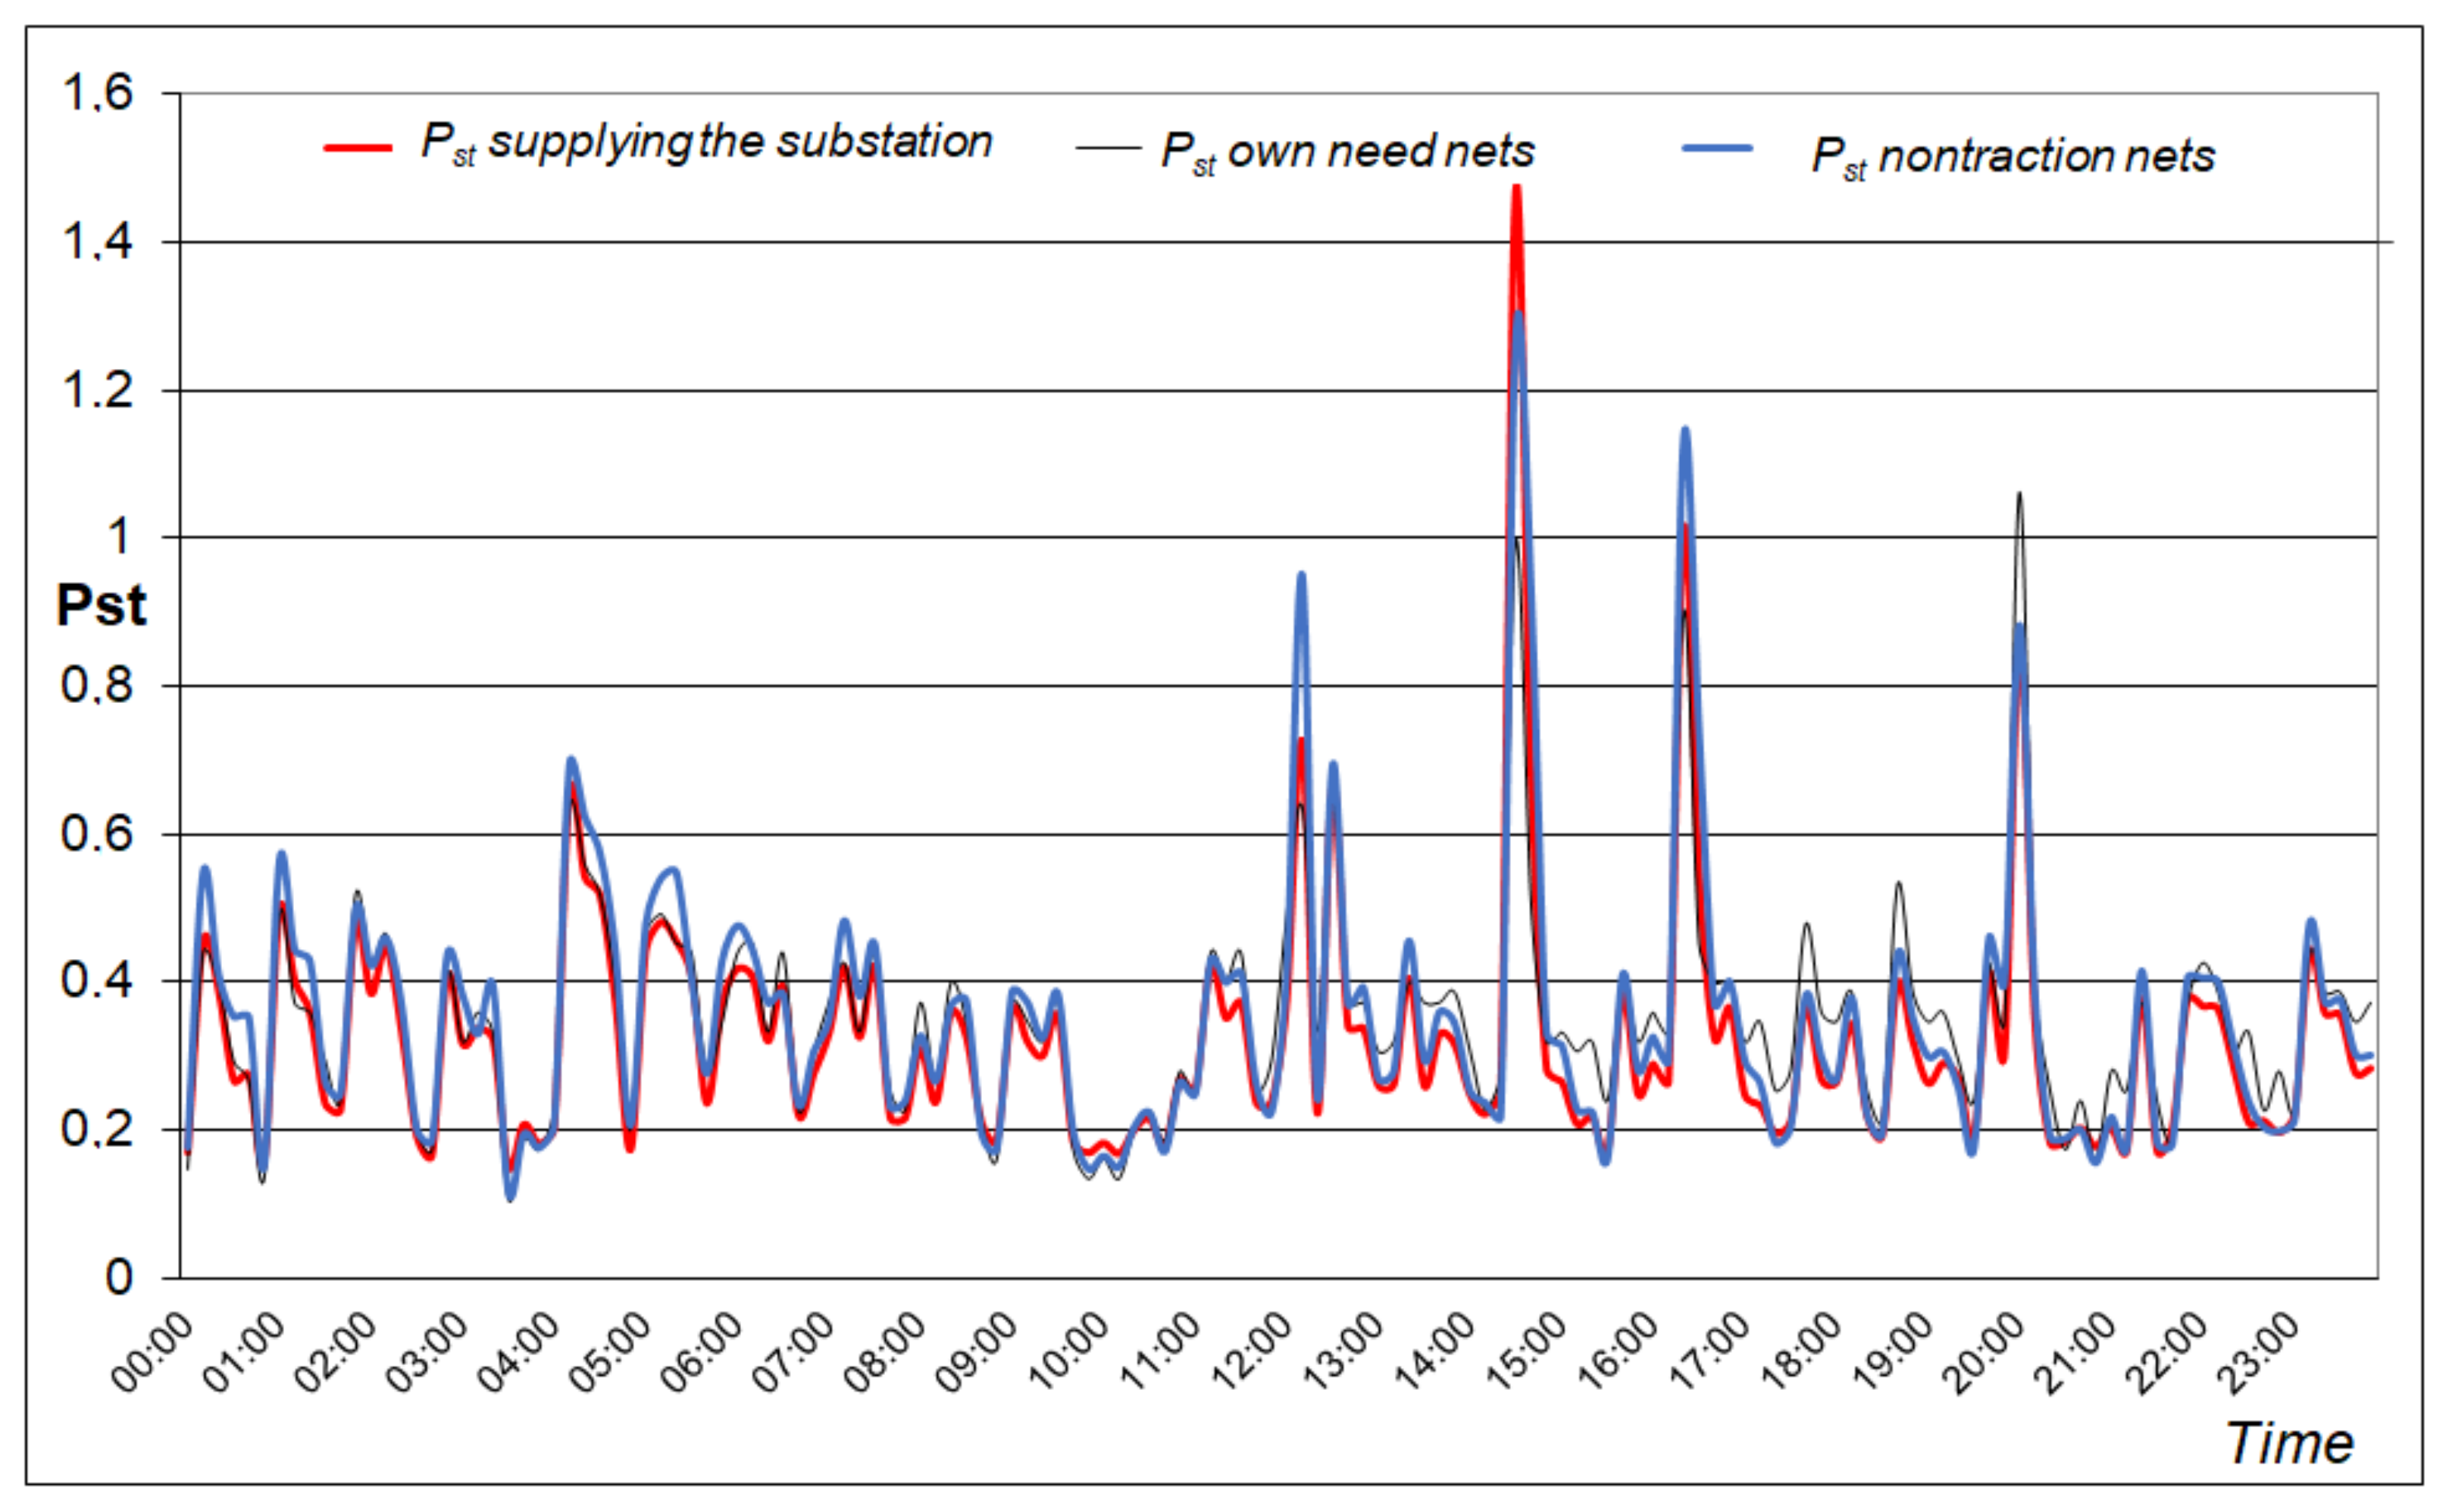
Figure 26 shows the changes in flicker coefficients recorded in the substation supply line, non-traction lines and auxiliary circuits. The correlation coefficients between the individual P
st light flicker indicators are as follows:
rPstB,PstC = 0.825,
rPstB,PstD = 0.9145,
rPstB,PstD = 0.865.
The reasons related to voltage dips and fluctuations, however, can be found both in the power system from which the traction substation is supplied and in the DC traction system.
7. Discussion
Based on the analysis of measurements of indicators characterizing the power quality, it can be clearly stated that the main disturbances caused by DC traction systems are voltage dips and fluctuations. There are also increased deformations of the voltage curve, but the values of these deformations do not exceed the permissible limit value. The magnitude of voltage fluctuations is primarily influenced by the occurrence of short-circuits and switching overvoltages in the DC traction network, as well as the heavy start-up of the trains consuming the load, the power will change when switching individual stages of the starting resistors. The influence of the dynamics of loads on a traction substation affects the voltage changes and the value of the short-term light flicker Pst. The Pst index changes recorded in the substation supply network result from the train start-up, which is related to the changes in the voltage level both on the DC side and on the side of the traction substation supply network.
The load on the traction substation also affects the voltage distortion in the 30 kV MV lines. The measurements of the voltage change and the THD coefficient with dynamic load changes in the supply line to the substation confirm that for small loads, the current consumed by the substation remains at a stable level and the THD coefficient is low. Any start of the train results in an increase in current, which results in an increase in the THD factor. One should also pay attention to the characteristic harmonics 11 and 13, generated by rectifier sets operating in a twelve-pulse system. During the analysis of the performed measurements, particular attention was paid to the parameters of supplying the non-traction needs lines. The special treatment of these systems results from the wide variety of power consumption and greater sensitivity to disturbances. It means that for this type of circuits appropriate parameters of the supply voltage should be ensured. The use of rectifier sets for DC systems has an impact on the disturbances that appear in the non-traction circuits. An additional source of disturbances resulting from the low short-circuit power of the substation auxiliary connection point are disturbances caused by receivers connected to the non-traction needs circuits. The main disturbances in the non-traction needs line are the voltage distortions of the 5 and 7 harmonics and the value change of the short-term flicker Pst.
In addition to supplying voltage to the railway network, the traction substation also supplies power to various facilities not related to electric traction, which require alternating current electricity with a voltage of 230/400 V. When analyzing the influence of the DC traction system on auxiliary circuits, it was found that voltage changes in auxiliary circuits are closely related to voltage changes in the substation supply line. Voltage changes and THD values recorded in the substation supply line and auxiliary circuits confirm the influence of the DC system on the substation auxiliary circuits. The analysis of the performed measurements also showed a direct impact on the quality of electricity in auxiliary circuits due to disturbances in the 30 kV medium voltage lines. The voltage dips presented are closely related to the disturbances of the 30 kV line and cause changes in the voltage and flicker ratio in the auxiliary circuits.
The discussed topic will be developed in subsequent publications in which the modeled fragment of the power system supplying traction substations will be subjected to research analysis, in which dynamic load changes will be compared with the actual measurement results. The obtained information on the influence of the operating parameters of the 3 kV DC traction system on the power supply network will be used to develop appropriate solutions for the mitigation of disturbances resulting from the operation of variable loads of the DC system.
8. Conclusions
Direct current electric traction belongs to energy consumers, which affects the power quality of the power system from which it is supplied. The disturbances generated by traction substations are determined both by the need to convert AC voltage into DC voltage and the dynamics of load changes resulting from the movement of traction vehicles (trains). The supply conditions for traction substations (short-circuit power of supply networks) also affect the magnitude of the disturbances.
Based on the analysis of the registered indicators characterizing the quality of electricity, the propagation of disturbances generated by substations to the supply networks and power lines supplying the traction infrastructure was estimated. The arising disturbances may cause disruptions in the operation of devices related to train traffic and devices related to passenger service. It is of particular importance to ensure the appropriate quality of energy in the lines supplying railway automation systems, which is related to the safe operation of trains.
The collected measurement data, selected fragments of which are presented in the article, will be helpful in modeling studies, including in the assessment of the impact of traction substation supply conditions on the magnitude of disturbances generated by DC electric traction.


