

Multivariant Analysis of Photovoltaic Performance with Consideration of Self-Consumption

Department of Renewable Energy Engineering, Faculty of Environmental Engineering, Lublin University of Technology, Nadbystrzycka 40B, 20-618 Lublin, Poland
Energies 2022, 15(18), 6732; https://doi.org/10.3390/en15186732
Submission received: 15 July 2022
/
Revised: 5 September 2022
/
Accepted: 12 September 2022
/
Published: 14 September 2022
(This article belongs to the Special Issue Solar Energy Systems: Challenges, Opportunities and Advances)
Abstract
:The presented work contains the comparison of a different photovoltaic system approach, in terms of monthly energy production profiles, with detailed user needs profiles. Two types of investors were taken into account—a company where the yearly energy consumption exceeded 50 MWh and a standard household where the yearly energy consumption was around 6 MWh. Moreover, two different scenarios were considered; the first one was focused on the maximization of the energy production during a year by choosing optimal azimuth and tilt angles, whereas the second PV system was based on the East–West azimuth angles, which usually enables one to have better energy self-consumption, which leads to sustainable energy usage. Energy production profiles, along with users’ energy needs profiles, were analyzed in terms of sustainability, investment payback time, and energy loss in the face of the new Polish Renewable Energy Law. Recent changes in the Renewable Energy Law in Poland, which came into force on the 1 April 2022, have changed the way many investors are thinking about investing in photovoltaic systems. The main difference is how the Energy Distributor is obliged to trade the photovoltaic electrical energy injected into the grid by Prosumers. The so-called “net metering”, which is kind of a barter deal, was changed to “net billing”—selling energy at a wholesale price. Net billing is believed to be less profitable than net metering due to a significant price difference between the bought and sold energy.
1. Introduction
During the last years, 2016–2021, the power of the photovoltaic systems installed in Poland was increasing rapidly. Cumulative installed PV power in 2016 was 0.199 GWp, while in 2021, cumulative power reached 7.67 GWp (Figure 1) [1]. Almost all installed photovoltaic systems are on-grid installations—photovoltaics integrated with an electrical grid [2]. The main increase is observed in installations with a power limitation of 50 kWp, referred to as microinstallations [3] (Figure 1). When an investor is within the microinstallation power limitations, he becomes a Prosumer—producer and consumer of the electrical energy at the same time. When connecting PV microinstallations to the electrical grid, a Prosumer is obliged by the Electrical Energy Distributor to provide only basic information about the PV system, such as the power of the system, producer and model of the modules, and the inverter. In addition, an electrical scheme of the PV system integrated with the internal electrical grid is required. When the power of the PV system exceeds 50 kWp, the investor becomes an Energy Producer, and in this case, in order to connect the photovoltaic installation to the electrical grid, a building permit is required as well as establishing connection-specific conditions for energy producers. The formal path to connect a microinstallation to the electrical grid is simplified compared to PV systems larger than 50 kWp. Great dynamics in the number of microinstallations in Poland installed in the past few years were due to national supporting programs [4], which helped to reduce the costs of PV installations. Rapidly increasing electricity prices also encouraged private and commercial investors to install photovoltaics. Recent changes in the Polish Renewable Energy Law changed the way the Energy Distributor is obliged to trade the electrical energy produced by PV plants. Before the 1 April 2022, the energy produced by Prosumers was consumed within the building, and the surplus was injected into the electrical grid. During the time when there was no sun radiation or the sun radiation was low, Prosumers could reuse the solar energy from the electrical grid with an efficiency of 80% for a system power of less than 10 kWp. For higher powers between 10 kWp and 50 kWp, the efficiency is 70% of the injected energy [4]. The new legislation changed the way Prosumers [3] are obliged to settle the produced energy with an energy company. Net metering [5] was changed to net billing, which is based on selling surplus electrical energy to the provider at the average monthly wholesale market price [6].
The cost of produced energy is usually half the price of the energy that Prosumers buy from the provider. These new rules of energy distribution necessitate taking into consideration the higher ratio of self-consumption (SC) of produced energy from photovoltaics [7,8]. SC becomes an important parameter while taking into account the developing photovoltaic installations. This issue was analyzed in terms of Building Integrated Photovoltaics (BIPV) in commercial and office buildings [9], as well as in Building Applied Photovoltaics (BAPV) [10]. In addition, self-consumption is important when considering photovoltaic electrical grid integration, as reported in [11]. A recent publication by Ordóñez et al. takes into account self-consumption while analyzing net billing and net metering remuneration mechanisms in Ecuador [12]. Furthermore, SC has a key role in electricity bill reduction [13]. An increase in the SC can be achieved by:
The first case is the most efficient in terms of self-consumption, but it corresponds to a significant increase in the PV system price. Matching energy usage profiles in most cases could be difficult or sometimes almost impossible. The application of the third scenario does not entail additional costs and can be performed during the system design process. The savings resulting from a higher self-consumption should decrease the investment payback time, which is usually the main parameter taken into account by investors. Furthermore, sustainable energy consumption is a very important issue due to rapidly increasing numbers of PV systems and the overloading of the distribution network, which can lead to grid instability and a decrease in power quality [19,20,21,22]. Self-consumption also has an impact on decreasing CO2 emissions [23].
This work presents the analysis of two different investors who are planning to reduce the costs of electrical energy by installing photovoltaic systems. Due to the simplicity of connecting a PV system to the electrical grid, only so-called microinstallations—which do not exceed 50 kWp of installed power—are taken into consideration. The first one is a standard household with energy needs (Eneed) of 5.7 MWh/year, whereas the second one is a company that has yearly energy needs at a level of 380 MWh. Detailed hourly energy consumption profiles were obtained from a monitoring system installed at the corresponding places of investment (Figure A1 and Figure A2).
Simulations of different variants for each site of installation were conducted with PVsyst software that enables one to perform PV system simulations based on specific meteorological data, 3D shading scenes, and profiles of energy user needs, giving detailed results of the photovoltaic system performance.
The conclusions of the presented analysis will help to establish whether the investment in photovoltaic microinstallations would still be profitable in the face of the new renewable energy sources law. In addition, comparing different variants of microinstallations would be interesting in terms of an economic point of view, as well as sustainable energy usage and an ecological aspect.
2. Materials and Methods
In order to compare different variants, the PV tilt angles of installations were unified and adapted to current construction elements’ availability. For the installations facing South (S), a 25° tilt angle was introduced, while the installation facing the East–West (E-W) direction had a tilt angle of 10°. All the analyzed systems were designed using a middle-range PV module produced by Risen Solar monocrystalline silicon RSM-40-8-400-M with 400 Wp nominal power. Two different inverters were included—Fronius Symo 5.0-3-M characterized by a nominal power of 5 kW with two maximal power point trackers (MPPT) was used for a household. In turn, a Huawei Technologies SUN2000-40KTL-M3-480V inverter with four MPPT, characterized by 40 kW of nominal power, was selected for the PV system designed for the considered company. For the simulation, the metrological data from Meteonorm 8.0 [24] for Lublin, Poland, were introduced to the PVsyst. Furthermore, user energy needs profiles were introduced to simulations, enabling analysis of the self-consumption parameter, which is a proper indicator of sustainable usage of the energy produced by photovoltaics. This is also important in terms of overloading the electrical grid. Since the popularity of photovoltaic systems has increased, it is common for there to be several PV installations within one transformer station. On sunny days, it can lead to an increase in the AC voltage and in extreme situations, when the voltage reaches 253 V, PV inverters will stop energy production. That is why self-consumption is a very important issue.
Two scenarios were analyzed for each investor:
- PV system designed to maximize the yearly energy yield by installing modules facing South (v1).
- PV system with a higher energy self-consumption with modules facing East–West (v2).
2.1. Photovoltaic System for a Household
The main assumption while designing a photovoltaic system for a household is to gain a sufficient amount of energy from a PV power plant in order to balance the energy user’s needs during a year. The considered house is located in Southeastern Poland, in Lublin. Energy profiles were extracted from the Solar Edge Energy Meter with Modbus Connection, which was installed in June 2020. The measurements of energy needs were taken every 15 min. For the analysis, the year 2021 was taken into consideration. In 2021, the energy consumption of a given household was 5.7 MWh. This value was a basis for designing the photovoltaic system that should be installed in order to balance the user’s energy needs. In total, 14 PV modules were planned with total nominal power of 5.6 kWp (PPV). A detailed electrical configuration is given in Table 1. Using two circuits connected to two independent MPPTs enables one to introduce two different azimuth angles without any losses. The proposed electrical configuration is the same for a system facing South and East–West.
The connected PV power is 12% higher than the nominal power of the inverter, but it does not generate any overload losses.
2.2. Photovoltaic System for a Company
An example of a company with energy needs significantly exceeding 50 MWh/year, the Innovations and Advanced Technology Center (IATC) of the Lublin University of Technology, was analyzed. The measurements of energy needs were taken every 15 min, and similar to the case of the household, the year 2021 was taken into account. The yearly amount of energy that the IATC building used in 2021 was 383 MWh. Due to the simplicity of connecting a PV system to the electrical grid, the nominal power of the PV power plant cannot be higher than 50 kWp. In total, 120 modules were planned with combined nominal power of 48 kWp (PPV). A detailed electrical configuration is given in Table 2. The photovoltaic power connected to the inverter is 20% higher than the inverter nominal power, but such a design does not generate any overload loss.
2.3. Analyzed Parameters
In order to compare different scenarios for given buildings, simulations of different systems were performed. All the important parameters that have an impact on the solar system performance were introduced to the simulation software. PVsyst provides hourly distribution of energy production over the entire year. The following parameters were extracted from the PVsyst simulations: yearly energy production (EP)—electric energy that was produced by photovoltaics during one year, EPV-Grid—energy that the photovoltaic system introduced to the electrical grid, the energy that was provided to a user from the electrical grid (EGRID), energy self-consumption (ESC)—electrical energy produced by the PV system and used to power up energy receivers within the internal electrical grid, system performance ratio (PR)—the ratio of the Ep to the energy that would be produced if the system was continuously working at its nominal STC efficiency (ESTC):
Specific production (SP)—the ratio of the energy produced by a PV system during one year to the nominal power of a PV system (PPV) (kWh/kWp/year):
Payback period and return on investment (ROI)—is the ratio between net income (NI) over the given period and investment costs (IC).
The higher the ROI, the better the profitability is for the investor.
In order to have a wider view of the new Polish legislation changes, the financial parameters were analyzed considering the new “net billing” as well as the old “net metering” way of trading photovoltaic electrical energy.
3. Results
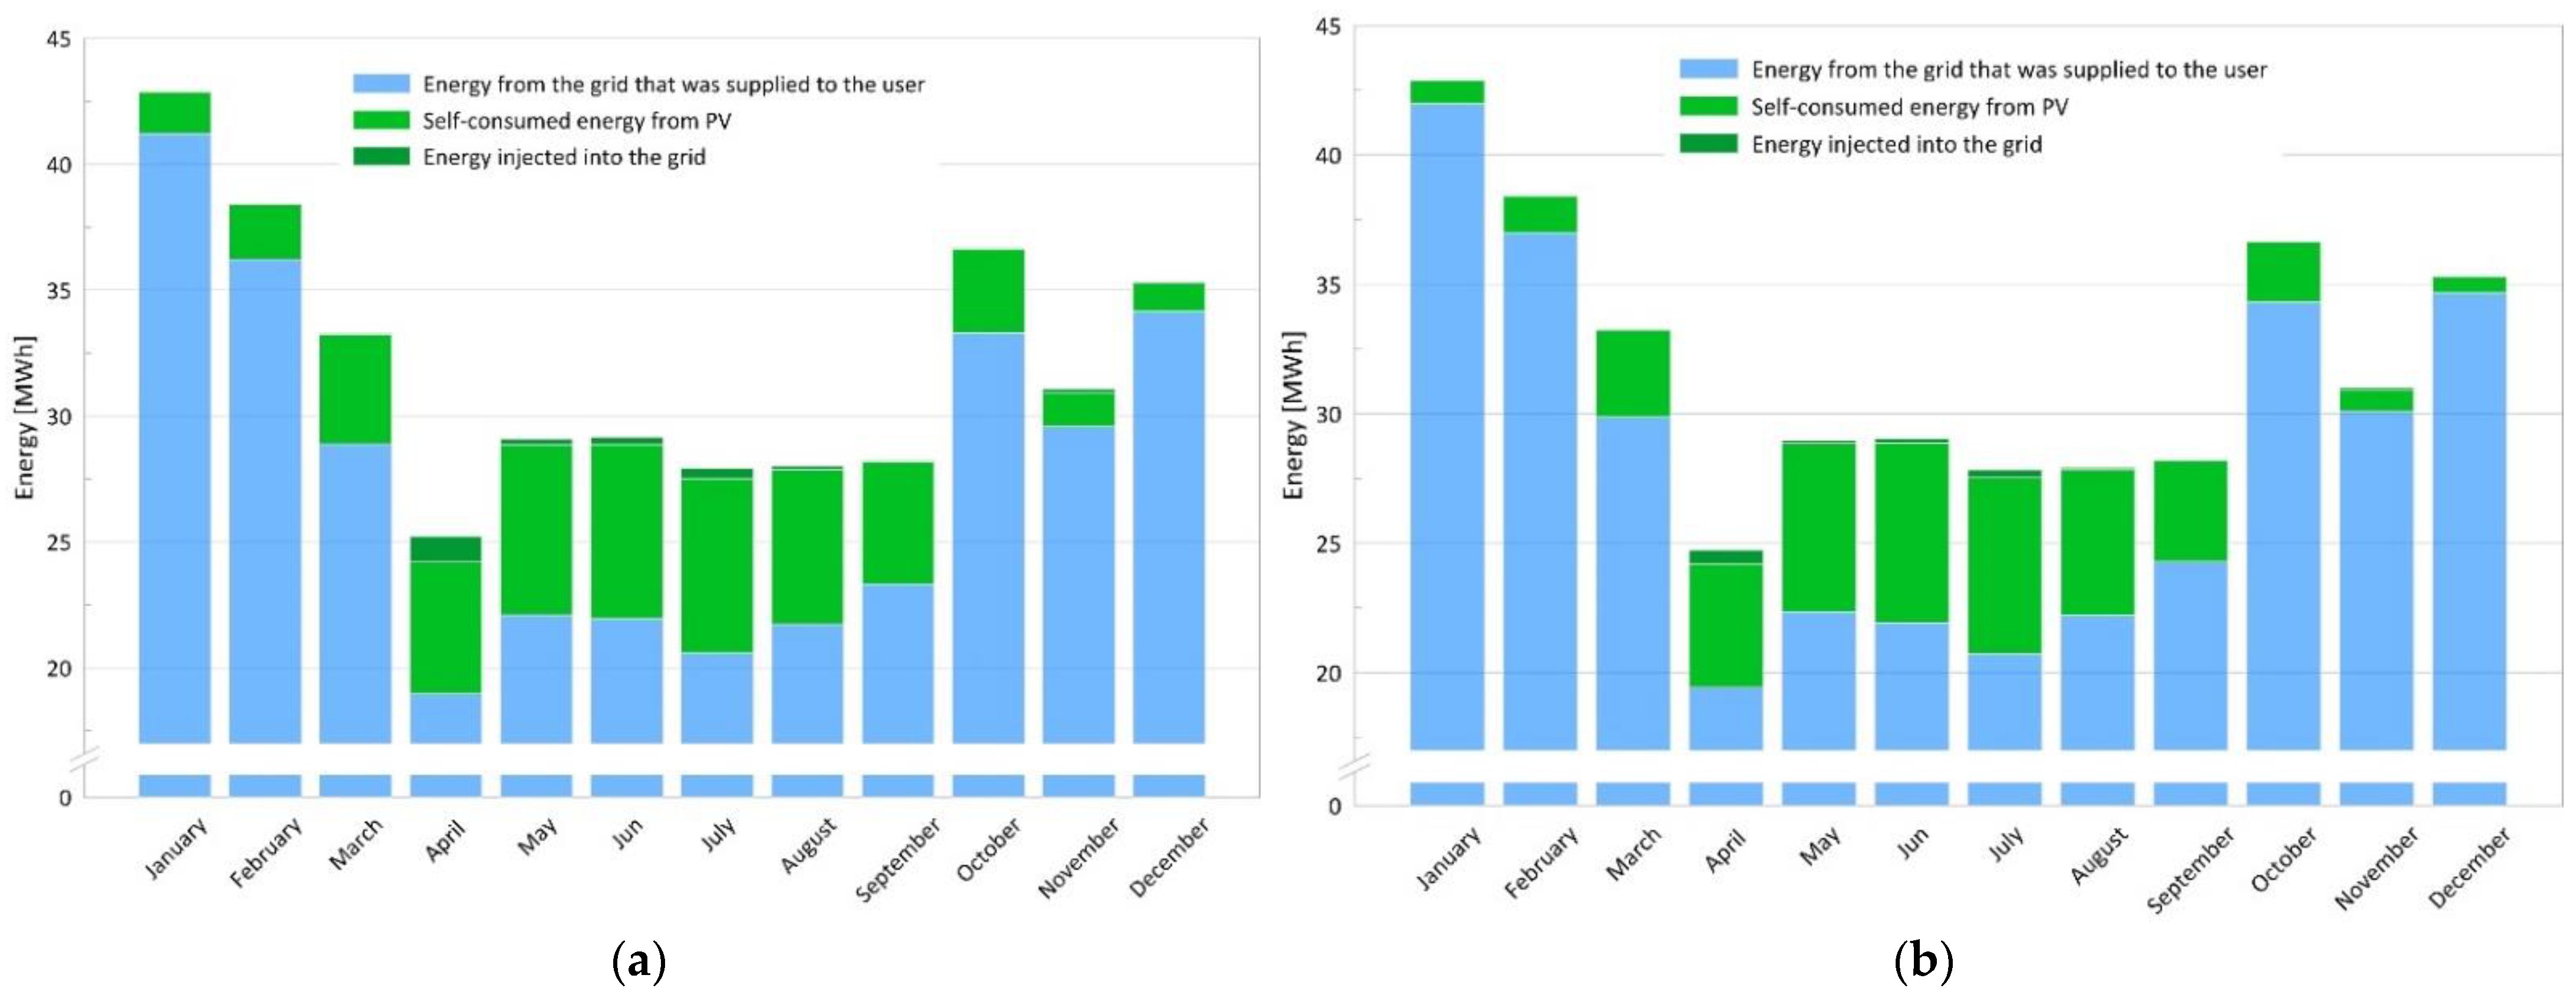
On the basis of the hourly simulations (an example of hourly simulation results is shown in Figure 2), the comparison between considered cases was performed for the household (Figure 3a,b) and the company (Figure 4a,b) in the subsequent months of the year. While analyzing the cases of the two considered investors, one can clearly see that energy self-consumption is much higher for the company than for the household. In the company, only a small amount of produced energy was injected into the grid in April (Figure 4a,b), while for the household, the energy sold for the energy supplier outweighs energy that was self-consumed every month. The highest energy self-consumption value is observed during the winter months (Figure 3a,b), but this period of the year is also characterized by low energy production and high energy needs.
When comparing different PV system configurations (S and E-W directions), one can observe that the system facing E-W is characterized by higher energy self-consumption for the household as well as for the company.
Yearly data were also analyzed. The main parameters of the photovoltaic systems are presented in Table 3.
One can clearly see the difference between the yearly energy production (EP) for the installation facing South and East–West. For the household, the yearly difference reaches 0.9 MWh and for the company, 7.9 MWh, in favor of the installation facing South, which is 15% of the energy produced by South-oriented installations. The parameter that is more reliable in terms of comparison, because it is independent from nominal PV power, is specific production (SP). The difference between SP for the considered azimuth angles is almost the same for the household and company: 163 kWh/kWp/year and 165 kWh/kWp/year, respectively. The PR parameter is also relatively constant for different azimuth angles. These two parameters show that the PV modules facing South are characterized by a higher energy yield compared to E-W, but the difference does not exclude this kind of system in terms of profitability.
The parameter that can decrease the profitability difference between the S and E-W systems is the self-consumption of the energy produced by photovoltaics (ESC). High ESC will have a positive influence on an electrical grid, decreasing the overloading of the grid [25], which is very important in terms of sustainable energy usage. Moreover, due to the new regulations in the Polish act on renewable energy sources [3], energy self-consumption is more profitable in terms of savings resulting from producing and using energy from photovoltaics.
According to the results shown in Table 3 and Figure 3 and Figure 4, energy self-consumption strongly depends on the ratio between energy production and energy needs. If yearly energy needs are comparable to yearly energy production (in the case of the household, Figure 3), due to the specific behavior of a PV system, which is strongly dependent on insolation conditions, the ESC parameter is rather low, and it reaches 27% for the PV system facing S and 30% for the PV system facing E-W. A completely different situation is observed when the yearly energy needs are much higher than the yearly energy yield (in the case of the company, Figure 4). In this case, ESC reaches 95% and 97% for the installation facing South and East–West, respectively. In both cases, energy self-consumption is higher for the E-W configuration, but the difference reaches at most 3%.
Important parameters for the investors include the payback period and return on investment (ROI); these two factors show whether an investment will be profitable. In order to estimate these two parameters, some assumptions had to be applied concerning the costs of installation and recent regulations in electrical energy trading for microinstallations.
According to the recent annual report on the photovoltaic market in Poland, published by the Institute of Renewable Energy [1], the average net price in 2021 for a PV system of nominal power around 5 kWp was 985 EUR. The gross price of the considered PV system for the household would be 5 959 EUR (8% of VAT). For the PV installations with a nominal power around 50 kWp, the average net price was 657 EUR; thus, the gross price for the PV system designed for the company would be 38 783 EUR (23% VAT). All the prices were converted from PLN to EUR according to the average price of 1 EUR in the year 2021 (1 EUR = 4567 PLN) [26].
On the 1st of April 2022, net billing entered into force as a way of the financial settlement between a Prosumer and Energy Distributor. New regulations oblige an Energy Distributor to buy electrical energy injected into the electrical grid by a PV system for a wholesale price. According to the report published on 29 March 2022 by Polish Energy Regulatory Office (URE), the average price of electrical energy in Poland in 2021 was 0.1302 EUR/kWh. In turn, the average wholesale price of electrical energy on the market was 0.0609 EUR/kWh [27,28,29]. Moreover, inflation during 2021 was taken into account (5.1%) while calculating the payback period and ROI.
In order to simplify the calculations, no subsidies or loans were considered; 100% of the investment costs are covered by their own funds.
A typical lifetime of 25 years was assumed for the considered PV systems.
All the data above were used to estimate the payback period, ROI, and profitability of the investment. Detailed results for the given installations are shown in Table 4.
As can be seen, while analyzing Table 3 and Table 4, self-consumption (ESC) has a significant influence on the profitability of a PV system for the net billing as well as for the net metering support schemes. When ESC reaches 95–97%, the payback period is less than 7 years, and the ROI for South-oriented installation is 336%. When PV modules are installed on an average household, according to the net billing system, the payback time reaches 11 years for the installation facing South and 13 years for the E-W configuration. The ROI parameter is 121% and 81% for the South and E-W systems, respectively, which means that for a given time of system utilization (at least 25 years), the investment would still be profitable, although the payback period is rather high.
When comparing these results with the net metering scheme one can clearly see that for the considered price of electrical energy, the new way of PV energy trade is less profitable in terms of ROI and payback time. The net metering to net billing change has the greatest impact on the household. The payback time is extended by 2.4 years for the South configuration and 2.7 years for E-W. The ROI parameter is 61 percentage points lower for the net billing and South azimuth and 45 percentage points lower for the net billing and E-W system. For the company, the difference is less significant due to the high self-consumption parameter. The payback period is almost the same for the net billing, and ROI is, at most, 5 percentage points lower than for the net metering.
Another aspect of photovoltaic system usage is the ecological impact on the environment. The analyzed parameter for the considered PV systems is “avoided CO2 emission” (Table 4) due to emission-free electrical energy production. The main assumptions taken into consideration while calculating carbon balance are as follows: PV system Life Cycle Emission (LCE)—the total amount of CO2 emission caused by the construction and operation of the PV installation: 9.4 t. Grid LCE is the average amount of CO2 emission per energy unit for the electricity produced by the electrical grid—798 gCO2/kWh. The project lifetime is 25 years. Moreover, the energy injected into the electrical grid (EGRID) is taken into account, as well as an annual system degradation of 1%. Considering all the data above, using the “Carbon Balance” tool in PVsyst, simulations were performed, and the results are shown in Table 4 and Figure 5.
While analyzing the avoided CO2 emission for the given systems, it is rather clear that its value is strictly correlated to the amount of energy produced by the PV systems. The higher the energy produced, the better the CO2 emission reduction. What is also worth analyzing is the time when the PV system becomes emission-free due to balancing the electrical energy needed to manufacture and install all the components included in the entire installation. According to the graphs presented in Figure 5a,b, the PV system facing South for the household as well as for the company will reach the considered balance after two years of operation. For the East–West configuration, this time does not change significantly, and it is 2.5 years, which is a good result, especially since the PV system will work for at least 25 years.
4. Conclusions
In the presented work, two different approaches in terms of investor energy needs were analyzed. One is a standard household with yearly energy needs of 5.7 MWh, and the second is a company where the energy needs reach 380 MWh during a year. The supposed PV microinstallations were designed, compared, and analyzed in order to choose the best solution for a given option in the face of the new energetic law regulations introduced in Poland. For each investor, two azimuth configurations of the installations were analyzed—South and East–West. Using the PVsyst software, the simulations were performed, taking into account the user’s energy need profiles. Different parameters of the designed PV systems were analyzed: yearly energy production, energy injected into the electrical grid, energy provided to the investor by an energy distributor, performance ratio, specific production, and energy self-consumption. Economic parameters, such as the payback period and the return on investment, were also analyzed, taking into account currently in force net billing and the previous net metering photovoltaic supporting schemes. Moreover, the ecological aspect of the PV system was also taken into account while comparing different system variants.
In terms of maximizing energy production, the PV system facing South is obviously the best option. The difference in yearly energy production between the systems facing South and East–West reaches 15%. However, the system facing E-W has a better energy self-consumption factor because usually a higher demand for electrical energy is observed in the morning and the afternoon. That is why the PV modules facing East and West will provide higher power during these parts of the day compared to modules facing South direction. High energy self-consumption is important in terms of sustainable energy usage and decreasing energy grid overload, which has become a common problem while the number of PV systems is increasing in Poland. Unfortunately, the difference in energy self-consumption between the East–West and South configurations reaches only 3% and as economic analysis has shown, it is not enough to balance the difference between the payback periods for the analyzed configurations. According to the performed simulations, the PV system facing South will still have a shorter payback time and a higher return on investment parameter, both for the household and the company.
However, the main difference between the two analyzed types of investors is the ratio between the energy produced by a PV system to the user’s energy needs. When this ratio is low, almost all the energy produced by photovoltaics (95–97%) is consumed by the investor (in the case of the company), which has a great influence on the profitability of the investment. The payback period does not exceed 6 years for the PV system facing South. Moreover, only 5% to 3% of the produced electrical energy is injected into the grid, so considering sustainable energy usage, it is the best option. The situation changes for the household where the self-consumption parameter reaches 30% and the payback period varies between 11 and 13 years. When considering the time span of the installation (25 years), the investment would still be profitable (ROI: 81–121%), but obviously not as much as for the company (ROI: 227–336%). It shows the importance of the energy self-consumption parameter.
Comparing the net billing and net metering financial schemes for a given electric energy price, one can conclude that currently in force net billing is less profitable than net metering, especially when the energy self-consumption parameter is low, like in the case of the household. When investors’ demand for electrical energy greatly exceeds energy produced by photovoltaics, the difference between net billing and net metering is almost insignificant.
Considering this analysis, one has to take into account that no subsidies were introduced to the performed simulations. Supporting financial programs would significantly decrease the payback period and ROI parameter. Moreover, constantly increasing prices of electrical energy will also make the PV systems investment more profitable.
The ecological effect that PV systems have on the environment is taken for granted. The more energy photovoltaics produce, the more CO2 emission is saved, especially when the produced energy is used in the place of investment. In terms of carbon balance, all considered installations will produce the energy needed to fabricate and install all the components in the PV system during 2–2.5 years.
All analyzed systems are profitable for the investor and beneficial for the environment in terms of sustainable energy usage. However, the best way to enhance the profitability of a photovoltaic investment in every aspect is to increase the energy self-consumption.
The analysis was made considering Polish legislation; however, the results are universal and can be successfully generalized for other countries where photovoltaic systems have become a dominant source of renewable energy.
Funding
This research was supported by the statutory funds granted to the Faculty of Environmental Engineering, Lublin University of Technology, Poland, grant number FD-20/IS-6/999.
Institutional Review Board Statement
Not applicable.
Informed Consent Statement
Not applicable.
Acknowledgments
The author would like to thank Sylwester Adamek for providing energy user needs data for the IATC building.
Conflicts of Interest
The author declare no conflict of interest.
Appendix A
Figure A1.
Daily values of household energy consumption during the year 2021.

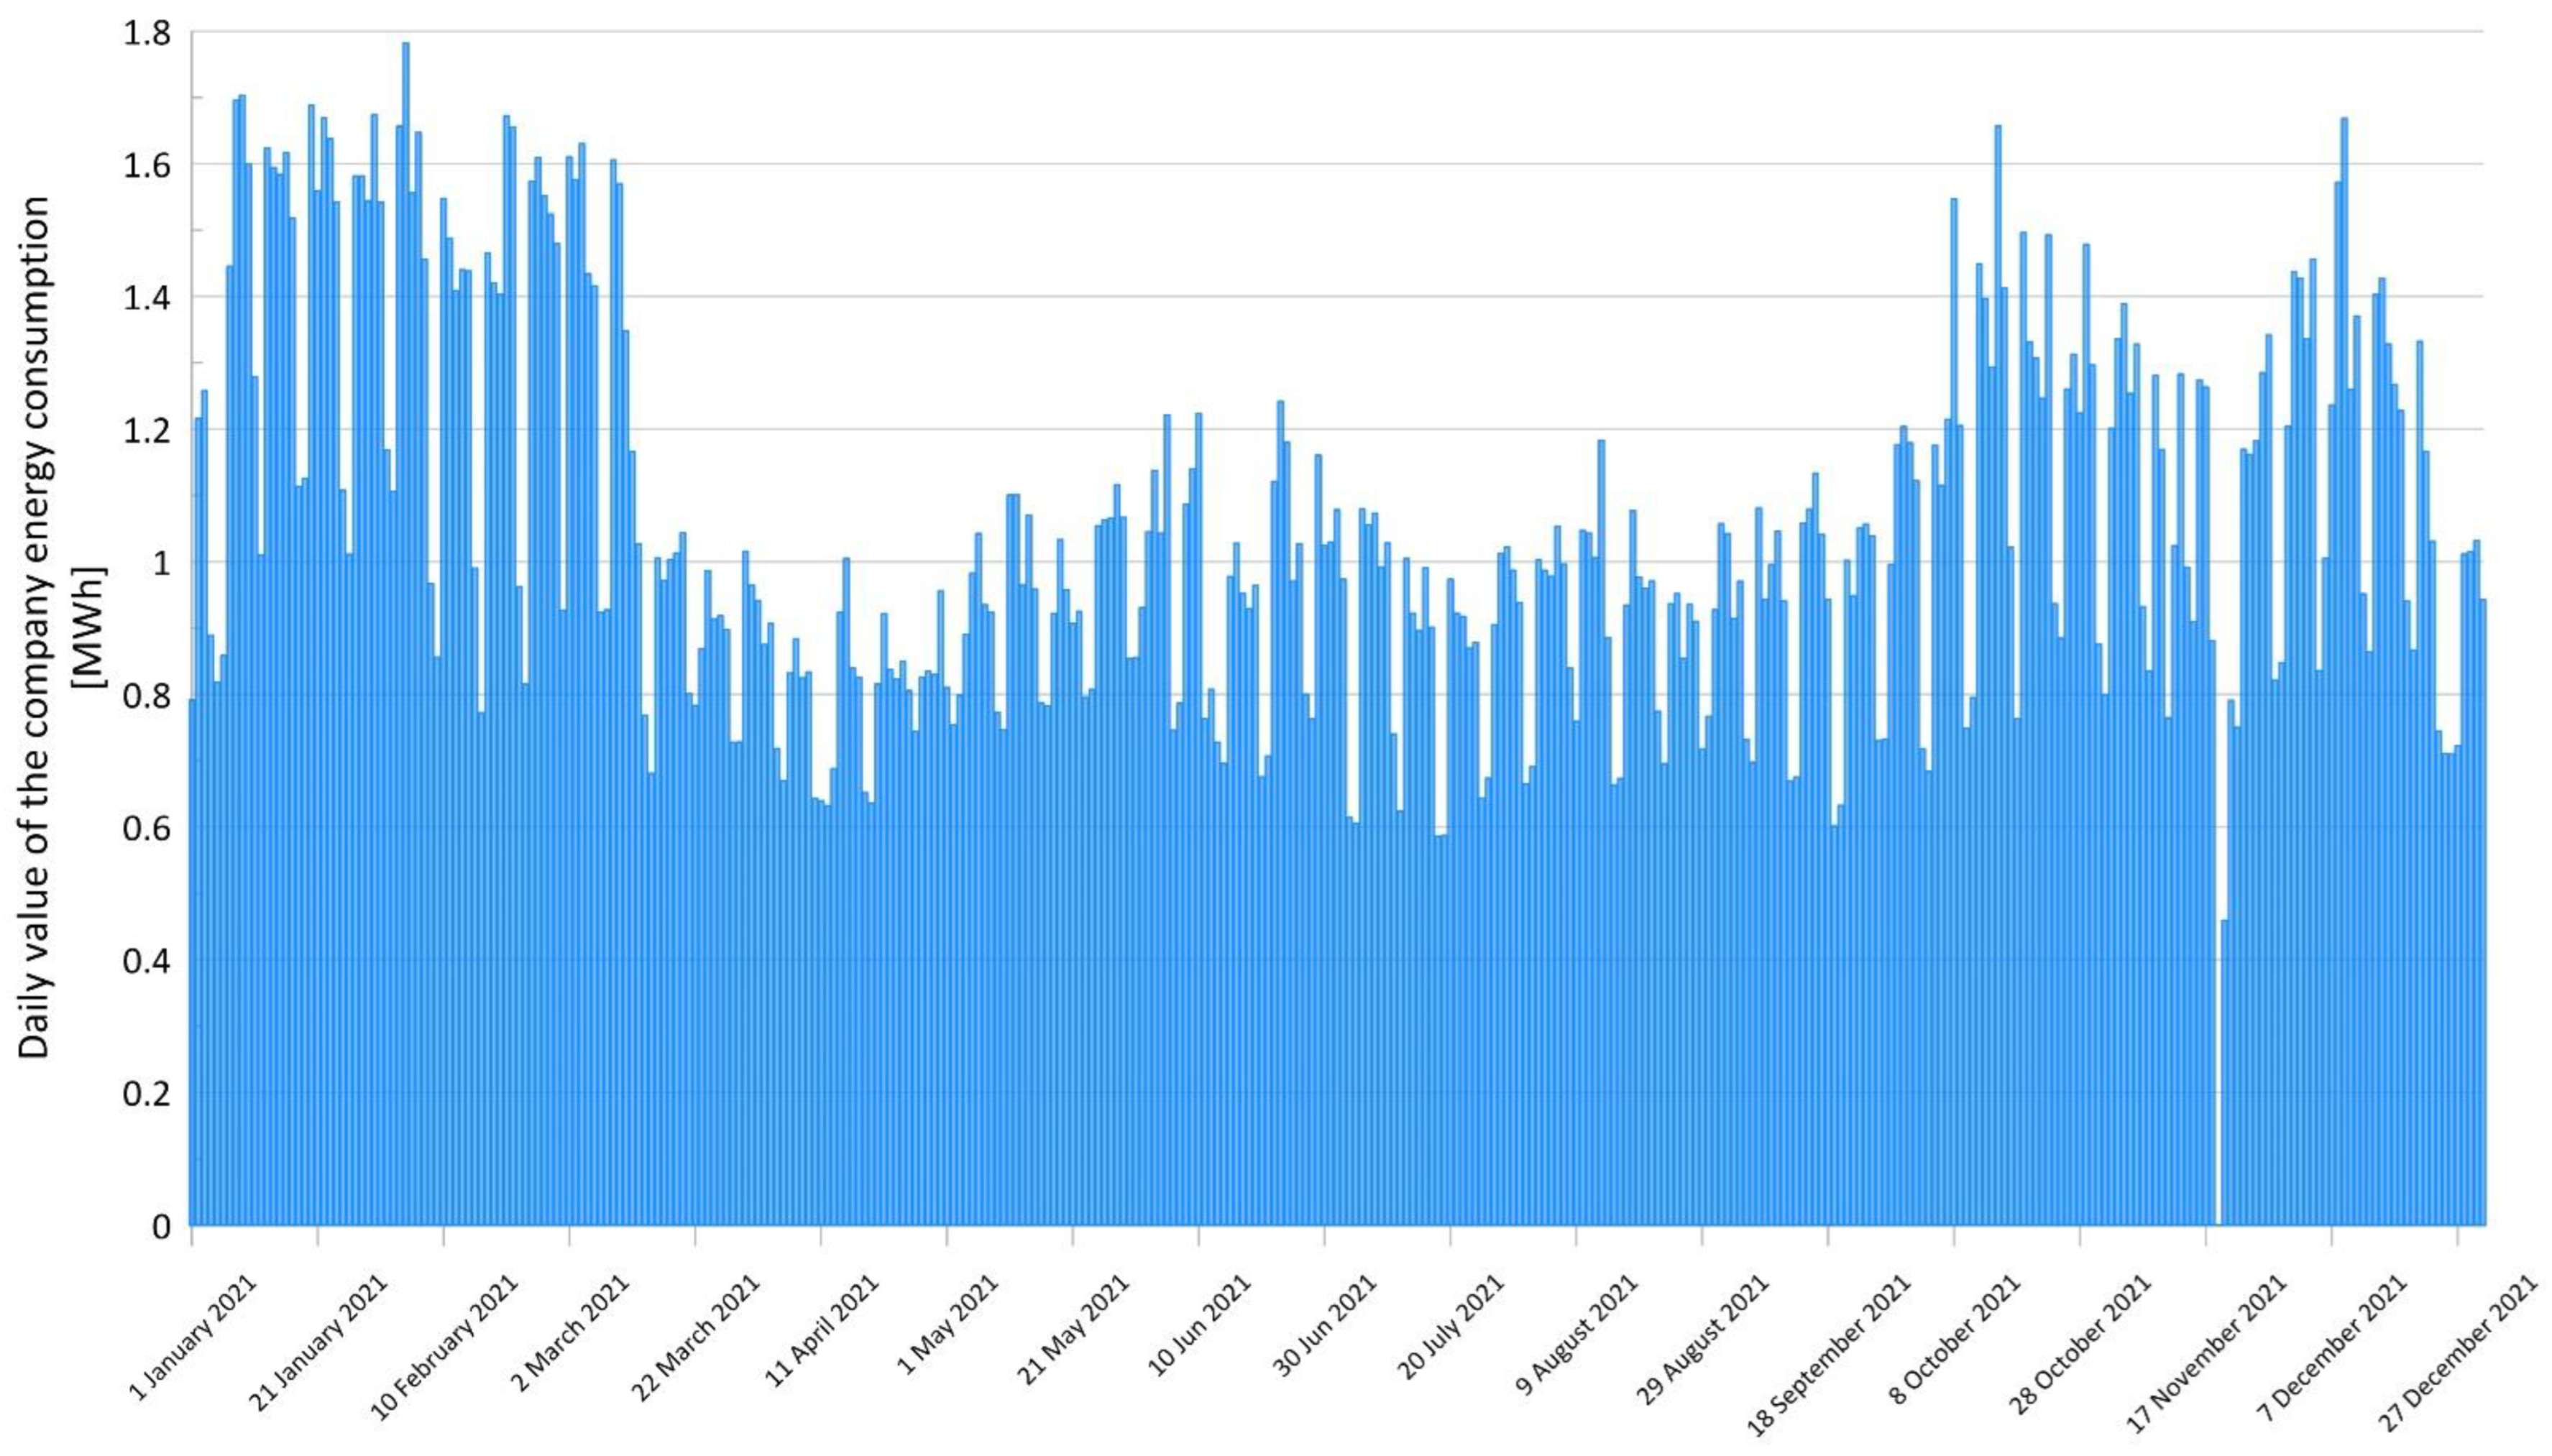
Figure A2.
Daily values of the company energy consumption during the year 2021.

References
- Institute for Renewable Energy. Photovoltaic Market in Poland. 2022. Available online: https://www.ieo.pl/pl/raport-pv-2022 (accessed on 8 July 2022).
- Kabir, E.; Kumar, P.; Kumar, S.; Adelodun, A.A.; Kim, K. Solar Energy Potential and future prospects. Renew. Sustain. Energy Rev. 2018, 82, 894–900. [Google Scholar] [CrossRef]
- Dziennik Ustaw Rzeczpospolitej Polskiej, 2020 R. poz. 261. Available online: https://isap.sejm.gov.pl/isap.nsf/DocDetails.xsp?id=WDU20200000261 (accessed on 8 July 2022).
- National Fund for Environmental Protection and Water Management. Informacje o Programie/Prosument-Dofinansowanie Mikroinstalacji OZE (2015–2020). Available online: https://archiwum.nfosigw.gov.pl/oferta-finansowania/srodki-krajowe/programy-priorytetowe/prosument-dofinansowanie-mikroinstalacji-oze/informacje-o-programie/ (accessed on 8 July 2022).
- Górnowicz, R.; Castro, R. Optimal design and economic analysis of a PV system operating under Net Metering or Feed-In-Tariff support mechanisms: A case study in Poland. Sustain. Energy Technol. Assess. 2020, 42, 100863. [Google Scholar] [CrossRef]
- International Energy Agency. Poland 2022 Energy Policy Review. 2022. Available online: https://www.iea.org/ (accessed on 8 July 2022).
- Bertsch, V.; Geldermann, J.; Luhn, T. What drives the profitability of household PV investments, self-consumption and self-sufficiency? Appl. Energy 2017, 204, 1–15. [Google Scholar] [CrossRef]
- Luthander, R.; Widen, J.; Nilsson, D.; Palm, J. Photovoltaic self-consumption in buildings: A review. Appl. Energy 2015, 142, 80–94. [Google Scholar] [CrossRef]
- Martín-Chivelet, N.; Montero-Gómez, D. Optimizing photovoltaic self-consumption in office buildings. Energy Build. 2017, 150, 71–80. [Google Scholar] [CrossRef]
- Montero, I.; Miranda, M.T.; Barrena, F.; Sepúlveda, F.J.; Arranz, J.I. Analysis of photovoltaic self-consumption systems for hospitals in southwestern Europe. Energy Build. 2022, 269, 112254. [Google Scholar] [CrossRef]
- Masa-Bote, D.; Castillo-Cagigal, M.; Matallanas, E.; Caamaño-Martín, E.; Gutiérrez, A.; Monasterio-Huelín, F.; Jiménez-Leube, J. Improving photovoltaics grid integration through short time forecasting and self-consumption. Appl. Energy 2014, 125, 103–113. [Google Scholar] [CrossRef]
- Ordóñez, Á.; Sánchez, E.; Rozas, L.; García, R.; Parra-Domínguez, J. Net-metering and net-billing in photovoltaic self-consumption: The cases of Ecuador and Spain. Sustain. Energy Technol. Assess. 2022, 53, 102434. [Google Scholar] [CrossRef]
- Lorenzi, G.; Augusto Santos Silva, C. Comparing demand response and battery storage to optimize self-consumption in PV systems. Appl. Energy 2016, 180, 524–535. [Google Scholar] [CrossRef]
- Barzegkar-Ntovom, G.A.; Chatzigeorgiou, N.G.; Nousdilis, A.I.; Vomva, S.A.; Kryonidis, G.C.; Kontis, E.O.; Georghiou, G.E.; Christoforidis, G.C.; Papagiannis, G.K. Assessing the viability of battery energy storage systems coupled with photovoltaics under a pure self-consumption scheme. Renew. Energy 2020, 152, 1302–1309. [Google Scholar] [CrossRef] [Green Version]
- Muñoz-Rodríguez, F.J.; Jiménez-Castillo, G.; de la Casa Hernández, J.; Aguilar Pena, J.D. A new tool to analysing photovoltaic self-consumption systems with batteries. Renew. Energy 2021, 168, 1327–1343. [Google Scholar] [CrossRef]
- Gulkowski, S. Specific Yield Analysis of the Rooftop PV Systems Located in South-Eastern Poland. Energies 2022, 15, 3666. [Google Scholar] [CrossRef]
- Stephant, M.; Abbes, D.; Hassam-Ouari, K.; Labrunie, A.; Robyn, B. Distributed optimization of energy profiles to improve photovoltaic self-consumption on a local energy community. Simul. Model. Pract. Theory 2021, 108, 102242–102255. [Google Scholar] [CrossRef]
- Khatib, T.; Deria, R. East-west oriented photovoltaic power systems: Model, benefits and technical evaluation. Energy Convers. Manag. 2022, 266, 115810–115825. [Google Scholar] [CrossRef]
- Eftekharnejad, S.; Vittal, V.; Heydt, G.T.; Keel, B.; Loehr, J. Impact of increased penetration of photovoltaic generation on power systems. IEE Trans. Power Syst. 2013, 28, 893–901. [Google Scholar] [CrossRef]
- Tavakoli, A.; Saha, S.; Arif, M.T.; Haque, M.E.; Mendis, N.; Aman, M.T. Impacts of grid integration of solar PV and electric vehicle on grid stability, power quality and energy economics: A review. IET Energy Syst. Int. 2020, 2, 243–260. [Google Scholar] [CrossRef]
- Karimi, M.; Mokhlis, H.; Naidu, K.; Uddin, S.; Bakar, A.H.A. Photovoltaic penetration issues and impacts in distribution network—A review. Renew. Sustain. Energy Rev. 2016, 53, 594–605. [Google Scholar] [CrossRef]
- Kumar, V.; Pandey, A.S.; Sinha, S.K. Grid integration and power quality issues of wind and solar energy system: A review. In Proceedings of the 2016 International Conference on Emerging Trends in Electrical Electronics & Sustainable Energy Systems (ICETEESES), Sultanpur, India, 11–12 March 2016; pp. 71–80. [Google Scholar]
- Roldan-Fernandez, J.M.; Burgos-Payan, M.; Riquelme-Santos, J.M. Assessing the decarbonisation effect of household photovoltaic self-consumption. J. Clean. Prod. 2021, 318, 128501–128517. [Google Scholar] [CrossRef]
- Available online: https://meteonorm.com/en/ (accessed on 8 July 2022).
- Rehman, O.U.; Khan, S.A.; Javaid, N. Impact of photovoltaic self-consumption curtailment on building-to-grid operations. Int. J. Electr. Power Energy Syst. 2021, 124, 106374–106390. [Google Scholar] [CrossRef]
- Available online: https://www.gov.pl/web/finanse/srednie-arytmetyczne/ (accessed on 8 July 2022).
- The Communications of the President of URE No. 13/2022. Available online: https://www.ure.gov.pl/pl/urzad/informacje-ogolne/komunikaty-prezesa-ure/10186,Informacja-nr-132022.html (accessed on 8 July 2022).
- The Communications of the President of URE No. 14/2022. Available online: https://www.ure.gov.pl/pl/urzad/informacje-ogolne/komunikaty-prezesa-ure/10187,Informacja-nr-142022.html (accessed on 8 July 2022).
- The Communications of the President of URE No. 15/2022. Available online: https://www.ure.gov.pl/pl/urzad/informacje-ogolne/komunikaty-prezesa-ure/10188,Informacja-nr-152022.html (accessed on 8 July 2022).
Figure 1.
Cumulative photovoltaic power installed in Poland [1].
Figure 1.
Cumulative photovoltaic power installed in Poland [1].

Figure 2.
Exemplary hourly results of the simulation for energy distribution for the household. Simulation performed during a sunny day on 26 May 2021.
Figure 2.
Exemplary hourly results of the simulation for energy distribution for the household. Simulation performed during a sunny day on 26 May 2021.

Figure 3.
Comparison of the household monthly energy distribution for a PV system facing South (a) and East–West (b).
Figure 3.
Comparison of the household monthly energy distribution for a PV system facing South (a) and East–West (b).

Figure 4.
Comparison of the company monthly energy distribution for a PV system facing South (a) and East–West (b).
Figure 4.
Comparison of the company monthly energy distribution for a PV system facing South (a) and East–West (b).

Figure 5.
Cumulative CO2 emission reduction during 25 years of PV system operation (a) for the household and (b) for the company.
Figure 5.
Cumulative CO2 emission reduction during 25 years of PV system operation (a) for the household and (b) for the company.


Table 1.
Electrical configuration of circuits connected to the inverter in the household.
| MPPT | Orientation | Tilt Angle | Number of Modules | |
|---|---|---|---|---|
| v1 | A | S | 25° | 7 |
| B | 7 | |||
| v2 | A | E | 10° | 7 |
| B | W | 10° | 7 |
Table 2.
Electrical configuration of circuits connected to the inverter in the IATC building.
| MPPT | Orientation | Tilt Angle | Number of Strings | Number of Modules | |
|---|---|---|---|---|---|
| v1 | A | S | 25° | 2 | 15 |
| B | 2 | 15 | |||
| C | 2 | 15 | |||
| D | 2 | 15 | |||
| v2 | A | E | 10° | 2 | 15 |
| B | 2 | 15 | |||
| C | W | 10° | 2 | 15 | |
| D | 2 | 15 |
Table 3.
Main PV system working parameters extracted from simulations performed in PVSYST.
| Investor | Azimuth | Eneeds (MWh) | PPV (kWp) | Ep (MWh/year) | PR | SP (MWh/kWp/year) | EGRID (MWh/year) | Esc (MWh/year) | EPV Grid (MWh/year) | Esc % (%) |
|---|---|---|---|---|---|---|---|---|---|---|
| household | S | 5.7 | 5.6 | 6.04 | 0.859 | 1.08 | 4.12 | 1.63 | 4.41 | 27% |
| E-W | 5.7 | 5.6 | 5.14 | 0.849 | 0.917 | 4.21 | 1.53 | 3.6 | 30% | |
| company | S | 383 | 48 | 53.4 | 0.886 | 1.112 | 332 | 50.9 | 2.4 | 95% |
| E-W | 383 | 48 | 45.5 | 0.876 | 0.947 | 338.78 | 44.14 | 1.3 | 97% |
Table 4.
Basic financial parameters for the considered PV systems taking into account currently in force in Poland—net billing and previous net metering photovoltaic support schemes.
Table 4.
Basic financial parameters for the considered PV systems taking into account currently in force in Poland—net billing and previous net metering photovoltaic support schemes.
| Net Billing | Net Metering | ||||||
|---|---|---|---|---|---|---|---|
| Investor | Azimuth | Installation Costs | Payback Period (Years) | Return on Investment | Payback Period (Years) | Return on Investment | Avoided CO2 Emission (Tons) |
| household | S | 5959 EUR | 11.3 | 121% | 8.9 | 182% | 98 t |
| E-W | 5959 EUR | 13.1 | 81% | 10.4 | 126% | 82 t | |
| company | S | 38,783 EUR | 5.7 | 336% | 5.7 | 341% | 858 t |
| E-W | 38,783 EUR | 6.7 | 275% | 6.6 | 278% | 717 t | |
Publisher’s Note: MDPI stays neutral with regard to jurisdictional claims in published maps and institutional affiliations. |
© 2022 by the author. Licensee MDPI, Basel, Switzerland. This article is an open access article distributed under the terms and conditions of the Creative Commons Attribution (CC BY) license (https://creativecommons.org/licenses/by/4.0/).
Share and Cite
MDPI and ACS Style
Cieślak, K.J. Multivariant Analysis of Photovoltaic Performance with Consideration of Self-Consumption. Energies 2022, 15, 6732. https://doi.org/10.3390/en15186732
AMA Style
Cieślak KJ. Multivariant Analysis of Photovoltaic Performance with Consideration of Self-Consumption. Energies. 2022; 15(18):6732. https://doi.org/10.3390/en15186732
Chicago/Turabian StyleCieślak, Krystian Janusz. 2022. "Multivariant Analysis of Photovoltaic Performance with Consideration of Self-Consumption" Energies 15, no. 18: 6732. https://doi.org/10.3390/en15186732
Note that from the first issue of 2016, this journal uses article numbers instead of page numbers. See further details here.