1. Introduction
As one of the most mature sources of unconventional gas resources, tight sandstone gas has very substantial reserves to be exploited. According to the research, the technically exploitable tight sandstone gas reserves today are 1050 to 2400 billion m
3 [
1]. However, tight sandstone gas reservoirs are characterized by deep burial, high pressure, tight matrix, fracture development, and the prevalence of edge and bottom water. Because of the small pore throats, the phenomenon of capillary force is obvious, and the difference in reservoir densities and fluid properties leads to severe water-blocking damage.
Water-blocking damage mainly refers to the phenomenon where the water saturation in the near-well zone of tight sandstone gas increases sharply because of the intrusion of foreign fluids into the reservoir, thus causing a decrease in gas-phase permeability. Once water blocking occurs in tight sandstone gas reservoirs, the permeability damage rate can reach more than 70%, and gas well production can drop to less than one-third of the original production [
2]. Therefore, understanding the water-blocking mechanism of tight sandstone gas reservoirs is helpful to reduce water-blocking damage and improve production from gas reservoirs.
According to the different foreign fluids, Xu, S. Y. [
3] divided the water-blocking damage process into two parts, capillary self-absorption and water phase retention, where capillary self-absorption refers to the rapid intrusion of edge and bottom water along the fracture and water phase retention refers to the inability to effectively return drainage because of the intrusion of working fluid into the reservoir. Wu, Y. [
4] focused on the influence of water phase retention on water blocking. The study concluded that the longer the working fluid intrudes into the reservoir, the greater the water-bearing saturation and the more severe the permeability damage. Gao, Q. S. [
5] clarified the effect of working fluid intrusion time on water-blocking damage by conducting damage experiments on tight sandstone reservoirs and classified the types of water blocking formed by working fluid into three types: deep intrusion low injury type, concave and convex intrusion medium injury type, and shallow intrusion high injury type. Using the pressure transfer test methods, Wang and Zhou [
6] found that working fluid intrusion makes the sandstone permeability decrease, which aggravates the water-blocking damage, and finally proposed a nanoemulsion system that effectively relieves the water-blocking damage. Zhang et al. [
7] proposed that when the surface tension of the working fluid is large, the reservoir core is severely damaged by water blocking, and foreign fluids are not easily displaced. Qin et al. [
8] investigated the effect of the fracture morphology and developmental characteristics on water blocking by using SEM and CT scans and found that intragrain fractures connect the pores and form a seepage network in dense sandstones, which greatly increases the permeability. Dong et al. [
9] divided the fractures in the Kalasu tight gas reservoir into macroscopic fractures and microscopic fractures based on the fracture pore size, fracture network effectively improves water-blocking damage by increasing permeability and gas seepage performance. Scholars at home and abroad have mainly studied the influence of working fluid on water locking in tight sandstone gas reservoirs while ignoring the study of the mechanism of edge and bottom water on water blocking in gas reservoirs.
As an emerging high technology, nuclear magnetic resonance (NMR)scanning technology is widely used in many aspects of oil and gas exploration. However, the current NMR scanning technique is less applied to the interpretation of the water-blocking mechanism and is mainly used to study the occurrence state and mobility of pore water in tight gas reservoirs. Yao et al. [
10] combined gas–water two-phase flow and NMR and found that whenever the saturation of the water-phase fluid entering the reservoir exceeded the original saturation, it would cause reservoir water-blocking damage. Li et al. [
11] used NMR testing to quantify the extent of water-blocking damage from a microscopic perspective and concluded that the root of relieving water-blocking damage is to eliminate the occupation of storage space by capillary water. Li et al. [
12] integrated NMR testing and core flooding, and the results showed that the lesser the percentage of movable water in the pore space, the more serious the degree of water blocking in the reservoir core under saturated water conditions. Zhang et al. [
13], using the NMR technique, analyzed the mechanism of water-blocking damage in working fluids from a microscopic perspective. Hassan et al. [
14] used NMR measurements to find that injecting a thermochemical fluid into a dense sample can reduce capillary forces and undo water-blocking damage.
In summary, the existing water-blocking mechanism of tight sandstone gas reservoirs mainly focuses on the water-phase retention caused by the working fluid, ignoring the study of the water-blocking mechanism of edge and bottom water. While NMR is an effective tool for oil and gas detection, it is less applied to explain the water-blocking mechanism in gas reservoirs. Therefore, this study comprehensively considered the impact of parameters such as porosity, water saturation, displacement pressure, pore size distribution, and fracture type on water blocking. Firstly, the core data of six wells in a tight sandstone gas reservoir were selected, and then centrifugal and NMR methods were used to conduct gas-displacing water experiments before and after fracture formation to simulate the effect of fracture formation on the water block in the reservoir. Finally, the water-blocking mechanism of gas reservoirs was analyzed based on the results of gas-flooding efficiency, expanding our understanding of the water-blocking mechanism in tight sandstone gas reservoirs.
3. Experimental Results
To study the effects of porosity, water saturation, displacement pressure, pore size distribution, and fracture morphology on water blocking in gas reservoirs, centrifugal and NMR experiments were performed. Finally, by comparing these effects on the gas-driving efficiency before and after fracture formation, the characteristics of pore throat distribution in tight sandstone gas reservoirs were obtained, and the effects on reservoir water blocking were analyzed.
3.1. Effect of Changes in Porosity and Water Saturation on Water Blocking after Fracture
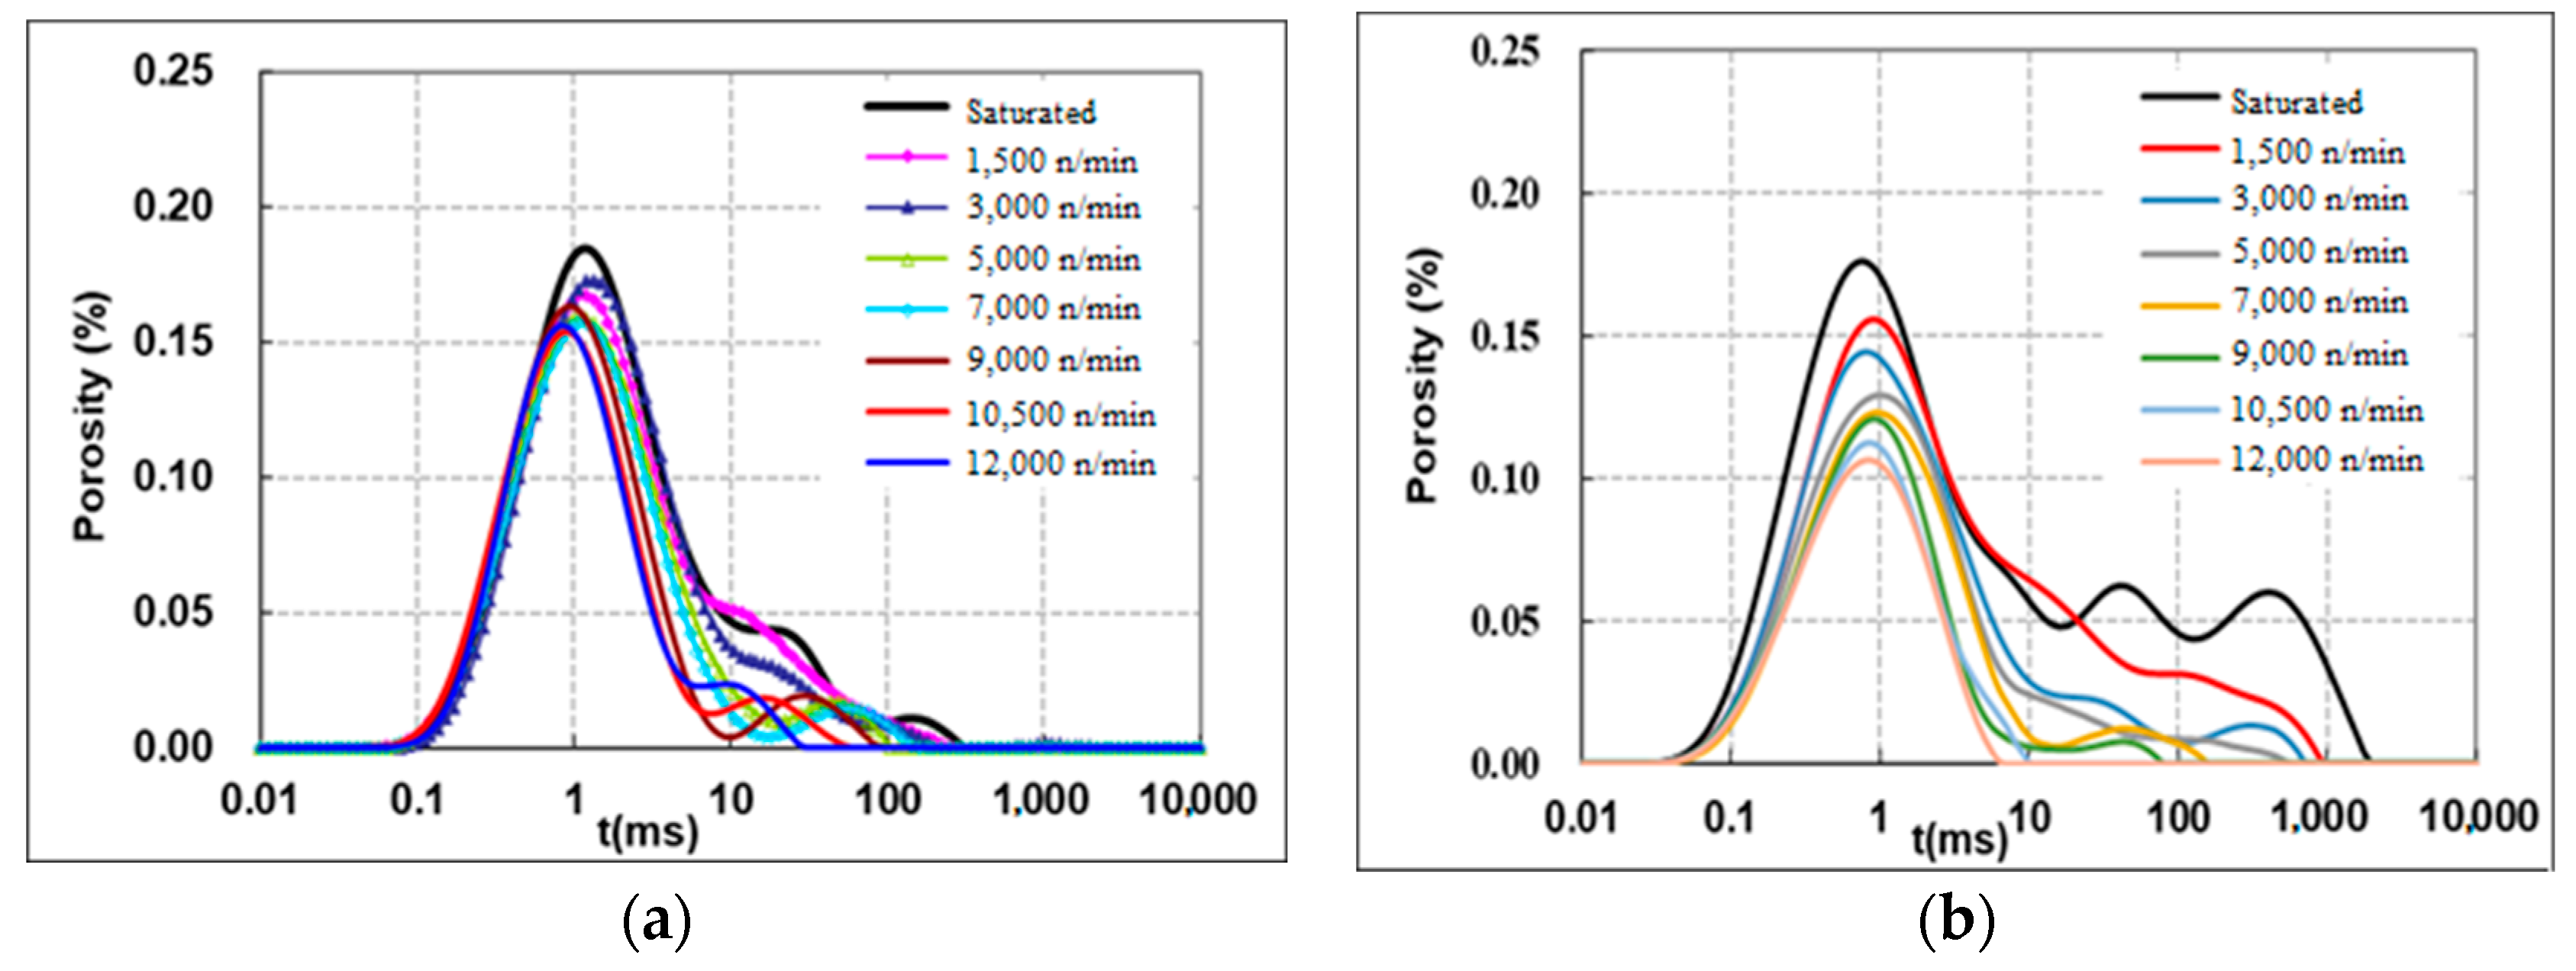
The cores from the tight sandstone gas reservoir No. 64 of well XX1003 were selected, and their plunger cores were tested by centrifugation and NMR. We finally obtained the NMR T2 spectrum curves and core pore size distributions at different rotational speeds before and after fracture, where the rotational speeds were 1500/3000/5000/7000/9000/10,500/12,000 turn/min, respectively. When the core is completely saturated with water, the T2 spectrum curve is the uppermost peripheral one, and its vertical coordinate is the porosity component of all filled water.
Comparing the NMR T
2 spectrum curves of cores before and after fracture formation at different rotational speeds (
Figure 1), it is found that, although the T
2 spectrum curves before and after fracture were both bimodal, the right peak of the curve before fracture was smaller and the left peak (short T
2 relaxation time) was dominant. It indicates that the core before fracture is mainly small pores, in which the water is poorly movable, and the capillary resistance is high, so the phenomenon of water blocking is serious. The right peak (T
2 relaxation time) of the curve is longer after fracture, which indicates that there are more large pores and stronger water movability. Therefore, the difference between the capillary force of the water phase and gas phase is smaller, the capillary resistance is reduced, and finally, the water-blocking phenomenon is effectively relieved.
From the curve characteristics of the core before and after fracture, the porosity of the core after fracture is relatively larger, so the water in the pore space is gradually driven out with the continuous gas repulsion. The T2 spectrum curve after gas flooding is shifted more, the final residual water saturation is lower, and finally, the degree of water-blocking damage is gradually reduced. In summary, the fracture is conducive to increasing the porosity of tight gas reservoirs and reducing capillary resistance. As the gas continues to occupy the pore space, the bound water keeps flowing out from the pore, which reduces the residual water saturation while slowing down the capillary self-absorption effect and finally effectively releasing the water-blocking damage.
Further, the distribution characteristics of gas and water in the pore space before and after fracture can be seen from the changes in water saturation at different speeds before and after fracture (
Table 3). Before the fracture, with the increase in centrifugal speed, the centrifugal force gradually overcomes the capillary force. The gas gradually occupies the space in the pore, which makes the water saturation decrease. However, the large pore content is low and poorly connected, and the permeability devotion value is dominated by the large pore. Although the pressure is sufficient, it is difficult to completely block the water phase. Therefore, even if the speed reaches 1200 turn/min, there is still about 70% of the water that cannot be effectively detached, and the saturation of bound water by centrifugation is high. It indicates that the sample is very dense and that a large amount of water has not been displaced. Even if the centrifugal speed is increased, the effect of gas-driving water is limited, and the water lock phenomenon is serious. The porosity of the core increases significantly after the fracture is created. Since the gas and water flow preferentially in the large pore space, the water saturation in the large pore space decreases rapidly, and the water is gradually driven out. However, because of the increase in the porosity in small pores, the effective seepage channels of the reservoir increase, and the water in the small pores is gradually replaced by gas. Therefore, the water saturation is continuously decreasing, and only about one-third of the water in the dense micropores has not been effectively displaced, which shows that the fracture-making effect is significant. When the speed reaches 12,000 turn/min, the saturation of bound water is only 34%. Therefore, the fracture structure can effectively communicate with the seepage channels and increase the porosity of the small pores while displacing the bound water from the small pores. Eventually, the gas permeability is increased by reducing the saturation of bound water to achieve effective improvement of water-blocking damage.
3.2. Effect of Changes in Displacement Pressure Curve on Water Blocking after Fracture
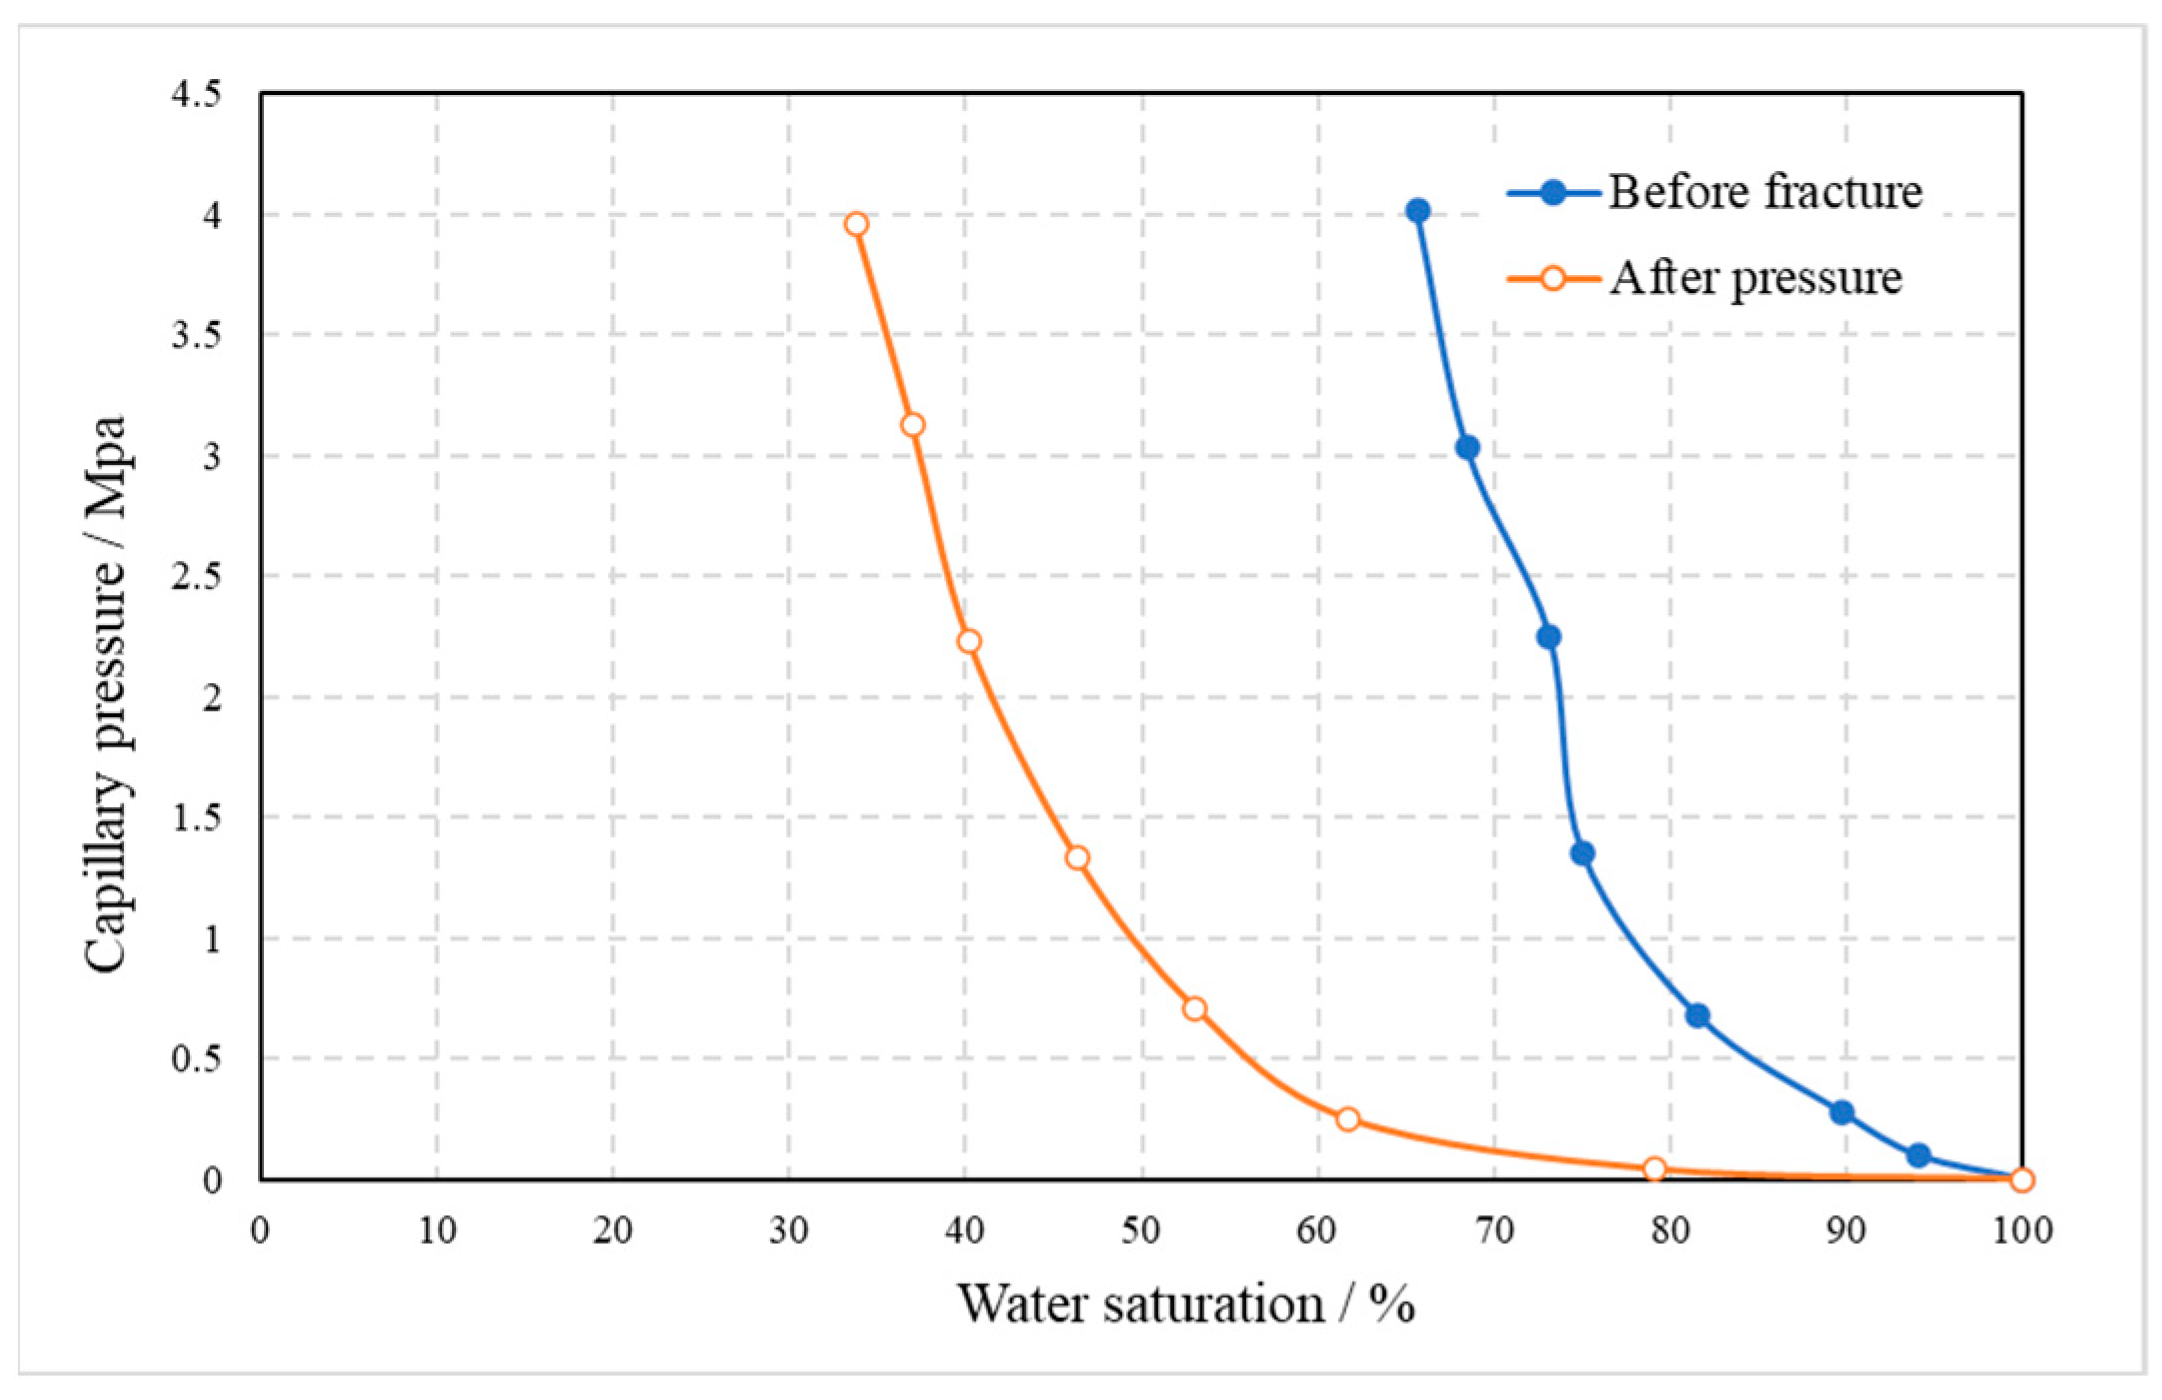
The graph of the displacement pressure before fracture is shown in
Figure 2 and indicates that when the displacement pressure increases to 0.7 MPa, only less than 20% of the water is displaced by the gas. Because this part of water exists in the large pores of the core, it can be displaced with only a small pressure. When the displacement pressure increased from 0.7 to 3 MPa, the gas flow rate increased because the displacement pressure overcomes part of the capillary force and drives part of the water flow in the pore space, eventually displacing about 10% of the water. When the displacement pressure increased to 4 MPa, the presence of a dense core and small porosity made the seepage channel resistance higher, so the water saturation of the core was around 70%, and still, more than two-thirds of the water was not displaced. This indicates that the gas flooding effect is still poor, and the water-blocking effect occurs in the reservoir, which leads to a significant reduction in gas production and ultimately affects the production of gas wells.
Fracture makes the core porosity increase, and more residual water in the tiny pores is transformed into movable water, which effectively communicates the seepage channels in the core. Therefore, when the displacement pressure is increased to 0.7 MPa, more than 45% of the water is displaced by the gas, compared with less than 20% of the water before fracture. When the displacement pressure is increased from 0.7 to 3 MPa, with the increase in displacement pressure, the capillary force of tiny pores is overcome. Therefore, more water in the pores and channels becomes movable water to be driven out. It was found that about 15% of water is driven out, and the relative permeability of the gas phase is increased. When the displacement pressure reached 4 MPa, only about one-third of the water remained because of the existence of even smaller pores and higher capillary resistance. Compared with the effect of displacement before fracture, although there are some tiny pores after fracture formation, fractures improve the overall physical properties of the reservoir and makes the core porosity increase significantly, which effectively communicates the seepage channel. At the same strength, the displacement pressure overcomes the capillary force of most of the tiny pores, further driving out the remaining water and alleviating the water-lock effect.
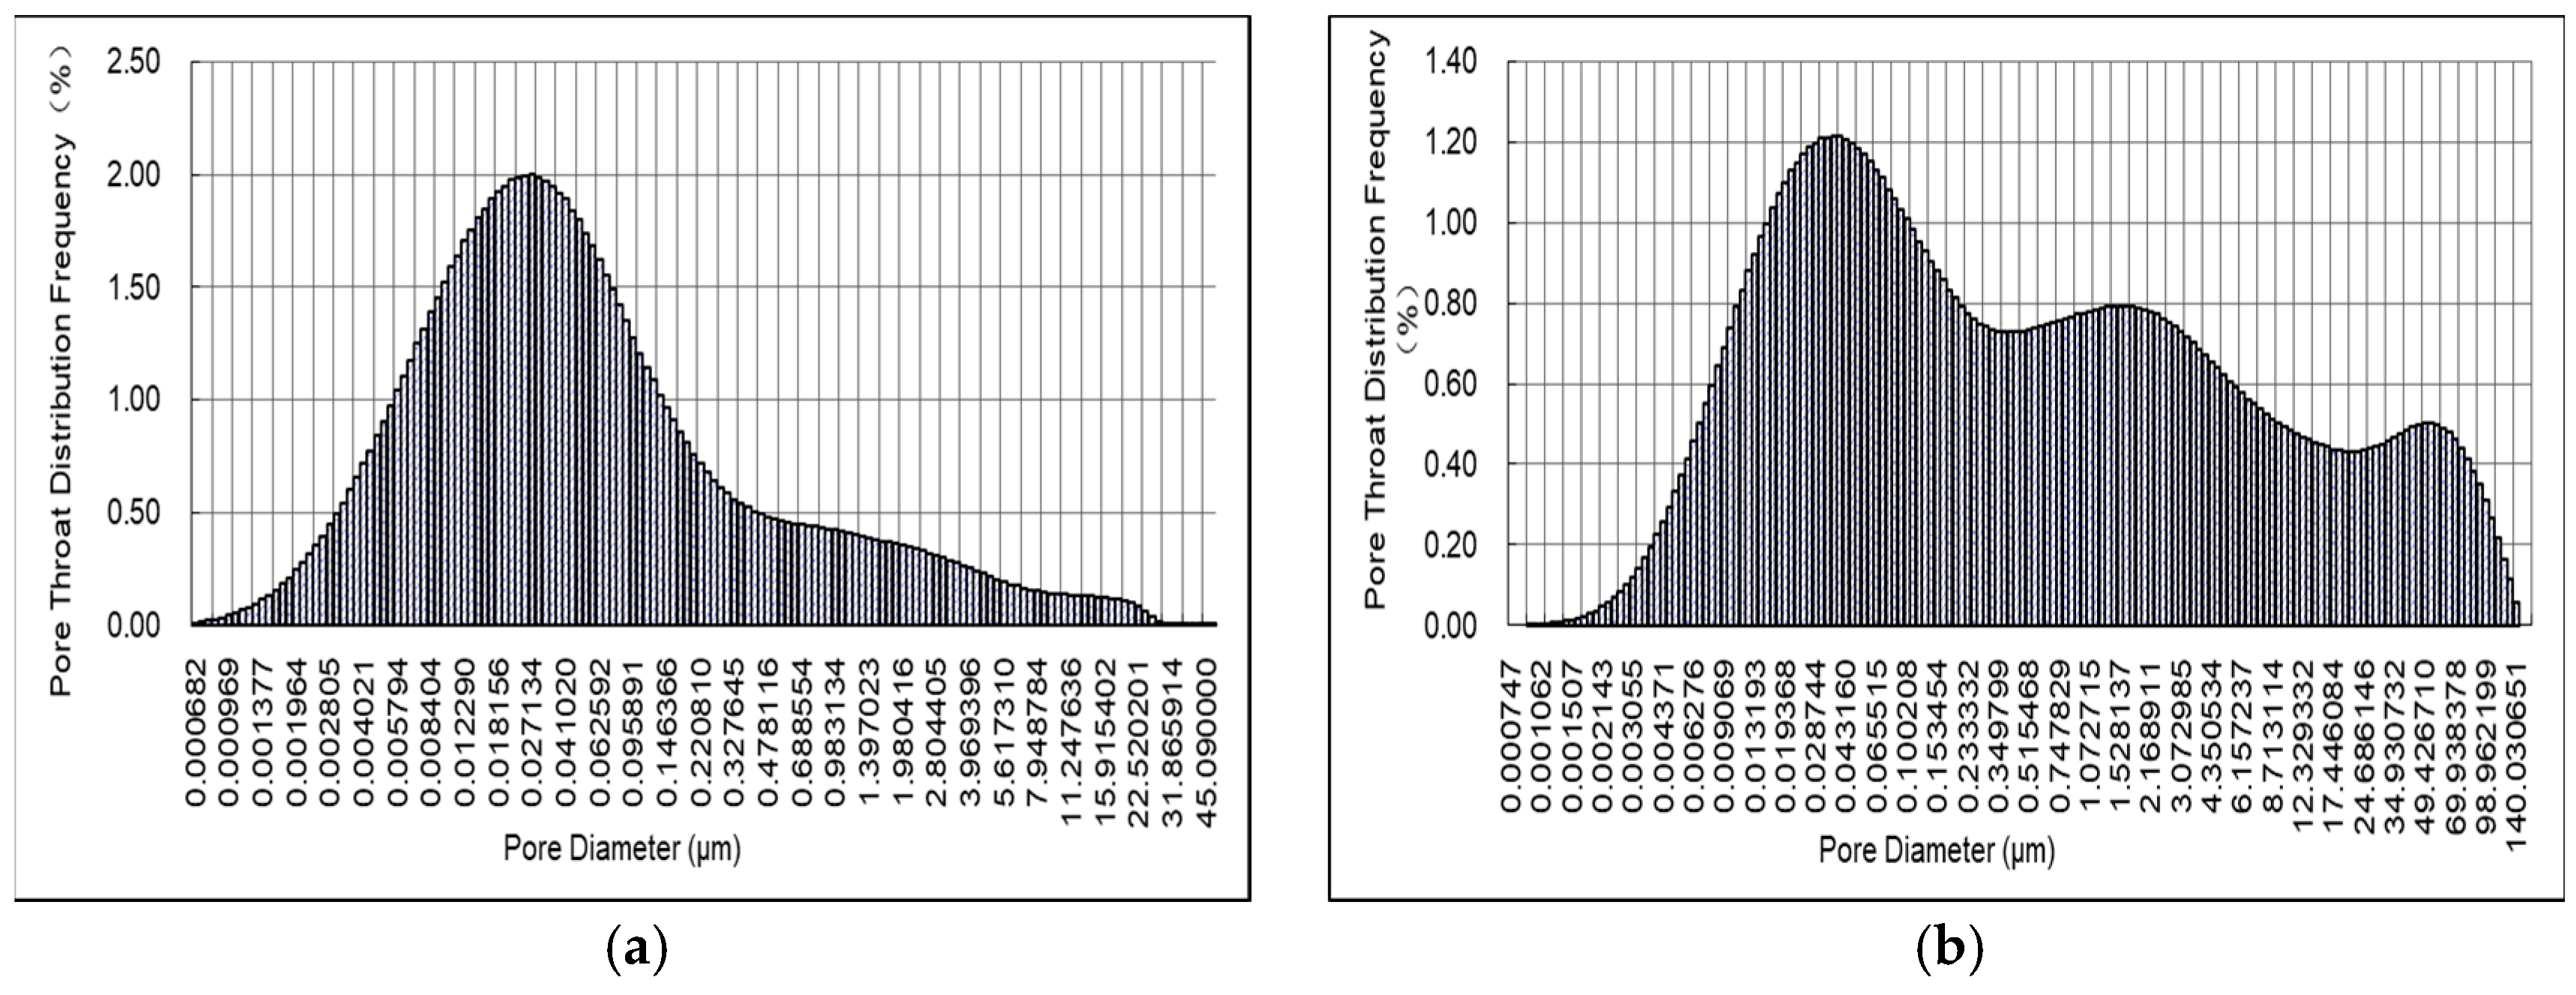
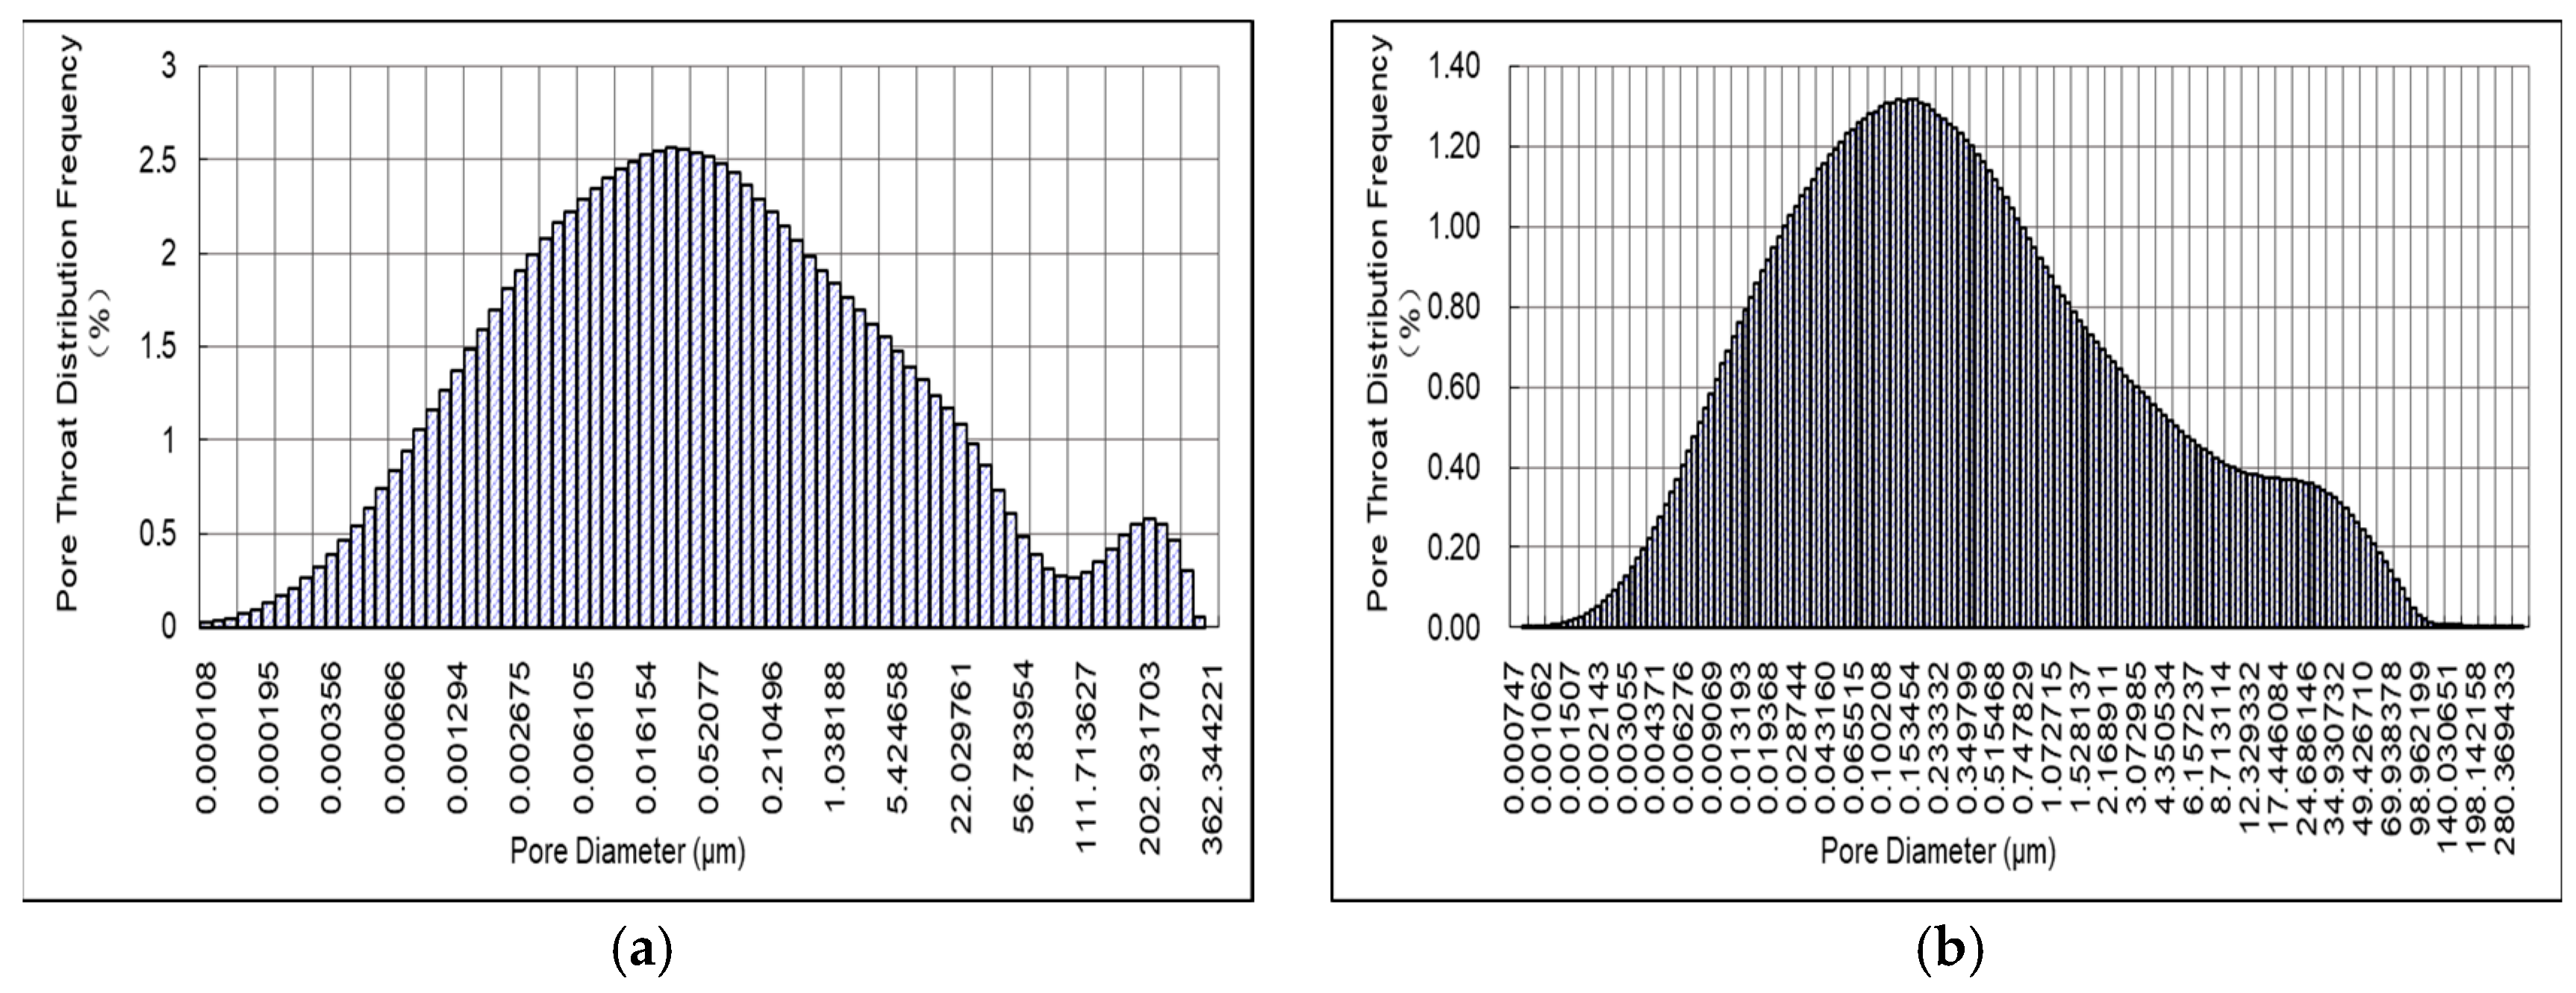
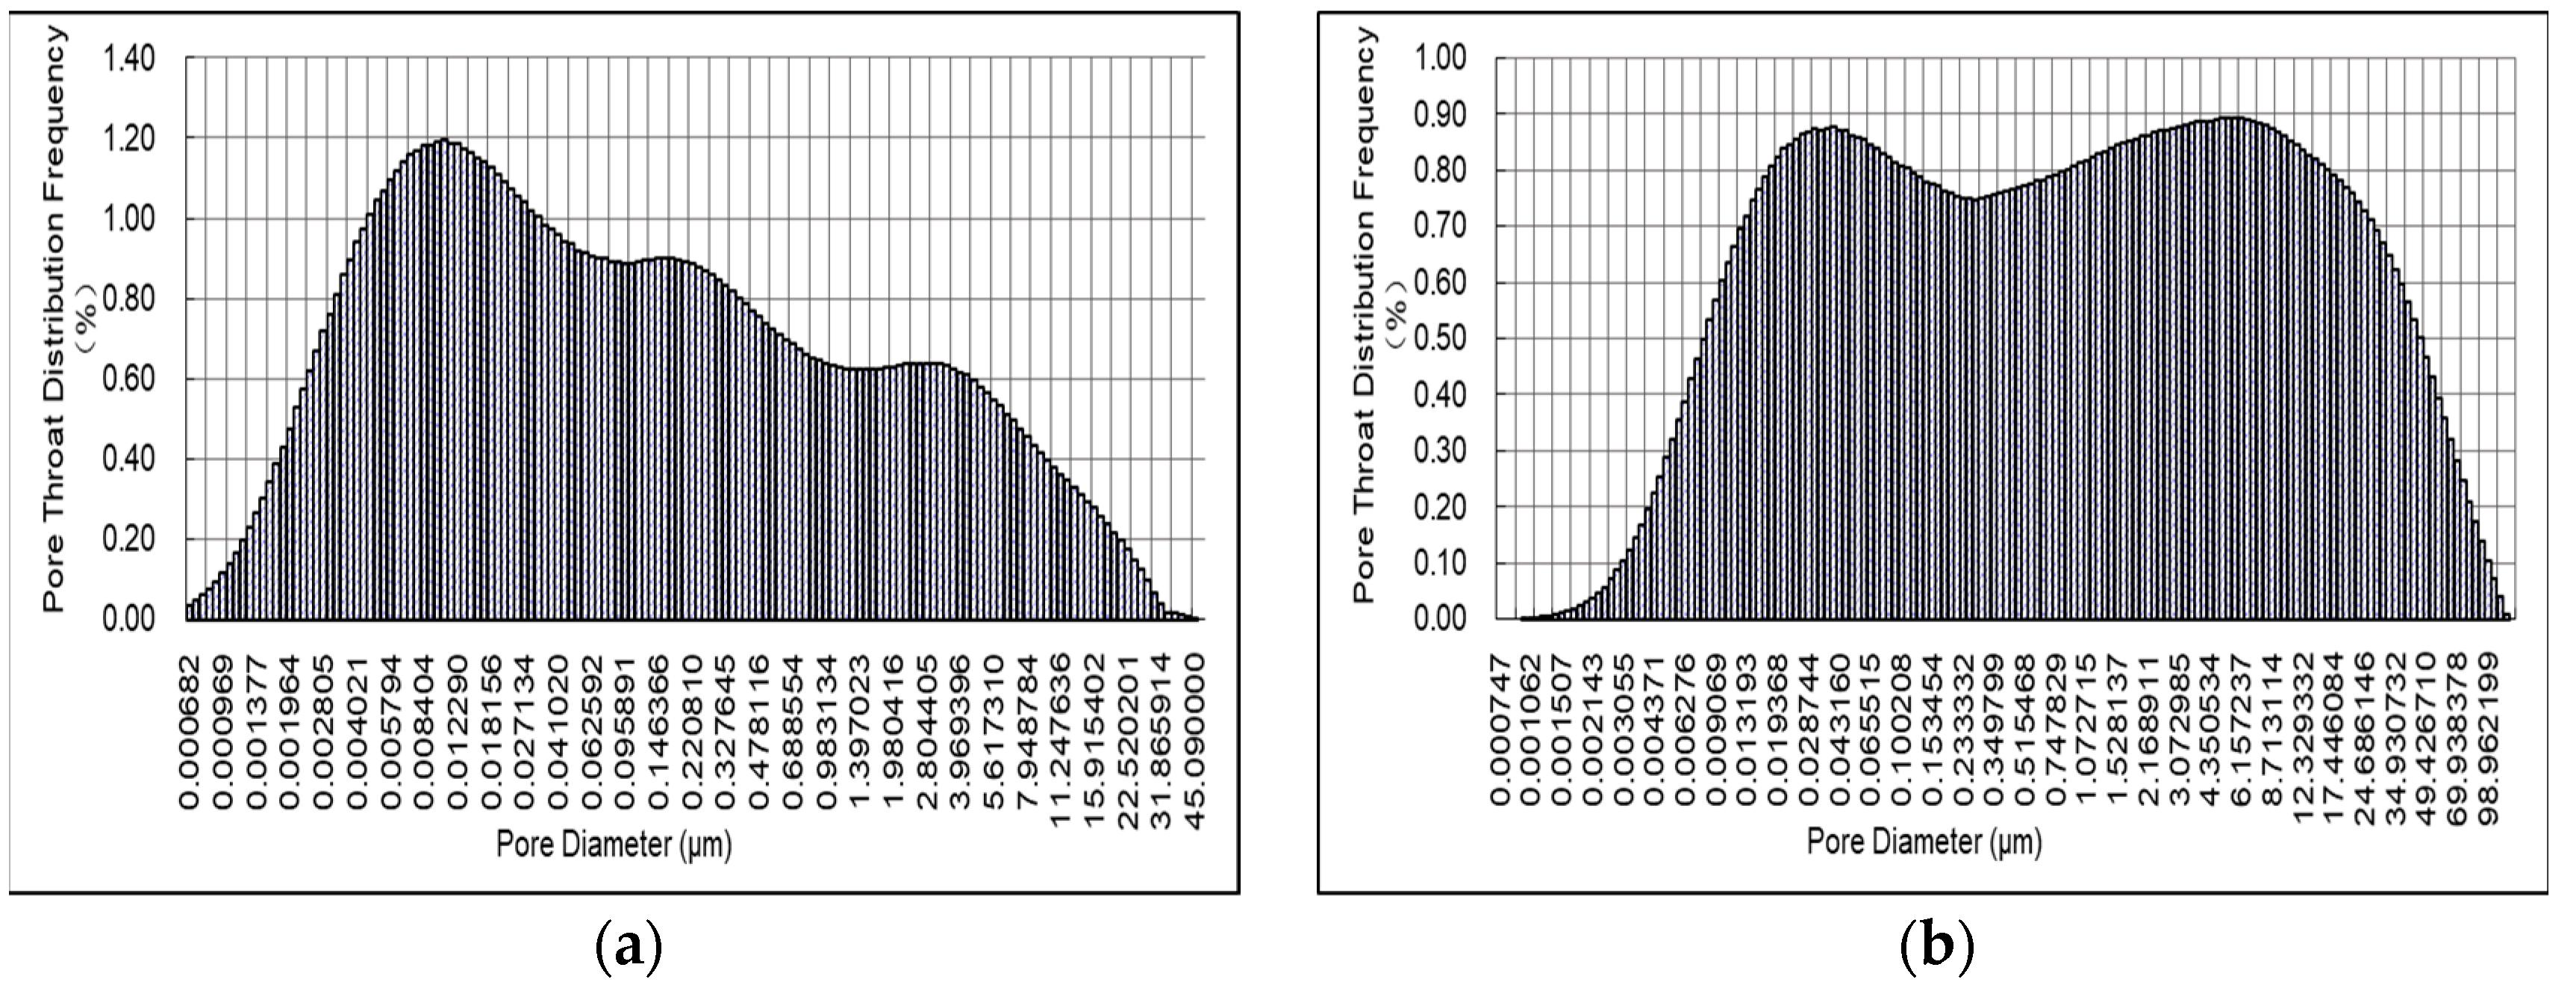
3.3. Effect of Changes in Pore Size Distribution on Water Blocking after Fracture
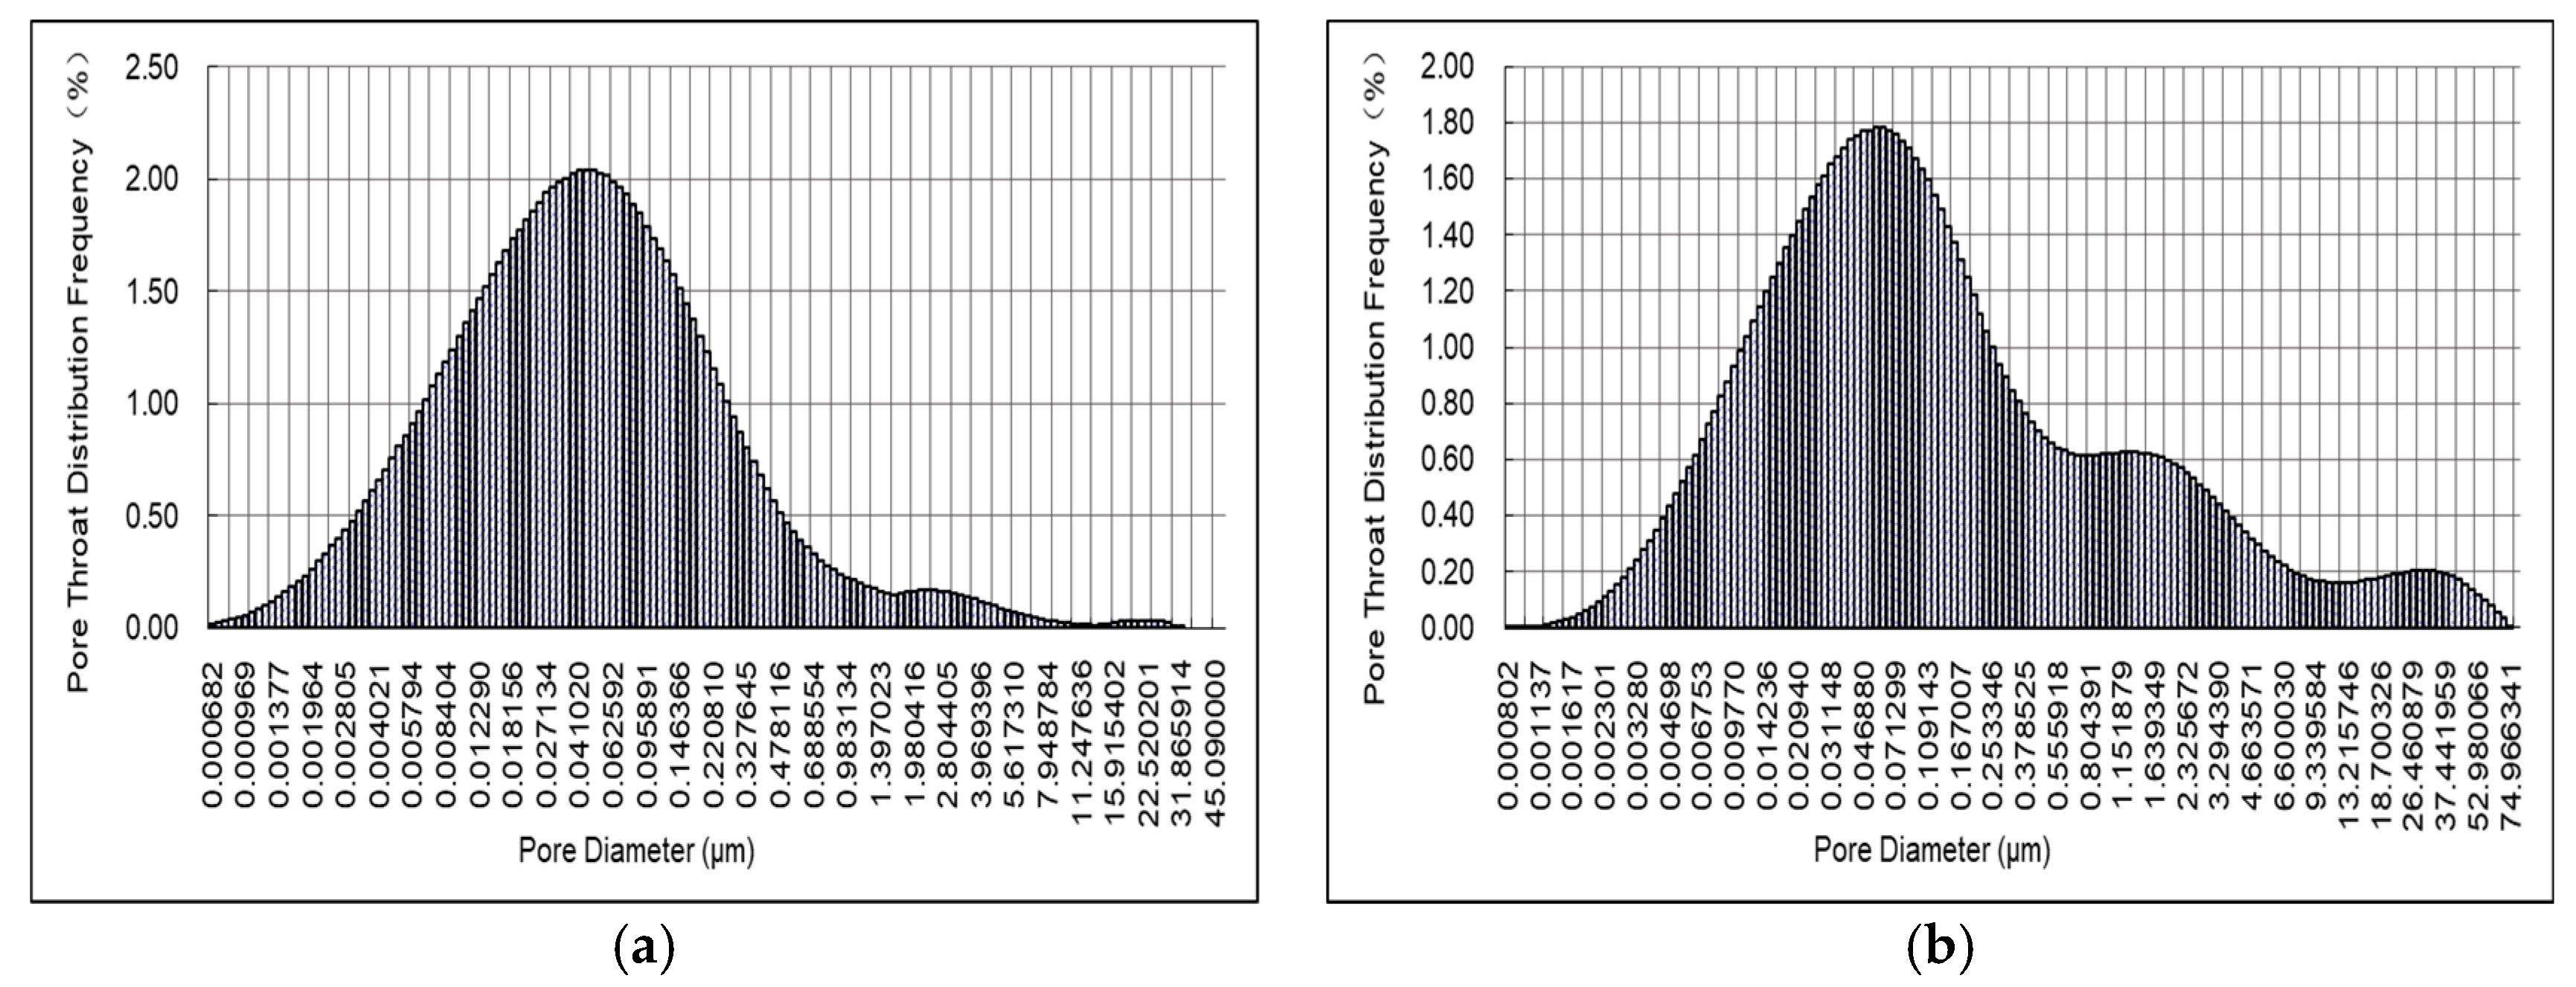
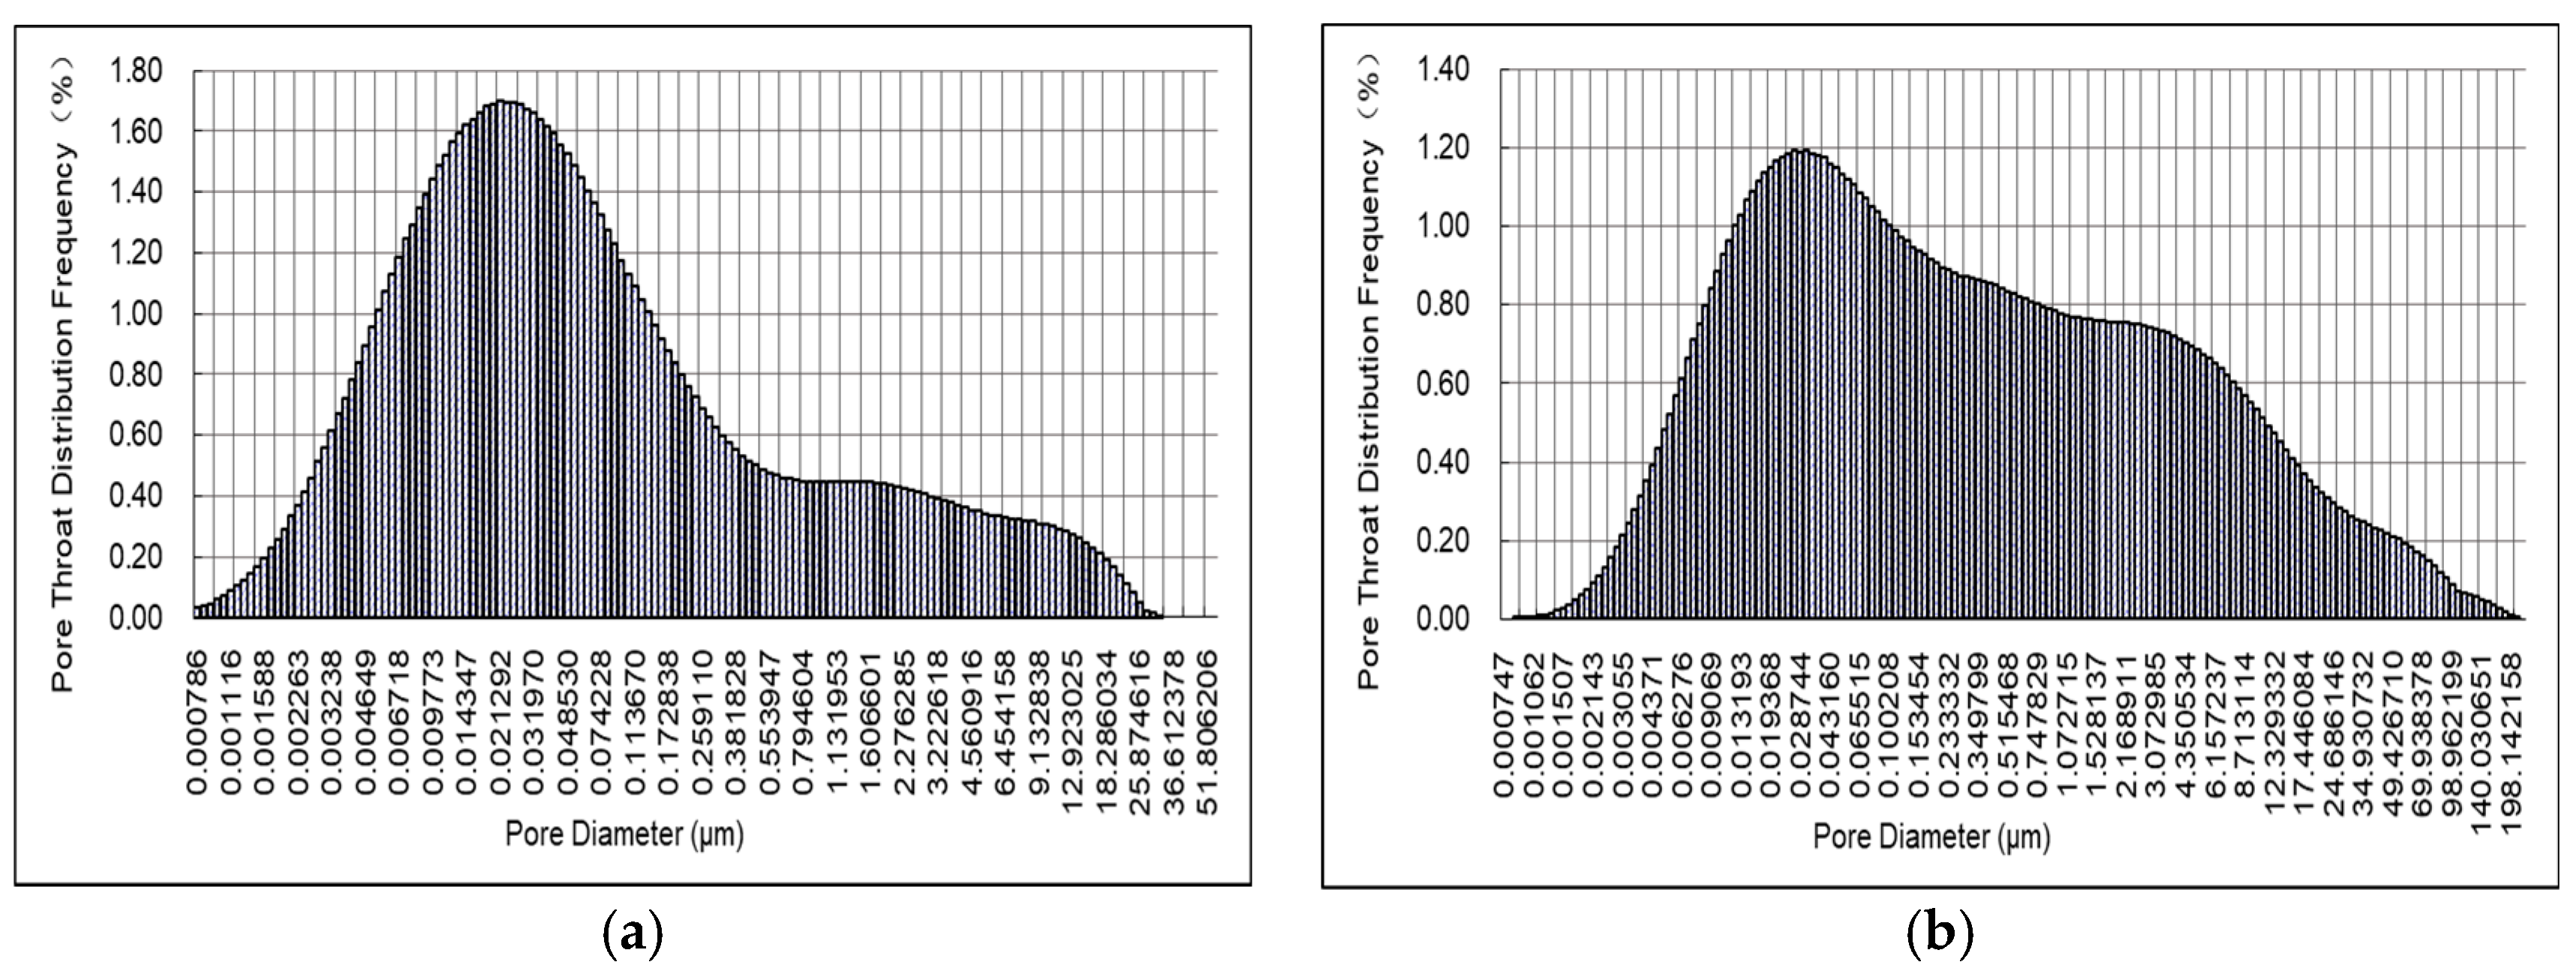
Centrifugal and NMR tests were carried out on the plunger cores from six wells in a tight sandstone gas reservoir to obtain pore size distribution maps before and after fracture, of which five wells were analyzed primarily (
Figure 3,
Figure 4,
Figure 5,
Figure 6 and
Figure 7).
According to the basic shape of the pore size distribution before and after fracture, it is found that the pore size distribution of the core before fracture is mainly unimodal and bimodal, and the main peak is concentrated on the left side, while the side peaks are not obvious. This feature indicates that the overall pore size before fracture is very small, with more than half of the pore size less than 20 nm, which makes the pore type complex, resulting in poor connectivity between large and small pores and high capillary resistance. Therefore, during the displacement process, it mainly shows the fluid output in the large pore space and the difficulty of fluid flow in the small pore space, resulting in poor gas-driving effect and serious water-blocking phenomenon. After a fracture, it is observed that both the primary and secondary peaks showed a tendency to move to the right, and the secondary peaks became larger. It means that the proportions of the large pore size become larger after fracture, and the proportions of small pore size become smaller, while the ratio of pore sizes less than 20 nm is only about one-third. The pore size distribution becomes wider, and the connectivity between large and small pores is well improved, which weakens the nonhomogeneity of the reservoir. During the displacement process, as the capillary resistance of the fluid decreases, more water in the pore space is displaced by the gas, and the residual water saturation decreases, which ultimately improves the water-blocking phenomenon effectively.
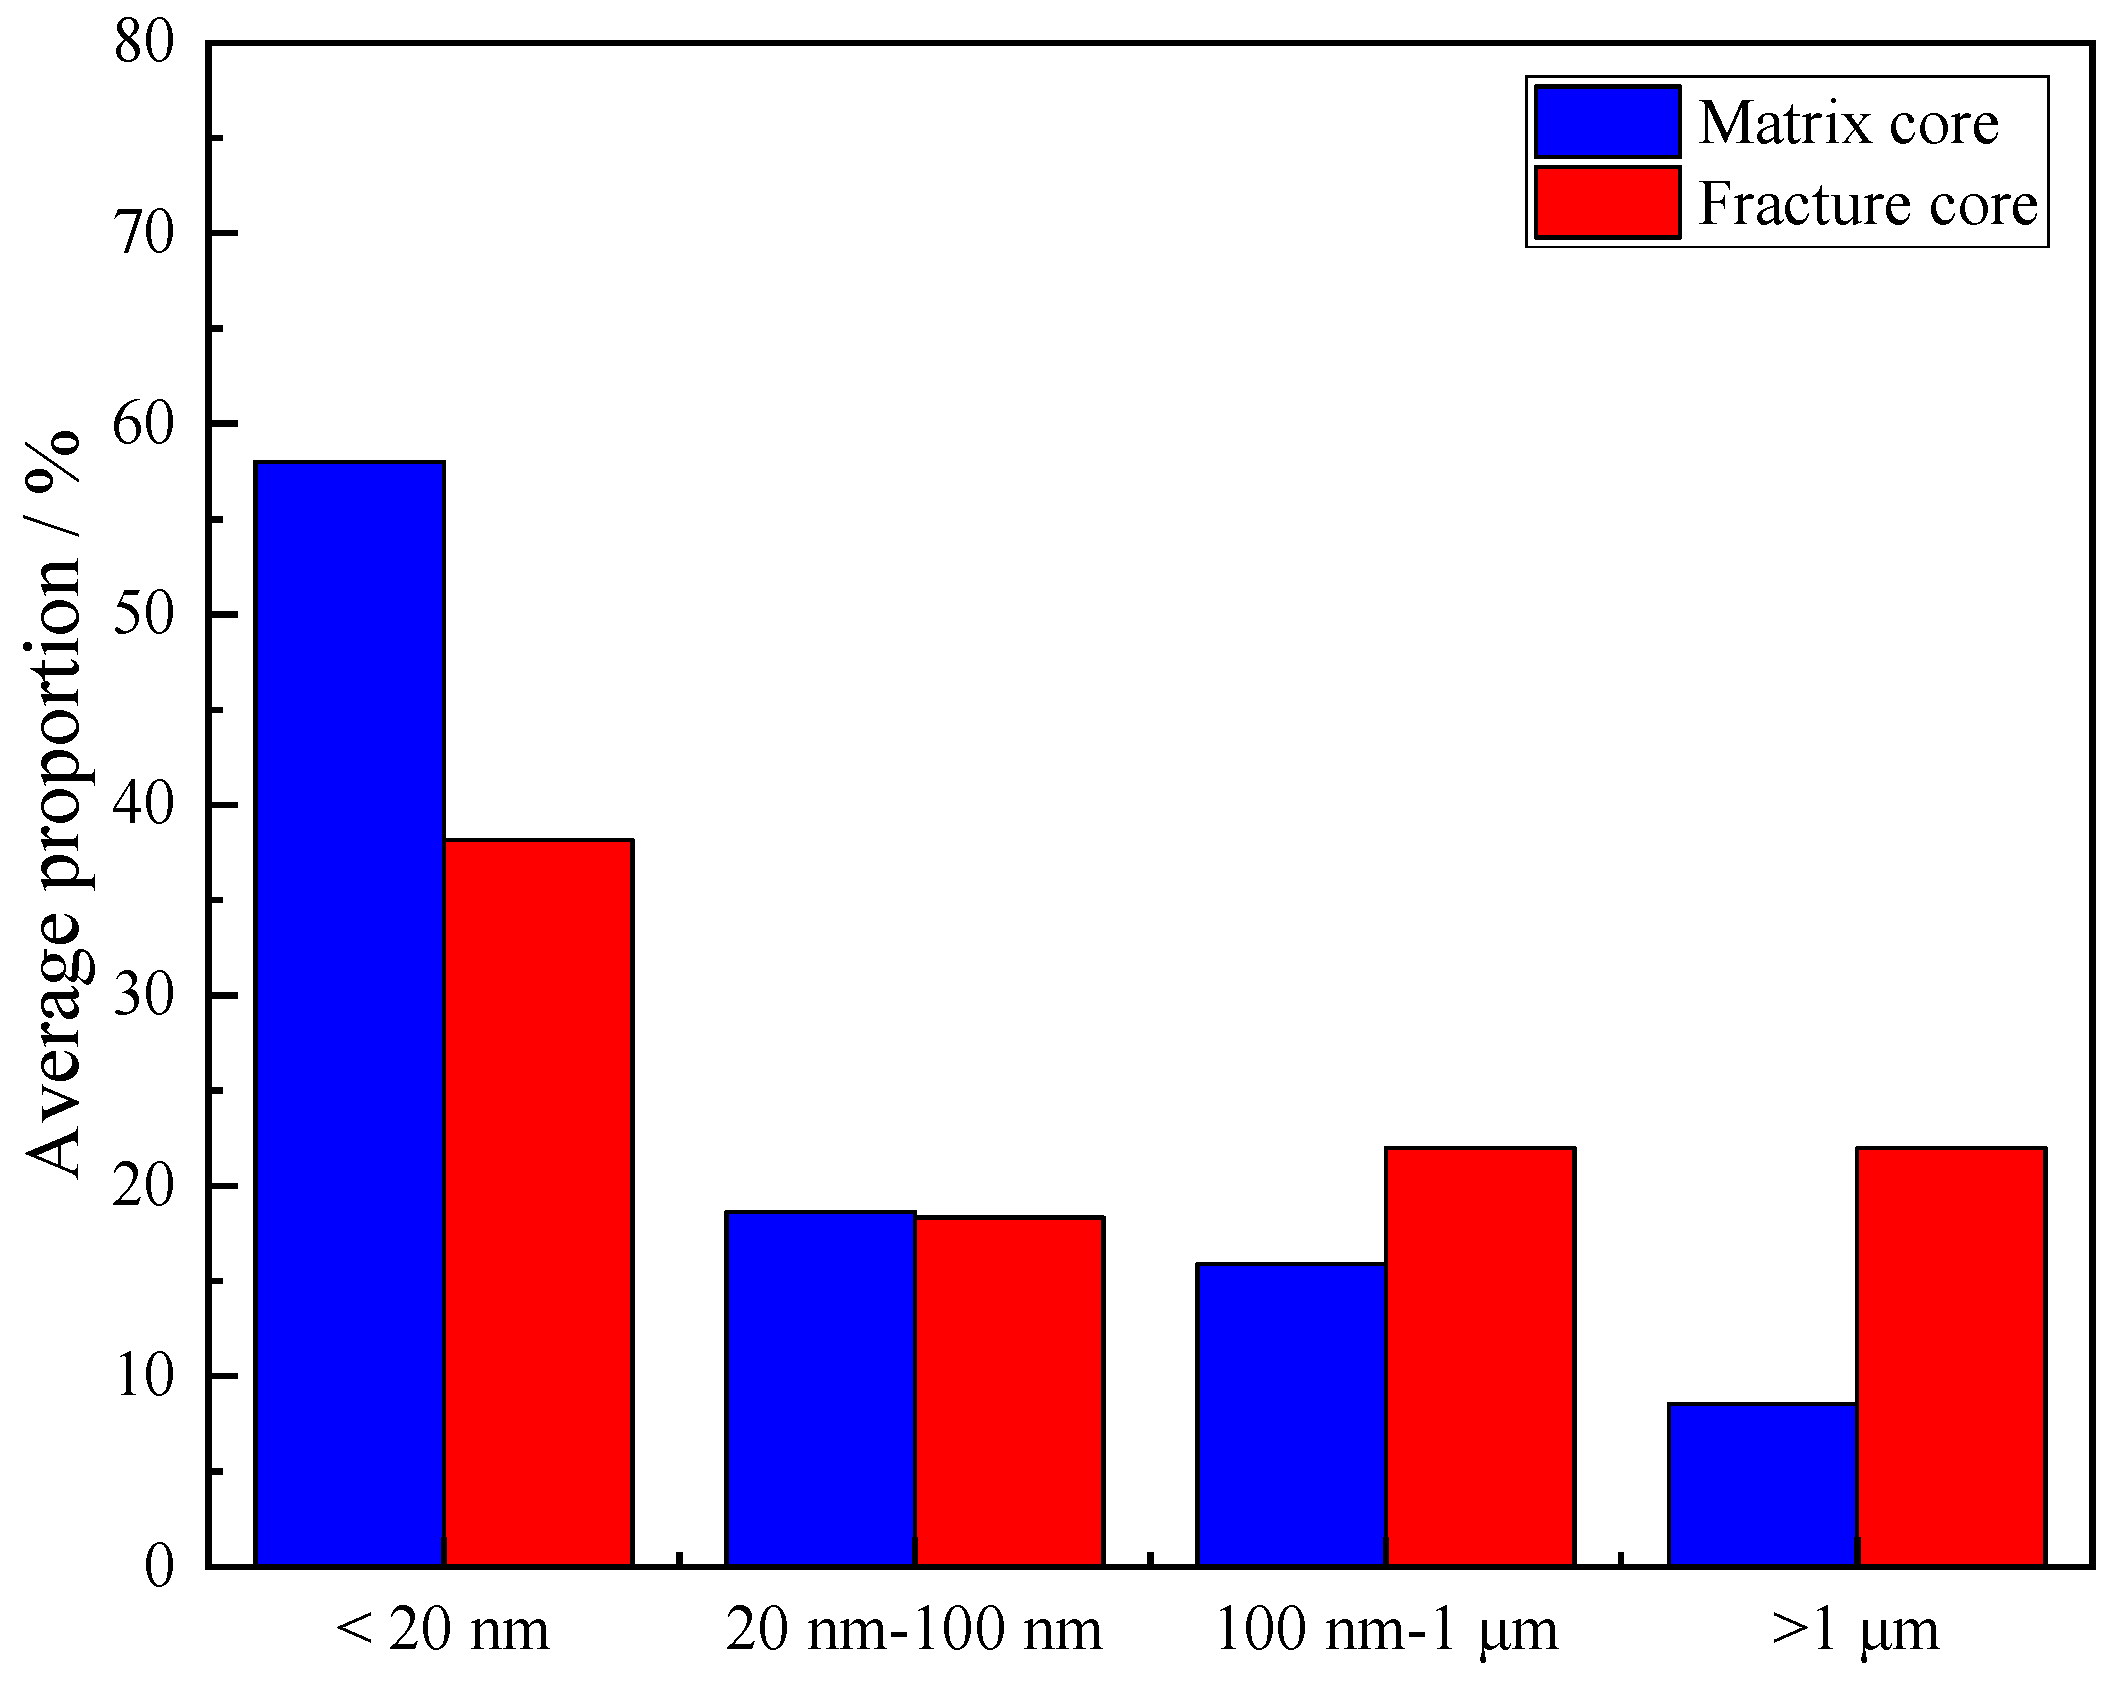
Comparing the average values of pore size distribution before and after fracture (
Figure 8), it is found that the center of the core pore size distribution has shifted towards large sizes. From the overall view of the five samples, it is found that the ratio of pore throat of less than 20 nm decreased by 19.82%, the ratio of 20 nm–100 nm decreased by 0.25%, the ratio of 100 nm–1 μm increased by 6.63%, and the ratio of greater than 1 μm increased by 13.44% after the fracture. Fractures widen the pore size distribution, thereby improving fluid flow channels and converting bound water in small pores into moveable water. By reducing the capillary resistance, the bound water in the small pore space is displaced out, making the residual water saturation reduced and mitigating the water-blocking effect.
3.4. Effect of Fracture Morphology on Water Blocking after Fracture
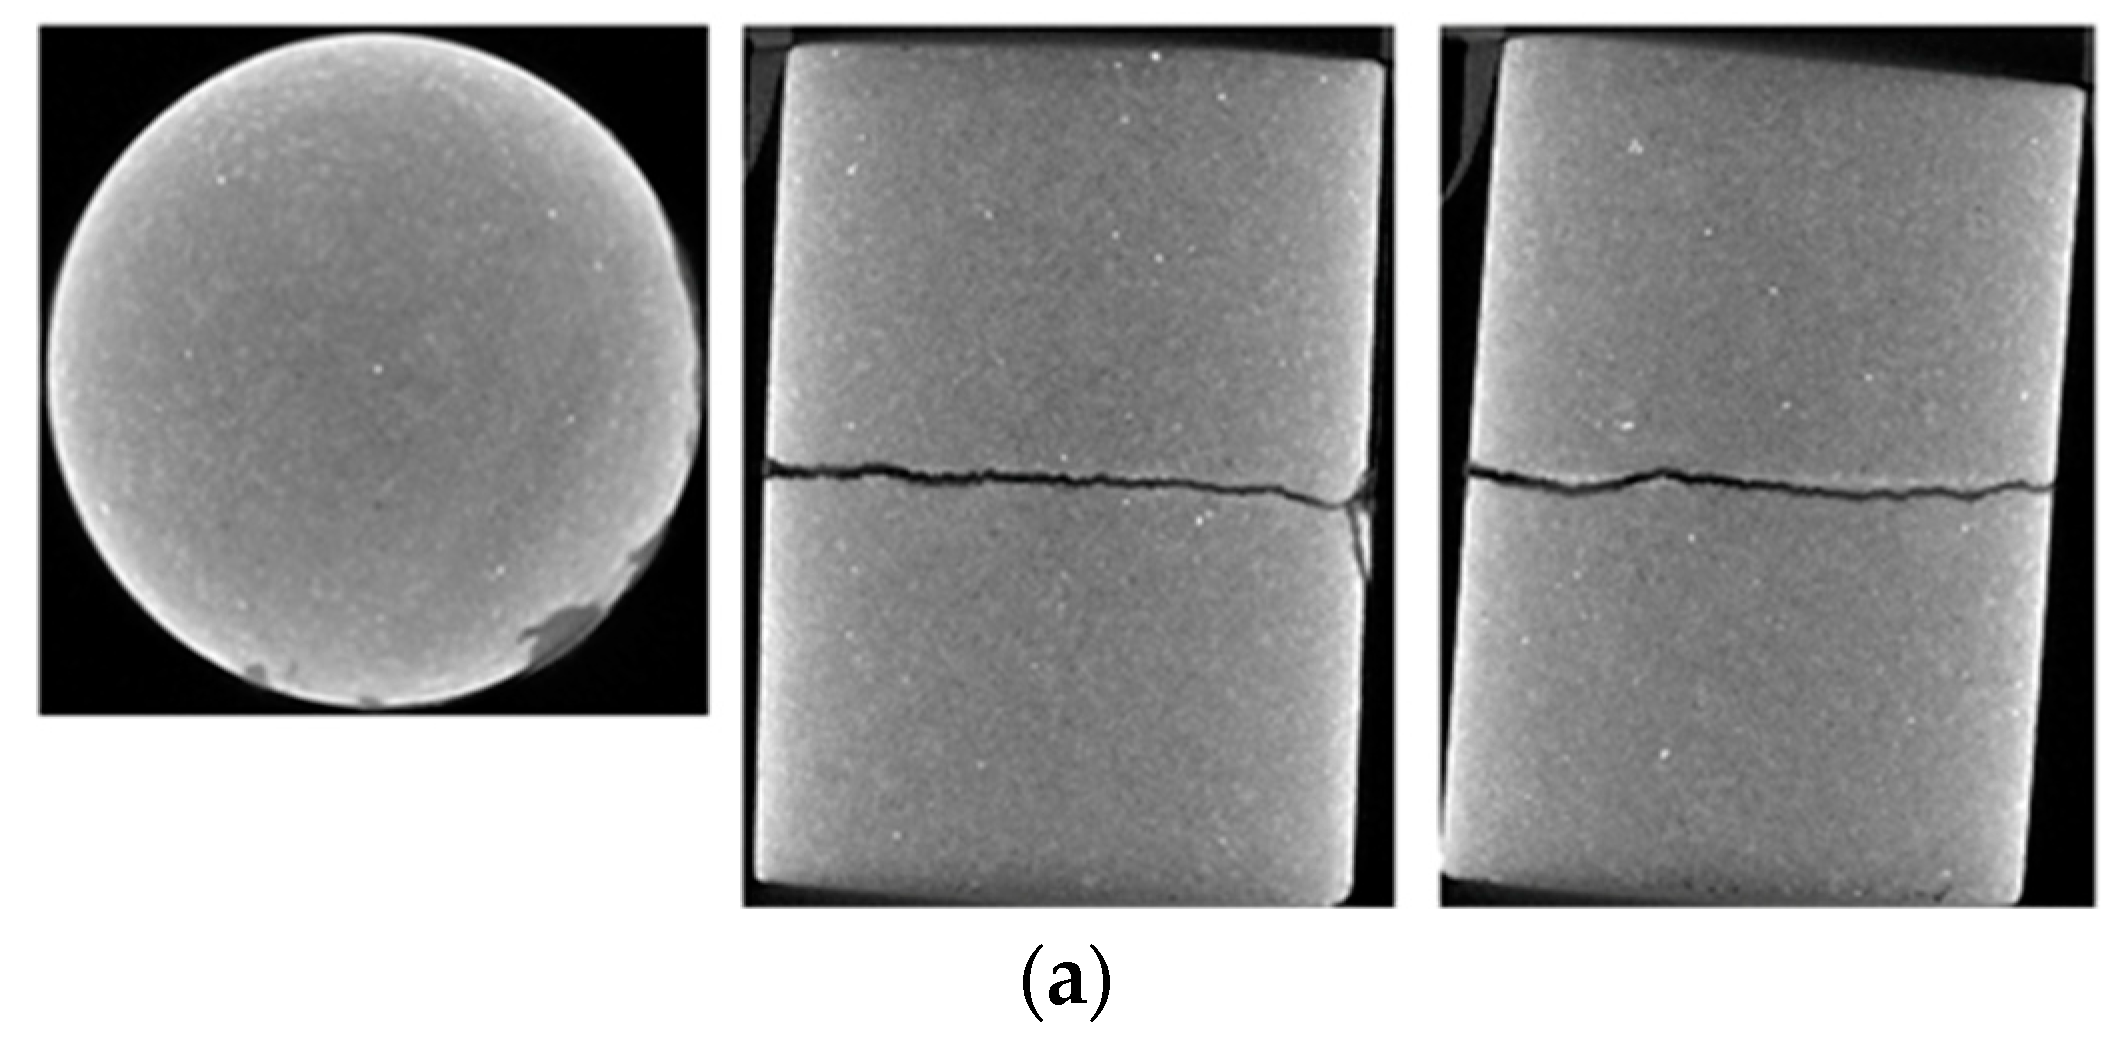
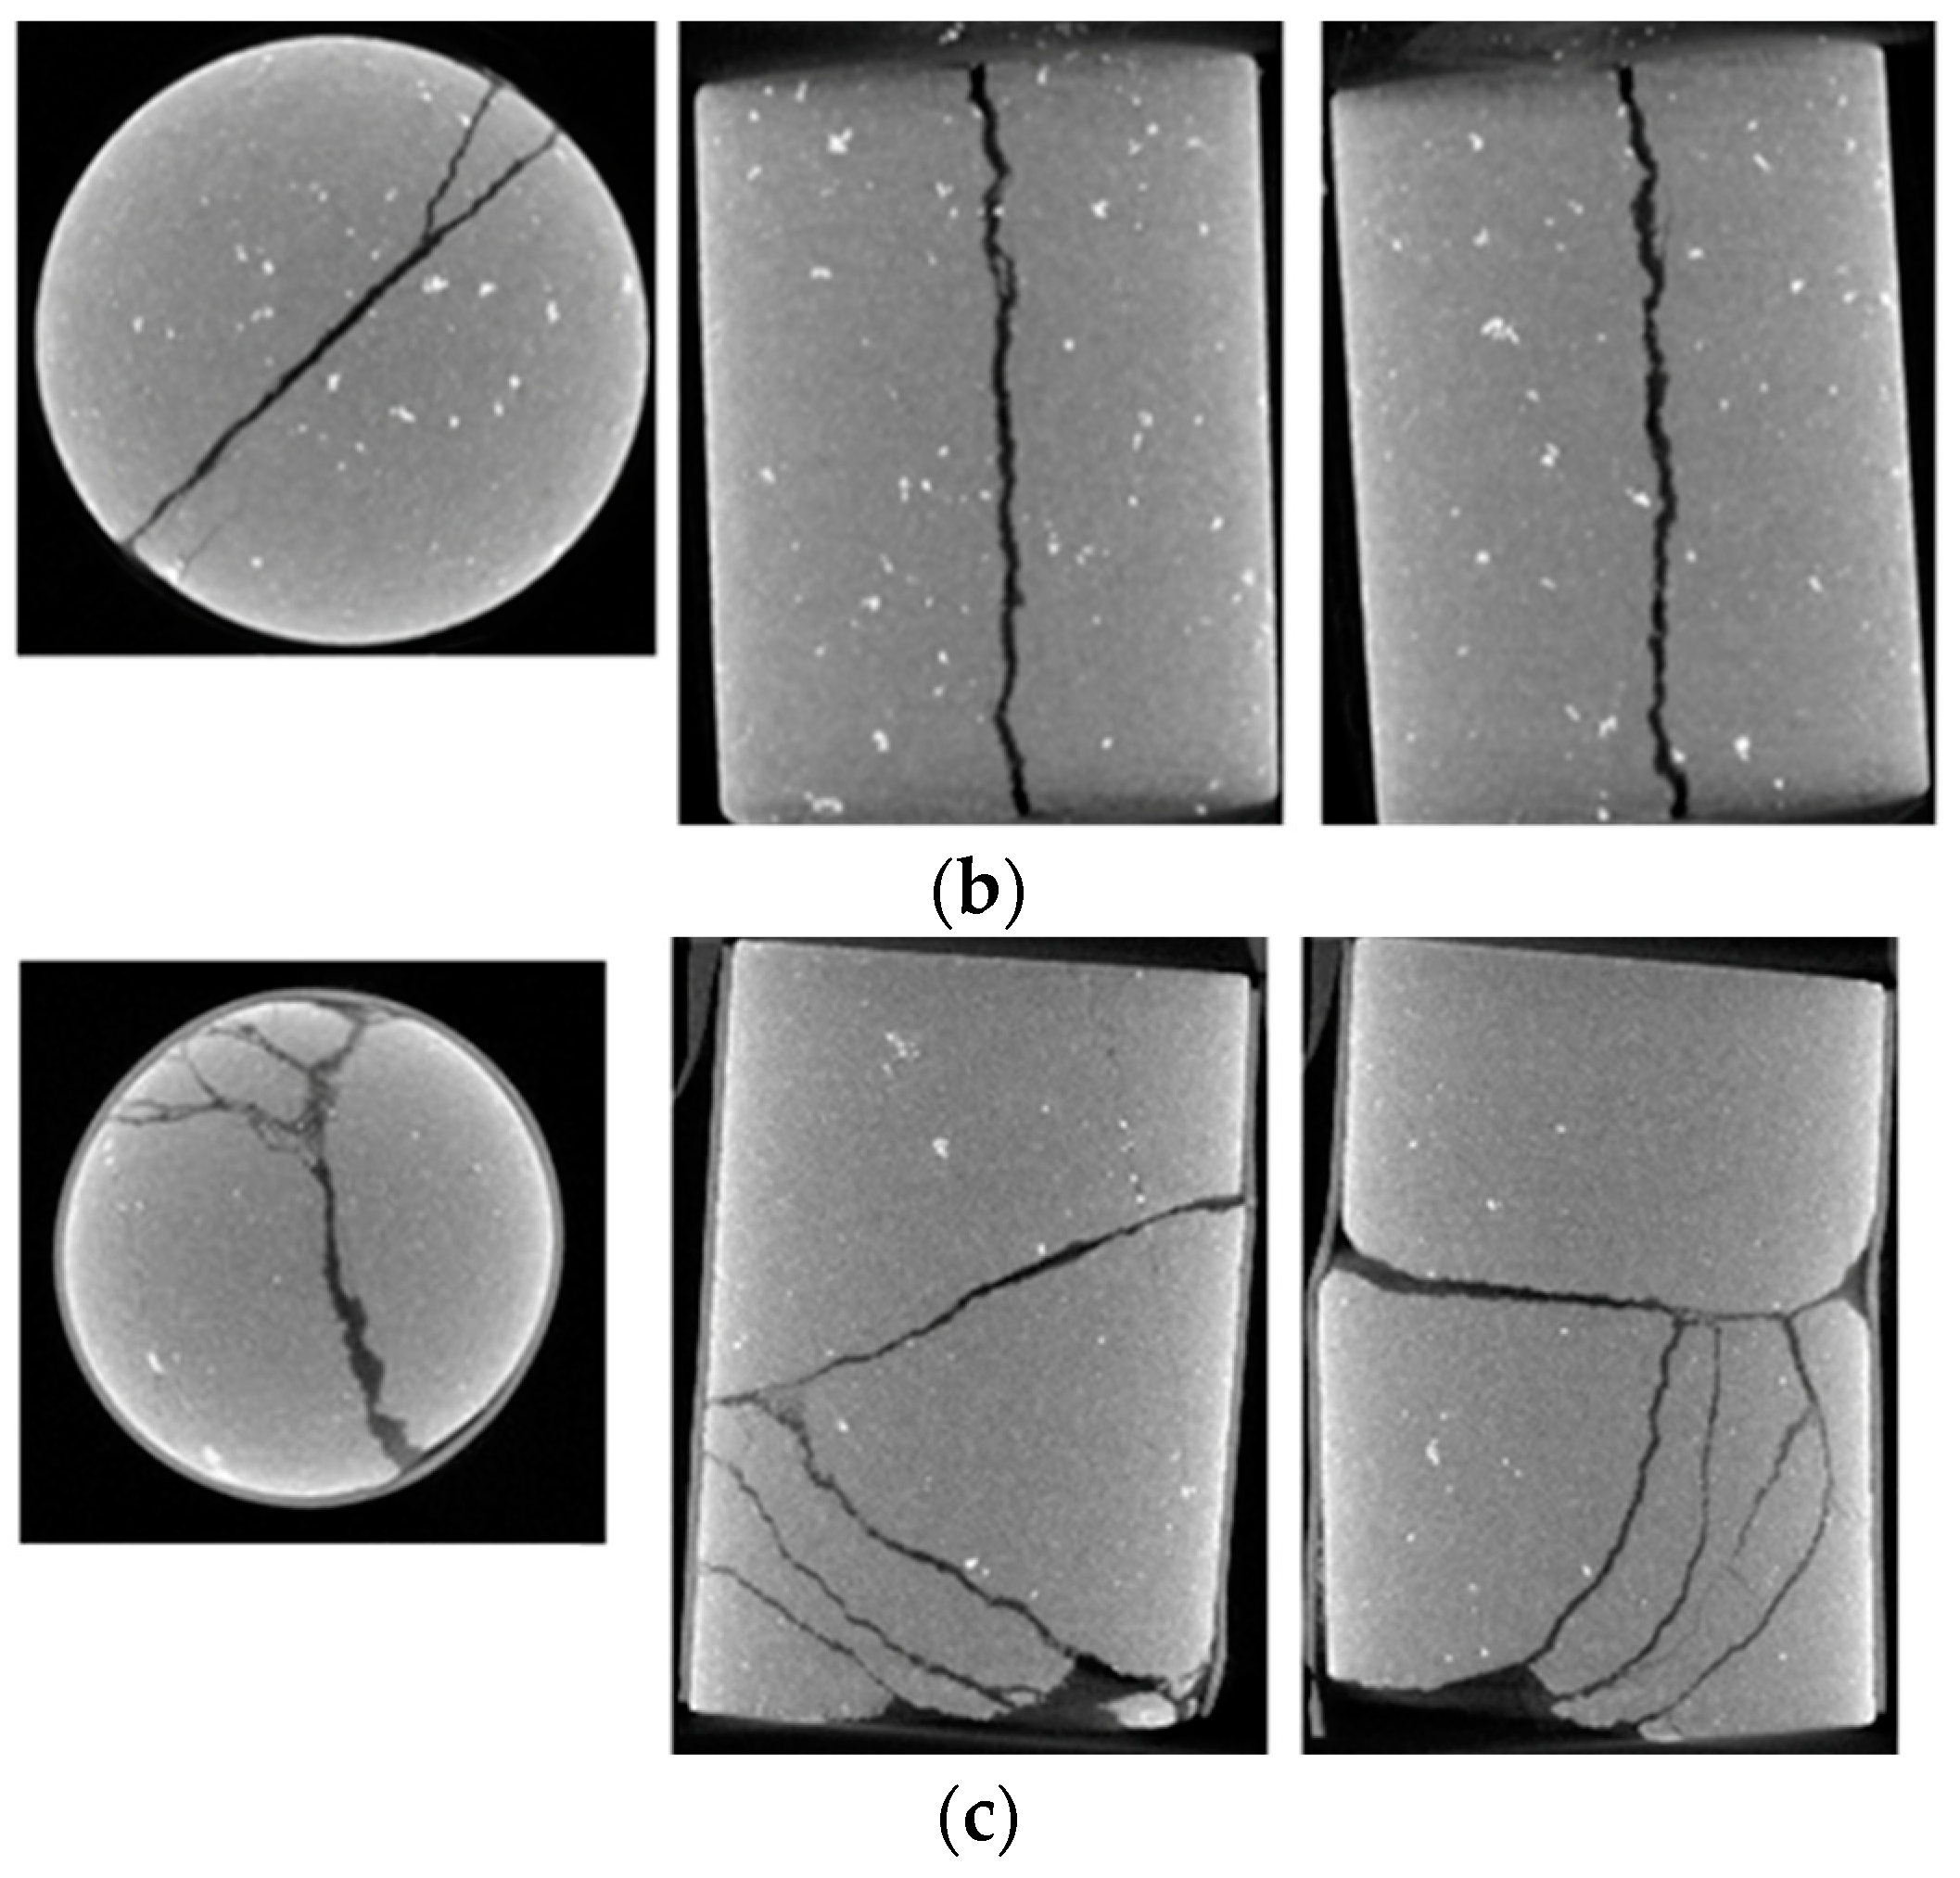
Fractures that can penetrate through the sandstone level are called penetrating fractures [
15]. Based on the relationship between the direction of the wellbore and the direction of the minimum horizontal principal stress, the fracture morphology can be divided into three types: lateral penetrating fracture, high-angle penetrating fracture, and complex fracture networks [
16]. Among them, the lateral penetrating fracture produces a fracture surface parallel to the ground, the high-angle penetrating fracture produces a fracture surface perpendicular to the ground, and the complex fracture networks produce a fracture surface that is both perpendicular and parallel to the ground.
Observing the fracture morphology diagram after a fracture (
Figure 9) and the relationship between fracture morphology and gas-driving efficiency before and after fracture creation (
Table 4), it is found that the fracture morphology in No. 3 of well XX2-2-3 after fracture morphology is a lateral penetrating fracture. Its fracture porosity only increased by 0.34%, and the gas-driving efficiency was poor, increasing by only 28.10%. The fracture morphology of No. 64 in Well XX1003 is a high-angle penetrating fracture. Although the fracture porosity only increased by 1.85% after fracture, its gas-driving efficiency increased by 97.87%, which significantly relieves the water-blocking damage. The fracture morphology of No. 21 in Well XX1103 is a complex fracture network. The fracture has increased its fracture porosity by 1.99%, significantly improved the gas-driving efficiency by 95.86%, and reduced the water-blocking effect.
In comparison, high-angle penetrating fracture and complex fracture networks are found to be more effective for enhancing gas and water displacement. This is because these two types of fractures have a large number of longitudinal fractures near the end of the production layer and a larger width of the fracture body, which effectively communicates the seepage channel. This increases the seepage area of the gas well while reducing the capillary resistance of the gas in the fracture, which ultimately helps to reduce the water-blocking effect. However, lateral penetrating fracture produces fractures parallel to the ground, and the width of the fracture body is small, which cannot effectively communicate the gas seepage channel. Therefore, the lateral penetrating fracture is less effective in enhancing the efficiency of gas-driving water and cannot effectively relieve the water-blocking damage.
3.5. Effect of Fracture Making on Water Blocking of Edge and Bottom
Tight sandstone gas reservoirs are characterized by fracture development and edge–bottom water. In the process of gas reservoir development, the edge–bottom water first bursts rapidly along the fracture and advances in a piston-like manner in the matrix. The occurrence of capillary fingering and snap-off causes reservoir water-blocking damage. Then, the production pressure difference makes the bottom water quickly channel to the local gas well along the fracture. The higher the production pressure difference, the faster the water runs. As a result, many gas wells produce water within a short period of time [
17,
18,
19,
20,
21].
After fracture formation, centrifugal and NMR experiments show that the fracture morphology is characterized by high-angle penetrating fracture and complex fracture networks. Through the connected pores, the fracture network structure is formed. This not only increases the effective seepage channels but also reduces the capillary force. At the same time, the porosity of small pores and the proportion of large pore sizes are increased. Therefore, the bound water of small pore size is converted into movable water, and the proportion of movable water is increased. With the significant increase in matrix permeability, the ability to supply gas to the fractures is greatly enhanced, further improving the heterogeneity of the gas reservoir. As the displacement pressure increases, the bound water in the small pore space is displaced out by the gas, and the saturation of bound water is decreased accordingly. This can effectively improve the water-blocking damage. At this time, the edge and bottom water advance uniformly in the matrix. When the fracture is connected to the water body, the water body is more uniformly protruding along the fracture during the mining process. The advance speed of the water invasion front is slowed, and the time to water appearance is delayed, which significantly improves gas reservoir recovery.


