Article

Techno-Economic Analysis of Hybrid Renewable Energy Systems Designed for Electric Vehicle Charging: A Case Study from the United Arab Emirates

by
Alya AlHammadi
1,
Nasser Al-Saif
1,
Ameena Saad Al-Sumaiti
2,*,
Mousa Marzband
3,
Tareefa Alsumaiti
4 and
Ehsan Heydarian-Forushani
5
1
Department of Electrical Engineering and Computer Science, Khalifa University, Abu Dhabi P.O. Box 127788, United Arab Emirates
2
Advanced Power and Energy Center, Department of Electrical Engineering and Computer Science, Khalifa University, Abu Dhabi P.O. Box 127788, United Arab Emirates
3
Mathematics, Physics and Electrical Engineering Department, Northumbria New-Castle University, Newcastle Upon Tyne NE1 8ST, UK
4
Geography and Urban Sustainability Department, United Arab Emirates University, Alain P.O. Box 15551, United Arab Emirates
5
Department of Electrical and Computer Engineering, Qom University of Technology, Qom 1519-37195, Iran
*
Author to whom correspondence should be addressed.
Energies 2022, 15(18), 6621; https://doi.org/10.3390/en15186621
Submission received: 26 July 2022 / Revised: 4 September 2022 / Accepted: 6 September 2022 / Published: 10 September 2022
(This article belongs to the Special Issue Design, Planning and Evaluation of Flexible Power Systems)

Abstract

:
The United Arab Emirates is moving towards the use of renewable energy for many reasons, including the country’s high energy consumption, unstable oil prices, and increasing carbon dioxide emissions. The usage of electric vehicles can improve public health and reduce emissions that contribute to climate change. Thus, the usage of renewable energy resources to meet the demands of electric vehicles is the major challenge influencing the development of an optimal smart system that can satisfy energy requirements, enhance sustainability and reduce negative environmental impacts. The objective of this study was to examine different configurations of hybrid renewable energy systems for electric vehicle charging in Abu Dhabi city, UAE. A comprehensive study was conducted to investigate previous electric vehicle charging approaches and formulate the problem accordingly. Subsequently, methods for acquiring data with respect to the energy input and load profiles were determined, and a techno-economic analysis was performed using Hybrid Optimization of Multiple Energy Resources (HOMER) software. The results demonstrated that the optimal electric vehicle charging model comprising solar photovoltaics, wind turbines, batteries and a distribution grid was superior to the other studied configurations from the technical, economic and environmental perspectives. An optimal model could produce excess electricity of 22,006 kWh/year with an energy cost of 0.06743 USD/kWh. Furthermore, the proposed battery–grid–solar photovoltaics–wind turbine system had the highest renewable penetration and thus reduced carbon dioxide emissions by 384 tons/year. The results also indicated that the carbon credits associated with this system could result in savings of 8786.8 USD/year. This study provides new guidelines and identifies the best indicators for electric vehicle charging systems that will positively influence the trend in carbon dioxide emissions and achieve sustainable electricity generation. This study also provides a valid financial assessment for investors looking to encourage the use of renewable energy.

1. Introduction

The United Arab Emirates (UAE) is one of the most rapidly developing countries in the gulf region. Its capital city of Abu Dhabi accounts for 90% of the country’s oil and natural gas consumption [1,2]. Since the end of the 20th century, the increase in carbon dioxide (CO2) emissions, oil-price instability, and oil embargos have led the government to seek cleaner and more sustainable resources and technologies to meet the economic-growth demands of the country. According to the Abu Dhabi Statistics Centre, the electricity demand of Abu Dhabi increased from 58,735,825 MWH in 2015 to 62,681,608 MWH in 2019 [3]. Furthermore, the total emissions of air pollutants by the water and electricity sectors exceeded 10,000 tons over the past five years [4].
Therefore, the UAE formulated a visionary plan to meet 7% of energy requirements using renewable energy sources (RESs) by 2020. This target was the driving factor for promising projects, such as the Masdar initiative, Noor 1 and Shams 1, all of which employed RESs such as solar photovoltaics (PVs), wind and solar power [5]. The Masdar initiative was considered a remarkable economic development program that aimed to improve Abu Dhabi in terms of its financial resources and energy diversification by developing innovative solutions for obtaining cleaner energy, apart from oil and gas, and decreasing CO2 emissions. The city of Abu Dhabi depends on PVs to generate electricity up to a capacity of 10 MW [6]. In addition, Abu Dhabi’s annual production of renewable energy reached 2,163,799 MWH in 2019 [3]. In line with the implementation of serious steps to reduce pollution and increase sustainability, the usage of electric vehicles (EVs) has considerably evolved in the UAE. Researchers are playing an integral part in this evolution by utilizing clean technology for EV charging. The Dubai Autonomous Transportation Strategy 2030 is an excellent example of how the UAE is planning to be more ecofriendly as it aims to transfer 25% of the total transport in Dubai to autonomous means by 2030. This strategy will save 1.5 billion AED by reducing environmental pollution by 12% [7].
In this paper we present a techno-economic assessment of a hybrid renewable energy system designed for charging EVs in the United Arab Emirates. The paper is structured as follows. Section 2 provides a literature review relevant to the investigated topic. Section 3 highlights the contributions of this work. Section 4 describes the methodology applied to the case study. Section 5 presents the simulation results, focusing on the technical analysis, economic analysis, emission analysis and sensitivity analysis. Section 6 concludes the paper and provides policy implications.

2. Literature Review

Various approaches and studies, conducted throughout the world to employ renewable energy systems for EV charging, are introduced in this section. Then, the problem statement and objectives of this study are presented. Several countries have investigated the installation of renewable energy systems to supply energy to EV charging stations [8,9,10,11,12,13,14,15,16,17,18,19,20,21,22,23,24,25,26]. A summary of such studies is presented below.
The authors of a previous study [8] conducted in Egypt proposed an energy management system (EMS) to control the power flow from RESs to EVs. The study achieved good results with respect to the electrical performance. Another study [9] evaluated the use of an EV charging system, optimizing the sizing and power flow control of the grid-connected multisource power converter system by conducting a cost–benefit analysis. The performance of the charging system was enhanced, and an optimal output was obtained. Furthermore, the capital requirements decreased considerably. Another study, conducted in China [10], discussed charging EVs and streetlights through a group of smart hybrid poles using renewable energy. Thus, high efficiency and power output could be obtained. Muhammed et al. [11] investigated the optimal sizing of hybrid power for EV charging in Indonesia, specifically in rural areas such as Labuan Bajo. The obtained results provided the optimal configuration of different hybrid systems for charging stations. In addition, an economic analysis was presented, including only the operating cost, net present cost (NPC) and initial capital cost. Some researchers in Japan [12] explored priority charging to control the EV charging stations in park-and-ride areas when using renewable energy and energy storage systems. They implemented their approach via the mixed-integer linear programming (MILP) approach, and the results showed a large reduction in equipment costs. In addition, policymakers play integral roles in increasing the capacity of RESs for EV charging. Furthermore, some guidelines for charging service providers in terms of appropriate charging prices and electricity management had been proposed [13]. The optimal pricing and electricity procurement policies were determined using the stochastic dynamic programming (SDP) algorithm and a greedy algorithm (benchmark algorithm). The obtained results indicated that the SDP algorithm could achieve a profit gain of up to 7%. In another study [14], a pricing methodology was proposed for charging stations located in wealthy areas. This study indicated reduced traffic jams, improved renewable energy consumption and load-balanced traffic flow. In another study [15], the authors attempted to reduce the impact of EV charging in university campuses by considering two configurations with respect to the orientation of the panels and the usage of storage systems based on the effects on the levelized cost of energy (COE). Their results indicated that a system with directional PVs was economically superior to a storage system. Tongpong et al. [16] used the MERIT simulation program to optimize the performance of the renewable energy system supplying energy to the EV charging stations. The outcomes indicated considerable potential in meeting the load demand and the authors provided a brief analysis with respect to the capital cost and surplus energy. One study [17] utilized an integer linear programming (ILP)-based centralized system intended to minimize the charging price per EV. The objective of this study was achieved because faster charging could be achieved at the lowest possible price. The study in [18] on the charging of EVs at office buildings and workplaces used two algorithms to estimate the EV charging demands and annual cost reductions. The results showed that the algorithms were computationally efficient and suitable for real-time operation. In addition, they reduced the cost by 7.2% and 6.9% on average. Lili et al., in [19], presented an EV charging strategy for improving power consumption and reducing charging costs. Based on the optimal results, the charging costs could be reduced by 7.6% and 10.3% in winter and summer, respectively. Xinyi et al. [20] proposed the optimal scheduling of a DC microgrid integrated with RESs for EV charging using NSGA-II software that resulted in reduced electricity purchasing costs and enhanced energy circulation. Another research group, as per [21], proposed a design for home-based EV charging stations relying on PV and wind energy generation. The obtained results demonstrated that the energy requirements of the charging station were satisfied in different operation modes. Murat et al., in [22], presented an EMS for the charging of EVs in industrial areas in Turkey to provide the EV load with optimal cost based on Monte Carlo simulations. Their results indicated that the charging demands of EVs could be met in different time periods. Yaqin et al. [23] presented an optimization model for the charging of EVs that was able to meet changing requirements and minimize electricity costs. Novotny et al. [24] proposed a concept called ALISE, which aimed to encourage the further uptake of EVs and reduce construction costs. Fei et al. conducted a technical review on some approaches for managing the charging demands of EVs [25]. This review indicated the potential of the proposed approaches in minimizing the system’s cost and enhancing the power quality. The effect of the integration of renewable energy with the charging systems of EVs through the Balmorel model was explored previously [26]. Based on that study, the load demands could be met, CO2 emissions could be reduced, and system costs could be minimized. Another study [27] investigated a different aspect by focusing on the use of tariffs for coordinating EV aggregators. In [28], energy management was the focus of the work to optimally coordinate the demand response and EV aggregators. In [29], driving conditions were considered to attain a strategy for managing the energy for EVs. The authors in [30] provided a review for integration the transport and smart grid sectors through looking at the management of EVs. In [31] the authors focused on a power system reschedule approach taking into consideration EVs and renewable energy. On the other hand, [32] considered energy storage in addition to renewable energy and EVs and targeted home energy management rather than the commercial sector. In [33], a techno-economic study was presented for the case of Pakistan. That study focused on the use of HOMER Pro software for the design of a rural energy system including renewable resources without the involvement of EVs. Table 1 provides a summary of the literature and their corresponding results and gaps.

3. Contribution

After reviewing and comparing all similar case studies and evaluating their drawbacks, especially the lack of environmental analyses and considerations of carbon reductions, the main contribution of this study is that it connects supplementary systems, such as batteries and utility grids, with renewable energy sources, such as PVs and wind turbines (WTs), for the charging of EVs. The main contributions of this paper are described as follows.
First, technical details of the hybrid systems installed in a commercial area are examined. Second, this study presents an environmental analysis and a carbon reduction analysis. Third, a detailed economic analysis is presented, and the effect of the carbon reduction on overall savings is investigated. Furthermore, although it is difficult to determine exactly which factor (cost, amount of electricity generation or renewable fraction) is of most importance with respect to the system performance, an attempt has been made in this paper to answer this question via sensitivity analysis.

4. Methodology Applied to the Case Study

The technical, economic and environmental analyses were conducted using HOMER software (Homer Pro Version 3.1.4.5, Boulder, CO, USA). Generally, this software is used to model and design power systems, including those with both on-grid and off-grid connections to primary and renewable energy resources. HOMER is also used to perform optimization modeling, simulations and sensitivity assessments [34]. In this section, a case study is presented along with its input data and the equations considered with respect to the HOMER software.

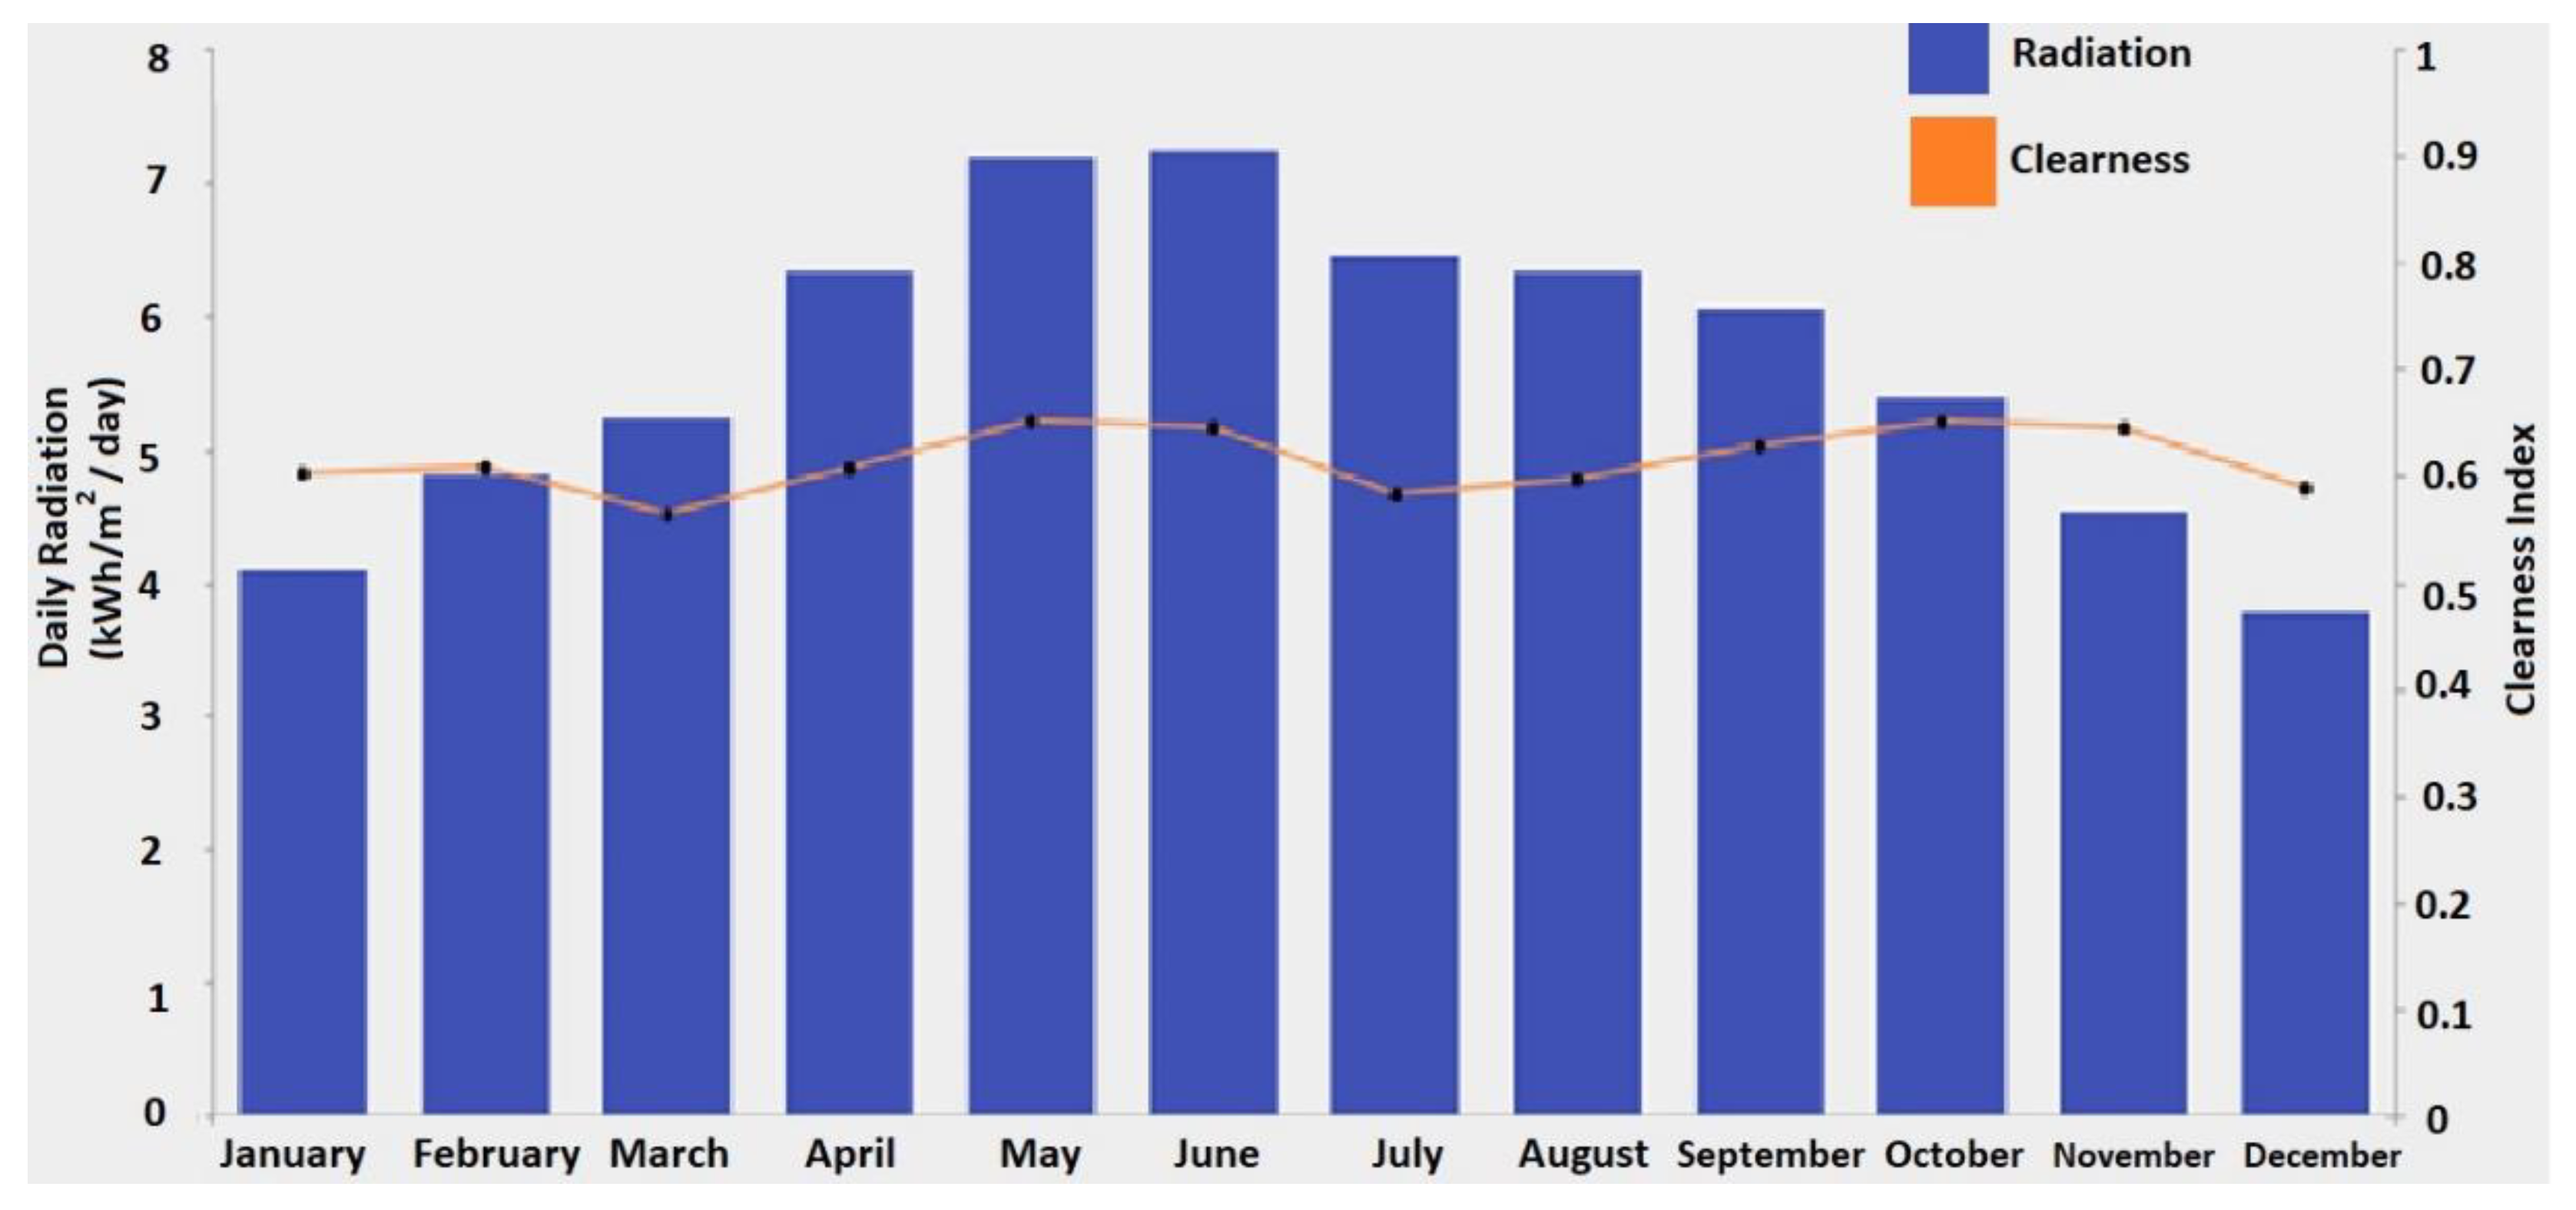
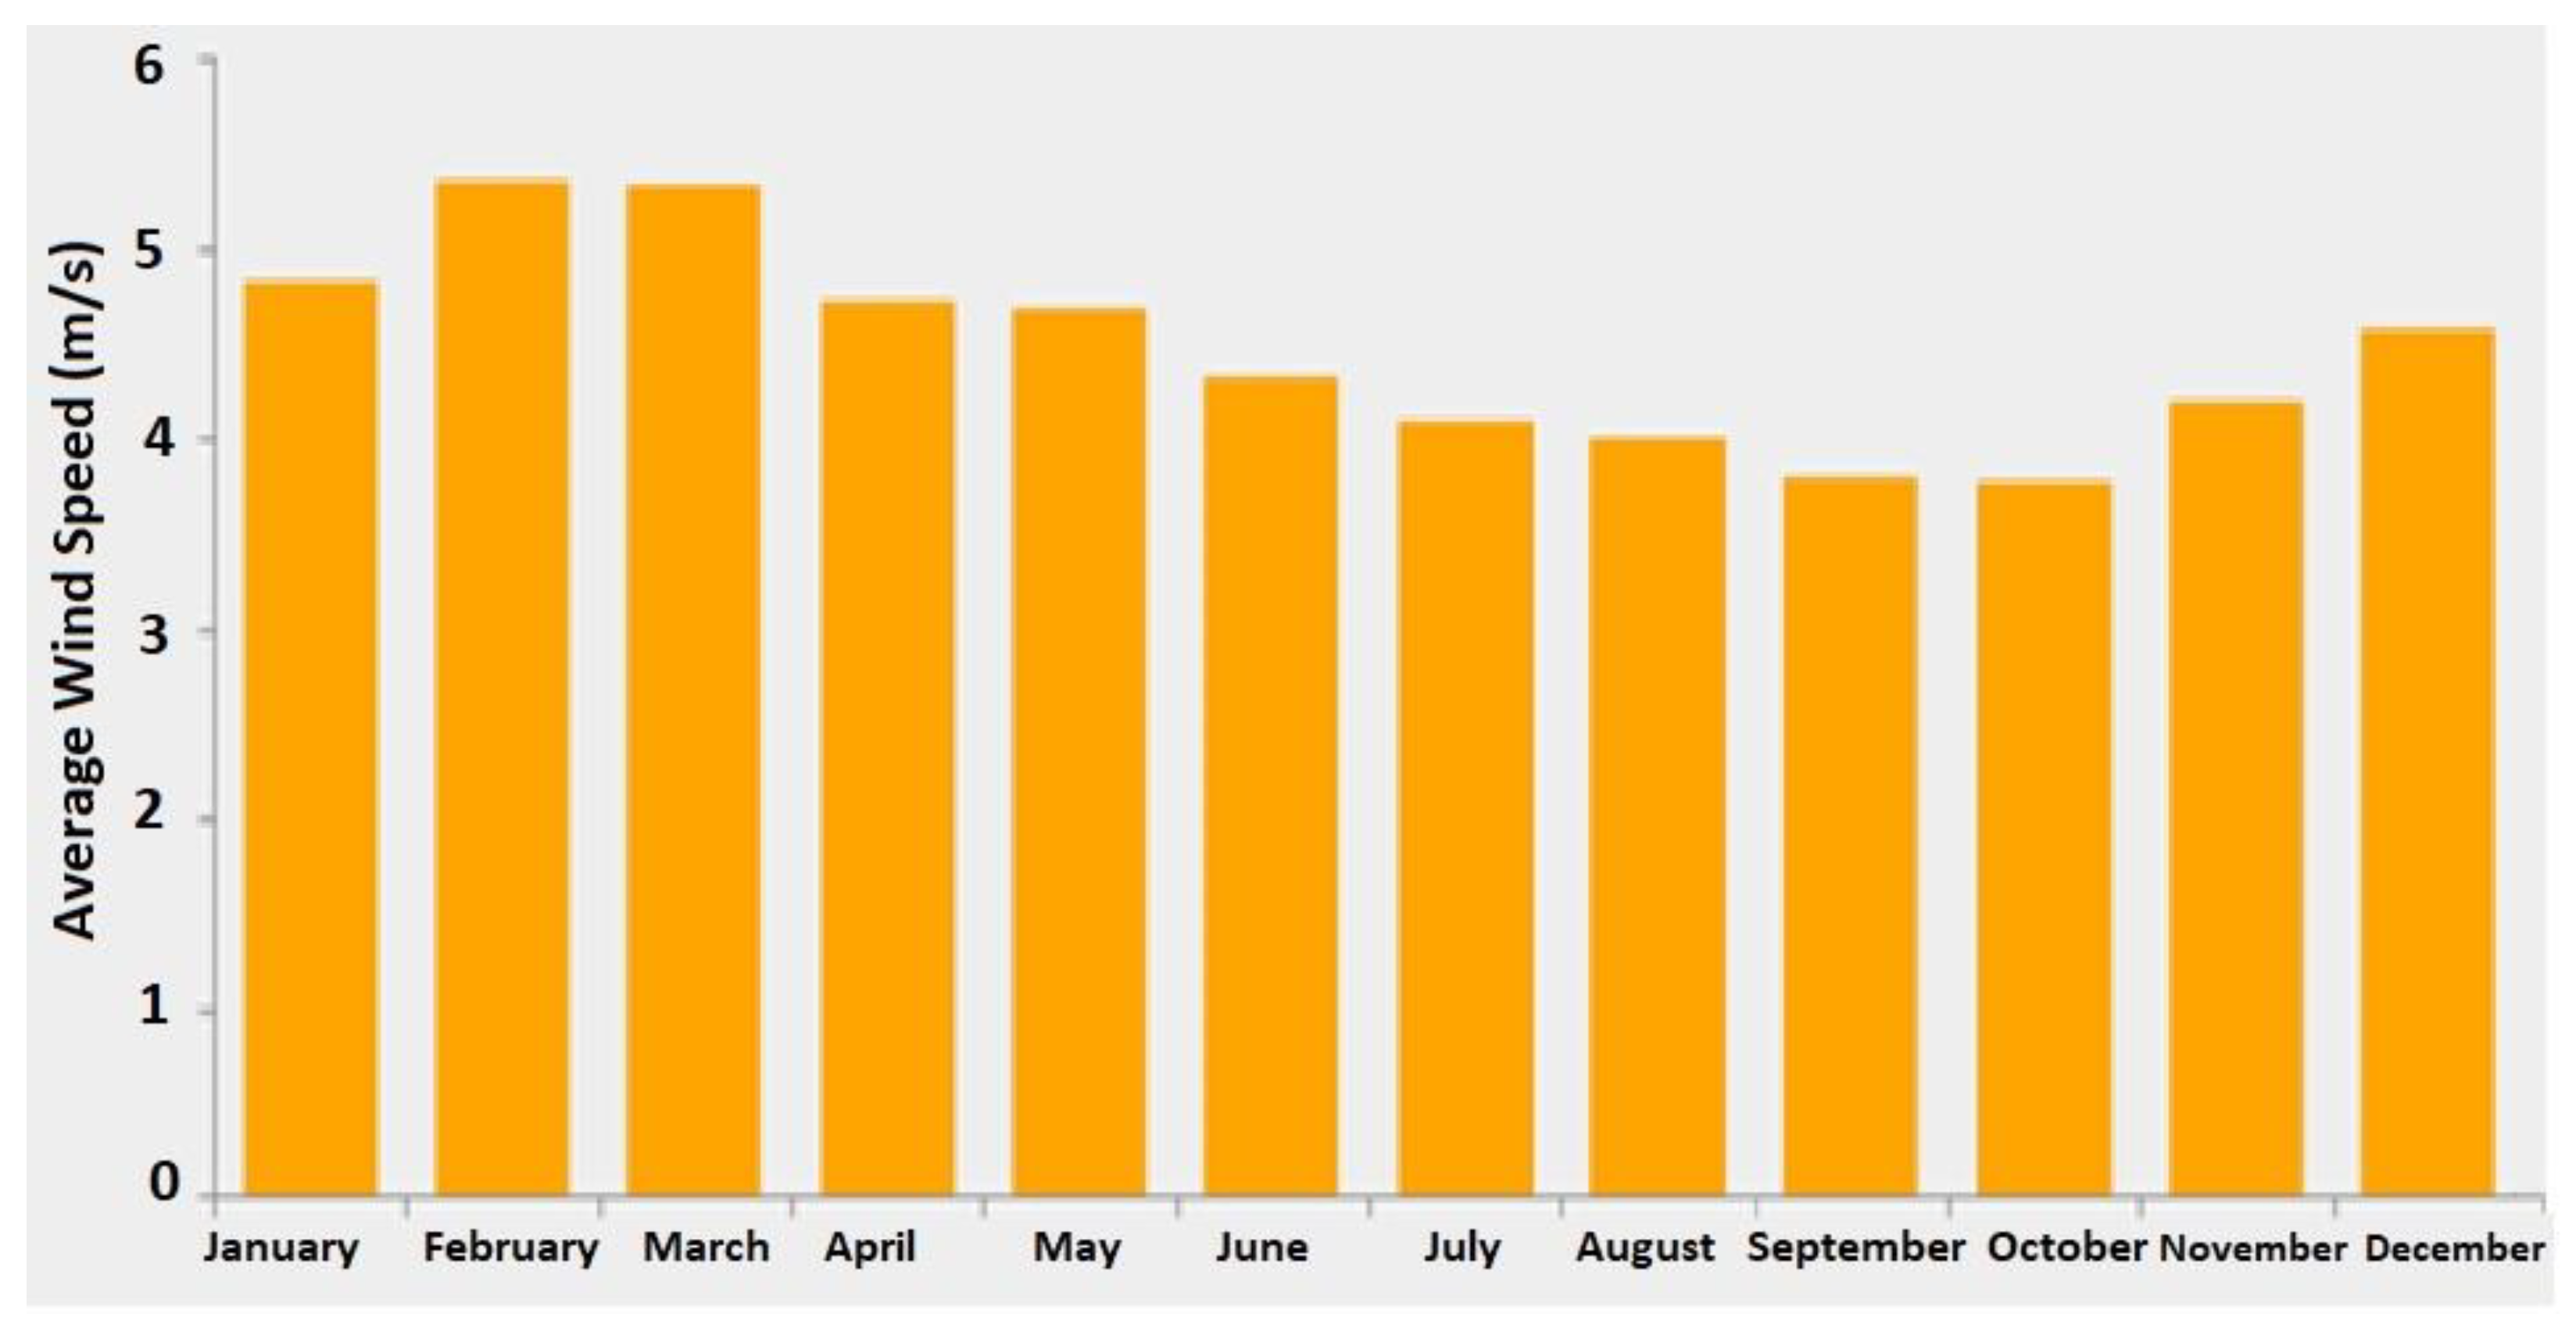
4.1. Case Study and Renewable Energy Resources

In this case study we considered Yas Island (Abu Dhabi, UAE) (See Figure 1) as the point of interest. This location was selected because it is a main hub in the area and has multiple points of interest, such as shopping malls, sports facilities, transportation services and hotels. This island is located at 24°29.8′ N and 54°36.2′ E, with an area of 25 km2. The current population of Abu Dhabi is estimated to be more than 1.48 million [35].
Furthermore, PV represents a high-potential RES for this case study because of the sunny climate of Abu Dhabi. As shown in Figure 2, the highest daily solar radiation occurred in June (7.23 kWh/m2/day), whereas the lowest daily radiation occurred in December (3.78 kWh/m2/day). The wind speed data were also considered in this study.
As shown in Figure 3, the highest wind speed was recorded in February (5.34 m/s), whereas the lowest wind speed was recorded in October (3.77 m/s). The data for solar radiation and wind speed were collected from NASA Surface Meteorology and Solar Energy using HOMER to determine the output of PVs and wind turbines.

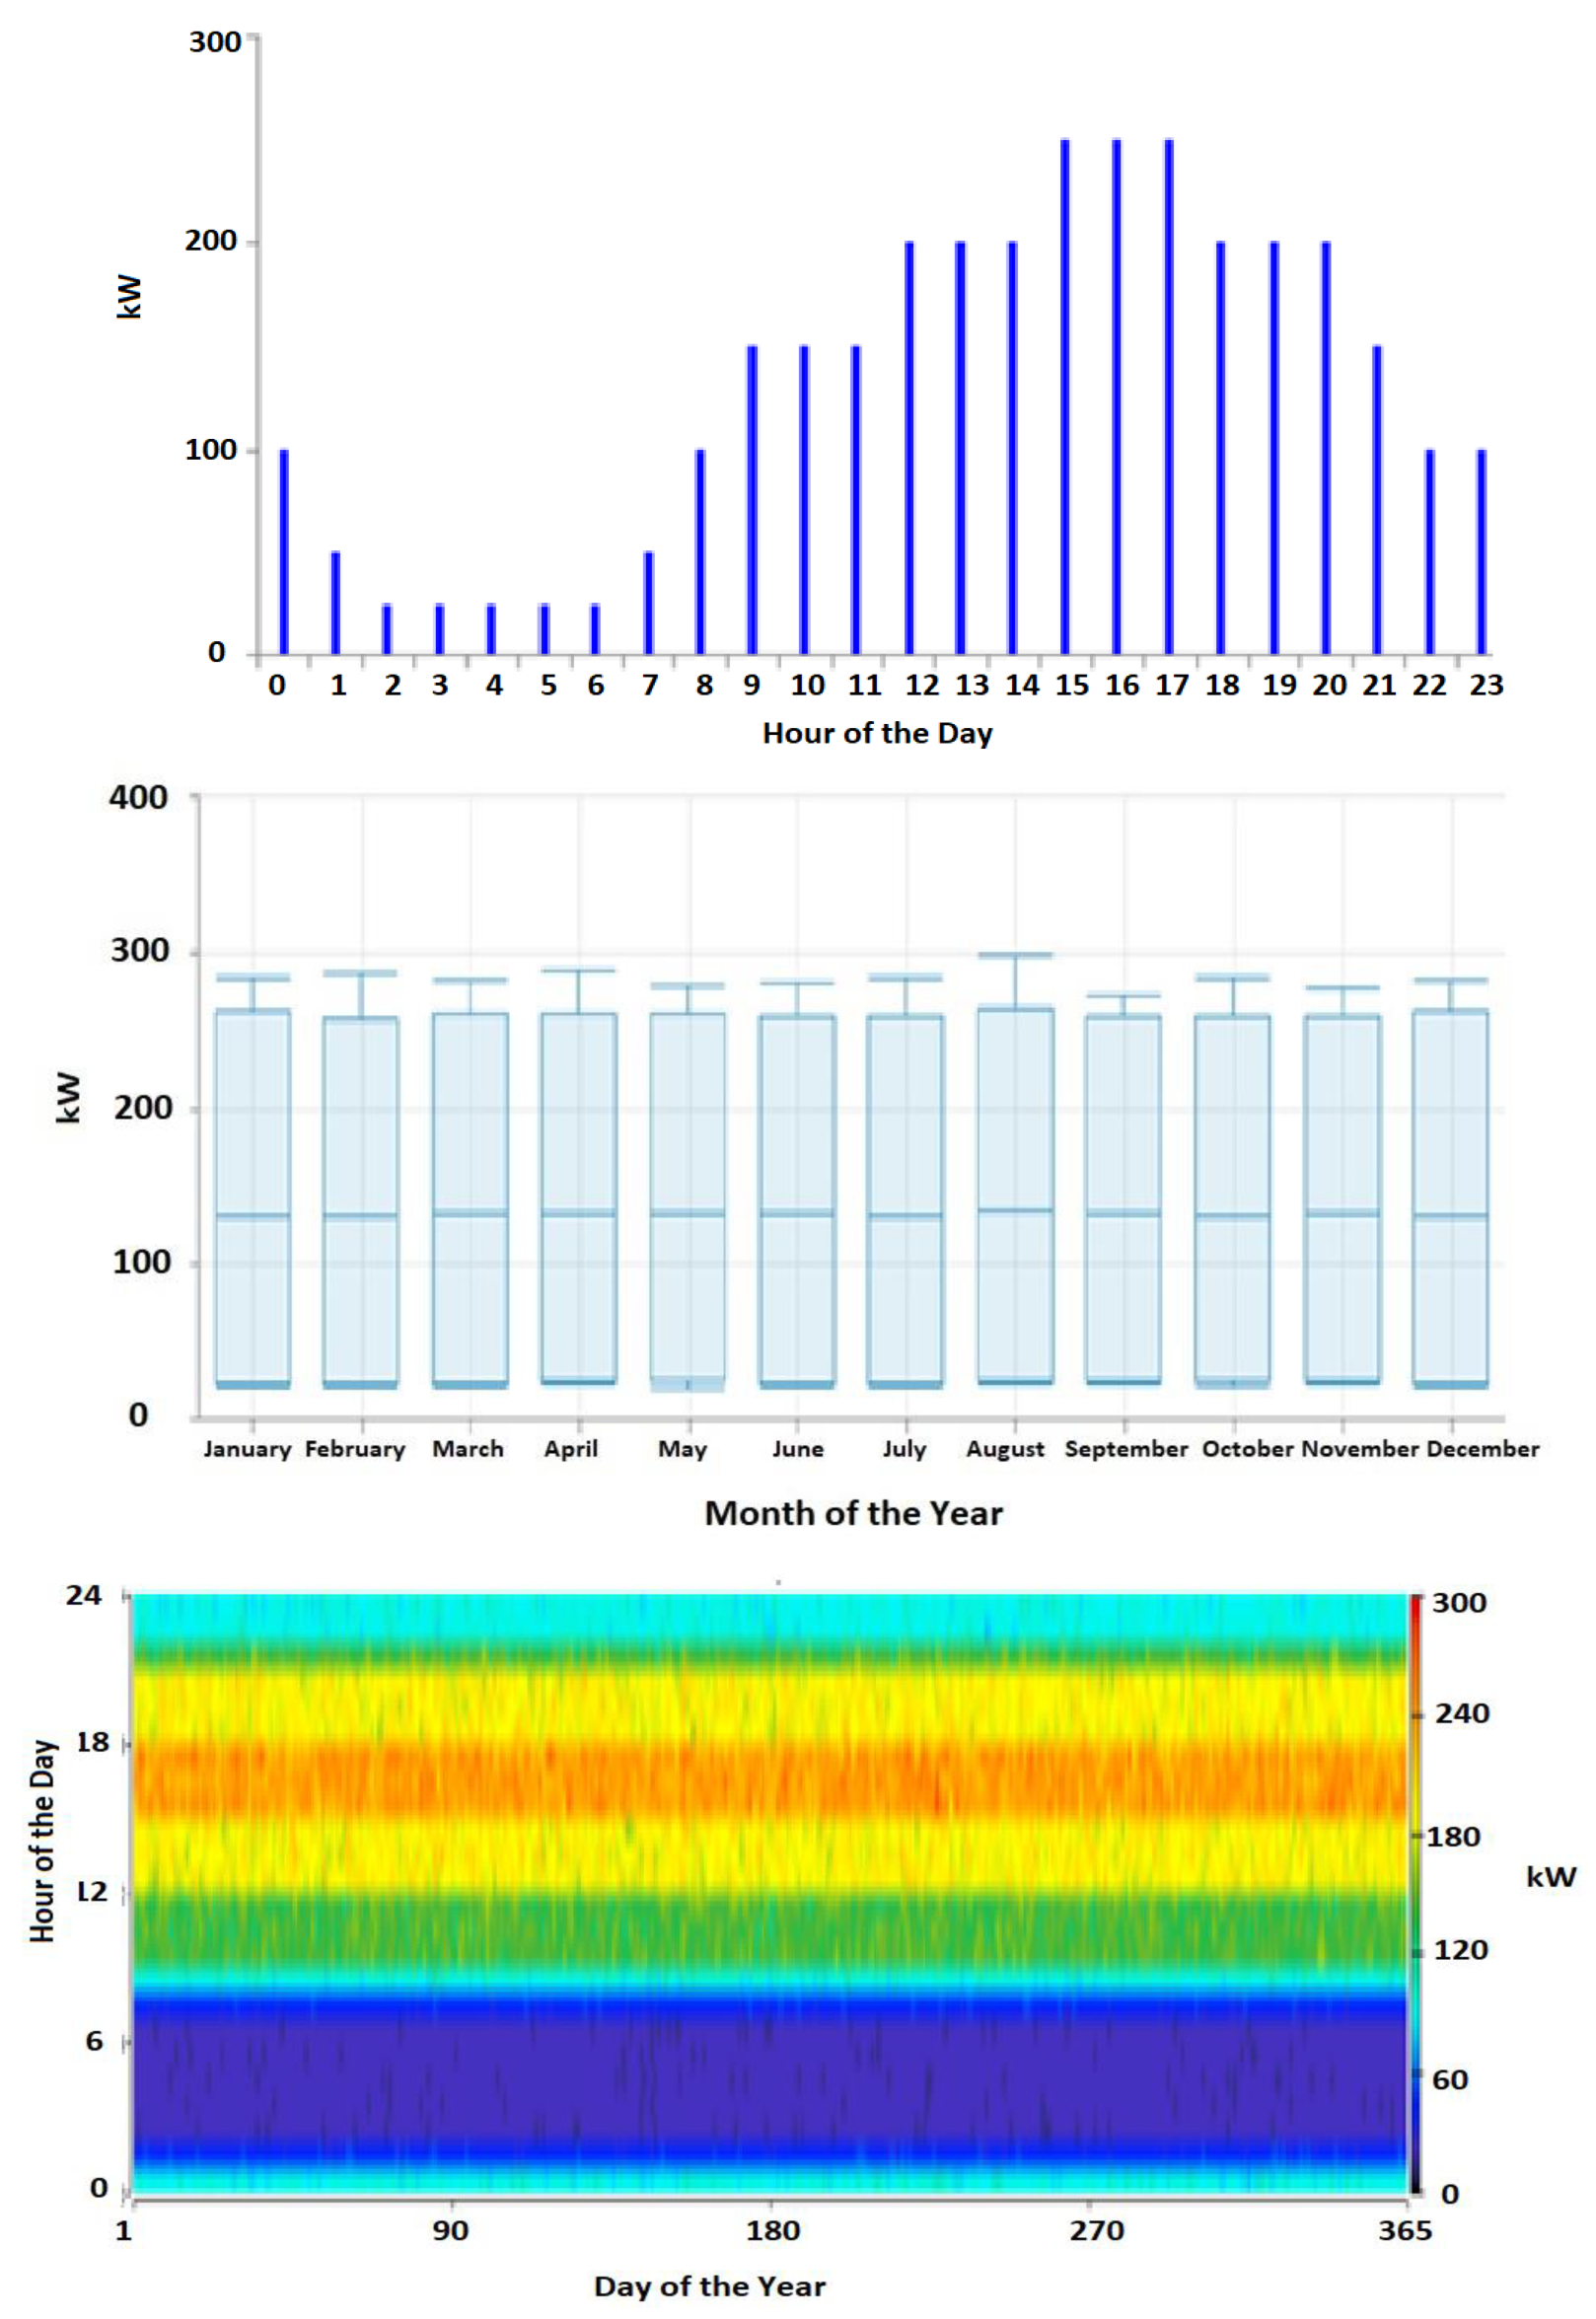
4.2. Load Profile for Yas Island
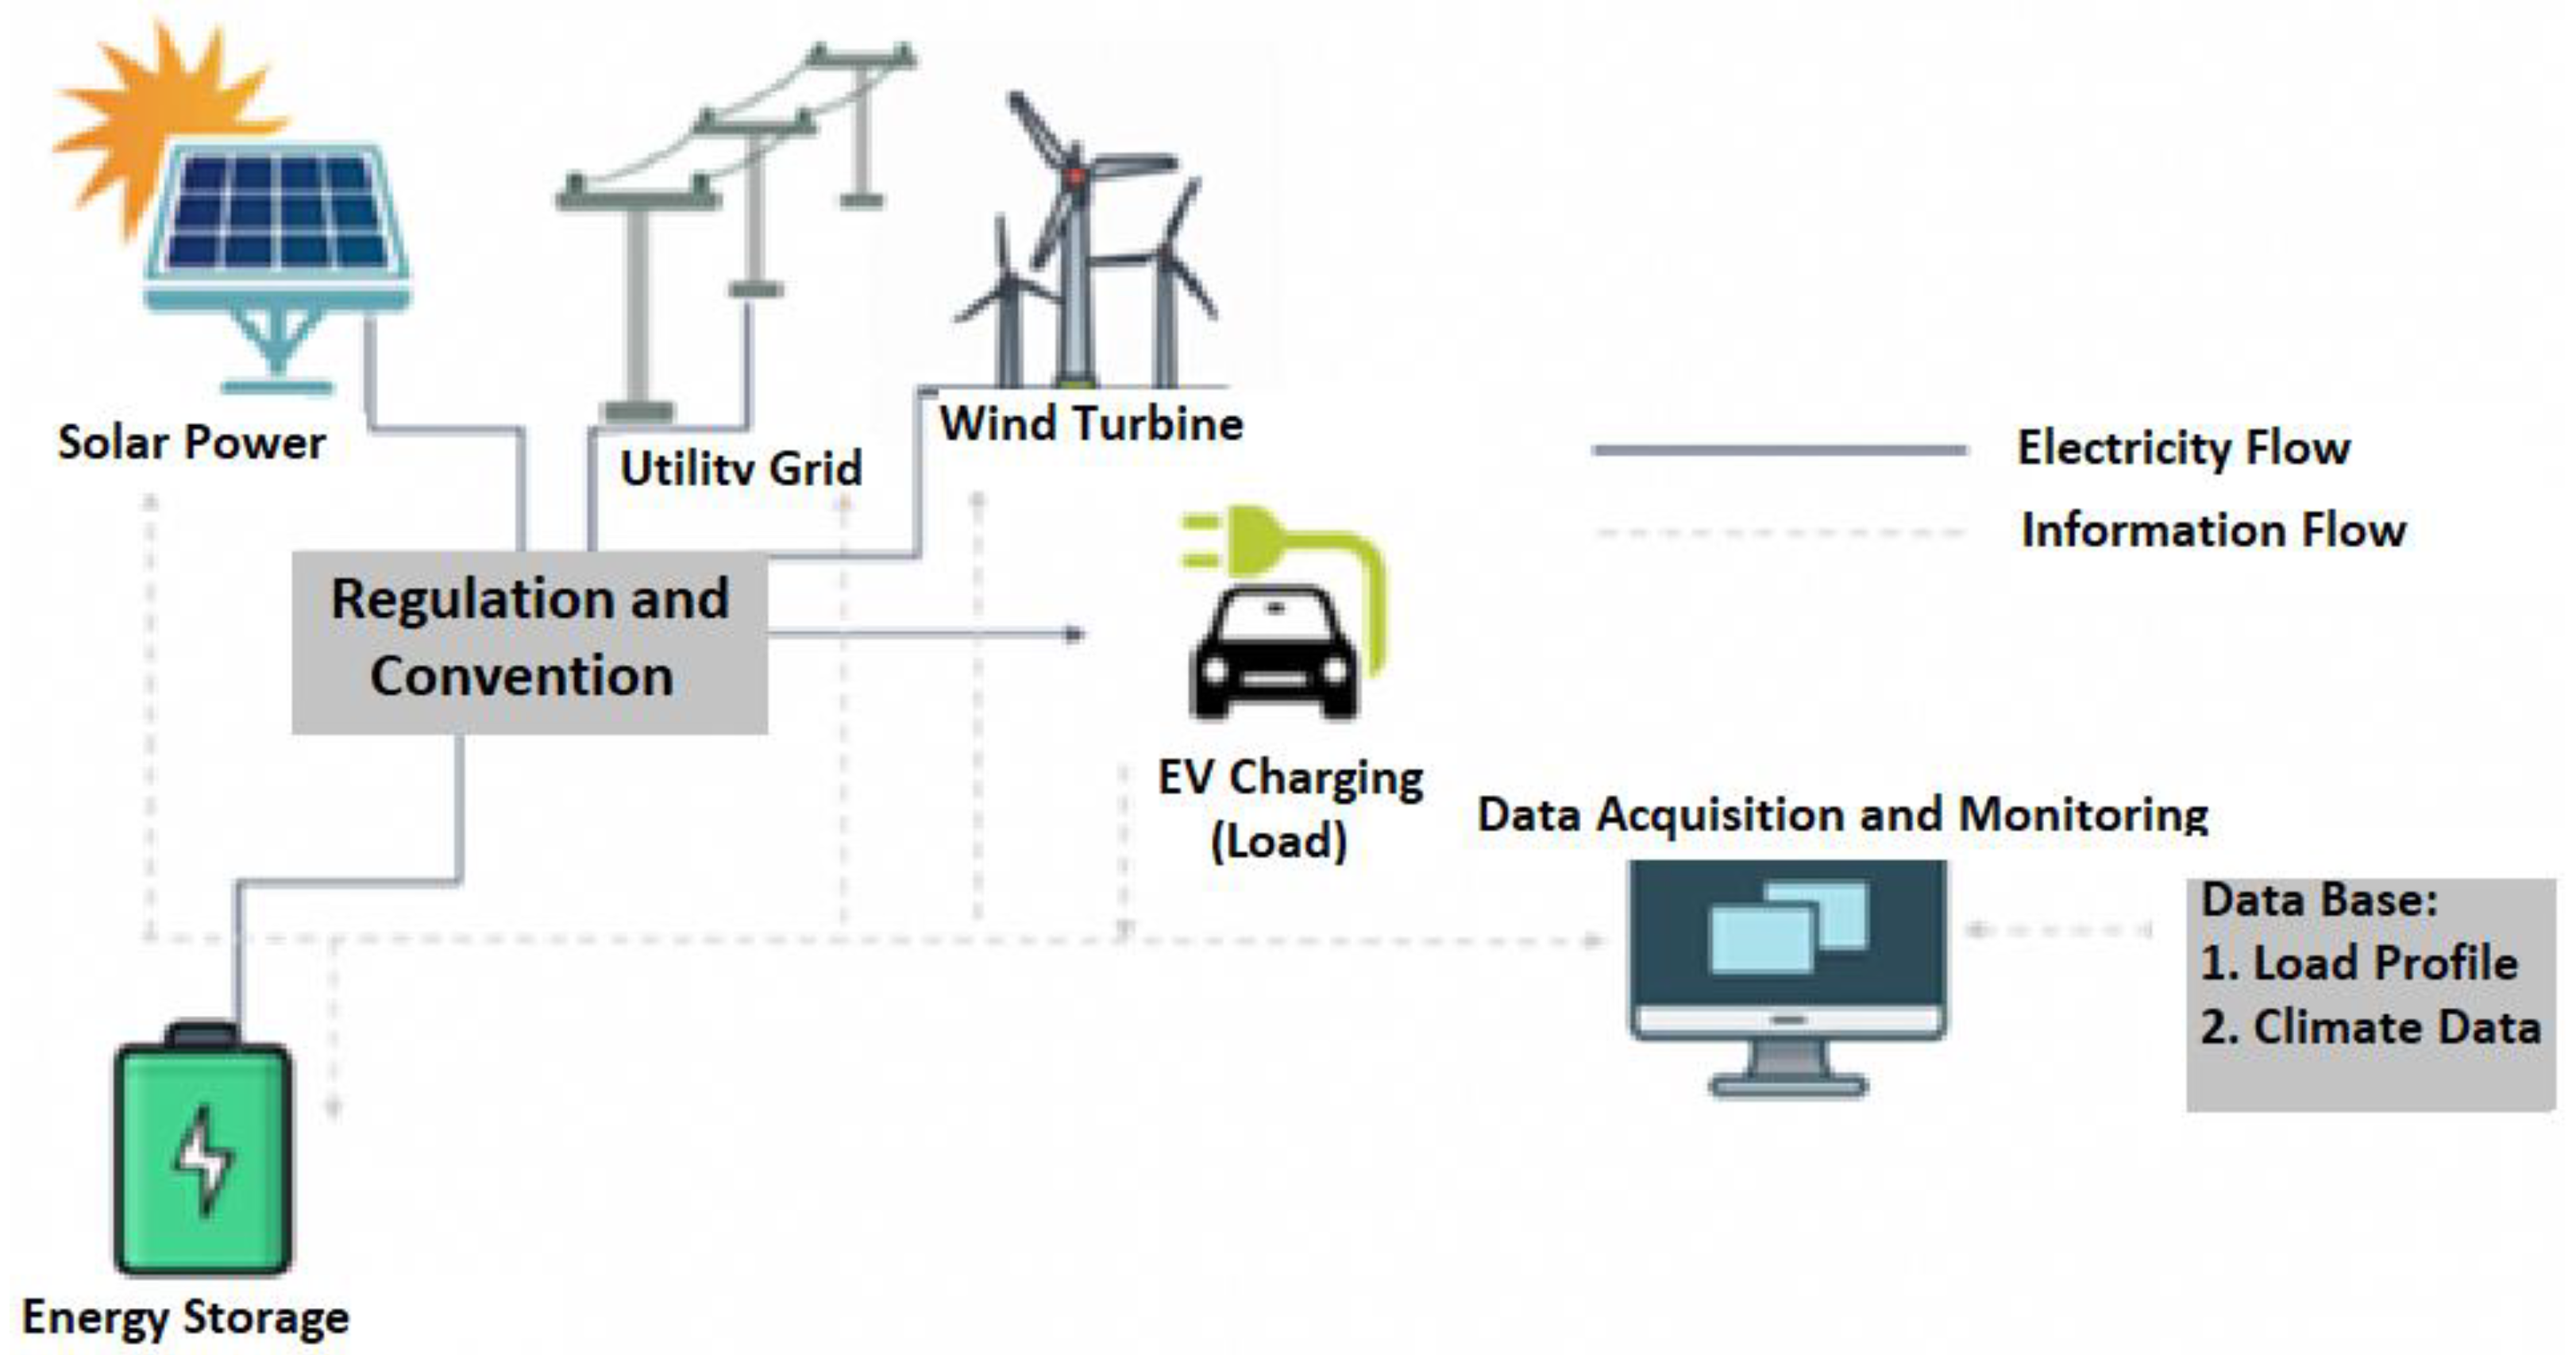
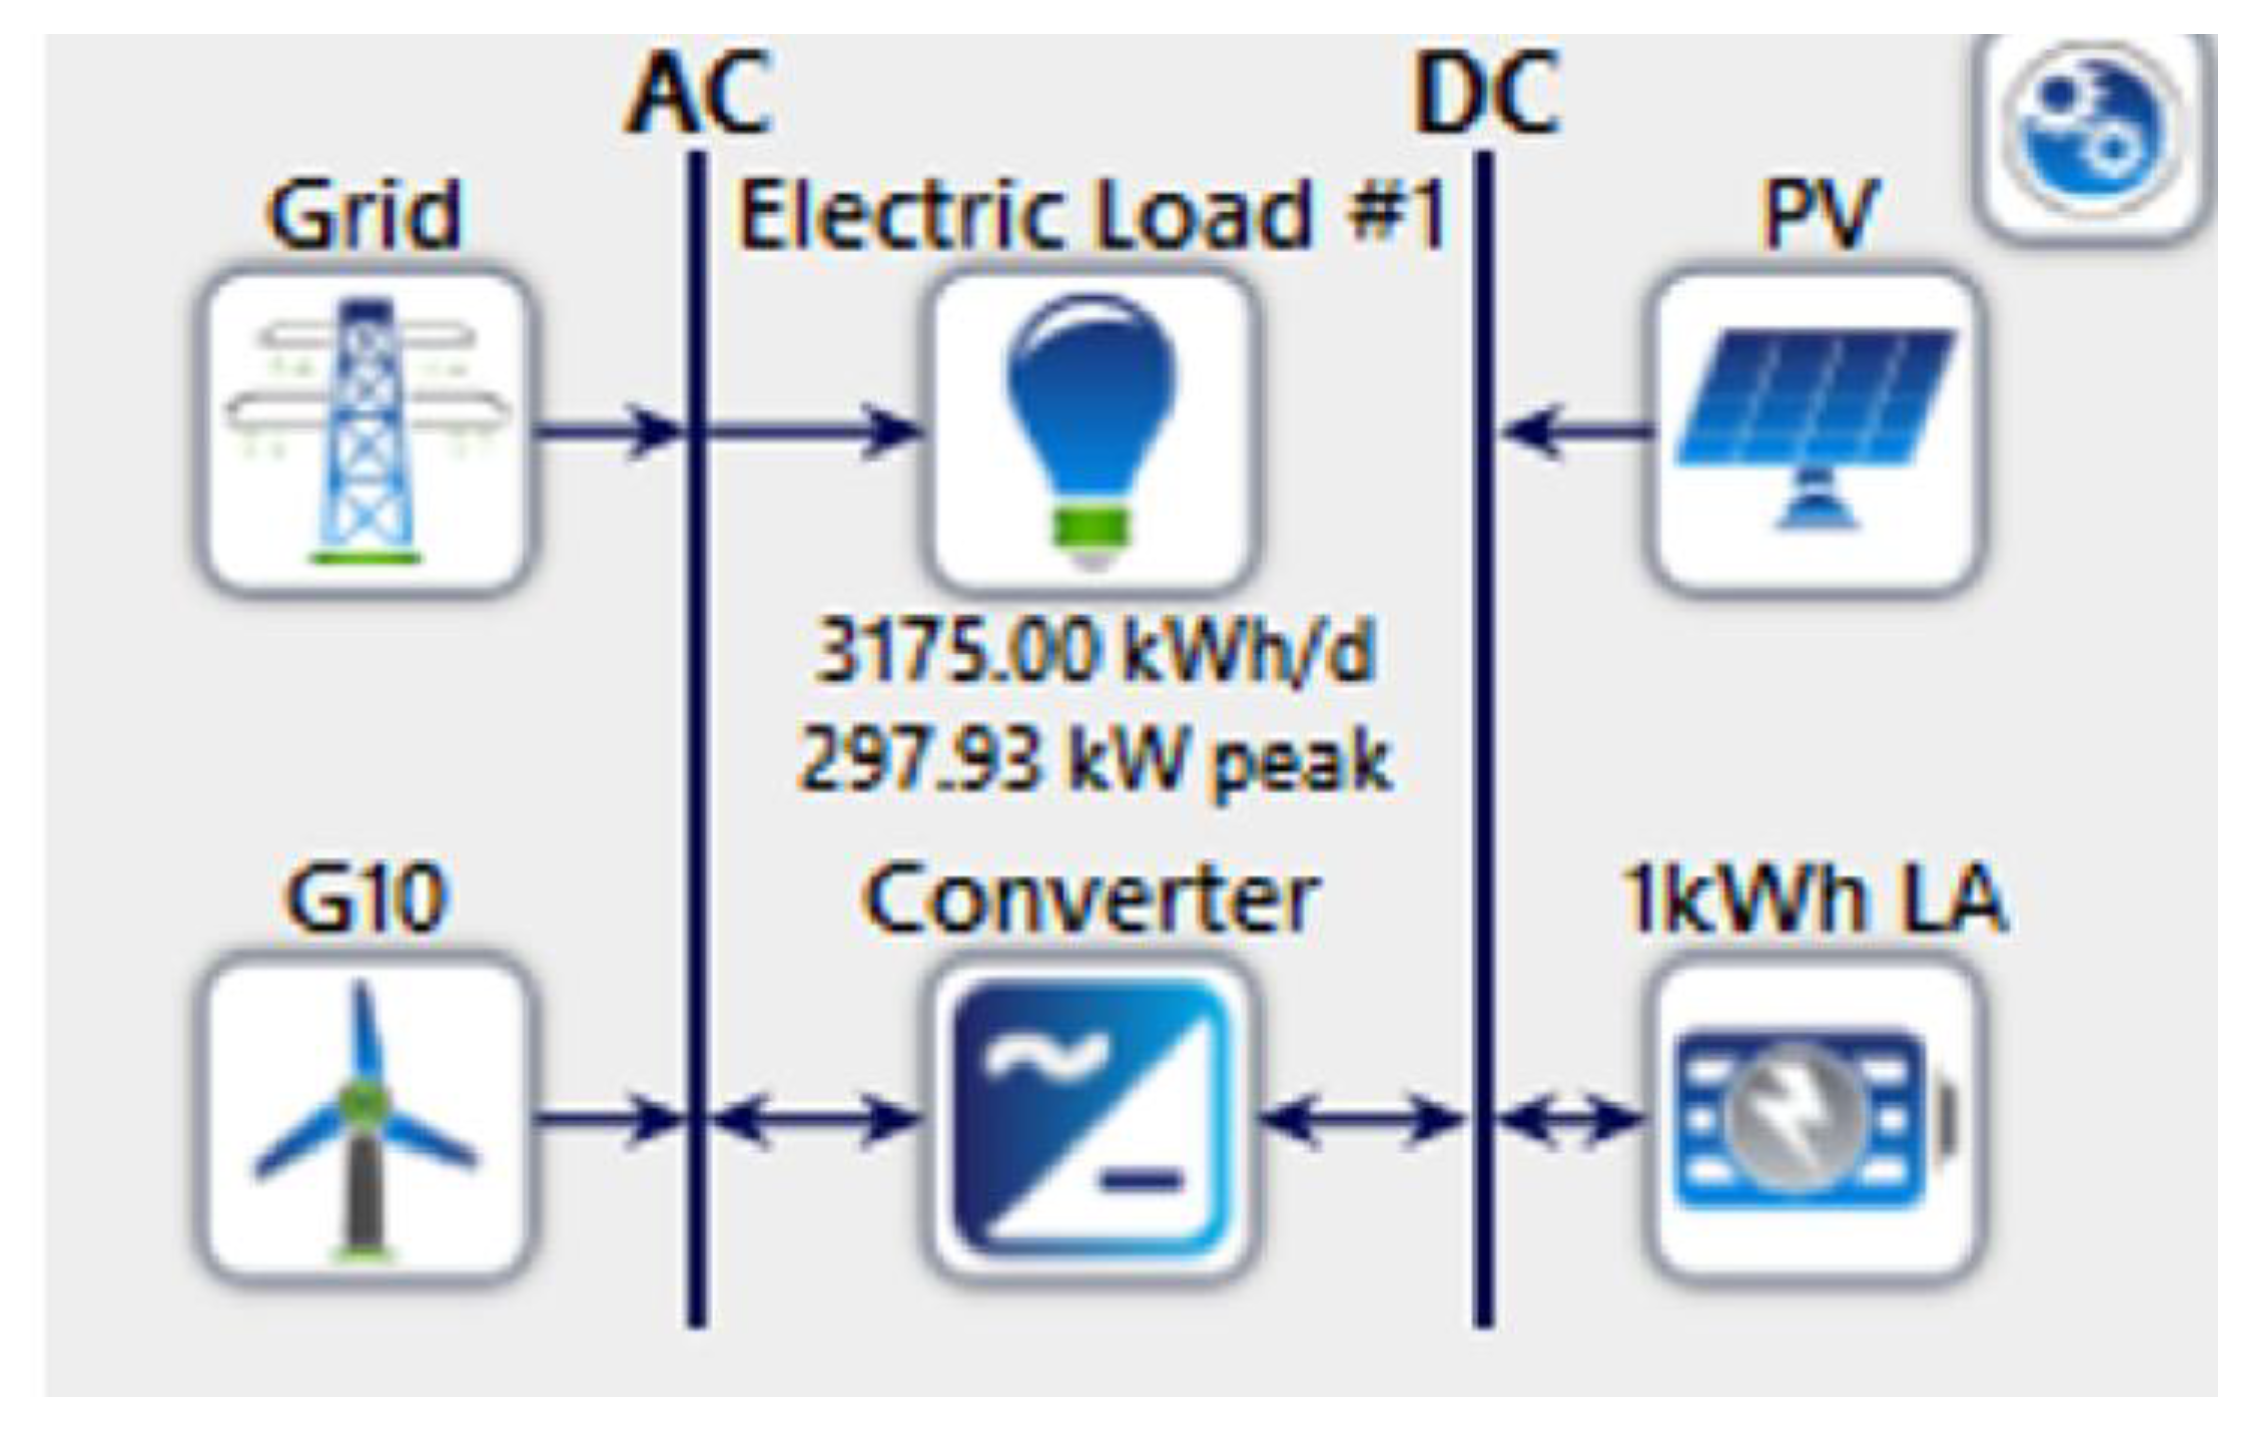
Figure 4 shows the daily, seasonal and annual load profiles of Yas Island. The project is installed in a commercial area where EV charging is considered in the load. The hypothetical data used were obtained using HOMER and they exhibited a daily random variability based on uncertainty. The maximum electricity consumption for EV charging was 3175 kWh/day, and its peak was at 297 kW. This peak can be attributed to the rush hour and increased human activity between 3:00 p.m. and 5:00 p.m. Table 2 summarizes the technical information related to the load profile.

4.3. Studied System

The UAE is investing considerably in ecofriendly cars. Hybrid power systems can satisfy energy requirements with low costs for any type of load, including commercial, industrial and residential loads. Therefore, in this study we aimed to develop a cost-effective, reliable, sustainable and ecofriendly hybrid system based on renewable energy resources for EV charging in a commercial area. Overall, our aim was to help achieve the Dubai Autonomous Transportation Strategy 2030 of the UAE. In this study, solar radiation, wind speed and load demand were the critical input data of the system, on the basis of which an optimal output could be obtained. Figure 5 presents a schematic of the proposed system.

4.4. Modeling of the Hybrid Energy System

HOMER software was used to provide a better understanding regarding the amount of energy produced by the proposed hybrid system and the manner in which the proposed system affected the environment in terms of decreasing emissions, while also considering the economic implications. Furthermore, the concept of optimization was applied in the proposed system to select and verify the best proposed hybrid system based on the selected area and available resources. Figure 6 shows the proposed system configuration, involving a PV, a national grid, a wind turbine, a bi-directional converter, a battery and an electric load. In the HOMER software, we utilized PV and wind power as the primary energy sources and the national grid as the secondary energy source. The electricity tariff (grid) was obtained from electricity providers in the UAE, such as the Dubai Electricity and Water Authority (DEWA) and the Abu Dhabi Water and Electricity Authority (ADWEA), with a grid power price of 0.130 USD/kWh. A battery was used as the backup when insufficient power was procured from these two sources. Table 3 shows the characteristics of the components used in this study. The battery will be replaced after every 15 years. The battery charges when there is no excess electricity that is not used by the load. In addition, EV charging is conducted using the battery if the latter is fully charged. However, the power required for the load is obtained via PV power generation or from the grid, depending on the electricity tariff.
Focusing on the energy deficits in Abu Dhabi, relevant data were collected from the NASA Surface Meteorology and Solar Energy databases and employed in the HOMER software. Furthermore, the output of the hybrid system was economically analyzed using two important parameters: NPC and the levelized COE [36,37].
N P C = C t o t , a n n u a l C R F
C R F i , N = i 1 + i N 1 + i N 1
where C t o t , a n n u a l is the total annual cost, CRF is the capital recovery factor, i denotes the real interest rate calculated based on the nominal discount rate and N is the number of years. Furthermore,
C O E = C t o t , a n n u a l E s e r v e d  
where E s e r v e d is the energy provided (KWh/year), which can be calculated as follows:
E s e r v e d = E i s + E g r i d
where E i s and E g r i d denote the electrical energy generated from the microgrid system and the amount of electricity exported to the main grid, respectively. The salvage value and return on investment (ROI) are other important economic factors. The salvage value is the remaining value of power generated by the hybrid system after the project lifetime and can be given as follows [36]:
S a l v a g e = C r e f R c o m p [ n R c o m p * I N T n R c o m p R c o m p
where Cref denotes the replacement cost of a component and Rcomp denotes the component lifetime. ROI is defined as the annual cost savings relative to the initial investment. This value can be obtained using HOMER software as follows [38]:
R O I = i = 0 n C i , r e f C i n C c a p C c a p , r e f
where Ci,ref is the system’s reference nominal cash flow, Ci is the system’s annual current nominal cash flow, Ccap is the current system’s capital cost and Ccap,ref is the capital cost of a reference system. Furthermore, carbon credits are measures of how the use of renewable energy can reduce carbon dioxide emissions annually. This study can be beneficial in both environmental and economic terms. From the environmental perspective, it calculates the reduction in CO2 emissions and hence its effect on the environment. Similarly, carbon credits can be sold because of their high potential for revenue generation. Carbon credits can be can be estimated using Equations (7)–(10) [39,40,41]. The annual electricity output of the project can be given as follows:
E = C u F × h o u r s × r a t i n g
where CuF indicates the capacity utilization factor of the renewable energy project, which varies depending on the type of renewable energy source used. The term hours indicates the number of hours in a year (8760) and rating represents the rating of the renewable energy project. Then, the annual carbon dioxide emissions can be given as
M = E × E f
where Ef represents the emission factor, which is zero in the case of renewable energy. The annual electricity output and carbon dioxide emissions in the case of the studied project can be easily determined using the HOMER software. The annual baseline emissions can be estimated as follows:
B a s e = E × E F e l e c
where E F e l e c represents the emission factor of a country in the case of electricity production; it is 0.0694 tCO2/MWh for the UAE [41]. Finally, the annual emission reduction can be given as follows:
R e d = B a s e M  
Each carbon credit corresponds to a one-ton reduction in carbon dioxide emissions [39].

5. Results and Discussion

Five different hybrid systems for Yas Island were examined based on the available technologies to obtain the optimal output with respect to reliability and affordability. As discussed above, the system components included batteries and a utility grid, combined with PVs and wind turbines as renewable energy sources to provide electricity for the charging of EVs. In this section, the simulation results for different hybrid system configurations are presented and the data are analyzed technically, economically and environmentally.

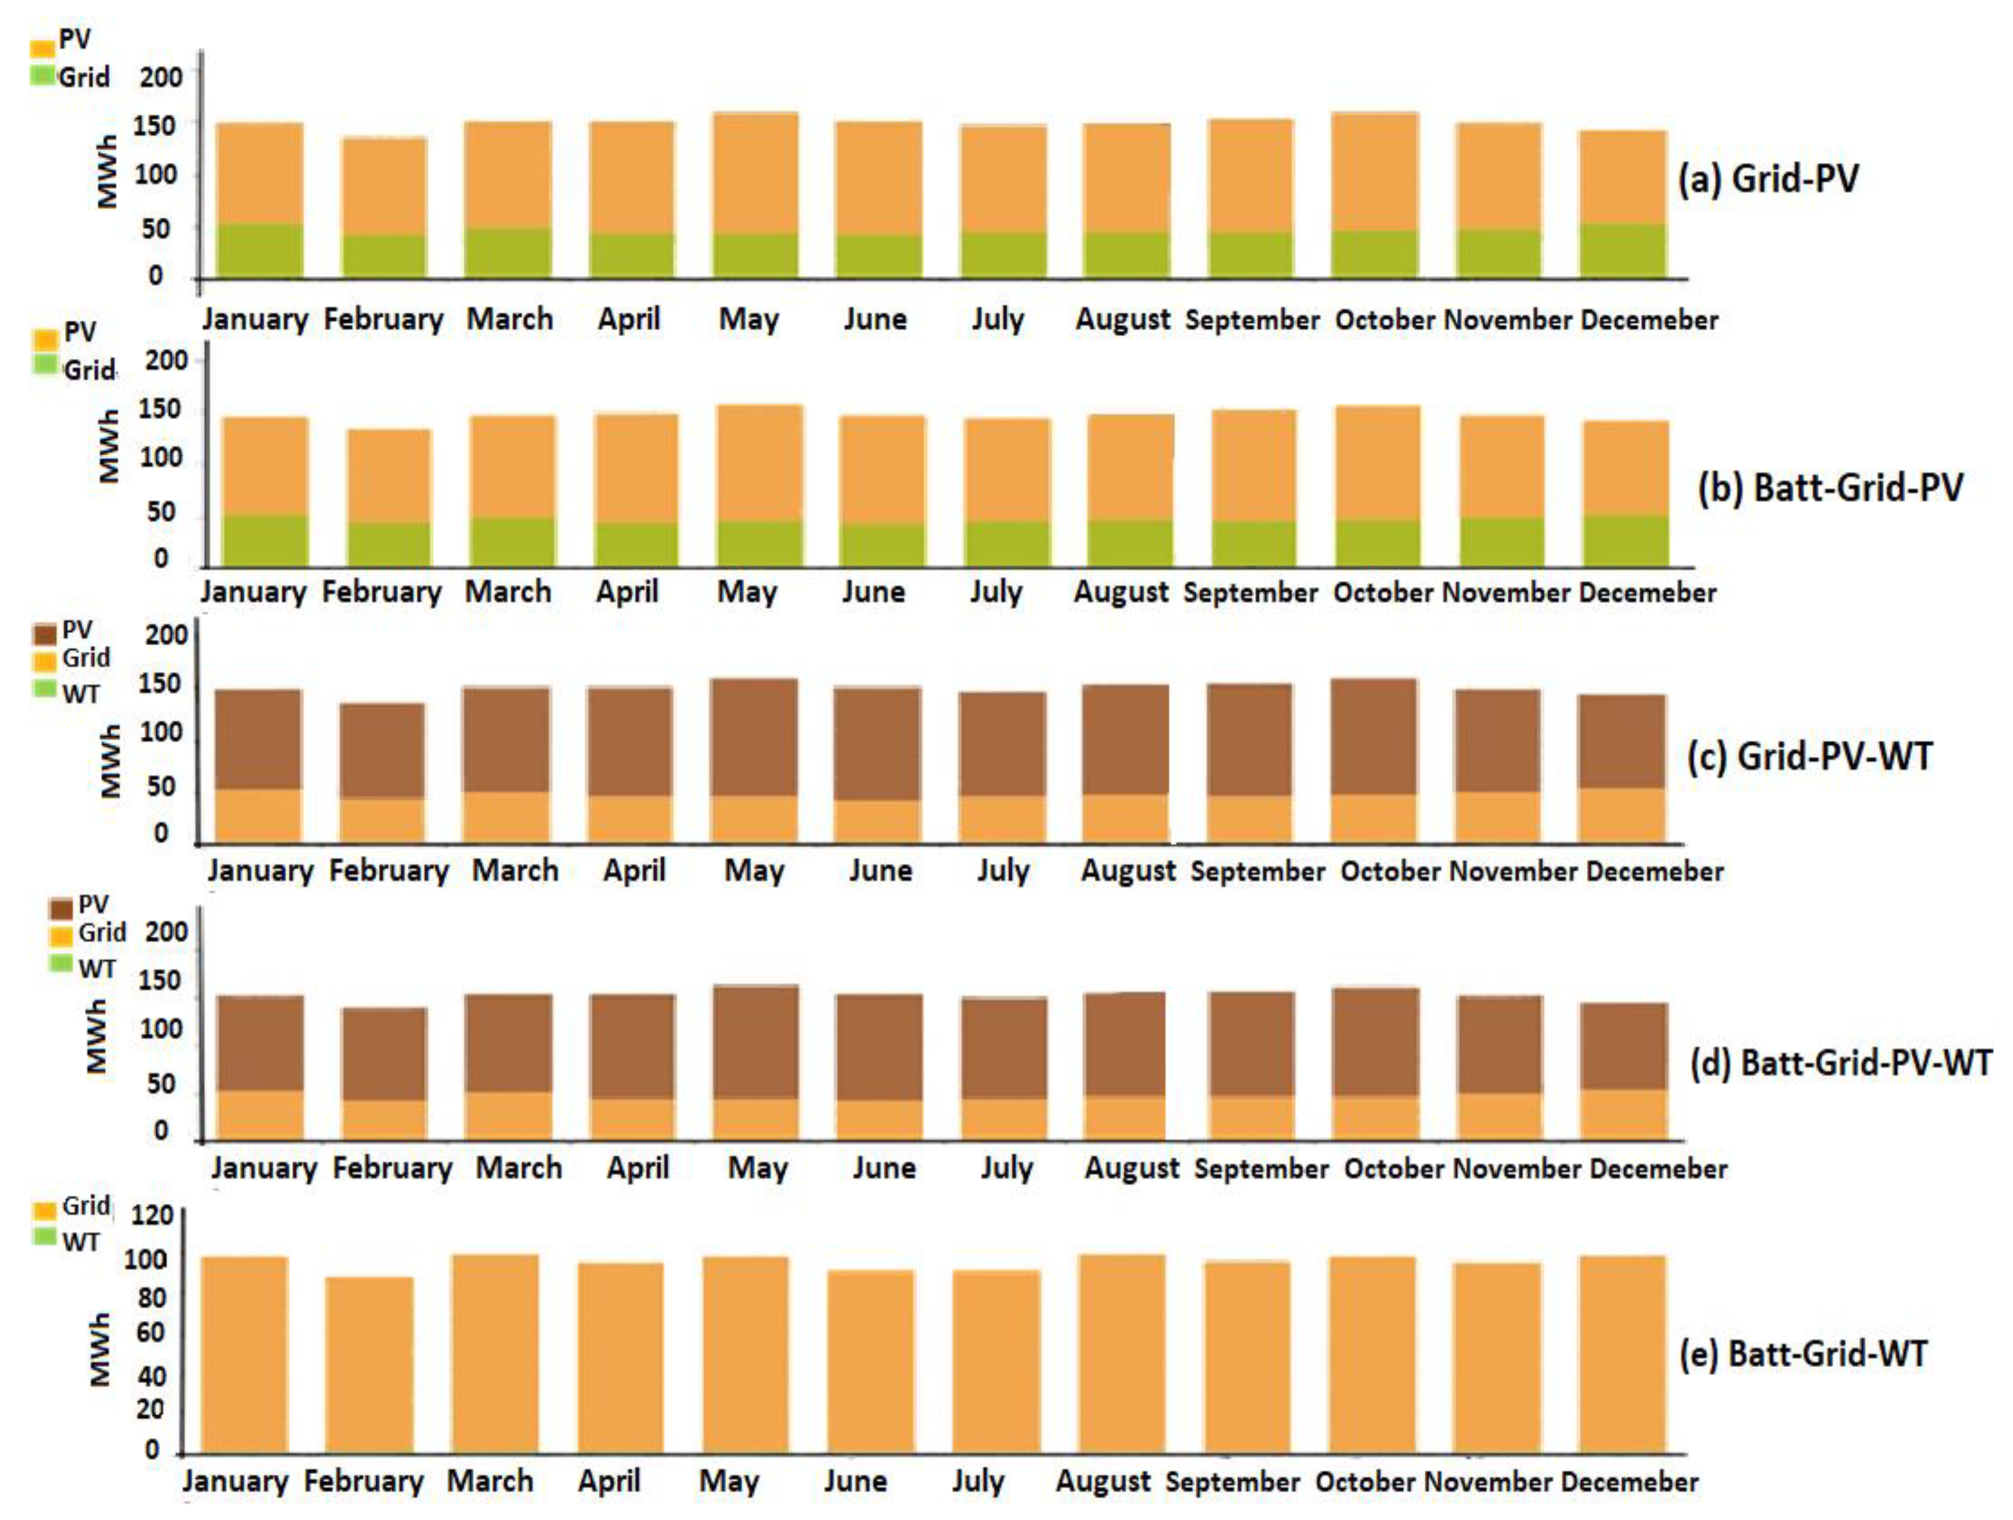
5.1. Technical Analysis

As EVs are becoming more visible on the UAE’s roads and gaining more recognition in the country, awareness regarding this technology is growing. This is good because EVs have great potential in the transportation sector. Because traditional power systems rely on fossil fuels for power generation, they have harmful effects on the environment. However, the usage of renewable energy in electrical systems for charging EVs can considerably reduce emissions.
In this section, a technical analysis of each system and its monthly power production is presented. Table 4 shows the power generation for each system configuration. Most of the configurations feature PVs because of the sunny climate of Abu Dhabi. The load demand for the charging of EVs in commercial areas was fully satisfied in all scenarios; however, managing the surplus electricity is a major challenge.
According to Table 4, when using only the utility grid as the supplementary system, PV power generation was high and the excess electricity, which represents the electrical energy not used by the load, was low. This can be attributed to the load demand. The system should have a higher capacity for renewable energy to supply the load demand, especially during peak times. When coupling the battery storage with the grid, PV power generation decreased, and the excess power increased. This can be clearly observed as the involvement of several primary energy sources provides system flexibility for reacting to the load demands. In addition, the use of wind turbines increased the capacity of renewable energy sources by 11,041 kWh/year. The highest electricity excess could be obtained when all four components (battery–grid–PV–WT system) were combined, providing an output that was equivalent to 22,006 kWh/year. The battery–grid–PV–WT system increased the solar panel capacity and renewable energy fraction because of its ability to store PV power. Figure 7 presents the power generation profiles of hybrid systems with different combinations of power sources (grid power, solar PV, wind turbines (10 kW)) and batteries.

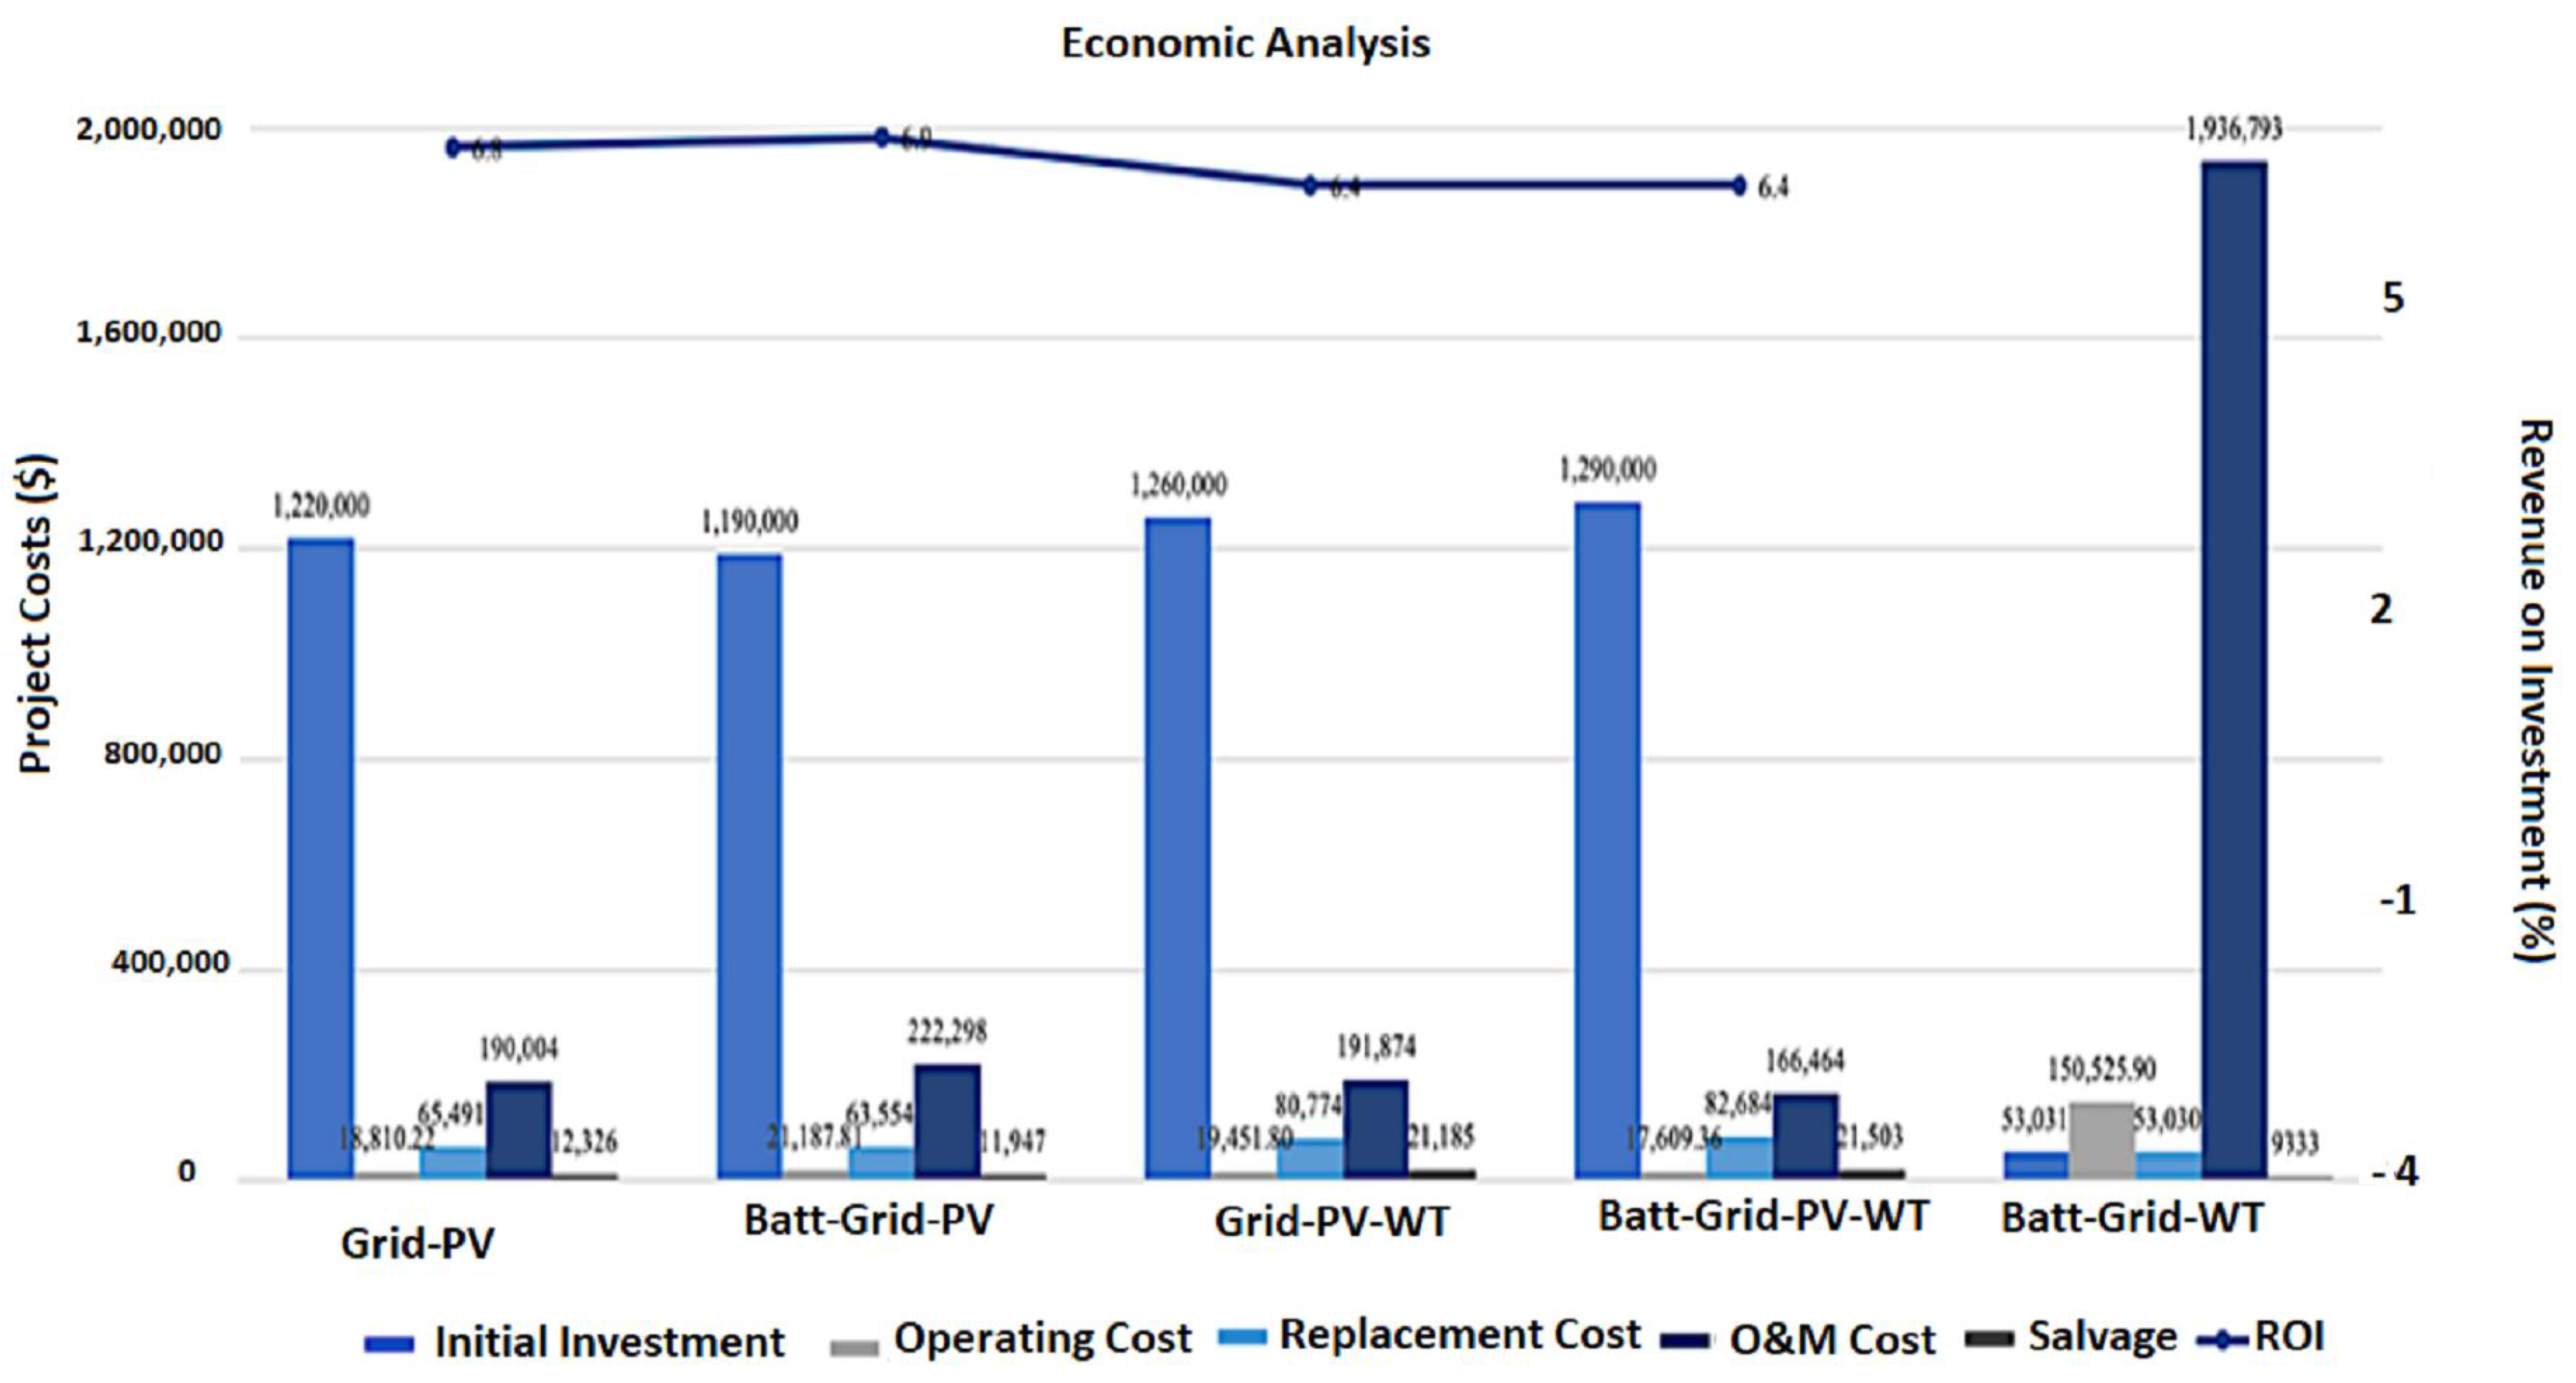
5.2. Economic Analysis

In this section, a discussion of the economic analysis of the combinations of hybrid systems selected using HOMER software is presented. NPC and COE are the critical economic factors that are optimized using HOMER software based on the equations presented in Section 2. When performing a vital analysis with respect to the lifetime of the components, other costs such as the initial capital cost, replacement cost and operation and maintenance (O&M) costs, were considered, along with important economic factors including the salvage value and ROI.
Table 5 indicates the economic assessment of each scenario. The first scenario (grid–PV) had the lowest COE value (0.06581 USD/kWh), whereas the proposed battery–grid–PV–WT system had the highest COE value (0.06743 USD/kWh). Although there was a tradeoff between cost and other system factors, an investor may decide on what is more preferable among the economic parameters, i.e., system efficiency (lower losses) or the renewable fraction (lower emissions). The proposed power system was characterized by a high initial investment cost (equivalent to 1.29 million USD) but low operating and O&M costs.
Based on all the data, using the proposed system with a 719-kW solar panel and a 10-kW wind turbine with three battery units and a utility grid was the most cost-effective alternative. Furthermore, this system had the highest renewable fraction among all the scenarios (68.2%), indicating its good environmental performance and producing the highest electricity surplus (22,006 kWh/year).
Finally, the best ROI was provided by the battery–grid–PV system (6.9%), whereas the lowest ROI was observed in the case of the battery–grid–WT (−3.7%). Figure 8 summarizes the costs for all the hybrid systems. This analysis is beneficial because it economically specifies how the prices of the technologies can be reduced to make them more affordable and install them in hybrid systems.

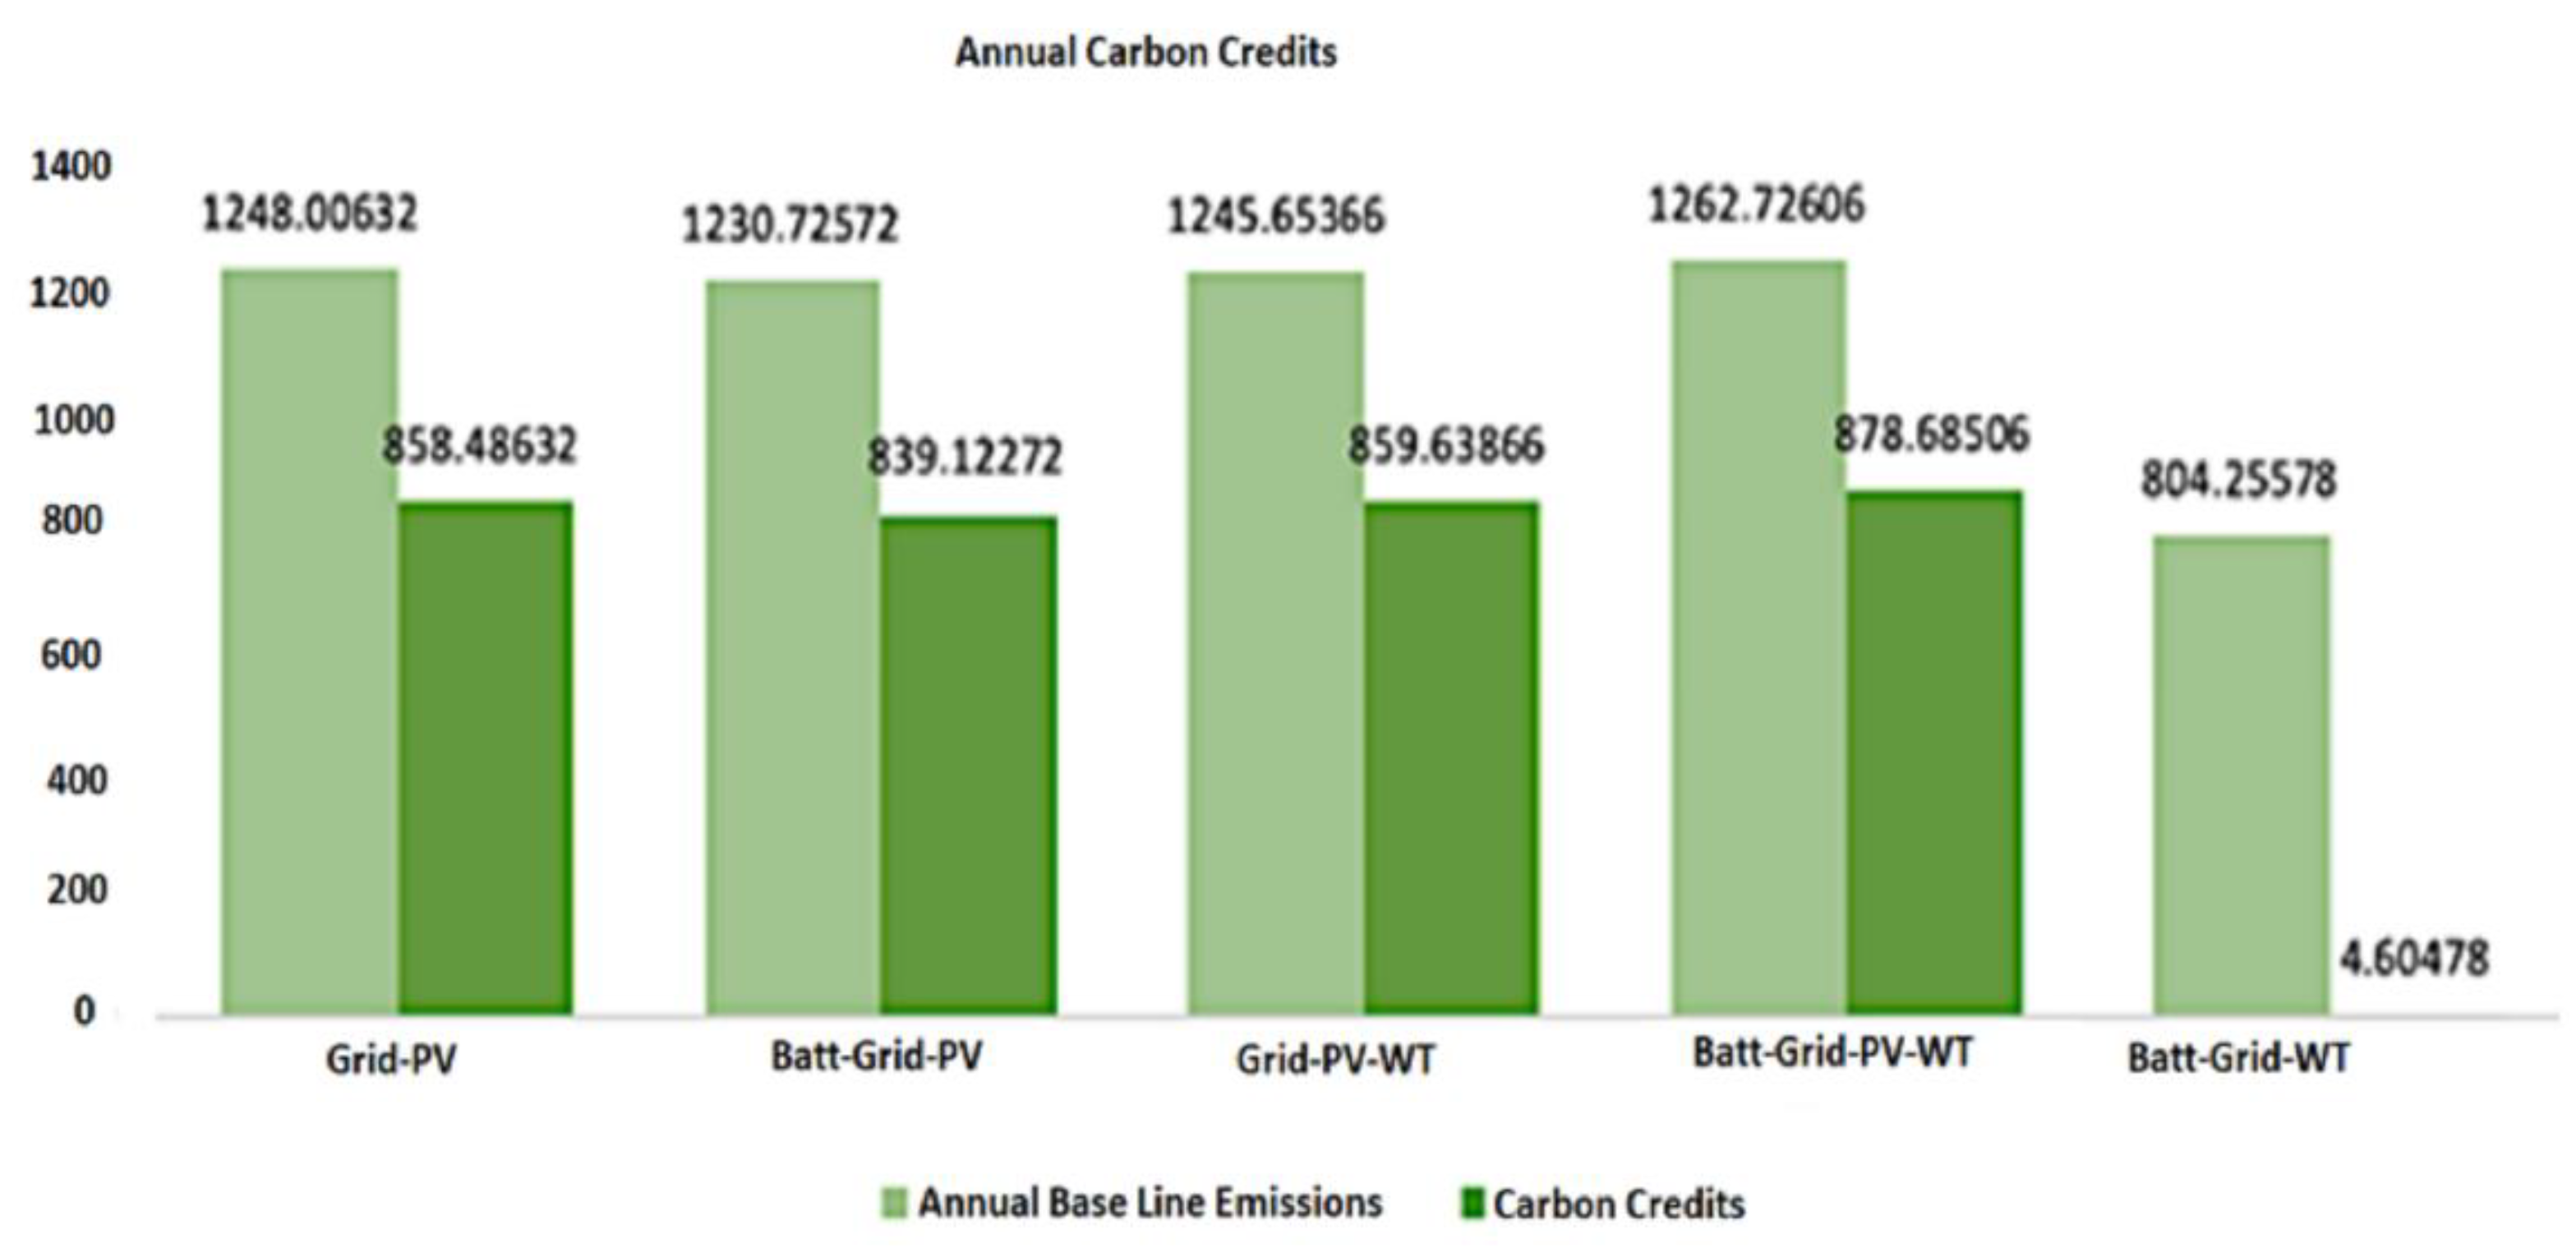
5.3. Emission Analysis

A greenhouse gas (GHG) absorbs and emits radiation in a specific thermal infrared range. Hence, it plays a major role in ensuring a clean and safe environment. In this section, an environmental analysis was performed by considering the GHG emissions of different hybrid power systems.
Table 6 indicates the emissions produced by different hybrid systems. The system in which only the utility grid was employed exhibited the highest emissions of all GHGs. However, the emissions were reduced significantly when considering renewable sources such as PVs and wind turbines. This can be attributed to the installation of a high capacity of renewable energy systems. Furthermore, the battery–grid–PV–WT scenario exhibited the lowest emissions of carbon dioxide, sulfur dioxide and nitrogen oxides. This system produced approximately 1.4% less pollutants than the grid–PV system. From an environmental perspective, the proposed system was ecofriendly and exhibited the best performance. In addition, it was the most efficient system in terms of delivering the required power to the load, along with increasing the system flexibility and enhancing the environmental performance. The amount of emitted pollutants, including carbon monoxide, unburned hydrocarbons and particulate matter, was zero for each system because of the absence of any fossil-fuel-based generator or fuel combustion.
Finally, the carbon reductions associated with each system were determined. After estimating the annual electricity output and carbon dioxide emissions using HOMER software, the carbon credits were calculated and examined accordingly. Table 7 shows the carbon credit values for each scenario.
One carbon credit corresponds to a one-ton reduction in carbon dioxide emission. According to Table 7, the proposed system exhibited an excellent performance with respect to carbon dioxide reductions because it provided a reduction of approximately 878.68 tons per year and up to 21,950 tons over the lifetime of the project (25 years). Furthermore, this can result in savings that are worth up to 8786.8 USD per year. Figure 9 shows that the management of carbon credits is necessary to increase profits and decrease CO2 emissions. Therefore, governments can develop new policies and impose penalties for companies with high CO2 emissions. Furthermore, companies can buy carbon credits to offset their remaining emissions.

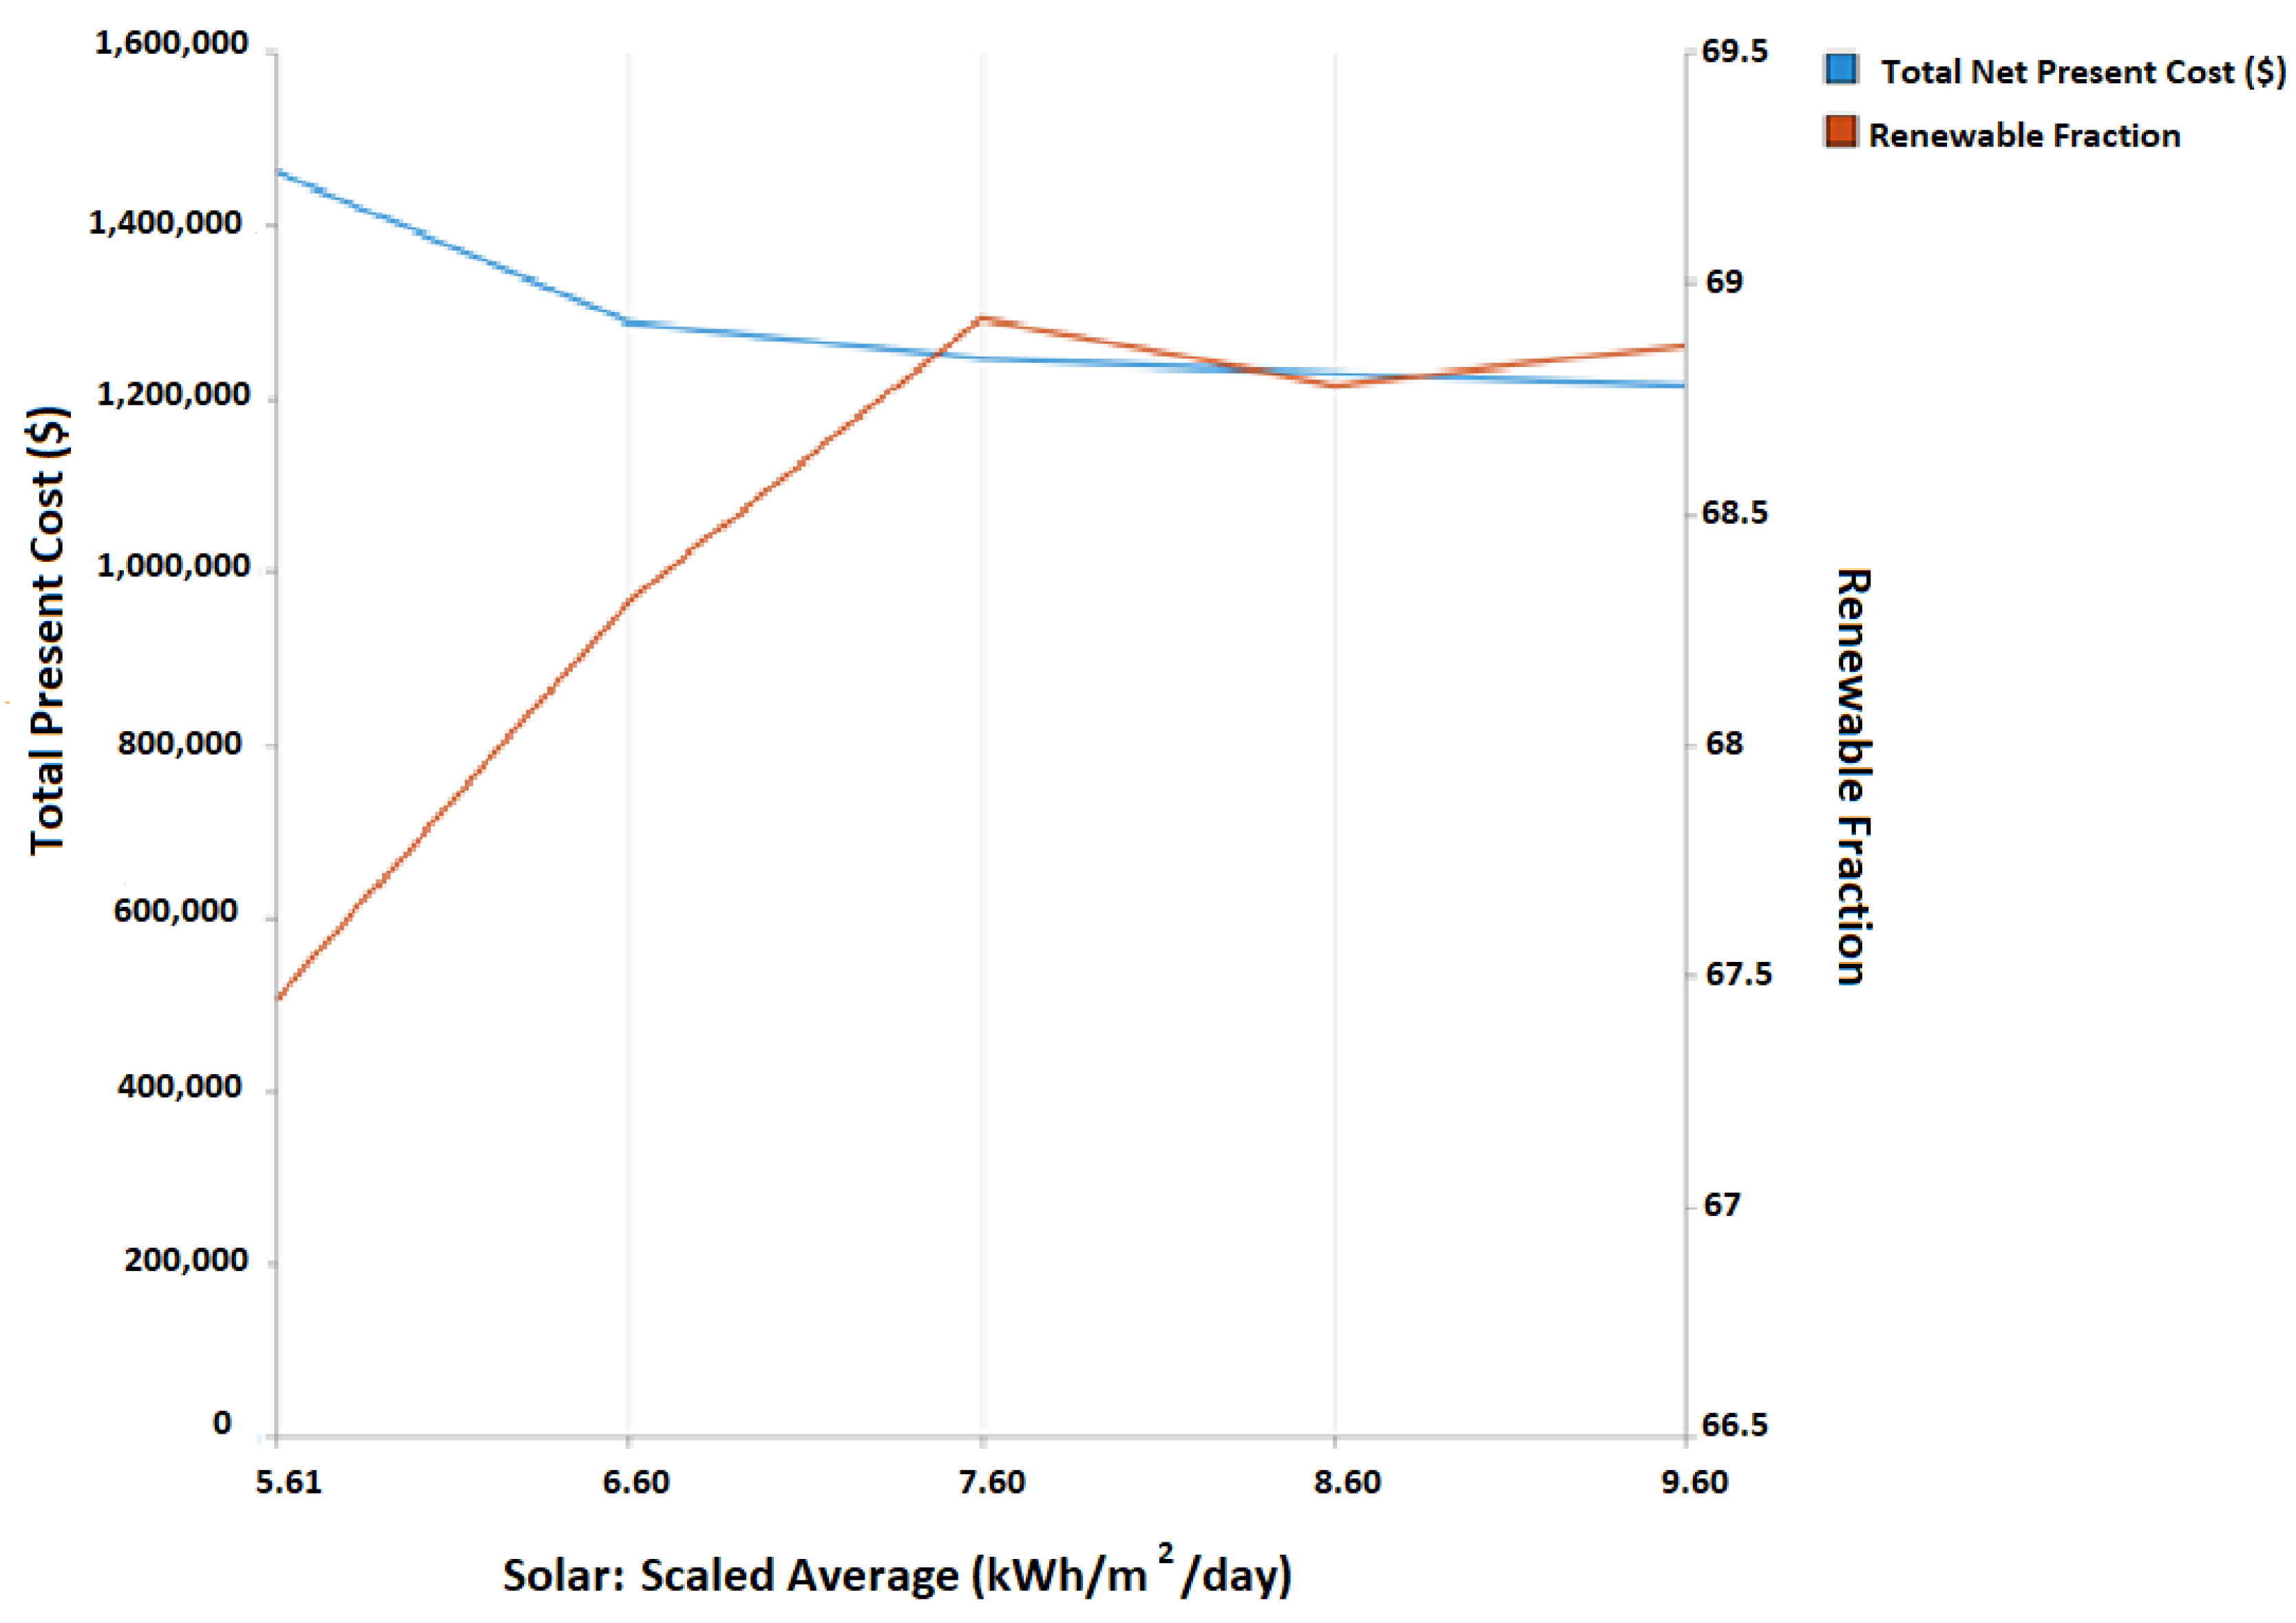
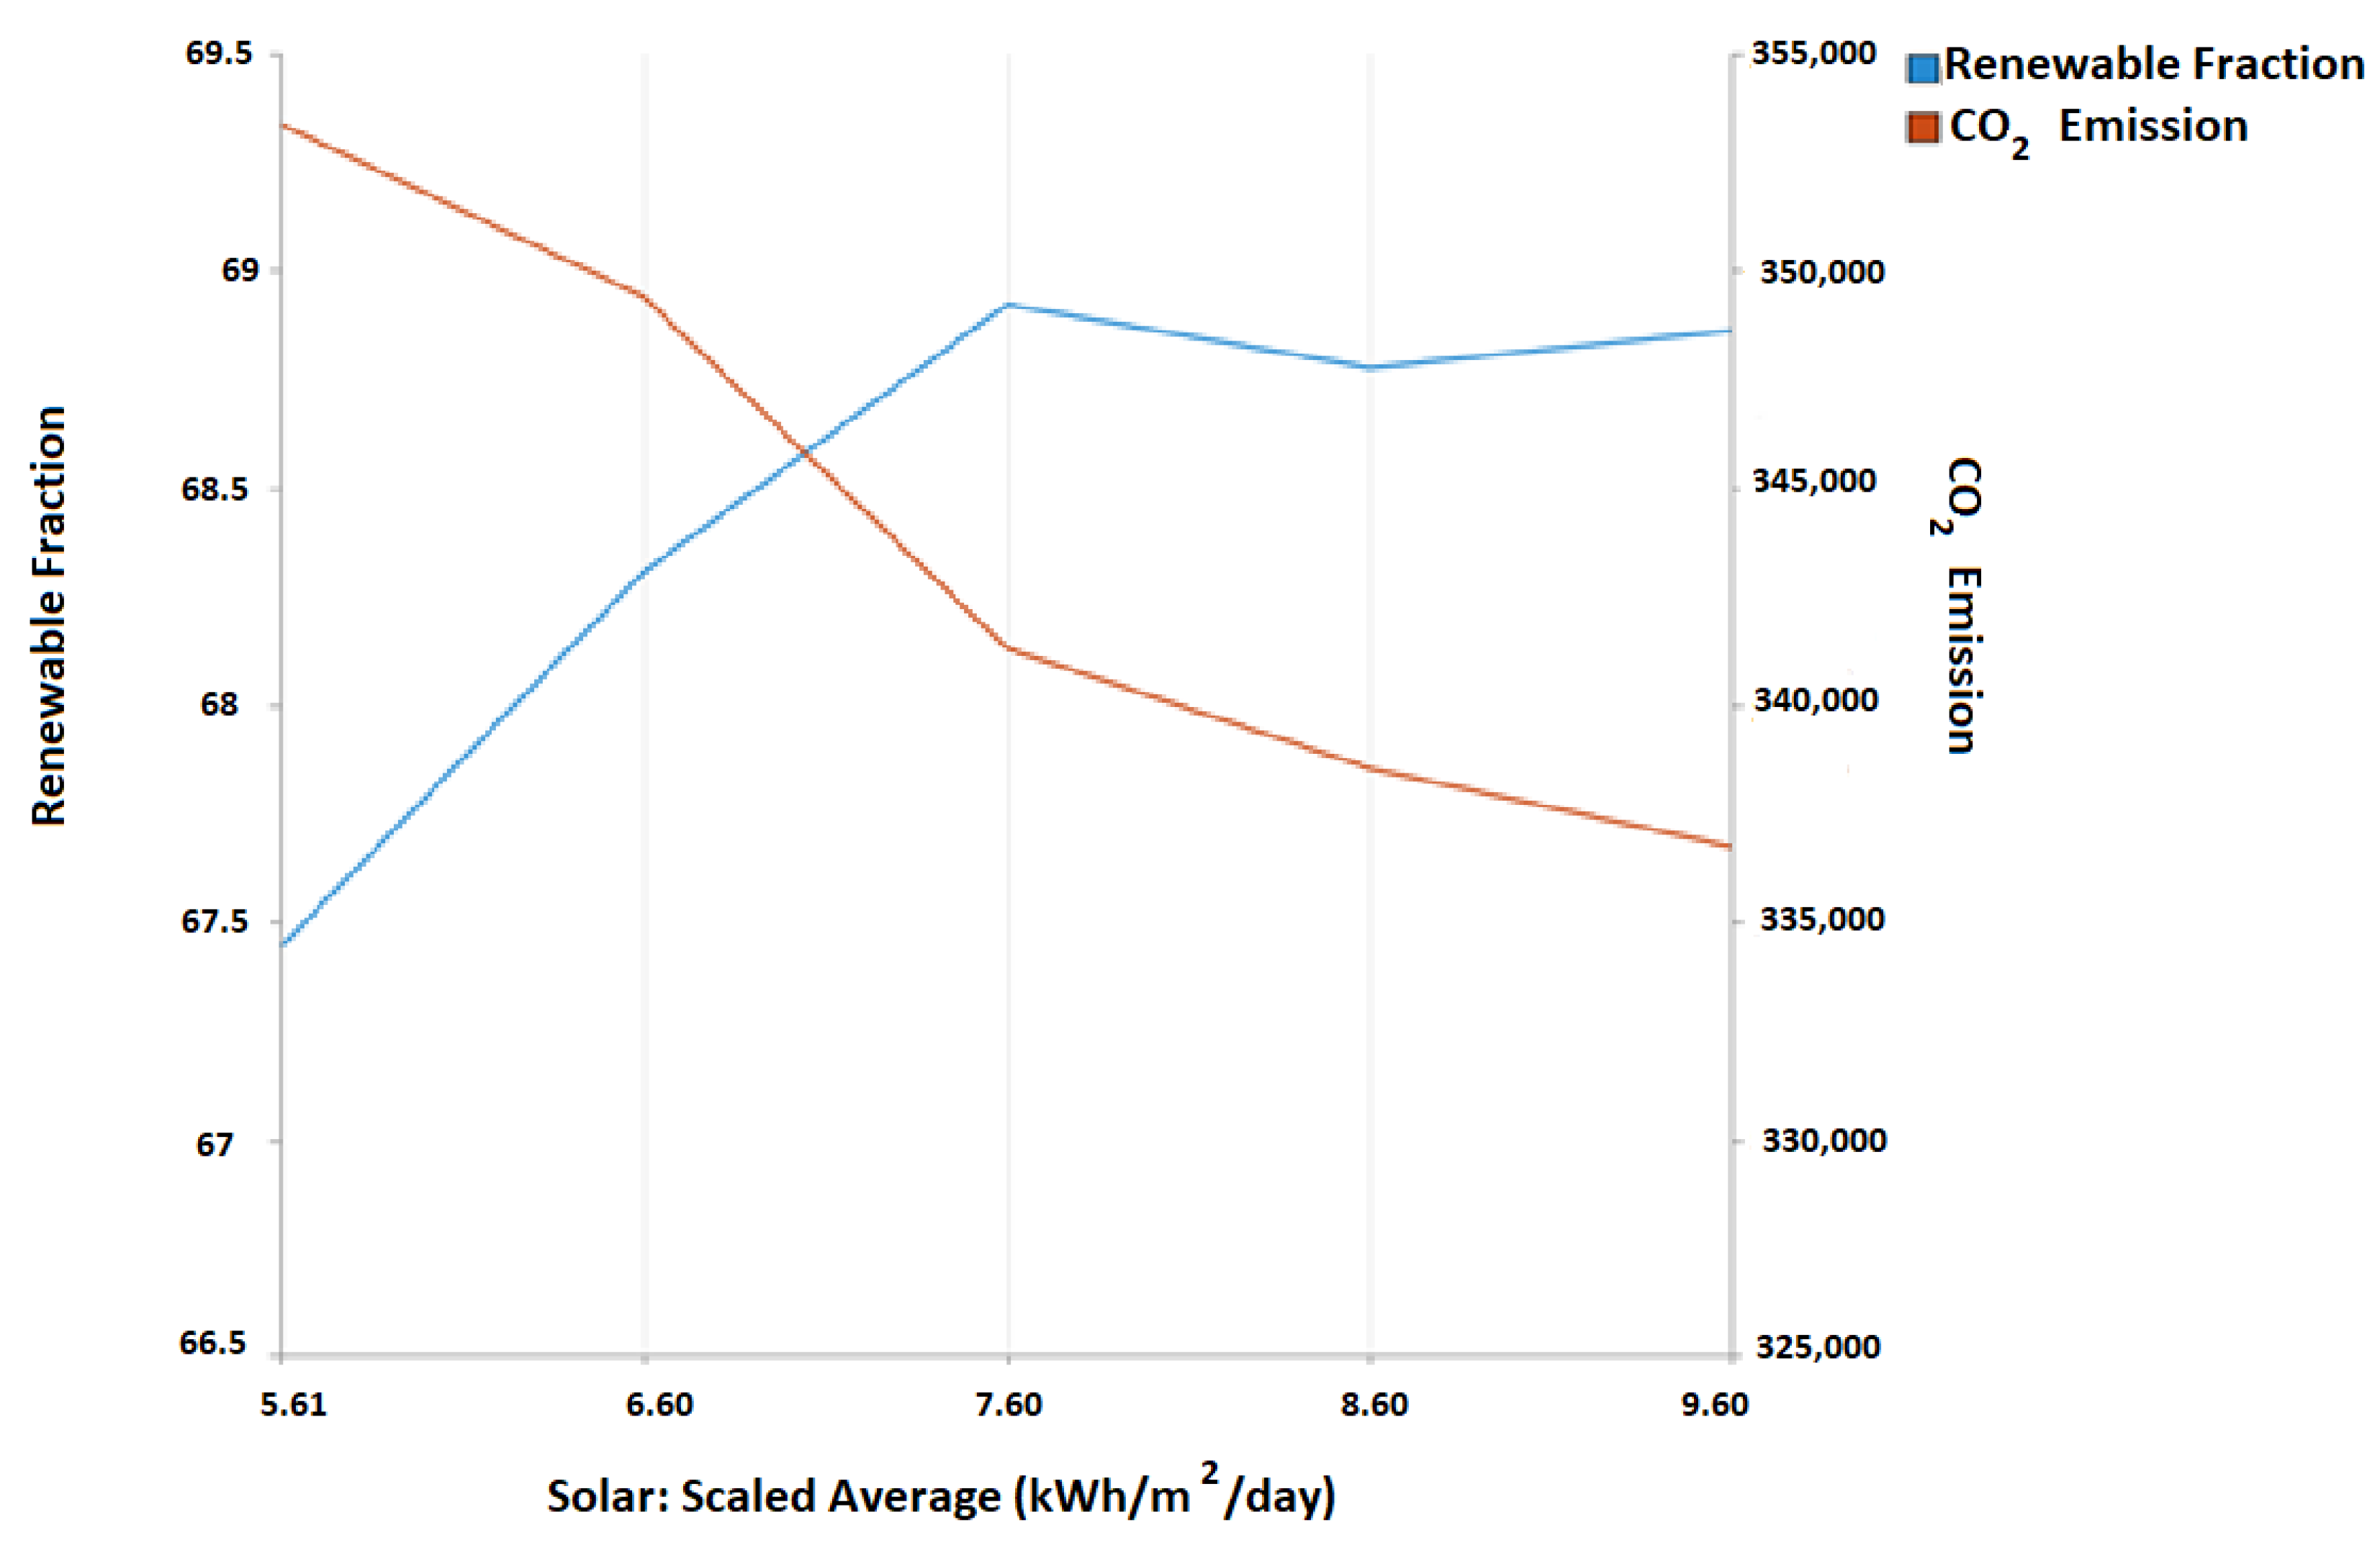
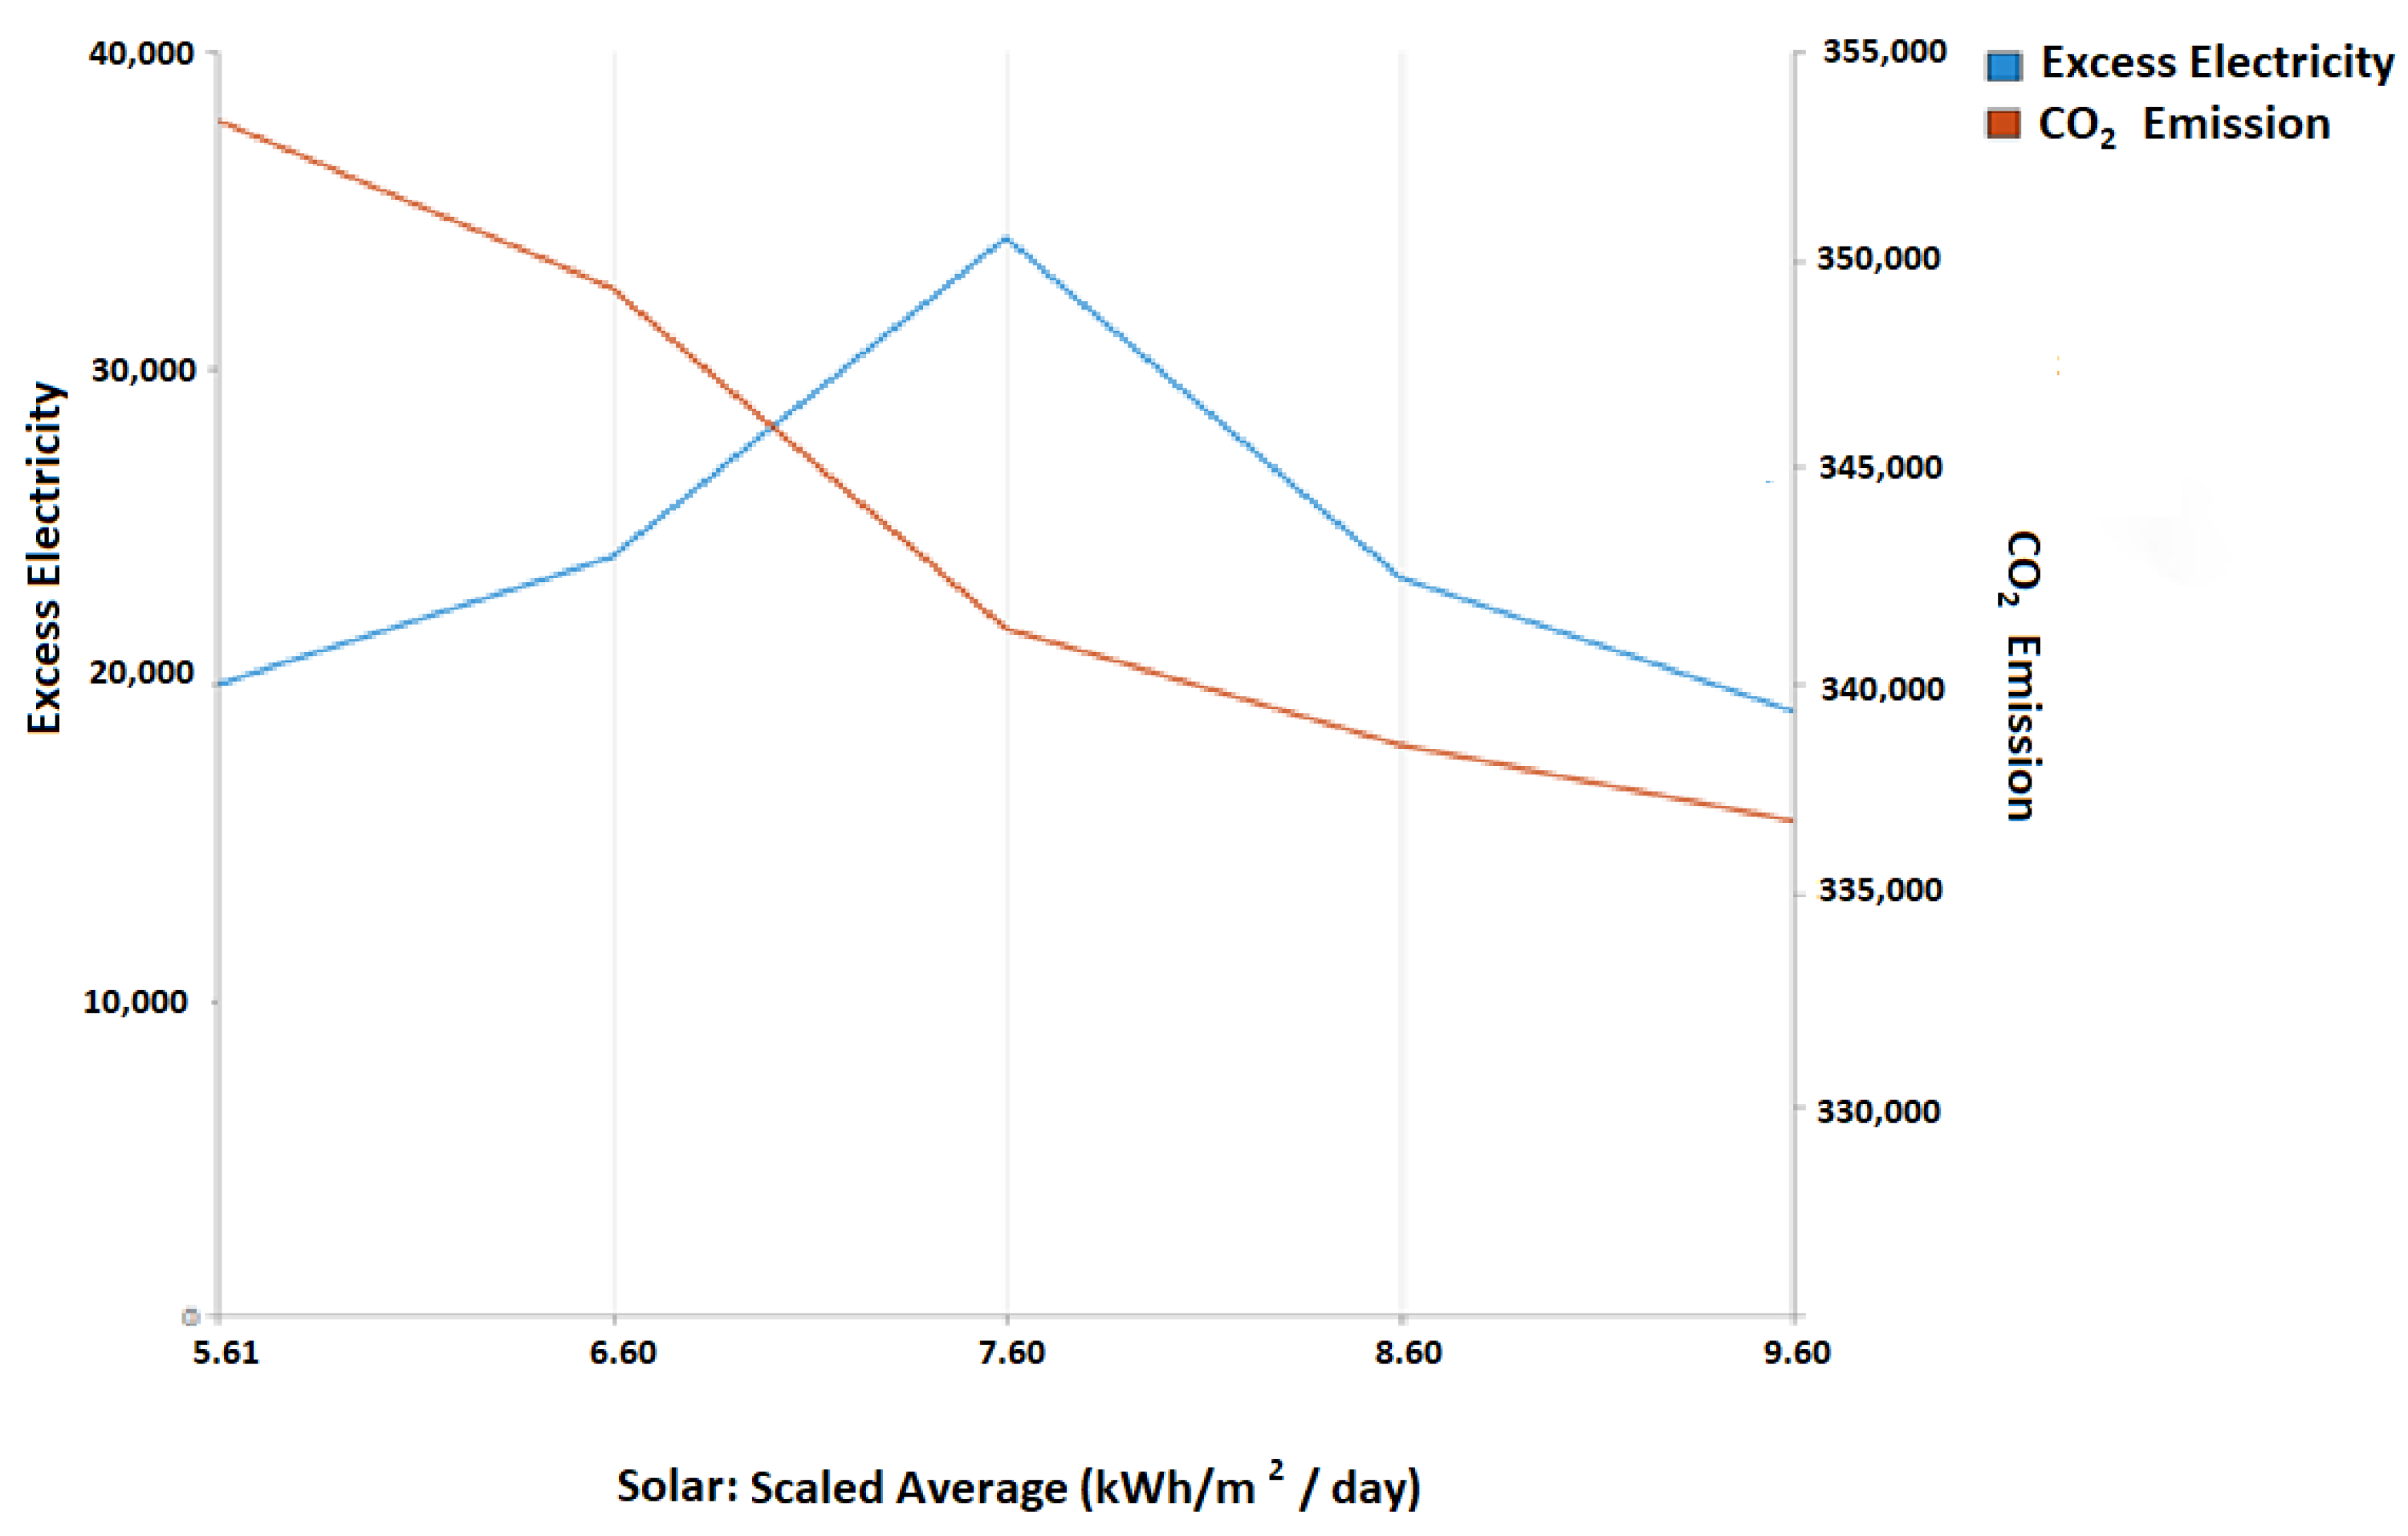
5.4. Sensitivity Analysis

In this section, several optimizations determined using HOMER software for a low-price system are examined, making it easier to understand under which conditions the optimal model can be obtained and the manner in which the results are affected. First, the renewable fraction and NPC were assessed with respect to the average solar radiation. As shown in Figure 10, an increase in solar radiation resulted in an increased renewable fraction and decreased NPC. However, beyond 7.6 kWh/m2/day, the NPC and renewable fraction did not change the overall performance of the system.
In addition, the renewable fraction and CO2 emissions were examined. As can be observed in Figure 11, increased solar radiation resulted in an increased renewable fraction, which played a major role in decreasing the CO2 emissions. Furthermore, surplus electricity was considered because an increased solar radiation would result in increased excess electricity owing to the high PV output power under high solar radiation. Figure 12 shows that CO2 emissions and excess electricity did not change significantly above 7.6 kWh/m2/day solar energy.
The objective of the proposed project was to introduce renewable energy into a commercial area. Based on all previous cases, changing the project location to an area with a considerably higher solar radiation would result in similar performance. Furthermore, the cost of the project is the most important factor from the viewpoint of the investor. In this case, wind turbines can be ignored because wind is not prominent in the area under study, in addition to the role of infrastructure and buildings, especially those in built-up commercial areas, in preventing wind power generation.

6. Conclusions

Since energy crises and environmental problems have raised major concerns for scientists and policymakers around the globe, EVs have high application potential in the automotive sector because they provide green transportation and reduce the sector’s carbon dioxide footprint. Thus, the establishment and deployment of renewable energy resources for the charging of EVs will promote sustainable electricity, enhance system reliability, ensure resource diversity and improve ecological performance. The aim of this study was to conduct a techno-economic analysis of different hybrid systems using HOMER software. Technically, the proposed system including PVs, wind turbines, utility grids and batteries could offer benefits in terms of supplying the load demand, minimizing energy losses and providing surplus electricity (22,006 kWh/year). Economically, the PV–grid system configuration had the lowest energy cost of 0.06581 USD/kWh. The addition of a wind turbine and battery storage system increased the energy cost to 0.06743 USD/kWh. The proposed system had the lowest O&M costs. Carbon credits were also considered because they contributed to the overall profit by approximately 8786.8 USD per year. Environmentally, the proposed system exhibited the highest renewable fraction, providing an annual reduction in all emissions and especially in the case of CO2 emissions by more than 878 tons/year, indicating the positive environmental impact of the system. Sensitivity analysis results showed that an increase in solar radiation would increase electricity generation and the renewable fraction and decrease CO2 emissions. On the other hand, and considering a combined qualitative and quantitative assessment of the study, it can be concluded that the battery–grid–PV system configuration has potential, and the use of wind turbines can be neglected because of the low wind speed and urban buildup in the UAE, preventing wind power generation. From the economic point of view, the study indicated that the best return on investment would be provided by the battery–grid–PV system configuration, with an estimated value of 6.9%, indicating an appropriate business opportunity in the field of energy and transport sectors. Such a configuration also produced 1.4% less pollutants in comparison to the grid–PV system, indicating a more ecofriendly performance configuration. In terms of carbon credits, such a configuration can attain almost 839.12 carbon credits per year, which is a worth value of 8391.2 USD per year. Furthermore, we conducted a sensitivity analysis and observed that a solar radiation level of 7.6 kWh/m2/day would be a threshold beyond which the net present cost and renewable fraction would not change the overall system performance. This conclusion also applies to carbon dioxide emissions, with no significant variation above this value. It can be concluded that the nature of the area under study and the infrastructure of commercial buildings limit the potential of wind energy compared to solar energy and battery deployment.
The study had some limitations due to the lack of real data on EVs’ load profiles in this area or in similar areas, thus requiring the utilization of hypothetical data. In future studies, a dynamic load model that accounts for different types of EVs must be considered, along with different types of EV chargers to realize fast charging. Eventually, variations between residential, educational and industrial sites must be accounted for in future studies.
Some policy implications exist as some cities in the United Arab Emirates have suggested that a specific percentage of parking lots should be allocated for green vehicles. However, there is a mandate for the study presented in this paper as it has been recommended that such cities investigate the optimal configuration for the source of power when charging the EVs. Furthermore, many UAE initiatives have been conducted in order to encourage the use of electric cars, such as DEWA charging stations of electric cards. Therefore, this study can help in installing hybrid systems in all public charging stations, as well as petrol stations, to expedite and enhance the process of charging electric vehicles and help to make the UAE a global model of a green economy.

Author Contributions

Conceptualization, A.S.A.-S. and M.M.; methodology, A.S.A.-S. and M.M.; software, A.A. and N.A.-S.; validation, A.A. and N.A.-S., formal analysis, A.S.A.-S., A.A., N.A.-S., M.M., T.A. and E.H.-F., investigation, A.S.A.-S., M.M., A.A. and N.A.-S.; resources, A.A. and N.A.-S.; data curation, A.A. and N.A.-S.; writing—original draft preparation, A.S.A.-S., A.A. and N.A.-S.; writing—review and editing, A.S.A.-S., M.M., T.A. and E.H.-F.; visualization, A.S.A.-S., A.A. and N.A.-S.; supervision, A.S.A.-S., M.M. and T.A., project administration, A.S.A.-S.; funding acquisition, A.S.A.-S. All authors have read and agreed to the published version of the manuscript.

Funding

This work is supported by Khalifa University under Award No. kkjrc-2019-trans 2 and Research Excellence Award # 8474000427.

Institutional Review Board Statement

Not applicable.

Informed Consent Statement

Not applicable.

Data Availability Statement

The HOMER software has built in databases which allowed to select and simulate all the required components a long with NASA Surface Meteorology and Solar Energy Database which is employed in the software. In addition, the data for electrical tariffs were added using the UAE Statistical Year book data for 2019.

Conflicts of Interest

The authors declare no conflict of interest.

References

  1. Mezher, T.; Goldsmith, D.; Choucri, N. Renewable Energy in Abu Dhabi: Opportunities and Challenges. J. Energy Eng. 2011, 137, 169–176. [Google Scholar] [CrossRef]
  2. Said, Z.; Alshehhi, A.A.; Mehmood, A. Predictions of UAE’s renewable energy mix in 2030. Renew. Energy. 2018, 118, 779–789. [Google Scholar] [CrossRef]
  3. Statistical Yearbook—Energy and Water 2019; Statistics Center: Abu Dhabi, UAE, 2019; pp. 278–289. Available online: https://www.scad.gov.ae/Release%20Documents/Statistical%20Yearbook%20of%20Abu%20Dhabi_2019_Annual_Yearly_en.pdf (accessed on 1 September 2022).
  4. Statistical Yearbook—Environment 2019; Statistics Center: Abu Dhabi, UAE, 2019; pp. 254–277. Available online: https://www.scad.gov.ae/Release%20Documents/Statistical%20Yearbook%20of%20Abu%20Dhabi_2019_Annual_Yearly_en.pdf (accessed on 1 September 2022).
  5. Shareef, S.; Altan, H. Assessing the Implementation of Renewable Energy Policy within the UAE by Adopting the Australian ‘Solar Town’ Program. Future Cities and Environ. 2019, 5, 1–11. [Google Scholar] [CrossRef]
  6. Belasri, D.; Sowunmi, A.; Bastidas-Oyanedel, J.R.; Amaya, C.; Schmidt, J.E. Prospecting of renewable energy technologies for the Emirate of Abu Dhabi: A techno-economic analysis. Prog. Ind. Ecol. Int. J. 2016, 10, 301–318. [Google Scholar] [CrossRef]
  7. Dubai Autonomous Transportation Strategy—The Official Portal of the UAE Government. Available online: https://u.ae/en/about-the-uae/strategies-initiatives-and-awards/local-governments-strategies-and-plans/dubai-autonomous-transportation-strategy (accessed on 1 September 2022).
  8. Sayed, K.; Abo-Khalil, A.G.; Alghamdi, A.S. Optimum Resilient Operation and Control DC Microgrid Based Electric Vehicles Charging Station Powered by Renewable Energy Sources. Energies 2019, 12, 4240. [Google Scholar] [CrossRef]
  9. Abronzini, U.; Attaianese, C.; D’Arpino, M.; Di Monaco, M.; Genovese, A.; Pede, G.; Tomasso, G. Multi-source power converter system for EV charging station with integrated ESS. In Proceedings of the 2015 IEEE 1st International Forum on Research and Technologies for Society and Industry Leveraging a better tomorrow (RTSI), Torino, Italy, 16–18 September 2015. [Google Scholar]
  10. Yao, J.; Zhang, Y.; Yan, Z.; Li, L. A Group Approach of Smart Hybrid Poles with Renewable Energy, Street Lighting and EV Charging Based on DC Micro-Grid. Energies 2018, 11, 3445. [Google Scholar] [CrossRef]
  11. Nizam, M.; Wicaksono, F.X.R. Design and Optimization of Solar, Wind, and Distributed Energy Resource (DER) Hybrid Power Plant for Electric Vehicle (EV) Charging Station in Rural Area. In Proceedings of the 2018 5th International Conference on Electric Vehicular Technology (ICEVT), Surakarta, Indonesia, 30–31 October 2018. [Google Scholar]
  12. Takahashi, K.; Masrur, H.; Nakadomari, A.; Narayanan, K.; Takahashi, H.; Senjyu, T. Optimal Sizing of a Microgrid System with EV Charging Station in Park & Ride Facility. In Proceedings of the 2020 12th IEEE PES Asia-Pacific Power and Energy Engineering Conference (APPEEC), Nanging, China, 20–23 September 2020. [Google Scholar]
  13. Luo, C.; Huang, Y.-F.; Gupta, V. Stochastic Dynamic Pricing for EV Charging Stations with Renewable Integration and Energy Storage. IEEE Trans. Smart Grid 2018, 9, 1494–1505. [Google Scholar] [CrossRef]
  14. Zhou, S.; Qiu, Y.; Zou, F.; He, D.; Yu, P.; Du, J.; Luo, X.; Wang, C.; Wu, Z.; Gu, W. Dynamic EV Charging Pricing Methodology for Facilitating Renewable Energy with Consideration of Highway Traffic Flow. IEEE Access 2020, 8, 13161–13178. [Google Scholar] [CrossRef]
  15. Caruso, M.; Di Tommaso, A.O.; Imburgia, A.; Longo, M.; Miceli, R.; Romano, P.; Salvo, G.; Schettino, G.; Spataro, C.; Viola, F. Economic Evaluation of PV System for EV Charging Stations: Comparison between matching Maximum Orientation and Storage System Employment. In Proceedings of the 5th International Conference on Renewable Energy Research and Applications (ICRERA), Birmingham, UK, 20–23 November 2016. [Google Scholar] [CrossRef]
  16. Sriboon, T.; Sangsritorn, S.; Tuohy, P.G.; Sharma, M.K.; Leeprechanon, N. Simulation and analysis of renewable energy resource integration for electric vehicle charging stations in Thailand. In Proceedings of the 2016 International Conference on Cogeneration, Small Power Plants and District Energy (ICUE), Bangkok, Thailand, 14–16 September 2016. [Google Scholar]
  17. Kabir, M.E.; Assi, C.; Tushar, M.H.K.; Yan, J. Optimal Scheduling of EV Charging at a Solar Power-Based Charging Station. IEEE Syst. J. 2020, 14, 4221–4231. [Google Scholar] [CrossRef]
  18. Wu, D.; Zeng, H.; Lu, C.; Boulet, B. Two-stage energy management for office buildings with workplace EV charging and renewable energy. IEEE Trans. Transp. Electrif. 2017, 3, 225–237. [Google Scholar] [CrossRef]
  19. Gong, L.; Cao, W.; Liu, K.; Yu, Y.; Zhao, J. Demand responsive charging strategy of electric vehicles to mitigate the volatility of renewable energy sources. Renew. Energy 2020, 156, 665–676. [Google Scholar] [CrossRef]
  20. Lu, X.; Liu, N.; Chen, Q.; Zhang, J. Multi-objective optimal scheduling of a DC micro-grid consisted of PV system and EV charging station. In Proceedings of the IEEE ISGT Innovative Smart Grid Technologies, Washington, DC, USA, 19–22 February 2014. [Google Scholar]
  21. Verma, A.; Singh, B. Control of Renewable Energy Integrated EV Charging Station with Seamless Connection to Grid and DG Set. In Proceedings of the 2020 IEEE 5th International Conference on Computing Communication and Automation (ICCCA), Greater Noida, India, 30–31 October 2020. [Google Scholar]
  22. Akil, M.; Dokur, E.; Bayindir, R. Energy Management for EV Charging Based on Solar Energy in an Industrial Microgrid. In Proceedings of the 2020 9th International Conference on Renewable Energy Research and Application (ICRERA), Glasgow, UK, 27–30 September 2020. [Google Scholar]
  23. Zhou, Y.; Kumar, R.; Tang, S. Incentive-Based Distributed Scheduling of Electric Vehicle Charging Under Uncertainty. IEEE Trans. Power Syst. 2019, 34, 3–11. [Google Scholar] [CrossRef]
  24. Novotny, V.; Dobes, J.; Hrabal, D. Implementing large scale electromobility infrastructure as a profitable virtual electricity storage plant: A case study, system ALISE. In Proceedings of the 2018 Smart City Symposium Prague (SCSP), Prague, Czech Republic, 24–25 May 2018. [Google Scholar]
  25. Teng, F.; Ding, Z.; Hu, Z.; Sarikprueck, P. Technical Review on Advanced Approaches for Electric Vehicle Charging Demand Management, Part I: Applications in Electric Power Market and Renewable Energy Integration. IEEE Trans. Ind. Appl. 2020, 56, 5684–5694. [Google Scholar] [CrossRef]
  26. Gunkel, P.A.; Faust, F.J.; Skytte, K.; Bergaentzle, C. The Impact of EV Charging Schemes on the Nordic Energy System. In Proceedings of the 2019 16th International Conference on the European Energy Market (EEM), Ljubljana, Slovenia, 18–20 September 2019. [Google Scholar]
  27. Coria, G.E.; Sanchez, A.M.; Al-Sumaiti, A.S.; Rattá, G.A.; Rivera, S.R.; Romero, A.A. A Framework for Determining a Prediction-Of-Use Tariff Aimed at Coordinating Aggregators of Plug-In Electric Vehicles. Energies 2019, 12, 4487. [Google Scholar] [CrossRef]
  28. Harsh, P.; Das, D. Optimal coordination strategy of demand response and electric vehicle aggregators for the energy management of recon-figured grid-connected microgrid. Renew. Sustain. Energy Rev. 2022, 160, 112251. [Google Scholar] [CrossRef]
  29. Liu, C.; Liu, Y. Energy Management Strategy for Plug-In Hybrid Electric Vehicles Based on Driving Condition Recognition: A Review. Electronics 2022, 11, 342. [Google Scholar] [CrossRef]
  30. Casella, V.; Valderrama, D.F.; Ferro, G.; Minciardi, R.; Paolucci, M.; Parodi, L.; Robba, M. Towards the Integration of Sustainable Transportation and Smart Grids: A Review on Electric Vehicles’ Management. Energies 2022, 15, 4020. [Google Scholar] [CrossRef]
  31. Zhao, S.; Li, K.; Yang, Z.; Xu, X.; Zhang, N. A new power system active rescheduling method considering the dispatchable plug-in electric vehicles and intermittent renewable energies. Appl. Energy 2022, 314, 118715. [Google Scholar] [CrossRef]
  32. Ouramdane, O.; Elbouchikhi, E.; Amirat, Y.; Le Gall, F.; Sedgh Gooya, E. Home Energy Management Considering Renewable Resources, Energy Storage, and an Electric Vehicle as a Backup. Energies 2022, 15, 2830. [Google Scholar] [CrossRef]
  33. Ali, F.; Ahmar, M.; Jiang, Y.; AlAhmad, M. A techno-economic assessment of hybrid energy systems in rural Pakistan. Energy 2021, 215, 119103. [Google Scholar] [CrossRef]
  34. HOMER Pro Information, HOMER Pro—Microgrid Software for Designing Optimized Hybrid Microgrids. Available online: https://www.homerenergy.com/products/pro/index.html (accessed on 1 September 2022).
  35. Abu Dhabi Population 2020, Abu Dhabi Population 2020 (Demographics, Maps, Graphs). Available online: https://worldpopulationreview.com/world-cities/abu-dhabi-population (accessed on 1 September 2022).
  36. Razmjoo, A.; Kaigutha, L.G.; Rad, M.V.; Marzband, M.; Davarpanah, A.; Denai, M. A technical analysis investi-gating energy sustainability utilizing reliable renewable energy sources to reduce CO2 emissions in a high potential area. Renew. Energy 2021, 164, 46–57. [Google Scholar] [CrossRef]
  37. Rinaldi, F.; Moghaddampoor, F.; Najafi, B.; Marchesi, R. Economic feasibility analysis and optimization of hybrid renewable energy systems for rural electrification in Peru. Clean Technol. Environ. Policy 2020, 23, 731–748. [Google Scholar] [CrossRef]
  38. HOMER Energy, HOMER Help Manual. Available online: https://www.homerenergy.com/pdf/HOMER2_2.8_HelpManual.pdf (accessed on 1 September 2022).
  39. Al-Sumaiti, A.S. The role of regulation in the economic evaluation of renewable energy investments in developing countries. In Proceedings of the 2013 7th IEEE GCC Conference and Exhibition (GCC), Doha, Qatar, 17–20 November 2013. [Google Scholar]
  40. Barros, R.M.; Filho, G.L.T. Small hydropower and carbon credits revenue for an SHP project in national isolated and interconnected systems in Brazil. Renew. Energy 2012, 48, 27–34. [Google Scholar] [CrossRef]
  41. Wisions.net. 2020. Available online: https://www.wisions.net/files/uploads/SEPS_GHG_Baseline_Calculation.pdf (accessed on 30 November 2020).
Figure 1. Map of Yas Island.
Energies 15 06621 g001
Figure 2. Daily radiation amount at Yas Island.
Energies 15 06621 g002
Figure 3. Average wind speed at Yas Island.
Energies 15 06621 g003
Figure 4. Daily (top), seasonal (middle) and annual (bottom) load profiles for Yas Island.
Energies 15 06621 g004
Figure 5. Schematic of the proposed system.
Energies 15 06621 g005
Figure 6. Structure of the proposed hybrid system.
Energies 15 06621 g006
Figure 7. Monthly electric production of the various system configurations.
Energies 15 06621 g007
Figure 8. Projected costs for each scenario.
Energies 15 06621 g008
Figure 9. Reduction in carbon dioxide emissions per year.
Energies 15 06621 g009
Figure 10. Sensitivity analysis of the renewable fraction and NPC based on average solar radiation.
Energies 15 06621 g010
Figure 11. Sensitivity analysis of renewable fraction and CO2 emissions based on average solar radiation.
Energies 15 06621 g011
Figure 12. Sensitivity analysis for excess electricity and CO2 emissions based on average solar radiation.
Energies 15 06621 g012
Table 1. Summary of previous approaches dedicated to EV charging research.
Ref.YearPlaceObjectiveAlgorithm/SoftwareResultsGaps
[20]2014ChinaOptimal scheduling of a DC microgrid integrated with RESs for EVC stationsNSGA-II (1) Reducing the cost of electricity purchase;
(2) enhancing energy circulation
No environmental analysis
[9]2015-(1) EV charging system optimal sizing charging system via power flow control,
(2) cost–benefit analysis
Numerical methodMATLAB/Simulink(1) Enhanced charging system performance;
(2) capital costs reduction
(1) No detailed economic analalysis;
(2) no environmental analysis
[15]2016ItalyReducing the impact of EVC in universitiesExamining 2 configurations based on panel orientations and the usage of storage systemsSystem with directional PV is better from an economic perspectiveNo environmental analysis
[16]2016ThailandOptimizing system performance of renewable energy system supplying energy to EVC stationsMERIT simulation programPotential in meeting load demand and informing on capital cost and surplus energyNo environmental analysis
[18]2017-Employs office buildings and workplaces for EVCTwo algorithms to meet EVC demand and obtain annual cost reductions.(1) Computationally efficient;
(2) suitable for real-time operation;
(3) average cost reductions of 7.2% and 6.9%
No environmental analysis
[10]2018ChinaCharging EV and streetlights via a group of smart hybrid polesEfficiency model High efficiency and power output(1) No financial assessment;
(2) no environmental analysis
[11]2018IndonesiaOptimal sizing of hybrid power for EV chargingHOMER software(1) Optimal configuration for different systems;
(2) cost reductions
(1) No environmental analysis;
(2) no detailed economic analysis (only operating, net present and initial capital costs)
[13]2018ChinaGuidelines for charging service providers for proper charging prices and electricity management2 algorithms:
(1) stochastic dynamic programming;
(2) greedy algorithm (benchmark)
SDP can achieve up to 7% profit gainNo environmental analysis
[23]2019-Optimization model for EV chargingMATLABMeets EVC requirements and minimizes electricity costNo environmental analysis
[8]2019EgyptEMS to control power flow from RESs to EVsMATLAB/SimulinkGood results in terms of electrical performance and meeting load demand(1) No financial assessment;
(2) no environmental analysis
[26]2019DenmarkEffect of integrating RES with EVC systemBalmorel model(1) Meeting load demand;
(2) reducing CO2 emissions;
(3) cutting system costs
No detailed environmental analysis (CO2 only).
[14]2020ChinaPricing method considering charging facility service ratio, traffic flow and RES generation in wealthy areasPricing methodology(1) Reducing traffic jams;
(2) facilitating renewable consumption;
(3) balancing traffic flow
(1) No financial assessment;
(2) no environmental analysis
[12]2020JapanPriority charging to control EV charging (EVC) station in park and ride areasMixed-integer linear programmingHigh reduction in equipment costs (1) No financial assessment;
(2) no environmental analysis
[17]2020-Minimizing charging price per EVInteger linear programming-based centralized systemFaster charging at lowest possible priceNo environmental analysis
[19]2020ChinaEVC strategy to improve power consumption and reduce charging costOptimizationCharging cost of EVs can be reducedNo environmental analysis
[21]2020IndiaDesign for EVC stations in homes Control algorithmOperation of charging station is achieved in all modes (1) No financial assessment;
(2) no environmental analysis
[22]2020TurkeyEMS for EVC installed in industrial areasMonte Carlo simulationDemands of EVCs can be met in different time periods(1) No financial assessment;
(2) no environmental analysis
[32]2022FranceHome energy managementMatlabAdvantages for the integration of EVs, covering aspects of optimal sizing, energy autonomy and limiting grid power supplyNo coverage of commercial sector
Current Study-UAEOptimal sizing of EVC via RESsHOMER software(1) Meeting load demand;
(2) increasing RES capacity;
(3) cost-effective system;
(4) reducing ecological damage and GHG emissions;
(5) carbon credits contributing to system revenue
Table 2. Technical information regarding the load profile.
Average (kWh/Day)Average (kW)Peak (kW)Load FactorAverage Energy per Month (kWh)
3175132.29297.930.4446,646
Table 3. Characteristics of the components used in the study.
ComponentModelCapital Cost (USD)Maintenance Cost (USD/Year)Rated CapacityLifetime (Years)
PV Generic15001020,000 kW25
Battery Lead Acid300101 kWh15
Wind Turbine Generic50,00050010 kW25
Converter Generic300101 kW15
Table 4. Electricity generation with the selected hybrid system configurations for EV charging in a commercial area.
Supplementary SystemRenewable SystemGrid (kW/Year)Battery (kWh/Year)PV (kWh/Year)WT (kWh/Year)Excess Power
(kWh/Year)
Grid PV559,125-1,239,158-19,974
Battery–Grid PV562,11611,211,268-22,122
Grid PV–WT554,093-1,229,75511,04120,376
Battery–Grid PV–WT551,26011,257,18511,04122,006
Battery–Grid WT1,147,8349-11,0410
Table 5. Economic assessments of the considered scenarios.
Hybrid SystemBattery (kWh)PV (kW)Converter (kW)WT (Unit)Initial Investment (USD)Operating Cost (USD)COE (USD/kWh)NPC (USD)RF (%)
Grid–PV -709515-1.22 M18,810.220.065811,461,13867.4
Battery–Grid–PV 1693497-1.19 M21,187.810.066891,463,04666.8
Grid–PV–WT -70450911.26 M19,451.800.068141,509,81267.7
Battery–Grid–PV–WT 371951811.29 M17,609.360.067431,513,06668.2
Battery–Grid–WT 9-1.10153,031150,525.900.13341,998,9570.953
Table 6. Comparison of the GHG emissions produced by each hybrid system.
Hybrid SystemCarbon Dioxide (Kg/Year)Carbon Monoxide (Kg/Year)Unburned Hydrocarbons (Kg/Year)Particulate Matter (Kg/Year)Sulfur Dioxide (Kg/Year)Nitrogen Oxides (Kg/Year)
Grid732,40900031751553
Grid–PV353,3670001532749
Battery–Grid–PV355,2570001540753
Grid–PV–WT350,1870001518742
Battery–Grid–PV–WT348,3960001510739
Battery–Grid–WT725,43100031451538
Table 7. Carbon credit analysis.
Hybrid SystemAnnual Electricity Output (MWh/Year)Carbon Dioxide Emissions (Tons/Year)Annual Base Line Emissions (Tons)Carbon Credits per Year (Tons)Carbon Credits per Year (USD)
Grid–PV1798.28389.521248.006858.488584.8
Battery–Grid–PV1773.38391.6031230.72839.128391.2
Grid–PV–WT1794.89386.0151245.65859.638596.3
Battery–Grid–PV–WT1819.49384.0411262.72878.688786.8
Battery–Grid–WT1158.87799.651804.254.6046.04
Publisher’s Note: MDPI stays neutral with regard to jurisdictional claims in published maps and institutional affiliations.

