1. Introduction
Capacity planning is a vital and complex aspect in the process of seaport development. If the capacity of the port is significantly greater than the demand for port services, this can result in inefficient use of the port infrastructure and superstructure and thus more expensive port services. On the other hand, when the demand for port services is greater than the port capacity, then the time of ship and cargo handling is longer, and congestion in the port is inevitable. In turn, this increases the delivery costs and losses of cargo receivers. The point is that port services cannot be stored. Therefore, the supply of port services is determined by the port transshipment capacity. This is why an increase in their volume is incremental and requires investments that are cost and time-consuming.
Moreover, investment in port infrastructure requires considerable time to be accomplished and has an extremely long economic life and a long payback period. Therefore, to avoid the consequences of the poor adjustment of port supply and demand and to create a basis for determining the amount of supply, it is necessary to predict the demand for port services [
1]. Before making any decisions about increasing port capacity, the long-term demand for port facilities and services must be determined. It is necessary to prepare port cargo transshipment forecasts.
Determining the level of long-term demand for port facilities and services is required for port master/development plans, and/or investment project evaluations, and/or the evaluation of investment alternatives. While planning investment, the challenge is optimising capacity whereby port facilities and services are provided at the appropriate service time and cost level [
2].
In the port industry, throughput is a product, and the creation of capacity is an investment. Port investment results in a potential throughput increase, which is achieved where there is demand for it.
As elaborated in one study [
3], an investment in a port infrastructure or superstructure, regardless of who the port authority or the port operators are, normally affects an increase in throughput both in total and per unit of time, as well as an improvement in the level of service in terms of quantity and quality. This reduces the operating and time costs of the port service (i.e., generalised cost) and causes throughput to increase by a growth rate that is directly related to the degree of competition that exists on the market of the port services. Port investors (port authority and/or port operators) increase profits due to cost reduction and increased volume of transshipments. Cutting the generalised cost in ports causes a decrease in the generalised cost in the whole transport chain, both for carriers using the port and its representatives.
This triggers within the transport industry the same kinds of effects: lower costs, higher volumes, and higher profits. Furthermore, such a mechanism is also seen for shippers (and possibly for intermediate operators, such as logistics operators, forwarders, etc.), Lower generalised costs cause both volumes and profit to rise. The final beneficiaries of the lowered prices for transported goods are eventually the final consumers [
3].
Port capacity is a measure of the maximum throughput in tonnes, TEU, or the number of vessels that a port and its terminals can service over a given period, while the port throughput reflects the actual amount of cargo or the number of vessels handled over time. Capacity utilisation is the ratio between the actual throughput and the designed capacity and is expressed as a percentage. While the (theoretical) design capacity is defined as the maximum technically possible utilisation rate that can be achieved with existing port resources and facilities, e.g., infrastructure, equipment, labour, technology, etc., then effective (commercial) capacity indicates maximum capacity that can be reached at the quality of service acceptable for most customers, for instance, by incorporating a general acceptable level of congestion. The maximum capacity that each port or terminal can achieve under these arrangements in terms of the faster turnaround time of a ship is described as the commercial capacity [
2].
One of the key drivers behind utilisation is, therefore, throughput and, as such, rising freight volumes carried on larger vessels. Terminal performance is affected not only by a disrupted arrival pattern of ships, but also by how quickly cargo is removed from a terminal. Increasing dwell times put pressure on spatial yard capacity and land-side delivery, and collection peaks create disruptions in the workload planning at terminals [
4]. As the capacity utilisation rate is above a certain level (in container handling, according to the rule of thumb, the container terminal starts to become congested when its capacity utilisation exceeds 70%), maintaining the performance and quality of transshipment operations, and keeping the turn-around time of the ships at an acceptable level, encounters problems [
5]. Port operations are provided at higher costs, and the service time lasts longer. This is attributed to port congestion, and it is especially relevant to containers, whereas in such conditions, the dynamics of container flows slow down.
Regarding the terminology for classifying seaports and port systems, it is worth highlighting that there is no universally accepted terminology, both in theory and in practice. For example, smaller ports are often described in the literature as small and medium-sized, secondary, minor, peripheral, local, regional, or feeder ports, while larger ports are often named major, large, primary, or hub ports, as well as loading centers or gateways [
6]. For the purposes of this article, smaller ports are referred to as minor or small and medium-sized ports (SMPs) and are defined as ports that are not as large in size, throughput volumes, or capacity as major seaports. A port system can be defined as a system of two or more ports found in proximity within a given area; however, port system delimitation and delineation are quite complex and the subject of advances in research [
7]. Nevertheless, we adopt the view that the port system consists of major (gateway) and minor (smaller) ports competing for the same hinterland.
The scale and scope of port activity are a main property that makes key differences between minor and major ports. What is specific for major ports is that they accommodate large oceangoing vessels and are able to obtain high cargo throughput, while serving a vast hinterland that is mostly international. In turn, small seaports handle smaller vessels, usually in short- and medium-range shipping, have smaller and typically more diversified cargo throughput, and serve their regional hinterland. The major ports face major problems manifested in increased transport congestion and insufficient land resources for expansion. However, in smaller ports, transport congestion is less critical and land resources are typically more considerable [
8]. In general, problems in smaller ports’ functioning and development are rarely investigated, although studies on their role in circular and in biomass supply chains [
9,
10], as well as studies concerning efficiency of container operations [
11], positioning in the network [
12], their competitiveness and connectivity [
13], and their economic importance for regional economy [
14] are advancing.
Numerous studies on port system development exist and, according to a recent review [
7], research dimensions can be classified as follows:
Container traffic volumes and related market shares within the given port systems; measurement of container concentration or inequality with the use of the Gini coefficient (including Lorenz curves and Gini decomposition analysis) and the Herfindahl–Hirschman Index (HHI);
Analysis of complementarity vs. substitutability between ports. Here, the focus is on assessing whether nodes of the same port system act as substitutes to each other (implying competition) or complements (pointing to a high level of interdependence among the nodes);
Traffic-forecasting studies which deploy time series analysis and more advanced forecasting methods to develop scenarios and prognoses for the future traffic volumes and related market shares of nodes in a port system.
According to Hayuth [
15], the port system dynamics feature concentration and, when it eventually reaches its limits, they invert into the process of de-concentration. As a port system develops, diseconomies of scale in some large loading centres appear in the form of insufficient space for expansion and port congestion. This encourages smaller ports or even new ports to attract cargo. The phenomenon is referred to as the peripheral port challenge and refers to the last fifth phase of the Hayuth model [
16].
In the research [
17], the concentration and de-concentration processes on the examples of two-port systems found in the Rhine–Scheldt Delta port cluster and the port system found in the West Mediterranean port range were investigated. Both port systems consist of several small and medium-sized ports, as well as major ports. It is argued that de-concentration within a port system occurs when some of the cargo is shifted from major ports to smaller and new ports or when the big loading centres only absorb a small part of the container traffic growth in the whole port system.
Seaports are becoming increasingly interrelated with other ports and inland ports. The question arises about finding the right balance between competition and cooperation to achieve a sustainable competitive advantage for both the individual load centres in a port system and the system.
Feng and Notteboom [
18] examined the empirical case of Yingkou port in the logistics system of the Bohai Sea of China, which places Yingkou port into a more competitive position in contrast to the dominant ports in that area. Academics conclude that small and medium-sized ports (SMPs) often look for cost advantage in specific niche markets. They might also secure growth by serving the dominant ports in a multi-port gateway region. Such a strategy demands close cooperation between ports.
In another work [
19], the role of SMPs in the multi-gateway region of northeast China was studied in the context of five variables: (a) the handled cargo volume and market share; (b) the international connectivity; (c) a cluster’s relative position; (d) the port city and hinterland connections; and (e) the logistics and distribution function. They introduced the Herfindahl–Hirschman Index (HHI index) to measure the market concentration of the multi-port region and elaborate with historical data their position changes in the relevant port system. In conclusion, they say that SMPs develop independently, which requires ports to find their specific competitive advantage or cooperate when they seek cooperation with larger neighbouring ports.
In research on the phenomenon of the dynamics of the port system and evolution patterns, minor ports were found to be instrumental to the peripheral port challenge and thus to the de-concentration of the port system.
In another research [
20], the port system located in the Pearl River Delta (PRD) with hub and peripheral ports were studied to reveal system dynamics. Scholars analysed 25 container ports in the region and used historical data from between 1970 and 2007 on container throughputs and capacity and introduced the Gini coefficient to assess the changes in concentration level of container traffic in the port system. With the use of an econometric model, they estimated container traffic and compared it with past traffic development. As claimed, since 1997, the development of the container port system in the PRD has stepped into the phase of the peripheral challenge, and the challenge is mainly between the Hong Kong and Shenzhen ports.
In further studies, e.g., [
21,
22,
23], deconcentrating patterns in port systems are investigated under the assumption that the peripheral port challenge is an inherent ingredient of the development of contemporary port systems. It is argued that de-concentration within a port system occurs when some of the cargo is shifted from large to smaller ports or when the large load centres only absorb a small portion of the container traffic growth in the whole port system.
The above studies concentrate on ex-post port system evolution and thereafter the tendencies revealed in the past are evaluated in view of concentration or de-concentration of the multi-port formations; some recommendations for port policy are also contemplated.
Yet, studies focused on the ex-ante evolution of port systems remain under-researched. Its assessment requires prediction of freight flows in the port system, which is a challenging task. It becomes more complex if we consider interactions between ports and the future cargo flow shifts among ports, while these issues remain poorly recognised in academic work.
The objective of the paper is to investigate the future evolution of port systems considering the development of major and minor ports, inter-port competition, and feasible cargo shifts resulting from improved capacity or congestion faced by ports. The literature review on port system dynamics indicates that the relationships that emerge between major and minor ports located in each range stem from competition and cooperation. However, we argue that there are essential ports that play a predominant role in shaping these relationships, while inter-port relations in the system are based on competition.
With the use of transshipment forecasts, existing and emerging interdependencies among major and minor ports in the system, and capacity development and/or changes in the level of capacity utilisation, the ex-ante dynamics of the port system are evaluated. The subject of investigation is two port systems, namely, the Polish port system and the Rhine–Scheldt Delta port system. We investigate the future dynamics in each port system and find that the evolution pattern has different features if the minor ports improve capacity or challenge the major ports by offering free capacity.
This paper thus contributes to studies on multi-port formations through the ex-ante evolution of the port system and provides new insights on the peripheral port challenge phenomenon.
The remainder of this paper is organised as follows.
Section 2 provides a comprehensive review of research on long-term demand forecasting in ports.
Section 3 and
Section 4 include a quantitative analysis of demand prediction, considering major and minor ports, developments of capacity, and feasible inter-port shifts of cargo flows. The investigation concerns the Polish port system and the Rhine–Scheldt Delta port system. In
Section 5, we discuss lessons to be learnt, while conclusions are made in
Section 6.
2. Review of Selected Port Transshipment Prognostic Studies
From the perspective of the public investor (port authorities), the main aspects of port planning and development are as follows [
24]:
Demand forecasting for port facilities and services defines the long-term direction of port development, the future port size (land and water areas), and the portfolio of commodities to be served;
To optimise/rationalise investment decisions, it is necessary that port traffic demand exercises consider its competitive environment and changes thereof;
Authorities create the infrastructural preconditions for enabling private concessionaires (port operators) to realise their own projects, thus the future demand development should stimulate and guide port operators in their own business planning, also trying to harmonise such investment programmes in terms of timing, sizing, and technological levels;
Traffic forecasts have become fundamental for port planning and development, as well as to support associated investment decisions, to manage processes in public–private partnerships, and to renew concessions or land leases.
Therefore, a good assessment of future demand and the timing of port capacity increases are crucial to position the port for sustained growth.
A review of research works on the subject matter of port transshipment methods devoted to forecasting [
24,
25] revealed that: (1) the subject has not received sufficient attention and, most likely, no common accepted and universal guide on port throughput forecasting exists; (2) in practice, predictions are usually based on casual relationships between port transshipments and other exogenous variables, such as demographic, economic or industrial growth; (3) most articles dealing with the subject do not relate to casual models applied in practice, but instead refer to methods that are based on mere trend extrapolation from historical data and trend-based models. However, these methods are less suitable for long-term predictions of port throughput.
In a pragmatic approach, prognostic works apply the causal relationships between port transshipments and socio-economic variables, while the latter are selected on theories, knowledge, experience, and best practice of the researcher. Cargo transshipment is dependent on imports and exports, which are a component of GDP that is considered from an expenditure approach. Therefore, GDP is a proper factor that can be considered as an explanatory variable in cargo transshipment models. In one study [
25], a mix of quantitative and qualitative methods are applied to (very) long-term port throughput forecasts in the Le Havre–Hamburg range, including, in their framework system, dynamic modelling, judgement, and causal relations. Their combined method consists of three steps. First, they propose a probabilistic forecast of the working-age population. Second, expert judgment is applied to define assumptions concerning the development of several variables (i.e., employment, annual working hours, and GDP per hour) to derive the GDP forecast for the sample geographic area. Third, the authors calculate the port throughput forecast by scrutinising the causal relation between GDP and port throughput.
In another study [
26], the authors proposed an approach for predicting cargo throughput that applied a cargo transport model to the Hamburg–Le Havre range. In that model, two main components of the study were used: expert judgment and commodity-specific research. Needless to say, a disaggregated forecasting approach is needed in terms of commodity types, as each coherent and homogeneous commodity group has different throughput drivers and terminal requirements.
The relationships between GDP and industrial growth and port transshipments have been applied to Antwerp port to forecast container transshipments and liquid bulk cargo [
27]. Other empirical evidence [
28] proved that the correlation coefficient between GDP and container handling was remarkably high and amounted to 0.97. It confirms a strong and positive correlation between variables of interest. The two-dimensional linear regression equation showed the relationship between ports and the regional economy. In one paper [
5], the empirical analysis is based on an annual time series (1995–2017) for total container throughput for the main ports within the Hamburg–Le Havre range and economic indices based on GDP components. The study shows that there is a long-term relationship between the EU-19 trade indices and total container throughput. Therefore, there is a lot of empirical evidence showing very strong and positive correlations between transshipments in ports and the value of goods and services produced in the economy, measured by GDP or gross value added.
In another paper [
29], forecasts of the import container transshipments of Taiwan were developed with the use of a modified regression model. There are attempts, e.g., [
30], to use relevant indexes of containerisation that refer to the macroeconomic descriptors of the country of cargo origin and the country of cargo destination, such as foreign trade, population, and gross domestic product.
So far, port cargo turnover predictions have focused mainly on major ports and container turnover. With a few exceptions, e.g., [
31], the issue of port development throughput prediction in minor seaports is limited in scientific works. Cargo throughput forecasts in smaller seaports cover many types of cargo (besides containers) and are mostly decided by the relationships that occur between major and minor seaports that are in the given port system.
3. The Polish Port System
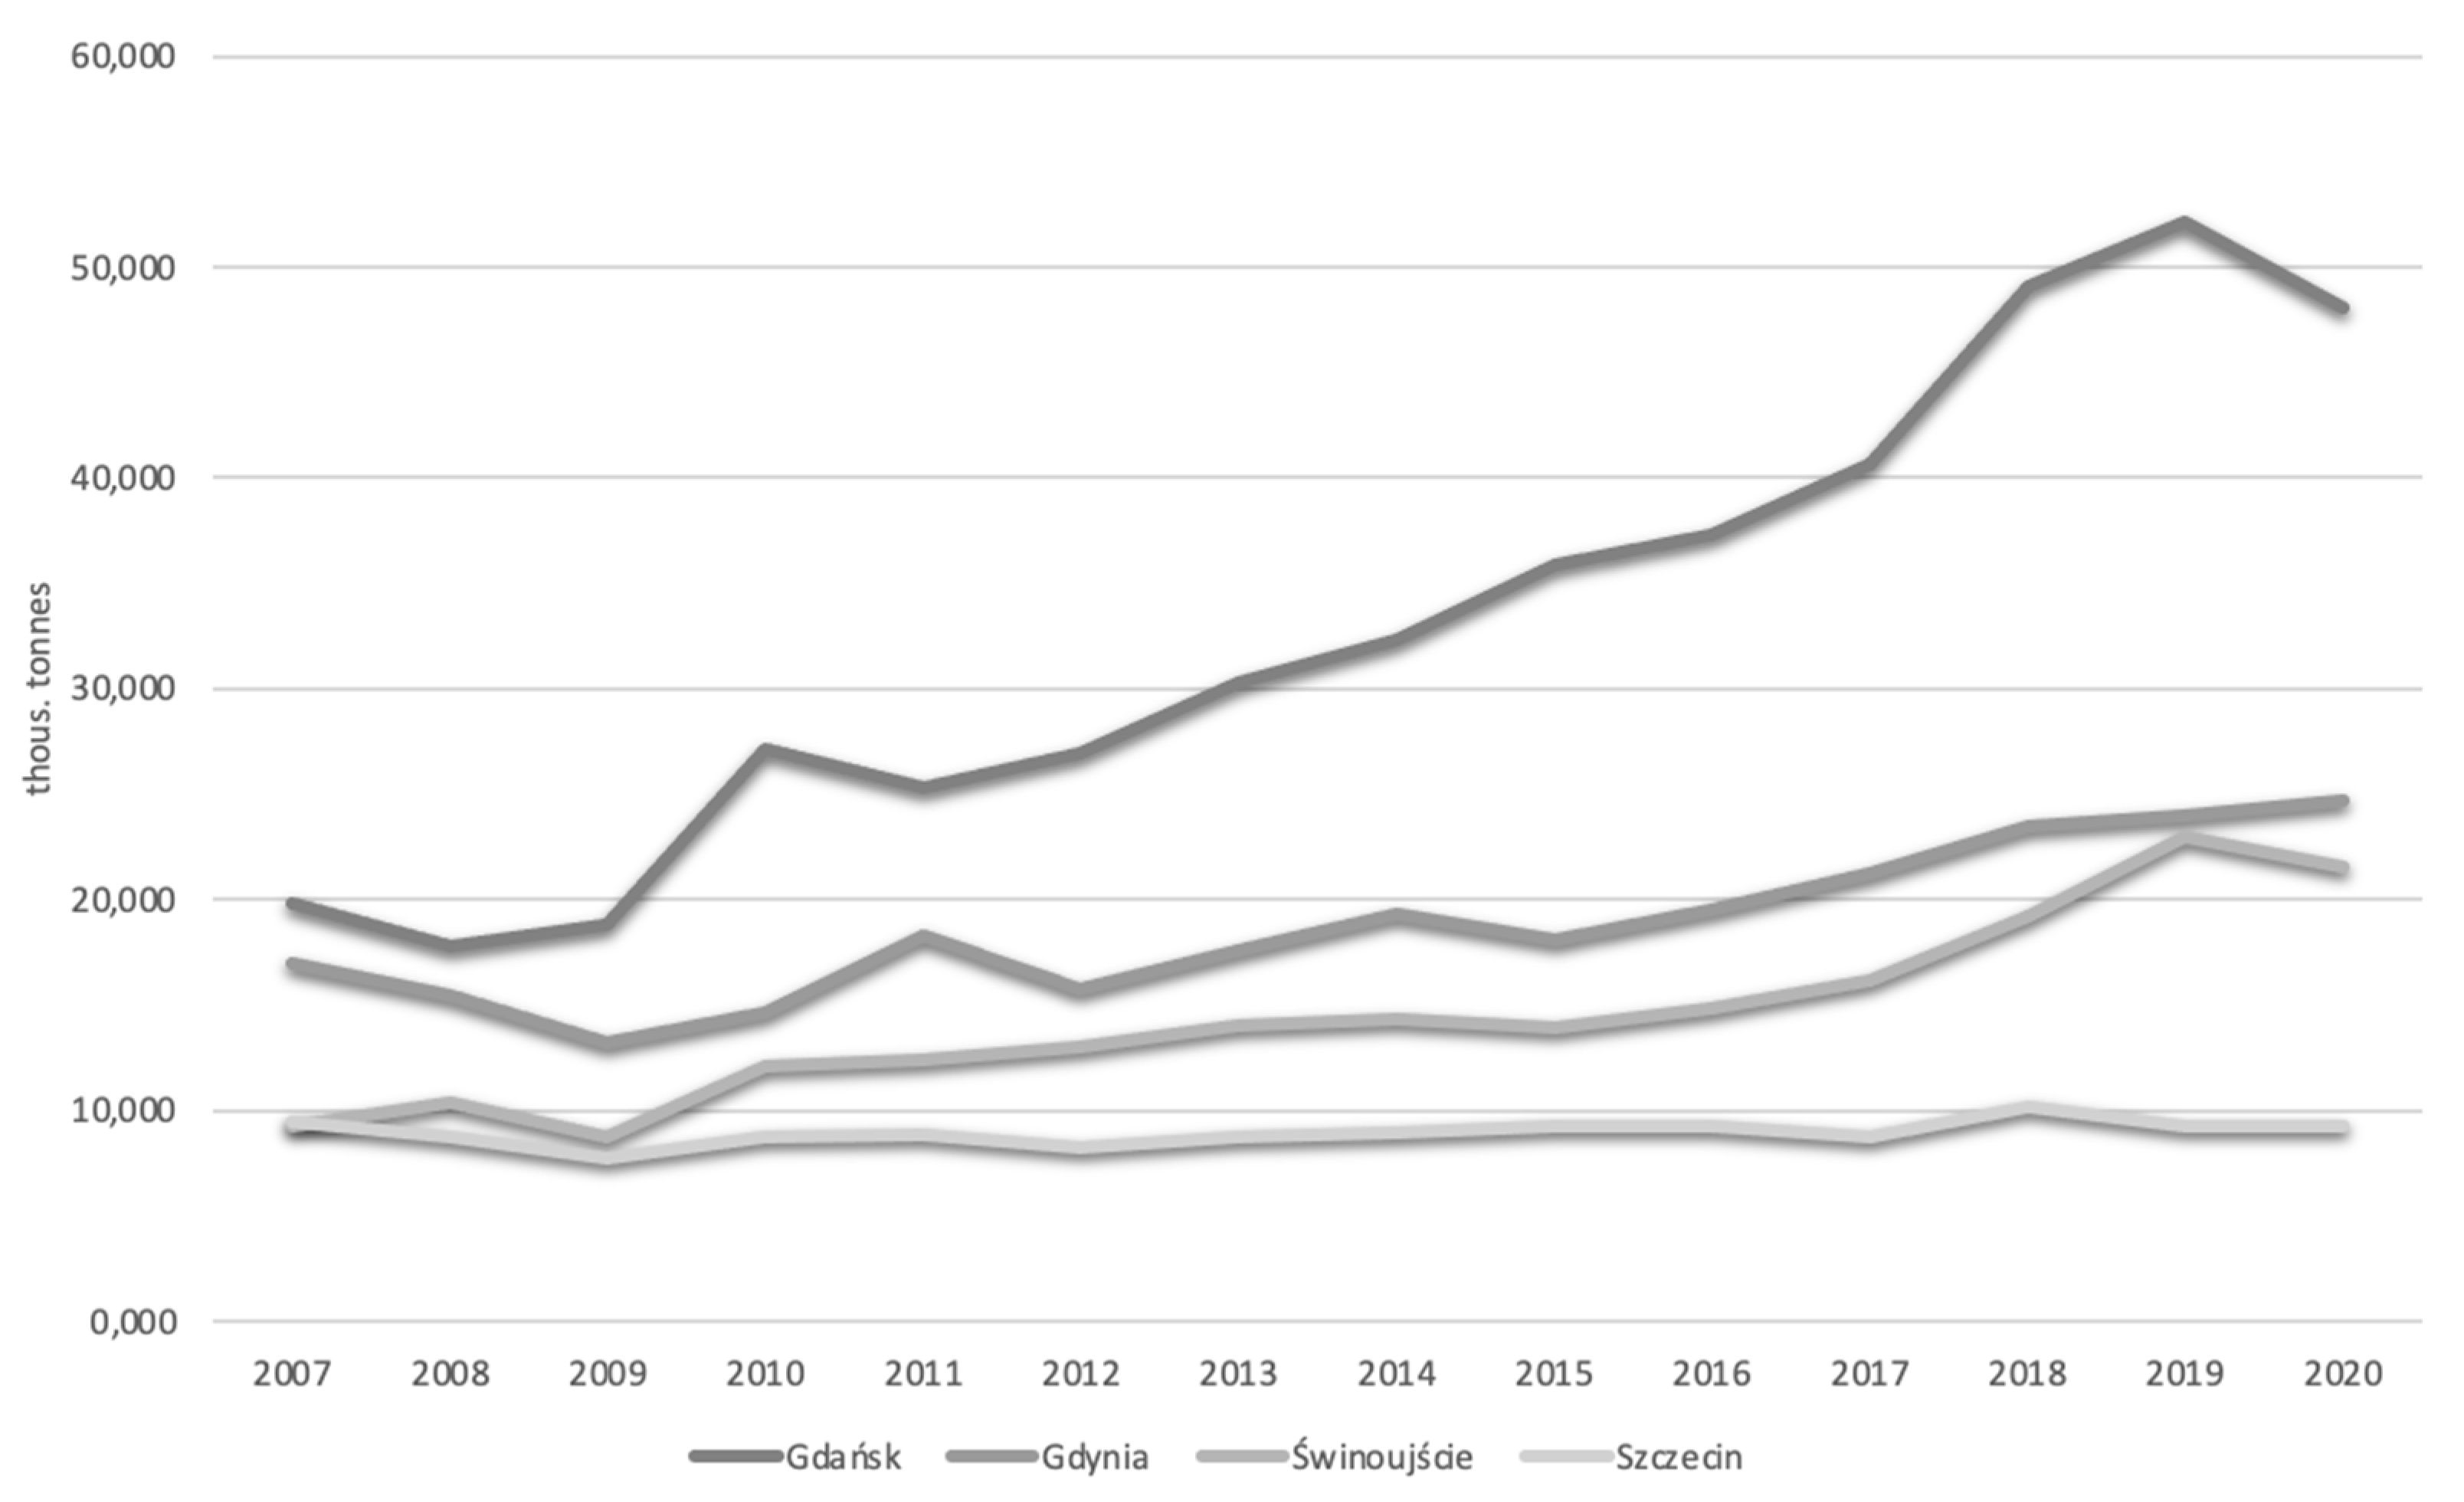
The system of Polish seaports includes the major ports of Gdańsk, Gdynia, Świnoujście, and the minor port of Szczecin, which are in the Baltic Sea within a range of 500 km. Gdańsk is a deep-water port that is able to service the largest vessels in the Baltic Sea. It notes the largest transshipments of oil and oil products and dry bulk goods, as well as being a container gateway with dynamically increasing container freight; in 2020, recorded 20 million tonnes (around two million TEU). Gdynia specialises in containers provided by feeder services and short sea shipping (around 0.9 million TEU in 2020), roll-on–roll-off traffic, and cereal, while Świnoujście focuses on roll-on–roll-off ferry traffic, dry bulk, and transshipment of liquified natural gas in the modern LNG terminal. Szczecin is a minor and universal port with a total annual throughput limited to ten million tonnes.
In the period observed in the study, 2007–2020, the port in Gdańsk recorded the highest growth rate of cargo throughput. Transshipments in the port of Gdańsk more than doubled in that time and increased on average by 8.39% annually. In the same period, the port of Świnoujście saw cargo throughput increase by 32.8%, that is, by an average of 6.7% annually, while in the port of Gdynia, it grew by 41.1%, that is, by an average of 2.91% annually. The port in Szczecin was the only port that did not record an increase in cargo throughput. For example, in 2007, the cargo handled by the port of Szczecin amounted to 9487 thousand tonnes, and, in 2020, the number of tonnes transshipped was almost the same, amounting to 9285 thousand tonnes, which decreased the cargo throughput by 2.29% during the analysed period (
Figure 1). As a result, the role of the port in Szczecin as a load center decreased compared to other Polish seaports (
Table 1).
The total transshipments in the Polish port system are presented in
Figure 1.
The port of Szczecin lost its share in the market. The share of Szczecin port in total freight handling in major ports in the Polish port system decreased from 17.1% in 2007 to 9.0% in 2020 (a decrease of 8.1 percentage points).
It is worth highlighting that the port of Szczecin is located 65 km south of the Baltic Sea and is connected to the sea by a waterway. The quality of the waterway determines the access to the port from the sea. The current depth of the fairway, which is 10.5 m, allows safe navigation and seagoing service ships with a draught of 9.15 m and a carrying capacity of up to 20,000 deadweight tonnes. At the current stage of development of sea trade and shipping, accessibility to Szczecin port from the sea is considered low. The navigational conditions of all other significant and major ports located on the southern coast of the Baltic Sea allow them to serve larger sea vessels compared to the port of Szczecin.
In summary, regarding the port of Szczecin, the limited access to the seaport is a key factor of the adverse trends in the growth rate of cargo throughput. The port in Szczecin plays the role of a minor port in the port system and is marginalised in the logistics grid because the competing and neighbouring major ports in Gdańsk, Gdynia, and Świnoujście have deeper canals, fairways, and basins, as well as deep-water quays; thus, they are able to serve larger vessels and increase their cost advantage and position in handling trade.
However, large-scale investments are being accomplished recently in the port of Szczecin. As a consequence, the nautical access to the port will be improved. Right now, the Świnoujście–Szczecin waterway is deeper by up to 12.5 m, and the port authority is adjusting some seasides to that depth in the Kaszubski Basin and the Dębicki Canal. Due to such an improvement, larger vessels of up to 40,000 DWT will be served in the port. Thus, it will also significantly increase cargo handling capacity.
In the work on forecasts for the Polish port system, the GDP forecasts expressed in current prices were used. Then, on the basis of the regression models, cargo transshipments were forecasted for the main types of cargo. Consequently, based on the cargo forecasts, annual growth chain indexes were calculated, and then, after investment in the port in Szczecin was finished, such indexes were used to forecast the freight transsipment for the port of Szczecin under new circumstances, that is, an improved access to the sea. However, the Polish GDP forecast did not consider the economic impact of the COVID-19 pandemic.
To forecast cargo transshipments in the major Polish seaports, regression models of transshipments by cargo type in relation to GDP in Poland were used with the following general formula:
where:
—the cargo throughput of the j-th group over time t;
GDPt—the observations of GDP in Poland over time t;
—the structural parameters of the regression model for the j-th cargo group; and
—the random component of the model over time t for the j-th cargo group.
To estimate the parameters of the regression models for each main cargo type, the ordinary least squares estimator (OLSE) was used based on the data set from 2007–2020. Cargo transshipment models with estimates and regression statistics by type of cargo are presented below.
- 2.
Cereal
- 3.
General cargo
- 4.
Containers
- 5.
Crude oil and oil products
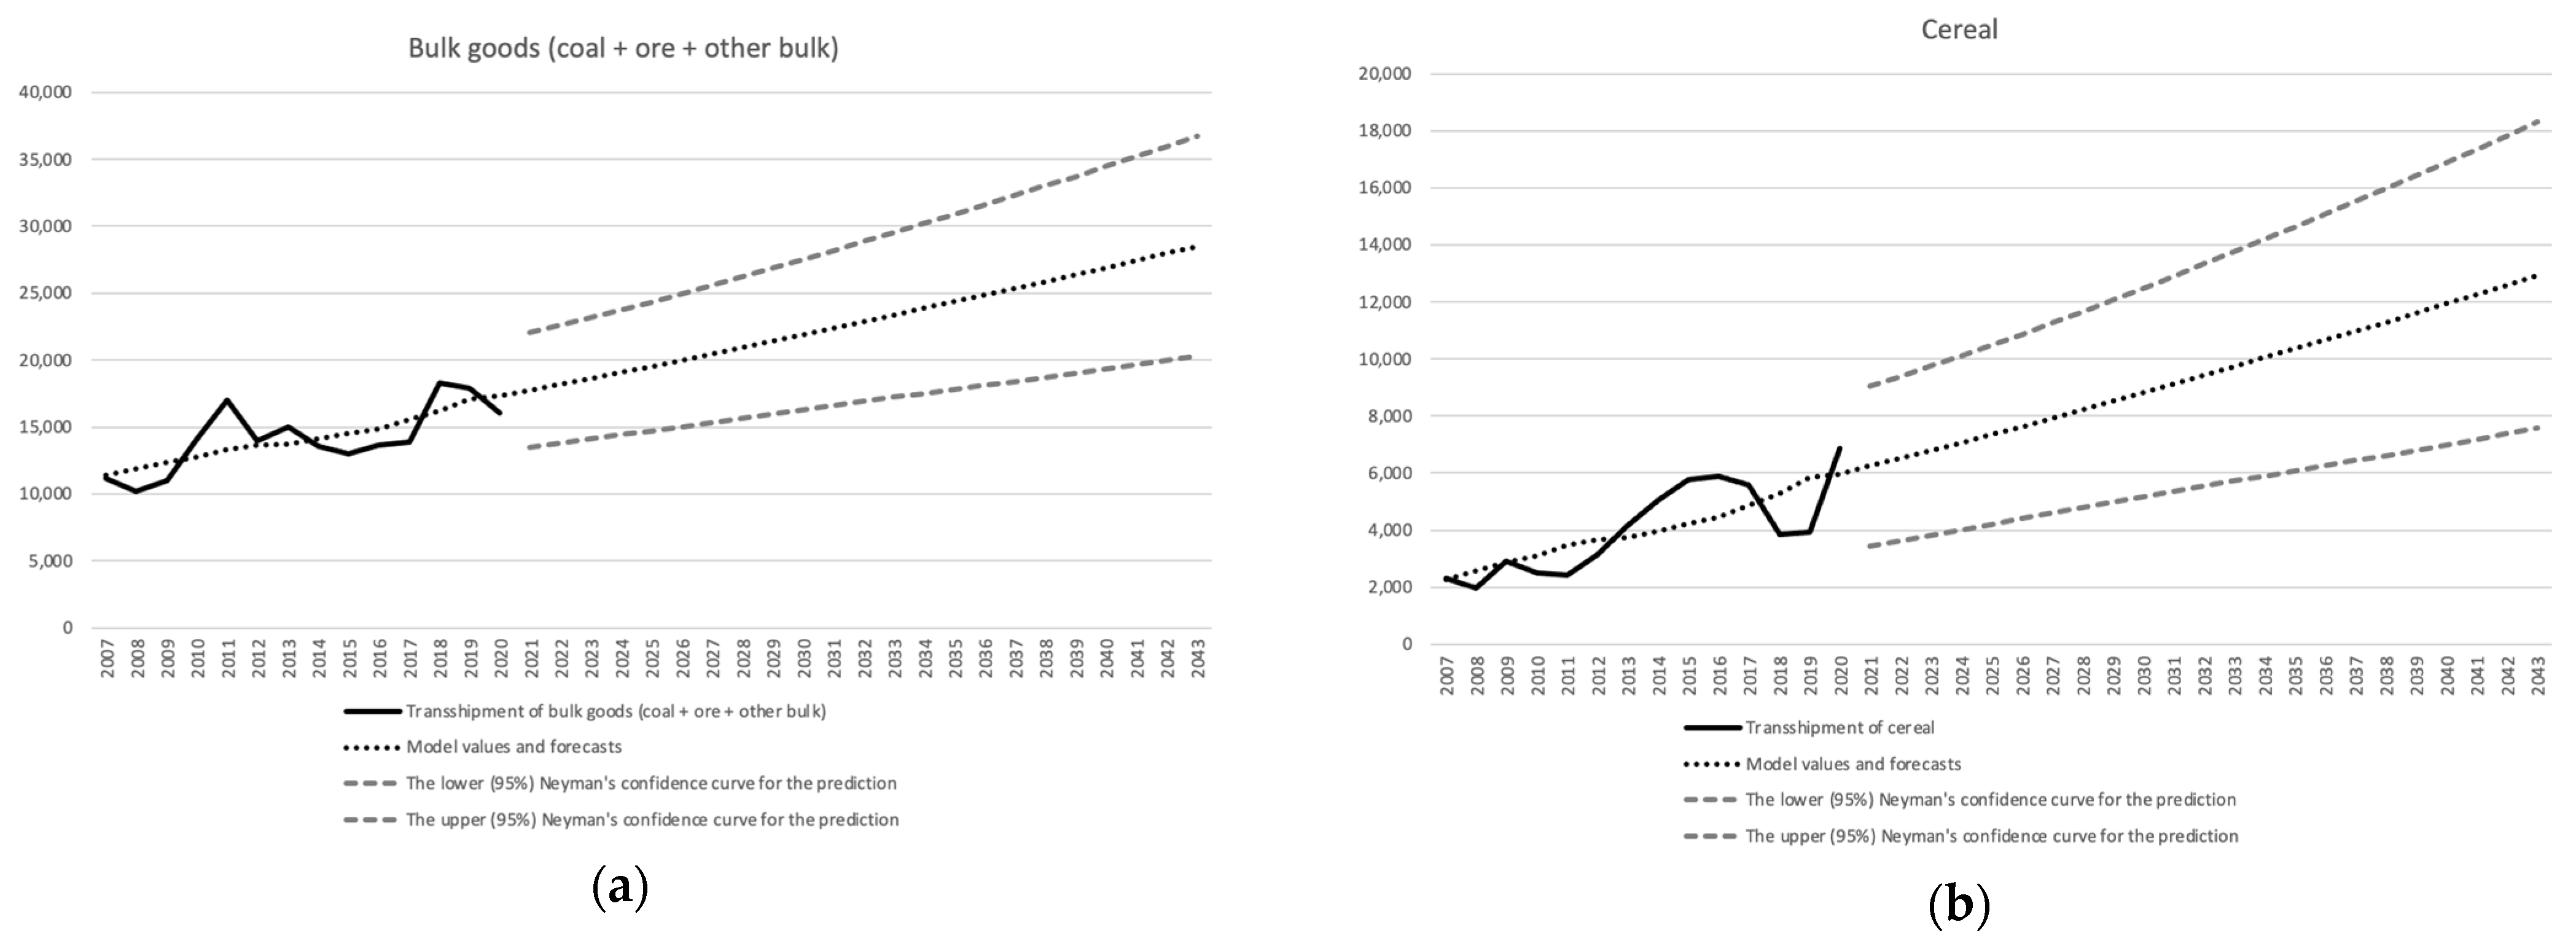
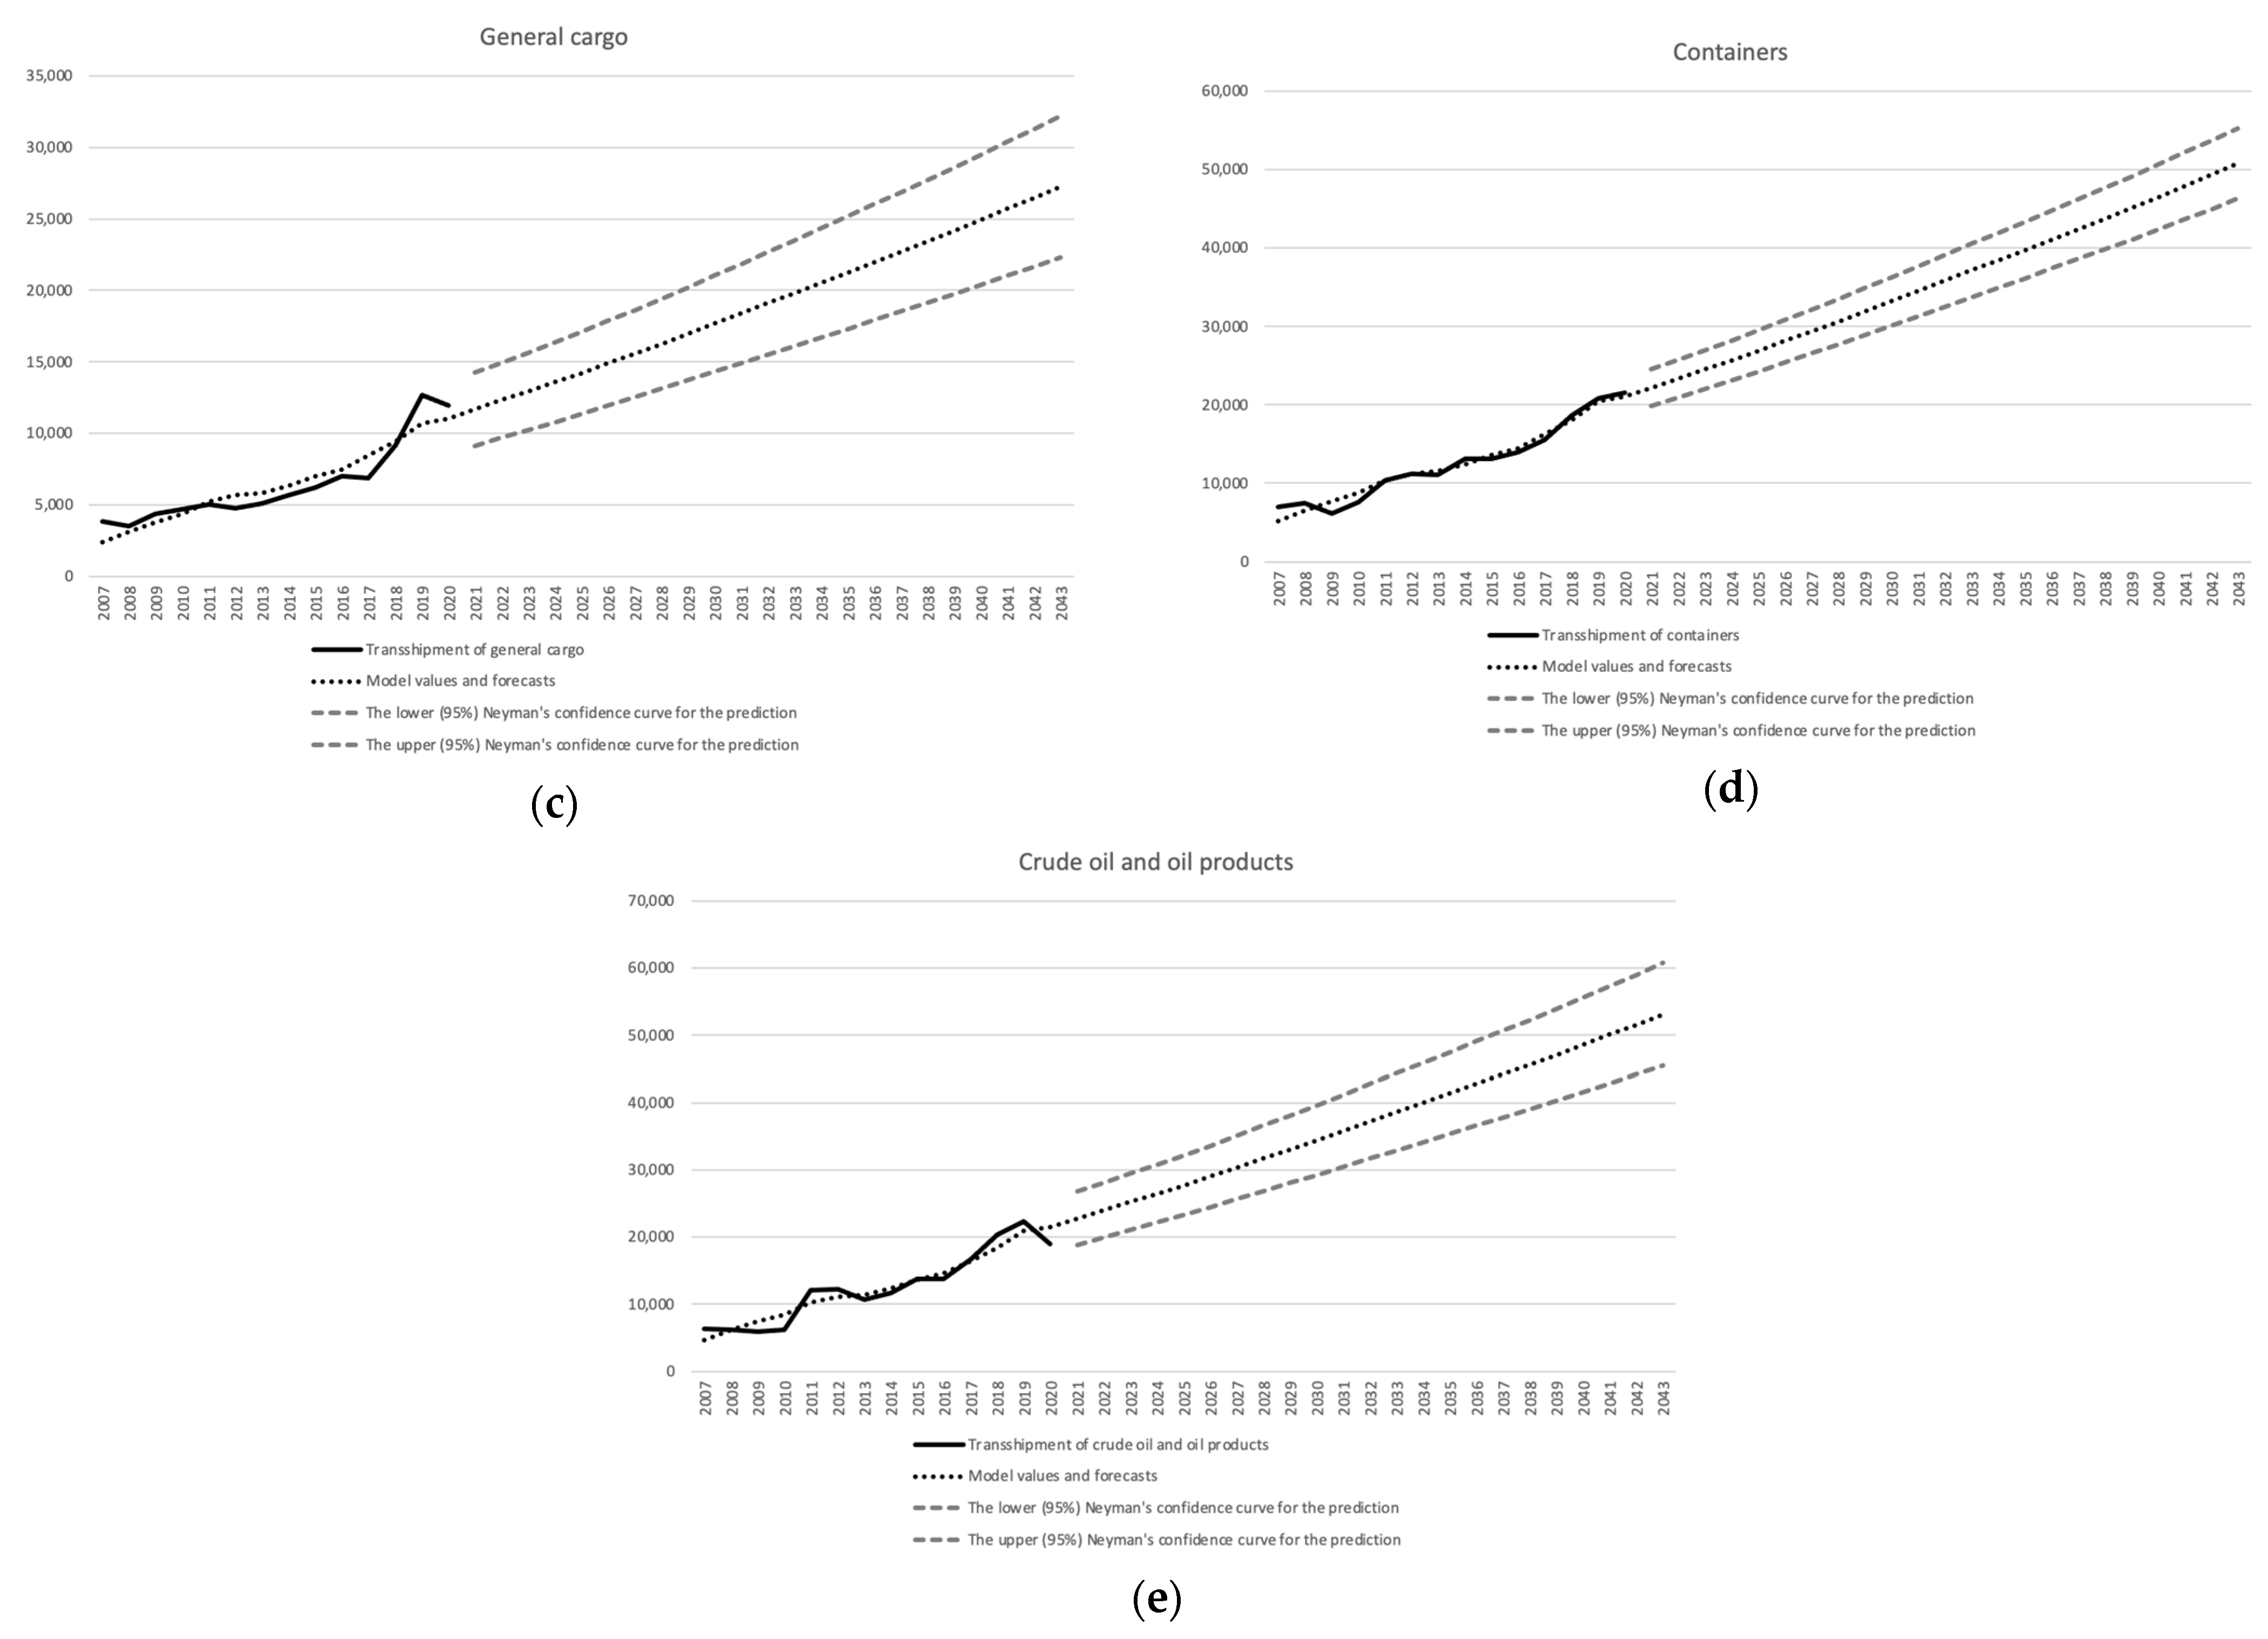
The models presented above are accompanied by some important regression statistics that show the goodness of fit of the models used and the statistical significance of the parameter estimates. The coefficient of determination R2 provides a measure of how well observed outcomes are replicated by the model. Models (4)–(6) are characterised by a very high degree of explanation of the variance of the endogenous variable (transshipments). The degree of matching of the models to empirical data was, respectively, 88.1%, 96.8%, and 92.2%. In the case of models (2) and (3), this level was moderate and amounted to 56.0% and 53.7%. Furthermore, the standard errors of the estimation are given in the brackets below each parameter estimate.
The next statistic presented above is a Student’s t-test (t-Stat), which is a comparison of the estimate obtained with the standard error of the estimation. It is used in significance tests of parameter estimates. The absolute value of the t-Stat should be greater than the critical value, which is 2.179 for a significance level of α = 0.05 and degrees of freedom of df = 12. The latter depends on the number of observations (n = 14) and the number of parameters to be estimated (k = 2). This implies requirements for an empirical significance level denoted as a p-value less than 0.05.
In summary, the fit of the models for general cargo, containers, and crude oil and products turned out to be remarkably high, while for bulk cargo, such as coal, ore, cereal, and other bulk cargo, it was medium. Importantly, from the point of view of the forecasts, all estimates of the slope parameters of the models were statistically significant.
Applying the extrapolation of the cargo turnover models, forecasts of all types of cargo transshipment in the major Polish seaports were produced (
Table 2).
With reference to all major Polish ports, the highest growth rate in the forecast period refers to oil and oil products (+180.6%), containerised cargo (+136.0%), and conventional general cargo (+128.4%). The smallest increases relate to cereal (+88.0%) and dry bulk cargo (coal, iron ore, and other bulk) (+77.4%).
The admissibility of forecasts was assessed by ex-ante errors such as variance of prediction error, standard error of prediction, and relative prediction error. Furthermore, 95% confidence intervals were stated in the forecast period. Such intervals create the area that shows the most probable range of variability for forecasts (
Table 3 and
Figure 2).
The matrix of indices of changes in demand for cargo group transshipments, established for major Polish ports, was used to predict the demand for transshipment services in the port of Szczecin. Applying the average transshipments for the period 2017–2020 in the port of Szczecin and the matrix of chain indices derived from the forecasts of throughput in the major ports, the recursive equation was formulated to produce the forecasts of cargo transshipment in the port of Szczecin, as follows:
where:
—forecasts for the j-th cargo group in time t;
—forecasts for the j-th cargo group in time t − 1;
—the annual chain indices of cargo throughput growth in the j-th cargo group; and
—the average level of transit in the j-th cargo group determined from k time periods.
The predicted cargo throughput volumes were limited by the handling capacity of the port of Szczecin. The outcome of this procedure is verified and calibrated demand forecasts in the minor port of Szczecin (
Table 4).
The predicted increase in transshipments is 6.1 million tonnes, from 9.4 million tonnes in 2022, to 15.5 million tonnes in 2043.
4. The Rhine–Scheldt Delta Port System
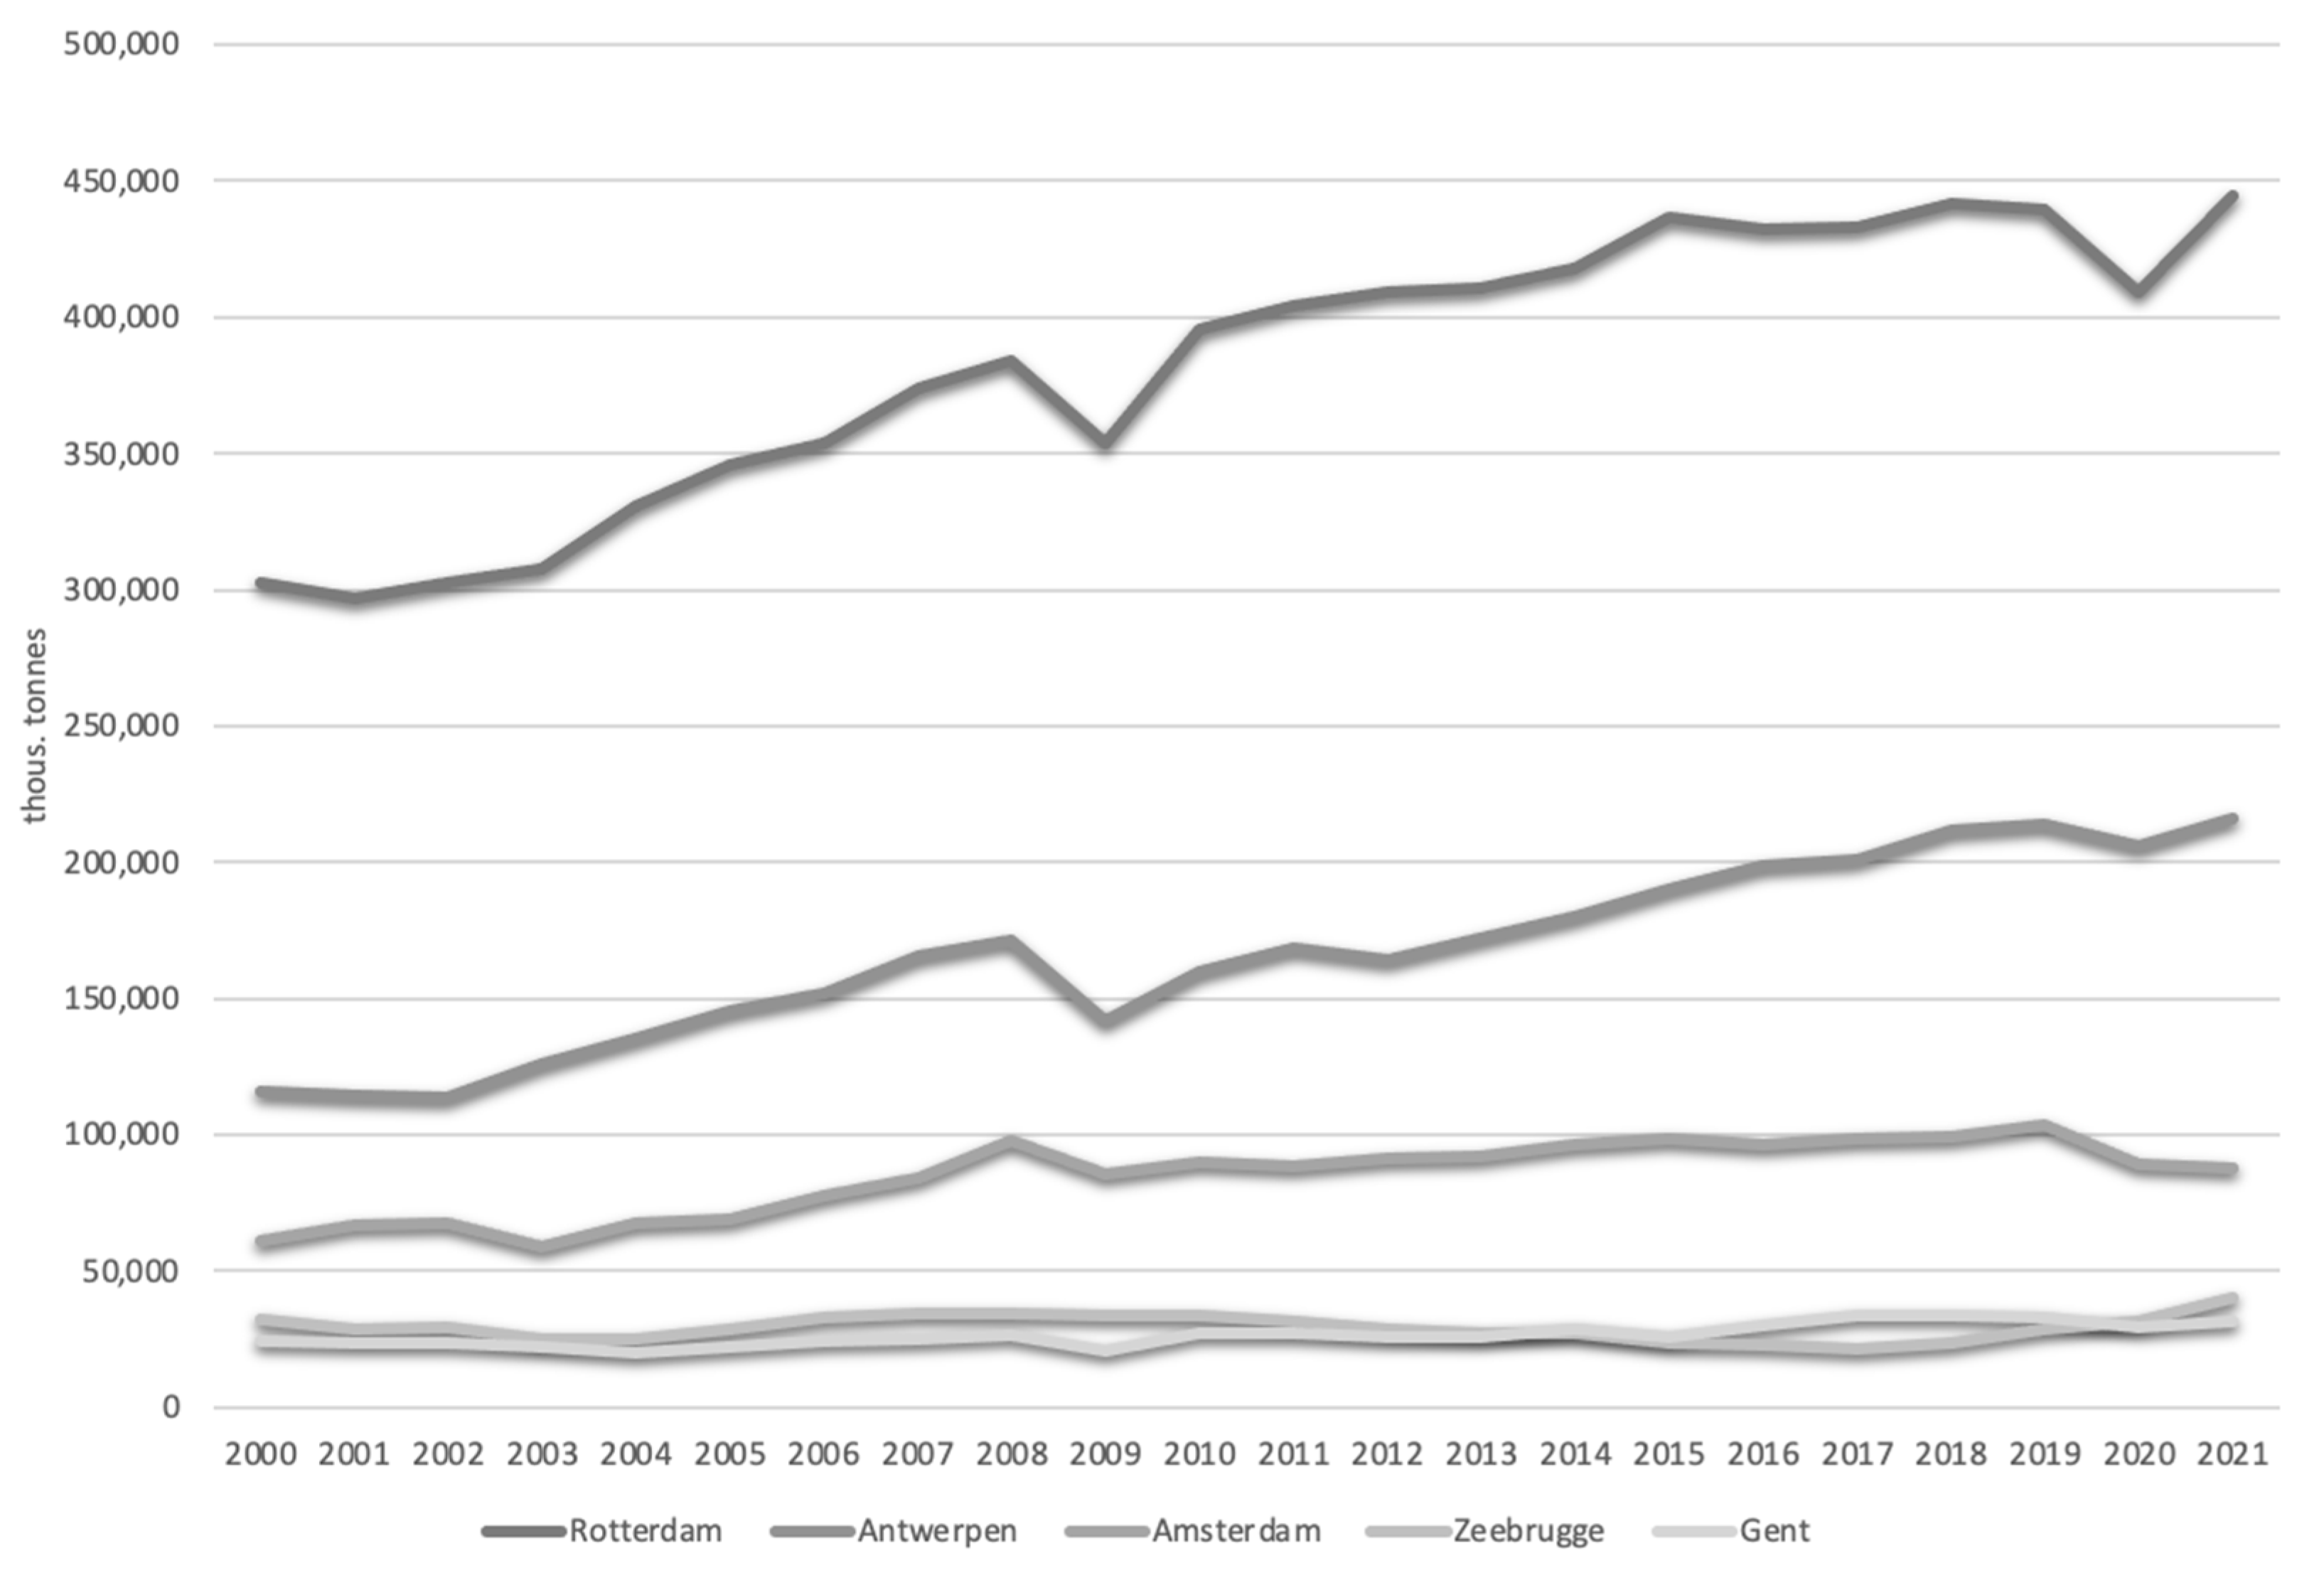
The Rhine–Scheldt Delta port system includes such ports as the port of Rotterdam (NL), the port of Antwerp (BE), respectively, the largest and third largest container ports in Europe, as well as Europe’s fourth largest port of Amsterdam (NL), followed by the two medium-sized ports of Ghent and Zeebrugge (BE). The port of Rotterdam is a downstream port; Antwerp, Amsterdam, and Ghent are upstream ports; while Zeebrugge is a deep-water coastal port [
32]. Rotterdam, Antwerp, and Amsterdam (named ‘ARA’ ports) are the major ports, while Zeebrugge and Ghent play the role of minor ports in the Rhine–Scheldt Delta system.
Table 5 shows the development of traffic by port and freight category and the analysis is based on Eurostat data and its nomenclature (Eurostat aggregates cargo to six types: liquid bulk goods (liquefied gas, crude oil, oil products, and other liquid bulk goods); dry bulk goods (ores, coal, agriculture, and other dry bulk goods); large containers (20-foot freight units, 40-foot freight units, freight units over 20-feet and under 40-feet in length, and freight units over 40-feet long); other general cargo (including small containers) and forestry products, iron, and steel products. Self-propelled mobile roll-on–roll-off and non-self-propelled mobile roll-on–roll-off units are self-clear).
The total transshipments in the Rhine–Scheldt Delta port system are presented in
Figure 3.
Three major ports in Amsterdam, Rotterdam, and Antwerp specialise in the processing and trading of oil and oil products. While Rotterdam and Antwerp are important in every throughput category, Amsterdam focuses on oil products. Rotterdam features many oil terminals and oil refineries, but fewer petrochemical plants. The port of Antwerp has fewer oil terminals and oil refineries, but more and larger petrochemical plants. Amsterdam is clearly a logistics oil centre focused on the storage, blending, and distribution of oil products [
33]. The port of Zeebrugge focuses on the transshipment of liquefied natural gas with the use of a modern and recently expanded in capacity LNG terminal. Considering the highly specified technology interconnected with oil refining and processing and the long-term established cooperation with the refineries and petrochemical plants in the vicinity, as well as most of these industries receiving oil and oil products by pipelines and/or river, the possible shifts of oil flows between ports are very limited, while, in the case of liquefied natural gas processed at the Zeebrugge LNG terminal, there is no alternative for transshipment at all.
Dry bulk is the important cargo group handled in the port system. In the ports of Rotterdam, Antwerp, and Amsterdam, coal, iron ore, and scrap predominate. A substantial part of the dry bulk is processed in the ports before it is transshipped into Europe. As most bulk commodity users are in seaports or control seaport terminals, bulk flows do not often switch between ports. The growing supply of green energy and the reduced demand for coal and ores from the steel sector explain the decline in dry bulk transshipment in the ARA ports, while in Ghent, a moderate growing trend in transshipment results from the more diversified cargo group in transshipment, including ores and agricultural dry commodities.
In the roll-on–roll-off traffic sector, there is a clear declining trend in ro–ro mobile self-propelled units and increasing traffic of ro–ro mobile non-self-propelled units. Zeebrugge is a leading port for roll-on–roll-off traffic, including ferry traffic, and it is the hub port for the automotive industry for new vehicles.
The ports of Rotterdam and Antwerp are, respectively, the largest and third largest container ports in Europe, and the fiercest competition is between these ports. In the late 1990s, Antwerp decided to build container capacity along the Scheldt River in front of the locks, thereby allowing considerable savings in the port turnaround time of container vessels [
34]. The last expansion in 2005 concerned the new Deurganck dock, with an annual capacity of 9.8 million TEU. Rotterdam has deep-water access and made a large investment in a new port area called Maasvlakte II. From 2013, a capacity of 5.2 million TEU was operational out of the total container capacity of Maasvlakte II, estimated at 12.0 million TEU [
5]. As a result of expansion in container capacity, both ports recorded substantial increases in container transshipments; however, dynamics of transshipment in both ports and thereafter their share in the market were subject to periodical fluctuation. Zeebrugge is an important centre for containerised cargo, accommodating ocean container ships. It recorded a very dynamic growth in container transshipment at more than 12 million tonnes in 2010 and thereafter exhibited a similar dynamic decrease in transshipment, down to 2.3 million tonnes in 2015. Since 2019, transshipment volumes in Zeebrugge have been increasing again, and, in 2021, Zeebrugge recorded 6.7 million tonnes of handled containerised cargo, which translates to +52.3% yearly growth. Recapitulating, container flows are sensitive to port congestion and they are very susceptible to the cargo shifts between ports.
To determine the transshipment forecasts in the Rhine–Scheldt Delta port system, we applied regression models in relation to the GDP of Belgium, the Netherlands, France, and Germany, but again the GDP forecast did not consider the economic impact of the COVID-19 pandemic.
To estimate the parameters of regression models for each main cargo type, as before for the Polish port system, the ordinary least squares estimator (OLSE) was used based on the data set for 2000–2021. Basic regression statistics and models are summarised below.
- 2.
Dry bulk goods
- 3.
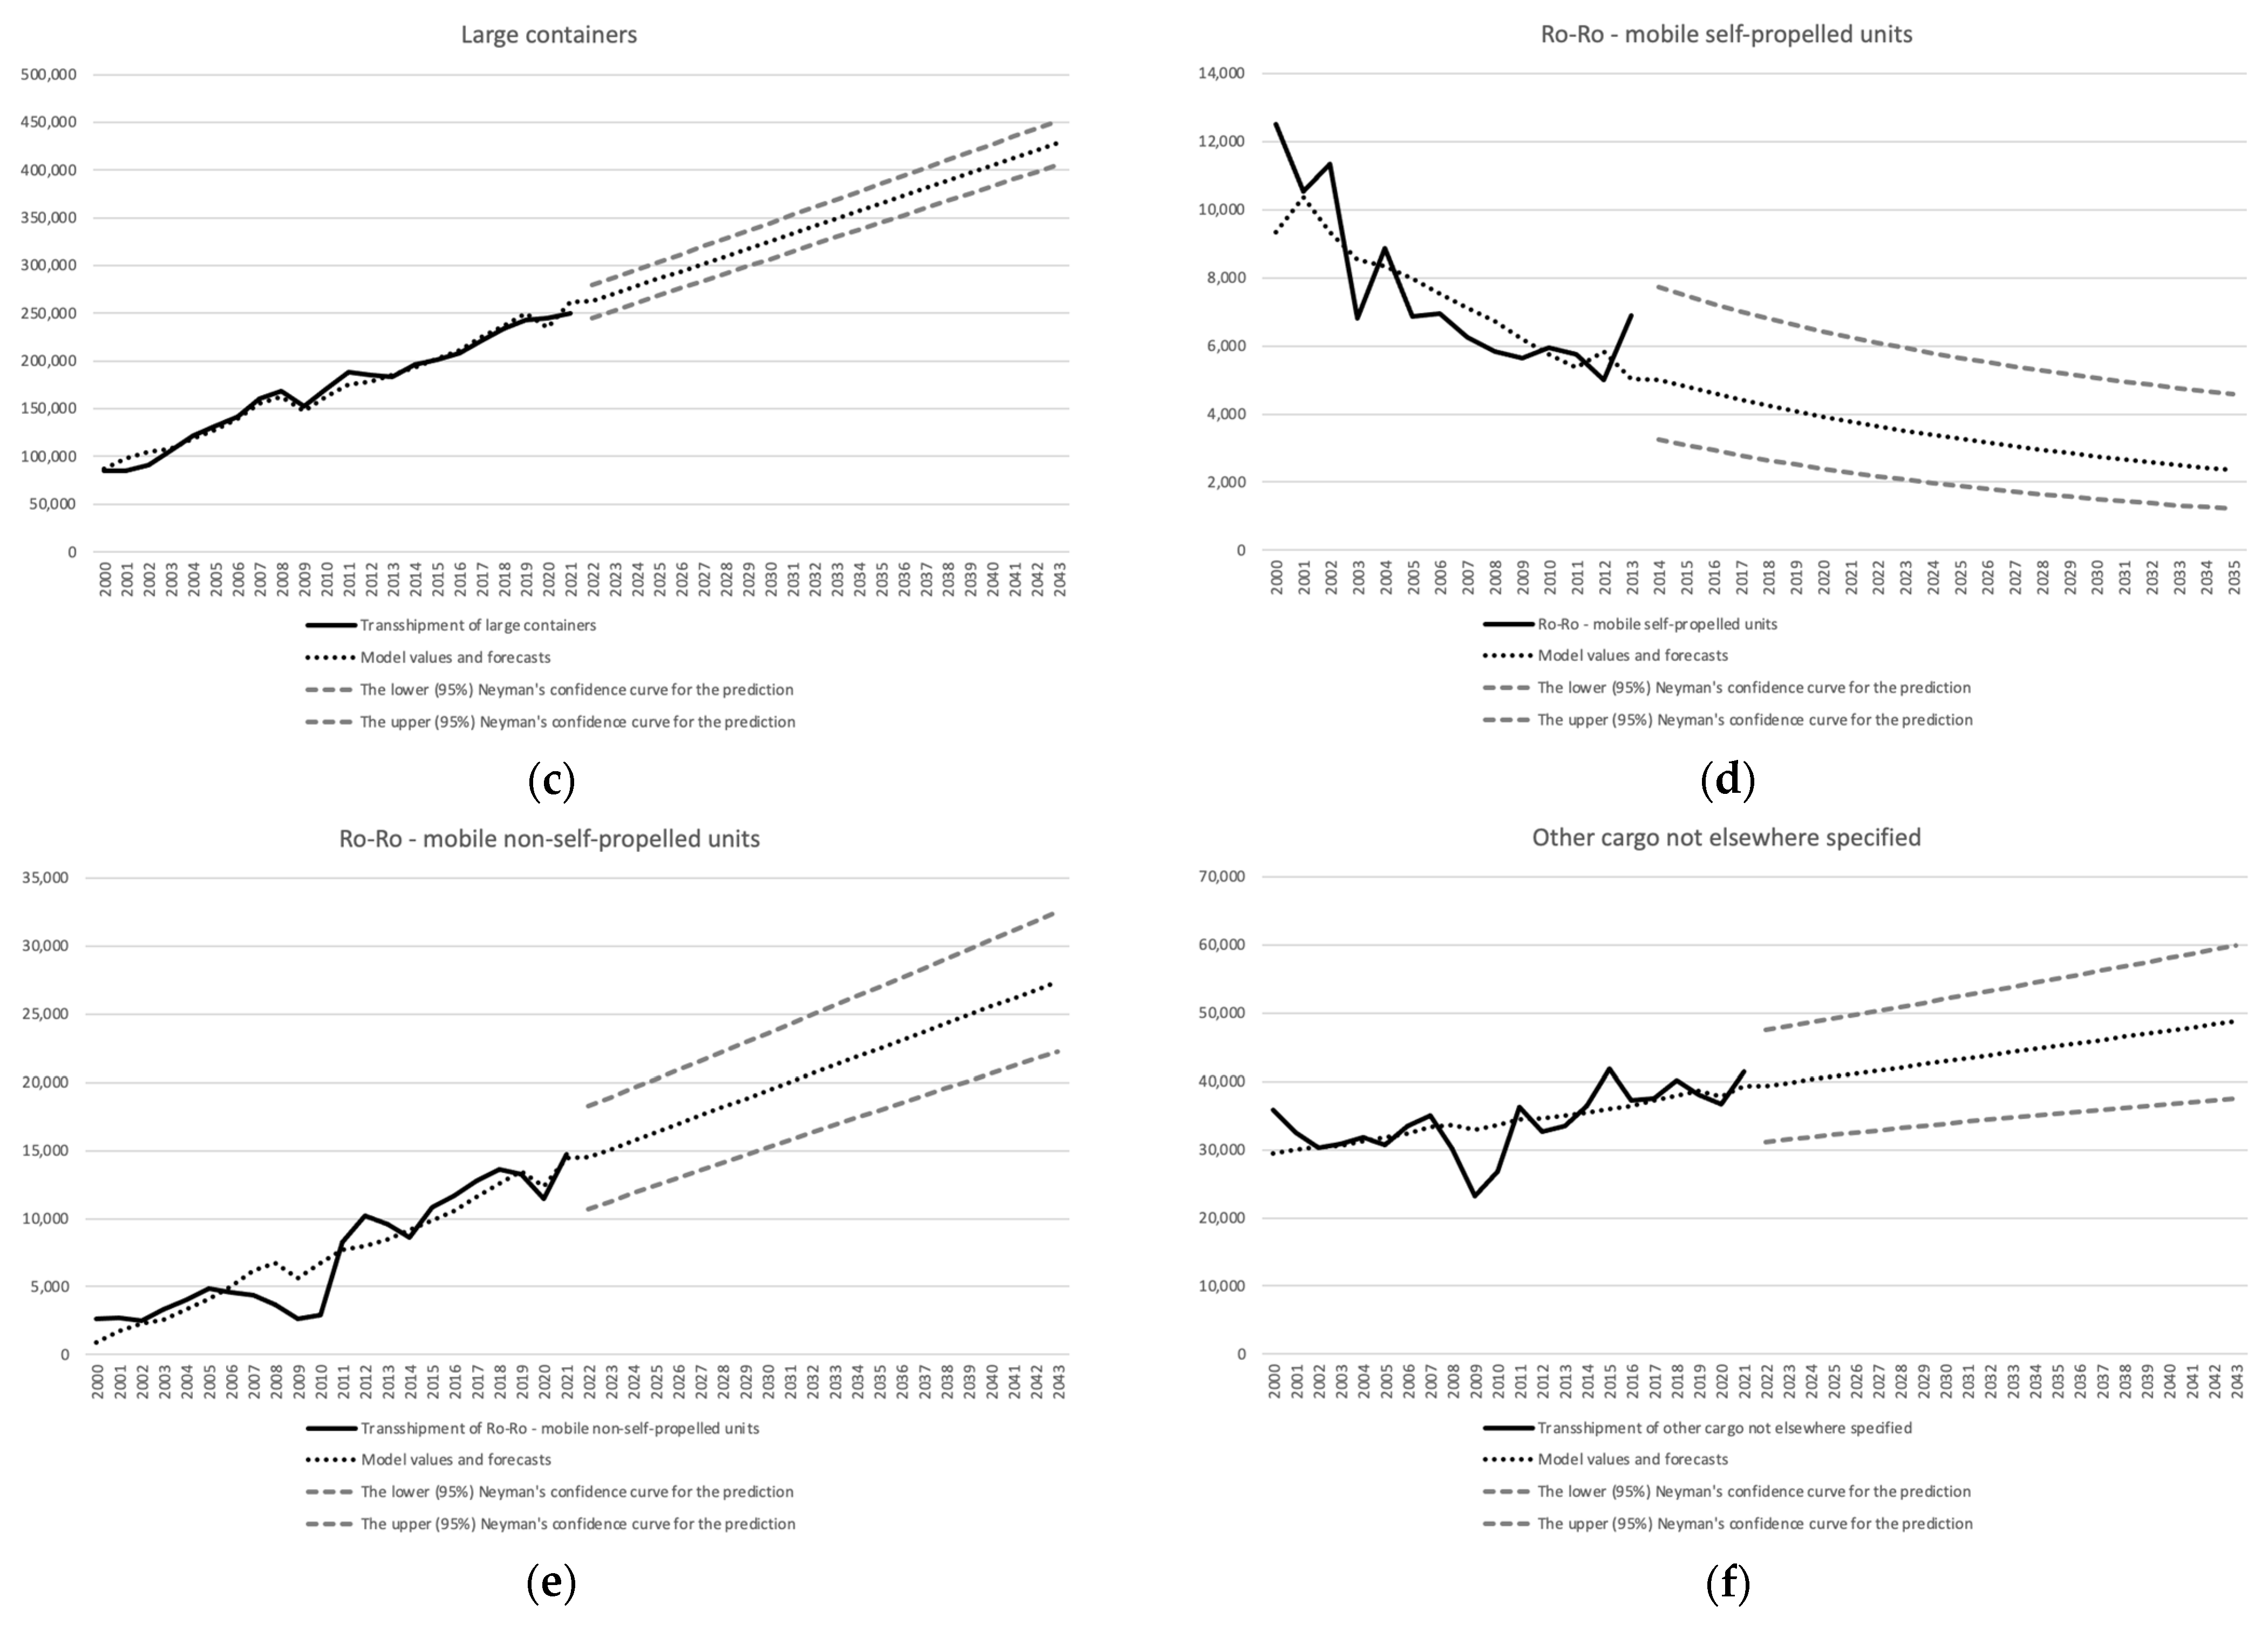
Large containers
- 4.
Ro–Ro mobile self-propelled units
- 5.
Ro–Ro mobile non-self-propelled units
- 6.
Other cargo not elsewhere specified
Models (8), (10), and (12) are characterised by a very high degree of explanation of the variance of the endogenous variable (transshipments). The degree of matching of the models to empirical data was, respectively, 87.2%, 98.1%, and 86.1%. In the case of models (9), (11), and (13), this level was moderate and amounted to 46.0%, 58.3%, and 41.0%.
All estimates of parameters turned out to be statistically significant, which means that the absolute values of the t-Stat were greater than the critical value (2.086) calculated for α = 0.05 and degrees of freedom df = 20. The only exception is the intercept parameter in model (8), but it does not constitute an obstacle in forecasting, as it does not multiply the forecast error in the extrapolation process.
In summary, the fit of the models for liquid bulk goods, large containers, and ro–ro mobile non-self-propelled units turned out to be remarkably high, while for dry bulk goods, ro–ro mobile self-propelled units, and other cargo not elsewhere specified, it was medium. Importantly, from the point of view of forecasts, all slope parameters of the models were statistically significant, as before for the Polish port system.
Applying the extrapolation of the cargo turnover models, forecasts of all types of cargo transshipment were produced in the major ports of the Rhine–Scheldt Delta, namely, Rotterdam, Antwerp, and Amsterdam (
Table 6). One of the most important premises of forecast theory known as the ‘dynamic status quo’ was adopted, which means that statistical regularities observed in the past continue during the forecast period.
As before, the admissibility of forecasts was examined by ex-ante errors such as variance of prediction error, standard error of prediction, relative prediction error, and 95% confidence intervals in the forecast period (
Table 7 and
Figure 4).
Since in the port of Ghent the transshipment of dry bulk concerns a different segment to the major ports and the potential for dry bulk shifts in-between ports in the system is low because there is also no evidence for Ghent’s structural limits in developments, the transshipment forecasts for Ghent were obtained with the use of predicting models, as for major ports (
Table 8).
In the port of Zeebrugge, for forecasting liquid and dry bulk goods, as well as for roll-on–roll-off traffic and the category of other cargo, we used the same assumptions as for other ports in the system, but in prognostic works for container traffic, the procedure differs.
In the following, with reference to [
35], there are estimates of the present container-handling capacities:
Rotterdam: Maasvlakte II (+5.2 million TEU, from 2013 onwards), totalling 14.5 million TEU (145 million tonnes),
Antwerp: Deurganckdock (+9.8 million TEU, from 2005 onwards), totalling 12.5 million TEU (125 million tonnes).
Regarding Zeebrugge, the present container capacity is estimated at 1.0 million TEU (CSP Zeebrugge Terminal), while from 2015 onwards, the port decreased capacity by 1.1 million TEU and moved container cranes from Zeebrugge to Antwerp.
Matching the incremental growth of capacity with ever-fluctuating demand is a challenge resulting in periodical capacity surpluses or shortages and enhancement or deterioration of the shipping lines service in Antwerp and/or Rotterdam. As the capacity utilisation rate (calculated as the ratio of the actual total port throughput divided by the designed capacity) is above a certain level, maintaining the performance and quality of the container operations, and keeping the turn-around time of container ships at an acceptable level, encounters problems. The dynamics of container flows slow down, which is attributed to port congestion. As a function of the capacity utilisation rate level, set at a level of more than 70%, the following congestion periods in containers were found [
5]:
- 3.
The port of Antwerp faced congestion problems during 2003–2004; the utilisation rate had a stable average of 70% during 2010–2014, which slightly increased to 75%;
- 4.
The port of Rotterdam faced congestion problems during the whole period of 2003–2012, except for a few years: 2006 and 2009.
In this period, the utilisation rate was above the given level and the large ports of Antwerp and Rotterdam faced reduced growth of container transshipment, while the port of Zeebrugge recorded dynamic growth in container transshipment. However, from 2010 onwards, as a function of growing container capacities in major ports, the utilisation rate declined, thus making service conditions for shipping lines competitive, which resulted in decreasing transshipment in the port of Zeebrugge and increasing container growth in the ports of Antwerp and Rotterdam. Since 2019 onwards, transshipment volumes in Zeebrugge have been increasing again due to enormous problems at the deep-sea terminals of Antwerp and Rotterdam caused by the COVID-19 pandemic and disruptions in the supply chains, which upset or delayed sailing schedules of container shipping lines, causing problems with access to free containers, empty box logistics included. Within three years (2019–2021), the volumes of containerised cargo in Zeebrugge more than doubled.
To capture the future effects of the shifts in container flows in the system, we used previously elaborated container transshipment forecasts for Antwerp and Rotterdam and matched the predicted demand with the capacity utilisation rate in the major ports, set at a level of 80%. When reaching this default utilisation rate, both ports face congestion, which is counterbalanced by the added capacity in these ports. In terms of the port of Antwerp, more container-handling capacity comes from planned investments in the ’Saeftinghe Development Area’. The project is planned in phases to supply, in total, an 11 million TEU capacity. With forecasting demand and capacity utilisation rate controlled at a level of 80%, the first phase with a capacity of 5.1 million TEU is needed to be operational from 2022, while the second phase with a capacity of 5.9 million TEU should be operational as from 2034.
For Rotterdam, at Massvlakte II, there is still room for another 6.8 million TEU. Following the level of capacity utilisation around 80%, this added capacity should be operational by 2022. The simulation of container traffic flows in the port system is depicted in
Table 9.
In the case of Antwerp port, for each year in the periods 2028–2033 and 2041–2043, from 0.9 to 3.64 million tonnes of containerised cargo should shift to Zeebrugge for transshipment.
In the case of Rotterdam, for each year in the period 2029–2043, there is up to 4.25 million tonnes of containerised cargo likely to be transferred for transshipment in Zeebrugge.
Forecasted container transshipment can be calculated in the minor port according to Equation (14):
where:
—the forecasts for container transshipment forecasts in the minor port in time t;
—the baseline forecasts of container transshipments in the minor port without cargo shifts between ports;
—the forecasts for container transshipments in the j-th major port in time t;
—the threshold value for the occurrence of the congestion risk (the capacity utilisation rate, default value );
—the maximal capacity in the j-th major port;
—the nominal increase in the transshipments of containers in the j-th major port in time t compared to time t − 1 (previous period);
N—the number of major ports in the port system.
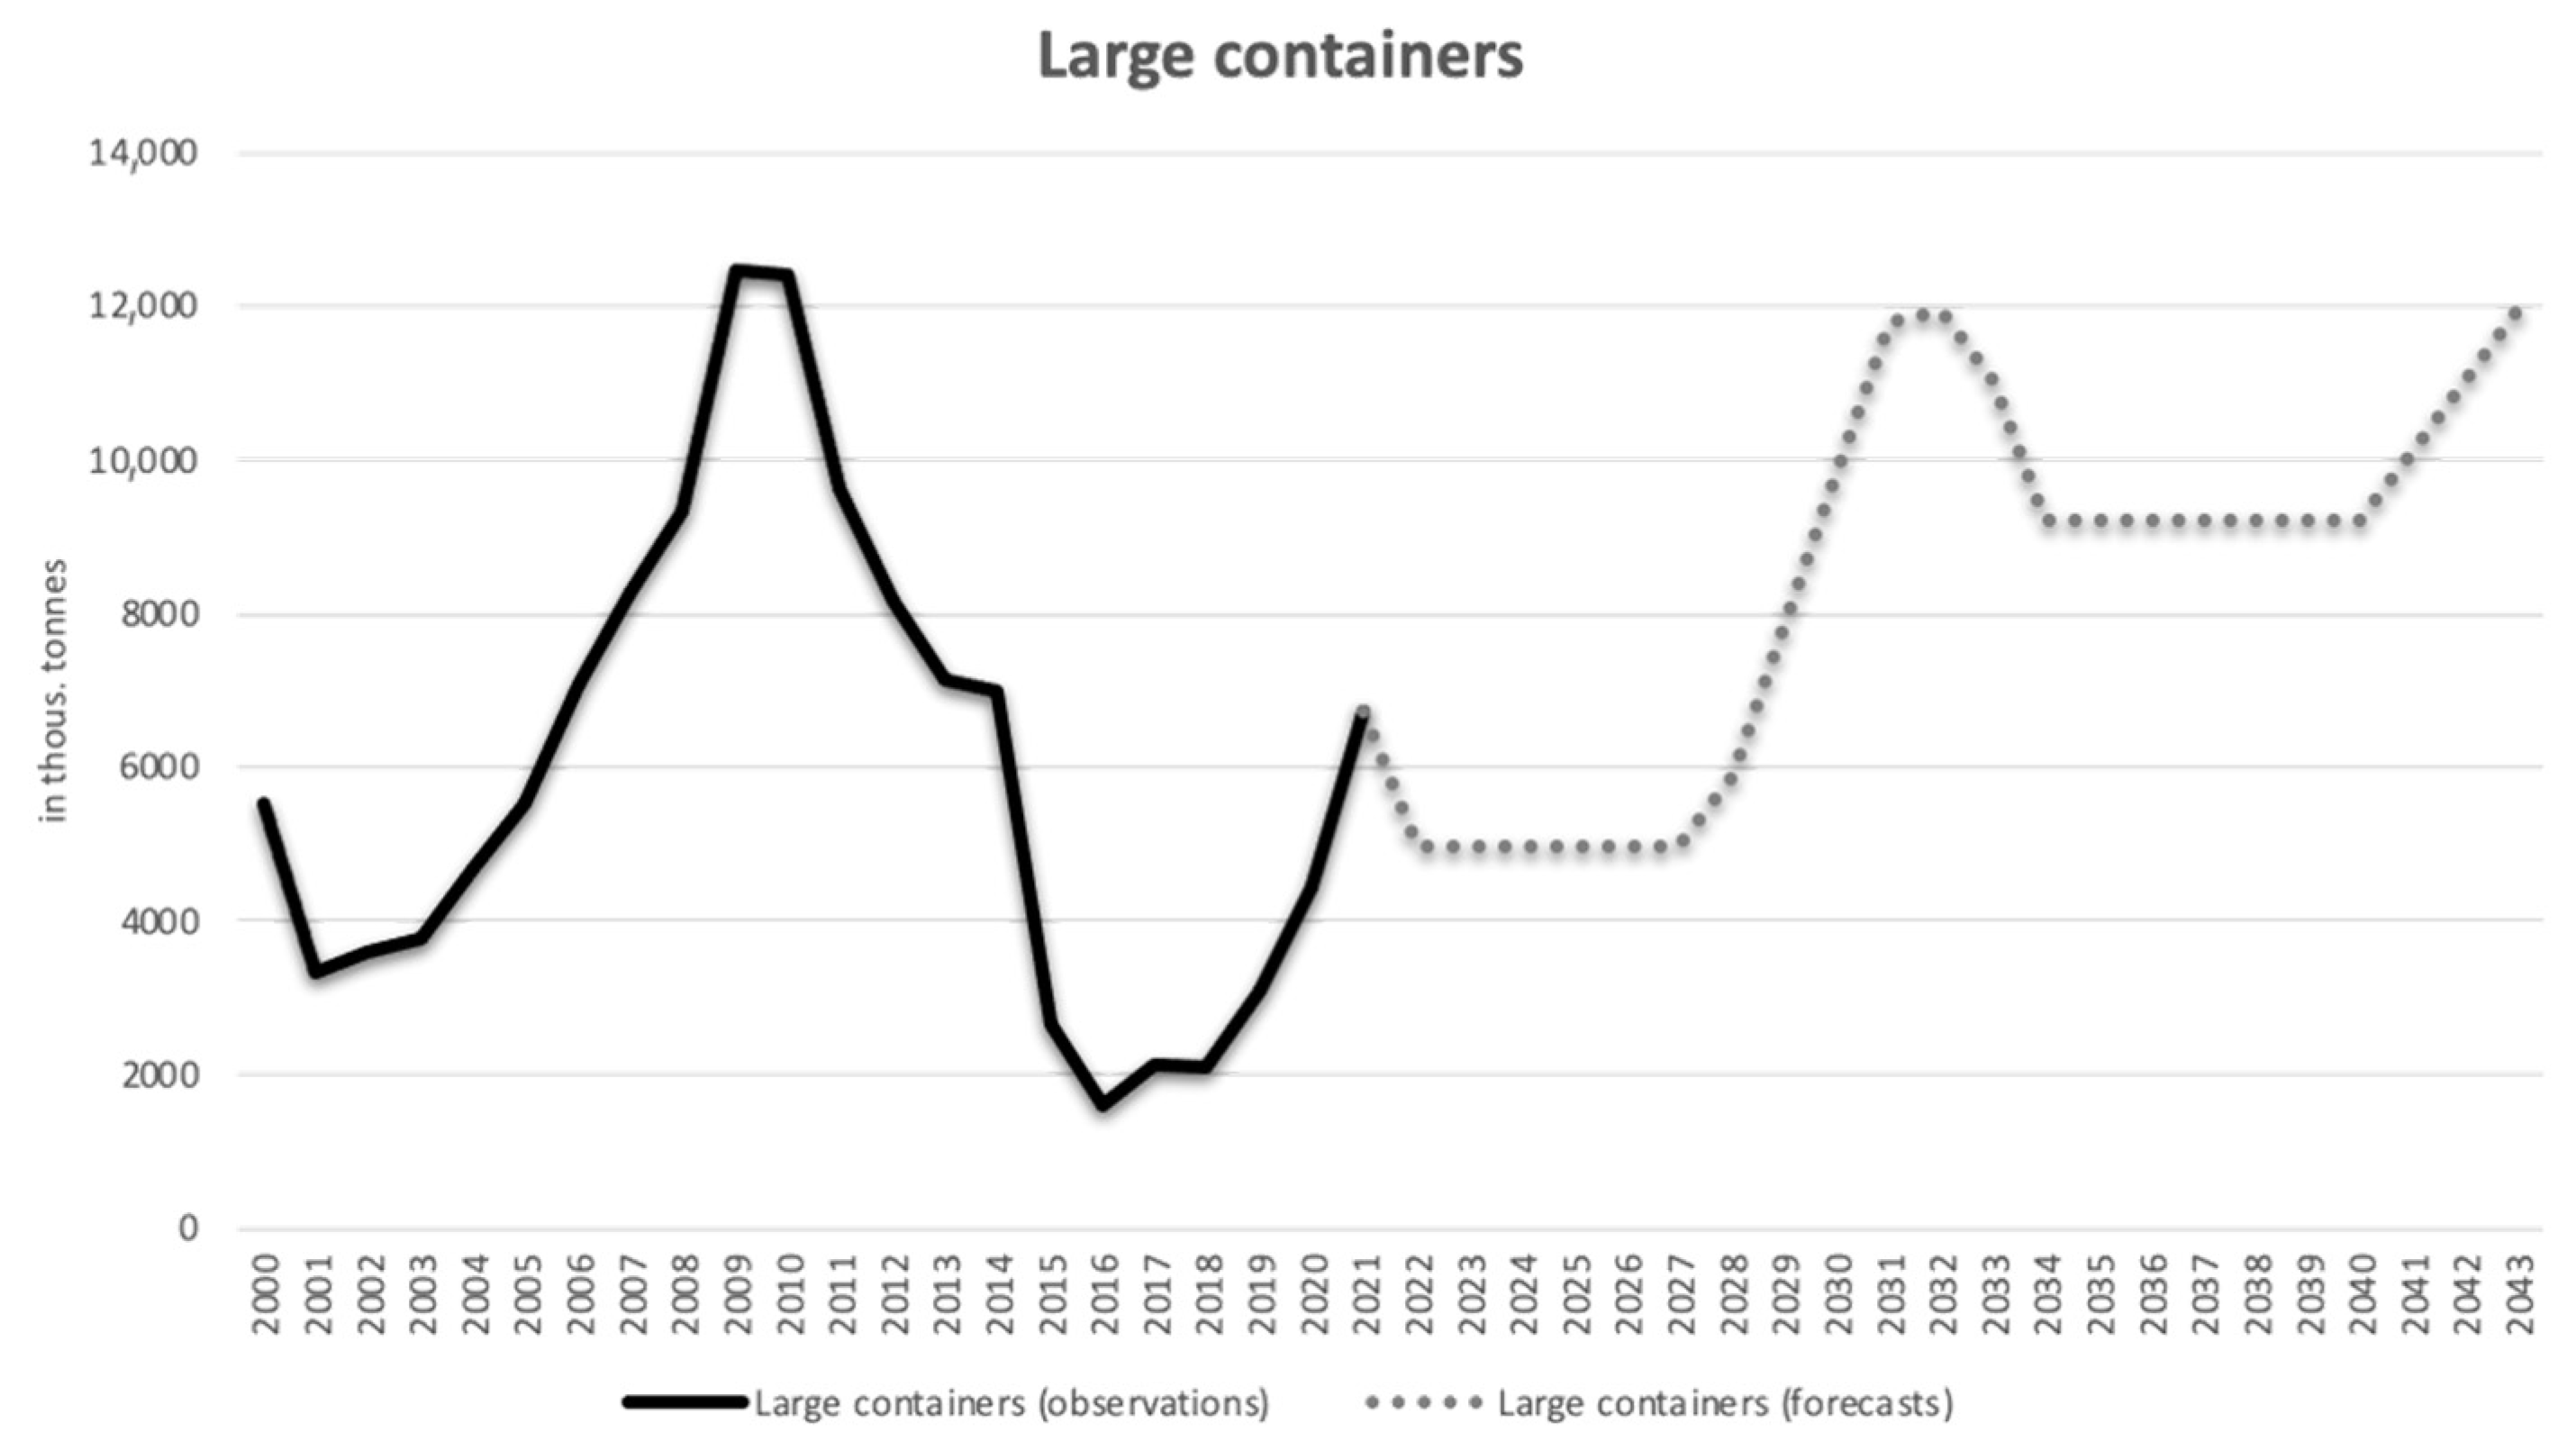
Incorporating the estimated shifts of cargo flows from Antwerp and Rotterdam into the forecast base volume of containerised cargo transshipment in Zeebrugge (estimated at 4.965 million tonnes), the future containerised cargo volumes to be handled in Zeebrugge have been determined and are presented in
Figure 5.
Then, the overall transshipment forecast for the port of Zeebrugge, supplemented with predicted container freight, presents as in
Table 10.
5. Lessons to Be Learnt
In this paper, an attempt was made to elaborate on the complex problem of the future dynamics of port systems. Considering the relationships between minor and major ports, forecasted transshipment, and inter-port cargo shifts, the evolution was investigated using the example of the multi-port systems in Poland and in the Rhine–Scheldt Delta. The analysis of the dynamics of both port systems was performed with the use of competition relations, more specifically, in the function of the capacity extension or capacity utilisation. Therefore, the other research dimensions of the port system dynamics such as transitions in the maritime and hinterland networks were not considered. However, as claimed in [
7], such an approach can still provide additional insights into the evolution of multi-port formations and the vulnerability of the port peripheral challenge.
Although the analysis considers the relationship between major and minor ports in the system and it is performed from the perspective of minor ports potential for development, it differs in evolution pattern for each port system.
In the Polish port system, the minor port (Szczecin) suffers from structural constraints related to the obsolete accessibility of the waterside and, consequently, loses the possibility of further development. If throughput forecast is produced with direct reference to the trends and internal conditions of that minor port, it is burdened with structural limitations to the port’s growth and ignores relations with the major ports. Therefore, in this case, the method of demand forecasting for the minor port is relative, as it refers in the first step to the estimated demand for transshipments in major ports, while in the second step, it uses the obtained indices of transshipment dynamics in major ports to develop forecasts of the cargo throughput in the minor port. In the next stage, the forecast is verified against the existing and planned capacity of the minor port and scrutinised with issues such as market niches, competition, and trade patterns. Thus, this approach of investigation of the future dynamics of port systems includes relations between major and minor ports in the system and multi-staged validation of minor port development potentials. It is difficult to determine to what extent the forecast throughput volumes in minor ports result from their cooperation with large ports in handling growing demand, and to what extent it comes from the improvement of the competitive position of the minor port and the seizure of emerging market niches. In this approach, these relations are not distinguished, but we assumed that the total impact of the above relations is reflected in the throughput dynamic indices previously established for major ports and then treated as a reference to produce throughput forecasts for minor ports. This procedure assumes that improved port accessibility (infrastructural investments and facilities improvements) enhances minor port competitiveness, thus increases the volume of transshipments comparable to the pace of development in large seaports.
This assumption has been verified and confirmed in recent studies concerning the port of Szczecin, where the effects of improvement of port nautical accessibility on the shippers’ decisions [
36], as well as on the maritime component of supply chains, have been identified and quantified [
37].
In the Rhine–Scheldt Delta port system, both major and minor ports feature progress, although their dynamics are different regarding cargo groups and temporal trends. It allows for elaborating forecasts with the use of trends and internal and external conditions for each port and freight categories. When analysing the relationships among major and minor ports, we investigated the vulnerability potential of the main cargo group. The propensity for shifts for liquid bulk (oil and oil products, chemicals, and liquid natural gas) is very low; for dry bulk and roll-on–roll-off traffic, it is low to moderate; while for containers, it is very high. Analysing ex-post relations between major ports (Antwerp and Rotterdam) and the minor port (Zeebrugge), we found that if the major port utilisation rate of container capacity is high and/or trade and transport markets are disrupted, the smaller port experiences an increase in container turnover. Thereafter, when the major ports build up capacity and/or markets calm down, container throughput increases in large ports, while container-handling volumes in the minor port decrease.
This indicates that there are large ports that affect the small port’s volumes of container transshipment and that the container flows in the system are bi-directional, from large ports to the smaller port and from the smaller port to large ports. Inter-port relations are based on competition; small ports challenge the major ports offering free capacity, while major ports reduce outflow of containers to smaller ports, counteracted by increasing capacity. Under these conditions, the projected volume of container handling in a small port fluctuates (like in the port of Zeebrugge), and the development of the port system is subject to change, from concentration to de-concentration and vice versa.
When the further extension of capacity in major ports encounters barriers, then the phase of inter-port collaboration comes into play. Since April 2022, the ports of Antwerp and Zeebrugge have been merged and operate under one name: Port of Antwerp–Bruges. Although there are no tangible results of these institutional transitions in the short term, it is noticeably clear that this collaboration is aimed at securing strategic assets (land and container capacities), thus reducing the main constraints in the long-term development of major port.
6. Conclusions
As for the major Polish seaports (Gdańsk, Gdynia, and Świnoujście), the highest growth rate in the planning horizon (2020–2043) refers to oil and oil products (+180.6%), but this is somehow misleading because this cargo category also includes liquid natural gas, which exbibits the highest growth rate in this cargo group. The high growth rate refers to containerised cargo (totalling +136.0%), and, in case of Gdańsk, it relates to the expected development of ocean container shipping, which creates ground for reinforcing the position of Gdańsk port as the gateway within the Baltic. The predicted growth of containers in the port of Gdynia is linked with the envisaged development of European trade and container short-sea and feeder shipping. These forecasted upward trends are already considered when planning the expansion of container-handling capacity in both Polish ports.
The general cargo growth in Polish ports in 2020–2043, estimated at +128.4%, is correlated with expected trade developments of steel products and other break bulk cargo. Minor growth relates to cereals (+88.0%) and dry bulk (coal, iron ore, and other bulk) (+77.4%). In the former cargo group, the projections are subject to high uncertainty due to the high volatility in the volume and trade directions (export vs. import), as well as the strategic importance of grain and trade susceptibility to shocks. The expected low developments in dry bulk cargo, mainly coal and iron ore, are the result of the decrease in energy and material consumption and the tendency to withdraw from the use of fossil fuels. Regarding the minor port of Szczecin, throughput forecasts show that it will retain its universal character in the future, and a moderate increase in the transshipment (+6.15 million tonnes in years 2022–2043) confirms that it will serve as a complementary port to the major ports in the range.
For Rotterdam and Antwerp, the overall forecasted traffic development within the planning horizon amounts to + 177.3 million tonnes (+37.4%) and +112.6 million tonnes (+49.0%), respectively. Both ports will encounter reduced throughput volumes in dry bulk, i.e., in iron ore, coal, and scrap, but the decline dynamics are foreseen higher in Antwerp than in Rotterdam. In oil and oil products, predicted transshipment volumes exhibit a higher growth rate in Rotterdam than in Antwerp. This may be related to the differences in navigational accessibility of both ports. While the port of Rotterdam can handle vessels up to 300.000 DWT, Antwerp can receive vessels with tonnage up to 150.000 DWT. While calling to Rotterdam, both shipping carriers and shippers can enjoy considerable cost savings resulting from economies of scale [
38], which is eventually reflected in the diversified dynamics of transshipments in these two ports. Compared to Antwerp, Rotterdam port features a slower decline in dry bulk and a higher growth in oil and oil products. However, the decrease in volumes of dry bulk cargo comes from the reduced use of fossil fuels and the increased efficiency of the power and steel industries in continental Europe.
In Rotterdam, container traffic growth is estimated at +89.2 million tonnes, which is 50.3% of the overall cargo increase predicted. In Antwerp, container traffic growth is accounted for up to +76.4 million tonnes, which is 67.8% of the estimated total transshipment growth. However, these volumes and their magnitude in port turnover are highly dependent on the timing of the planned capacity extension aimed at securing container growth in both ports. In case of delays in capacity expansion and subsequent increase in congestion, container flows will look for services in the neighbouring port of Zeebrugge.
After unsuccessful attempts with container service, the port of Amsterdam is developing into a processing and distribution centre for petroleum products, and because of technology and interconnected pipeline systems, its turnover to some degree depends on volumes of oil and oil products transhipped in Rotterdam. In Amsterdam, for the total predicted increase in transshipment, amounted to +11.0 million tonnes, the share of petroleum products is +5.8 million and, for the most part, these are highly specialised products. The port of Amsterdam maximises not so much throughput volumes, but the added value of cargo processing and distribution, thus ensuring an economically viable future.
The forecasted transshipments in the port of Ghent show that: (i) the industry has reached a good level of maturity, thus traffic developments feature moderate growth rates (in the 22 years planning horizon, totalling +6.3 million tonnes, that is, by +20.9%); (ii) the port is advancing by capturing market niches (non-iron ores and agricultural dry and wet commodities); (iii) it is largely indifferent to competition from other ports in the region. The predicted volume and structure of throughput confirm that small and medium-sized ports, Ghent included, tend to develop universally.
Unlike the other nodes in the system, Zeebrugge is a port that specialises in roll-on–roll-off traffic, LNG, and container handling. Although forecast volumes of ro–ro and LNG traffic feature rather moderate fluctuations, containers are subject to dynamic and trend-increasing transshipments, reflecting bidirectional cargo flow shifts induced by the capacity utilisation level in the ports of Antwerp and Rotterdam. Problems with the efficient service of ships and containers in Antwerp and Rotterdam ports can result from capacity shortages, and/or market disruptions, and/or shocks. Whatever the reason, major ports face congestion and shipping lines are looking for alternative nodes to ensure a shorter turnaround service time for their mega-vessels. Zeebrugge is a deep-water port offering service at lower costs, hence accommodating container flows from neighbouring major ports unless these ports ensure additional capacity is operational. If the ports of Antwerp and/or Rotterdam extend their capacity, container handling stabilises or even decreases in the port of Zeebrugge, and this situation lasts until the ports of Antwerp and Rotterdam experience further problems with efficient service of the growing demand for container reloading. Therefore, the projected transshipment volumes of containers at Zeebrugge varies over time in the range from about 5.0 to 9.0 million tonnes to 12.0 million tonnes in 2043.
Finally, the limitations of this study are the result of its assumptions and the prognostic data used. When predicting port transshipment, a historical relationship between port transshipment and GDP was used. However, in the future, these relationships may change with unknown magnitude and direction. Furthermore, the projected port cargo forecasts may be affected by future unpredictable structural, social, political, and economic changes and shocks. Furthermore, as [
39] underlined, factors such as bounded rationality, inertia, and opportunistic behaviour can lead to a deviation from the predicted development of minor ports.
Further research should focus on the problems of complementarity and competition in multi-port systems. It is also essential to continue research on the geographical and functional definition of relevant port systems and to identify the relationships of competition and cooperation between ports in the system.


 The ports of Antwerp and Rotterdam are faced with congestion when the capacity utilisation rate exceeds 80%. Source: Own calculations.