Article

Particle Number Emission from Vehicles of Various Drives in the RDE Tests

1
Faculty of Civil and Transport Engineering, Poznan University of Technology, pl. M. Sklodowskiej-Curie 5, 60-965 Poznan, Poland
2
Motor Transport Institute, Jagiellonska Street 80, 03-301 Warsaw, Poland
*
Author to whom correspondence should be addressed.
Energies 2022, 15(17), 6471; https://doi.org/10.3390/en15176471
Submission received: 19 August 2022 / Revised: 28 August 2022 / Accepted: 2 September 2022 / Published: 5 September 2022

Abstract

:
In this study, the authors assessed the road emissions of several passenger cars using specialised instrumentation, of the PEMS type, to measure particle number emissions in real traffic conditions. The tests were performed on a RDE test route developed and compliant with EU guidelines. The results of the tests were discussed in terms of the direct (created in the internal combustion engine) emission of particulate matter in various road conditions. Additionally, an index was determined that characterizes the number of particles according to their diameter in relation to the content of particles in the air. A characteristic of combustion engines (gasoline, diesel) is that during a cold start of the engine, the concentration of the number of particles with diameters around 100 nm increases more than 200 times (for hybrids—300 times). On this basis, it can be concluded that particle emissions with diameters smaller than 23 nm are significant in motor vehicles powered by combustion engines, regardless of whether they are conventional or hybrid vehicles. The share of particles with diameters less than 5 nm is 66% (for diesel engines) and 40% (for gasoline engines) of all the particles.

1. Introduction

European passenger car emissions standards are one of the strictest in the world. Until the end of 2020, the Euro 6d-Temp emission standard was in force, and from 1 January 2021—Euro 6d. With its introduction, a comprehensive requirement for type-approval testing came into effect, taking into account road emission testing of vehicles in real traffic conditions. It is not without reason that the European Union has become the determinant of such emission rigor. Year after year, air quality in large European urban areas is deteriorating, and the number of people that falls ill as a result is rising. Various factors contribute to this, including motor transport, which is responsible (depending on the lie of the land) for as much as 70% of air pollution. Taking into account the increasing “restrictions” imposed by the European Commission, the authors of this article decided to refer to the emission of exhaust pollutants in terms of particulate matter. Particulate matter with a diameter of less than 1 μm penetrates directly into the bloodstream, even leading to death. The parameters of particulate matter emitted from internal combustion engines determine their limitation. For a dozen or so years, the number of particulates emitted in vehicle exhaust has been a major problem. Unfortunately, only internal combustion vehicles fuelled with hydrogen will not—in the future—emit particles of nanometric size.
Transportation is an important part of the modern economy. The impact of the COVID-19 pandemic and the resulting restrictions have significantly affected passenger transportation. In order to prevent the spread of the virus, people have significantly changed their transportation habits, reducing the use of public transportation in favour of personal vehicles. According to mobility analyses, due to restrictions and fear of infection, the number of public transportation passengers has decreased (by about 30%) [1,2], while the number of people using a personal vehicle regularly has increased (by about 25%) [3,4], both as drivers and passengers. This indicates a problem with public transportation and the inability to replace private vehicles, especially in times of crisis.
Boldizsár et al. [5] examined the trends in changes in the vehicle population in the European Union countries, and the relationship between road freight transport and population development in the studied countries was analysed from an economic point of view. The study found no correlation between social and freight transport indicators in the European Union Member States. On the other hand, there is a correlation in the economic dimension.
According to the European Parliament, almost 30% of total carbon dioxide emissions within the European Union come from the transport sector; 72% come from road transport, of which the share of passenger vehicles is as high as 60.7%. For this reason, it is important to reduce exhaust emissions from car exhaust systems [6], especially in diesel engines [7]
There are many solutions to reduce exhaust emissions. According to [8], by 2020, start–stop functional systems (micro hybrid) will almost completely replace traditional purely ICE (internal combustion engine) systems (Figure 1). The development of more electrified topologies is growing rapidly, relative to today’s very low sales volumes, but remains at a low level. Therefore, the sum of the market share of mild hybrids (electric installation 48 V), full hybrids, plug-in hybrids, and battery electric vehicles will be just over 10%. In the subsequent 5 years, a distinctive growth in mild hybrids (2025: 33% market share), plug-in hybrids (2025: 13% market share), and battery electric vehicles (2025: 8% market share) is expected.
Due to increasingly stringent standards, manufacturers are using various solutions to reduce not only the gaseous components of exhaust gases but also, most importantly, particulate matter. Particulate matter also includes nanoparticles that cannot be seen, which are the most dangerous to human health and life. One approach is the use of alternative fuels [9] such as bioethanol, butanol, or oxymethylen ether [10], for example, which is not valid for biodiesels [11]. The next step is the electrification of powertrains. FEV assumes a significant future share of electrified vehicles. However, looking ahead to 2030, 80% of vehicles will still be powered by hybrids using internal combustion engines [12].
The authors, in their previous work, undertook the possibility of the emission evaluation of conventional, hybrid, and electric vehicles under real traffic conditions, pointing out the required further research on this topic. In [13], a comparative assessment was made of the energy consumption under different traffic conditions of passenger vehicles with different propulsion systems. The lowest total energy consumption under real traffic conditions is that of an electric vehicle, which is about 10% higher for a plug-in hybrid gasoline vehicle, and it is the highest for an internal combustion vehicle (30% higher than an electric vehicle). Another article [14] also made an ecological environmental assessment of N2-and N3-category trucks, showing that trucks in the latter category significantly exceed particulate emission standards. Articles [15,16] present the authors’ categorization of vehicles in terms of environmental performance, determining their aspects under real traffic conditions. A four-stage environmental categorization was used, and the division was made using the fulfilment of requirements in RDE (real driving emissions) tests.
This means that the problem of exhaust emissions from automobile transport will continue to be significant. In urban areas, excessive emissions of exhaust pollutants (especially nitrogen oxides and particulate matter) may contribute not only to poorer air quality but also to increased morbidity among residents. According to [17], atmospheric pollution by nanoparticles negatively affects human health and the environment. Particles with a diameter of 10 µm or smaller can cause various diseases, primarily heart and lung diseases and associated deaths. In accordance with [18], published by the National Institute of Public Health—National Institute of Hygiene, it appears that, between 2005 and 2017, the phenomenon of smog (mainly contains suspended dust) was responsible for an average of about 3800 deaths per year. Air pollution is a significant problem, especially during the autumn and winter. The main reason for this is considered to be heating systems, which require the burning of fuels including coal. However, this is not the only problem. Automobile transportation is also responsible for air pollution. This problem is increasingly recognized, especially in large cities. For this reason, the EU is trying to legally regulate the maximum emissions of passenger cars, among others, through strict limits on individual exhaust pollutants.
The more distant view towards 2030 is, today, still uncertain. The interaction of the development of the plug-in hybrid market share and the sales volumes for battery-powered vehicles is not yet predictable and is primarily linked to the development progress of battery technology (energy density and price), the development of the charging infrastructure, and the development of oil prices.

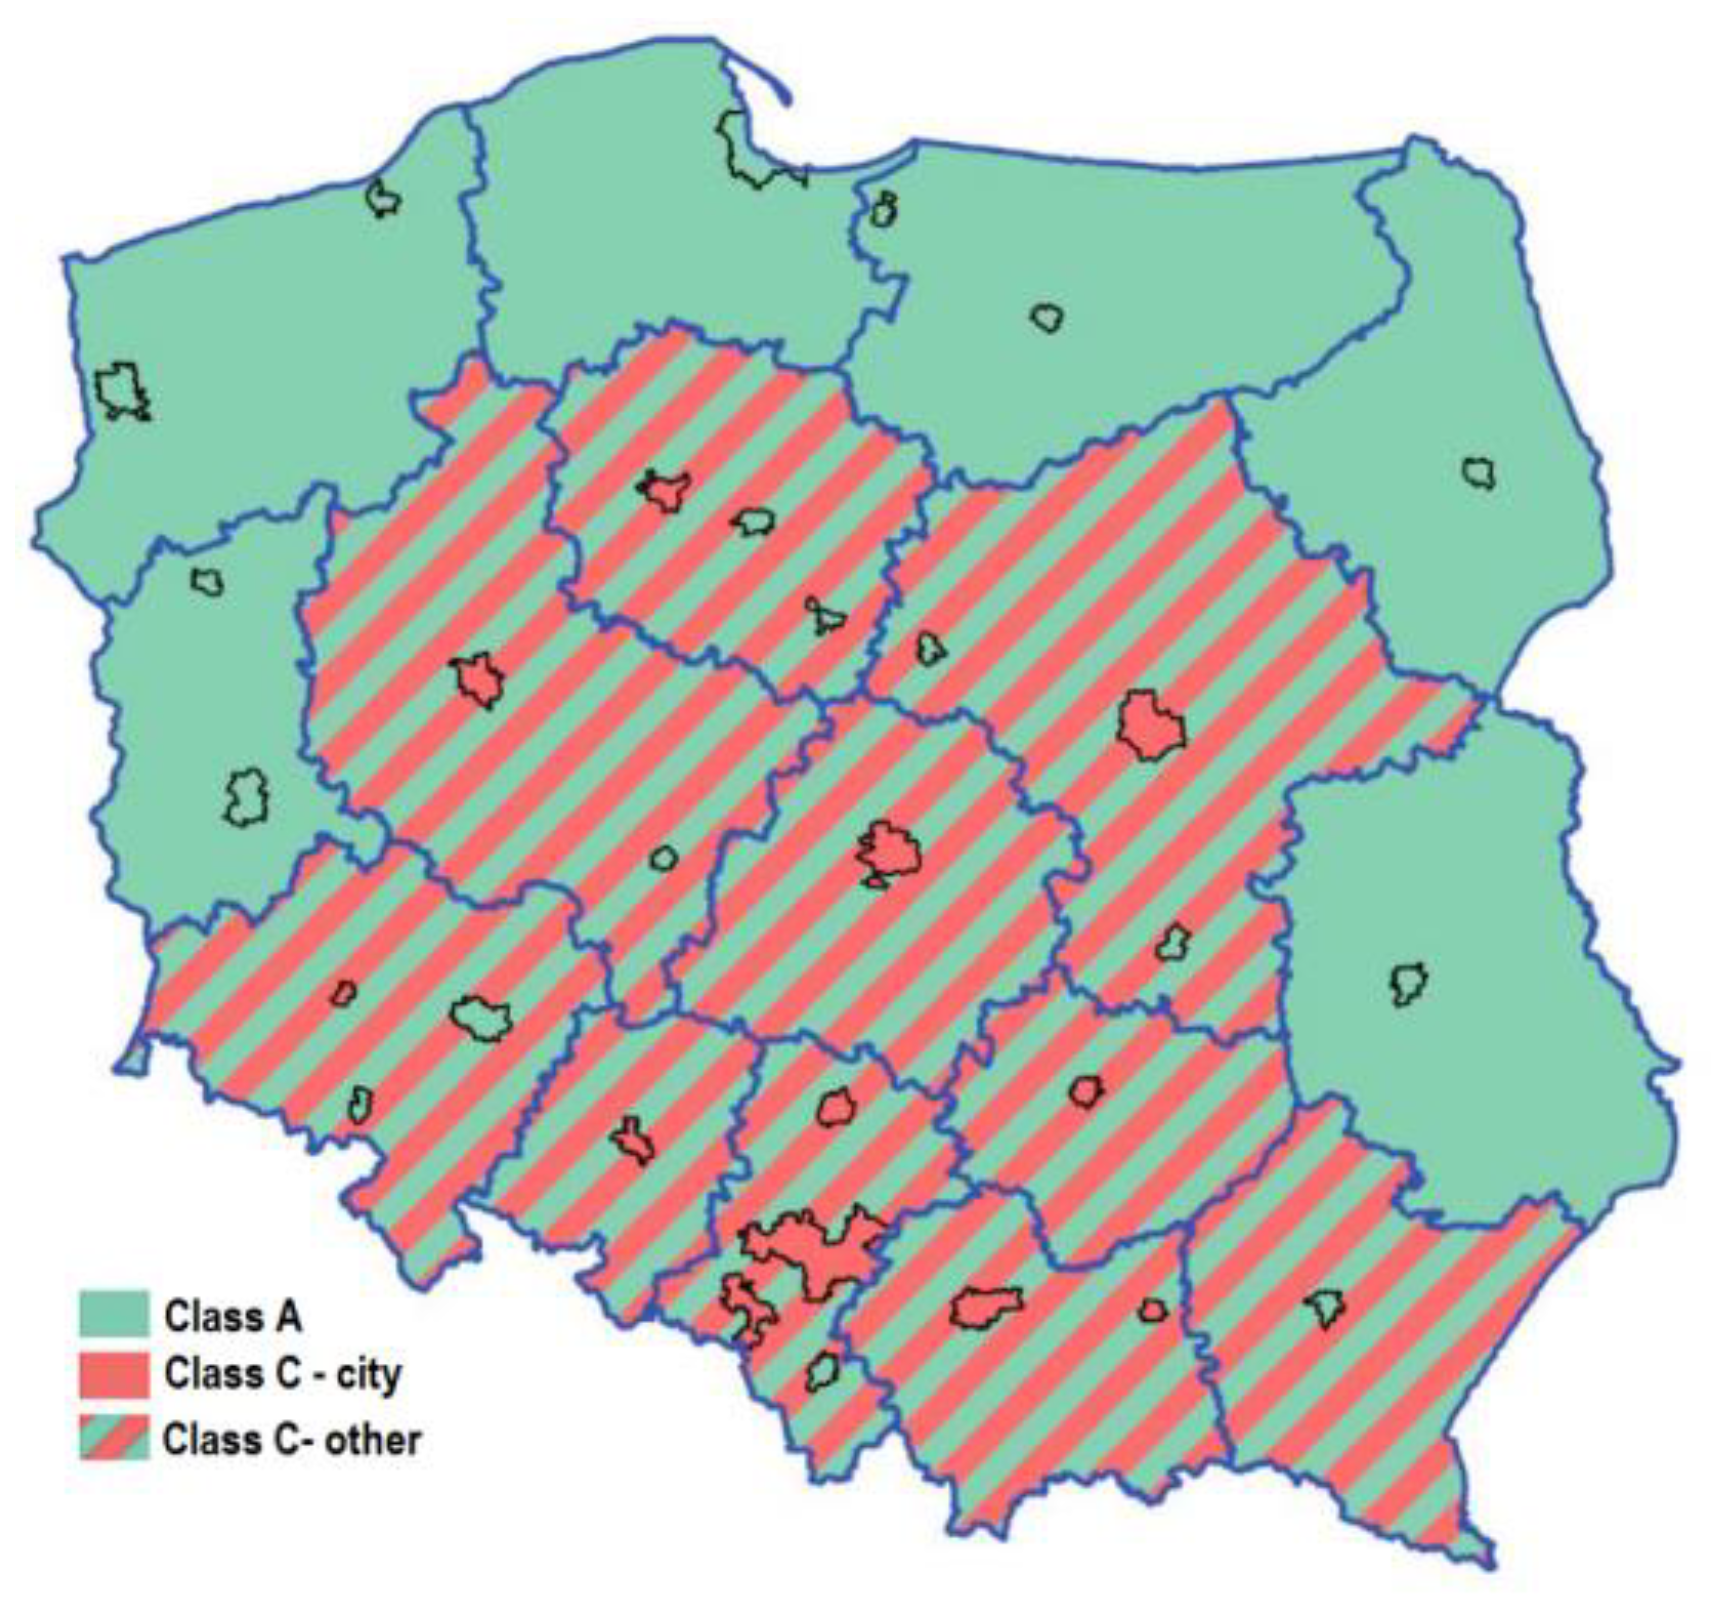
2. Emission of Particulate Matters in Poland

The Chief Inspectorate for Environmental Protection surveyed the country (Poland) and then published a report on the annual assessment of air quality, in accordance with the principles set forth in Article 89 of the Law—Environmental Protection Law [19]. The air quality assessment was performed by zone, and the result was the assignment of a class to each zone for each of the assessed pollutants. According to the adopted methodology, for example, assigning class A to a zone means that no exceedances of the normative concentration values of a given pollutant in force in Poland were found in its territory in a specific year.
According to the annual assessment, in the case of concentrations of particulate matter (PM10), the classification of zones was adopted according to the parameters: the permissible level for 24 h concentrations and the permissible level for annual average concentrations.
In the 2019 assessment of PM10 particulate matter, 7 of the 12 agglomerations were classified as class C. In the previous year, 10 agglomerations received class C. In the area of 5 of the 18 zones—cities with more than 100,000 inhabitants—exceedances were found, resulting in their assignment to class C [20]. This means a significant deterioration of air quality (Figure 2 and Figure 3).
The study also identified the main reasons for PM exceedances. In the case of 24 h PM10 (PM was above 50 μg/m3), the main cause was the impact of emissions related to individual building heating. However, the contribution of emissions related to vehicle traffic was also marked (for 29% of the zones with exceedances). This is no different for PM2.5 emissions, with the main source being the combustion of fossil fuels for building heating. Road transport, in this case, is responsible for about 10% of national PM2.5 emissions. Taking into account the place and height of the introduction of traffic pollutants into the atmosphere, it can be concluded that in the central parts of agglomerations (with a dense grid of streets with heavy vehicle traffic), road emissions from cars can be the determining factor in the occurrence of the exceedances of limit values [20].
The situation with particulate emissions from both automobile transport and heating could be solved by increasing the share of renewable energy sources (RES). Unfortunately, the development of this sector in the country is quite slow. According to [21], in 2030, Poland will have a share of RES of about 19%. The leader in this regard will be the Netherlands (59%). The European average is expected to be 27% (Figure 4).

3. Number of Particle Matters

The particle number (PN) problem has been recognized in the European Union for a long time. For this reason, the PN emissions of particles > 23 nm have been controlled, since 2011 for diesel vehicles and since 2014 for gasoline direct-injection vehicles [22]. Studies related to PN emissions are carried out all over the world. Korea is a case in point. In this case, to monitor the greenhouse gases and vehicle exhaust emissions from and establish emission factors for the transportation sector, National Institute of Environmental Research (NIER) test modes have been used for experimental test modes, because NIER test modes reflect driving patterns in Seoul. The test modes consist of 15 test cycles numbered from 0 to 15, and every single one takes into account diverse traffic conditions. According to the results, a significant impact on CO2 and PN emissions was determined. In conclusion, it is highlighted that the most influential test condition over the whole range of test modes is the use of the air conditioner, in which both the CO2 and PN emission levels increased. One of the test modes tested the impact of the starting temperature parameter. A cold engine start requires sufficient time for the warming-up process of the engine and aftertreatment systems that reduce harmful exhaust gases. Because the air–fuel ratio becomes richer, and the spark timing is delayed, the PN emission level increased by approximately three times and the CO2 emission level increased by 6.1%, compared with those under a warmed-up engine start. The PN emission results also increased from 6.65 × 10¹¹ #/km to 2.86 × 10¹² #/km, and most of the increase occurred in phase, which included the engine start and warming-up processes.
The laboratory-type approval of vehicles was augmented by on-road real-driving emissions testing with portable emissions measurement systems (PEMS) [23]. PEMS, due to their small size and simpler design, may have higher measurement uncertainty compared to laboratory-grade equipment [24]. PEMS measure undiluted exhaust gas with all the associated challenges [25].
In contrast to studies assessing instruments for ambient air or personal exposure, the assessment of PN PEMS is limited [26]. The studies gave maximum differences of 50% (light-duty) [27] to 65% (heavy-duty) [28] to the laboratory systems, for the majority of cases. This measurement uncertainty is taken into account when the vehicles are assessed on the road.
The authors of [29] focused their research on measuring PN below 23 nm, emitted from a spark-ignition DI/PFI engine using an EEPS system connected to a sample conditioning device. The engine was fuelled with ethanol, both pure and a 30% blend. The bulk of the emissions were shown to consist of PN smaller than 23 nm, and the number of particles varied with fuel, injection strategy, and operating conditions. The authors note that a cold start does not increase the emissions of small-sized nanoparticles.
Another paper [30] studied the emissions of PN larger than 10 nm and 23 nm in a WLTC test and in real traffic conditions, using two particle counters (PNCs). They showed that PN10 emissions were 32% and 15% higher than PN23 in Worldwide harmonized Light duty vehicles Test Cycle (WLTC) and laboratory RDE cycles, respectively.
In [31], the researchers studied a gasoline direct-injection vehicle using two reference particle-count-measurement systems. The tests were conducted at several certified laboratories, which conducted measurements using their own nanoparticle-emission-measurement systems. They found that the vehicle’s emissions (from cold and hot starts) ranged from 1 to 15 × 1012 #/km, with a 10%–50% ratio of particles smaller than 23 nm in diameter compared to those larger than 23 nm.
At the same time, in recent studies of hybrid vehicles, for example, the authors of [32] point out that a cold start is important for testing particles with diameters smaller than 23 nm. A plug-in hybrid diesel vehicle meeting the Euro 6d standard was tested. The gaseous emissions in the laboratory and on various test routes were less than the requirements of the standard; however, emissions of N2O and PN smaller than 23 nm were higher during a cold start in road tests.
The cited data from various studies demonstrate the significant problem of testing particulates in the range of less than 23 nm, but insufficient consideration has been given to the issue holistically. What would be required would be a comparison of several vehicles with different power systems in terms of particulate emissions, primarily under actual traffic conditions. This approach also means that comparisons have been made for vehicles that are currently in use, and their usefulness is confirmed by public interest.

4. Purpose of the Article

The purpose of this article is to evaluate the comparative amount of particulate matter in all parts of the RDE test (cold start, urban driving, rural driving, motorway driving) of vehicles characterized by different types of propulsion units that are currently used on the market. Among the cars tested, the main focus was on the variety of drive units: gasoline, diesel, mild hybrid, and plug-in hybrid. The tests were carried out under real traffic conditions, using a PEMS-PN type measuring apparatus to measure the number of particulate matter and, in addition, to determine the concentration of selected exhaust pollutants (carbon dioxide) and exhaust flow rate.
An additional objective was to determine an index that would characterize the number of particulates, according to their diameter, produced by vehicles, in relation to the content of particulates in the air. This is a new issue that has not been previously considered in publications by other authors.

5. Methodology

5.1. Test Objects

Four passenger cars were used for the study. Each was characterized by a different powertrain; however, the cars had relatively similar engine displacements and power indicator. Selected technical data of the test objects are listed in Table 1.

5.2. Road Test–Description

The test subjects have been tested in real traffic conditions. The research route was in Poznan and its vicinities. It was determined according to the EU-wide directive, which contains all the guidelines [33,34]. Thus, the road was planned in such way that it included a cold-start procedure, as well as urban, rural, and motorway sections. What is worth emphasizing is that the tests were performed on the same day (in respective driving modes). One driver drove the vehicles, with the same load (driver, passenger, and measurement equipment). The test subjects have been tested in real traffic conditions.
The RDE test route was selected in accordance with the requirements of the standard (Package 4), in which the basic requirements for the different parts of the test are as follows:
  • urban: a maximum driving speed of up to 60 km/h, a minimum distance of 16 km, and a share of about 34% of the total (±10%);
  • rural: speed range 60–90 km/h, minimum distance of 16 km, and a share of about 33% of the total (±10%);
  • motorway: speed range above 90 km/h, minimum distance of 16 km, and a share of about 33% of the total (±10%).
The tests were repeated 3 times on the same measuring route (without changing the direction). The final values of emissions did not differ by more than 10%. The values shown in the article are representative values for the given parameter category.

5.3. Measurement Equipment

The exhaust emission levels from the tested vehicles were analysed with the use of SEMTECH DS portable system by Sensors Inc. The device was placed in the vehicle, and a flowmeter was connected to the exhaust unit to measure the exhaust flow levels (selected depending on the engine displacement).
The device is equipped with analysers, through which it is possible to measure the concentration of such substances as carbon dioxide, carbon monoxide, hydrocarbon, nitrogen oxides (including nitric oxide and nitrogen dioxide), oxygen, and exhaust mass intensity. Each analyser has a different range and accuracy. A nondispersive infrared analyser is used to measure carbon dioxide concentration, which has a measurement range of 0% to 20% and a measurement accuracy of 2.5%. Other analysers of the system not used during the tests are a flame ionization detector to measure hydrocarbon concentration, a non-dispersive ultraviolet detector to measure nitrogen oxides, and an electrochemical analyser to measure oxygen concentration. The flue gas flow rate is measured from 0 kg/h to 500 kg/h, with an accuracy of ±1% [35].
Data from the vehicle’s diagnostic system, GPS, ambient temperature, and pressure measurement system were also recorded. Those values are recorded with 1 Hz frequency; thus, it is possible to observe dynamic changes in the concentration of harmful substances in exhaust gases [35].
EEPS spectrometer was second used device. Particles enter the instrument as part of the aerosol inlet flow through a cyclone with a 1 μm cut. Next, the particles pass through an electrical diffusion charger, in which ions are generated. These mix with the particles and electrically charge them, to provide a predictable charge level based on particle size. The charger is mounted in-line with the analyser column and is located at the top of the instrument. Particles then enter the sizing region through an annular gap, where they meet a stream of particle-free sheath air. The sizing region is formed by the space between two concentric cylinders. The outer cylinder is built from a stack of sensing electrode rings that are electrically insulated from each other. The electrodes are connected to a very sensitive charge amplifier, also called an electrometer, with an input near ground potential. The inner cylinder is connected to a positive high voltage supply, which forms the high voltage electrode. This creates an electric field between the two cylinders. While the positive-charged particles stream with the sheath air from the top to the bottom of the sizing region, they are also repelled from the high voltage electrode and travel towards the sensing electrodes. Particles that land on the sensing electrodes transfer their charge. The generated current is amplified by the electrometers, digitized, and read by a microcontroller. The data are processed in real time to obtain 10 particle size distributions per second [36].

6. Results

6.1. Test Requirements

The tests of the described vehicles were performed under real traffic conditions (RDE). All of them were conducted at a similar time and in similar weather conditions. During the tests, the driver was the same, which excluded the influence of different driving styles on the realization of the tests and their results. The realization of the sample tests, i.e., the waveforms of driving speed as a function of road, is shown in Figure 5. The figures show differences in the speed waveforms for the individual tests; however, the analysis performed after the test was fully executed, so did not disqualify any of them—the parameters for the tests were within acceptable limits (according to the standards).
Moreover, a comparison of the shares of driving speed and acceleration (made for a broader presentation of the similarity of the test results) made it possible to conclude that they were in good agreement. This was additional evidence for the possibility of comparing the results, that is, for further analysis of the obtained test results (Figure 6). The characteristics shown in the figures make it clear that the largest share of vehicle work is in stopping the vehicle (a share of 13%–16% of the total test time) and vehicle speed in the range from 12 m/s to 15 m/s (43–54 km/h). The speed ranges for the other acceleration values were also characterized by considerable similarity.

6.2. Dynamic Parameters of Tests

To be valid, an RDE test must be carried out within specified boundary conditions, with respect to overall test characteristics as well as traffic dynamics. To assess traffic dynamics, two requirements have been introduced in the RDE legislation: the 95th percentile (P95) of v∙apos (for apos ≥ 0.1 m/s2) and the average RPA. The parameter v∙apos, the product of vehicle speed and positive acceleration, is commonly used as an indicator for high(er) dynamics of a trip, and RPA, the relative positive acceleration, is used an indicator for the lack of dynamics in a trip. These two RDE trip dynamics parameters are determined in three speed bins, i.e., the ‘urban’ (below 60 km/h), the ‘rural’ (60 to 90 km/h), and the ‘motorway’ speed bins (above 90 km/h). With the average speed per speed bin, the result is three pairs of an average speed and a dynamics parameter [37] (Figure 7 and Figure 8).
For the vehicles tested, their driving dynamics were similar. None of them exceeded the permissible values, falling within the allowed range. Among the differences, slightly higher driving dynamics can be noted for vehicle 1 compared to the other vehicles. Vehicle 4, on the other hand, had the lowest value of the RPA parameter in the urban part. Moreover, in the rural and motorway parts, vehicle 4 had slightly lower driving dynamics compared to the other vehicles tested. The differences, which are normal for RDE tests, were not so large that they were considered similar to each other.

6.3. Comparison of Particle Number Distribution for Each Part of the RDE Test

In tests of vehicles under real-driving conditions, the dependence of the number of particulates and their aerodynamic diameters were recorded. Depending on the type of propulsion system used in the vehicles, the particles were of different sizes, and their numbers depended on the parts of the RDE test. The following parts of the RDE test were analysed:
  • cold start—the period of the first 300 s after the engine is started (for a plug-in hybrid vehicle—the engine was started in the middle of the test);
  • urban part of the RDE test (including the start-up period);
  • motorway part of the RDE test;
  • the whole RDE test.
Analysis of the data obtained showed that the highest concentration of the number of particles occurs during cold start—regardless of the type of vehicle tested. However, there are differences in their number of particles (#) and in their size (diameter size). For vehicle 1 (gasoline) (Figure 9, ①), during cold start, the highest number of particles was located in the 80–100 nm range. For vehicle 2 (diesel) (Figure 9, ②), the highest concentrations occurred for particles between 40 nm and 60 nm in diameter. Hybrid vehicles were characterized differently: for the mild hybrid (Figure 9, ③), the values were from 40 nm to 60 nm, with a concentration of about 20,000 #/cm3. In contrast, for the plug-in vehicle, the particle concentration was about 28,000 #/cm3, which was due to the internal combustion engine being turned on during high-speed operation (Figure 9, ④). This was the first engine start-up, so the particle concentration due to significant engine load was about 50% higher than for other vehicles, where engine start-up occurred at idle—without significant engine load.
The analysis of the concentration of the number of particles in the different parts of the RDE test is also not insignificant. Examination of individual parts showed significant differences in their concentration and characteristic diameter (found in the highest concentration) depending on the powertrain. In the case of vehicle 1 (gasoline) (Figure 10, ①), a significant increase in the number of particles ranging from 19 nm to 34 nm is evident for motorway driving. A smaller number of particles was recorded in the urban and rural parts (with dominant diameters in the 60–100 nm range).
A different distribution of the number of particles occurred for vehicle 2 (diesel) (Figure 10, ②), for which a lower concentration of particles and a shift of their characteristic diameter to the left, towards smaller diameter values, were observed (mainly by the effective operation of the particle filter).
Other characteristics were observed for hybrid vehicles. For the mild hybrid vehicle (Figure 10, ③), in which the internal combustion engine shut down very often during the urban phase, particulate concentrations were significant mainly due to engine cooling at standstill. Such cooling of the engine and, with it, the exhaust aftertreatment systems has a major impact on the particulate matter emitted, obviously at the expense of reduced fuel consumption.
The plug-in hybrid vehicle in the RDE test started driving using its electric motor, and its internal combustion engine was only switched on during the off-road portion (Figure 10, ④). This condition caused the internal combustion engine to start during high speed, so there was no time for the low-load warm-up phase of the engine. The increased load caused the average concentration of particulate matter in the rural section to be the highest of all vehicles, at around 10,000 #/cm3. A consequence of the increased load was also the large diameter of the emitted particles, which were in the range of 80 nm to 100 nm.

7. Discussion

In order to compare the obtained results of particle number concentration in different phases of the test to the value of their concentration in the surrounding air (in particular diameter ranges), the authors proposed a dimensionless index. It denotes the multiplicity of the increase in the particle number concentration, under the given measurement conditions, to the value of the particle number concentration in the ambient air, for a particular particle diameter. Since one is comparing quantities that change linearly over a very wide range, and relative changes are of most interest, this ratio is described by the formula:
L = 10 log (PNE,D/PNA,D) [dB],
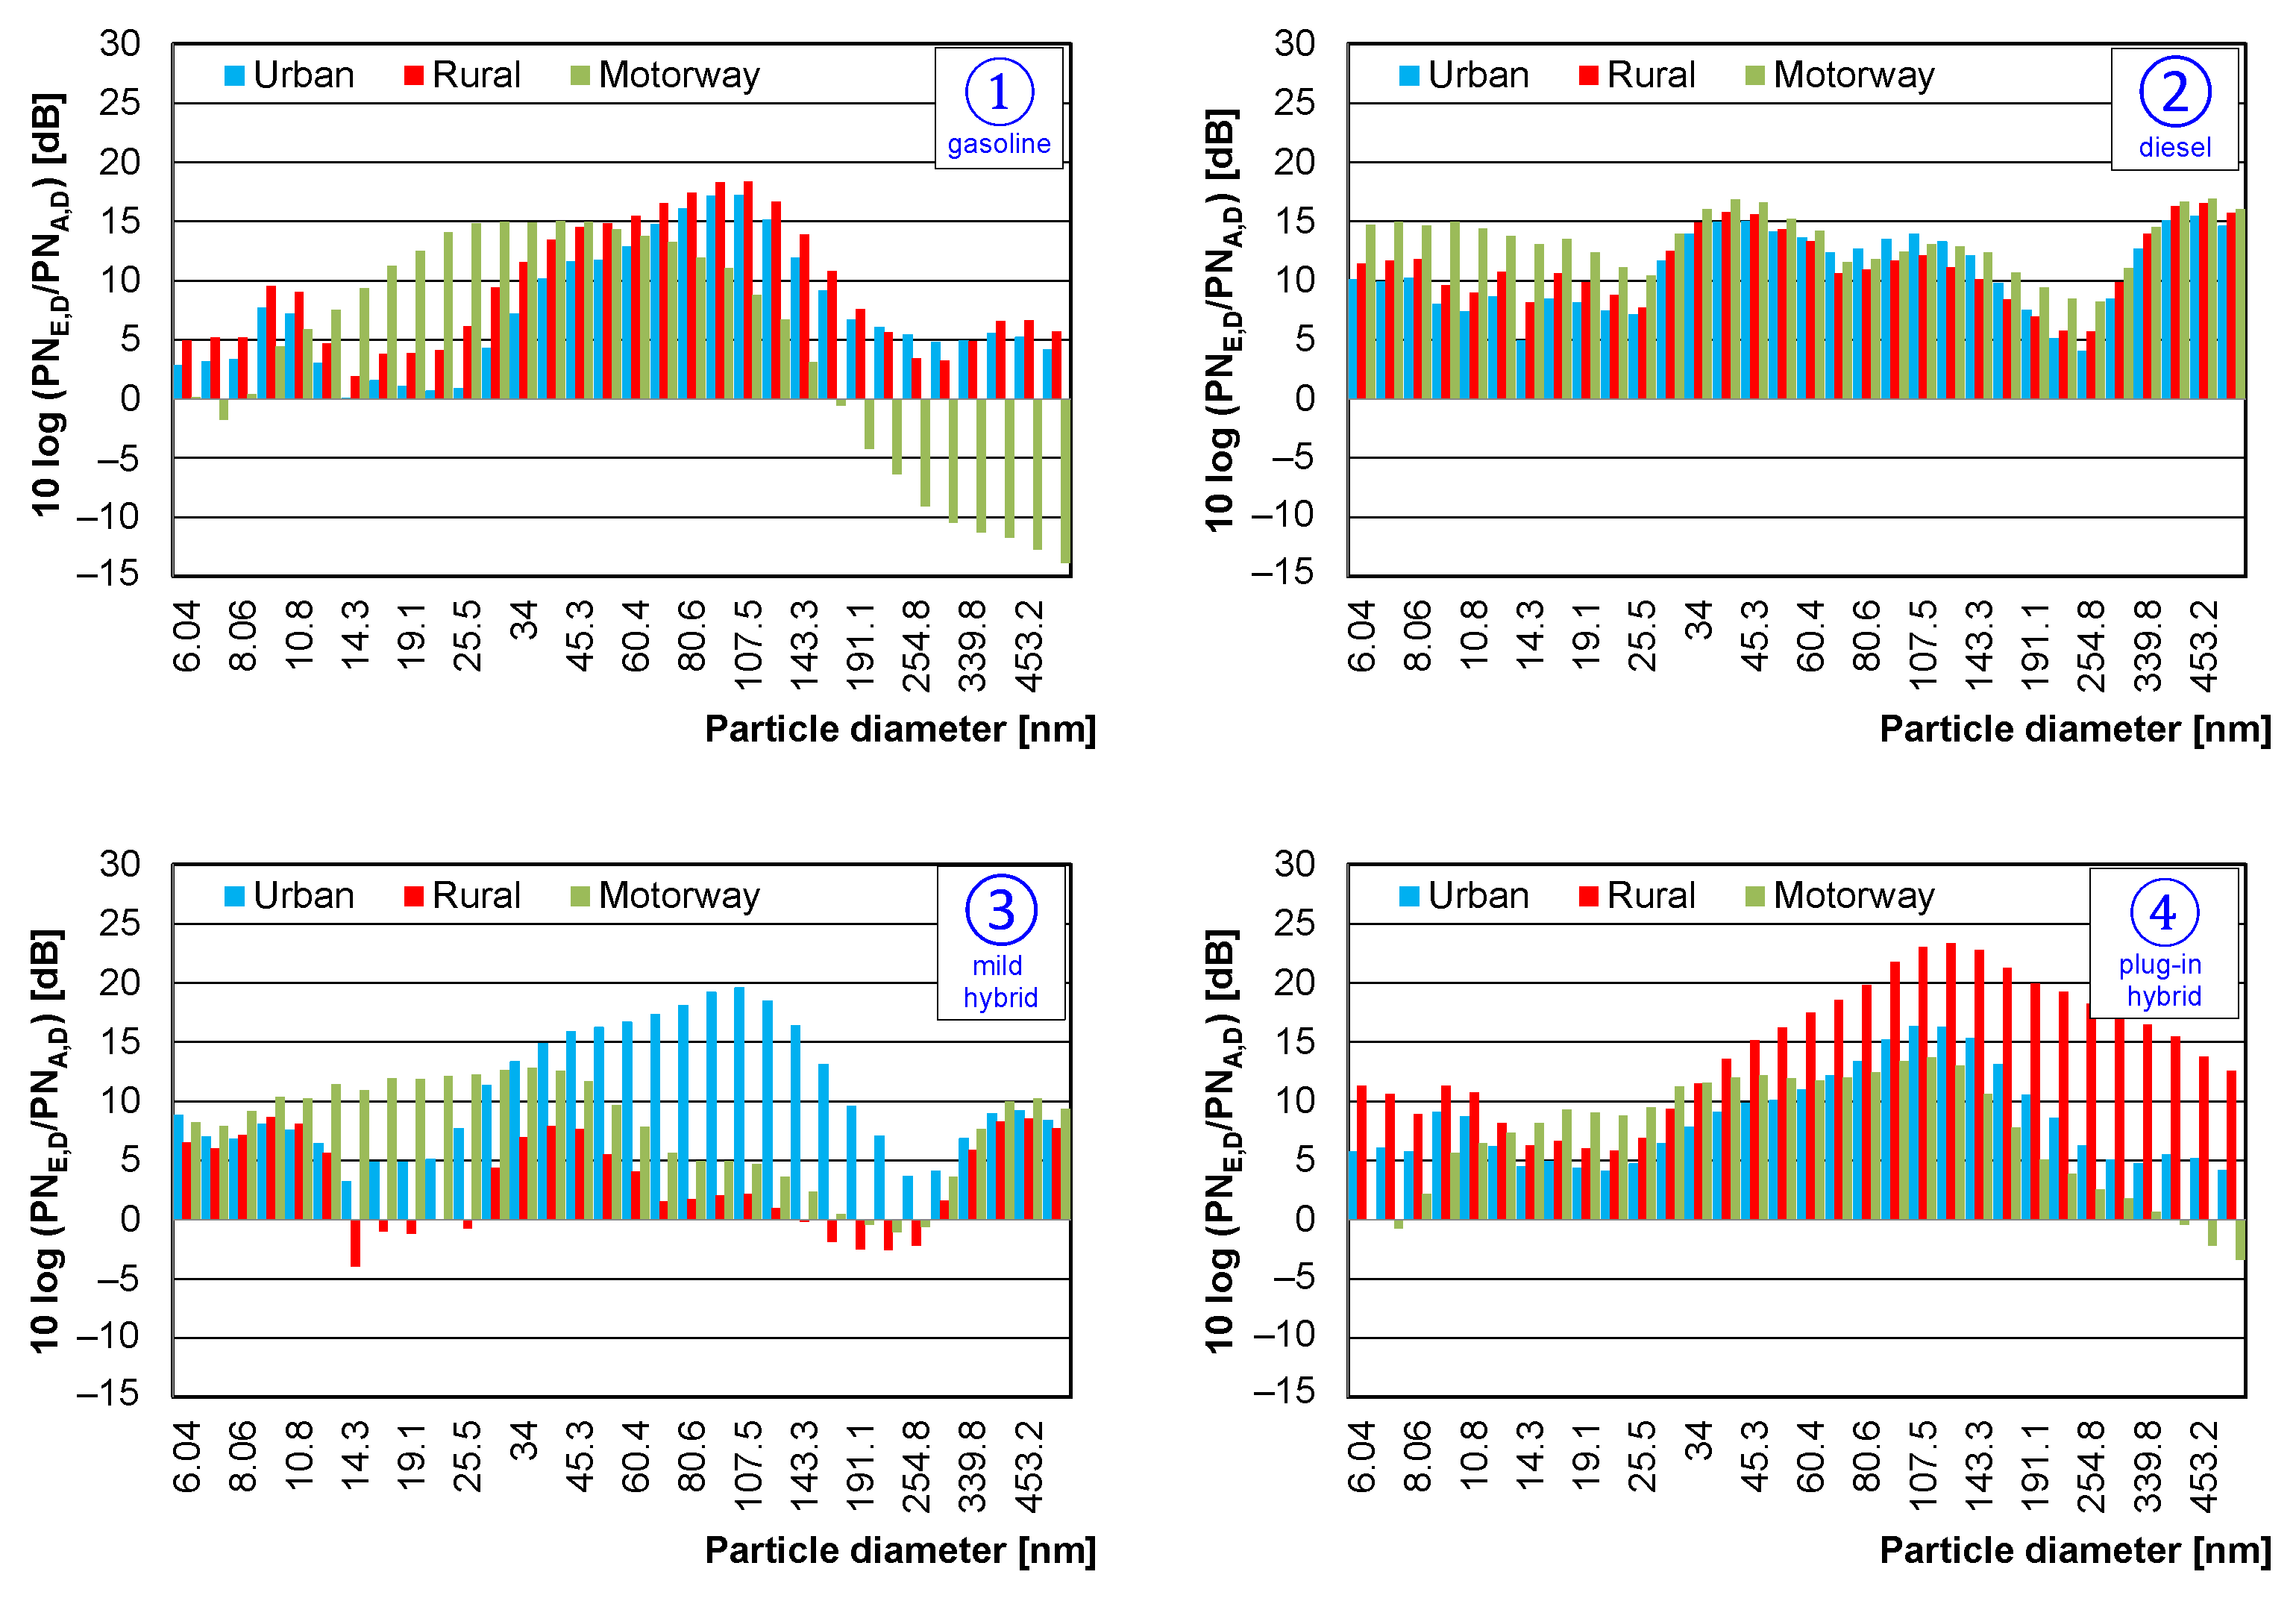
  • L—particle number change indicator [dB];
  • PNE,D—concentration of the number of D-diameter particles in the exhaust gas [#/cm3];
  • PNA,D—concentration of the number of particles of diameter D in the air [#/cm3].
On the basis of the comparison, it was found that the characteristic of gasoline and diesel engines is that, during a cold start of the engine, the concentration of the number of particles with diameters around 100 nm increases more than 300 times (L = 25 dB), in relation to the content in the air. In contrast, during the entire RDE test, the concentration of the number of particles with diameters between 25 nm and 100 nm increases 30 to 100 times (L = 15 dB and 20 dB, respectively) (Figure 11, ①, ②). For the mild hybrid vehicle, the increase in the number of particles was the smallest amounting to 2–3 dB, which translates into the fact that during a cold start-up of the engine, the number of particles of given diameters increases by 100% (Figure 11, ③). Such a relationship is mainly dictated by the fact that the cold start of the engine occurs (as in conventional engines) during the initial period of driving the vehicle. Therefore, the nature of changes in the number of particles as a dependence on their diameter is very similar to a conventional vehicle powered only by an internal combustion engine. The comparison of the particle spectrum is different for a plug-in hybrid vehicle, in which the cold start occurred during the rural phase of the RDE test. Such a start-up at a very low SOC (state of charge), during an increased driving speed, forced a high load on the engine, resulting in an increased particulate number. This increased particle count (for diameters of 30–150 nm) was characteristic throughout the test, which was a consequence of the engine starting in the rural phase (Figure 11, ④).
This indicator was used to determine the increase/decrease characteristics of the number of particulates in the different phases of vehicle testing: during the cold start of the internal combustion engine in the urban, rural, and motorway parts of the RDE test. A very important informative factor of the indicator is that its negative values show the cleaning function of the vehicle—the number of particles of given diameters emitted from the vehicle is less than the number of particles in the air. This effect is very evident for a gasoline-powered vehicle during the motorway phase (Figure 12, ①), where the concentration of particles from the vehicle is 30 times smaller than in the air. For the other vehicles, such a large effect was not recorded, with only a very small similar correlation for the plug-in hybrid vehicle. For the conventional diesel-powered vehicle (Figure 12, ②), similar particle increase rates were recorded for all phases of the test for the entire range of their diameters. Only the urban phase is notable here, in which this increase was about 15 dB for particles in the 6–20 nm range, confirming the attention paid to this fact by other authors. At the same time, this phase has a very large impact on particle emissions throughout the test, which is also taken into account in the RDE regulations, which now mandate compliance with the requirements for emission factors in the urban part of the RDE test and throughout the test.
Particle increase rates for hybrid vehicles were of a different nature. For the mild hybrid vehicle, the urban phase was characteristic, with large indicator values (about 15–20 dB for particles with diameters of 30–150 nm) (Figure 12, ③). This was the effect of the urban phase, in which the frequency of engine starting was the highest, and, at the same time, the acceleration value was the highest. This resulted in the formation of large-diameter particles as a result of short-term increased engine load. The effect of running the plug-in hybrid vehicle’s engine in the extra-urban part is very evident from the particle-count-increase graph (Figure 12, ④). Starting the internal combustion engine at speeds in excess of 60 km/h with a significant engine load resulted in the formation of particles with very large diameters, the number of which is several times greater than in the other phases. This results in the fact that, despite the reduction in particulate matter in plug-in hybrid vehicles in the urban part, unfortunately, during trips on longer routes, the environmental aspects are not satisfactory. During high-speed driving, when the internal combustion engine turns on when the SOC is approaching its minimum value, the particulate emissions are significantly higher than the other types of vehicles.
When considering the total number of particulates from the studied vehicles, it should be noted that the vehicles were characterized by similar levels of values, which makes it possible to conclude that they have similar environmental values. However, a detailed analysis shows that the number of particulates emitted in each phase is significantly different for the vehicles studied. For a conventional gasoline-powered vehicle (Figure 13, ①), the proportion of particulate matter (D > 23 nm) in the test phases was as follows: urban—2%, rural—4%, and motorway—94%. This means that by far the largest share of particulates is emitted in the motorway phase, where the exhaust gas flow rate is the highest; though, at the same time, based on Figure 12, ①, it should be kept in mind that the particulate filter used reduces the largest particulates produced in this test phase. A similar proportion of particles was observed in other measurement ranges, with an increase in the number of particles for the larger measurement range. For particle diameters D > 19 nm, the increase was 10%; for D > 10 nm, the value was 25% greater; and for particles with a diameter of D > 5 nm, the number of particles was 27% greater than the reference measurement (D > 23 nm).
The total number of particulates for a conventional diesel-powered vehicle was lower compared to a gasoline-powered engine, at 1.25∙1013 units. Moreover, the proportion of particulates in the different phases of the test was different, which may be due to the effectiveness of the particulate filter for such an engine and the entire exhaust aftertreatment system. In the urban phase, the share was 40%; in the rural phase, the share was25%; and in the motorway phase, the share was 35%. Similar proportions of shares were also maintained when considering the number of particulates for other diameter measurement ranges (Figure 13, ②). For diesel-powered vehicles, it is very important for the initial range of particle diameters to be considered; for particle diameters D > 19 nm, the increase was 9%; however, already for D > 10 nm, the value was 97% higher, and for particles with a diameter of D > 5 nm, the number of particles was 183% higher compared to the reference measurement (D > 23 nm). This means that for diesel-powered vehicles, the proportion of particles with very small diameters (D < 10 nm) is significant, while at the same time the filtration efficiency of such particles is very low.
For the mild hybrid vehicle (Figure 13, ③), particle number values were obtained that were consistent with the type of engine used. The overall nature of the changes in the evaluated parameters was similar to the gasoline-powered engine. However, the use of an electric motor in this vehicle reduced the total number of particles (1.8 × 10¹³ units), compared to vehicle ①. The proportion of particulate matter by phase was more similar to the gasoline-powered vehicle (urban—20%, rural—15%, motorway—65%). Moreover, the number of particles similarly increased when the initial particle diameter was taken into account. For particle diameters D > 19 nm, the increase in the number of particles was 5%; for D > 10 nm, the number of particles was 27% higher; and, for particles with a diameter of D > 5 nm, the number of particles was 42% higher, compared to the reference measurement (D > 23 nm).
The particle count values for the plug-in hybrid vehicle (Figure 13, ④) were similar to the previous hybrid vehicle (with a similar internal combustion engine used). However, the reduced proportion of internal combustion engine operation throughout the test reduced the overall particle count (1.6∙1013 units), compared to the ③ vehicle. The proportion of the number of particulates in each phase was similar to the mild hybrid vehicle and was 10% in the urban phase, 20% in the rural phase, and 70% in the motorway phase. The number of particles was higher when the initial particle diameter value was smaller. For particle diameters D > 19 nm, their number was 9% higher; for D > 10 nm, the value was 33% higher; and, for particles with a diameter of D > 5 nm, the number of particles was 38% higher compared to the reference measurement (D > 23 nm).
On this basis, it can be concluded that the particle emissions with diameters smaller than 23 nm are significant in motor vehicles powered by internal combustion engines, regardless of whether they are conventional or hybrid vehicles. The share of particles with diameters of less than 5 nm is:
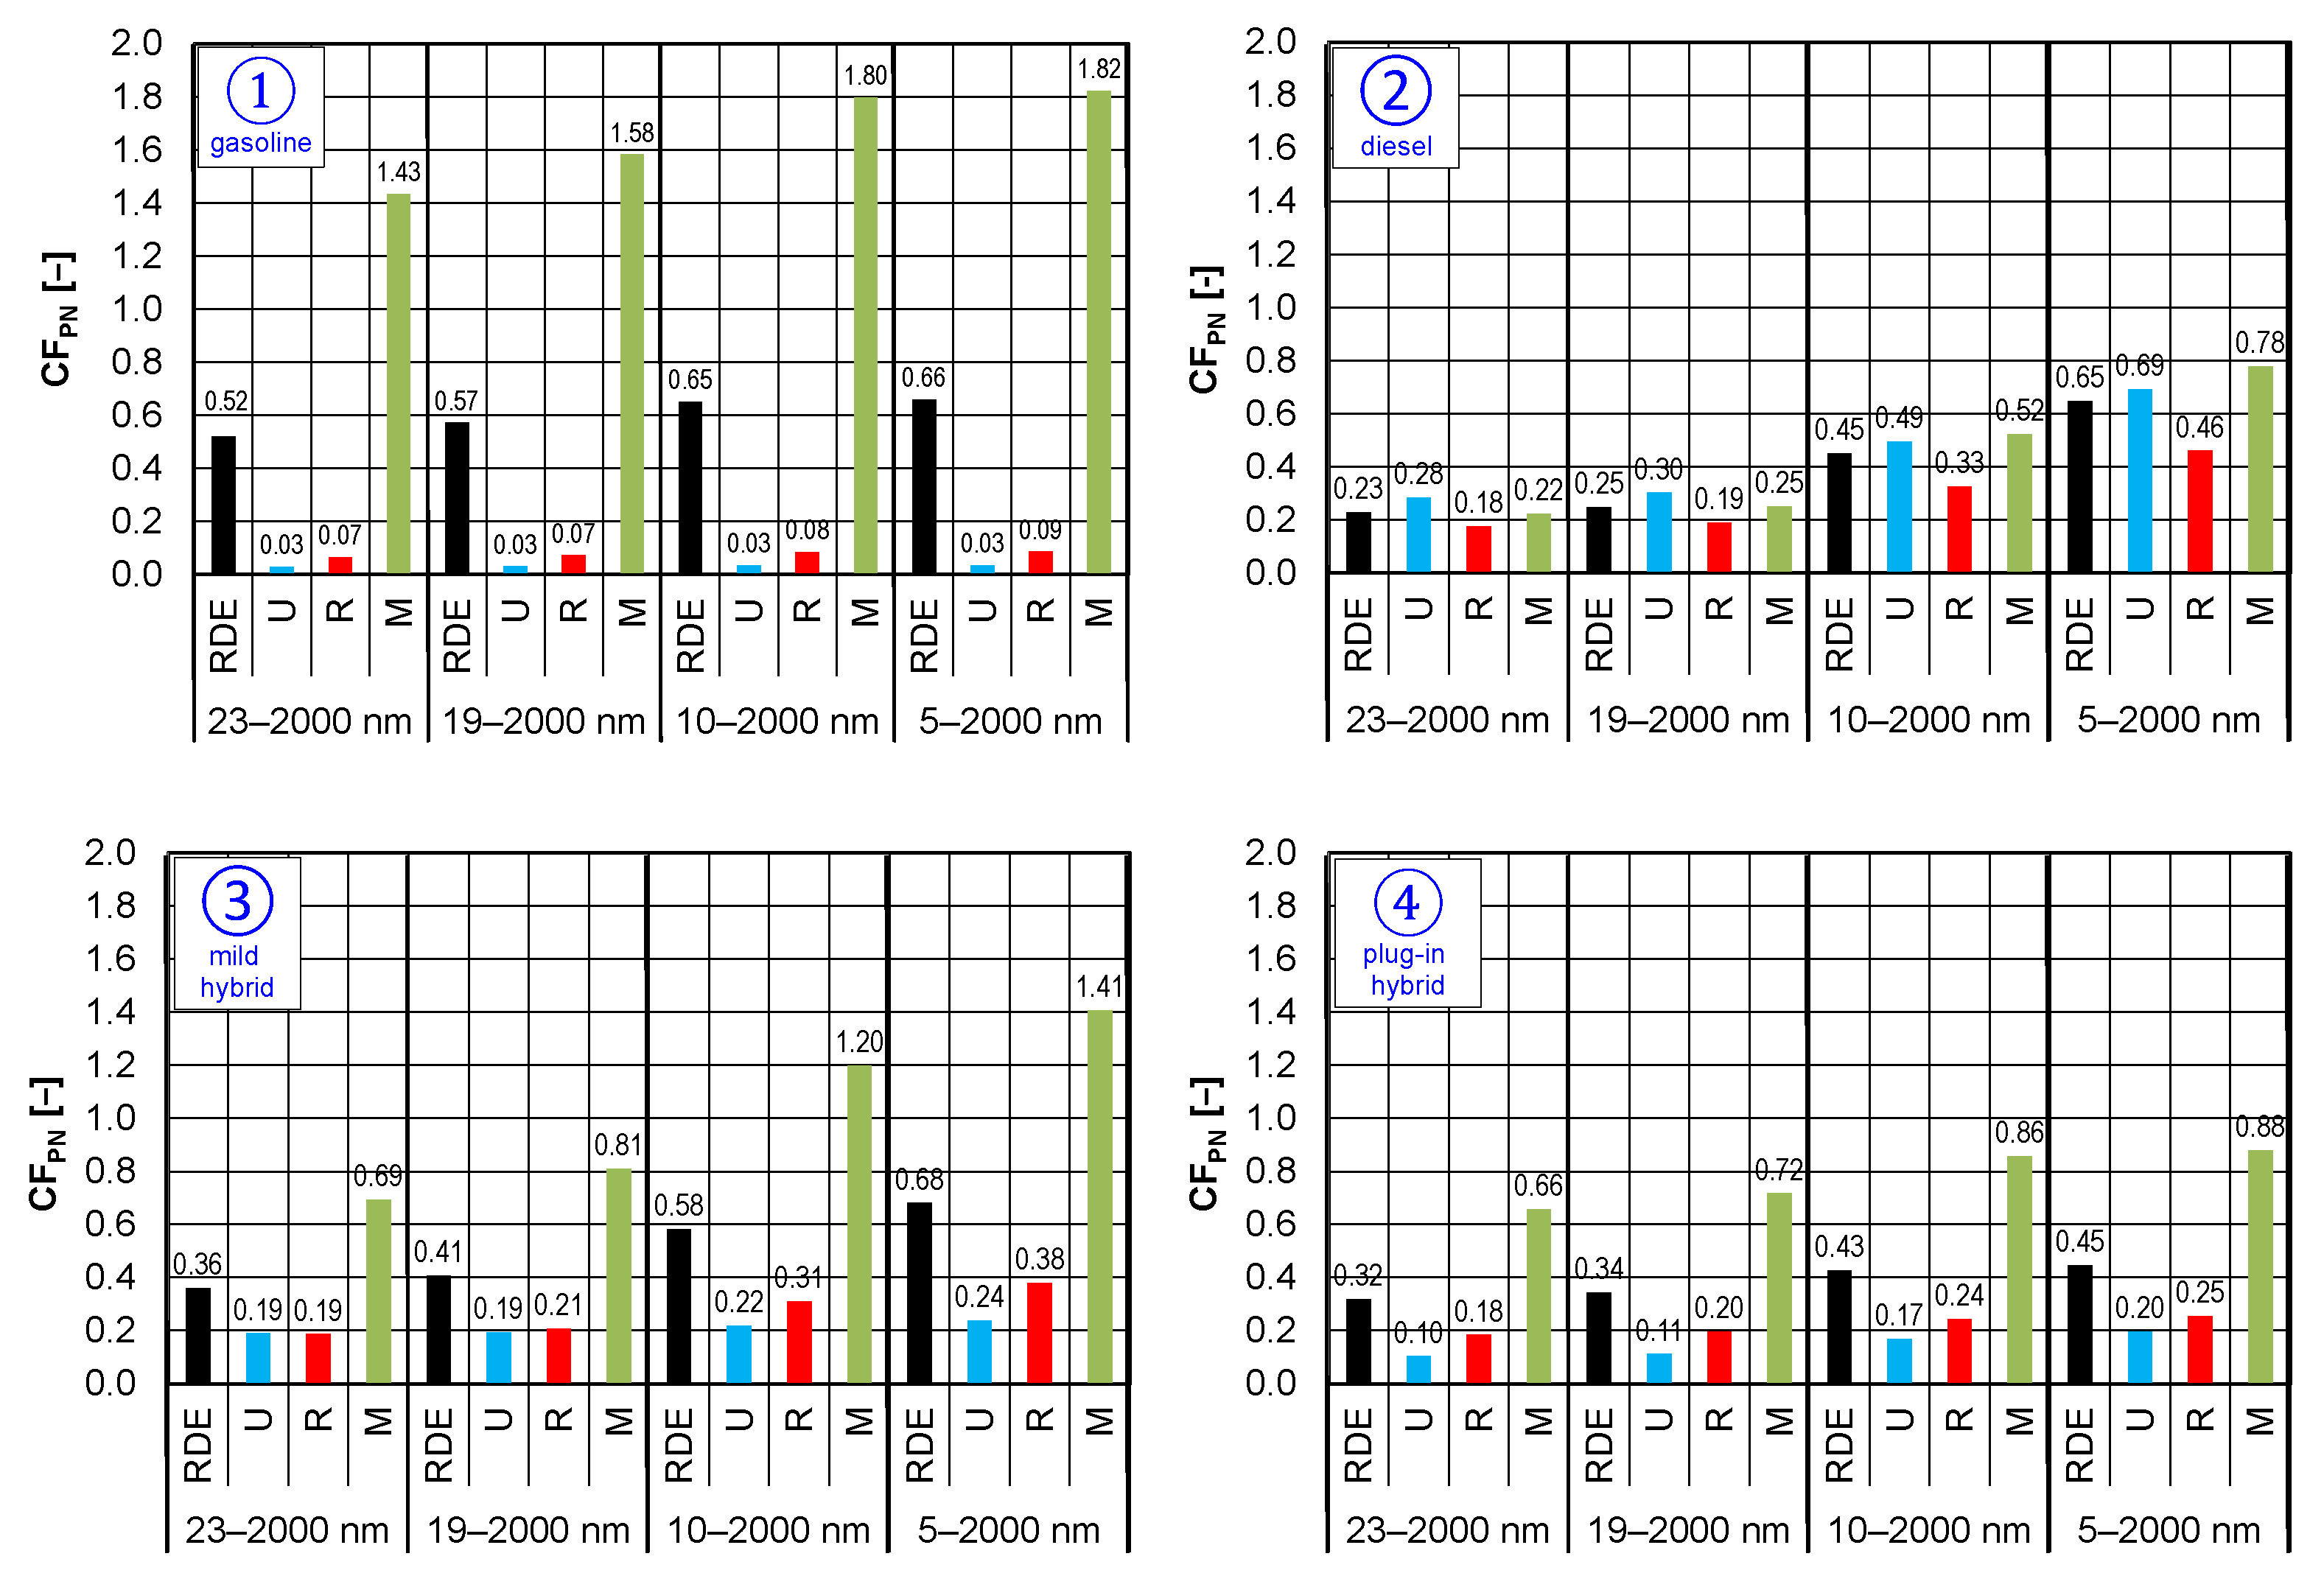
  • For diesel engines: about 200% of the number of particles with D > 23 nm;
  • For gasoline engines: about 30%–40% of the number of particles with D > 23 nm.
The research carried out allowed for estimating the particle count contribution to RDE tests of conventional and hybrid vehicles depending on the test phase, the cold start phase, and the initial diameter of the particles considered. Consideration of the initial diameter of particulate matter is important in terms of the introduction of future regulations for exhaust gas toxicity tests. A reduction in this diameter will result in a significant increase in the number of particles, which may cause the conformity factor (CF) values for the number of particles to be exceeded. Such a comparison against the tests performed is shown in Figure 14, which shows that a conventional gasoline-powered vehicle exceeds (CFPN = 1.5) only in the motorway phase, when considering particles with initial diameter D < 19 nm (Figure 14, ①). The provision of CFPN = 1, which should be in effect from Euro 7 onward, is also met under all conditions.
For a vehicle equipped with a diesel-powered engine, the CFPN values are always less than 1 (Figure 14, ②). This means that the exhaust after-treatment systems on such vehicles do their job regardless of the test phase and allow them to meet the requirements for small particles. Although the increase in the number of particles with diameters below 23 nm is significant (almost three times the number), the very small value of particles with diameters over 23 nm results in them not exceeding their emission limits (CFPN = 0.78—in the worst case).
As for the mild hybrid vehicle (Figure 14, ③) a similar relationship is observed as for the gasoline-powered vehicle, which is as expected. The CF index is met in each case for the entire RDE test (CFPN = 0.36–0.68) and for the urban phase (CFPN = 0.19–0.24), regardless of the consideration of the initial particulate measurement diameter. Only in the rural phase were two cases of exceeding the value equal to 1 (CFPN = 1.2 and 1.42) observed, when testing for particles with a diameter of D > 10 nm and D > 5 nm, respectively.
Conformity factor values for the plug-in hybrid vehicle (Figure 14, ④) represent a compromise between the mild hybrid vehicle and the conventional gasoline-powered vehicle. The CF index takes values less than 1, for all cases considered—for the entire RDE test (CFPN = 0.32–0.45) and for the urban phase (CFPN = 0.10–0.20). This means that despite running the engine under the conditions of significant internal combustion engine load and speed, emission factors with regard to particulate matter are not exceeded.

8. Conclusions

The major conclusions of the paper can be summarized in the following points:
  • The highest concentration of the number of particles (for D = 30–100 nm) occurs during cold start—regardless of the type of vehicle tested.
  • The article determines an index that characterizes the number of particulates according to their diameter produced by vehicles, in relation to the content of particulates in the air. The value of the index is:
    • for a gasoline engine: L = 20 dB (for RDE test) and L = 25 dB (for cold start); it is for the diameter of particles D = 60–120 nm;
    • for a diesel engine: L = 20 dB (for RDE test, D = 30–60 nm) and L = 25 dB (for cold start, D = 100–120 nm);
    • for a mild hybrid: L = 15–20 dB (for RDE test, D = 30–120 nm) and L = 20–22 dB (for cold start, D = 60–140 nm);
    • for a plug-in hybrid: L = 20–25 dB (for RDE test, D = 70–150 nm) and L = 25–30 dB (for cold start, D = 80–150 nm).
  • Particle emissions with diameters smaller than 23 nm are significant in motor vehicles powered by combustion engines, regardless of whether they are conventional or hybrid vehicles. The share of particles with diameters of less than 5 nm is 66% (for diesel engines) and 40% (for gasoline engines) of all the particles.
  • The conformity factor for the number of particles for a vehicle equipped with:
    • a gasoline-powered engine is three times higher in the motorway phase than in the overall RDE test;
    • a diesel-powered engine is similar in each phase of the RDE test;
    • a hybrid (mild and plug-in) powered engine is two times higher in the motorway phase than in the overall RDE test.
The studies carried out do not exhaust the issue under consideration but are only an indication of the possibility of assessing the number of particles as well as the dissonance between the parameters determined. Reducing the initial diameter of particulate matter in both type-approval and on-road tests will again involve changing the equipment and its approval for use; at the same time—which is the most negative effect—this will not reduce particulate matter emissions in cars already in use. All the achievements presented in the article concern vehicles approved according to the Euro 6d emission standard, while (using Poland as an example) 80% of vehicles (or more) are equipped with older engines, in which particulate emissions are many times higher than the considered measurement ranges. Therefore, the next aspect to be resolved is to assess the number of particulates from vehicles already in operation and take measures to increase the environmental requirements of vehicles at the stage of, for example, annual maintenance.

Author Contributions

Conceptualization, W.G., M.G. and J.P.; methodology, K.S., W.G. and J.P.; formal analysis, W.G., J.P., M.G. and K.S.; investigation, W.G., M.G., J.P. and K.S.; resources, J.P. and K.S.; data curation, J.P. and K.S.; writing—original draft preparation, J.P., M.G., K.S. and W.G.; writing—review and editing, J.P. and K.S.; visualization, J.P. and K.S.; project administration, J.P., K.S. and M.G. All authors have read and agreed to the published version of the manuscript.

Funding

This research was funded by Poznan University of Technology, grant number 0415/SBAD/0338.

Institutional Review Board Statement

Not applicable.

Informed Consent Statement

Not applicable.

Data Availability Statement

The data presented in this study are available on request from the corresponding author.

Conflicts of Interest

The authors declare no conflict of interest.

Abbreviations

aacceleration vehicle
Aair
broad exhaust emission
CFconformity factor
Eexhaust
FCfuel consumption
FEVForschungsgesselschaft für Energietechnik und Verbrennungsmotoren
HEVhybrid electric vehicle
ICEinternal combustion engines
Lparticle number change indicator
Mmotorway
NEDCNew European Driving Cycle
NIERNational Institute of Environmental Research
PEMSportable emission measurement system
PHEVplug-in hybrid electric vehicle
PNparticle number
PNCparticle counter
Rrural
RDEreal driving emissions
RESrenewable energy sources
RPArelative positive acceleration
Sdistance
SOCstate of charge
ttime
ushare
Uurban
Vvehicle speed
WLTCWorldwide harmonized Light duty vehicles Test Cycle
WLTPWorldwide harmonized Light duty vehicles Test Procedure

References

  1. Szczepanek, W.K.; Kruszyna, M. The Impact of COVID-19 on the Choice of Transport Means in Journeys to Work Based on the Selected Example from Poland. Sustainability 2022, 14, 7619. [Google Scholar] [CrossRef]
  2. Statistic Poland. Transport of Goods and Passengers in 2021. Available online: https://stat.gov.pl/en/topics/transport-and-communications/transport/transport-of-goods-and-passengers-in-2021,9,10.html (accessed on 12 July 2022).
  3. Poland Passenger Transport: Vehicles. Related Indicators for Poland Passenger Transport: Vehicles. Available online: https://poland/freight-and-passenger-traffic/passenger-transport-vehicles (accessed on 5 July 2022).
  4. Transport of the Future. Report on Prospects for the Development of Road Transport in Poland in 2020–2030. Available online: https://www.pwc.pl/pl/pdf-nf/2019/report-transport-of-the-future-2019.pdf (accessed on 27 June 2022).
  5. Boldizsár, A.; Meszaros, F.; Torok, E. Social and Economic Analysis of the EU Road Freight Transport Fleet. Cogn. Sustain. 2022, 1, 2. [Google Scholar] [CrossRef]
  6. European Environment Agency. Status of Air Quality in Europe 2022. Available online: https://www.eea.europa.eu/publications/status-of-air-quality-in-Europe-2022 (accessed on 1 August 2022).
  7. Nyerges, Á.; Zöldy, M. Verification and Comparison of Nine Exhaust Gas Recirculation Mass Flow Rate Estimation Methods. Sensors 2020, 20, 7291. [Google Scholar] [CrossRef] [PubMed]
  8. The Future Drives Electric? FEV Study Examines Drivetrain Topologies in 2030. Available online: https://magazine.fev.com/en/fev-study-examines-drivetrain-topologies-in-2030-2/ (accessed on 12 November 2021).
  9. Merkisz, J.; Pielecha, J. Nanoparticle Emissions from Combustion Engines; Springer Tracts on Transportation and Traffic–STTT; Springer: Berlin/Heidelberg, Germany, 2015. [Google Scholar]
  10. Virt, M.; Arnold, U. Effects of Oxymethylene Ether in a Commercial Diesel Engine. Cogn. Sustain. 2022, 1, 1. [Google Scholar] [CrossRef]
  11. Alahmer, A.; Rezk, H.; Aladayleh, W.; Mostafa, A.O.; Abu-Zaid, M.; Alahmer, H.; Gomaa, M.R.; Alhussan, A.A.; Ghoniem, R.M. Modeling and Optimization of a Compression Ignition Engine Fueled with Biodiesel Blends for Performance Improvement. Mathematics 2022, 10, 420. [Google Scholar] [CrossRef]
  12. Mild-Hybrid-Diesel-Powertrain. Mild-Hybrid-Diesel-Powertrain with a Pre-Turbine Exhaust Aftertreatment. Available online: https://magazine.fev.com/en/mild-hybrid-diesel-powertrain-with-a-pre-turbine-exhaust-aftertreatment/ (accessed on 23 July 2022).
  13. Pielecha, J.; Skobiej, K.; Kurtyka, K. Exhaust Emissions and Energy Consumption Analysis of Conventional, Hybrid, and Electric Vehicles in Real Driving Cycles. Energies 2020, 13, 23. [Google Scholar] [CrossRef]
  14. Skobiej, K.; Pielecha, J. Plug-in Hybrid Ecological Category in Real Driving Emissions. Energies 2021, 14, 8. [Google Scholar] [CrossRef]
  15. Gis, W.; Gis, M.; Pielecha, J.; Skobiej, K. Alternative Exhaust Emission Factors from Vehicles in On-Road Driving Tests. Energies 2021, 14, 12. [Google Scholar] [CrossRef]
  16. Pielecha, J.; Skobiej, K.; Kubiak, P.; Woźniak, M.; Siczek, K. Exhaust Emissions from Plug-in and HEV Vehicles in Type-Approval Tests and Real Driving Cycles. Energies 2022, 15, 7. [Google Scholar] [CrossRef]
  17. Gwinn, M.R.; Vallyathan, V. Nanoparticles: Health Effects—Pros and Cons. Environ. Health Perspect. 2006, 114, 12. [Google Scholar] [CrossRef] [PubMed] [Green Version]
  18. Wojtyniak, B.; Goryński, P. Health Status of Polish Population and its Determinants 2020; National Institute of Public Health, National Institute of Hygiene: Warsaw, Poland, 2020. Available online: https://www.pzh.gov.pl/download/21915/ (accessed on 18 June 2022).
  19. Państwowy Monitoring Środowiska–Główny Inspektorat Ochrony Środowiska, Opracowanie: INFAIR, IOŚ-PIB. Available online: https://www.gios.gov.pl/images/dokumenty/raporty/Informacja_o_realizacji_zadan_IOS_2021.pdf (accessed on 15 May 2022).
  20. Report: Assessment of Air Quality in Zones in Poland for 2019. State Environmental Monitoring. 2019; pp. 54–83. Available online: https://powietrze.gios.gov.pl/pjp/documents/download/105626 (accessed on 12 May 2022).
  21. Vision or Division? What NECPs Tell Us about the EU Power Sector in 2030. Available online: https://ember-climate.org/project/necp7/?fbclid=IwAR3eLo_88PVQwrpRemz4pwGjBPu4pt_zCovYDxp77aVfUpKwvNCP-c0-ayk (accessed on 12 November 2021).
  22. Kim, K.; Chung, W.; Kim, M.; Kim, C.; Myung, C.; Park, S. Inspection of PN, CO2, and Regulated Gaseous Emissions Characteristics from a GDI Vehicle under Various Real-World Vehicle Test Modes. Energies 2020, 13, 2581. [Google Scholar] [CrossRef]
  23. Giechaskiel, B.; Lähde, T.; Gandi, S.; Keller, S.; Kreutziger, P.; Mamakos, A. Assessment of 10-nm Particle Number (PN) Portable Emissions Measurement Systems (PEMS) for Future Regulations. Int. J. Environ. Res. Public Health 2020, 17, 3878. [Google Scholar] [CrossRef] [PubMed]
  24. Giechaskiel, B.; Joshi, A.; Ntziachristos, L.; Dilara, P. European Regulatory Framework and Particulate Matter Emissions of Gasoline Light-Duty Vehicles: A Review. Catalysts 2019, 9, 586. [Google Scholar] [CrossRef]
  25. Giechaskiel, B.; Bonnel, P.; Perujo, A.; Dilara, P. Solid Particle Number (SPN) Portable Emissions Measurement Systems (PEMS) in the European Legislation: A review. Int. J. Environ. Res. Public Health 2019, 16, 4819. [Google Scholar] [CrossRef]
  26. Bergmann, M.; Kirchner, U.; Vogt, R.; Benter, T. On-road and Laboratory Investigation of Low-Level PM Emissions of a Modern Diesel Particulate Filter Equipped Diesel Passenger Car. Atmos. Environ. 2009, 43, 1908–1916. [Google Scholar] [CrossRef]
  27. Giechaskiel, B.; Casadei, S.; Mazzini, M.; Sammarco, M.; Montabone, G.; Tonelli, R.; Deana, M.; Costi, G.; Di Tanno, F.; Prati, M.V.; et al. Inter-Laboratory Correlation Exercise with Portable Emissions Measurement Systems (PEMS) on Chassis Dynamometers. Appl. Sci. 2018, 8, 2275. [Google Scholar] [CrossRef]
  28. Giechaskiel, B.; Schwelberger, M.; Delacroix, C.; Marchetti, M.; Feijen, M.; Prieger, K.; Andersson, S.; Karlsson, H.L. Experimental Assessment of Solid Particle Number Portable Emissions Measurement Systems (PEMS) for Heavy-Duty Vehicles Applications. J. Aerosol Sci. 2018, 123, 161–170. [Google Scholar] [CrossRef]
  29. Catapano, F.; Di Iorio, S.; Magno, A.; Sementa, P.; Vaglieco, B.M. Measurement of Sub-23 nm Particles Emitted from PFI/DI SI Engine Fueled with Oxygenated Fuels: A Comparison between Conventional and Novel Methodologies. Energies 2022, 15, 2021. [Google Scholar] [CrossRef]
  30. Guo, D.; Ge, Y.; Wang, X.; Liu, H.; Su, S.; Li, C.; Tao, T. Sub-23 nm Particle Emissions from China-6 GDI Vehicle: Impacts of Drive Cycle and Ambient Temperature. Atmosphere 2022, 13, 1216. [Google Scholar] [CrossRef]
  31. Lähde, T.; Giechaskiel, B.; Martini, G.; Woodburn, J.; Bielaczyc, P.; Schreiber, D.; Huber, M.; Dimopoulos Eggenschwiler, P.; Fittavolini, C.; Florio, S.; et al. Reproducibility of the 10-nm Solid Particle Number Methodology for Light-Duty Vehicles Exhaust Measurements. Atmosphere 2022, 13, 872. [Google Scholar] [CrossRef]
  32. Selleri, T.; Melas, A.; Ferrarese, C.; Franzetti, J.; Giechaskiel, B.; Suarez-Bertoa, R. Emissions from a Modern Euro 6d Diesel Plug-In Hybrid. Atmosphere 2022, 13, 1175. [Google Scholar] [CrossRef]
  33. Commission Regulation, 2008, 692/2008 of 18 July 2008 Implementing and Amending Regulation (EC) 715/2007 of the European Parliament and of the Council on Type-Approval of Motor Vehicles with Respect to Emissions from Light Passenger and Commercial Vehicles (Euro 5 and Euro 6) and on Access to Vehicle Repair and Maintenance Information, European Commission (EC), L 199. Available online: http://data.europa.eu/eli/reg/2008/692/oj (accessed on 15 November 2021).
  34. Commission Regulation, 2016, 2016/427 of 10 March 2016 Amending Regulation (EC) No. 692/2008 as Regards Emissions from Light Passenger and Commercial Vehicles (Euro 6), Verifying Real Driving Emissions, L 82. Available online: http://data.europa.eu/eli/reg/2016/427/oj (accessed on 15 November 2021).
  35. Gaseous and Exhaust Flow Measurement SEMTECH® DS+ for Light-Duty. Available online: https://sensors-inc.com/Products/SEMTECH/DS_Plus_Light_Duty (accessed on 15 June 2022).
  36. Engine Exhaust Particle Sizer (EEPS) 3090. Available online: https://tsi.com/products/particle-sizers/fast-particle-sizer-spectrometers/engine-exhaust-particle-sizer-(eeps)-3090/ (accessed on 15 June 2022).
  37. Commission Regulation, 2018, 2018/1832 of 5 November 2018 Amending Directive 2007/46/EC of the European Parliament and of the Council, Commission Regulation (EC) No 692/2008 and Commission Regulation (EU) 2017/1151 for the Purpose of Improving the Emission Type Approval Tests and Procedures for Light Passenger and Commercial Vehicles, Including Those for In-Service Conformity and Real-Driving Emissions and Introducing Devices for Monitoring the Consumption of Fuel and Electric Energy. Available online: http://data.europa.eu/eli/reg/2018/1832/oj (accessed on 21 February 2022).
Figure 1. Prediction of change in share of powertrains used in vehicles by 2030 [8]; CO2 fleet emissions: 95 g/km (2020), 75 g/km (2025), and 65 g/km (2030).
Energies 15 06471 g001
Figure 2. Spatial distribution of PM10 concentrations across Poland in 2019 [20]. Reprinted with permission from [20]. Copyright 2019, State Environmental Monitoring.
Energies 15 06471 g002
Figure 3. Classification of zones in Poland for PM10 dust, based on air quality assessment for 2019 [20]. Reprinted with permission from [20]. Copyright 2019, State Environmental Monitoring.
Energies 15 06471 g003
Figure 4. Renewables growth in Europe 2010–2018 and 2018–2030 [21]. Reprinted with permission from [21]. Copyright 2020, Ember.
Energies 15 06471 g004
Figure 5. Implementation of the RDE test for vehicles 1 and 4—the course of speed as a function of distance; 1—gasoline, 4—plug-in hybrid.
Energies 15 06471 g005
Figure 6. Comparison of the share of the vehicle’s operation in the velocity–acceleration coordinates for vehicles 1 and 2; 1—gasoline, 2—diesel.
Energies 15 06471 g006
Figure 7. Values of driving dynamics parameters P95 of v∙apos compared to the RDE limits for P95 of v∙apos for vehicle 1–4; 1—gasoline, 2—diesel, 3—mild hybrid, 4—plug-in hybrid.
Energies 15 06471 g007
Figure 8. Values of relative positive acceleration compared to the RDE limits for average RPA for vehicle 1–4; 1—gasoline, 2—diesel, 3—mild hybrid, 4—plug-in hybrid.
Energies 15 06471 g008
Figure 9. Number distribution of particulate matter for vehicles 1–4 in the cold start phase of the engine against the values obtained during the whole test; 1—gasoline, 2—diesel, 3—mild hybrid, 4—plug-in hybrid.
Energies 15 06471 g009
Figure 10. Dependence of particle number concentration on particle diameter for vehicles 1–4 in different parts of the RDE test (urban, rural, motorway); 1—gasoline, 2—diesel, 3—mild hybrid, 4—plug-in hybrid.
Energies 15 06471 g010
Figure 11. Particle number increase rate for vehicles 1–4 in the cold start phase of the engine and throughout the RDE test; 1—gasoline, 2—diesel, 3—mild hybrid, 4—plug-in hybrid.
Energies 15 06471 g011
Figure 12. Particle number increase rate for vehicles 1–4 in each part of the RDE test (urban, rural, motorway); 1—gasoline, 2—diesel, 3—mild hybrid, 4—plug-in hybrid.
Energies 15 06471 g012
Figure 13. Total number of particles for vehicles 1–4 in the RDE test and its individual parts (urban, rural, motorway), along with a division of the diameters considered; 1—gasoline, 2—diesel, 3—mild hybrid, 4—plug-in hybrid.
Energies 15 06471 g013
Figure 14. Conformity factor for the number of particles for vehicles 1–4 in the RDE test and its individual parts (urban, rural, motorway), along with a division of the diameters considered; 1—gasoline, 2—diesel, 3—mild hybrid, 4—plug-in hybrid.
Energies 15 06471 g014
Table 1. Selected technical data of research objects.
Vehicle 1Vehicle 2Vehicle 3Vehicle 4
PowertrainConventionalConventionalMild hybridPlug-in hybrid
Fuel typeGasolineDieselGasolineGasoline and electric
Engine capacity1591 cm31685 cm31497 cm31999 cm3
Cylinders/valves4/164/164/164/16
Injection systemDirectDirectDirectDirect
Maximum power132 kW
5500 rpm
104 kW
4000 rpm
135 kW
5800 rpm
151 kW
6000 rpm
Maximum torque265 Nm
1500–4500 rpm
340 Nm
1750–2500 rpm
280 Nm
1200–4000 rpm
375 Nm
2330 rpm
Maximum power of electric motor49 kW
2330–3300 rpm
Maximum torque of electric motor205 Nm
0–2330 rpm
Power indicator
(power/displacement)
83 kW/dm362 kW/dm390 kW/dm376 kW/dm3
Battery capacity1.2 Ah31.3 Ah
Empty vehicle weight1465 kg1515 kg1430 kg1740 kg
Exhaust emission standardEuro 6d, GPFEuro 6d, DPF, SCREuro 6dEuro 6d
Publisher’s Note: MDPI stays neutral with regard to jurisdictional claims in published maps and institutional affiliations.

