Review

Effects of a Floating Photovoltaic System on the Water Evaporation Rate in the Passaúna Reservoir, Brazil

by
Fernando Roberto dos Santos
1,*,
Giovana Katie Wiecheteck
1,
Jorim Sousa das Virgens Filho
1,
Gabriel Alfredo Carranza
2,
Terrence Lynn Chambers
3 and
Afef Fekih
4
1
Postgraduate Master Degree Program in Environmental and Sanitary Engineering, State University of Ponta Grossa, 4748 Gal. Carlos Cavalcanti Av., Ponta Grossa 84030-900, PR, Brazil
2
Energy Efficiency and Sustainable Energy Center, University of Louisiana at Lafayette, Lafayette, LA 70504, USA
3
Department of Mechanical Engineering, University of Louisiana at Lafayette, Lafayette, LA 70503, USA
4
Department of Electrical and Computer Engineering, University of Louisiana at Lafayette, Lafayette, LA 70504, USA
*
Author to whom correspondence should be addressed.
Energies 2022, 15(17), 6274; https://doi.org/10.3390/en15176274
Submission received: 26 July 2022 / Revised: 22 August 2022 / Accepted: 26 August 2022 / Published: 28 August 2022
(This article belongs to the Section A2: Solar Energy and Photovoltaic Systems)

Abstract

:
Freshwater scarcity is a significant concern due to climate change in some regions of Brazil; likewise, evaporation rates have increased over the years. Floating photovoltaic systems can reduce water evaporation from reservoirs by suppressing the evaporating area on the water surface. This work evaluated the effects of floating photovoltaic systems on water evaporation rates in the Passaúna Reservoir, southeastern Brazil. Meteorological data such as temperature, humidity, wind speed, and solar radiation were used to estimate the rate of water evaporation using FAO Penman–Monteith, Linacre, Hargreaves–Samani, Rohwer, and Valiantzas methods. The methods were tested with the Kruskal–Wallis test, including measured evaporation from the nearest meteorological station to determine whether there were significant differences between the medians of the methods considering a 95% confidence level for hypothesis testing. All methods differed from the standard method recommended by the FAO Penman–Monteith. Simulations with more extensive coverage areas of the floating photovoltaic system were carried out to verify the relationship between the surface water coverage area and the evaporation reduction efficiency provided by the system and to obtain the avoided water evaporation volume. For the floating photovoltaic system with a coverage area of 1265.14 m2, an efficiency of 60.20% was obtained in reducing water evaporation; future expansions of the FPS were simulated with coverage areas corresponding to energy production capacities of 1 MWp, 2.5 MWp, and 5 MWp. The results indicated that for a floating photovoltaic system coverage area corresponding to 5 MWp of energy production capacity, the saved water volume would be enough to supply over 196 people for a year. More significant areas, such as covering up the entire available surface area of the Passaúna reservoir with a floating photovoltaic system, could save up to 2.69 hm3 of water volume annually, representing a more significant value for the public management of water resources.

1. Introduction

Water scarcity is one of the most relevant aspects of the world stage. With the growing demand for water resources—used for the most diverse purposes, from the primary to the tertiary sector—their practical use is vital for human life and the economy, especially knowing it is a limited resource. Water reservoirs are crucial in developing water resource management policies and as a way to control variations in water availability during drought and floods.
Alternatives to optimize water resources are increasingly necessary with the growing environmental concern and the urgency for the rational use of water. The work reported in [1] estimated that reservoirs lost half of their water through evaporation. The environmental issue of possible water scarcity is also shared by [2], which suggest that water losses through evaporation are likely to increase in the coming years due to global warming. Hence, solutions to maximize water resources are vital.
Water surface evaporation in reservoirs represents an essential value for controlling water output, being an effective way to monitor water resources [3]. Studies of water evaporation in reservoirs can be used to understand how global average temperature changes affect the amount of water lost through evaporation. In warmer climates and with rising temperatures, water evaporation losses also increase [4,5].
Research on water evaporation estimation in lakes and reservoirs dates back to the beginning of the 20th century. It is quantified by a variety of meteorological data, such as the incidence of solar radiation, wind speed, relative humidity, air temperature, and atmospheric pressure. In addition, it is a variable difficult to obtain directly, which is why methods for indirect estimates were developed [6,7].
Different methods based on meteorological data and empirical evapotranspiration equations were used to estimate water evaporation from lakes and reservoirs [2,4,8,9,10,11,12,13,14,15,16,17,18]. A method based on aerodynamics, mainly considering wind speed, was one of the first attempts to estimate water evaporation through an empirical equation [19]. The study was motivated by the need to determine the feasibility of irrigation water reservoirs considering evaporative losses.
The Food and Agriculture Organization of the United Nations (FAO) standardized the Penman–Monteith method [20,21,22], which determines the reference evapotranspiration of the crop. However, Kohli and Frenken [12] stated that when using a crop coefficient value as one, the FAO Penman–Monteith method would lead to water evaporation in reservoirs. The method requires data such as: air temperature, relative humidity, solar radiation, and wind speed.
Due to the FAO Penman–Monteith method requiring many data and an intensive calculation step, other methods were proposed as a simplified version such as Linacre [23], which is based on data of air temperature and local elevation; Linacre [24], which includes air temperature, wind speed, and solar radiation; and Valiantzas [10] which considers all variables such as solar radiation, air temperature, wind speed, and relative humidity. Allen et al. [22] also recommend the Hargreaves–Samani method, an evapotranspiration equation, when it is difficult to obtain enough climatological data, which depends on the maximum and minimum air temperatures [25].
For that reason, the availability of different methods and their different variables or input data are important to estimate water evaporation, making their need notable when direct measurements are not available and when there is not enough data to use complex models such as the FAO Penman–Monteith.
Reducing water evaporation in reservoirs is also important when considering the security of water availability—mainly in arid regions. For example, it is possible to relate evaporation reduction with the water surface covered in reservoirs by floating photovoltaic systems (FPS) [26,27,28]. Studies have shown that devices such as floating or suspended covers can reduce water evaporation rates by up to 90% [9,13,15,29]. FPS can be used for water management by reducing water evaporation rates, producing energy, and reducing algae growth by improving water quality [2,17].
According to [30,31], FPS is a suitable solution for a country that has a lot of hydropower plants with dams and open water areas. This is the case for Brazil, where hydropower supplied 66% of its electricity demand in 2020 [32]. One of the advantages of FPS is that there is no need to occupy land which could be used for another purpose [31]. The authors have started studies on the influence of FPS on water losses by evaporation and consider that more detailed information about the region called the Tocantins–Araguaia Basin (northern region of Brazil), such as climate, and reservoir characteristics need to be considered in the evaporation models to obtain more accurate results.
Although hydraulic energy is the most used renewable energy source in Brazil, photovoltaic energy generation has shown considerable growth within the Brazilian electricity matrix, approximately 5.475 GW, according to the 10-year Brazilian Energy Plan [33], which foresees an evolution in the electricity matrix until 2030. According to the Brazilian Association of Photovoltaic Solar Energy [34], analyzing the cumulative installed capacity of solar PV; Brazil advanced one position in the world ranking and assumed 13th place in 2021.
A water evaporative cooling mechanism and lower soiling loss improved the PV efficiency by up to 30% according to a study in Indonesia [30]. Water evaporation measurement was carried out using a Class A evaporation pan, a cylinder with a diameter of 120.7 cm that has a depth of 25 cm, in Jordan [35]. The authors concluded that covering water bodies with PV modules can save a considerable amount of water. The amount of water saved is consistent with the coverage percentage, where a 50% covered pan saved 54.5% while the 30% covered pan saved 31.2% when compared to the uncovered pan.
Additionally, the diversity made possible by FPS requires the most diverse studies. Such technology may vary according to the material used in the photovoltaic (PV) modules, the system’s angle, and its installation type.
For example, [2] studied the water evaporation reduction from different typologies of FPS: (1) with floats that cover the surface below the solar module entirely; (2) with modules anchored to a buoyancy system; (3) suspended PV modules in a structure over water canals; and (4) flexible PV modules in direct contact with water. As specified by the authors, each typology or installation scheme has pros and cons. In the first case, the PV modules can reduce the transmission of solar radiation almost entirely to the reservoir, resulting in lower evaporation rates. The second and third typologies can reduce only a part of the solar radiation but allows good ventilation below the modules. In the latter, the advantages are due to the direct contact with water that produces cooling effects in the modules and allows them to deform with water wave motions. The results showed that flexible modules can reduce evaporation rates by 42% to 64%, with areas covered with FPS from 30% to 50% of the reservoir surface.
Different materials applied to FPS were also a field of study; prior research [36] compared the differences between the polycrystalline, thin film, and mono-crystalline FPS in Egypt. The study investigated how the tracking system, position, and material affect the FPS’s installed capacity and energy yield. The results indicated that the energy yield of mono-crystalline panels is lesser than polycrystalline panels, and the thin film has an energy yield increase of 22% and 34%, compared to poly and mono-crystalline panels, respectively. The authors state that the water–energy nexus is the notorious advantage of FPS; the saved water and efficient energy generation adds up when considering embodied energy associated with water provision and storage.
Similarly, [37] analyzed floating photovoltaics with flexible crystalline silicon-based modules backed up with foam, reducing cost compared to pontoon-based FPS. The authors also highlight advantages, including less water evaporation and gains due to lower operational temperature—compared to pontoon-based FPS, which could provide over 127 TWh of solar electricity and 633.2 million m3 of water savings with a 50% coverage at Lake Mead.
This paper evaluates the effects of floating photovoltaic systems on water evaporation rates for a reservoir in southeastern Brazil. It also provides a comparative analysis of different water evaporation prediction methods and evaluates the volume of water that would be saved if the coverage area of the FPS was increased.
In addition, the study focuses on the importance of FPS in reducing water losses by evaporation in reservoirs as a viable way to reverse the effects of drought periods that are occurring in some regions of Brazil. This study can help researchers to expand the acknowledgment of the effects of floating photovoltaic systems on water evaporation rates, promoting further investigations, especially considering climate change.
This research intended not only to reproduce recognized evaporation estimate methods but to test them according to meteorological data from the southern region of Brazil, which is lacking as far as our knowledge goes. Moreover, to introduce the theme of floating photovoltaic systems and their effects on water evaporation—as a tool to improve water security, especially when periodicals droughts are taking place in the region. Furthermore, the study can help expand the acknowledgment of the effects of floating photovoltaic systems on water evaporation rates and renewable energy production and promote further investigations, especially considering climate change.
The remainder of the paper is organized as follows. Section 2 describes the Passaúna Reservoir as well as some preliminaries. The comparison study is detailed in Section 3. Some conclusions are finally given in Section 4.

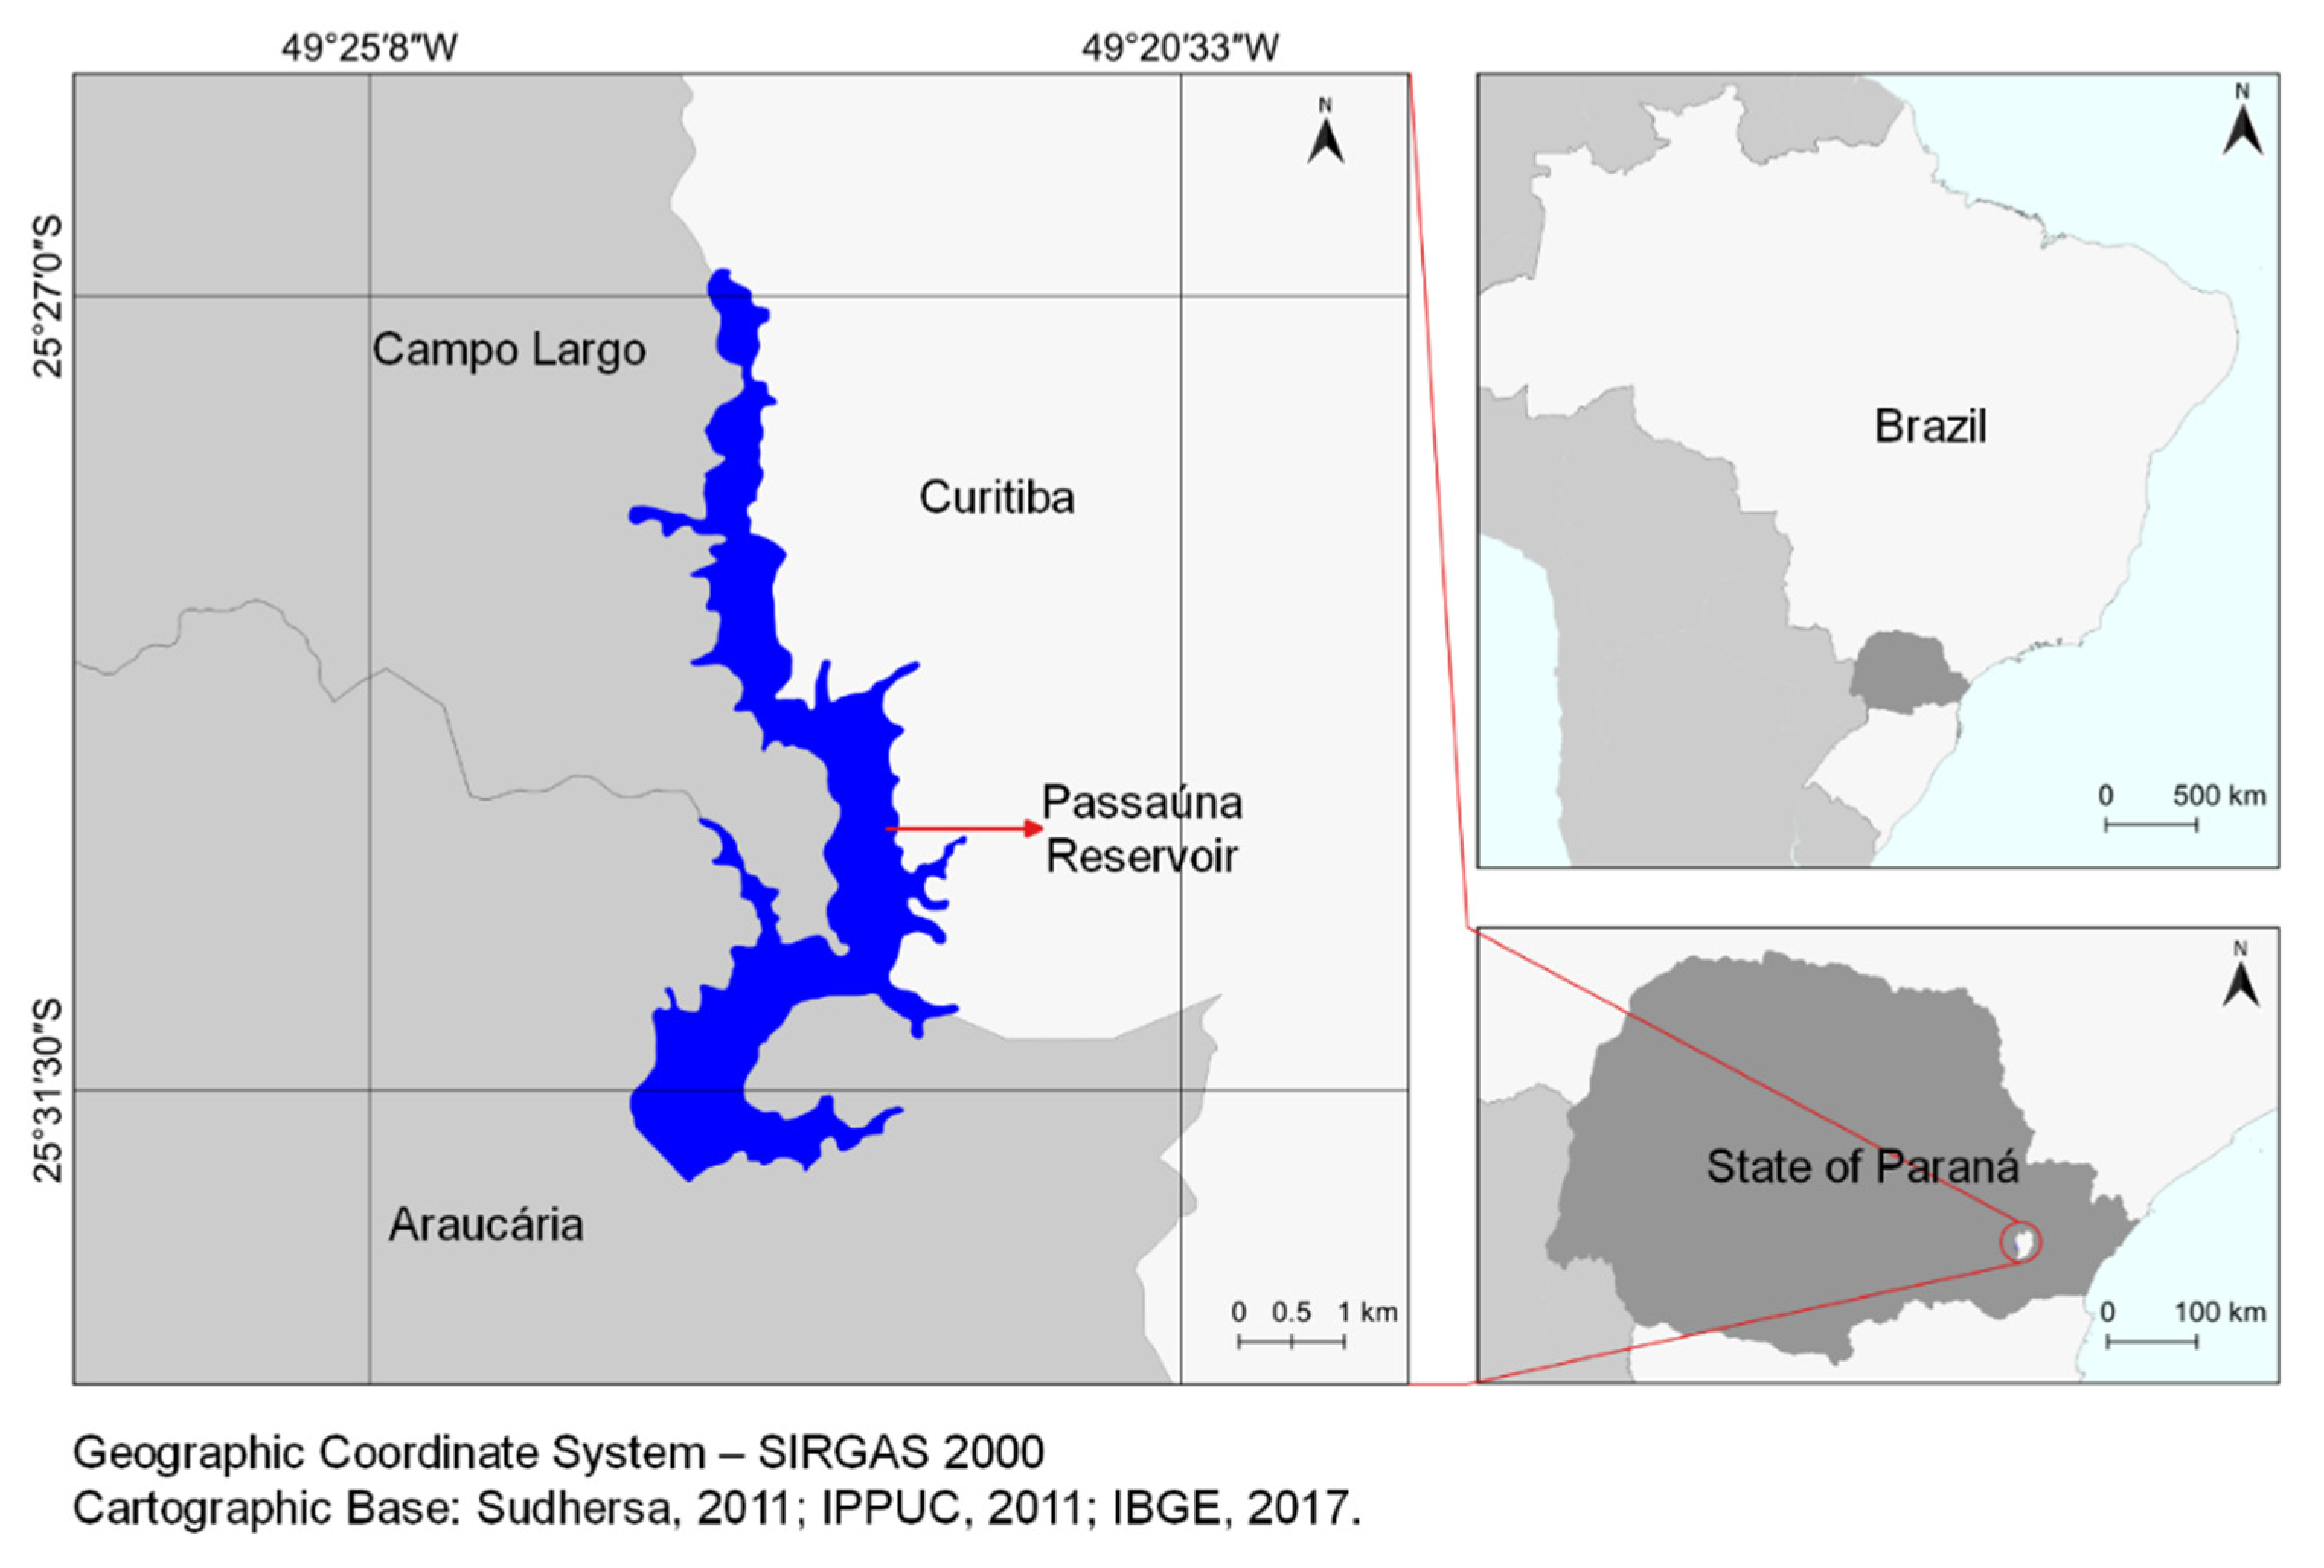
2. Materials and Methods

The research work reported in this paper was carried out in the Passaúna Reservoir, which originated from the damming of the Passaúna River in 1990.
The reservoir has a surface area of 8.5 km2, a maximum depth of 18.1 m, and an average depth of 6.5 m. It has a total storage volume of 69.3 hm3, with a useful volume of 48 hm3, and a dead storage volume of 19.5 hm3 [38,39]. The reservoir borders the cities of Curitiba, Araucária, and Campo Largo, and supplies 20% of the water consumed by the population of the metropolitan region of Curitiba [38,40,41,42].
The Passaúna Reservoir is located southwest of Curitiba in Paraná State, South Brazil, as shown in Figure 1.

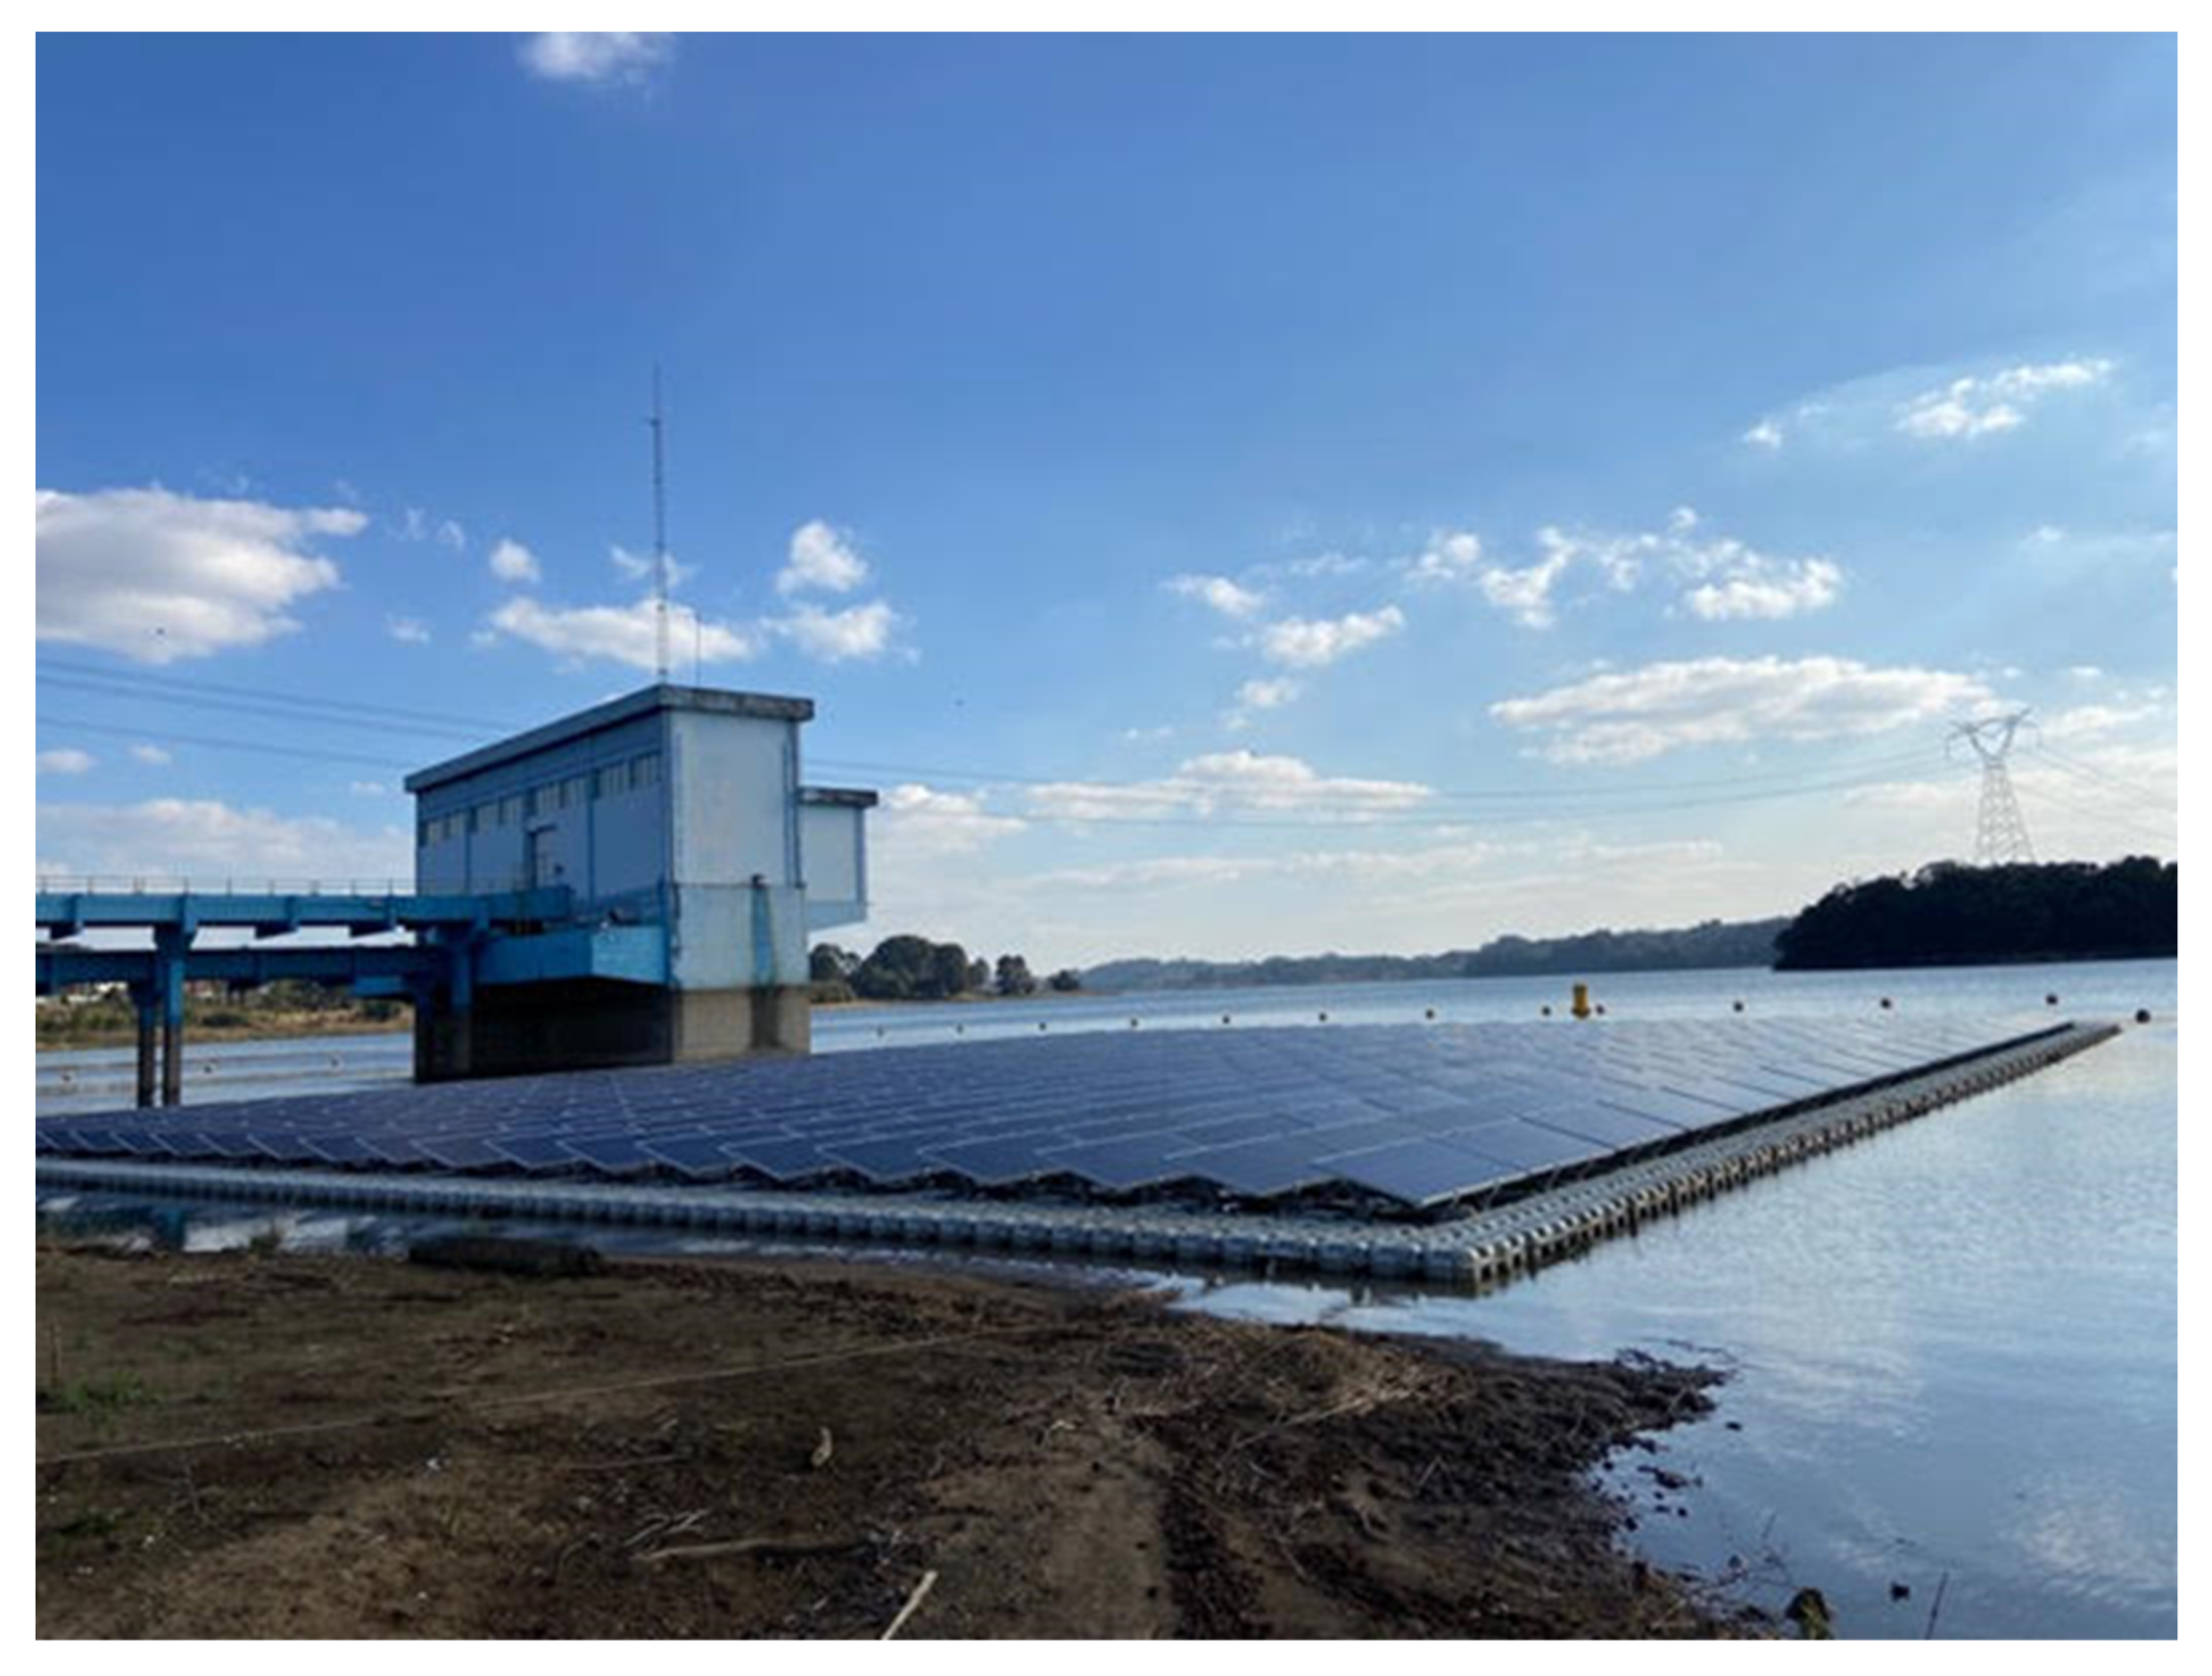
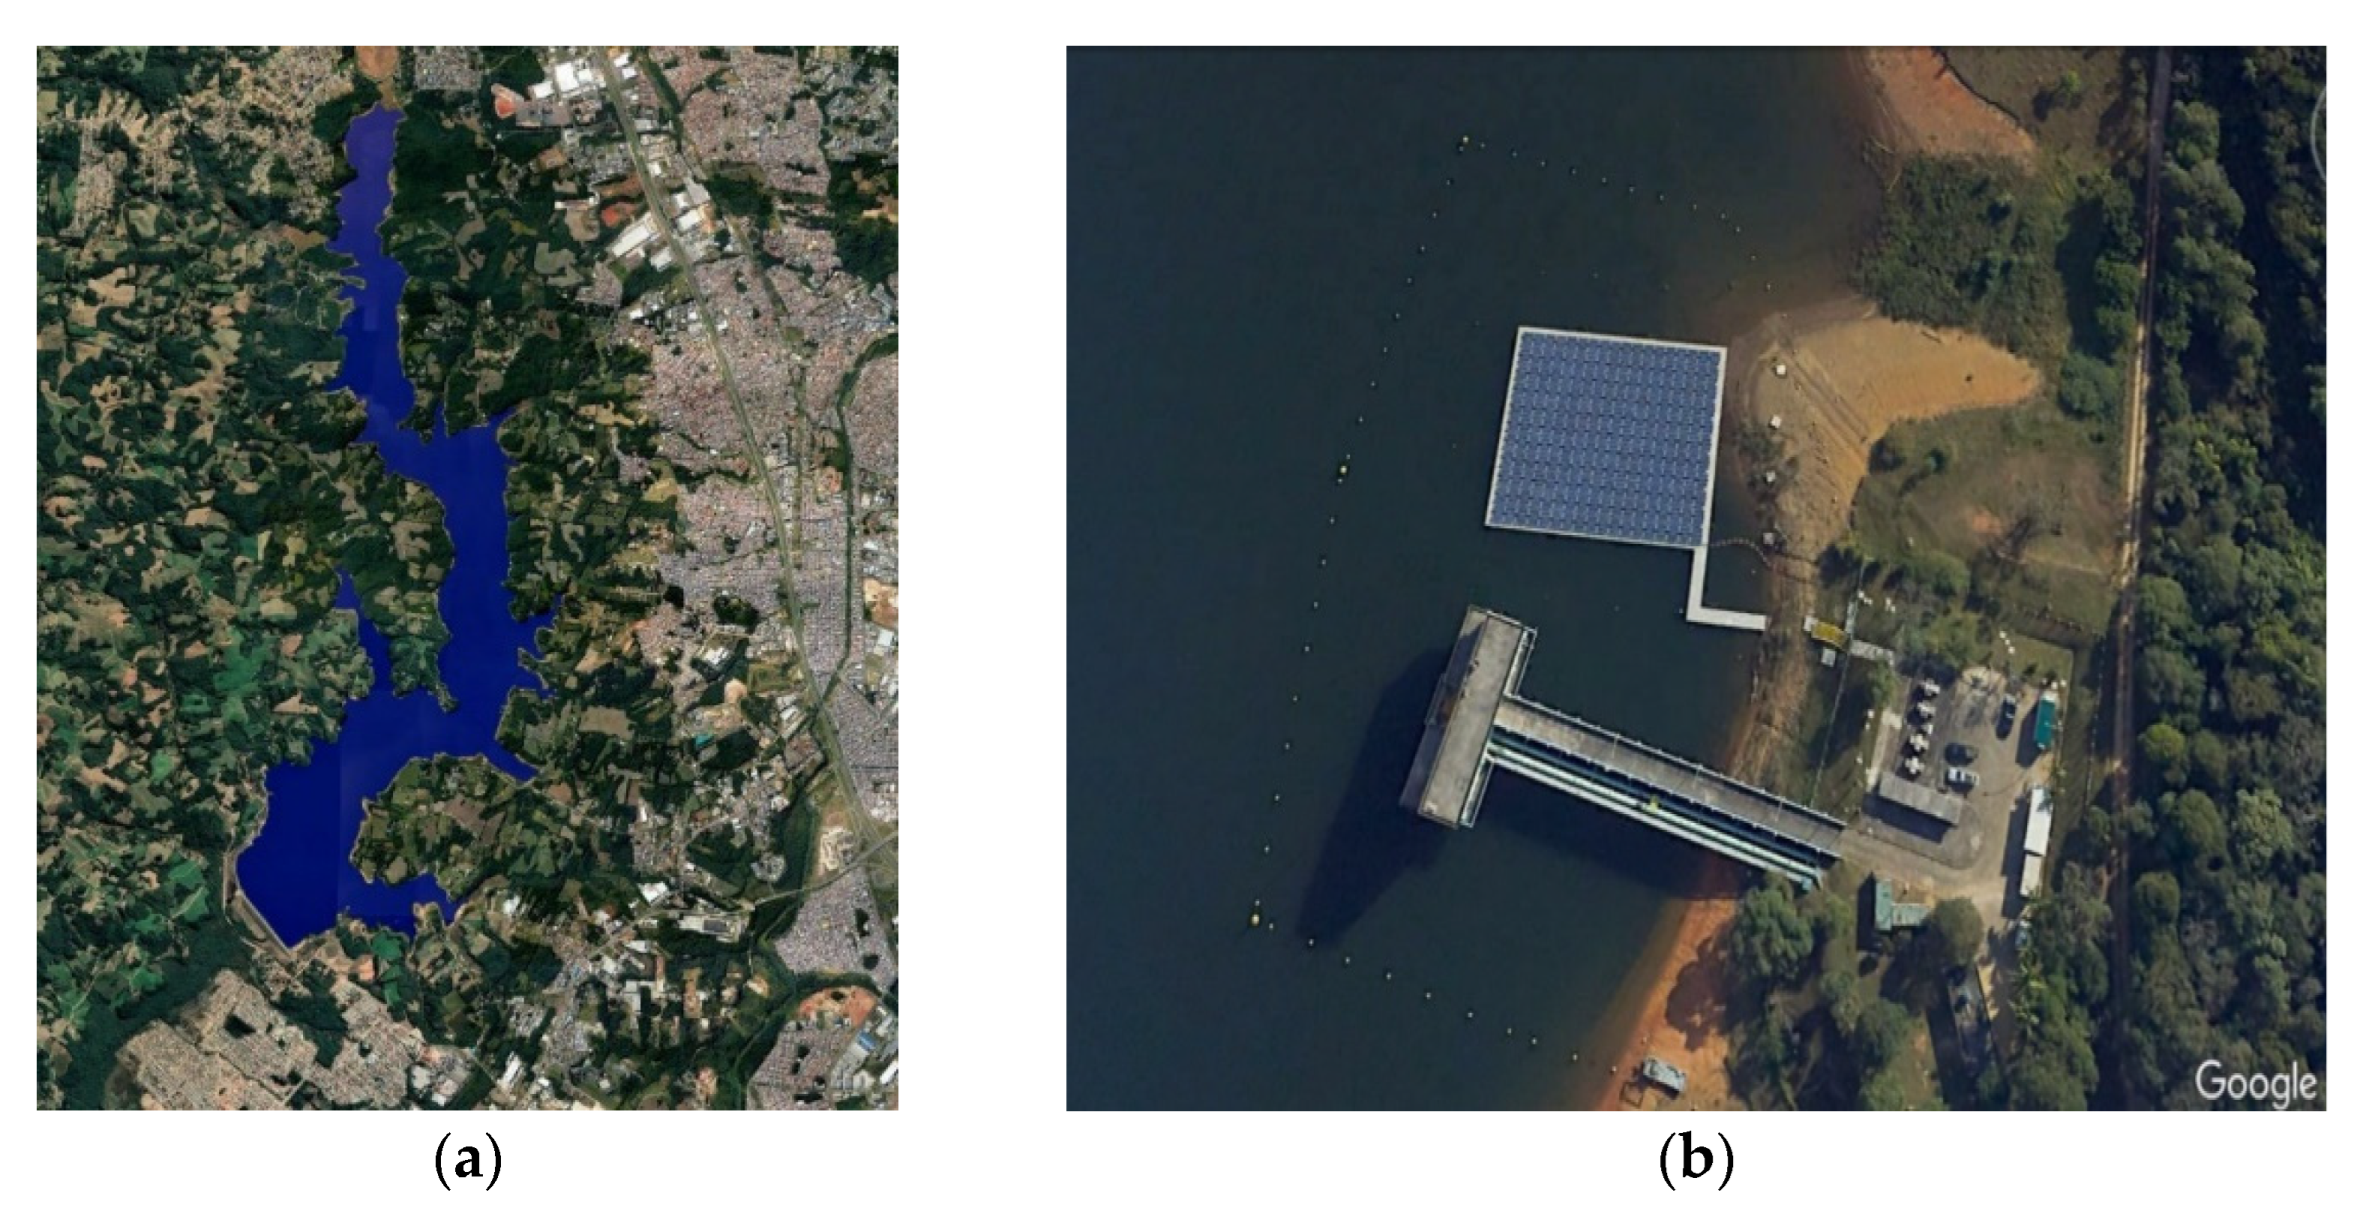
2.1. Floating Photovoltaic System—FPS

The floating photovoltaic system (FPS) was installed in 2019 in the Passaúna Reservoir, with an energy production capacity of 130 kWp, occupying an area of 1265.14 m2 with 396 photovoltaic modules installed on a floating platform. It is located close to the water supply pumping system of the Water and Sanitation Company of Paraná (Sanepar, Curitiba, PR, Brazil), at the coordinates 25°30′45″ S and 49°22′07″ W, as shown in Figure 2.
The modular floating devices from the FPS can be easily removed or added, with the possibility of expanding the system in the future. The floating platform supports the photovoltaic modules, which have dimensions of 1960 mm × 991 mm × 40 mm and maximum power of 330 W [43]. The FPS consists of 22 strings, and each string contains 18 photovoltaic modules. Every two strings, there is an access walkway for module maintenance.

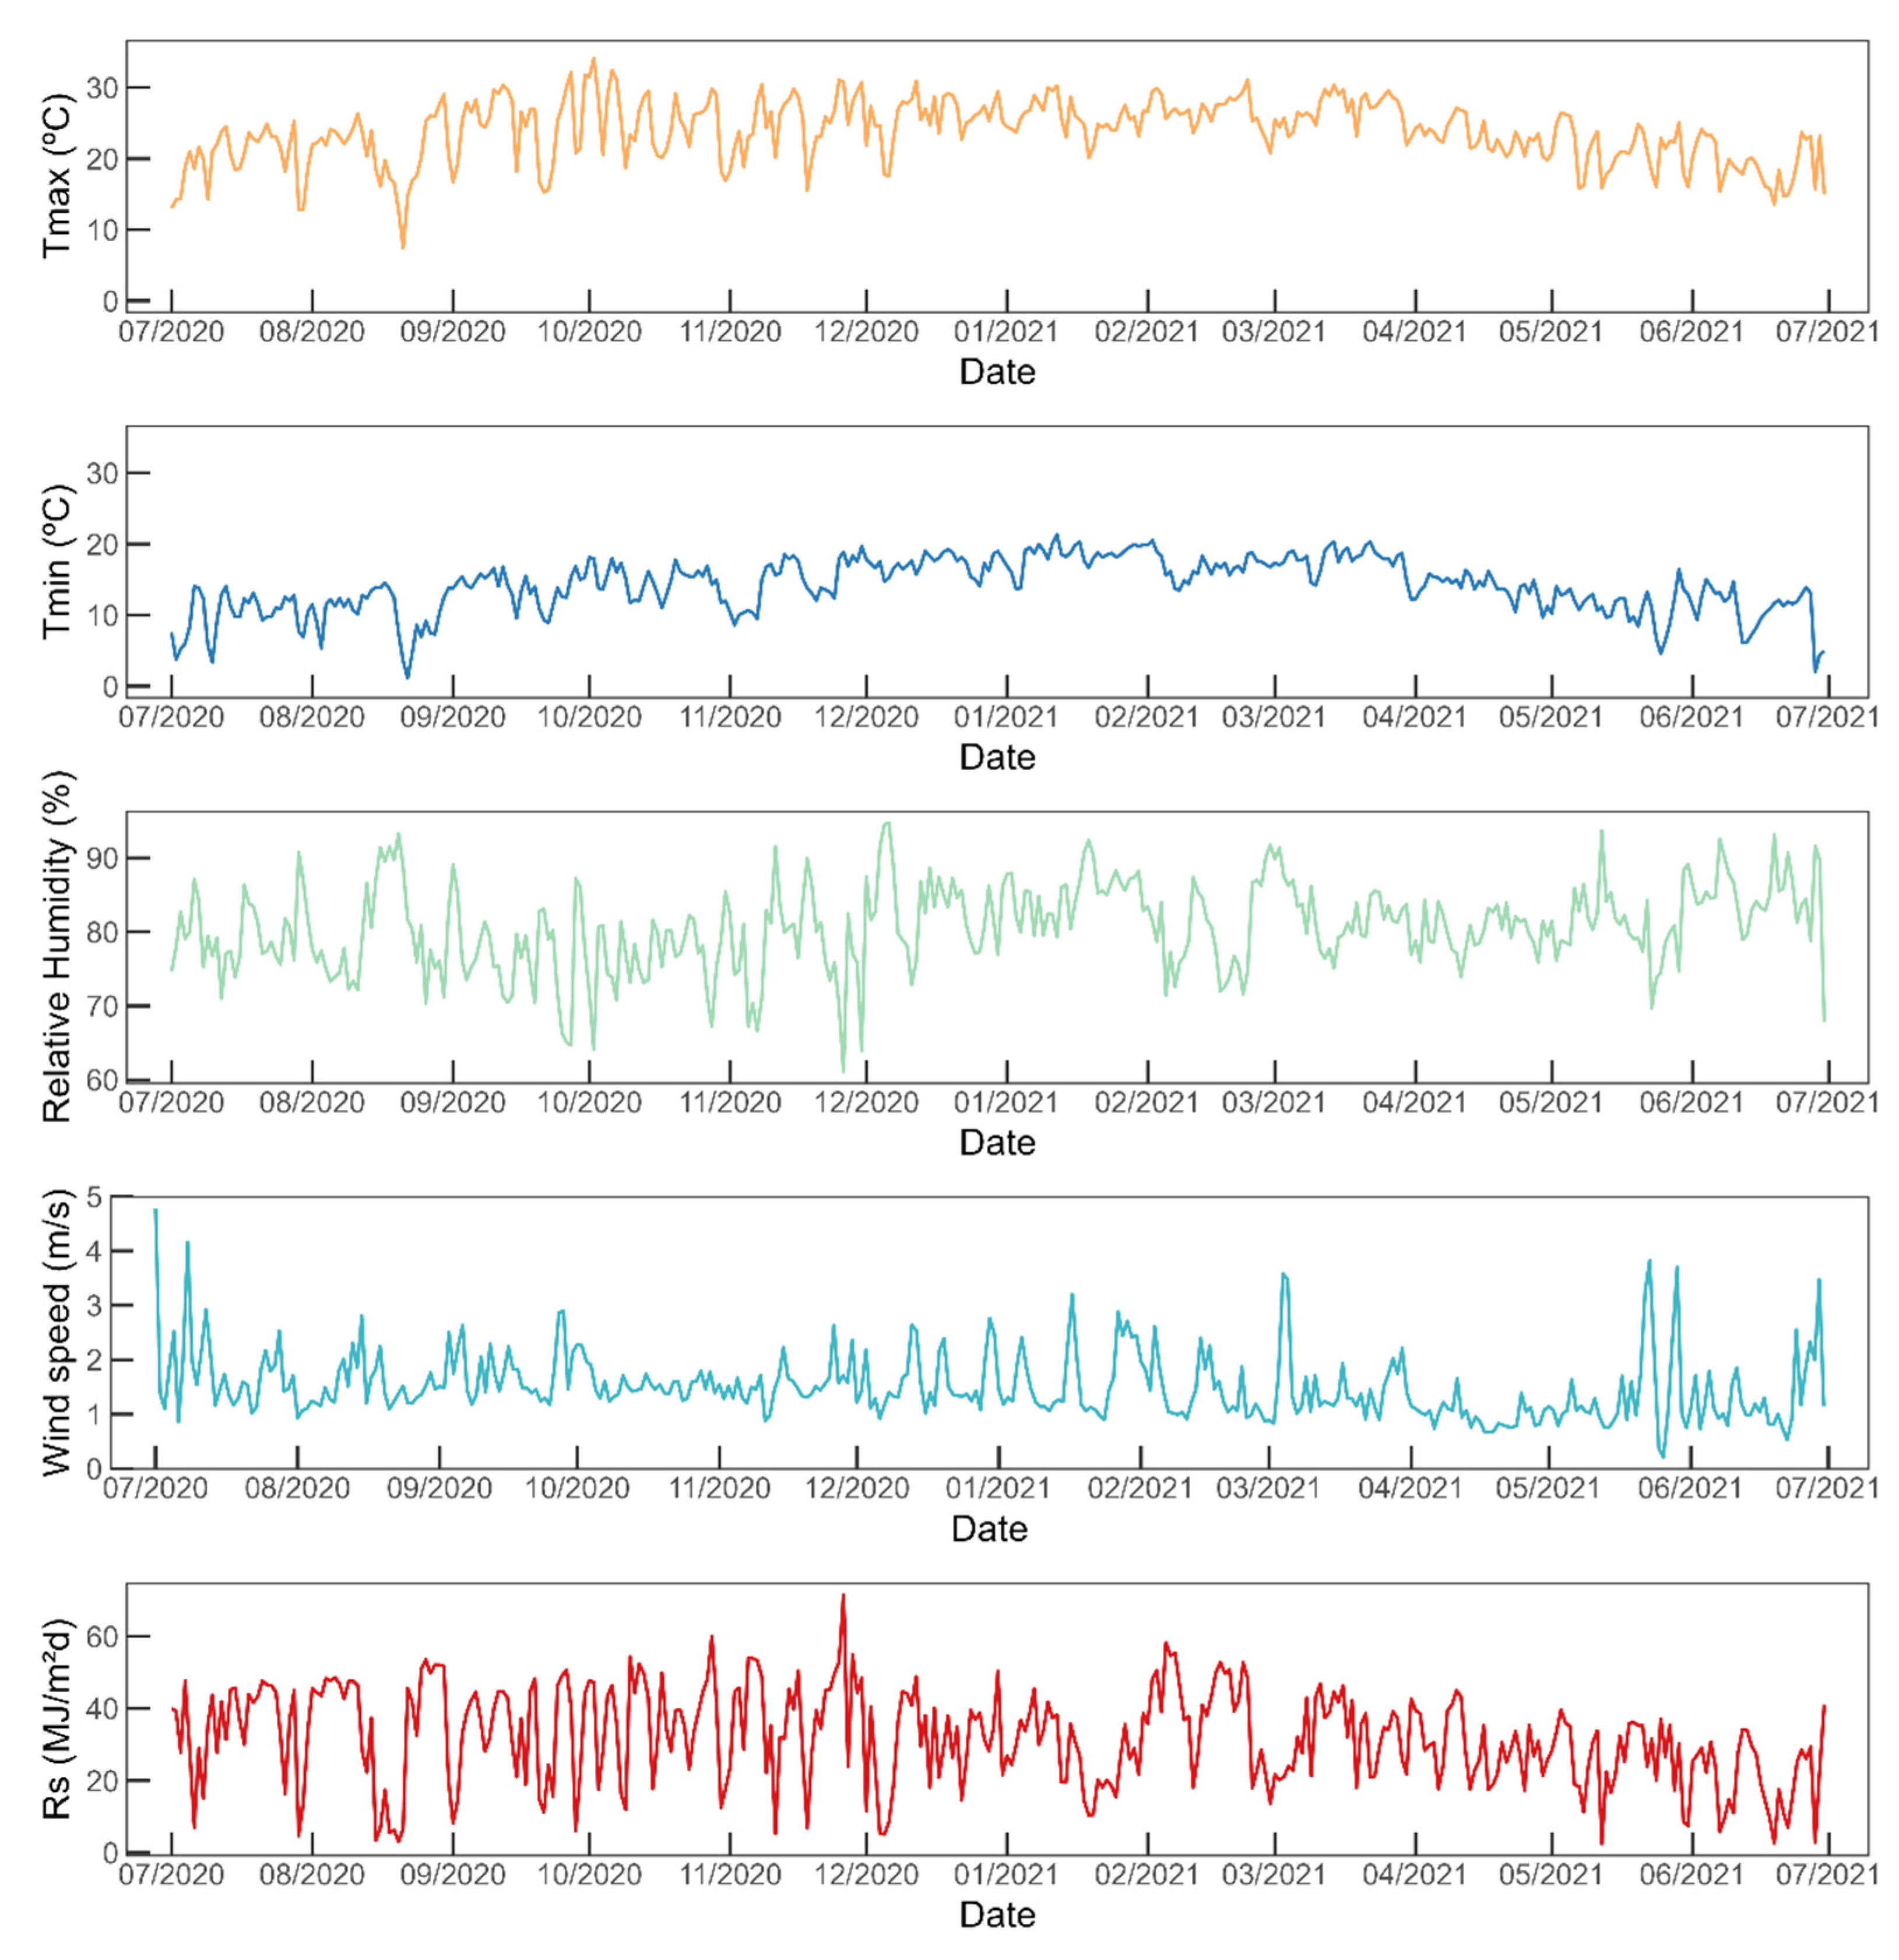
2.2. Meteorological Data

The meteorological dataset for this work was obtained from the weather station close to the FPS site. From 1 July 2020 to 30 June 2021, the input data used to obtain the evaporation by the methods studied were: solar radiation, air temperature, relative humidity, and wind speed. Data gaps were observed in October (3rd to 16th and 25th to 30th), November (27th to 29th), and December (3rd). In order to have continuous data over the period, the missing data were filled through linear regression, using data from another meteorological station, located 14 km from the Passaúna Reservoir. These data are available in the Meteorological Database for Teaching and Research (BDMEP) of the National Institute of Meteorology (INMET).

2.3. Evaporation Estimative

Different methods were used to estimate the evaporation, as shown in Table 1: FAO Penman–Monteith, Linacre (1977 and 1993), Rohwer, Valiantzas, and Hargreaves–Samani. Measured evaporation data obtained by a Piche evaporimeter at the INMET weather station for the same period were used as a baseline. Because non-continuous monthly failures were observed in the measured evaporation data, the rows with null data were disregarded for the statistical analysis of the methods. Data were analyzed monthly using R-Studio 1.4.17 [44]. The estimated evaporations were analyzed using the non-parametric Kruskal–Wallis test to determine whether there were significant differences between the medians obtained from the methods, with a 95% confidence level for hypothesis testing.
In order to estimate the efficiency of reducing water evaporation by the FPS, the Assouline, Narkis and Or [45] method was used. Additional details can be found in their publications.
Equation (7) was used to estimate the daily evaporated volume in the reservoir:
T vol = ( E ) ( A ) 10 3 ,
where:
Tvol = daily evaporated volume (m3);
E = evaporation rate (mm day−1);
A = reservoir area (km2).
The sum of each daily evaporated volume for a respective month results in the monthly evaporated amount.
To evaluate future expansions of the FPS and its influences on the evaporation rates in the Passaúna Reservoir, the water volume that could be lost by evaporation but would be avoided by the FPS was calculated. For the calculations, the coverage area for the current 130 kWp system was considered, and those corresponding to the expansions of energy production capacity to 1 MWp, 2.5 MWp, and 5 MWp. These expansions were determined under ANEEL normative resolution number 482/2012, limiting renewable energy mini-generation systems to 5 MWp [46].
The evaporated volume avoided by different coverage areas of the FPS was obtained by Equation (8):
Δ = ( T vol ) ( EQC ) ( ε ) ,
where:
Δ = avoided evaporation volume for assumed coverage (m3);
EQC = equivalent covered area for each energy production capacity (m2);
ε = assumed evaporation reduction efficiency (%).
The available surface area of the reservoir considered was for the total storage volume and for the volume during periods of water scarcity.

3. Results and Discussions

3.1. Meteorological Dataset

Figure 3 shows the variation of meteorological data from the weather station close to the FPS, used to estimate the evaporation rates based on the different methods. The meteorological dataset refers to the period of one year, from 1 July 2020 to 30 June 2021.
A maximum temperature of 34.13 °C and a minimum temperature of 1.14 °C was observed from the dataset. The relative humidity ranges from 61.12% to 94.72%, and the wind speed from 0.21 m s−1 to 4.16 m s−1. The solar radiation average for the region is 31.96 MJ m−2 day−1 or 369.91 W m−2.

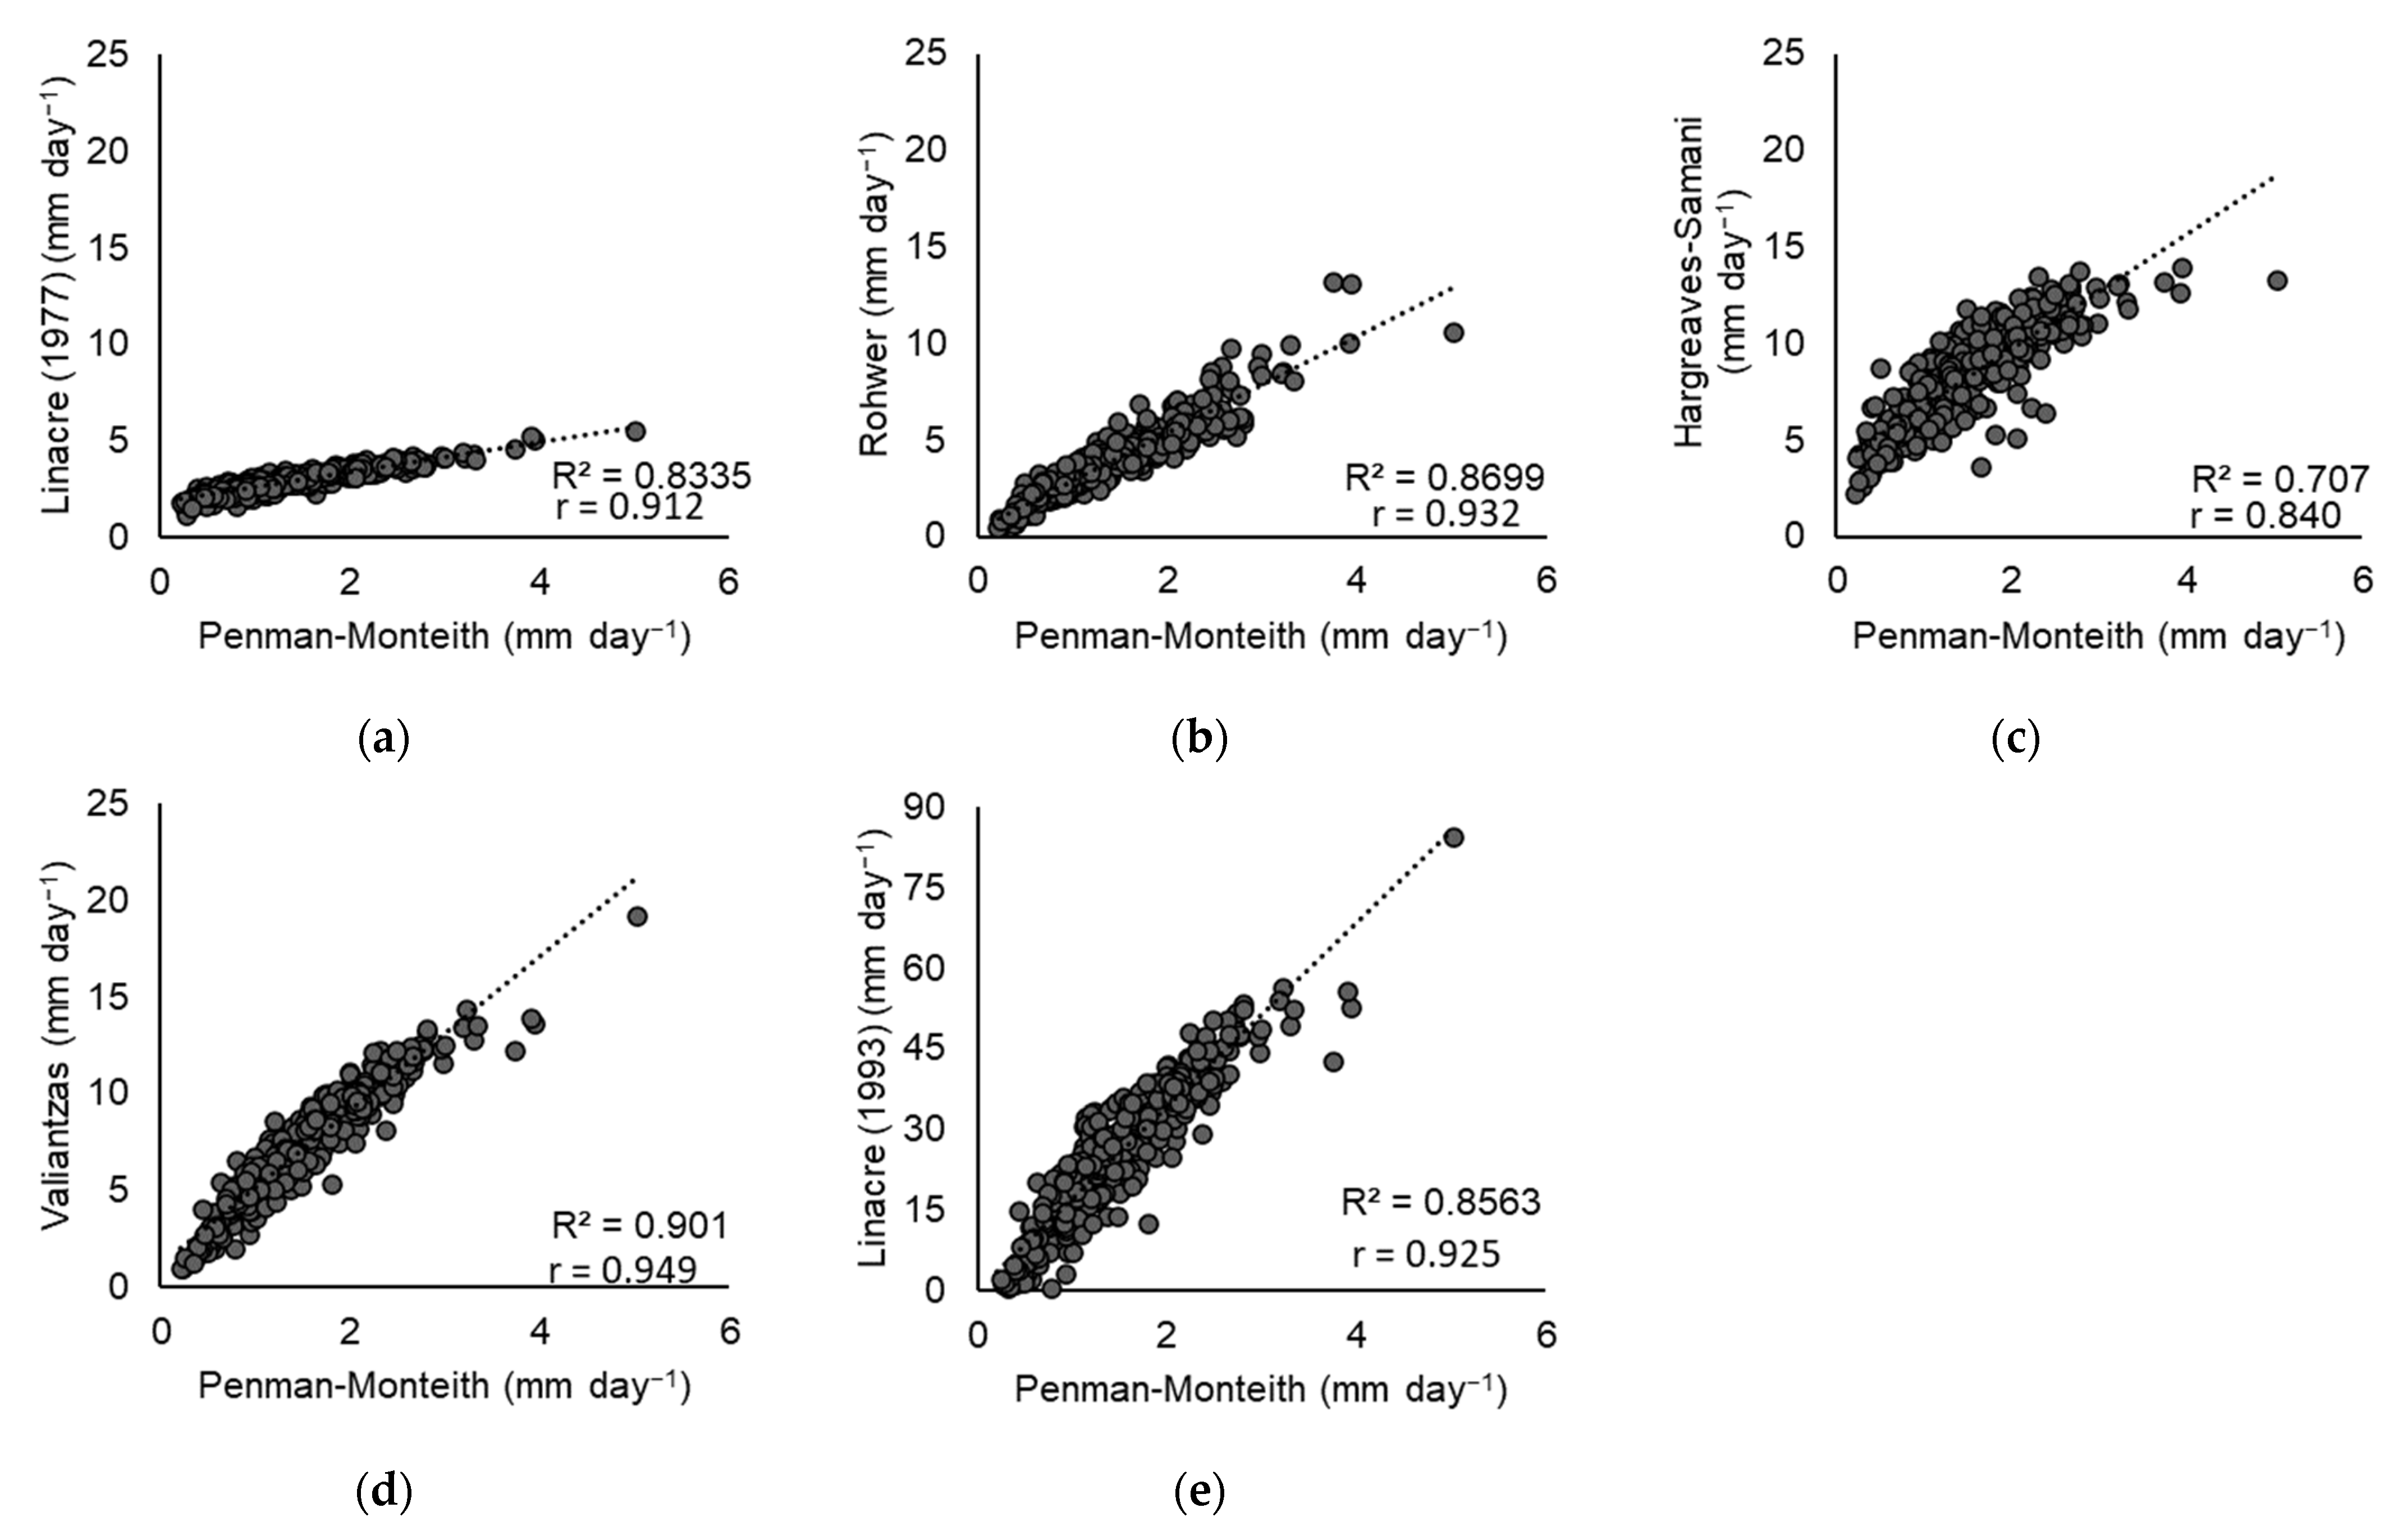
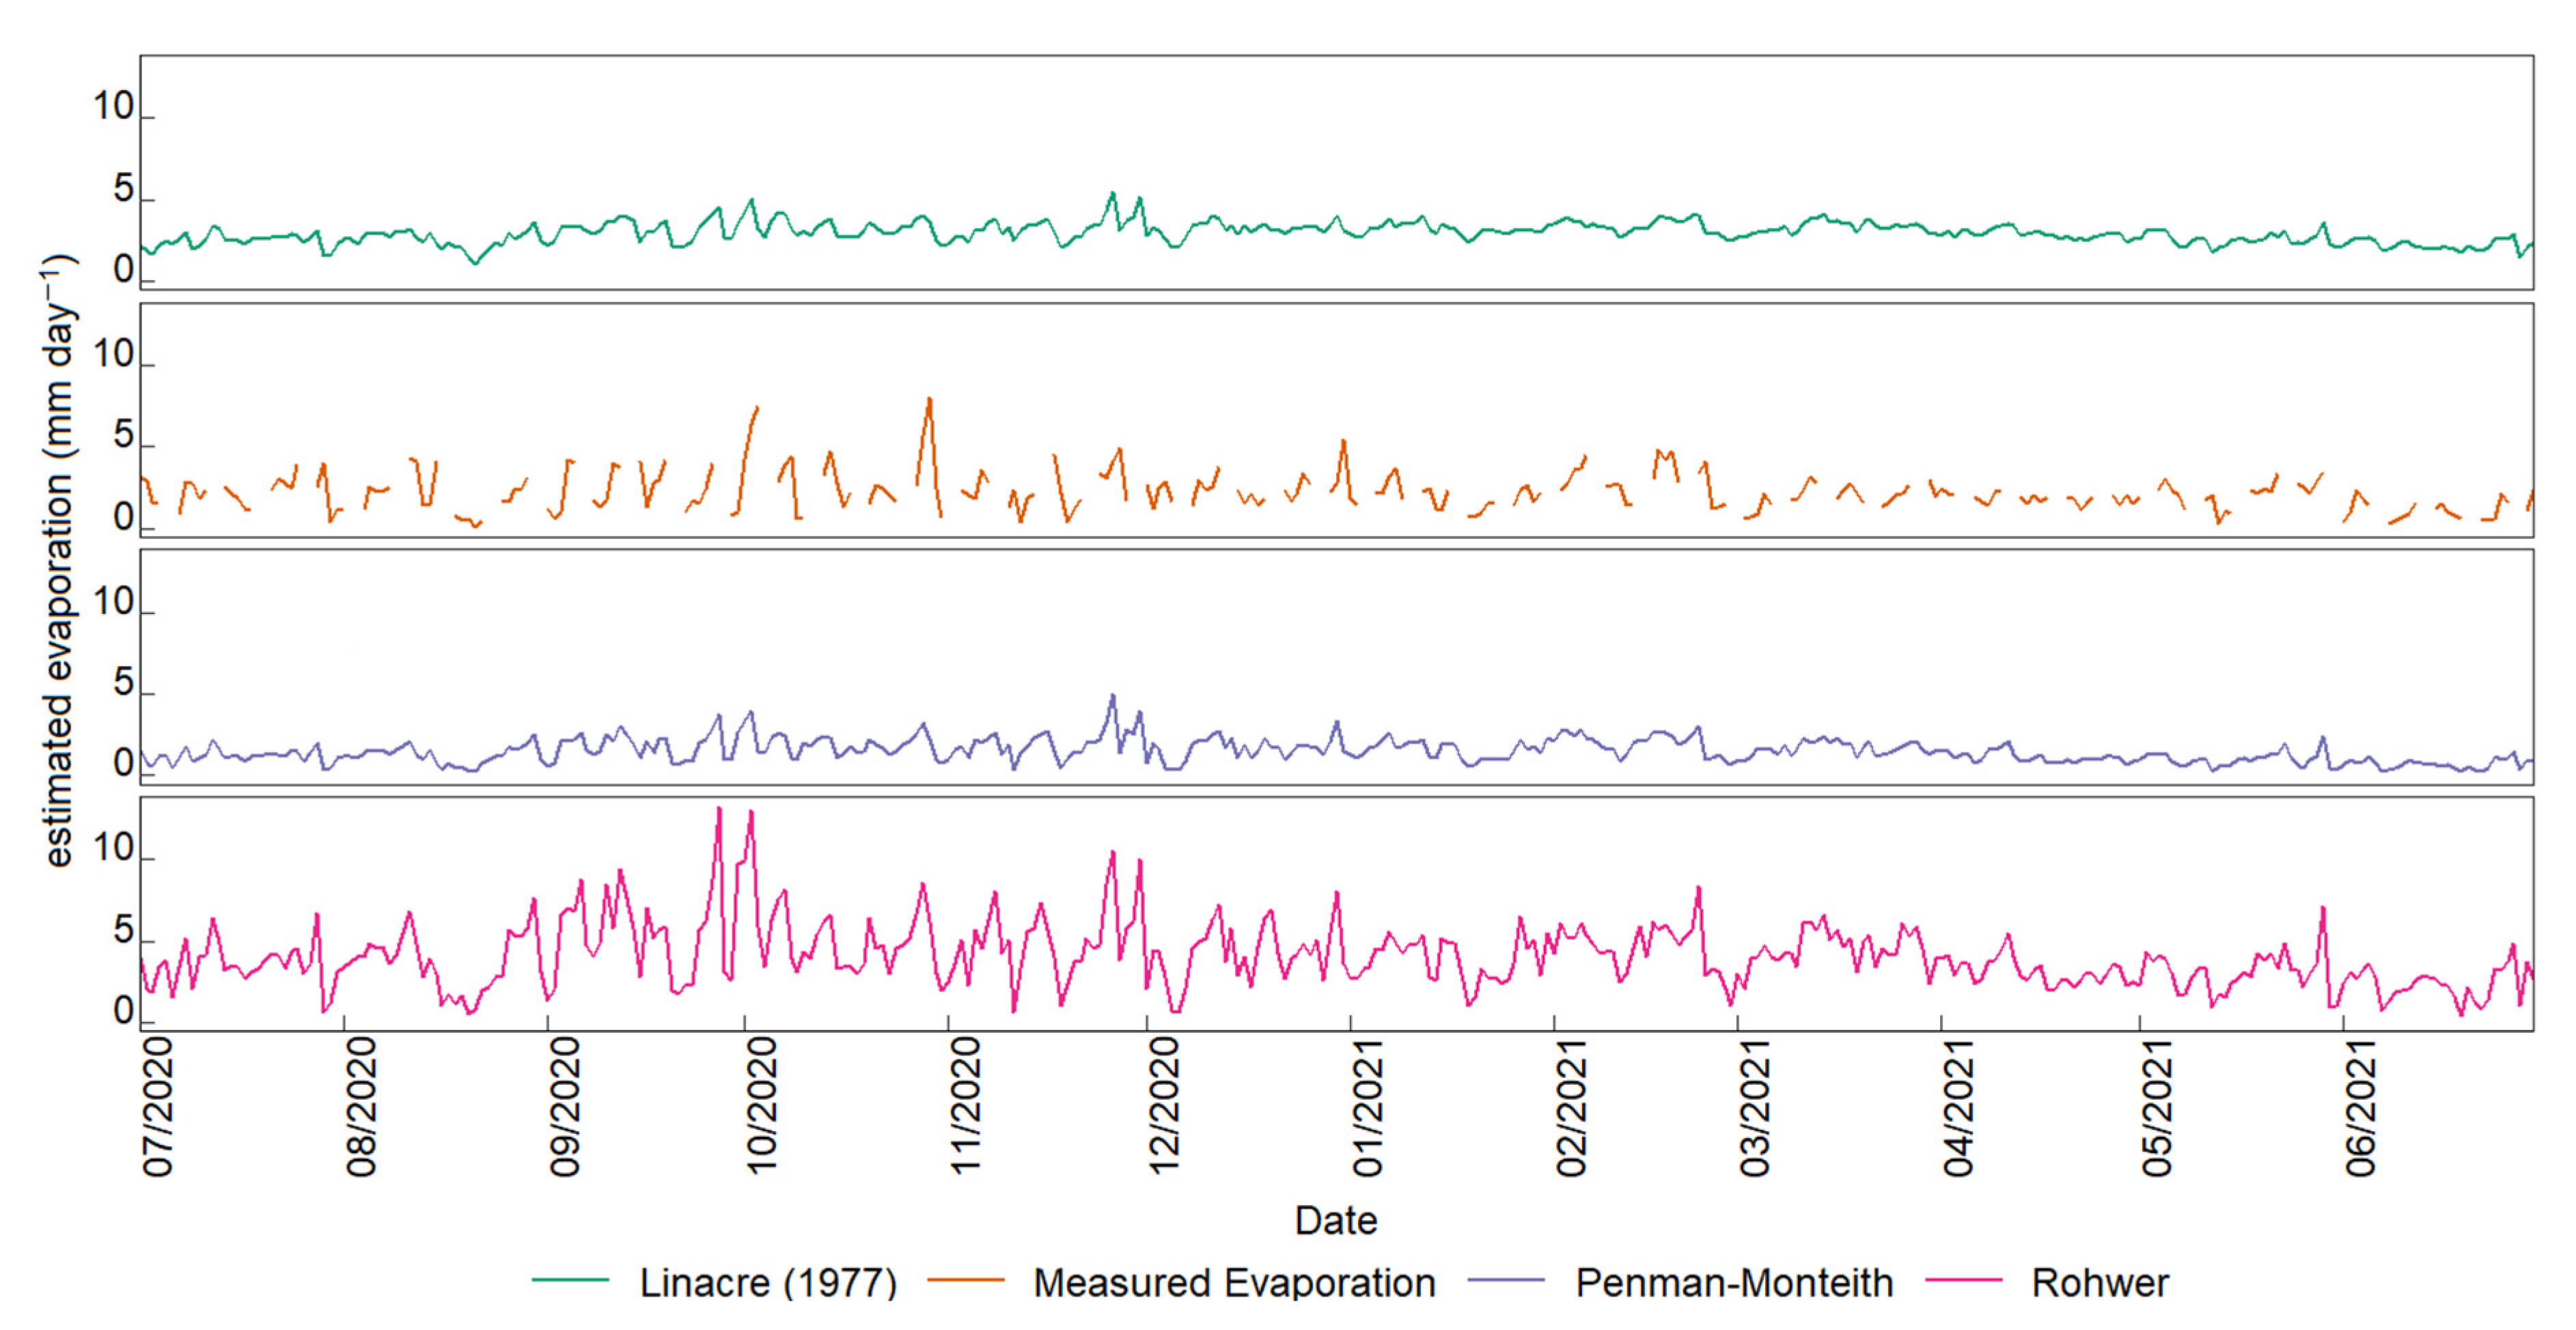
3.2. Evaporation Rates by the Various Methods

Table 2 presents the average and standard deviation rates of evaporation for the methods studied along with the evaporation data measured.
In a numerical comparison study of accumulated evaporation by evaporation methods and data measured in Catania-Italy, the Penman–Monteith and Hargreaves–Samani methods slightly underestimated the evaporation rates, while Valiantzas and Rohwer methods slightly overestimated the evaporation values. The study concluded that all methods could be used in the long-term analysis. However, better short-term results are obtained using more complex models such as the FAO Penman–Monteith [2].
The results of the Kruskal–Wallis test for the compared methods, along with the measured evaporation rates, are shown in Table 3.
Based on the results reported in Table 3, the evaporation values obtained by the Linacre (1997) and FAO Penman–Monteith methods were more aligned with the measured evaporation values.
The Linacre method [23] did not differ statistically from the evaporation values measured in July, August, September, October, November (2020), February, and May (2021), with a confidence level of 95%.
The FAO Penman–Monteith method [22] did not differ statistically from the evaporation values measured in August, September, November, December (2020), January, March, and June (2021), with a confidence level of 95%.
The Rohwer method [19] did not differ statistically only in May from the evaporation values measured with a confidence level of 95%. The Hargreaves–Samani, Valiantzas, and Linacre [10,24,25] methods differed statistically from the measured evaporation for all months with a confidence level of 95%.
The Linacre [24] method is an optimization of the Linacre [23] early method, in which wind speed variations and a better approach to net radiation are included. For the results obtained, they presented differences with a confidence level of 95%.
Linear regression showed that all estimation methods have a strong correlation with the standardized FAO Penman–Monteith method, the coefficient of determination (R2) was between 0.707–0.901, and Pearson correlation coefficient (r) was between 0.840–0.949, as shown in Figure 4.
Although the methods show a strong correlation, they do not reflect the climatic conditions of the Passaúna Reservoir region. Implying that the methods are validated for specific climates and therefore, scale differences between the methods were shown [3].
Coelho et al. [16] also found differences between the evaporation estimation methods but with underestimated results for Linacre [24] compared to the FAO Penman–Monteith, different from the overestimation obtained by us. Differences from our results can be explained by the high rainfall rates during most of the year in Tucuruí—Northeast Brazil, leading to an underestimation of the solar radiation and, consequently, the evaporation rates.
Similar results were obtained for the Sobradinho and Três Marias reservoirs in Southeastern Brazil, in which the Linacre (1993) method overestimated the evaporation compared to the Penman–Monteith method [8,14].
The Valiantzas method [10] showed better accuracy compared to the FAO Penman–Monteith method on a daily scale in southern China due to the consideration of the four variables of air temperature, relative humidity, wind speed, and solar radiation, which are important meteorological parameters for estimating evaporation [47].
The evaporation values obtained by the Linacre (1977), FAO Penman–Monteith, and Rohwer methods were the closest to the measured evaporation values for the present work. The discontinuity of measured evaporation data is due to the lack of available data, which is one of the problems faced when obtaining data of directly measured evaporation. The results of the evaporation rates estimated by these methods and the measured evaporation are presented in Figure 5.
Comparing the monthly evaporation results obtained by the considered methods to the measured ones shows that the Rohwer (1931) method has differed statistically in all months except May. The Linacre (1977) method differed statistically in December, January, March, April, and June. The FAO Penman–Monteith method [22] differed statistically in July, October, February, April, and May. All analyses were carried out with a confidence level of 95%.
The best results obtained were for the FAO Penman–Monteith method. Hence, it was chosen to calculate of the evaporation estimate for different areas of the FPS, presented in the next section.

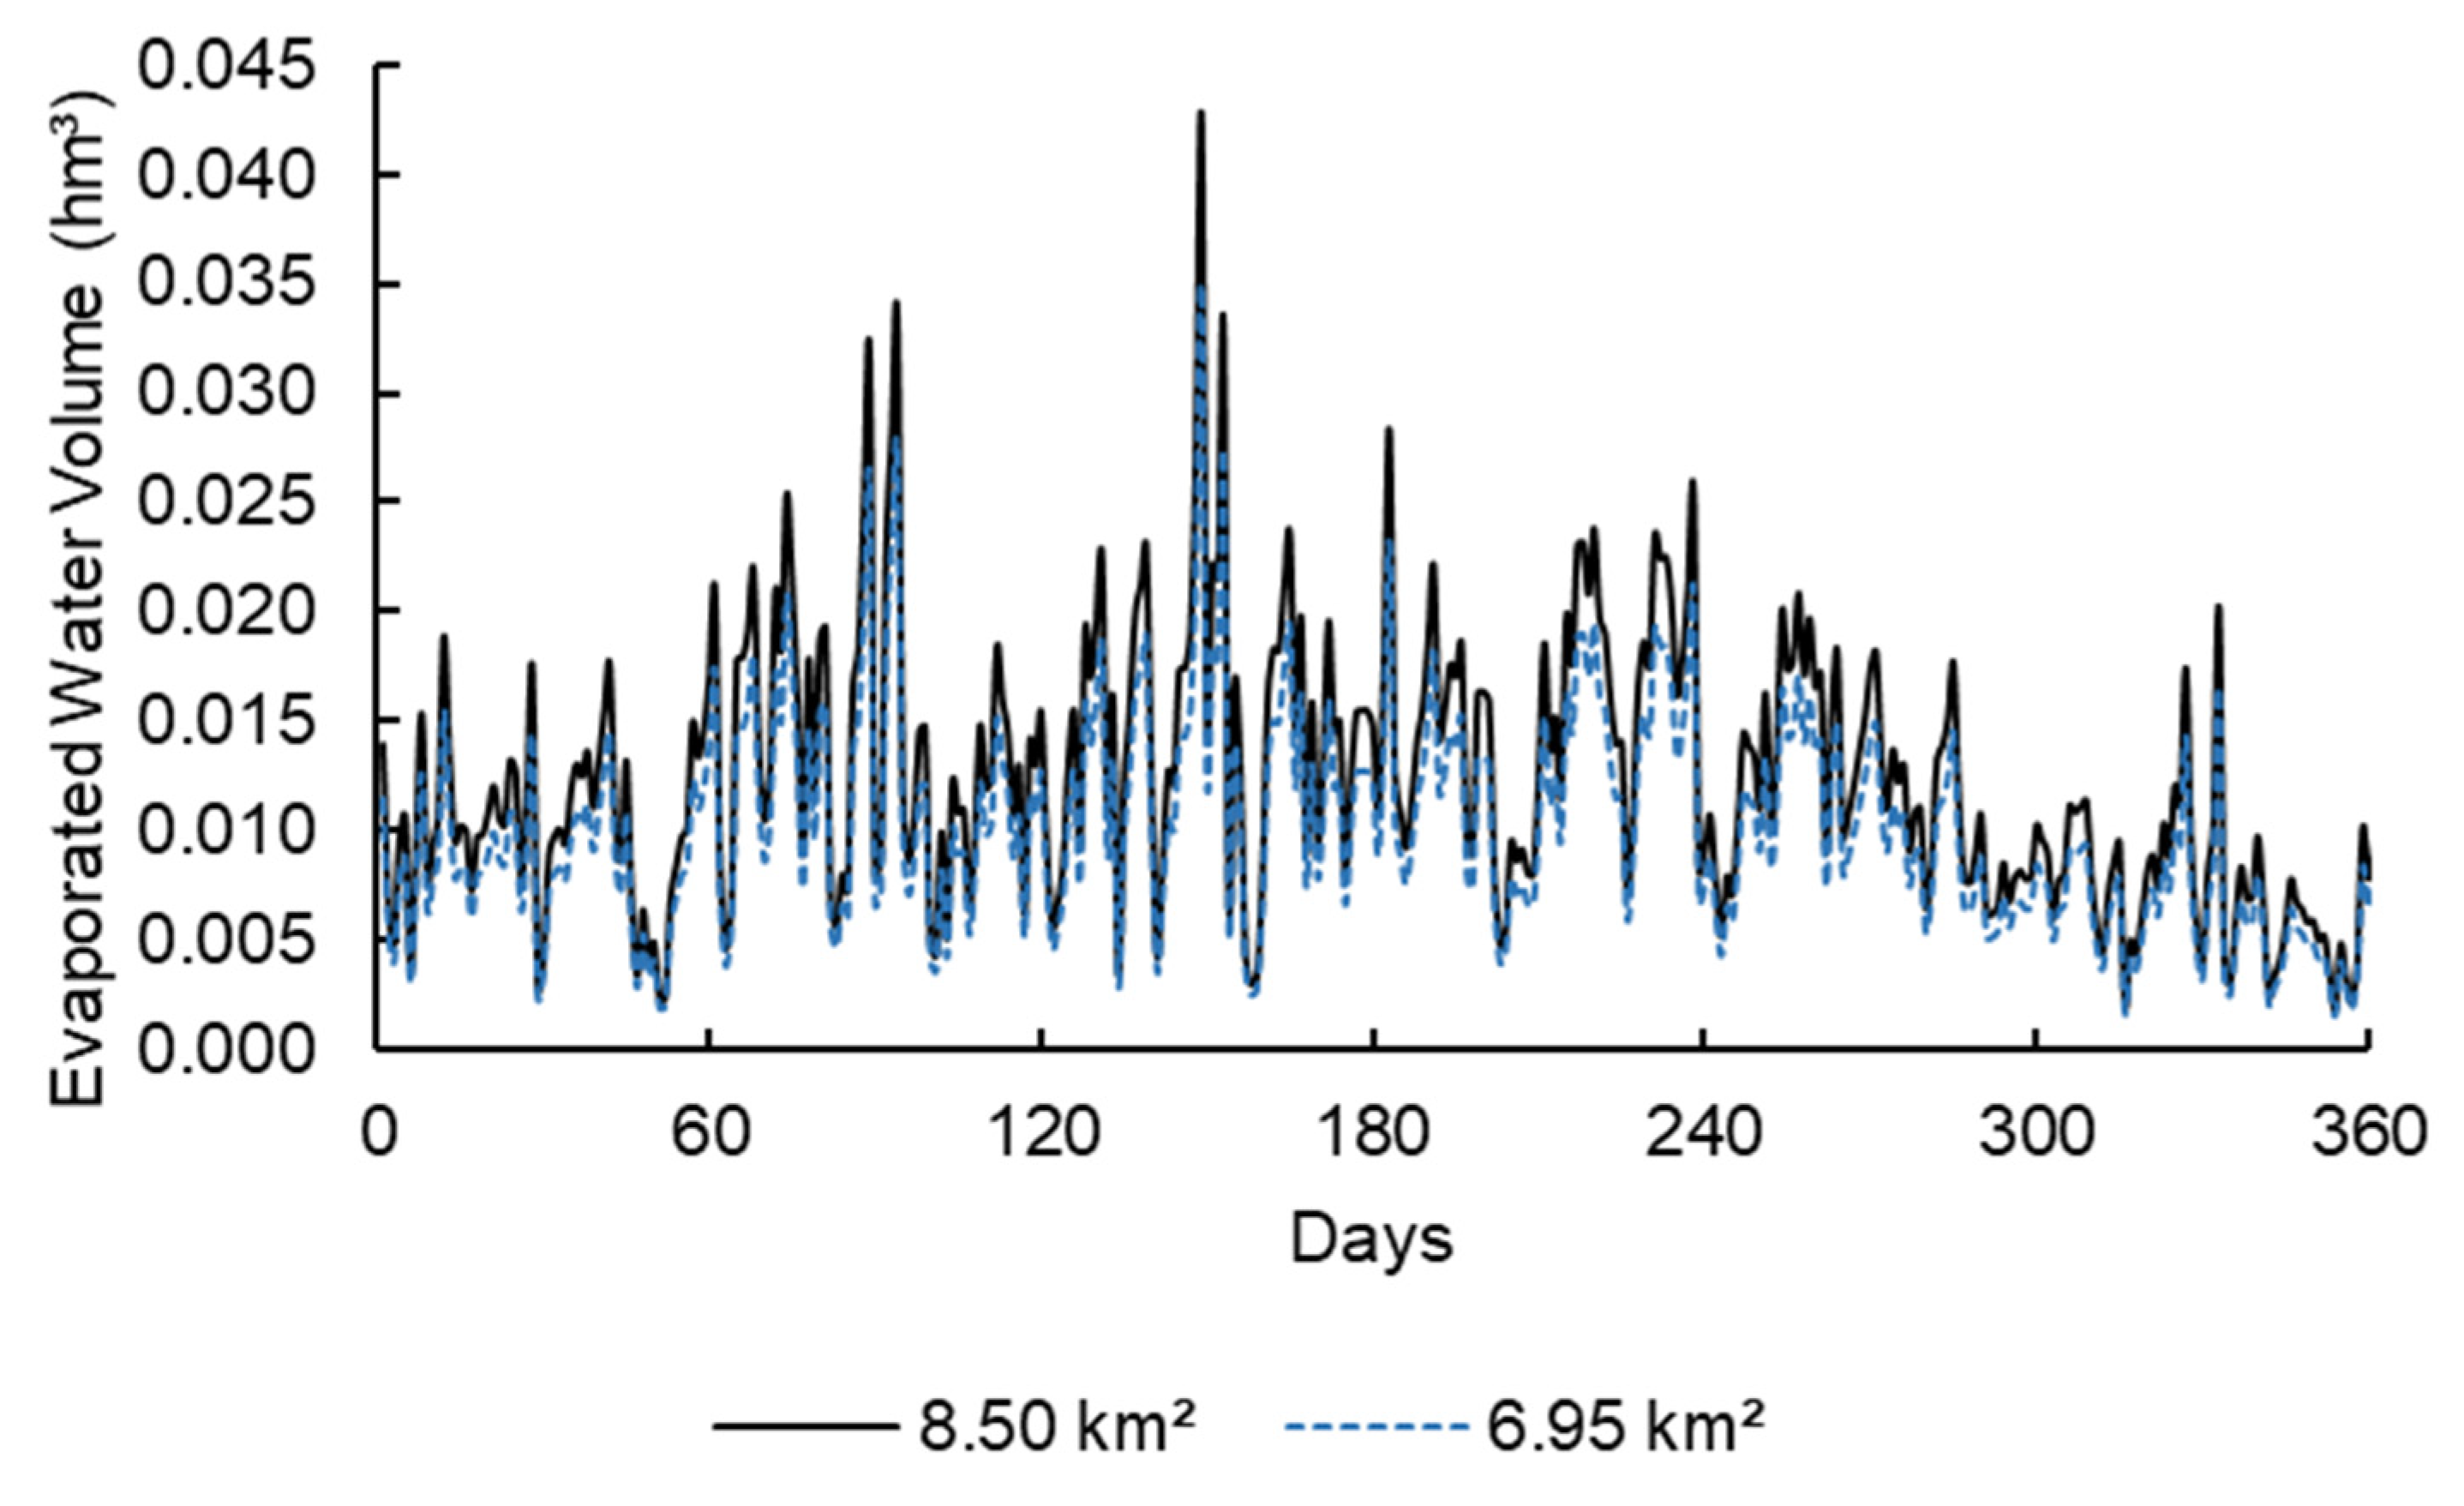
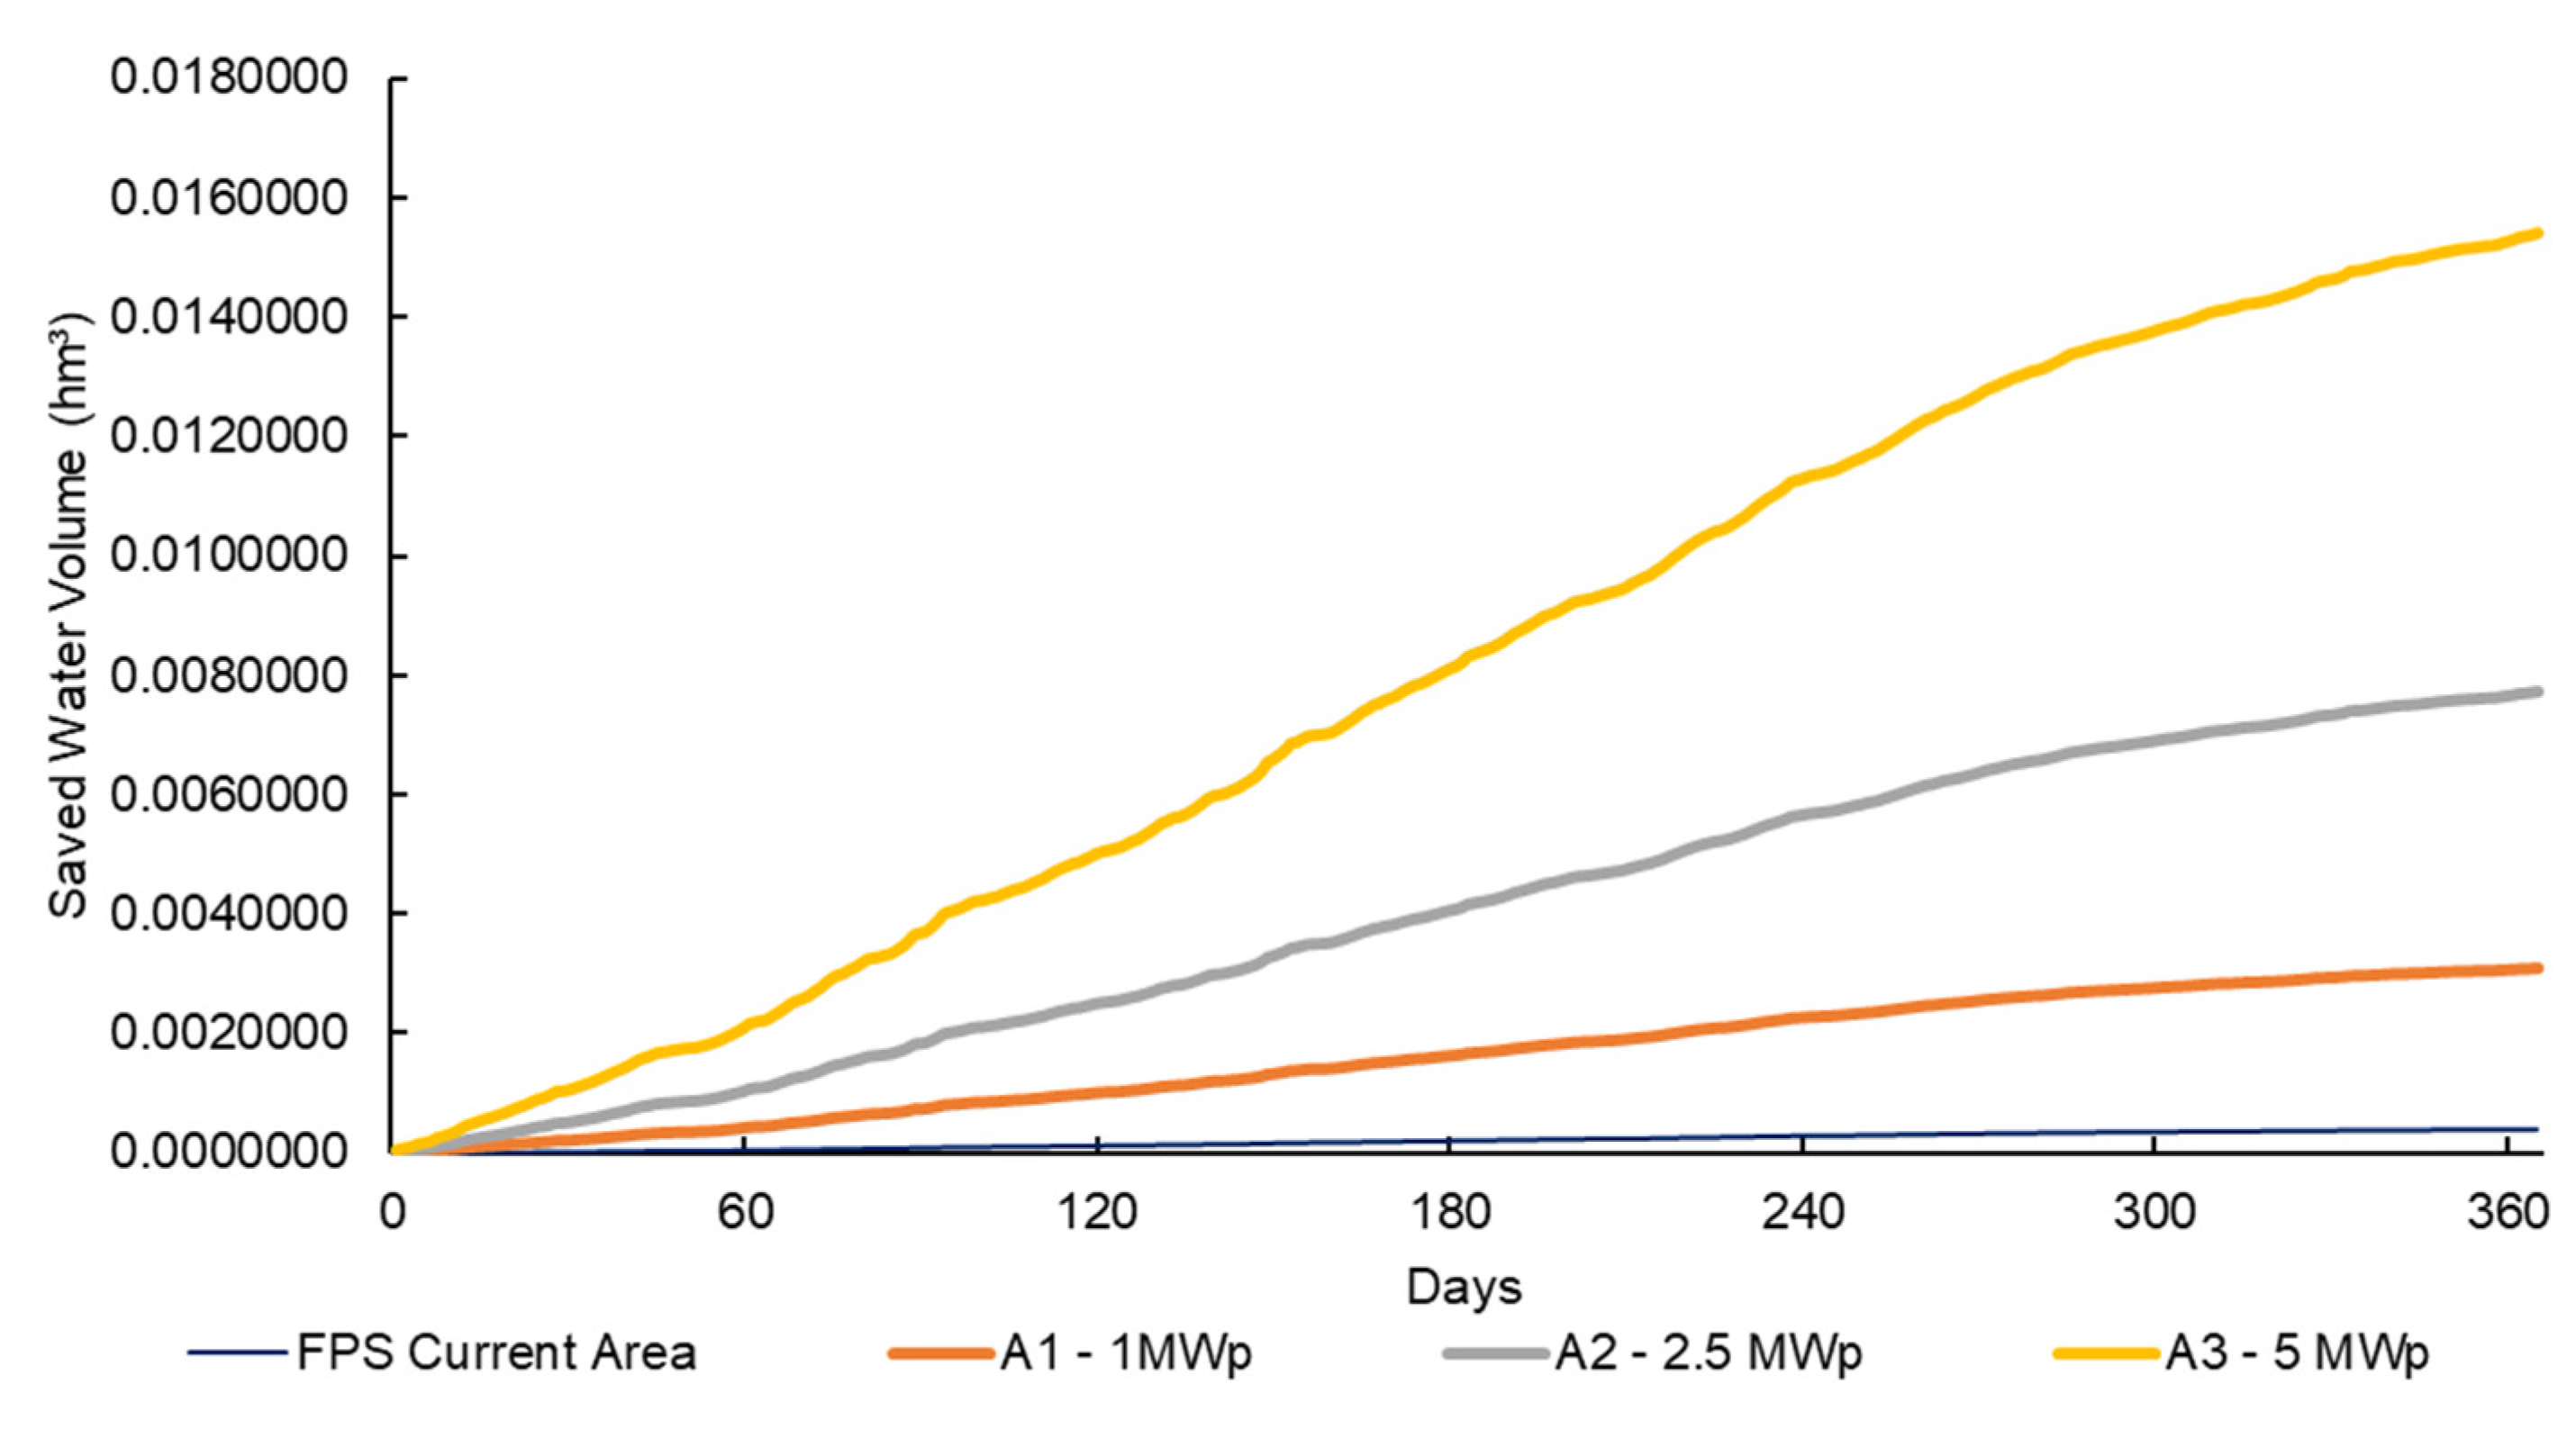
3.3. Floating Photovoltaic System Water Evaporation Reduction

The evaporation reduction considering the area covered by the FPS in the Passúna reservoir was estimated using the FAO Penman–Monteith method. The Assouline, Narkis and Or [45] relation was implemented to obtain the reduction in the evaporation rates considering the interference of the FPS, as shown in Table 4.
As shown in Table 4, the existing FPS occupies a covered area of 1265.14 m2, with a total opening area of 199.83 m2, resulting in an evaporation fraction of 0.157. The area expansions corresponding to energy production capacities of 1 MWp, 2.5 MWp, and 5 MWp were calculated proportionally to the current area of the FPS, maintaining the openings and coverage ratio of the photovoltaic modules and their surrounding area.
The efficiency was estimated from 60.20% to 70.70% for the evaporation reduction by the FPS. The most conservative (60.20%) was assumed to estimate the evaporation reduction.
As the current FPS in the Passaúna Reservoir occupies a relatively small covered area to the total area of the reservoir, corresponding to 0.01%, expansions were assumed with coverage areas corresponding to energy production capacities of 1 MWp, 2.5 MWp, and 5 MWp. The available area of the reservoir was presumed in two approaches: reservoir area at its total volume of water storage with an area of 8.5 km2, and another with the current available area of 6.95 km2 considering the water scarcity period, as shown in Figure 6.
Figure 7 shows the annual daily behavior of evaporated water volume in the Passaúna Reservoir considering the period of water scarcity.
The highest values of evaporated water volume, observed in Figure 7, were in the summer, followed by spring, autumn, and winter. For the surface area of the Passaúna reservoir, considering the total storage volume, the yearly accumulated volume of evaporated water is 4.47 hm3. Considering the surface area during the period of water scarcity, the volume of evaporated water is 3.65 hm3. In terms of the average volume of water used by Sanepar in 2021 (43 hm3) to supply the population, these volumes correspond to approximately 10.4% and 8.5%, respectively. The accumulated volume of evaporated water could supply 58,596 and 47,846 people annually, respectively.
Figure 8 depicts the accumulated volume of water saved by covering the water surface occupied by the FPS current area and area expansions corresponding to an energy production capacity of 1 MWp (A1), 2.5 MWp (A2), and 5 MWp (A3). It was observed that the larger the area of the FPS on the water surface, the greater the reduction of the water evaporation and, consequently, the greater the volume of the saved water.
Although larger areas represent a more significant reduction of water evaporation, the FPS occupies a small area compared to the total surface area available in the Passaúna Reservoir. The volume of water that could be saved by evaporation is approximately 0.015 hm3 for the largest area (A3).
Considering a per capita water consumption of 0.209 m3 per inhabitant per day, according to Sanepar in 2021, the accumulated volume of water saved by evaporation for an FPS with energy production of 5 MWp would be enough to supply more than 196 people per year. In the same way, the FPS could supply the electricity demand for 2564 inhabitants, considering the average per capita consumption of 1.95 kWh in the State of Paraná [48].
Valadares [49] evaluated the impact of FPS installed in reservoirs used for hydroelectric power generation in Brazil on the evaporation rate. The author considered the reduction of the water evaporation due to the installation of the FPS insignificant, especially when comparing the avoided evaporation in a water volume of 0.35 hm3, with the total volume of the reservoir (792 hm3), which could supply 6304 people over a year. The annual accumulated volume of water saved can be approximately equal to the total volume of water evaporated in a single day on the reservoir.
Lopes et al. [50] studied the evaporation reduction efficiency from the percentage of the coverage area over the total area of the reservoir located in the Brazilian semiarid region. The authors obtained unevaporated water volumes per year of 21.2%, 37%, and 55.2% for covered areas of 30%, 50%, and 70% respectively. They obtained similar results for different scenarios of covered areas, 19.4%, 50%, and 70% of the weir surface, which can represent a reduction in the annual government expenses of 13.38%, 14.36%, and 15.3%, respectively, with a reduction in the water demand from water trucks delivered to the population. The authors concluded that the FPS had a relevant impact on the evaporation rate of weirs.
Bontempo Scavo et al. [2] obtained a 42% reduction in evaporation with flexible modules installed directly on the water, a system similar to the one installed in the Passaúna Reservoir. In addition, the full coverage FPS below the modules presented a 49% reduction in water evaporation, showing that the greater the area covered by the FPS, the greater the reduction in water evaporation.
The results achieved by [37] may indicate an overestimation in the FPS evaporation losses reduction efficiency. The authors found that for 50% coverage of the lake’s surface, a FPS could save 633.22 million m3 of water. That could be due to the assumption of a 90% in evaporation losses reduction. Further investigations are advised to estimate the FPS’s evaporation efficiency reduction in this case, as the results may not represent actual values.

4. Conclusions

This paper evaluated the effects of floating photovoltaic systems on water evaporation rates for a reservoir in southeastern Brazil. It provided a comparative analysis of different water evaporation prediction methods, namely the FAO Penman–Monteith, Linacre (1977), Rohwer (1931), Valiantzas (2006), Hargreaves–Samani (1985), and Linacre (1993) methods.
For preliminary research on the effects of the FPS on the estimation of the evaporation rate in the Passaúna Reservoir, the FAO Penman–Monteith and Linacre (1977) methods presented results closest to the measured evaporation values.
The water evaporation reduction efficiency obtained considering the covered area of the FPS was 60.20%. FPS can effectively reduce the reservoir evaporation rate, especially when the coverage area over water occupies larger areas of the reservoir, which is not the case of the FPS installed at the Passaúna Reservoir.
The water savings promoted by the current FPS area in the Passaúna reservoir and its future expansions to areas corresponding to energy productions of 1 MWp, 2.5 MWp, and 5 MWp did not result in a significant volume to the total surface available in the reservoir. Nevertheless, for a 5 MWp system, the water saved by evaporation could supply up to 196 people a year and about 2564 people with electricity, considering per capita consumption of 209 L/day and 1.95 kWh, respectively.
The accumulated volume of evaporated water during one year was 4.47 hm3, and in periods of water scarcity, this volume can be 3.65 hm3. The average volume of water withdrawn from the Passaúna reservoir by the Water and Sanitation Company in 2021 to supply the population was 43 hm3. The accumulated volumes of evaporated water correspond to approximately 10.4% and 8.5%, respectively. The accumulated volume of evaporated water could supply 58,596 and 47,846 people annually, respectively. With an FPS covering the entire surface of the Passaúna reservoir, the volume of water saved could reach 2.69 hm3, which could supply 35,262 people over a year, thus representing an essential value for the public management of the water resources in the reservoir.

Author Contributions

Conceptualization, F.R.d.S. and G.K.W.; methodology, F.R.d.S., G.K.W. and J.S.d.V.F.; software, J.S.d.V.F.; formal analysis, F.R.d.S.; investigation, F.R.d.S.; resources, G.K.W.; data curation, F.R.d.S.; writing—original draft preparation, F.R.d.S.; writing—review and editing, G.K.W., T.L.C., G.A.C. and A.F.; visualization, F.R.d.S.; supervision, G.K.W. and J.S.d.V.F.; project administration, G.K.W. All authors have read and agreed to the published version of the manuscript.

Funding

This research received no external funding.

Institutional Review Board Statement

Not applicable.

Informed Consent Statement

Not applicable.

Data Availability Statement

Not applicable.

Acknowledgments

We acknowledge the support of Sanepar Research and Innovation Management for the meteorological data provided and information about the floating photovoltaic system.

Conflicts of Interest

The authors declare no conflict of interest.

Nomenclature

ANEELBrazilian Electricity Regulatory Agency
FAOFood and Agriculture Organization of the United Nations
PVphotovoltaic
FPSfloating photovoltaic system
SaneparWater and Sanitation Company of Paraná State
BDMEPMetereological Database for Teaching and Research
INMETNational Institute of Meteorology
Tmeanmean air temperature
Tmaxmaximum air temperature
Tminminimum air temperature
Tdewdew-point temperature
zaltitude
ϕ latitude
Rssolar radiation
Raextraterrestrial radiation
Rnnet radiation
uwind speed
essaturation vapour pressure
eavapour pressure
edsaturarion vapour pressure at dew-point temperature
RHrelative humidity
Gsoil heat flux density
αwater albedo
auwind function constant
slope vapor pressure curve
Eestimated evaporation
ETPpotential evapotranspiration

References

  1. Craig, I.; Green, A.; Scobie, M.; Schmidt, E. Controlling Evaporation Loss from Water; National Centre for Engineering in Agriculture Publication 1000580/1; University of Southern Queensland: Toowoomba, Australia, 2005. [Google Scholar]
  2. Bontempo Scavo, F.; Tina, G.M.; Gagliano, A.; Nižetić, S. An Assessment Study of Evaporation Rate Models on a Water Basin with Floating Photovoltaic Plants. Int. J. Energy Res. 2021, 45, 167–188. [Google Scholar] [CrossRef]
  3. Wurbs, R.A.; Ayala, R.A. Reservoir Evaporation in Texas, USA. J. Hydrol. 2014, 510, 1–9. [Google Scholar] [CrossRef]
  4. Helfer, F.; Lemckert, C.; Zhang, H. Impacts of Climate Change on Temperature and Evaporation from a Large Reservoir in Australia. J. Hydrol. 2012, 475, 365–378. [Google Scholar] [CrossRef]
  5. Hartmann, D.L. The Hydrologic Cycle. In Global Physical Climatology; Elsevier: Amsterdam, The Netherlands, 2016; pp. 131–157. [Google Scholar]
  6. Harwell, G.R. Estimation of Evaporation from Open Water: A Review of Selected Studies, Summary of U.S. Army Corps of Engineers Data Collection and Methods, and Evaluation of Two Methods for Estimation of Evaporation from Five Reservoirs in Texas. USA; Geological Survey Scientific Investigations Report; USGS: Reston, VA, USA, 2012. [CrossRef]
  7. Curtarelli, M.P.; Alcântara, E.H.; de Araújo, C.A.S.; Stech, J.L.; Lorenzzetti, J.A. Assessment of Temporal Dynamics of Evaporation in the Itumbiara Reservoir, GO, Using Remote Sensing Data. Ambiente e Água 2013, 8, 272–289. [Google Scholar] [CrossRef]
  8. Pereira, S.B.; Pruski, F.F.; da Silva, D.D.; Ramos, M.M. Evaporação líquida no lago de Sobradinho e impactos no escoamento devido à construção do reservatório. Rev. Bras. de Eng. Agrícola e Ambient. 2009, 13, 346–352. [Google Scholar] [CrossRef]
  9. Craig, I.P. Loss of Storage Water due to Evaporation—A Literature Review; National Centre for Engineering in Agriculture publication; University of Southern Queensland: Toowoomba, Australia, 2005. [Google Scholar]
  10. Valiantzas, J.D. Simplified Versions for the Penman Evaporation Equation Using Routine Weather Data. J. Hydrol. 2006, 331, 690–702. [Google Scholar] [CrossRef]
  11. McMahon, T.A.; Peel, M.C.; Lowe, L.; Srikanthan, R.; McVicar, T.R. Estimating Actual, Potential, Reference Crop and Pan Evaporation Using Standard Meteorological Data: A Pragmatic Synthesis. Hydrol. Earth Syst. Sci. 2013, 17, 1331–1363. [Google Scholar] [CrossRef]
  12. Kohli, A.; Frenken, K. Evaporation from Artificial Lakes and Reservoirs. FAO AQUASTAT Reports 10. 2015. Available online: http://www.fao.org/3/a-bc814e.pdf (accessed on 29 January 2021).
  13. Hassan, M.M.; Peirson, W.L.; Neyland, B.M.; Fiddis, N.M.Q. Evaporation Mitigation Using Floating Modular Devices. J. Hydrol. 2015, 530, 742–750. [Google Scholar] [CrossRef]
  14. Vieira, N.P.A.; Pereira, S.B.; Martinez, M.A.; da Silva, D.D.; Silva, F.B. Estimativa Da Evaporação Nos Reservatórios de Sobradinho e Três Marias Usando Diferentes Modelos. Eng. Agrícola 2016, 36, 433–448. [Google Scholar] [CrossRef] [Green Version]
  15. Taboada, M.E.; Cáceres, L.; Graber, T.A.; Galleguillos, H.R.; Cabeza, L.F.; Rojas, R. Solar Water Heating System and Photovoltaic Floating Cover to Reduce Evaporation: Experimental Results and Modeling. Renew. Energy 2017, 105, 601–615. [Google Scholar] [CrossRef]
  16. Coelho, C.D.; da Silva, D.D.; Sediyama, G.C.; Moreira, M.C.; Pereira, S.B.; Lana, Â.M.Q. Estimates of Monthly and Annual Evaporation Rates and Evaporated Volumes per Unit Time in the Tucuruí-PA and Lajeado-TO Hydroelectric Power Plant Reservoirs Based on Different Methods. Eng. Agric. 2018, 38, 38–46. [Google Scholar] [CrossRef]
  17. Haas, J.; Khalighi, J.; de la Fuente, A.; Gerbersdorf, S.U.; Nowak, W.; Chen, P.J. Floating Photovoltaic Plants: Ecological Impacts versus Hydropower Operation Flexibility. Energy Convers. Manag. 2020, 206, 112414. [Google Scholar] [CrossRef]
  18. Rodrigues, I.S.; Ramalho, G.L.B.; Medeiros, P.H.A. Potential of Floating Photovoltaic Plant in a Tropical Reservoir in Brazil. J. Environ. Plan. Manag. 2020, 63, 2334–2356. [Google Scholar] [CrossRef]
  19. Rohwer, C. Evaporation from Free Water Surfaces; Technical Bulletins; United States Department of Agriculture, Economic Research Service: Washington, DC, USA, 1931. [CrossRef]
  20. Penman, H.L.; Keen, B.A. Natural Evaporation from Open Water, Bare Soil and Grass. Proc. R. Soc. Lond. Ser. A Math. Phys. Sci. 1948, 193, 120–145. [Google Scholar] [CrossRef]
  21. Monteith, J.L. Evaporation and Environment. Symp. Soc. Exp. Biol. 1965, 19, 205–234. [Google Scholar] [PubMed]
  22. Allen, R.G.; Pereira, L.S.; Raes, D.; Smith, M. Crop Evapotranspiration—Guidelines for Computing Crop Water Requirements; FAO Irrigation and Drainage Paper 56; FAO: Rome, Italy, 1998. [Google Scholar]
  23. Linacre, E.T. A simple formula for estimating evaporation rates in various climates, using temperature data alone. Agric. Meteorol. 1977, 18, 409–424. [Google Scholar] [CrossRef]
  24. Linacre, E.T. Data-sparse estimation of lake evaporation, using a simplified Penman equation. Agric. For. Meteorol. 1993, 64, 237–256. [Google Scholar] [CrossRef]
  25. Hargreaves, G.H.; Samani, Z.A. Reference Crop Evapotranspiration from Temperature. Appl. Eng. Agric. 1985, 1, 96–99. [Google Scholar] [CrossRef]
  26. Aminzadeh, M.; Lehmann, P.; Or, D. Evaporation Suppression and Energy Balance of Water Reservoirs Covered with Self-Assembling Floating Elements. Hydrol. Earth Syst. Sci. 2018, 22, 4015–4032. [Google Scholar] [CrossRef]
  27. Althoff, D.; Rodrigues, L.N.; da Silva, D.D. Impacts of Climate Change on the Evaporation and Availability of Water in Small Reservoirs in the Brazilian Savannah. Clim. Chang. 2020, 159, 215–232. [Google Scholar] [CrossRef]
  28. Yao, X.; Zhang, H.; Lemckert, C.; Brook, A.; Schouten, P. Evaporation Reduction by Suspended and Floating Covers: Overview, Modelling and Efficiency; Urban Water Security Research Alliance Technical Report No. 28; 2010. Available online: http://www.urbanwateralliance.org.au/publications/uwsra-tr28.pdf (accessed on 27 August 2022).
  29. Cazzaniga, R.; Cicu, M.; Rosa-Clot, M.; Rosa-Clot, P.; Tina, G.M.; Ventura, C. Floating photovoltaic plants: Performance analysis and design solutions. Renew. Sustain. Energy Rev. 2018, 81, 1730–1741. [Google Scholar] [CrossRef]
  30. Sukarso, A.P.; Kim, K.N. Cooling Effect on the Floating Solar PV: Performance and Economic Analysis on the Case of West Java Province in Indonesia. Energies 2020, 13, 2126. [Google Scholar] [CrossRef]
  31. Moraes, C.A.; Valadão, G.F.; Renato, N.S.; Botelho, D.F.; de Oliveira, A.C.L.; Aleman, C.C.; Cunha, F.F. Floating Photovoltaic Plants as an Electricity Supply Option in the Tocantins-Araguaia Basin. Renew. Energy 2022, 193, 264–277. [Google Scholar] [CrossRef]
  32. United States. U.S. Energy Information Administration EIA. United States, 2021. Hydropower Made up 66% of Brazil’s Electricity Generation in 2020. Available online: https://www.eia.gov/todayinenergy/detail.php?id=49436# (accessed on 22 August 2022).
  33. EPE. Plano Decenal de Expansão de Energia 2029. Available online: https://www.epe.gov.br/sites-pt/publicacoes-dados-abertos/publicacoes/Documents/PDE%202029.pdf (accessed on 22 August 2022).
  34. ABSOLAR—Associação Brasileira de Energia Solar Fotovoltaica. Energia Solar Fotovoltaica: Brasil é o 4º país Que Mais Cresceu em 2021. Available online: https://www.absolar.org.br/noticia/energia-solar-fotovoltaica-brasil-e-o-4o-pais-que-mais-cresceu-em-2021/ (accessed on 22 August 2022).
  35. Al-Widyan, M.; Khasawneh, M.; Abu-Dalo, M. Potential of Floating Photovoltaic Technology and Their Effects on Energy Output, Water Quality and Supply in Jordan. Energies 2021, 14, 8417. [Google Scholar] [CrossRef]
  36. Ravichandran, N.; Fayek, H.H.; Rusu, E. Emerging Floating Photovoltaic System—Case Studies High Dam and Aswan Reservoir in Egypt. Processes 2021, 9, 1005. [Google Scholar] [CrossRef]
  37. Hayibo, K.S.; Mayville, P.; Kailey, R.K.; Pearce, J.M. Water Conservation Potential of Self-Funded Foam-Based Flexible Surface-Mounted Floatovoltaics. Energies 2020, 13, 6285. [Google Scholar] [CrossRef]
  38. SANEPAR. Plano Diretor SAIC—Sistema de Abastecimento de Água Integrado de Curitiba e Região Metropolitana; Sanepar: Curitiba, Brazil, 2013; Available online: http://site.sanepar.com.br/arquivos/saicplanodiretor.pdf (accessed on 9 February 2021).
  39. Carneiro, C.; Kelderman, P.; Irvine, K. Assessment of Phosphorus Sediment–Water Exchange through Water and Mass Budget in Passaúna Reservoir (Paraná State, Brazil). Environ. Earth Sci. 2016, 75, 564. [Google Scholar] [CrossRef]
  40. Sotiri, K.; Hilgert, S.; Mannich, M.; Bleninger, T.; Fuchs, S. Implementation of Comparative Detection Approaches for the Accurate Assessment of Sediment Thickness and Sediment Volume in the Passaúna Reservoir. J. Environ. Manag. 2021, 287, 112298. [Google Scholar] [CrossRef]
  41. Sales, G.G. Water Quality Modeling in a Subtropical Water Supply Reservoir. Master’s Thesis, Federal University of Paraná, Curitiba, Brazil, 2020. [Google Scholar]
  42. Golyjeswki, O.W. Simulation of Thermal Stratification Using the a 2DV (CE-QUALW2) and a 3D (DELFT3D) Mode. The Case Study: Passaúna Reservoir. Master’s Thesis, Federal University of Paraná, Curitiba, Brazil, 2020. [Google Scholar]
  43. JA SOLAR. Available online: https://www.jasolar.com (accessed on 15 February 2022).
  44. RStudio Team. RStudio: Integrated Development Environment for R. RStudio; PBC: Boston, MA, USA, 2015; Available online: http://www.rstudio.com (accessed on 22 February 2021).
  45. Assouline, S.; Narkis, K.; Or, D. Evaporation Suppression from Water Reservoirs: Efficiency Considerations of Partial Covers. Water Resour. Res. 2011, 47. [Google Scholar] [CrossRef]
  46. ANEEL. Normative Resolution No. 482, of 17 April 2012. Available online: https://www.aneel.gov.br/ (accessed on 26 March 2022).
  47. Li, M.; Chu, R.; Islam, A.R.M.T.; Shen, S. Reference Evapotranspiration Variation Analysis and Its Approaches Evaluation of 13 Empirical Models in Sub-Humid and Humid Regions: A Case Study of the Huai River Basin, Eastern China. Water 2018, 10, 493. [Google Scholar] [CrossRef]
  48. EPE. Anuário Estatístico de Energia Elétrica 2022: Ano Base 2021. Available online: https://www.epe.gov.br (accessed on 15 June 2022).
  49. Valadares, B.U.T.F. Uma Metodologia sobre Estratégias de Gerenciamento de Energia para Usinas Fotovoltaicas Flutuantes Instaladas sobre Reservatórios de Usinas Hidrelétricas. Master’s Thesis, Federal University of Minas Gerais, Belo Horizonte, Brazil, 2017. [Google Scholar]
  50. Padilha Campos Lopes, M.; de Andrade Neto, S.; Alves Castelo Branco, D.; Vasconcelos de Freitas, M.A.; da Silva Fidelis, N. Water-Energy Nexus: Floating Photovoltaic Systems Promoting Water Security and Energy Generation in the Semiarid Region of Brazil. J. Clean. Prod. 2020, 273, 122010. [Google Scholar] [CrossRef]
Figure 1. Location of the Passaúna Reservoir. The author.
Energies 15 06274 g001
Figure 2. FPS in the Passaúna Reservoir.
Energies 15 06274 g002
Figure 3. Weather data from the study site (1 July 2020 to 30 June 2021).
Energies 15 06274 g003
Figure 4. Linear regression between FAO Penman–Monteith and other methods. (a) Comparison of PM with Linacre (1977); (b) Comparison of PM with Rohwer; (c) Comparison of PM with Hargreaves–Samani; (d) Comparison of PM with Valiantzas; (e) Comparison of PM with Linacre (1993).
Energies 15 06274 g004
Figure 5. Comparison between estimated evaporation (mm day−1) methods from Linacre (1977), FAO Penman-Monteith, Rohwer and the Measured Evaporation.
Energies 15 06274 g005
Figure 6. Aerial view of the water surface area of the Passaúna Reservoir and the FPS during the water shortage in 2021: (a) Passaúna Reservoir; (b) FPS site highlighting the low water level. Google Earth images.
Energies 15 06274 g006
Figure 7. Annual daily volume of evaporated water in the Passaúna reservoir (1 July 2020 to 30 June 2021).
Energies 15 06274 g007
Figure 8. Accumulated saved water volume by the FPS for current and future coverage area expansions (1 July 2020 to 30 June 2021).
Energies 15 06274 g008
Table 1. Literature models for estimating the evaporation.
Literature Evaporation Models Input Variables
Linacre (1977) [23]
E = 700 ( T mean + 0.006 z ) 100     ϕ + 15 ( T mean     T dew ) ( 80     T mean )
(1) T mean ,   T dew ,   z ,   ϕ
Linacre (1993) [24]
E = ( 0.015 + 0.0042 T mean + 10 6 z ) [ 0.8 R s     40 + 2.5 ( F ) ( u ) ( T mean     T dew ) ]
(2) R s ,   T mean ,   T dew , z, u
Rohwer [19]
E = ( 0.44 + 0.118 u ) ( e s     e d )
(3)es, ed, u
Valiantzas [10]
E     0.051 ( 1     α ) R s T mean + 9.5     0.188 ( T mean + 13 ) ( R s R a     0.194 )
( 1     0.00014 ( 0.7 T max + 0.3 T min + 46 ) 2 RH 100 ) + 0.049 ( T max + 16.3 )
( 1     RH 100 ) ( a u + 0.536 u )
(4)Rs, Ra, Tmax, Tmean, Tmin, RH, u
Hargreaves–Samani [25]
ETP = 0.0023 R a ( T max     T min ) 0.5 ( T mean + 17.8 )
(5) T max ,   T min ,   T mean ,   R a
Penman–Monteith [22]
E = 0.408 Δ ( R n     G ) + γ ( 900 T mean + 273 ) u ( e s     e a ) Δ + γ ( 1 + 0.34 u )
(6)Rn, Tmean, G, es, ea, u
Note: Tmean = mean air temperature, Tmax = maximum air temperature, Tmin = minimum air temperature, Tdew = dew-point temperature, z = altitude, ϕ = latitude , Rs = solar radiation, Ra = extraterrestrial radiation, Rn = net radiation, u = wind speed, es = saturation vapour pressure, ea = vapour pressure, ed = saturation vapour pressure at dew-point temperature, RH = relative humidity, G = soil heat flux density, F = 1.0–8.7 × 10⁻⁵z, α = water albedo, au = wind function constant, ∆ = slope vapor pressure curve, γ = psychometric constant; E = estimated evaporation, ETP = potential evapotranspiration.
Table 2. Comparative table showing the mean and standard deviation for six evaporation methods and measured evaporation.
MonthEvaporation (Mean ± SD) (mm day−1)
Measured Evap.Penman–MonteithLinacre (1977)RohwerValiantzasHargreaves–SamaniLinacre (1993)
July2.24 ± 0.951.19 ± 0.432.47 ± 0.453.51 ± 1.326.14 ± 1.955.68 ± 1.1522.66 ± 9.78
August1.94 ± 1.241.23 ± 0.542.53 ± 0.553.66 ± 1.796.66 ± 3.036.85 ± 1.9723.79 ± 13.96
September2.33 ± 1.331.81 ± 0.813.18 ± 0.665.59 ± 2.857.74 ± 3.219.01 ± 2.4626.96 ± 14.28
October3.24 ± 2.101.93 ± 0.733.32 ± 0.635.29 ± 2.378.66 ± 3.0210.03 ± 2.2331.01 ± 13.93
November2.3 ± 1.271.97 ± 0.973.25 ± 0.794.9 ± 2.339.12 ± 3.7110.23 ± 2.2633.04 ± 17.32
December2.43 ± 0.951.65 ± 0.683.19 ± 0.444.21 ± 1.797.44 ± 3.019.83 ± 2.0225.97 ± 13.29
January1.87 ± 0.771.54 ± 0.533.18 ± 0.353.83 ± 1.316.94 ± 2.329.09 ± 1.5623.96 ± 10.45
February2.94 ± 1.181.99 ± 0.693.41 ± 0.454.64 ± 1.539.48 ± 2.9810.41 ± 1.6035.92 ± 13.56
March1.94 ± 0.711.68 ± 0.443.3 ± 0.364.53 ± 1.147.78 ± 2.039.28 ± 1.2228.54 ± 9.79
April1.81 ± 0.331.12 ± 0.342.9 ± 0.293.14 ± 0.825.95 ± 1.697.43 ± 1.1621.38 ± 7.85
May2.15 ± 0.810.99 ± 0.462.57 ± 0.413.03 ± 1.295.05 ± 1.846.16 ± 1.3917.63 ± 8.58
June1.12 ± 0.630.71 ± 0.302.22 ± 0.332.4 ± 1.033.74 ± 1.554.89 ± 1.2712.22 ± 7.33
Annual cumulated evaporation
(mm year −1)
566.30538.591074.931475.82559.602994.789165.54
Note that the results obtained by the FAO Penman–Monteith method slightly underestimated the evaporation rate—only a 5.14% difference in the annual cumulated evaporation. In contrast, the results of annual evaporation rates obtained by the Linacre (1977), Rohwer (1931), Valiantzas (2006), Hargreaves–Samani (1985), and Linacre (1993) methods were overestimated.
Table 3. Kruskal–Wallis test results for the evaporation values obtained by the methods and measured evaporation values.
MethodJulyAugustSeptemberOctoberNovemberDecemberJanuaryFebruaryMarchAprilMayJune
Measured Evap.cdededdededfebc
Penman–Monteithdeeeedeeffcc
Linacre (1977)bccdddcdcdcdedbb
Rohwerbbcccccdcddbb
Valiantzasaabbbbbcbccaa
Hargreaves–Samaniaaababababbbbbaa
Linacre (1993)aaaaaaaaaaaa
Note: Methods with the different lowercase letters indicate significant differences at p < 0.05 (Kruskal–Wallis test).
Table 4. Results of the evaporation reduction efficiency relation for the Floating Photovoltaic System.
Energy Production Capacity (MWp)FPS Area (m2)FPS Open Area (m2)ɑ (Evaporating Fraction)XƐ (Small Openings)Ɛ (Large Openings)
0.131265.14199.830.1570.8420.6020.707
19731.841537.15
2.524,329.623842.88
548,659.237685.76
Publisher’s Note: MDPI stays neutral with regard to jurisdictional claims in published maps and institutional affiliations.

