Article

Changes in Energy Consumption and Energy Intensity in EU Countries as a Result of the COVID-19 Pandemic by Sector and Area Economy

by
Tomasz Rokicki
1,*,
Radosław Jadczak
2,
Adam Kucharski
2,
Piotr Bórawski
3,
Aneta Bełdycka-Bórawska
3,
András Szeberényi
4 and
Aleksandra Perkowska
1
1
Institute of Economics and Finance, Warsaw University of Life Sciences, 02-787 Warsaw, Poland
2
Faculty of Economics and Sociology, University of Lodz, 90-255 Łódz, Poland
3
Faculty of Agriculture and Forestry, University of Warmia and Mazury in Olsztyn, 10-719 Olsztyn, Poland
4
Institute of Marketing, Budapest Metropolitan University, 1148 Budapest, Hungary
*
Author to whom correspondence should be addressed.
Energies 2022, 15(17), 6243; https://doi.org/10.3390/en15176243
Submission received: 3 August 2022 / Revised: 19 August 2022 / Accepted: 26 August 2022 / Published: 26 August 2022

Abstract

:
Energy is vital for the proper functioning of the various sectors of the economy and social life. During the pandemic, there have been some changes in these aspects that need to be investigated. The main objective of this article is to identify the direction of change caused by the COVID-19 pandemic in energy consumption and energy intensity in sectors and economic areas in EU countries. The specific objectives are to identify the importance of energy consumption in sectors and areas of the economy in individual EU countries; to determine the dynamics of change and variability during the pandemic in energy consumption in individual sectors and areas of the economy in EU countries, especially during the COVID-19 pandemic; to determine the changes in energy intensity of individual economic sectors and the differences in energy intensity between individual EU countries, including during the COVID-19 pandemic. Using a purposive selection method, all 27 EU Member States were selected for the study on 31 December 2020. The analysed period covered the years 2005–2020. The sources of material were literature and data from Eurostat. Descriptive, tabular and graphical methods, dynamic indicators with a fixed base and variable base, Gini coefficient, coefficient of variation, Pearson’s linear correlation coefficient, and multi-criteria analysis were used for analysis and presentation. It was found that the structure of energy consumption had remained unchanged for several years, with transport, industry and households dominating. There were no significant differences between countries. The COVID-19 pandemic reduced energy consumption in all sectors of the economy, the largest in transport and services and the smaller in industry. At the same time, household energy consumption increased. As a result of the pandemic, there was an increase in energy intensity in all sectors of the economy, the largest in industry. Western European countries had a lower energy intensity of the economy than Central and Eastern European countries. There was little change over several years. Countries generally maintained their ranking. The pandemic did not change anything in this respect, meaning that it had a similar impact on individual EU countries.

1. Introduction

1.1. Energy Consumption in the Economic Sectors and the Household Area

One of the most critical factors determining countries’ and regions’ economic and social development is access to energy. Ideally, energy sources should be readily available and cheap [1,2]. Unfortunately, this is not always the case. Therefore, countries need to reduce their energy demand, i.e., be less energy-intensive [3]. A second reason is also environmental issues [4]. Economic activity and energy consumption are closely linked; hence the economy is called energy-dependent [5]. In the long term, economic growth and urbanisation are key factors leading to increased energy demand [6]. It is also important to remember that there is a national energy transition, meaning that both energy sources are changing (renewable energy is being developed), and production technologies are changing to more energy-efficient ones [7]. Technology transfer is promoted by globalisation [8], as is renewable energy development [9]. Such activities affect many areas of business and society. Examples include the promotion of electromobility [10], investment in renewable energy [11,12], and education toward a more environmentally responsible society [13,14].
There are differences in energy demand between the various sectors of the economy. The highest demand is reported by industry [15]. In contrast, the transport sector has the highest growth rate [16]. It all depends on the phase of economic development of a country. On the other hand, energy demand for transport grows steadily and takes up most of the total energy use in the later stages of development [17]. Innovations are needed in this sector to lower energy absorption and reduce air pollution. For example, advances in vehicle technology can reduce the energy intensity of the transport sector and improve the energy efficiency of transport operations [18]. The service sector is one of the fastest growing. Barriers can be found in this sector due to the high fragmentation of companies. The most important of these are insufficient knowledge, the low priority given to energy and financial difficulties [19,20]. In agriculture, the increase in energy demand is due to the increase in mechanisation, which leads to another issue—for example, replacing human labour with machine labour requires energy [21]. There are differences between countries. These are due to human capital characteristics, environmental conditions and the technical efficiency of crop and livestock production [22]. Interestingly, agriculture is a sector that produces more renewable energy than it consumes. By all means, progress is being made, but change is relatively slow [23]. Energy intensity may decrease with economic growth because of the technical changes that accompany this growth [24].
Household energy consumption is steadily increasing. The reason for this is the increasing share of various types of electricity-powered devices, such as computers and smartphones [25]. There are a great many factors that can influence household energy consumption. Among the most important are climate and urbanisation [26], housing characteristics, appliance use, household demographics [27,28], and population income [29]. One of the limiting factors for household energy consumption is energy prices [30]. Households seem to have the most variables determining the level of energy consumption. One of the most important is the economic factor.

1.2. Energy Policy Developments and Trends in Energy Consumption

EU energy policy is built on three pillars: competition, security of supply and sustainability. Targets such as reducing greenhouse gas emissions, increasing energy generated from renewable sources and increasing energy efficiency are also important [31,32,33]. Energy policy focuses on the liberalisation of the whole sector and, on the other hand, on developing a more sustainable energy sector [34,35,36]. All objectives have been progressively pursued and evolved. Important energy policy documents of recent years include Strategy 2010. It focuses on achieving energy efficiency targets and implementing low-carbon technologies [37]. The 2016 document on renewable energy should also be mentioned [38]. The energy policy, announced in 2015 in the ‘Energy Union Strategy’, is based on five closely related areas, namely: security, solidarity and trust among EU countries; full integration of the internal energy market; energy efficiency with reduced dependence on energy imports; decarbonisation of the economy; research, innovation and competitiveness towards low-carbon energy technologies [39]. In fact, energy integration within the EU has been an important objective since 2015.
In 2019, the Clean Energy for All Europeans package introduced a new comprehensive EU strategy. The aim was to achieve carbon neutrality by 2050 by facilitating a shift away from fossil fuels and replacing them with cleaner energy. One of the five targets is improving energy efficiency by saving and reducing greenhouse gas emissions. This aim assumes a 32.5% increase in energy efficiency by 2030 compared to the base year. The national targets are based on the country’s relative wealth (in GDP per capita). Less wealthy countries have less ambitious targets [40].
An action plan known as the European Green Deal has been created to address the challenges of climate change and environmental degradation. It aims to help transform the EU into a modern, resource-efficient and competitive economy that achieves zero net greenhouse gas emissions by 2050 and decouples economic growth from resource consumption. The aim is to reduce net greenhouse gas emissions by at least 55% by 2030 compared to the 1990 emission levels measured. Actions must be taken in this regard to address several areas. In terms of energy policy, one objective is to prioritise energy efficiency, improve the energy performance of buildings and develop an energy sector based mainly on renewable sources. In addition, changes are envisaged in the industrial, agricultural and transport sectors [41].

1.3. The Impact of COVID-19 on Business and Social Life

The COVID-19 pandemic generally had a negative impact on the economy. However, some activities benefited from it. Gourinchas [42] pointed to the very high degree of interconnectedness and specialisation of manufacturing activities. In such a situation, the collapse of supply chains will have cascading effects on many activities. Baldwin [43] identified circular flows that arose during the pandemic. COVID-19 decreased demand for face-to-face interaction services, such as hotels, restaurants and retail. On the other hand, there has been an increase in demand for services that can be provided remotely without the need for face-to-face contact. Information and communication technology (ICT) services can be cited as an example. Differences between countries were also due to the scale of the pandemic and the restrictions put in place by governments [44]. Using Canada as an example, Slade [45] singled out activities that were restricted during COVID-19, such as short-run production of furniture, automobiles, printing, petroleum, chemicals and plastics, non-metallic minerals, and computers, electronics and electricals. However, the increase in demand in the short term was in food and beverage and paper production. In the long term, production stabilised. In wholesale trade, sales of agricultural products, motor vehicles and construction parts and materials declined. Reductions in physical goods affected virtually all industries. Retail sales fell, except for food and beverages. Lebedeva and Moskalenko [46], using Ukraine as an example and 2020 data, found that industries such as car manufacturing, leather production, light industry, furniture manufacturing, coal mining, and oil and gas extraction were most affected. De Vet et al. [47] examined industrial production in the EU27. They found a sharp decline in this production in March and April 2020 (−11.1 and −20%, respectively, compared to the previous period), coinciding with the first wave of coronavirus spread. A rebound followed this in May and June 2020 (up 13% and 10.4% change from the previous period, respectively). Changes in production value were correlated with the disease situation and the restrictions put in place. Using Korea as an example, He and Wang [48] found that there were declines in all sectors, including food sales. In this country, restrictions and limitations were not extensive, but the country’s orientation towards importing and exporting goods and services was vital. Therefore, the impact of the pandemic was significant. The impact of COVID-19 on the economy may therefore be mixed. Arellana et al. [49], using Colombia as an example, found that in the first months of the pandemic, only the transport of goods increased, while the reduction was in the transport of people. Nonetheless, in the early stages of the pandemic, revenue declines were recorded in all transport sectors. Passenger transport was particularly negatively affected. Li et al. [50] found a correlation between the situation of passenger air transport worldwide and the rate of disease growth. The more morbidity there was, the more restrictions and a considerable reduction in the number of journeys. Similar results were obtained by Sun et al. [51,52] for the world and by Linka et al. [53,54] for European countries. Rahman and Thill [55] confirmed the patterns occurring based on studies in 86 countries.
The impact of COVID-19 on society is extensive and has far-reaching consequences. The economic aspects have already been presented. Social and health aspects can be mentioned next [56]. The first group can include the inability to use many services, cancellation or postponement of large-scale sporting events, avoidance of national and international travel and cancellation of services, disruption of the celebration of cultural, religious and festive events [57], stress and depression among the population, the need to maintain social distance with peers and family members [58], inability to use hotels, restaurants and places of worship [59], closure of entertainment venues such as cinemas and theatres, sports clubs, gymnasiums, swimming pools [60], postponement of examinations and remote learning [61]. In the EU countries, the pandemic had a very big impact on the tourism sector. Three countries are in the top five global travel destinations, ie Spain, France and Italy [59]. As for the health consequences for the public, the main ones mentioned are high health risks from contracting coronavirus, lack of access to medical services, and postponement of surgeries and procedures. All these restrictions meant that people had to spend a lot of time at home, only with their immediate family members. As a result, household expenses increased, including those for energy consumed.

1.4. Justification, Aims and Structure of the Article

The topics of this article are important and topical. The issues of energy consumption and energy intensity of individual sectors are essential for sustainable development and improving energy use efficiency. Ambitious targets have been set in the EU for significant energy consumption reductions and efficiency improvements. In addition, no country wants to sacrifice energy consumption for production and growth. These objectives appear to be somewhat contradictory. One possibility is to improve energy use by introducing new technologies, which should be appropriately performed in every sector. Reducing the energy consumption of households is also not insignificant. In this case, in addition to introducing energy-efficient appliances and solutions, education and a change in public habits are necessary. The background outlined in this way shows the direction of energy policy changes in the EU. The subject is important for future generations and the possibility of living in an unspoilt environment and benefiting from as yet inexhaustible energy resources. Therefore, this makes it all the more important to find out whether there have been changes in energy consumption patterns across sectors and areas of the economy during the COVID-19 epidemic. Did the pandemic significantly reduce energy consumption in particular sectors and areas? Or did it cause an increase in some? What were the differences in this respect? For aspects related to energy intensity, differences between sectors can also be identified. In addition, it would be important to identify differences between countries, whether these were exacerbated by the pandemic or reduced. In the first weeks, the pandemic certainly caused a surprise and a reduction in energy consumption, and this was an effect not anticipated in any of the forecasts. The occurrence of the pandemic worldwide was a particular problem. Of course, the impact varied from country to country and geographic region to geographic region. However, no one was immune from the effects of a pandemic. The scale and unpredictability of the phenomenon certainly had a major impact on the functioning of individual sectors and areas. The EU is reasonably coherent regarding policy objectives, including climate and energy. However, this grouping is made up of very diverse countries. It is also possible to distinguish groups of countries that are quite similar on energy issues. The conjuncture before the pandemic was very good. The changing playing field may also have caused energy consumption and intensity changes. What is new in this paper is the presentation of a comprehensive analysis of the impact of COVID-19 on energy consumption in different sectors of the economy and households. We believe that these two segments are interconnected. Remote working, for example, has somehow shifted some energy consumption from offices to employees’ homes. In the case of energy intensity, it is novel to present the changes that have taken place in this respect in EU countries and to identify whether there were countries that lost during the pandemic and those that gained. A problem and limitation is the lack of comprehensive data available. Individual sectors are assessed as a whole, which somewhat limits the inference about the development of individual industries. Based on the literature review, it is known that there were differences between individual industries within the industry sector, or services within the service sector, as well as transport modes within the entire transport sector. The authors of this article have not yet encountered such a comprehensive study of the energy consumption of individual sectors and areas of the economy, as well as their energy intensity, during the COVID-19 pandemic. It will be interesting to determine whether energy consumption and intensity changes were halted during the COVID-19 pandemic and how they proceeded in individual sectors and areas. The above aspects make the research necessary and unique. The article presented here can fill a research gap.
The article’s main objective is to identify the direction of change caused by the COVID-19 pandemic in energy consumption and energy intensity in sectors and areas of the economy in EU countries.
The specific objectives are:
  • Identifying the importance of energy consumption in sectors and areas of the economy in each EU country;
  • To determine the dynamics of change and variability during the pandemic in energy consumption by sector and economic area in EU countries, particularly during the COVID-19 pandemic;
  • To determine changes in the energy intensity of individual economic sectors and how this varies between EU countries, including during the COVID-19 pandemic.
The article seeks the answers to three research hypotheses:
Hypothesis 1.
The COVID-19 pandemic affected the decrease in energy consumption in EU countries in the material (industry) and customer contact (services) sectors, while it caused an increase in households.
Hypothesis 2.
The occurrence of the COVID-19 pandemic has hampered the favourable development of energy intensity reductions in individual economic sectors in EU countries.
Hypothesis 3.
Western European countries were characterised by lower energy intensity than Central and Eastern European countries, but these differences have decreased steadily.
The organisation of the work is as follows: Chapter 1 provides an introduction to the topic. The importance of energy consumption in sectors and areas of the economy is presented, as well as EU energy policy trends and objectives. The impact of COVID-19 on various economic and social activities is also shown. This section also includes the rationale and objectives of the article. Section 2 proposes methods to identify energy consumption and energy intensity changes in EU countries. In Section 3, the research findings were presented. In Section 4, the reference is made to other research results that dealt with the relationships tested. Furthermore, the main conclusions of this paper can be found in Section 5.

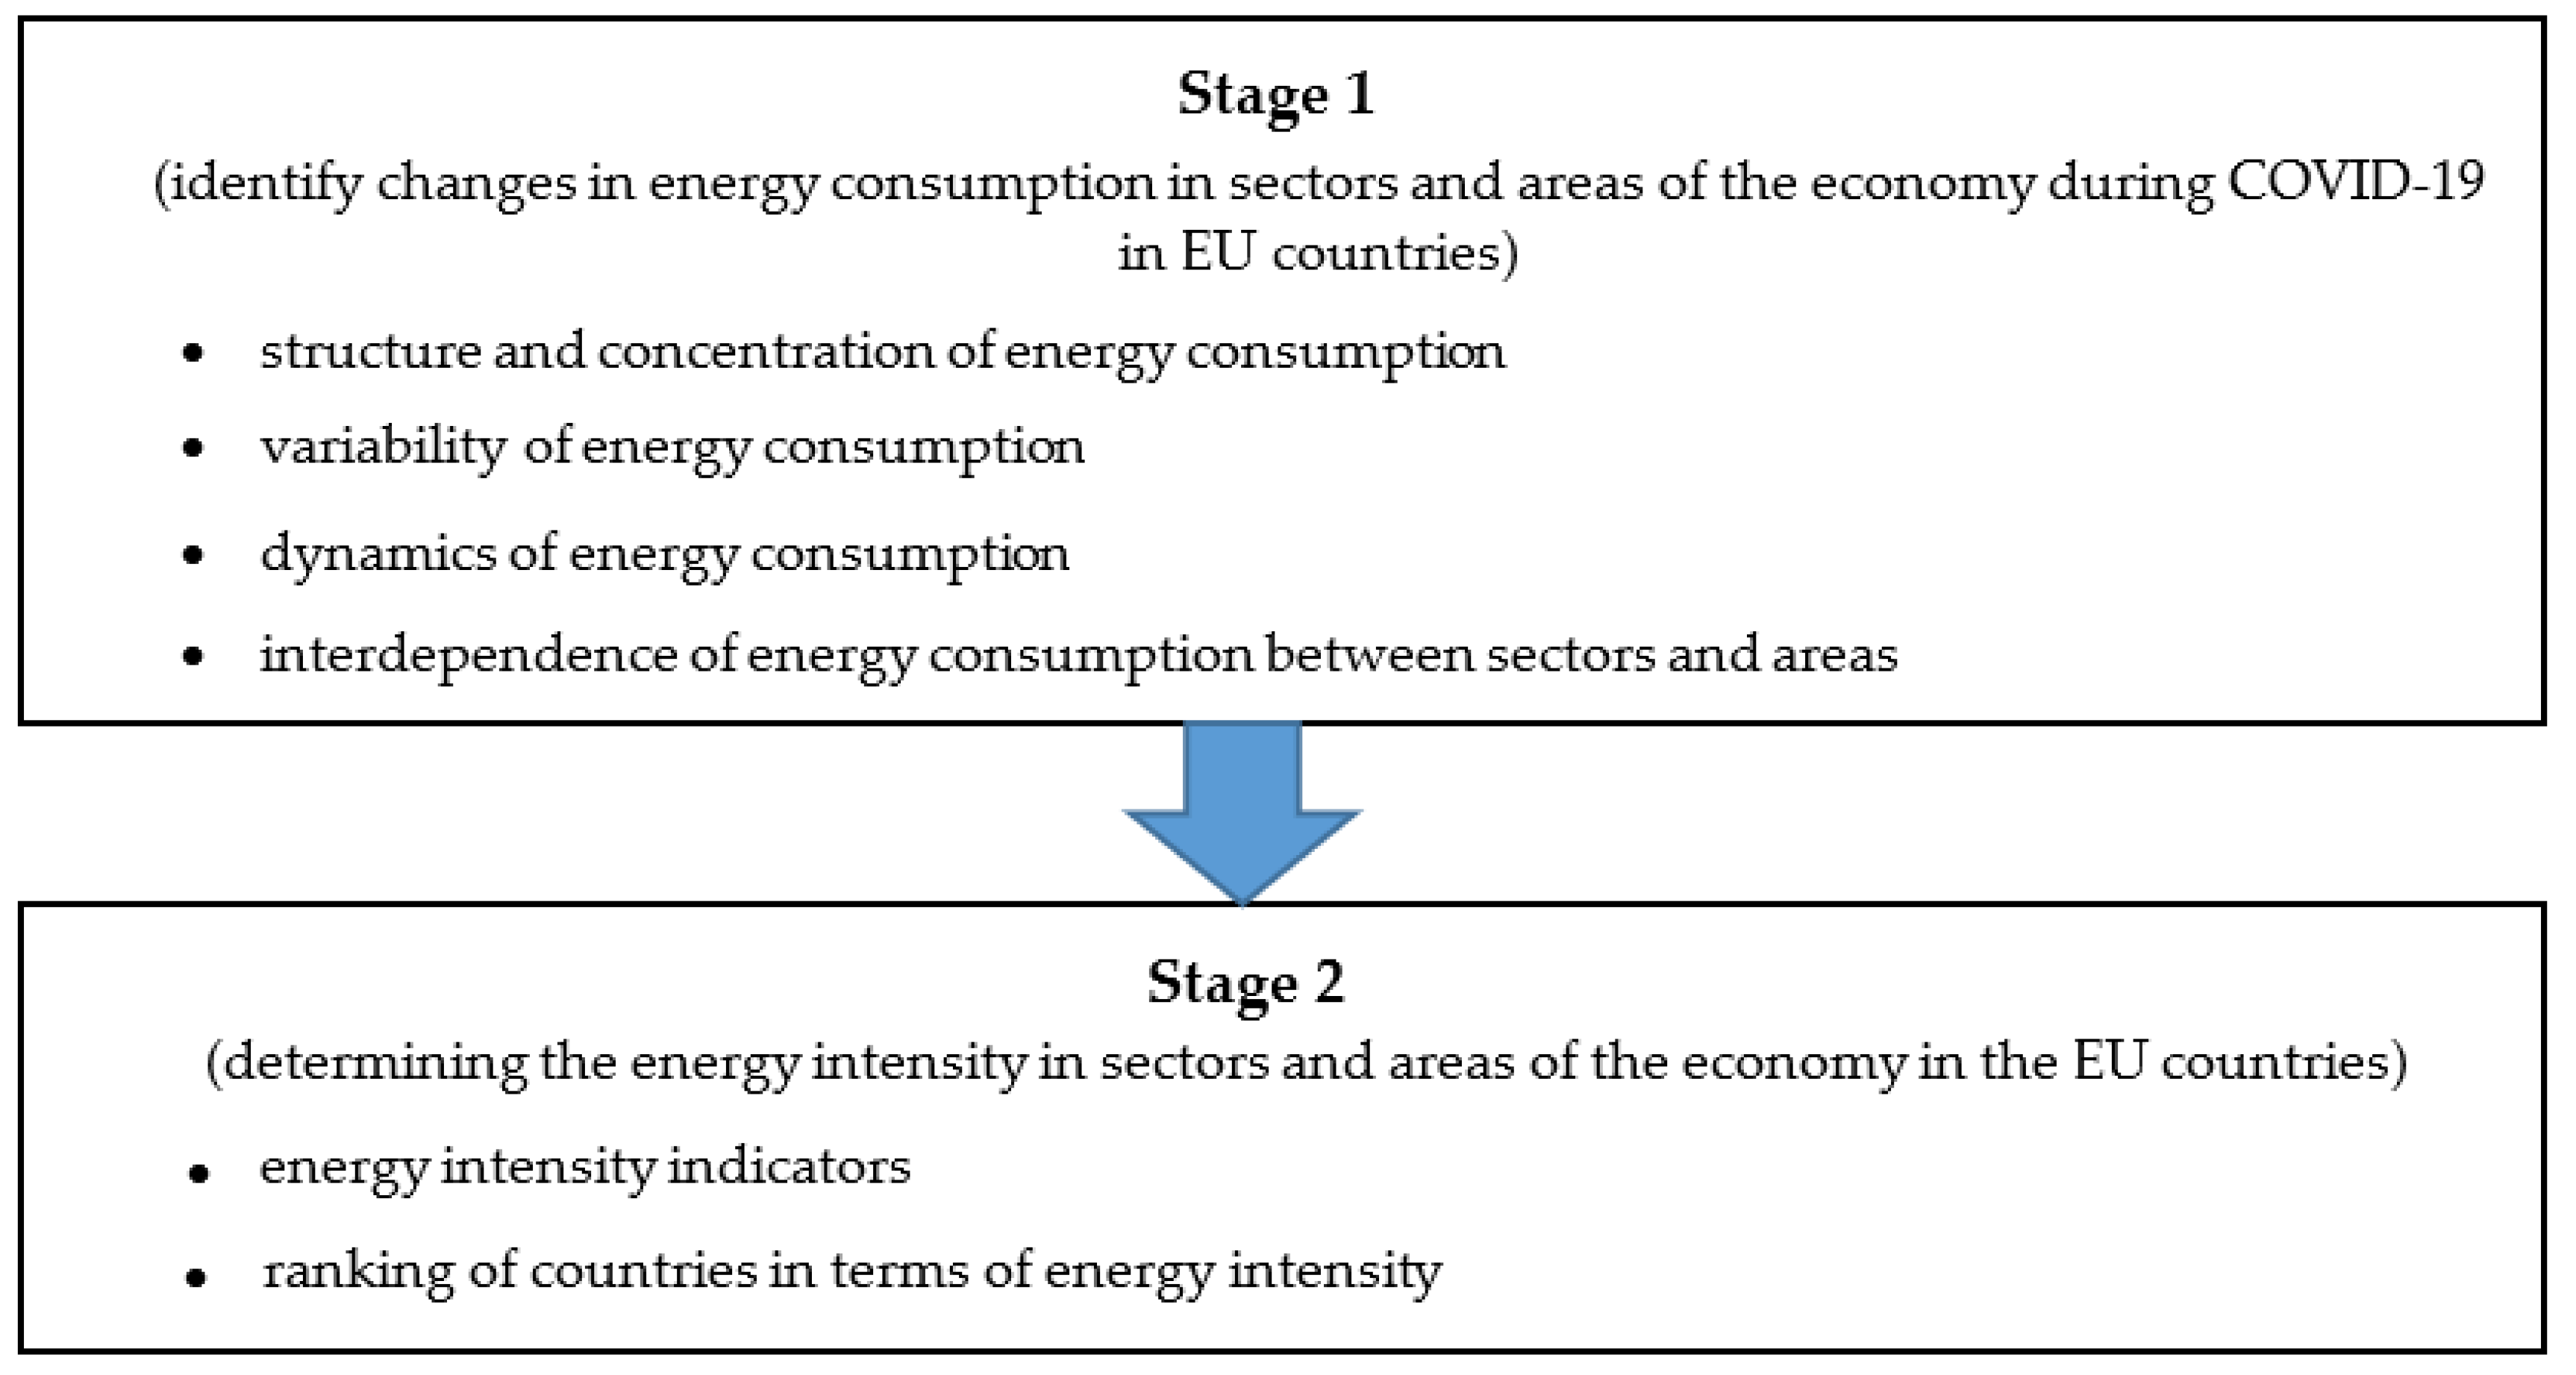
2. Materials and Methods

2.1. Data Collection, Processing, and Limitations

Using a purposive sampling method, all 27 EU Member States were selected for the study as of 31 December 2020. The UK was a member of the EU until 31 January 2020. In addition, in 2020, detailed statistical data on this country were no longer collected by Eurostat. It was, therefore, decided not to include this country in the analyses.
The study period covered 2005–2020, particularly 2019 and 2020. The adoption of such a period is justified on the merits. In May 2004, there was an extensive enlargement of the EU with ten new countries. The year 2005 was the first full year in the enlarged membership. Bulgaria and Romania joined in 2007, and Croatia in 2013. By 2019, changes in energy consumption and energy intensity due to the normal functioning of the economy can be observed. In 2020, there was an economic crisis caused by the COVID-19 pandemic. The European continent was quite severely affected by the pandemic.
The literature on the subject and statistical data available in the Eurostat database were used for research purposes. Some limitations were the datasets available and their detail. We could not analyse individual industries in detail, so we focused on sectors and areas of activity. Additionally, the 2021 data had not yet been published; the most recent data were for 2020, which was the first year of the pandemic, and, according to various analyses, this was when the most significant changes in energy consumption occurred. By 2021, businesses and society had already adapted to some extent to the new reality and were able to react accordingly. Therefore, the lack of data from 2021 will not distort the analysis results.

2.2. Applied Methods

The research was divided into stages. Figure 1 shows a diagram of the conducted research.
The research conducted was divided into two stages. In the first stage, the collected data were statistically analysed using selected indicators of structure, measures of location and variability, as well as selected measures of dynamics and correlation. Descriptive methods (tabular and graphical) were also used in this stage.
The complete picture of the structure of the surveyed community is provided by the absolute number of a given part of the community. The easiest way to present the structure of a community is the structure indicators (frequency, relative numbers) expressing the share of a part of the community (ni) in the whole community (∑ni). This measure assumes values from 0 to 1, and the sum of all indicators for the whole population is 1. Sometimes it is useful to know how many statistical units have a value that does not exceed the assumed level of the indicator, e.g., 50%. Then we determine the cumulative structure indicators by summing up the indicators for the following parts of the community. For some variables, information on the degree of concentration and the evenness of the variable distribution among the individuals making up the collective may be equally valuable. One widely accepted measure of this kind is the Gini coefficient, which can be calculated using the following formula [62]:
G = i = 1 n ( 2 i n 1 ) x i n 2 x ¯
where: n—the size of the population; xi—the value of the variable for the i-th statistical unit; x—arithmetic mean of the variable in the whole population.
Statistical data analysis aims to obtain a synthetic representation of the results of a study using appropriate numerical characteristics (statistical parameters). The following groups of parameters are most commonly used in the analysis of community structure:
  • Measures of position;
  • Measures of dispersion (variability, dispersion);
  • Measures of asymmetry.
The classic measures of the position include the arithmetic mean. For a detailed series, it is defined as the sum of the elements of the series divided by its size. The arithmetic mean is a good measure of the average characteristic level in the studied population only concerning a population with a low degree of variation. It is also sensitive to extreme observations. The lower the variation of a series, the higher the cognitive value of the average. Therefore, when interpreting it, it is necessary to know the level of variation in the data. Of the several measures available, the best is the variance and the root of the variance, i.e., the standard deviation. The variance for a detailed series is calculated from the formula [63]:
σ 2 = 1 n i = 1 n ( x i x ¯ ) 2
It is convenient to assess the degree of variation, especially when comparing two or more communities, using the coefficient of variation, which is the quotient of the arithmetic mean and the standard deviation. Coefficients of variation are useful when comparing several communities from the point of view of one characteristic or one community from the point of view of several characteristics. Large values of the coefficient of variation indicate a high degree of variation in the population concerning the characteristic under study.
Another type of analysis is the search for relationships between characteristics. Most often, we are interested in examining a community for two characteristics. If both are measurable, then the recommended way to assess the relationship is Pearson’s linear correlation coefficient. For two detailed series, x and y, this coefficient is given by the formula [64]:
r x y = i = 1 n ( x i x ¯ ) ( y i y ¯ ) i = 1 n ( x i x ¯ ) 2 i = 1 n ( y i y ¯ ) 2
Values of Pearson’s linear correlation coefficient range from 〈−1,1〉. The greater the absolute value of rxy, the stronger the relationship between the characteristics.
In the study presented in this article, we consider changes in the phenomena of interest over time. Statistics offers a group of measures used to analyse time series dynamics. The individual dynamics indices are the most popular in terms of occurrence. Like all other measures of this kind, they fall into two groups:
  • Fixed base (single base) indices;
  • Indexes with a movable base (chain).
Univariate dynamics measures are used to determine changes in the level of a phenomenon that has occurred in successive periods compared to the level of that phenomenon in the period adopted as the base (baseline) period. The single-basis dynamic index is calculated from the formula [65]:
i t / k = y t y k .  
where: yt—the magnitude of the phenomenon in the study period; yk—the magnitude of the phenomenon in the baseline period.
Chain measures of dynamics are used to assess the changes that have occurred in the level of a phenomenon in a given period compared to the previous period. The dynamic chain index is calculated from the formula [65]:
i t / t 1 = y t y t 1
Dynamics indices determine the ratio of the magnitude of the phenomenon under study in two different periods. They are unmeasured quantities. For interpretation, they are multiplied by 100 and expressed as a percentage. An index value less than 1 (100%) indicates a decrease in the level of the phenomenon, while a value greater than 1 (100%) indicates an increase.
Stage two focuses on the construction of rankings of EU Member States in terms of energy intensity in individual economic sectors based on purpose-built evaluation criteria, which have been given estimated weighting values.
In the second phase of the research conducted, a multi-criteria analysis of the EU countries was carried out based on four constructed evaluation criteria: K1–K4. These criteria expressed the ratio of final energy consumption to gross value added in a given sector: industry (K1); agriculture, forestry and fisheries (K2); services (K3); and transport (K4). The selection of the above criteria was inspired by the work of Graczyk [66], in which the author presents a set of indicators for sustainable energy development in three dimensions: social, economic and environmental, and one of the economic indicators for energy consumption is the energy intensity index.
In multi-criteria analyses, criteria are given weights to express their importance. These can be adopted arbitrarily using, for example, expert judgements or determined in a more objective way using specific numerical procedures. One method of determining objective weights is based on entropy, the so-called Shannon entropy method. Entropy determines the degree of disorder in a set. It allows the significance of individual criteria to be determined from the divergence of the values of each criterion. The Shannon method consists of several steps described in detail by Kobryn [67].
The result of the study is the construction of a ranking of EU countries based on the adopted evaluation criteria. Using the Shannon entropy method, the weights of the individual criteria were determined at the following levels: K1-40%, K2-32%, K3-18%, K4-10%. Rankings were made and then compared among themselves for the years: 2005, 2010, 2015, 2019 and 2020.
Decision support methods can be divided into single-criteria and multi-criteria. Often the very nature of the decision problem results in its multi-criteria nature. This is the case when decision-making requires the consideration of at least several decision options, each of which is influenced by a number of factors that determine its acceptability. Among the multi-criteria decision-making methods, there are mainly two basic groups of them [67]:
  • Methods based on the utility function;
  • Methods based on superiority relationships.
Utility function-based methods involve a “general to specific” approach. It consists of considering individual decision options (offers, operators etc.) separately from the point of view of each criterion and then aggregating the information thus obtained into a single whole, which may be a specific synthetic indicator (or function). The latter is based on superiority relationships. In contrast to the first, it implements a ‘bottom-up’ approach. We construct an overall superiority relationship between objects based on partial relationships (constructed for each criterion separately). The representative of this group of methods is the POMETHEE II algorithm (Preference Ranking Organisation Method for Enrichment Evaluations) [68]. The M objects analysed using K evaluation criteria can be presented in the following few steps.
Step 1
The objects must be compared in pairs for each criterion separately, which amounts to counting the following differences:
d k ( O [ i ] , O [ j ] ) = O [ i ] k O [ j ] k ,
where O [ i ] k , O [ j ] k denote the ratings of options i and j for criterion k (i,j = 1, …, M; k = 1, …, K).
Step 2
Based on the calculated differences in step 1, so-called pairwise object comparison preferences are created according to a given criterion. This boils down to applying one of the preference functions, the values of which are in the interval [0,1]. The preferences for stimulants and destimulants are given the forms respectively:
P k ( O [ i ] , O [ j ] ) = F k { d k ( O [ i ] , O [ j ] ) } ,
Each preference function has the important property that if Pk (O[i], O[j]) > 0 then Pk (O[j], O[i]) = 0.
Step 3
When all criteria are considered, calculate aggregated preference indices for each pair of objects O[i] and O[j]. This procedure is performed using the formulas:
Π ( O [ i ] , O [ j ] ) = k = 1 K w k P k ( O [ i ] , O [ j ] ) ,
Π ( O [ j ] , O [ i ] ) = k = 1 K w k P k ( O [ j ] , O [ i ] ) ,
This index indicates the extent to which, overall, in terms of all criteria, object O[i] is preferred over object O[j] or object O[j] over object O[i].
Step 4
Calculation of preference flows for each object. First, calculations of positive flowsΦ+ (O[i]) and negative flowsΦ (O[i]) are made:
Φ + ( O [ i ] ) = 1 m 1 O [ i ] O Π ( O [ i ] , O [ j ] ) ,
Φ ( O [ i ] ) = 1 m 1 O [ i ] O Π ( O [ j ] , O [ i ] ) ,
Positive preference flow should be interpreted as the degree to which object O[i] is superior to all other objects, while negative flow tells to what extent object O[i] is superior to all other objects.
Step 5
Calculation of net preference flows Φ (O[i]) according to the formula:
Φ ( O [ i ] ) = Φ + ( O [ i ] ) Φ ( O [ i ] ) ,
The values of the net preference flows of the offers are in the range [−1,1], and their sum is 0. Based on the net preference values, the final ranking of the sites can be constructed by arranging them in descending order of the indicator’s value.
In the PROMETHEE II algorithm presented here, step 2 is particularly noteworthy, in which a preference calculation has to be performed using appropriate top-down functions. Of the proposed functions, the Gaussian function was used, which is expressed by the formula:
P k ( O [ i ] , O [ j ] ) = 1 e x p ( d k ( O [ i ] , O [ j ] ) 2 2 σ 2 ) ,
where σ2 denotes the variance of the scores for the k-th criterion.
The Gaussian function has quite a few advantages over the other functions in the PROMETHEE II method. The preference index reacts approximately linearly for medium values of the preference function, rendering almost proportional relationships for different pairs of objects. In contrast, the preference indexes are close to each other within very large values of the preference function. The same is true for minimal differences—here, the preference indices are close to each other.
Having at our disposal a series of rankings created, for example, for successive periods, we can check whether the distributions of positions obtained by the objects can be considered similar from a statistical point of view. Two rankings are compared simultaneously. For this purpose, we used the Wilcoxon rank-sum test (also called the Wilcoxon paired rank test) [69]. This test is a non-parametric alternative to the paired observation t-test, but unlike it, it does not require the assumption of the normality of the distribution of observation differences to be met. It takes into account not only the sign of the paired observations but also the magnitude of the difference between them and, more precisely, the ranks of these differences. In our case, acceptance of the hypothesis being verified will mean that the rank distributions for the relevant years do not differ and that the differences in positions occupied by countries are not statistically significant. Thus, the hypothesis on the effect of changes in preferences for particular criteria on the position of countries in the ranking is also verified.

3. Results

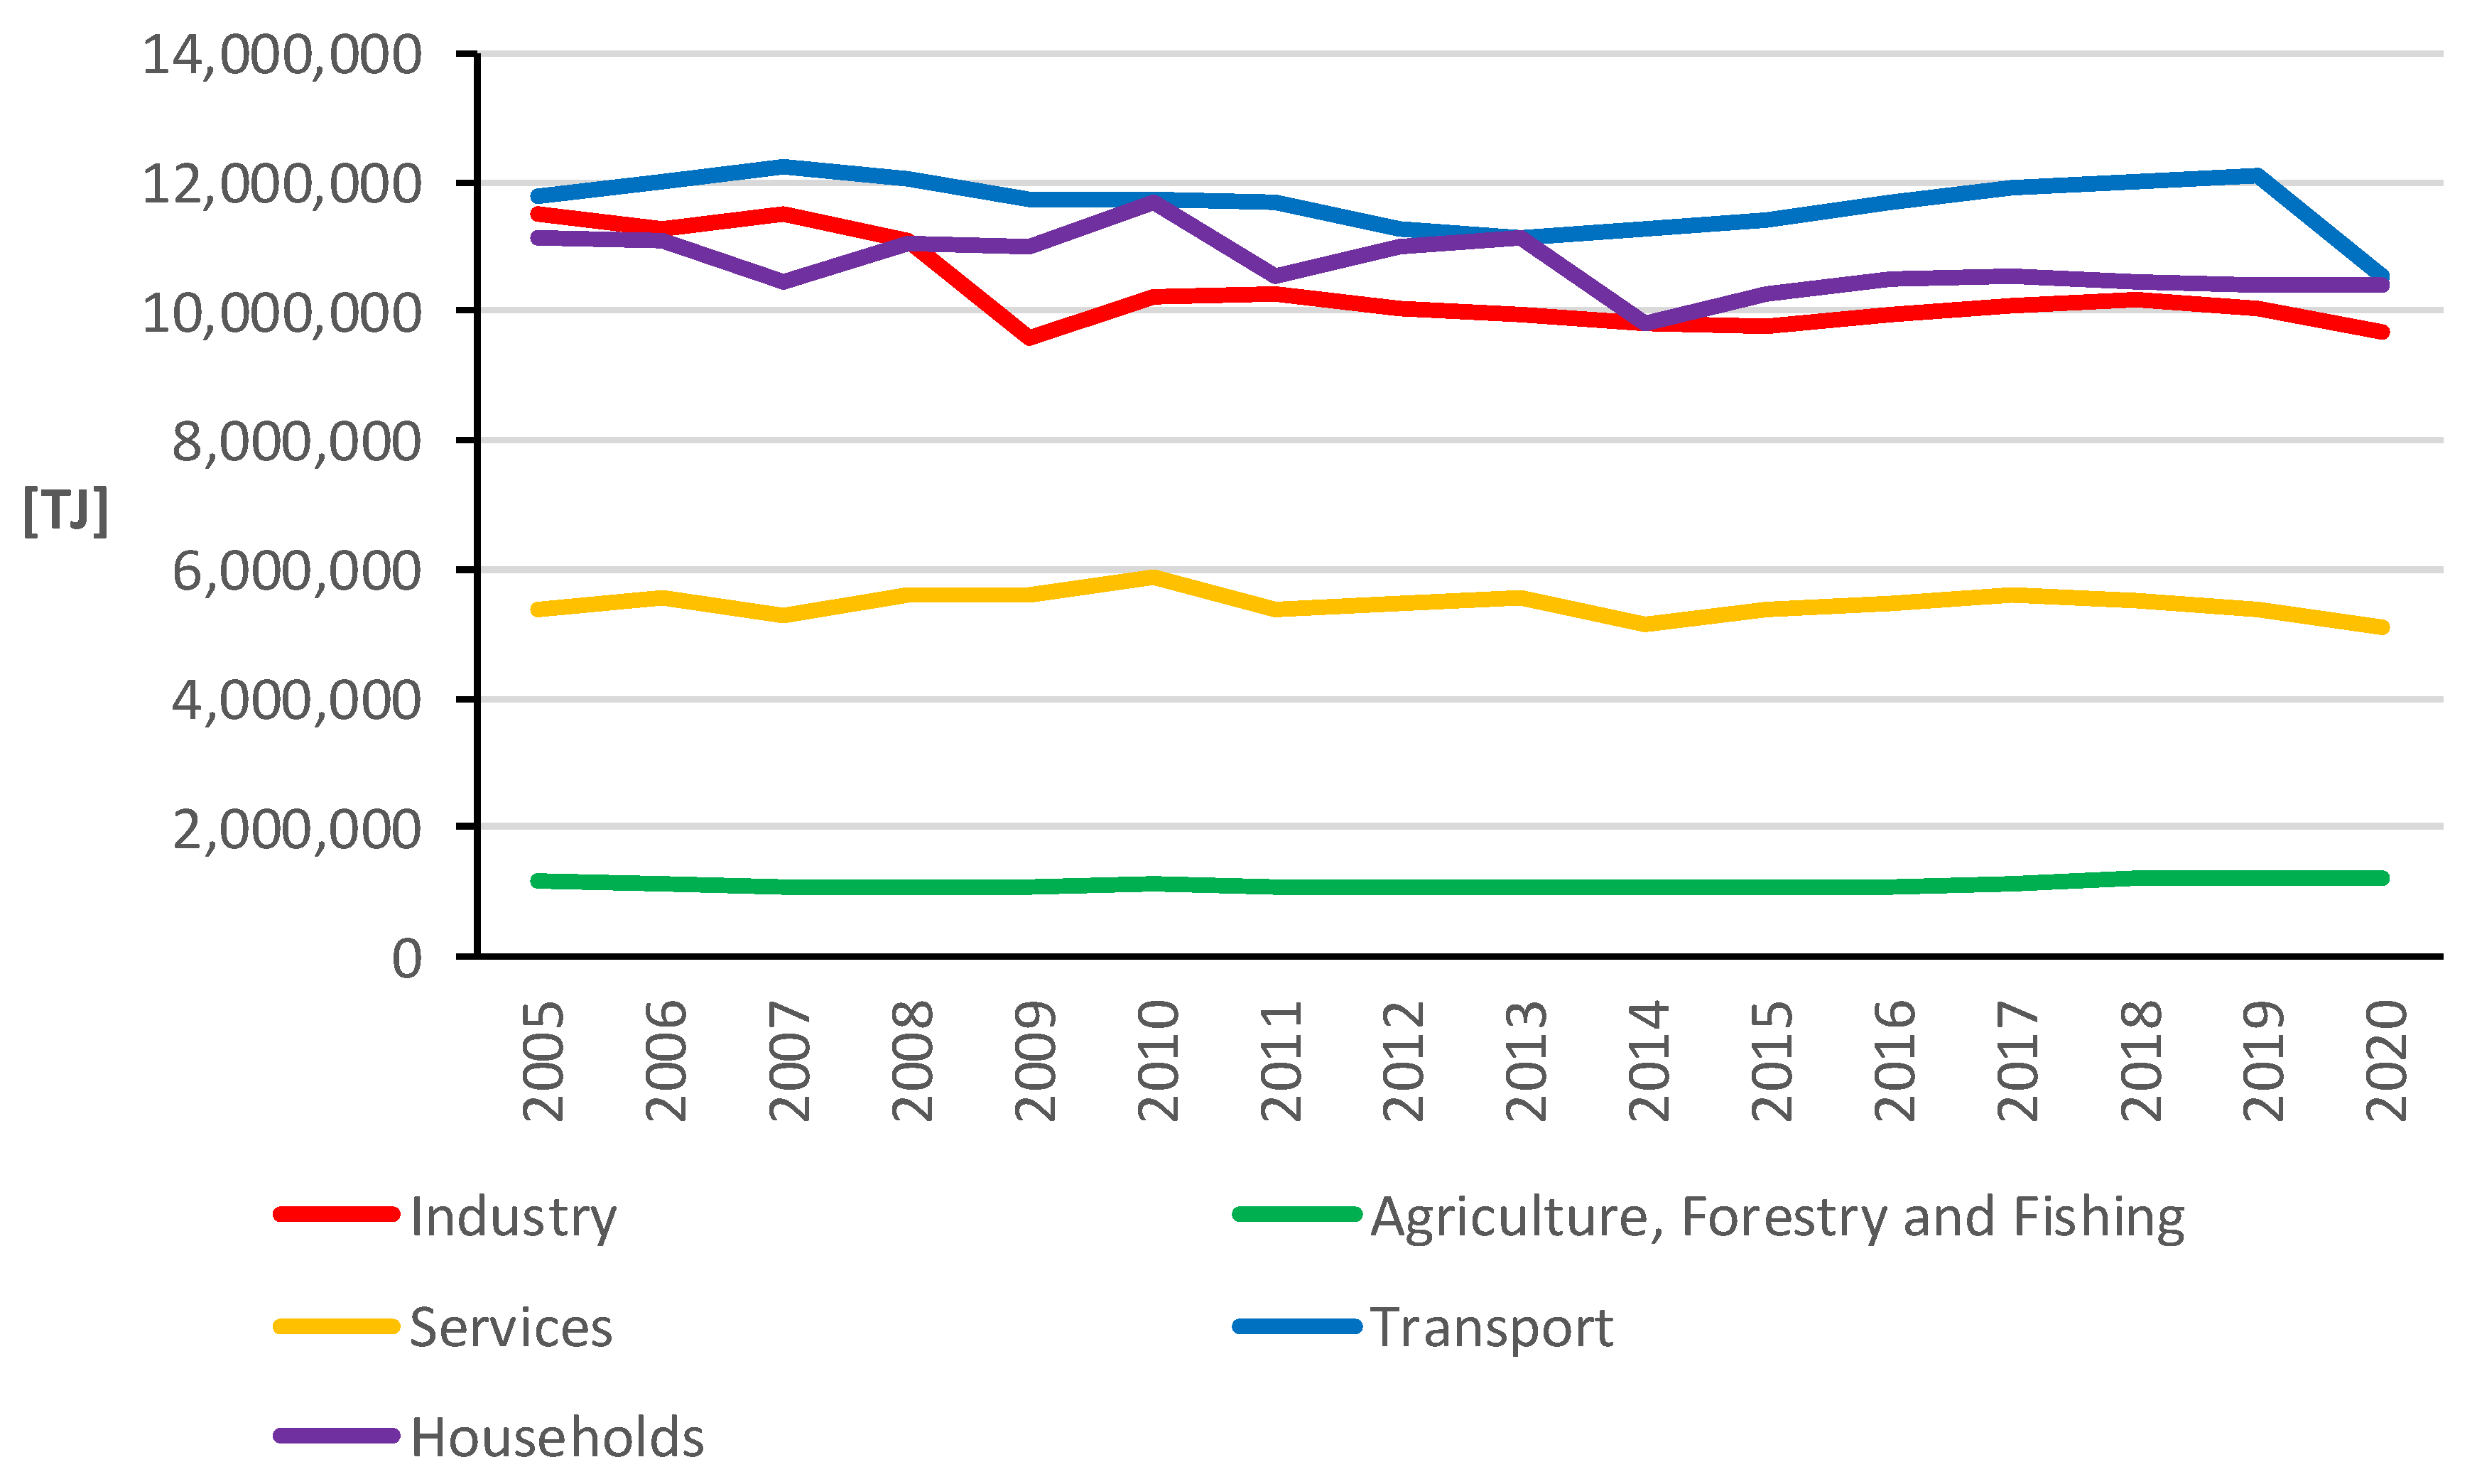
3.1. Structure and Concentration of Energy Consumption in EU Countries by Sector and Area

A general decline can be observed when total final energy consumption between 2005 and 2020. In 2019, it was 5.2%, to reach a value of 12.9% in 2020, an increase in the rate of decline in energy consumption in one year of 7.7 percentage points. Looking at energy consumption by sector, it can be seen that only the agriculture, forestry and fisheries sectors recorded a slight increase of 3.1%, while the other sectors were characterised by a decrease in this figure (Figure 2). The industrial sector (16.0%) experienced the most significant decrease over the period under review, followed by the transport sector (10.5%), households (6.8%) and the services sector (5.1%). In addition, it should be noted that there was a clear reduction in final energy consumption in the transport sector in the last year of the period under review, which directly translated into a decrease over the entire period analysed, despite small but systematic increases between 2011 and 2019.
Figure 3 shows the structure of each EU country’s final energy consumption by economic sector in 2020. The transport, industry and household sectors had the highest levels of final energy consumption in the EU countries. In contrast, the agriculture, forestry and fisheries sectors had the lowest and most stable levels.
On average, the industrial, transport and household sectors accounted for around 80% of total energy consumption in the respective economies in 2020. In the industrial sector, the largest share occurred for Finland (44.2%), while the smallest share occurred for Malta (11.7%). In the transport sector, on the other hand, the highest share of energy consumption was found in Luxembourg (51.1%) and the lowest in Finland (16.7%). When analysing the household sector, the highest share of energy consumption is found in Croatia and Estonia (35.4% and 34.6%, respectively), while the lowest is in Luxembourg (15.2%).
In the next step of analysing the structure of final energy consumption in individual sectors, calculations were made relating to the degree of concentration and the evenness of its distribution among the Community countries. The results of the calculations, in the form of estimated Gini coefficients, are summarised in Table 1. The blue colour indicates the highest index results in a given sector, while the red colour indicates the lowest.
It should be noted that the values of the Gini coefficients for the selected years did not differ significantly across the different economic sectors. Their values exceed 0.6, which indicates a moderately high concentration of energy consumption in five of the 27 EU countries, which include: Germany, France, Italy, Spain and Poland. Moreover, the stability of this coefficient in individual sectors over the period under study is also apparent, which means that the level of concentration of final energy consumption in the EU countries has been maintained.

3.2. Variability of Energy Consumption in EU Countries by Sector and Area

Between 2005 and 2020, the final energy consumption variation coefficients were calculated for each country by selected economic sectors (Table 2). The three highest coefficient scores in each sector are marked in blue font and the three lowest in red font.
The average observed variability in the industrial sector over the period under study was 10.5%, with the highest variability recorded in Greece (19.06%), Hungary (18.39%) and Estonia (18.08%). Only Hungary experienced an increase in energy consumption over the period under review, while the other two countries had high variability due to significant decreases in energy consumption. In contrast, the lowest coefficient of variation occurred in Austria (2.07%). Significantly greater differences in the maximum values of the measure under study can be seen in the agriculture, forestry and fisheries sector. Here, the highest variability can be observed in Germany (76.5%) and Greece (61.2%), while the lowest variability is in France (1.8%). In Germany, energy consumption in agriculture increased through greater mechanisation of work and a reduction in human labour. In Greece, on the other hand, there was a decrease in energy consumption for agriculture. The other sectors: services, transport and households, are characterised by similar average variations in final energy consumption over the sixteen years studied of less than 10% and are respectively: 8.2%, 7.9%, and 6.5%. In the tertiary and household sectors, the highest variability was observed in Malta (22.1% and 15.6%, respectively), while in the transport sector, it was in Poland (17.5%). Poland is an example of a country that dominated the EU road freight transport market after accession. This country achieved a market share of around 25%, associated with increased fuel consumption. Most services were provided domestically, but there was also a significant share of international transport services. In this case, services are also provided to transport in other countries, often on their territories. In this way, Poland’s transport sector carries out work previously carried out by domestic carriers, which also involves the transfer of energy consumption to other countries. This situation also occurs in other sectors, especially in industry. Production of components and even assembly are outsourced to other countries, even continents, e.g., China or India. Consequences resulted in the transfer of energy consumption to these countries. The final products are already offered in European markets. As a result, energy consumption is reduced, and energy efficiency is increased. At the same time, countries can demonstrate a reduction in environmental emissions. Assessing the energy consumption of EU countries in general by sector from 2005 to 2020, one is tempted to conclude that—except for Germany and Greece—consumption was characterised by relative stability in the sectors of agriculture, forestry and fisheries.

3.3. Energy Consumption Dynamics in EU Countries by Sector and Area before and during the COVID-19 Pandemic

The next step of the analysis was to examine the dynamics of final energy consumption by sector and area in the EU countries in 2019 and 2020. The calculated chain indices for 2019 and 2020 are shown in Table 3. The three countries with the highest energy consumption growth dynamics in a given sector and area are shown in blue, while the three countries with the lowest dynamics are shown in red. When observing the change in final energy consumption in 2020 compared to the previous year in the industrial sector, it can be seen that in 21 countries, this consumption decreased, with the most significant decreases observed for Slovakia (9.40%), Spain (8.73%) and Lithuania (8.03%). The remaining countries showed an increase, with the largest increases for Cyprus (7%) and Sweden (6.16%). In the agriculture, forestry and fisheries sectors, on the other hand, in the first year of the COVID-19 pandemic, more than half of the EU countries recorded an increase in final energy consumption, including Malta (6.07%), Portugal (5.68%) and Croatia (5.27%). Furthermore, the largest decrease compared to 2019 of 10.62% was seen in Belgium; in this case, a significant change could be experienced compared to the period from 2019 to 2018 (12.84%). In 2020, almost in all EU countries, in the case of the tertiary sector’s final energy consumption, there was a decrease (except for Estonia and Ireland, where consumption was at a similar level to 2019). Bulgaria (14.83%) and Cyprus (14.77%) are the countries with the largest decreases in consumption in service activities. The transport services sector proved to be the most vulnerable to the COVID-19 pandemic. All EU countries recorded decreases in final energy consumption, with the largest decreases in Luxembourg (22.5%), Spain (21.60%), and Italy (19.20%). It is worth noting that in 16 European countries, the decrease was 10% or more. Finally, the last sector analysed, households, was also not unaffected by the COVID-19 pandemic in terms of final energy consumption. As many as 18 countries out of 27 recorded an increase in consumption, with eight countries in 2019. The most significant increases in household energy consumption were recorded in Bulgaria (10.17%), Ireland (8.49%) and Luxembourg (7.41%). However, on the other hand, similar decreases in energy consumption should also be noted in Latvia and Finland at 6.11% and 6.07%, respectively. In summary, it can be concluded that the pandemic significantly impacted changes in energy consumption, but these varied across sectors and areas. The most considerable reductions in energy consumption occurred in the transport and services sectors and smaller reductions in the industry. The pandemic caused periodic closures of particular industries, especially those requiring personal contacts, such as catering, hospitality services and many others. On the other hand, transport depended on demand for materials and products, which was reduced overall in the pandemic. There was an even greater reduction in passenger transport. Air transport was closed. It is also important to note that restrictions on social contact resulted in the introduction of remote working and remote learning, which partially caused household energy consumption to increase. In addition, it must be stated that there were differences between countries in the scale of changes in energy consumption. One of the most important reasons for this may have been the different types of restrictions introduced by individual countries. The pandemic also had its waves distributed differently from country to country. Undoubtedly, the pandemic was a factor in the changes in energy consumption in particular sectors and areas.

3.4. Interdependence of Energy Consumption in EU Countries between Sectors and Areas

The final step in the statistical analysis of final energy consumption by sector and area in the EU countries was to examine the correlation of energy consumption between the sectors and areas. What was examined was not the levels of energy consumption in a given year but the differences in energy consumption between 2019 and 2020. For this purpose, the Pearson linear correlation coefficient discussed earlier was used, and its results for individual pairs of sectors and areas are summarised in Table 4.
The values in Table 4 show how an increase in the difference in energy consumption in one sector is responded to by the difference in energy consumption in another. The weakest correlation is observed for the household sector. Only for the tertiary sector a clear correlation can be observed. In this case, an increase in the difference in energy consumption in households causes an increase in the difference in energy consumption in services. For the other sectors, the correlation is very weak. It is worth noting that the correlation coefficients between industry, agriculture, services and transport assumed high values, which means that changes in the energy consumption gap in one of these sectors are strongly associated with changes in the gap in the other sectors and vice versa. Therefore, this means that energy consumption in households changed differently than in the economic sectors. Mostly, it increased due to spending a lot of time at home (remote working, remote learning, isolation and quarantines). Noteworthy is the very high correlation coefficient, close to 1, between the transport and services sectors and slightly lower between the transport and industry sectors. These sectors are closely linked in terms of demand. Increases in demand in the goods and services sectors drive demand for transport. In turn, falls in demand in these sectors also reduce demand for transport.
Most of the coefficients were positive, i.e., the directions of the differences in energy consumption in the European countries are the same. Excluding the area of households—due to the low value of the coefficient, there is a negative correlation on three occasions. The highest occurred in agriculture, forestry, fishing and industry sectors. In this case, the negative sign of the coefficient means that an increase in the difference in energy consumption in one sector causes a decrease in the difference in consumption in the other. The inverse relationship is also true. As we have already shown in the case of the dynamics indices, we have generally seen decreases in energy consumption in all sectors except agriculture in 2020 compared to 2019. Hence the resulting negative linear correlation of this sector with the others.

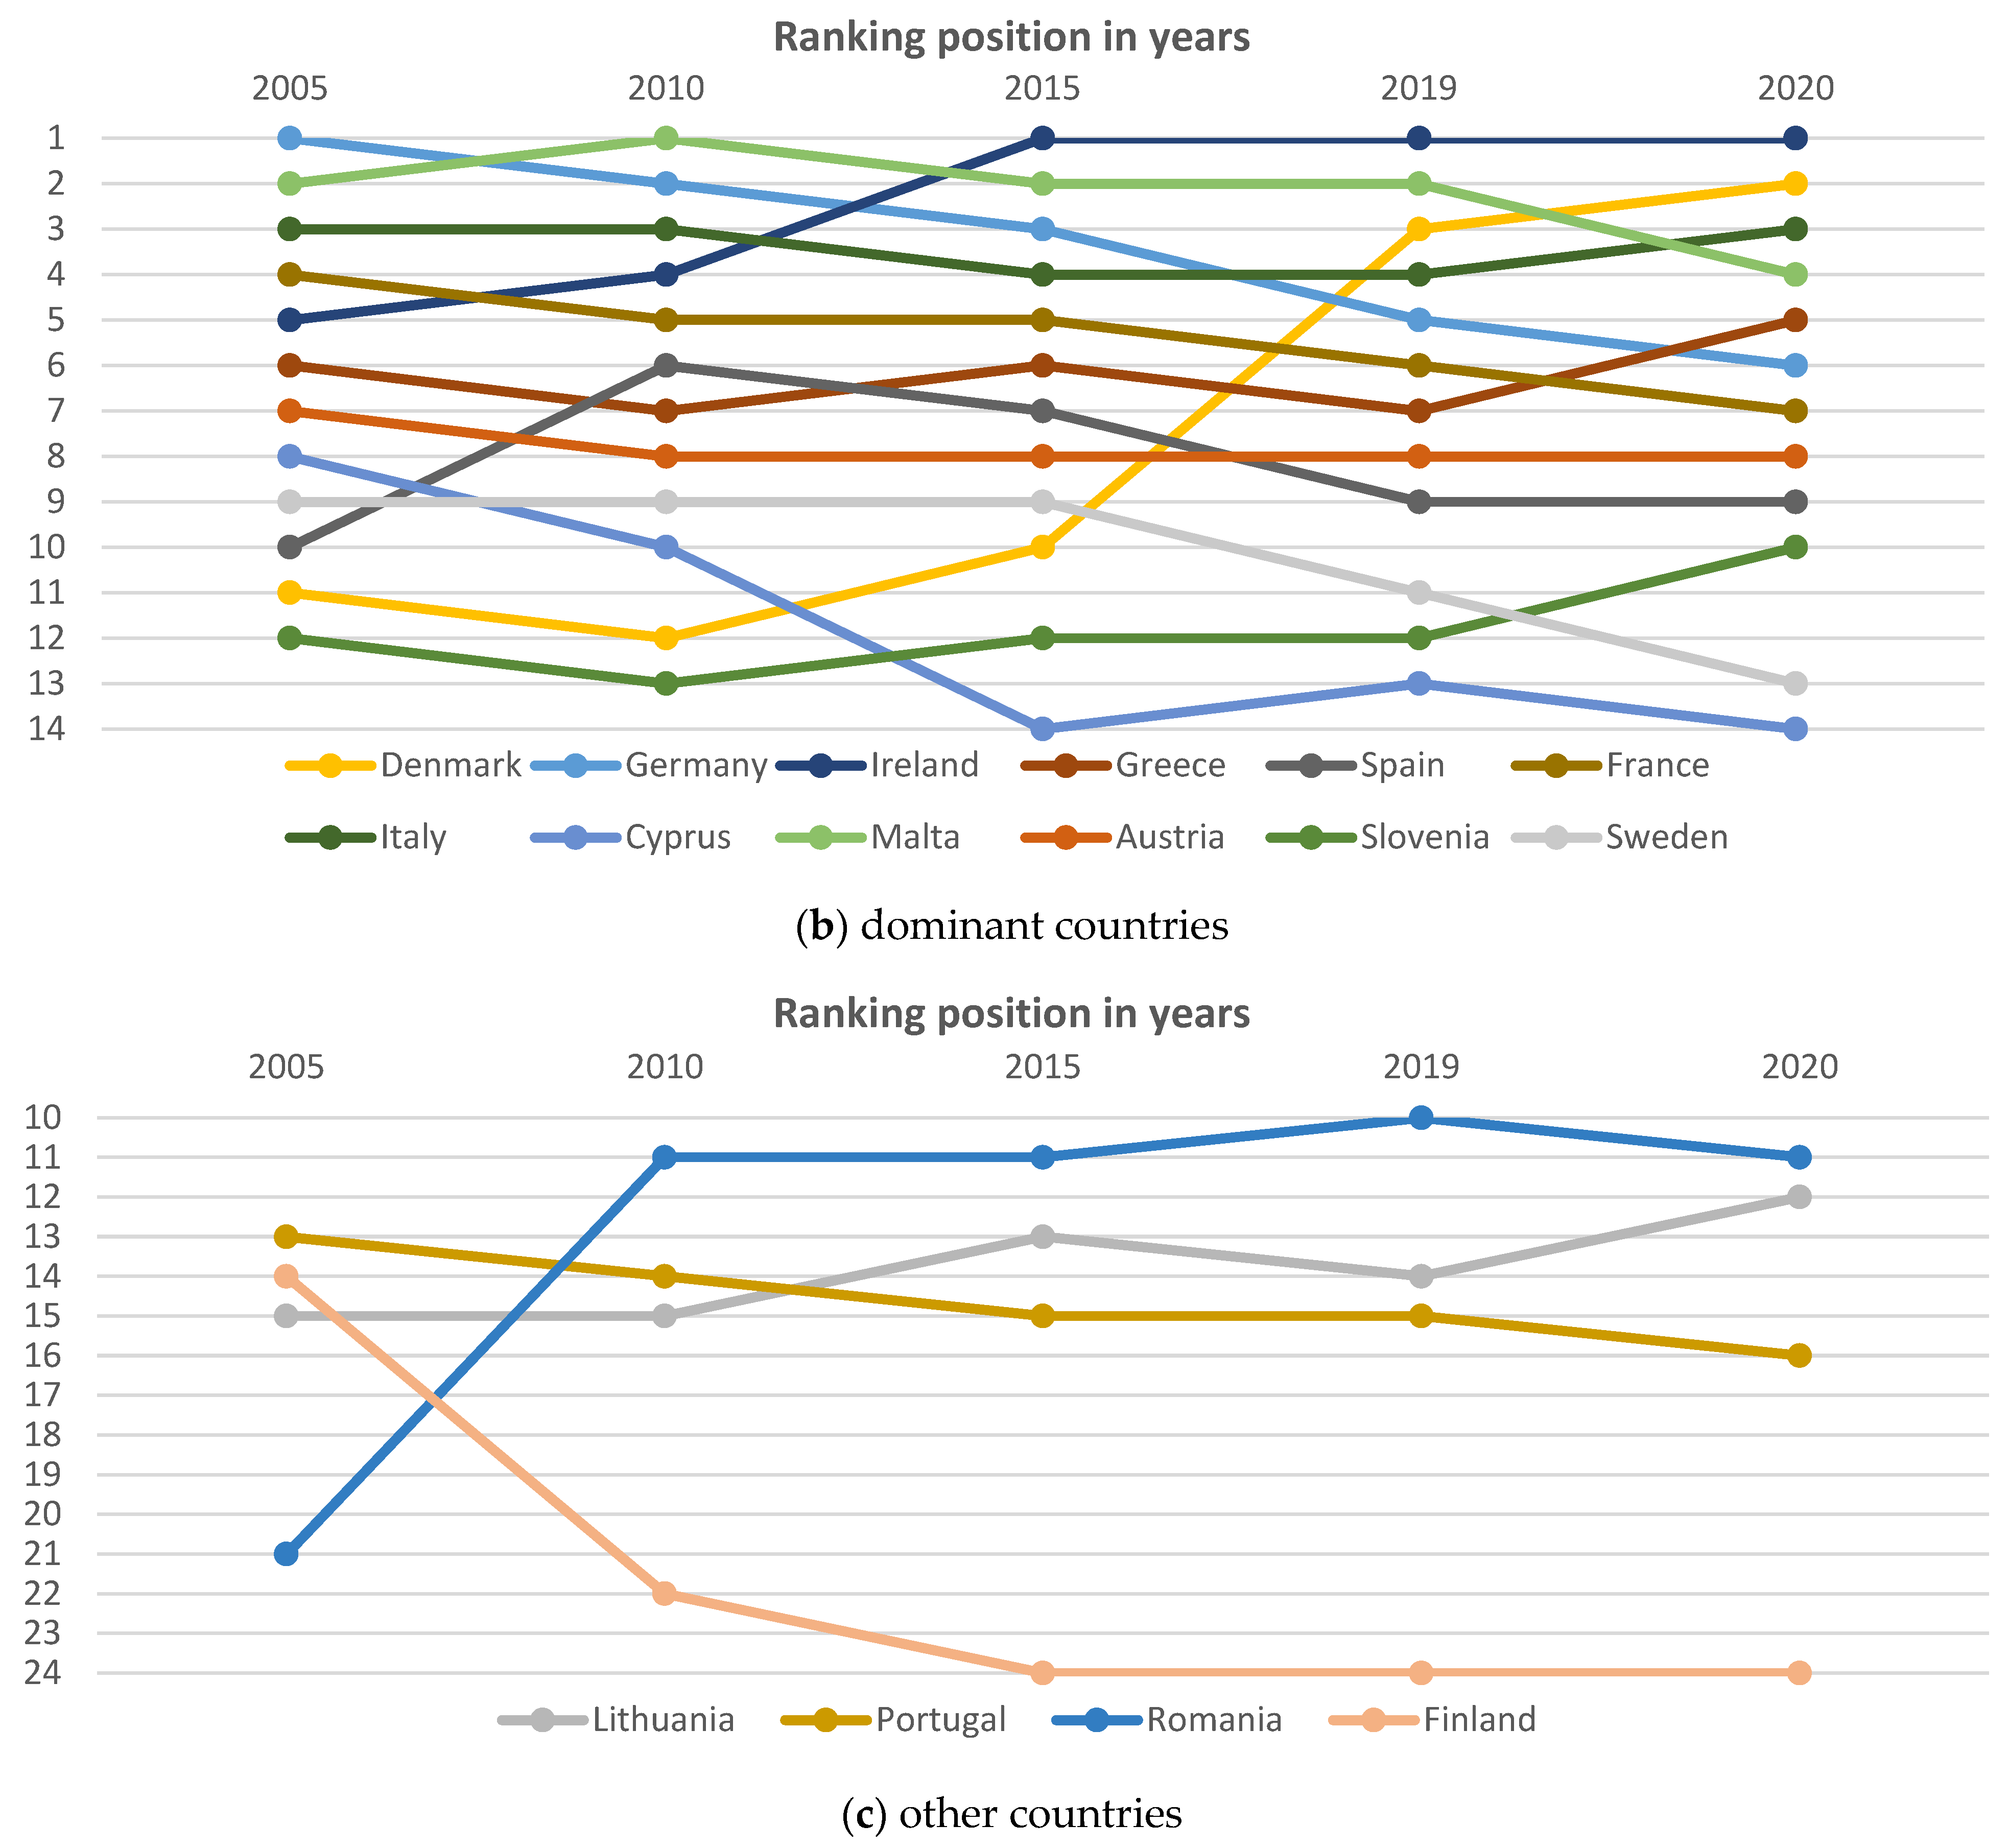
3.5. Energy Intensity in EU Countries by Sector before and during the COVID-19 Pandemic

The second phase of the study was devoted to analysing energy intensity in the economic sector. To this end, energy intensity indices were first calculated for the industrial (K1), agricultural, forestry and fishing (K2), services (K3) and transport (K4) sectors as a ratio of final energy consumption to gross value added in the respective sector. These indicators were the criteria for a multi-criteria assessment of EU Member States. Their calculated magnitudes, which were then used to build the rankings, are presented in Table 5. The three best performers in each year and sector are shown in blue, while the three worst performers are similarly shown in red. Looking at the average energy intensity in the EU-27, it can be seen that it was systematically lower. Only in 2020 did this positive trend stop, and energy intensity slightly deteriorated in all sectors.
With the assumptions above, for the selected years: 2005, 2010, 2015, 2019 and 2020, rankings were constructed using the PROMETHEE II method. The weights of the individual criteria, calculated according to Shannon’s entropy method, were taken at levels of respectively: K1-40%, K2-32%, K3-18% and K4-10%. Each criterion is a destimulant.
Table 6 summarises the results obtained, presenting the ranking position of a given country and the obtained value of the index of net preference flows Φ. The value of the index Φ allows not only to rank the countries (thus constructing the ranking) but also to indicate the group of dominant (positive Φ) and dominated (negative Φ, marked with grey background) countries in the constructed ranking.
From the rankings obtained for the selected years 2005–2020, it can be deduced that Ireland had the lowest energy intensity, achieving position one in 2015, 2019 and 2020. Germany and Malta also achieved position one in 2005 and 2010, respectively. The former country had low energy intensity compared to the other EU countries in 2005, 2010 and 2015. On the other hand, Malta was at the top of the surveyed countries in all years. What was also noteworthy during the period under study was Italy, which ranked highly in third or fourth place in all rankings. Furthermore, Denmark had relatively low energy intensity in 2019 and 2020.
In addition, analysing the values of the indicators Φ in the rankings presented, there are apparent differences in energy intensity between the former Eastern Bloc countries and the Western countries. Negative net preference flow indices indicate a group of 11 dominated countries. These are Belgium, Bulgaria, the Czech Republic, Estonia, Croatia, Latvia, Luxembourg, Hungary, the Netherlands, Poland and Slovakia. Among them were eight countries from the former Eastern Bloc. Only Slovenia is in the group of dominant countries, while Lithuania and Romania were initially in the group of dominant countries but later qualified. The variation in the ranking positions of individual countries from year to year is illustrated in the figures (Figure 4).
In addition, the stability of the obtained rankings in the individual years of the study period was also examined. For this purpose, the Wilcoxon rank-sum test was used (Table 7).
Table 7 shows the results of applying the test comparing the similarity of the distributions of the variables expressing the ranking position of the countries. Recall that rankings were compared for selected years. The upper number denotes the value of the test statistic, while the lower number determines the empirical significance level, also known as the p-value. The hypothesis to be verified (called the null hypothesis) assumes that the two rank distributions are not significantly different from each other. In our case, in the compared periods, there have been no significant changes in the position of the 27 ranking countries. Those changes that have occurred in it compared to the earlier period are not statistically significant.
At a standard significance level of 0.05, not once was the null hypothesis rejected. Moreover, all the p-values in the table are very high. Thus, in order to accept the alternative hypothesis, the significance level (the probability of making an error of the first kind—considering the true null hypothesis to be false) would have to be even higher. This way, the distributions of rankings by country for all pairs of years were not significantly different. Even if some countries did move up or down in subsequent years, it has become clear that the changes were small enough that the rankings could be considered similar.

4. Discussion

Olkuski et al. [70] note that energy consumption has been steadily increasing for many decades due to global population growth and the aspirations of developing countries to raise the standard of living of their citizens. In the EU, the opposite trend, i.e., a decrease in energy consumption, has been observed since 2007. The downward trend can be explained by relocating heavy industries outside Europe and introducing policies for efficient energy management and savings. Bertoldi et al. [71] additionally noted that these are the results of the European Union’s efforts to reduce energy consumption and improve energy efficiency. In their study for the period 2000–2014, energy indicators such as energy intensity and energy consumption decreased. According to Economidou and Román-Collado [72], this makes the EU more competitive. Nevertheless, within the EU, there was a very high concentration of energy consumption in a few of the largest countries, such as Germany, France and Italy. The total energy consumption of 14 EU countries was as high as 90% in 2014 [71]. Reuter et al. [73], using a decomposition analysis for the period 2000–2015, concluded that energy consumption in the EU 28 is primarily influenced by increased energy efficiency in industry, followed by households. Bertoldi and Mosconi [74] show the effectiveness of energy efficiency policies in saving energy between 1990 and 2013 in the EU. The results show that energy reduction processes have already been initiated in the EU. According to Thomas and Rosenow [75], this process is supported by improvements in energy efficiency. In our study, we also found similar trends regarding changes in energy consumption.
Román-Collado and Economidou [76] surveyed changes in individual economic sectors in the EU between 2000 and 2018. They found that the services sector increased its share of final energy consumption by four percentage points, while the industrial and agricultural sectors decreased by four and one percentage points, respectively. The transport sector was not studied, nor was the household area. Bertoldi et al. [71] indicated that, in 2014, the largest share of final energy consumption was in the transport sector (33.22%), followed by the industrial sector (25.89%), the residential sector (24.80%), and the smallest in the services sector (13.31%). However, the analysis did not include the agricultural sector. When comparing final energy consumption by sector for five different years (i.e., 2000, 2004, 2007, 2010 and 2014), it was found that the shares changed slightly. In our study, we obtained similar results. The changes in the structure of sectors and areas of the economy were small. Borozan [77] found that the structure of sectors by final energy consumption across the EU was fairly homogeneous between 1998 and 2015. In our study, we observed similar relationships for the period 2005–2020. The study by Bertoldi et al. [78] found that the energy consumption of the transport and services sector in the EU changed more gradually between 2000 and 2015. Energy consumption increased only in the transport sector, with a downward trend in the industry and services sector and residential buildings. The rate of change in energy consumption varied considerably between EU countries. In our study, we achieved similar results. Transport had to keep up with the increase in the number of goods transported and the greater mobility of the population. Improvements in energy efficiency did not keep up with these increases. Other sectors and areas of the economy performed better in this respect. Overall, it must be said that changing energy consumption as a result of improving energy efficiency is a process that will take many years, even decades.
Grossi and Mussini [79] found in their study of EU countries between 2007 and 2012 that there were inequalities in energy intensity distribution. In addition, low-energy-intensity EU countries are more efficient in energy transition and less energy-intensive in specific economic sectors than high-energy-intensity EU countries. Similar results were obtained by Mussini [80] in a study covering the period 2003–2014. Convergence of energy intensity occurred mainly in the first years of the period studied. At that time, CEE countries with high energy intensity joined the European Union. In subsequent years, the convergence process slowed down. In our study, we found similar patterns. The differences between countries did not diminish. The most developed Western European countries continued to have the highest efficiency. On the other hand, according to Mulder [81], increasing trade and market integration should reduce differences in energy efficiency across countries. It should also be noted that less developed countries often specialise in sectors where they do not have a comparative advantage in terms of energy efficiency. Guevara et al. [82], in a study of 14 EU countries between 2000 and 2010, found that differences in industrial direct energy intensity and final energy demand mix were drivers of energy intensity differences between countries. Of course, it must be remembered that these were more developed countries than those from central and eastern Europe. Román-Collado and Colinet [83], using Spain as an example, highlighted the importance of households in reducing the energy intensity of the economy, while Trotta [84], using Finland as an example, highlighted the importance of industry and housing. In addition, Cansino et al. [85] point to the decisive role of industry, transport and service sectors in increasing energy consumption despite energy efficiency improvements. Similar conclusions were had by Miskinis et al. [86] on the example of an analysis of energy intensity in Lithuania, Latvia and Estonia from 2000 to 2018. They particularly highlighted the high share of energy-intensive industries and the rapid growth of energy consumption in the Lithuanian transport sector, which limited the reduction of consumption and energy intensity in these economies. Our research also highlights the high importance of the transport and industrial sectors for energy consumption and energy intensity of the economy.
According to Aktar et al. [87], the change in the share of production in GDP caused by the pandemic resulted in a decrease in energy demand and consumption. In the first months of the pandemic, global energy demand fell sharply. According to Broom [88], the commercial sector was also affected. Zhang et al. [89] point to a reduction in energy consumption in road transport during COVID-19. There are few studies of this type. Much more common is the theme of carbon emission reductions due to reduced urban transport, such as in the studies by Henriques [90] and Caine [91]. We did not encounter any literature on changes in agricultural energy consumption during a pandemic. Studies have generally addressed food safety during a pandemic due to the breaking of supply chains, such as in the studies by Rozaki [92] and Cardoso et al. [93]. Abulibdeh [94], on the other hand, examined the impact of the pandemic on energy consumption in the residential, industrial, commercial, public and manufacturing sectors in Qatar. The pandemic disrupted the temporal and spatial patterns of energy consumption. During the pandemic, energy consumption fell sharply in both the industrial and commercial sectors. This study was the only one that looked at a multi-sectoral analysis of energy consumption during the pandemic because the other studies primarily focused on single sectors. These studies were also limited and focused on aspects other than energy consumption and energy efficiencies, such as the effects on the environment or only the consumption of electricity by people or utilities.
Using data from Korea, Kang et al. [95] found that residential energy consumption tended to increase during COVID-19. The rate of change in building energy consumption showed a significantly positive correlation with COVID-19-related factors. Similar results were obtained by Qarnain et al. [96] for India, Abdeen et al. [97] for Canada, Farrow [98] for Australia, Krarti and Aldubyan [99] for the UK and USA, and Tleuken et al. [100] for Kazakhstan. The results confirm the relationship we observed. Of course, there was variation between countries depending on the severity of the pandemic and the constraints present. Some authors point to differences depending on the size of cities—energy consumption was higher in large and medium-sized cities.
Jiang et al. [101] pointed out spatial and temporal differences during the pandemic. In addition, energy intensity changes differently from country to country. In the USA it increased by 29%, in Japan by 8% and in China by only 3%. In the EU, the increase in energy intensity was expected to be the smallest, at around 1%. Our survey results confirmed these predictions. Only in services was the increase in energy intensity higher.
The literature review presented here shows a great deal of research on the energy consumption of entire economies or individual sectors. However, there is a lack of up-to-date research concerning recent years and relating comprehensively to all sectors and areas of the economy. In addition, there are very few studies on changes in energy consumption in individual sectors. Only one comprehensive study on energy consumption in all sectors was found. The researchers focused primarily on the increase in household energy consumption during COVID-19 and the environmental consequences resulting from reduced vehicle traffic, mainly in cities. We also found one study on energy intensity during the pandemic, but the data were estimated based on projections. In conclusion, the studies we presented are essential and can fill a research gap, as there are no studies of this kind so comprehensively showing the situation in energy consumption and energy intensity during the COVID-19 pandemic.

5. Conclusions and Recommendations

5.1. Conclusions

The conducted research allows for a few generalisations.
  • Transport, industry and households accounted for the largest share of energy consumption in the EU (about 80%), with agriculture accounting for the smallest share. The energy consumption structure in the individual EU countries was quite similar, and the deviations were insignificant. In addition, the concentration level of energy consumption in individual sectors and areas did not change over several years, indicative of an occurring stabilisation.
  • The COVID-19 pandemic reduced energy consumption in all sectors of the economy, the largest in transport and services and the smaller in industry. At the same time, energy consumption in households increased. Hypothesis 1 was verified positively.
  • The greatest variability in energy consumption was in agriculture and industry, and the least in households. In agriculture, energy consumption generally increased due to the introduction of mechanisation, which replaced human labour. In industry, there was a reduction in energy consumption, which may have been due to the introduction of less energy-intensive production technologies.
  • In general, the pandemic caused a slight increase in energy intensity in all sectors of the EU economy. This increase occurred in the case of most EU countries. The increase in energy intensity occurred particularly in industry and, to a lesser extent, in other sectors of the economy. Hypothesis 2 was verified positively for the whole EU and most EU countries.
  • Western European countries have generally been characterised by lower economic energy intensity than countries in Central and Eastern Europe. Little has changed in this respect over the past decade or so. Of course, there were some deviations, as Belgium and the Netherlands had similar energy intensity to the CEE countries, while Slovenia had similar energy intensity to the Western European countries. Hypothesis 3 was verified positively concerning the differences between the country blocks and negatively regarding the narrowing of the energy intensity gap. One of the reasons for this may still be the technological advantage of Western European economies over CEE countries.
  • Unquestionably, a general conclusion can be drawn from the study that the pandemic has inhibited the beneficial changes in the energy intensity of most EU economies. With adaptation measures in place in the next few years, EU countries can get back on track to reduce the energy intensity of their economies.

5.2. Recommendations

The study shows the changes that have taken place in the economy’s energy consumption of individual sectors and areas and their energy intensity before and during the pandemic. Such a comprehensive approach is new. Research on such relationships during the COVID-19 pandemic in other European and global countries is lacking. It would be worthwhile to confront the results with each other, as the determinants and scale of constraints in a pandemic have differed from country to country. It can be clearly stated that the epidemic has created a new situation for the whole world; therefore, it requires further clarification.
A limitation of conducting such studies is the lack of available up-to-date and detailed data on individual industries within sectors. As is well known, for example, within an industry, there are more than a dozen differing industries in which conditions may vary. Another limitation may be the use of aggregated data for entire sectors. It would be interesting to research the level of companies operating in the sectors concerned. A possible direction for further research is to link the transformation of energy consumption resulting from COVID-19 in individual sectors to sustainable development, especially pollution reduction and economic development. Research could also address these linkages using examples from individual industries within sectors. The topics given may represent a research gap to be filled. The research may contribute to the construction of public policies in a post-COVID-19 scenario.

Author Contributions

Conceptualization, T.R., R.J. and A.K.; Data curation, T.R., R.J. and A.K.; Formal analysis, T.R., R.J. and A.K.; Funding acquisition, T.R.; Investigation, T.R.; Methodology, T.R., R.J. and A.K.; Project administration, T.R.; Resources, T.R.; Software, T.R., R.J. and A.K.; Supervision, T.R.; Validation, T.R., R.J. and A.K; Visualization, T.R., R.J. and A.K; Writing—original draft, T.R., R.J., A.K., P.B., A.B.-B., A.S. and A.P.; Writing—review & editing, T.R., R.J., A.K., P.B., A.B.-B., A.S. and A.P. All authors have read and agreed to the published version of the manuscript.

Funding

This research received no external funding.

Institutional Review Board Statement

Not applicable.

Informed Consent Statement

Not applicable.

Data Availability Statement

Not applicable.

Conflicts of Interest

The authors declare no conflict of interest.

References

  1. Bogdanov, D.; Ram, M.; Aghahosseini, A.; Gulagi, A.; Oyewo, A.S.; Child, M.; Caldera, U.; Sadovskaia, K.; Farfan, J.; De Souza, L.; et al. Low-cost renewable electricity as the key driver of the global energy transition towards sustainability. Energy 2021, 227, 120467. [Google Scholar] [CrossRef]
  2. Rokicki, T.; Perkowska, A. Diversity and Changes in the Energy Balance in EU Countries. Energies 2021, 14, 1098. [Google Scholar] [CrossRef]
  3. Waheed, R.; Sarwar, S.; Wei, C. The survey of economic growth, energy consumption and carbon emission. Energy Rep. 2019, 5, 1103–1115. [Google Scholar] [CrossRef]
  4. Jobert, T.; Karanfil, F. Sectoral energy consumption by source and economic growth in Turkey. Energy Policy 2007, 35, 5447–5456. [Google Scholar] [CrossRef]
  5. Shahbaz, M.; Arouri, M.; Teulon, F. Short-and long-run relationships between natural gas consumption and economic growth: Evidence from Pakistan. Econ. Model. 2014, 41, 219–226. [Google Scholar] [CrossRef]
  6. Shahbaz, M.; Mallick, H.; Mahalik, M.K.; Sadorsky, P. The role of globalization on the recent evolution of energy demand in India: Implications for sustainable development. Energy Econ. 2016, 55, 52–68. [Google Scholar] [CrossRef]
  7. Rokicki, T.; Perkowska, A. Changes in Energy Supplies in the Countries of the Visegrad Group. Sustainability 2020, 12, 7916. [Google Scholar] [CrossRef]
  8. Marques, L.M.; Fuinhas, J.A.; Marques, A.C. Augmented energy-growth nexus: Economic, political and social globalization impacts. Energy Procedia 2017, 136, 97–101. [Google Scholar] [CrossRef]
  9. Gozgor, G.; Mahalik, M.K.; Demir, E.; Padhan, H. The impact of economic globalization on renewable energy in the OECD countries. Energy Policy 2020, 139, 111365. [Google Scholar] [CrossRef]
  10. Rokicki, T.; Bórawski, P.; Bełdycka-Bórawska, A.; Żak, A.; Koszela, G. Development of Electromobility in European Union Countries under COVID-19 Conditions. Energies 2022, 15, 9. [Google Scholar] [CrossRef]
  11. Klepacki, B.; Kusto, B.; Bórawski, P.; Bełdycka-Bórawska, A.; Michalski, K.; Perkowska, A.; Rokicki, T. Investments in Renewable Energy Sources in Basic Units of Local Government in Rural Areas. Energies 2021, 14, 3170. [Google Scholar] [CrossRef]
  12. Dzikuć, M.; Piwowar, A.; Dzikuć, M. The importance and potential of photovoltaics in the context of low-carbon development in Poland. Energy Storage Sav. 2022. [Google Scholar] [CrossRef]
  13. Szeberényi, A. Environmentally Conscious Lifestyle Analysis Among High School and University Students in a Hungarian Rural Town of the Heves County. Visegr. J. Bioeconomy Sustain. Dev. 2017, 6, 74–78. [Google Scholar] [CrossRef]
  14. Rokicki, T.; Perkowska, A.; Klepacki, B.; Szczepaniuk, H.; Szczepaniuk, E.K.; Bereziński, S.; Ziółkowska, P. The importance of higher education in the EU countries in achieving the objectives of the circular economy in the energy sector. Energies 2020, 13, 4407. [Google Scholar] [CrossRef]
  15. Zhao, Y.; Ke, J.; Ni, C.C.; McNeil, M.; Khanna, N.Z.; Zhou, N.; Li, Q. A comparative study of energy consumption and efficiency of Japanese and Chinese manufacturing industry. Energy Policy 2014, 70, 45–56. [Google Scholar] [CrossRef]
  16. Gostkowski, M.; Rokicki, T.; Ochnio, L.; Koszela, G.; Wojtczuk, K.; Ratajczak, M.; Szczepaniuk, H.; Bórawski, P.; Bełdycka-Bórawska, A. Clustering Analysis of Energy Consumption in the Countries of the Visegrad Group. Energies 2021, 14, 5612. [Google Scholar] [CrossRef]
  17. Medlock III, K.B.; Soligo, R. Economic development and end-use energy demand. Energy J. 2001, 22, 77–105. [Google Scholar] [CrossRef]
  18. Rokicki, T.; Koszela, G.; Ochnio, L.; Wojtczuk, K.; Ratajczak, M.; Szczepaniuk, H.; Michalski, K.; Bórawski, P.; Bełdycka-Bórawska, A. Diversity and Changes in Energy Consumption by Transport in EU Countries. Energies 2021, 14, 5414. [Google Scholar] [CrossRef]
  19. Sequeira, M.; Joanaz de Melo, J. Energy saving potential in the small business service sector: Case study Telheiras neighborhood, Portugal. Energy Effic. 2020, 13, 551–569. [Google Scholar] [CrossRef]
  20. Schleich, J.; Gruber, E. Beyond case studies: Barriers to energy efficiency in commerce and the services sector. Energy Econ. 2008, 30, 449–464. [Google Scholar] [CrossRef]
  21. Rokicki, T.; Perkowska, A.; Klepacki, B.; Bórawski, P.; Bełdycka-Bórawska, A.; Michalski, K. Changes in Energy Consumption in Agriculture in the EU Countries. Energies 2021, 14, 1570. [Google Scholar] [CrossRef]
  22. Giannakis, E.; Bruggeman, A. Regional disparities in economic resilience in the European Union across the urban–rural divide. Reg. Stud. 2020, 54, 1200–1213. [Google Scholar] [CrossRef]
  23. Rokicki, T.; Ratajczak, M.; Bórawski, P.; Bełdycka-Bórawska, A.; Gradziuk, B.; Gradziuk, P.; Siedlecka, A. Energy Self-Subsistence of Agriculture in EU Countries. Energies 2021, 14, 3014. [Google Scholar] [CrossRef]
  24. Mahmood, T.; Ahmad, E. The relationship of energy intensity with economic growth: Evidence for European economies. Energy Strategy Rev. 2018, 20, 90–98. [Google Scholar] [CrossRef]
  25. Cialani, C.; Mortazavi, R. Household and industrial electricity demand in Europe. Energy Policy 2018, 122, 592–600. [Google Scholar] [CrossRef]
  26. Narayan, P.K.; Smyth, R. The residential demand for electricity in Australia: An application of the bounds testing approach to cointegration. Energy Policy 2005, 33, 467–474. [Google Scholar] [CrossRef]
  27. Besagni, G.; Borgarello, M. The determinants of residential energy expenditure in Italy. Energy 2018, 165, 369–386. [Google Scholar] [CrossRef]
  28. Lévy, J.P.; Belaïd, F. The determinants of domestic energy consumption in France: Energy modes, habitat, households and life cycles. Renew. Sustain. Energy Rev. 2018, 81, 2104–2114. [Google Scholar] [CrossRef]
  29. Mashhoodi, B.; Stead, D.; van Timmeren, A. Spatial homogeneity and heterogeneity of energy poverty: A neglected dimension. Annals of GIS 2019, 25, 19–31. [Google Scholar] [CrossRef]
  30. Rokicki, T.; Bórawski, P.; Gradziuk, B.; Gradziuk, P.; Mrówczyńska-Kamińska, A.; Kozak, J.; Guzal-Dec, D.J.; Wojtczuk, K. Differentiation and Changes of Household Electricity Prices in EU Countries. Energies 2021, 14, 6894. [Google Scholar] [CrossRef]
  31. Van den Bergh, K.; Delarue, E.; D’haeseleer, W. Impact of renewables deployment on the CO2 price and the CO2 emissions in the European electricity sector. Energy Policy 2013, 63, 1021–1031. [Google Scholar] [CrossRef]
  32. Strambo, C.; Nilsson, M.; Månsson, A. Coherent or inconsistent? Assessing energy security and climate policy interaction within the European Union. Energy Res. Soc. Sci. 2015, 8, 1–12. [Google Scholar] [CrossRef]
  33. Leal-Arcas, R.; Lesniewska, F.; Proedrou, F. Prosumers: New actors in EU energy security. In Netherlands Yearbook of International Law; TMC Asser Press: The Hague, The Netherlands, 2017; pp. 139–172. [Google Scholar]
  34. Pereira, G.I.; da Silva, P.P.; Soule, D. Policy-adaptation for a smarter and more sustainable EU electricity distribution industry: A foresight analysis. Environ. Dev. Sustain. 2018, 20, 231–267. [Google Scholar] [CrossRef]
  35. Soares, N.; Martins, A.G.; Carvalho, A.L.; Caldeira, C.; Du, C.; Castanheira, É.; Garcia, R. The challenging paradigm of interrelated energy systems towards a more sustainable future. Renew. Sustain. Energy Rev. 2018, 95, 171–193. [Google Scholar] [CrossRef]
  36. Pereira, G.; da Silva, P.P.; Soule, D. Designing Markets for Innovative Electricity Services in the EU: The Roles of Policy, Technology, and Utility Capabilities; Academic Press: Cambridge, MA, USA, 2019; pp. 22–35. [Google Scholar]
  37. European Commission. Energy 2020. In A Strategy for Competitive, Sustainable and Secure Energy; European Commission: Brussels, Belgium, 2010. [Google Scholar]
  38. European Commission. Clean Energy for All Europeans. In Communication from the Commission to the European Parliament, the Council, the European Economic and Social Committee, the Committee of the Regions and the European Investment Bank; European Commission: Brussels, Belgium, 2016. [Google Scholar]
  39. Wach, K.; Głodowska, A.; Maciejewski, M.; Sieja, M. Europeanization Processes of the EU Energy Policy in Visegrad Countries in the Years 2005–2018. Energies 2021, 14, 1802. [Google Scholar] [CrossRef]
  40. Allen, M.L.; Allen, M.M.; Cumming, D.; Johan, S. Comparative capitalisms and energy transitions: Renewable energy in the European Union. Br. J. Manag. 2021, 32, 611–629. [Google Scholar] [CrossRef]
  41. A European Green Deal. Available online: https://ec.europa.eu/info/strategy/priorities-2019-2024/european-green-deal_en (accessed on 26 July 2022).
  42. Gourinchas, P.O. Flattening the pandemic and recession curves. In Mitigating the COVID Economic Crisis: Act Fast and Do Whatever; Baldwin, R., Weder di Mauro, B., Eds.; CEPR Press: London, UK, 2020; Volume 31, pp. 57–62. [Google Scholar]
  43. Baldwin, R. Keeping the lights on: Economic medicine for a medical shock. VoxEU. 2020, 13. Available online: https://cepr.org/voxeu/columns/keeping-lights-economic-medicine-medical-shock (accessed on 25 July 2022).
  44. Abay, K.A.; Tafere, K.; Woldemichael, A. Winners and losers from COVID-19: Global evidence from Google Search. World Bank Policy Res. Work. Pap. 2021, 9268. [Google Scholar]
  45. Slade, M.E. Many losers and a few winners: The impact of COVID-19 on Canadian industries and regions. Can. J. Econ. Rev. Can. D’économique 2022, 55, 282–307. [Google Scholar] [CrossRef]
  46. Lebedeva, L.; Moskalenko, O. Impact of the COVID-19 pandemic on the industrial sector: Implications for economic policy. Balt. J. Econ. Stud. 2021, 7, 114–122. [Google Scholar] [CrossRef]
  47. De Vet, J.M.; Nigohosyan, D.; Ferrer, J.N.; Gross, A.K.; Kuehl, S.; Flickenschild, M. Impacts of the COVID-19 Pandemic on EU Industries; European Parliament: Strasbourg, France, 2021; pp. 1–86. [Google Scholar]
  48. He, Y.; Wang, Y. Macroeconomic Effects of COVID-19 Pandemic: Fresh Evidence from Korea. Sustainability 2022, 14, 5100. [Google Scholar] [CrossRef]
  49. Arellana, J.; Márquez, L.; Cantillo, V. COVID-19 outbreak in Colombia: An analysis of its impacts on transport systems. J. Adv. Transp. 2020, 2020, 8867316. [Google Scholar] [CrossRef]
  50. Li, S.; Zhou, Y.; Kundu, T.; Sheu, J.B. Spatiotemporal variation of the worldwide air transportation network induced by COVID-19 pandemic in 2020. Transport. Policy 2021, 111, 168–184. [Google Scholar] [CrossRef]
  51. Sun, X.; Wandelt, S.; Zhang, A. Ghostbusters: Hunting abnormal Flights in Europe during COVID-19. SSRN 2022, 4152511. [Google Scholar] [CrossRef]
  52. Sun, X.; Wandelt, S.; Zhang, A. Aviation under COVID-19 Pandemic: Status Quo and How to Proceed Further? SSRN 2022, 4031476. [Google Scholar] [CrossRef]
  53. Linka, K.; Peirlinck, M.; Sahli Costabal, F.; Kuhl, E. Outbreak dynamics of COVID-19 in Europe and the effect of travel restrictions. Comput. Methods Biomech. Biomed. Eng. 2020, 23, 710–717. [Google Scholar] [CrossRef]
  54. Linka, K.; Goriely, A.; Kuhl, E. Global and local mobility as a barometer for COVID-19 dynamics. Biomech. Modeling Mechanobiol. 2021, 20, 651–669. [Google Scholar] [CrossRef]
  55. Rahman, M.M.; Thill, J.-C. Associations between COVID-19 Pandemic, Lockdown Measures and Human Mobility: Longitudinal Evidence from 86 Countries. Int. J. Environ. Res. Public Health 2022, 19, 7317. [Google Scholar] [CrossRef]
  56. Haleem, A.; Javaid, M.; Vaishya, R. Effects of COVID-19 pandemic in daily life. Curr. Med. Res. Pract. 2020, 10, 78. [Google Scholar] [CrossRef]
  57. Sulkowski, L.; Ignatowski, G. Impact of COVID-19 pandemic on organization of religious behaviour in different Christian denominations in Poland. Religions 2020, 11, 254. [Google Scholar] [CrossRef]
  58. Hussain, M.W.; Mirza, T.; Hassan, M.M. Impact of COVID-19 pandemic on the human behavior. Int. J. Educ. Manag. Eng. 2020, 10, 35–61. [Google Scholar] [CrossRef]
  59. Škare, M.; Soriano, D.R.; Porada-Rochoń, M. Impact of COVID-19 on the travel and tourism industry. Technol. Forecast. Soc. Chang. 2021, 163, 120469. [Google Scholar] [CrossRef] [PubMed]
  60. Grix, J.; Brannagan, P.M.; Grimes, H.; Neville, R. The impact of Covid-19 on sport. Int. J. Sport Policy Politics 2021, 13, 1–12. [Google Scholar] [CrossRef]
  61. Tadesse, S.; Muluye, W. The impact of COVID-19 pandemic on education system in developing countries: A review. Open J. Soc. Sci. 2020, 8, 159–170. [Google Scholar] [CrossRef]
  62. Dixon, P.M.; Weiner, J.; Mitchell-Olds, T.; Woodley, R. Erratum to ‘Bootstrapping the Gini Coefficient of Inequality. Ecology 1988, 69, 1307. [Google Scholar] [CrossRef]
  63. Zeliaś, A. Metody Statystyczne; Wydawnictwo Naukowe PWN: Warsaw, Poland, 2000; pp. 15–22. [Google Scholar]
  64. Jajuga, K.; Walesiak, M. Remarks on the Dependence Measures and the Distance Measures. In Klasyfikacja i Analiza Danych—Teoria i Zastosowania; Jajuga, K., Walesiak, M., Eds.; Prace Naukowe Akademii Ekonomicznej we Wrocławiu: Wroclaw, Poland, 2004; pp. 348–354. [Google Scholar]
  65. Starzyńska, W. Statystyka Praktyczna; Wydawnictwo Naukowe PWN: Warsaw, Poland, 2002; pp. 142–148. [Google Scholar]
  66. Graczyk, A. Wskaźniki zrównoważonego rozwoju energetyki. Optimum. Studia Ekonomiczne 2017, 4, 53–68. [Google Scholar] [CrossRef]
  67. Kobryń, A. Wielokryterialne Wspomaganie Decyzji w Gospodarowaniu Przestrzenią; Difin: Warsaw, Poland, 2014. [Google Scholar]
  68. Trzaskalik, T. Metody Wielokryterialne na Polskim Rynku Finansowym; Wydawnictwo Naukowe PWN: Warsaw, Poland, 2009. [Google Scholar]
  69. Aczel, A. Statystyka w Zarządzaniu; Wydawnictwo Naukowe PWN: Warsaw, Poland, 2009. [Google Scholar]
  70. Olkuski, T.; Suwała, W.; Wyrwa, A.; Zyśk, J.; Tora, B. Primary energy consumption in selected EU Countries compared to global trends. Open Chem. 2021, 19, 503–510. [Google Scholar] [CrossRef]
  71. Bertoldi, P.; López-Lorente, J.; Labanca, N. Energy consumption and energy efficiency trends in the EU-28 2000–2014. Jt. Res. Cent. Ispra Italy 2016, 1, 1–175. [Google Scholar]
  72. Economidou, M.; Román-Collado, R. Assessing the progress towards the EU energy efficiency targets using index decomposition analysis. Luxemb. Publ. Off. Eur. Union 2017, 10, 675791. [Google Scholar]
  73. Reuter, M.; Patel, M.K.; Eichhammer, W. Applying ex post index decomposition analysis to final energy consumption for evaluating European energy efficiency policies and targets. Energy Effic. 2019, 12, 1329–1357. [Google Scholar] [CrossRef]
  74. Bertoldi, P.; Mosconi, R. Do energy efficiency policies save energy? A new approach based on energy policy indicators (in the EU Member States). Energy Policy 2020, 139, 111320. [Google Scholar] [CrossRef]
  75. Thomas, S.; Rosenow, J. Drivers of increasing energy consumption in Europe and policy implications. Energy Policy 2020, 137, 111108. [Google Scholar] [CrossRef]
  76. Román-Collado, R.; Economidou, M. The role of energy efficiency in assessing the progress towards the EU energy efficiency targets of 2020: Evidence from the European productive sectors. Energy Policy 2021, 156, 112441. [Google Scholar] [CrossRef]
  77. Borozan, D. Decomposing the changes in European final energy consumption. Energy Strategy Rev. 2018, 22, 26–36. [Google Scholar] [CrossRef]
  78. Bertoldi, P.; Diluiso, F.; Castellazzi, L.; Labanca, N.; Serrenho, T. Energy Consumption and Energy Efficiency Trends in the EU-28 2000–2015; JRC Report; European Commission: Brussel, Belguim, 2018. [Google Scholar]
  79. Grossi, L.; Mussini, M. Inequality in energy intensity in the EU-28: Evidence from a new decomposition method. Energy J. 2017, 38. [Google Scholar] [CrossRef]
  80. Mussini, M. Inequality and convergence in energy intensity in the European Union. Appl. Energy 2020, 261, 114371. [Google Scholar] [CrossRef]
  81. Mulder, P. International specialization, structural change and the evolution of manufacturing energy intensity in OECD countries. Energy J. 2015, 36. [Google Scholar] [CrossRef]
  82. Guevara, Z.; Henriques, S.; Sousa, T. Driving factors of differences in primary energy intensities of 14 European countries. Energy Policy 2021, 149, 112090. [Google Scholar] [CrossRef]
  83. Román-Collado, R.; Colinet, M.J. Is energy efficiency a driver or an inhibitor of energy consumption changes in Spain? Two decomposition approaches. Energy Policy 2018, 115, 409–417. [Google Scholar] [CrossRef]
  84. Trotta, G. Assessing energy efficiency improvements and related energy security and climate benefits in Finland: An ex post multi-sectoral decomposition analysis. Energy Econ. 2020, 86, 104640. [Google Scholar] [CrossRef]
  85. Cansino, J.M.; Román-Collado, R.; Merchán, J. Do Spanish energy efficiency actions trigger JEVON’S paradox? Energy 2019, 181, 760–770. [Google Scholar] [CrossRef]
  86. Miskinis, V.; Galinis, A.; Konstantinaviciute, I.; Lekavicius, V.; Neniskis, E. Comparative analysis of energy efficiency trends and driving factors in the Baltic States. Energy Strategy Rev. 2020, 30, 100514. [Google Scholar] [CrossRef]
  87. Aktar, M.A.; Alam, M.M.; Al-Amin, A.Q. Global economic crisis, energy use, CO2 emissions, and policy roadmap amid COVID-19. Sustain. Prod. Consum. 2021, 26, 770–781. [Google Scholar] [CrossRef] [PubMed]
  88. Broom, D. These 3 Charts Show What COVID-19 has Done to Global Energy Demand. In The World Economic Forum COVID Action Platform 2020. Available online: https://www.weforum.org/agenda/2020/08/covid19-change-energy-electricity-use-lockdowns-falling-demand/ (accessed on 26 July 2022).
  89. Zhang, X.; Li, Z.; Wang, J. Impact of COVID-19 pandemic on energy consumption and carbon dioxide emissions in China’s transportation sector. Case Stud. Therm. Eng. 2021, 26, 101091. [Google Scholar] [CrossRef]
  90. Henriques, M. Will COVID-19 Have a Lasting Impact on the Environment. Available online: https://www.bbc.com/future/article/20200326-covid-19-the-impact-of-coronavirus-on-the-environment (accessed on 26 July 2022).
  91. Caine, P. Environmental impact of COVID-19 lockdowns seen from space. Sci. Nat. 2020, 2. Available online: https://news.wttw.com/2020/04/02/environmental-impact-covid-19-lockdowns-seen-space (accessed on 25 July 2022).
  92. Rozaki, Z. COVID-19, agriculture, and food security in Indonesia. Rev. Agric. Sci. 2020, 8, 243–260. [Google Scholar] [CrossRef]
  93. Cardoso, B.; Cunha, L.; Leiras, A.; Gonçalves, P.; Yoshizaki, H.; de Brito Junior, I.; Pedroso, F. Causal Impacts of Epidemics and Pandemics on Food Supply Chains: A Systematic Review. Sustainability 2021, 13, 9799. [Google Scholar] [CrossRef]
  94. Abulibdeh, A. Modeling electricity consumption patterns during the COVID-19 pandemic across six socioeconomic sectors in the State of Qatar. Energy Strategy Rev. 2021, 38, 100733. [Google Scholar] [CrossRef]
  95. Kang, H.; An, J.; Kim, H.; Ji, C.; Hong, T.; Lee, S. Changes in energy consumption according to building use type under COVID-19 pandemic in South Korea. Renew. Sustain. Energy Rev. 2021, 148, 111294. [Google Scholar] [CrossRef]
  96. Qarnain, S.S.; Sattanathan, M.; Sankaranarayanan, B.; Ali, S.M. Analyzing energy consumption factors during coronavirus (COVID-19) pandemic outbreak: A case study of residential society. Energy Sources Part A Recovery Util. Environ. Eff. 2020, 1–20. [Google Scholar] [CrossRef]
  97. Abdeen, A.; Kharvari, F.; O’Brien, W.; Gunay, B. The impact of the COVID-19 on households’ hourly electricity consumption in Canada. Energy Build. 2021, 250, 111280. [Google Scholar] [CrossRef]
  98. Farrow, H. Commercial down v residential up: COVID-19′s electricity impact. Energy Network Australia. 2020, pp. 1–23. Available online: https://www.energynetworks.com.au/news/energy-insider/2020-energy-insider/commercial-down-v-residential-up-covid-19s-electricity-impact/address (accessed on 25 July 2022).
  99. Krarti, M.; Aldubyan, M. Review analysis of COVID-19 impact on electricity demand for residential buildings. Renew. Sustain. Energy Rev. 2021, 143, 110888. [Google Scholar] [CrossRef]
  100. Tleuken, A.; Tokazhanov, G.; Serikbay, A.B.; Zhalgasbayev, K.; Guney, M.; Turkyilmaz, A.; Karaca, F. Household Water and Energy Consumption Changes during COVID-19 Pandemic Lockdowns: Cases of the Kazakhstani Cities of Almaty, Shymkent, and Atyrau. Buildings 2021, 11, 663. [Google Scholar] [CrossRef]
  101. Jiang, P.; Van Fan, Y.; Klemeš, J.J. Impacts of COVID-19 on energy demand and consumption: Challenges, lessons and emerging opportunities. Appl. Energy 2021, 285, 116441. [Google Scholar] [CrossRef] [PubMed]
Figure 1. Diagram of the conducted research.
Energies 15 06243 g001
Figure 2. Final energy consumption by sector and area in EU countries from 2005 to 2020.
Energies 15 06243 g002
Figure 3. Structure of final energy consumption by sector and area in EU countries in 2020.
Energies 15 06243 g003
Figure 4. Positions achieved in the individual rankings for energy intensity. (a) dominated countries; (b) dominant countries; (c) other countries.
Energies 15 06243 g004aEnergies 15 06243 g004b
Table 1. Estimated Gini coefficient values for final energy consumption by sector and area in EU countries from 2005 to 2020. Blue indicates the best performer in a given period, and red the worst performer.
SectorGini Coefficient
20052010201520192020
Industry0.6070.6330.6430.6220.623
Agriculture, forestry
and fisheries
0.6140.6170.6460.6110.625
Services0.6120.6210.6460.6150.622
Transport0.6080.6200.6290.6040.622
Holdings
home
0.6060.6220.6300.5980.618
Table 2. Coefficient variation values for final energy consumption by sector and area in EU countries from 2005 to 2020. Blue indicates the three best performers in a given sector, and red the three worst performers.
CountryCoefficient of Variation
IndustryAgriculture, Forestry and FishingServicesTransportHouseholds
Austria2.07%2.30%7.50%4.10%3.50%
Belgium3.19%8.80%4.00%3.70%6.70%
Bulgaria15.51%19.20%10.40%8.80%4.40%
Croatia16.36%3.40%5.50%5.40%7.20%
Cyprus16.57%6.50%12.30%7.30%5.70%
Bohemia11.22%7.80%3.00%5.20%4.20%
Denmark10.88%8.70%3.60%4.80%3.70%
Estonia18.08%12.80%7.80%4.60%4.30%
Finland6.22%4.00%5.20%2.60%5.20%
France6.81%1.80%4.70%3.90%5.70%
Germany3.05%76.50%8.00%2.90%5.90%
Greece19.06%61.20%7.20%15.10%13.20%
Hungary18.39%15.00%18.30%9.40%6.10%
Ireland11.62%18.70%7.20%9.00%8.70%
Italy16.21%5.50%7.50%8.90%4.50%
Latvia8.52%13.80%5.20%7.90%10.70%
Lithuania6.11%4.40%3.90%14.50%4.30%
Luxembourg10.37%8.00%12.20%7.90%4.00%
Malta10.51%22.8%22.10%11.10%15.60%
Netherlands6.27%4.70%4.80%6.40%8.60%
Poland6.98%6.70%6.40%17.50%4.80%
Portugal11.01%8.70%9.50%7.90%6.70%
Romania13.30%25.3%9.20%13.00%3.10%
Slovakia5.78%7.10%19.40%8.40%10.40%
Slovenia12.17%4.00%8.60%8.70%9.50%
Spain14.11%8.20%6.00%11.30%4.40%
Sweden3.54%7.30%2.80%3.40%4.60%
EU-27 average10.52%13.82%8.23%7.91%6.51%
Table 3. Dynamics of change in final energy consumption by sector and area in EU countries from 2005 to 2020. Blue indicates the three best performers in a given sector and period, and red the three worst performers.
CountryChained Dynamic Indexes
IndustryAgriculture, Forestry and FishingServicesTransportHouseholds
2019202020192020201920202019202020192020
Austria99.7897.0898.3698.09102.6697.0699.9987.46102.24100.08
Belgium96.5296.98112.8489.3898.8597.0299.3187.8897.42100.99
Bulgaria97.998.79101.27100.34102.9885.17101.1194.396.98110.17
Croatia100.9199.9101.00105.27100.3590.66104.1188.0797.38101.72
Cyprus100.42107.00101.78103.98104.1985.23101.189.17107.54100.52
Bohemia98.7999.11102.4100.4102.0593.58101.7994.198.87102.65
Denmark97.35102.0898.2897.4996.6995.0698.3292.9498.6898.45
Estonia94.1588.8391.0096.7495.26100.9599.9895.29101.0999.3
Finland99.0793.4899.9897.0997.9593.1998.592.9298.9493.93
France97.5393.8199.01103.2798.0992.8499.9984.7499.6597.71
Germany97.4897.38107.89101.4795.397.23101.3590.65103.44100.43
Greece94.4897.52104.8399.17102.0189.14102.5185.06105.1104.29
Hungary100.1599.35103.97104.4997.797.54105.8587.9597.57105.1
Ireland99.5296.3798.0497.86103.04100.58100.6684.3697.18108.49
Italy101.0795.7296.57101.195.7491.01100.7980.897.698.45
Latvia94.97102.13110.58101.2996.0896.7599.1195.1496.593.89
Lithuania100.6591.97102.82102.3896.2491.94103.3298.8795.7499.05
Luxembourg97.3692.5591.3596.92112.7494.93102.4877.4892.45107.41
Malta103.43102.92115.29106.07105.3696.19106.3882.28107.19101.61
Netherlands96.87100.5799.997.6497.9195.599.3185.598.0798.43
Poland101.0196.5497.32101.4498.4897.08101.9495.5993.07100.51
Portugal101.497.49102.4105.6899.191.53102.3183.72100.47104.21
Romania100.7496.6498.4695.2699.2993.48104.2598.3199.72103.28
Slovakia94.5790.697.5101.8992.9690.69101.6689.18128.48103.83
Slovenia100.2395.2998.2998.2195.2791.8997.5782.1897.5101.42
Spain99.8991.27105.46103.33100.4691.67101.2979.495.18100.76
Sweden98.9106.16103.0293.497.6799.5798.6194.1998.3197.78
EU-27 average98.7197.32101.4799.9999.4293.98101.2488.80100.09101.28
Table 4. Pearson’s linear correlation coefficient values for individual sectors and areas in EU countries in 2019–2020.
SectorPearson’s Linear Correlation Coefficients for Sectors and Areas
IndustryAgriculture, Forestry and FishingServicesTransportHouseholds
Industry1.000
Agriculture, forestry
and fisheries
−0.7081.000
Services0.815−0.6091.000
Transport0.882−0.6360.9421.000
Holdings
home
0.364−0.2820.6340.4781.000
Table 5. Energy intensity factor values by sector in EU countries from 2005 to 2020. Blue indicates the three best performers in a given sector and period, and red the three worst performers.
CountryEnergy Intensity Factor [TJ/million EUR].
20052010201520192020
K1K2K3K4K1K2K3K4K1K2K3K4K1K2K3K4K1K2K3K4
Austria5.76,91.127.55.46.00.823.44.65.70.620.34.15.10.618.94.25.10.618.5
Belgium7.916.21.321.77.912.51.119.37.110.70.917.56.311.90.715.56.211.60.814.4
Bulgaria33.47.34.075.715.95.02.653.612.34.22.456.310.24.02.048.110.23.71.749.9
Croatia9.87.32.046.07.26.31.642.35.87.41.645.05.76.41.439.26.16.71.442.6
Cyprus10.13.90.931.67.14.11.024.97.45.20.821.05.74.60.920.66.64.70.821.6
Bohemia11.99.13.135.36.89.42.128.45.66.81.929.74.66.31.425.25.06.31.325.3
Denmark3.214.80.914.92.712.50.714.82.112.10.612.61.97.40.512.32.06.70.511.1
Estonia14.011.73.734.58.58.52.926.45.99.42.320.44.16.81.620.53.87.91.621.7
Finland12.08.41.621.611.77.41.521.611.46.61.119.311.05.31.118.010.45.01.020.6
France5.26.50.925.94.75.80.922.04.25.40.821.03.84.90.719.04.05.10.618.8
Germany4.40.51.224.94.02.61.221.23.42.90.918.73.05.60.716.93.26.20.716.2
Greece7.25.70.822.36.05.00.722.05.91.70.824.55.01.80.921.74.81.70.920.2
Hungary6.46.93.841.25.06.83.033.76.35.72.128.46.45.81.428.56.86.41.428.6
Ireland2.99.10.833.82.17.70.728.80.93.90.625.10.83.20.424.60.72.90.430.9
Italy5.84.60.924.74.54.30.920.43.73.50.818.73.33.60.916.93.43.70.815.7
Latvia15.012.44.628.111.29.03.427.49.77.92.321.38.87.11.820.89.27.51.823.4
Lithuania9.34.93.532.16.85.52.620.65.53.31.918.65.13.11.516.64.73.01.417.3
Luxembourg11.48.70.864.811.910.80.652.07.48.70.538.56.97.40.535.26.67.50.522.8
Malta2.83.61.125.32.03.91.022.72.51.90.816.61.95.50.614.82.06.80.621.7
Netherlands7.317.11.120.06.315.61.019.05.513.40.814.25.112.80.713.15.313.20.612.5
Poland11.325.93.341.07.315.13.041.66.013.62.228.06.012.91.729.16.012.41.729.3
Portugal10.06.71.248.38.65.60.936.56.54.91.130.46.04.50.926.66.25.00.931.2
Romania18.81.32.930.17.22.61.726.26.92.91.221.45.92.50.920.76.12.60.820.5
Slovakia14.510.95.146.38.75.23.142.97.43.61.719.26.53.51.322.56.63.41.121.5
Slovenia9.84.51.745.97.04.21.442.55.73.81.235.24.83.21.030.04.73.00.927.2
Spain8.25.10.843.35.43.60.832.94.93.80.726.24.83.80.726.84.83.60.727.1
Sweden7.68.11.119.16.94.71.017.46.14.20.714.35.94.10.713.56.73.90.713.7
EU-27 average9.88.42.034.37.07.01.629.16.06.01.224.55.35.71.022.85.45.81.023.1
Table 6. Country rankings in energy intensity by economic sector for the years selected for the study from 2005–2020.
CountryR’s Ranking and Net Preference Flow Rate Φ
20052010201520192020
RΦRΦRΦRΦRΦ
Austria70.20980.20580.18180.19180.197
Belgium20−0.07220−0.17322−0.18123−0.24121−0.225
Bulgaria27−0.57927−0.48627−0.51827−0.51125−0.464
Croatia16−0.00417−0.03021−0.17422−0.21123−0.263
Cyprus80.159100.162140.020130.056140.011
Bohemia22−0.14918−0.13417−0.12518−0.07918−0.086
Denmark110.112120.133100.13630.29620.338
Estonia23−0.30823−0.23723−0.25117−0.06619−0.101
Finland140.01322−0.22124−0.31124−0.32924−0.294
France40.23850.24950.21460.2170.207
Germany10.39320.36830.34250.25960.229
Greece60.21670.21560.20770.20650.232
Hungary17−0.01616−0.02918−0.12621−0.17622−0.244
Ireland50.22940.30410.46910.49410.493
Italy30.26830.30740.31340.28530.291
Latvia24−0.37325−0.44226−0.44525−0.44127−0.493
Lithuania15−0.00215−0.004130.042140.041120.101
Luxembourg19−0.06824−0.42420−0.17120−0.16517−0.072
Malta20.36210.43720.45220.36140.272
Netherlands18−0.06419−0.15219−0.14119−0.16420−0.168
Poland26−0.45626−0.45425−0.40426−0.48326−0.468
Portugal130.041140.002150.013150.00616−0.044
Romania21−0.138110.137110.080100.131110.132
Slovakia25−0.38621−0.20716−0.03916−0.04315−0.006
Slovenia120.076130.060120.057120.100100.162
Spain100.14460.23870.19790.14590.171
Sweden90.15890.17690.162110.127130.091
Table 7. Values of Wilcoxon rank-sum test statistics.
Value of Test Statistic and p-Value
2010201520192020
2005174199208199
(0.732)(0.822)(0.662)(0.822)
2010 222216208
(0.441)(0.530)(0.662)
2015 215196
(0.546)(0.878)
2019 186
(0.953)
Publisher’s Note: MDPI stays neutral with regard to jurisdictional claims in published maps and institutional affiliations.

