Article

Wind Tunnel Tests of Wake Characteristics for a Scaled Wind Turbine Model Based on Dynamic Similarity

1
Chongqing Key Laboratory of Wind Engineering and Wind Energy Utilization, School of Civil Engineering, Chongqing University, Chongqing 400045, China
2
College of Automation, Chongqing University, Chongqing 400045, China
3
CSSC Haizhuang Windpower Co., Ltd., Chongqing 401122, China
4
Energy Research Institute, Qilu University of Technology (Shandong Academy of Sciences), Jinan 250014, China
5
Department of Civil Engineering, The University of Hong Kong, Pokfulam, Hong Kong
*
Author to whom correspondence should be addressed.
Energies 2022, 15(17), 6165; https://doi.org/10.3390/en15176165
Submission received: 9 May 2022 / Revised: 27 June 2022 / Accepted: 30 June 2022 / Published: 25 August 2022

Abstract

:
This wind tunnel study was conducted to investigate the similarity laws involved in the reasonable simulation of the wake characteristics of a full-scale wind turbine. A 5 MW scaled wind turbine model was designed using an optimization method based on the blade element momentum (BEM) theory. Subsequently, wind tunnel tests were carried out on the geometrically similar model and the thrust-optimized model, with different yaw angles and under various upstream flow conditions. The results indicated that the wake development of the wind turbine model was closely related to the thrust forces of the wind turbine, and both kinematic and dynamic similarity laws should be observed to achieve wake characteristics that are reasonably similar to those of a full-scale wind turbine. This study investigated the aerodynamic similarity principles of small-scale wind turbine models to develop a more effective method for simulating full-scale turbine wake characteristics in wind tunnel tests. The outcomes of this study revealed the limitations of the anomalously low thrust coefficients in geometrically similar wind turbine models and present reasonable model design methodologies for small-scale wind turbine models in wind tunnel tests.

1. Introduction

With the increase in the severity of the energy crisis and environmental pollution, wind energy, as one of the most commercialized forms of energy production, has developed rapidly. The height of turbines and the size of their blades have been increased to improve the utilization rate of wind energy. However, the wake effect between turbines reduces the wind speed and increases the turbulence at the downstream turbine, lowering its power generation efficiency and increasing its fatigue load [1,2]. Research has demonstrated that the wake distribution of wind turbines is mainly affected by the atmospheric boundary layer, wind turbine type, wind turbine yaw angle, and thrust coefficient [3]. Some studies have shown that the yaw operation of the upstream turbine can change the distribution area of the wake, reducing the impact of the wake on the downstream turbine and significantly improving its output power. The wake effects of turbines have become an important research topic [4].
Due to their low cost and high flexibility, wind tunnel tests are often used to study the wake characteristics of wind turbines. The wakes of a horizontal-axis wind turbine (HAWT) were extensively studied and comprehensively reviewed in [5]. The researchers experimentally investigated the distribution characteristics of turbine wakes under operating conditions through wind tunnel tests using small-scale models. The experimental results facilitated the understanding of the wake evolutionary characteristics, as well as the validation and development of numerical models (such as large-eddy simulation (LES) and Reynolds-averaged Navier–Stokes (RANS)) and analytical wake models [6,7]. Currently, most studies focus on the geometrical and kinematic similarities of scaled wind turbine models in wind tunnel tests, and there is a lack of comprehensive studies on the dynamic similarity. Thus, using wind tunnel tests to design scaled models that demonstrate wake characteristics with a reasonable degree of similarity to those of the corresponding prototypes is important. Generally speaking, to ensure that the wake distribution of a small-scale model wind turbine, as measured by a wind tunnel experiment, reflects that of a full-scale wind turbine, the model must be accurately scaled and designed to comply with the similarity principle. For wind turbine blades, the real wake characteristics can only be simulated when the tip speed ratio and Reynolds number of the model are the same as those of the full-scale wind turbine. In wind tunnel tests, it is easy to meet the requirements of the blade tip speed ratio. The authors of [8] noted that if the blade tip speed ratio of the full-scale wind turbine is matched, the blade tip vortex of the wind turbine model presents the same spiral structure.
However, when the wind turbine rotates, the aerodynamic phenomenon of the blade depends on the Reynolds number of the flow. As it is usually limited by the scale ratio in a wind tunnel experiment, the Reynolds number of most scaled wind turbine models is generally in the range of Re ≈ 104. Researchers have demonstrated that the lift, drag, and stall behaviors of thick airfoils in wind turbines are highly sensitive when the Reynolds number is in the range of Re ≈ 104, while thick airfoils in geometrically similar models perform poorly in this low-Reynolds-number flow state, resulting in lower aerodynamic performance [9]. The Reynolds number of a full-scale wind turbine is 2~3 orders of magnitude higher. It is impossible to maintain the Reynolds number of a full-scale wind turbine in a wind tunnel experiment, because the high speed required to achieve Reynolds similarity would compromise the similarity of the blade tip speed ratio between the full-scale wind turbine and the scaled model.
The lift, drag, thrust, and torque are the main aerodynamic parameters of an airfoil and the key factors affecting the operation of a wind turbine. The authors of [10] showed that the wake expansion of a wind turbine model is related to the thrust coefficient. Scholars have also carried out research to determine the specific relationship between the thrust of a turbine model blade and the change in the Reynolds number. The authors of [11] developed a 1:50 scale model wind turbine to simulate the Froude number needed to analyze the overall motion and response of offshore floating wind turbines. The model used a flat-plate airfoil (naca-ag24 airfoil) with a low Reynolds number that was able to produce a thrust coefficient equivalent to that of the full-scale wind turbine, thus achieving the experimental purpose. Unfortunately, this study did not investigate the wake characteristics. In developing a wake model for a single wind turbine, the authors of [12] matched the thrust coefficient of a full-scale 2 MW wind turbine by adjusting the pitch angle of the blade with a low Reynolds number. It remains unclear whether a thrust coefficient as high as that of a large-scale wind turbine is suitable for a wind tunnel test. In a previous study, it was shown that, although the limitations of the wind tunnel experiment meant that the Reynolds number failed to match that of the full-scale turbine, the scaled model could reproduce the blade tip vortex, root vortex, and wake rotations observed in the wake development of the full-scale turbine [13]. The above research shows that, in order to reproduce the turbine wake in a wind tunnel, the Reynolds number similarity can be relaxed to some extent, as long as the thrust of the model wind turbine is consistent with that of the full-scale wind turbine.
In [14], it was suggested that, in contrast to the near wake region, the flow characteristics in the far wake region are greatly weakened by the aerodynamic characteristics of the wind turbine blades and are transformed into environmental turbulence, which plays a major role in the wake flow in this region. Generally, it is believed that there are three main turbulence sources in the far wake: atmospheric turbulence, caused by surface roughness and surface thermal convection; mechanical turbulence, caused by the wind turbine and tower; and wake turbulence, caused by tip vortex breaking. For instance, by comparing the particle image velocimetry (PIV) data of a scaled model with those of a full-scale turbine, one study came to the interesting conclusion that the velocity recovery rate in the far wake region mainly depends on atmospheric turbulence [15]. This conclusion was also confirmed by two experimental investigations [16,17]. It is commonly recognized that the higher the atmospheric turbulence intensity, the faster the wake velocity deficit recovery. The reason for this is that the mechanical turbulence caused by the nacelle and tower of the wind turbine is greatly weakened. This study will mainly focus on the effects of the oncoming flow conditions and the aerodynamic performance of the blade airfoil based on dynamic similarity.
For a large-scale wind turbine, the aerodynamic characteristics of an airfoil geometrically scaled from a high-Reynolds-number full-scale wind turbine airfoil are reduced in the wind tunnel test, resulting in a low Reynolds number, which causes the obvious differences in wake distribution between the scaled wind turbine model and the full-scale turbine. The purpose of this study was twofold: firstly, to clarify the influence of dynamic similarity on wake modeling using a scaled wind turbine in a wind tunnel test; and secondly, to confirm the necessity of achieving thrust similarity in a wind tunnel test of turbine wake characteristics. In this study, a wind turbine model with thrust-optimized blades was designed to mimic the thrust coefficient of a full-scale wind turbine by varying the blade airfoil, chord length, and twist angle. We elucidated the problem of the insufficient thrust of geometrically similar blades through experimental measurements and the analysis of aerodynamic principles. Additionally, the specific aerodynamic performance parameters that most substantially affected the wake characteristics were quantitatively identified. We carried out a systematic study to compare the differences in wake characteristics between the wind turbine model designed according to geometric similarity and motion similarity (i.e., all characteristic dimensions of the wind turbine model were consistent with the full-scale wind turbine) and the wind turbine model designed according to thrust similarity.

2. Experimental Setup

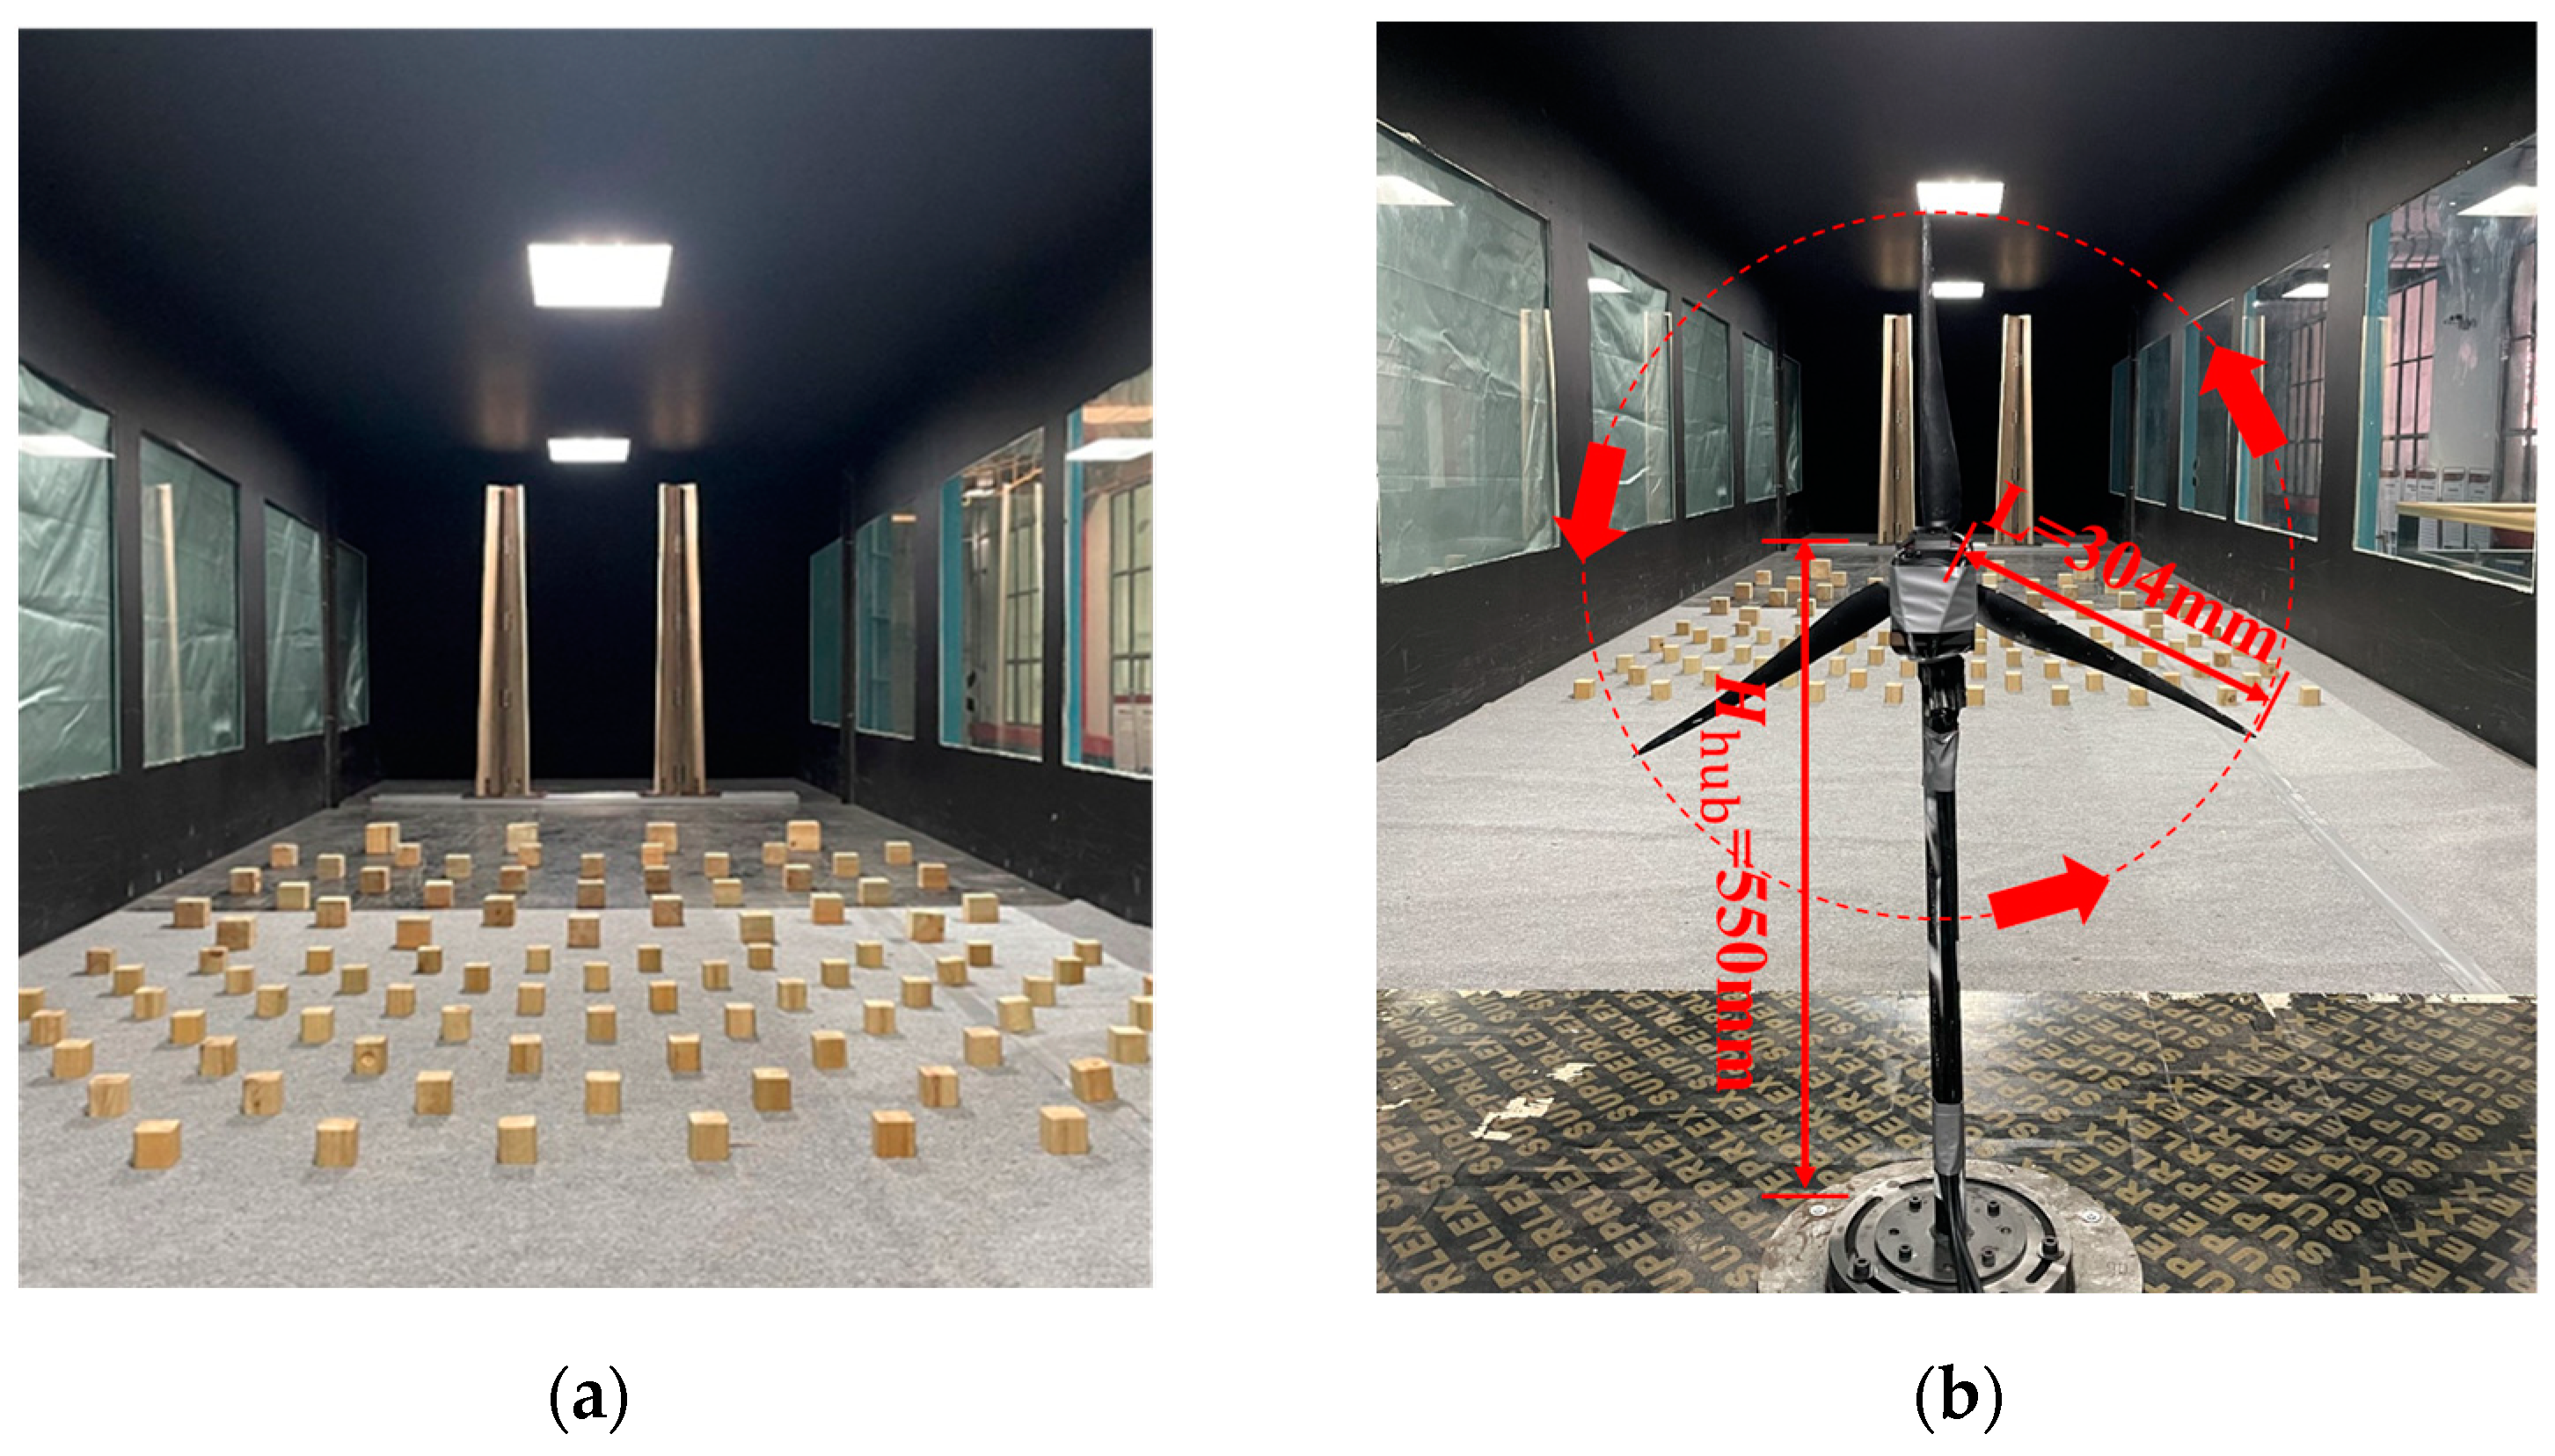
The experiment was conducted in the open-type wind tunnel laboratory of Chongqing University (CQU). The test area was 15.12 m (length) × 2.4 m (width) × 1.8 m (height), and the maximum wind speed of the wind tunnel was 35 m·s−1. Passive devices including baffles, spires, and roughness cells were implemented to generate the atmospheric boundary layer (ABL) flow, as shown in Figure 1a. The inflow conditions are shown in Table 1. The power law adopted for the upstream flow conditions was as follows:
u ¯ ( z ) u ¯ h u b = ( z z h u b ) α
where u ¯ h u b is the average wind speed at the hub height z h u b ; u ¯ ( z ) is the average wind speed at the height above ground z; and α is the exponential value of terrain exposure type A, stipulated in the wind load code of China. The experimental tests in this study were conducted to investigate the effects of the tip speed ratio and yaw angle on the aeromechanical performance and wake evolution of the wind turbine. The scale ratio of the wind turbine model was 1:250, it had a diameter of 608 mm (D) and a hub height of 550 mm ( H h u b ), and the rotor had three blades, as shown in Figure 1b. A comparison of the parameters between the scaled wind turbine model and the full-scale turbine is presented in Table 2. The model was installed in the center of the turntable, and its position was about 8 m downstream from the inlet of the test area. 
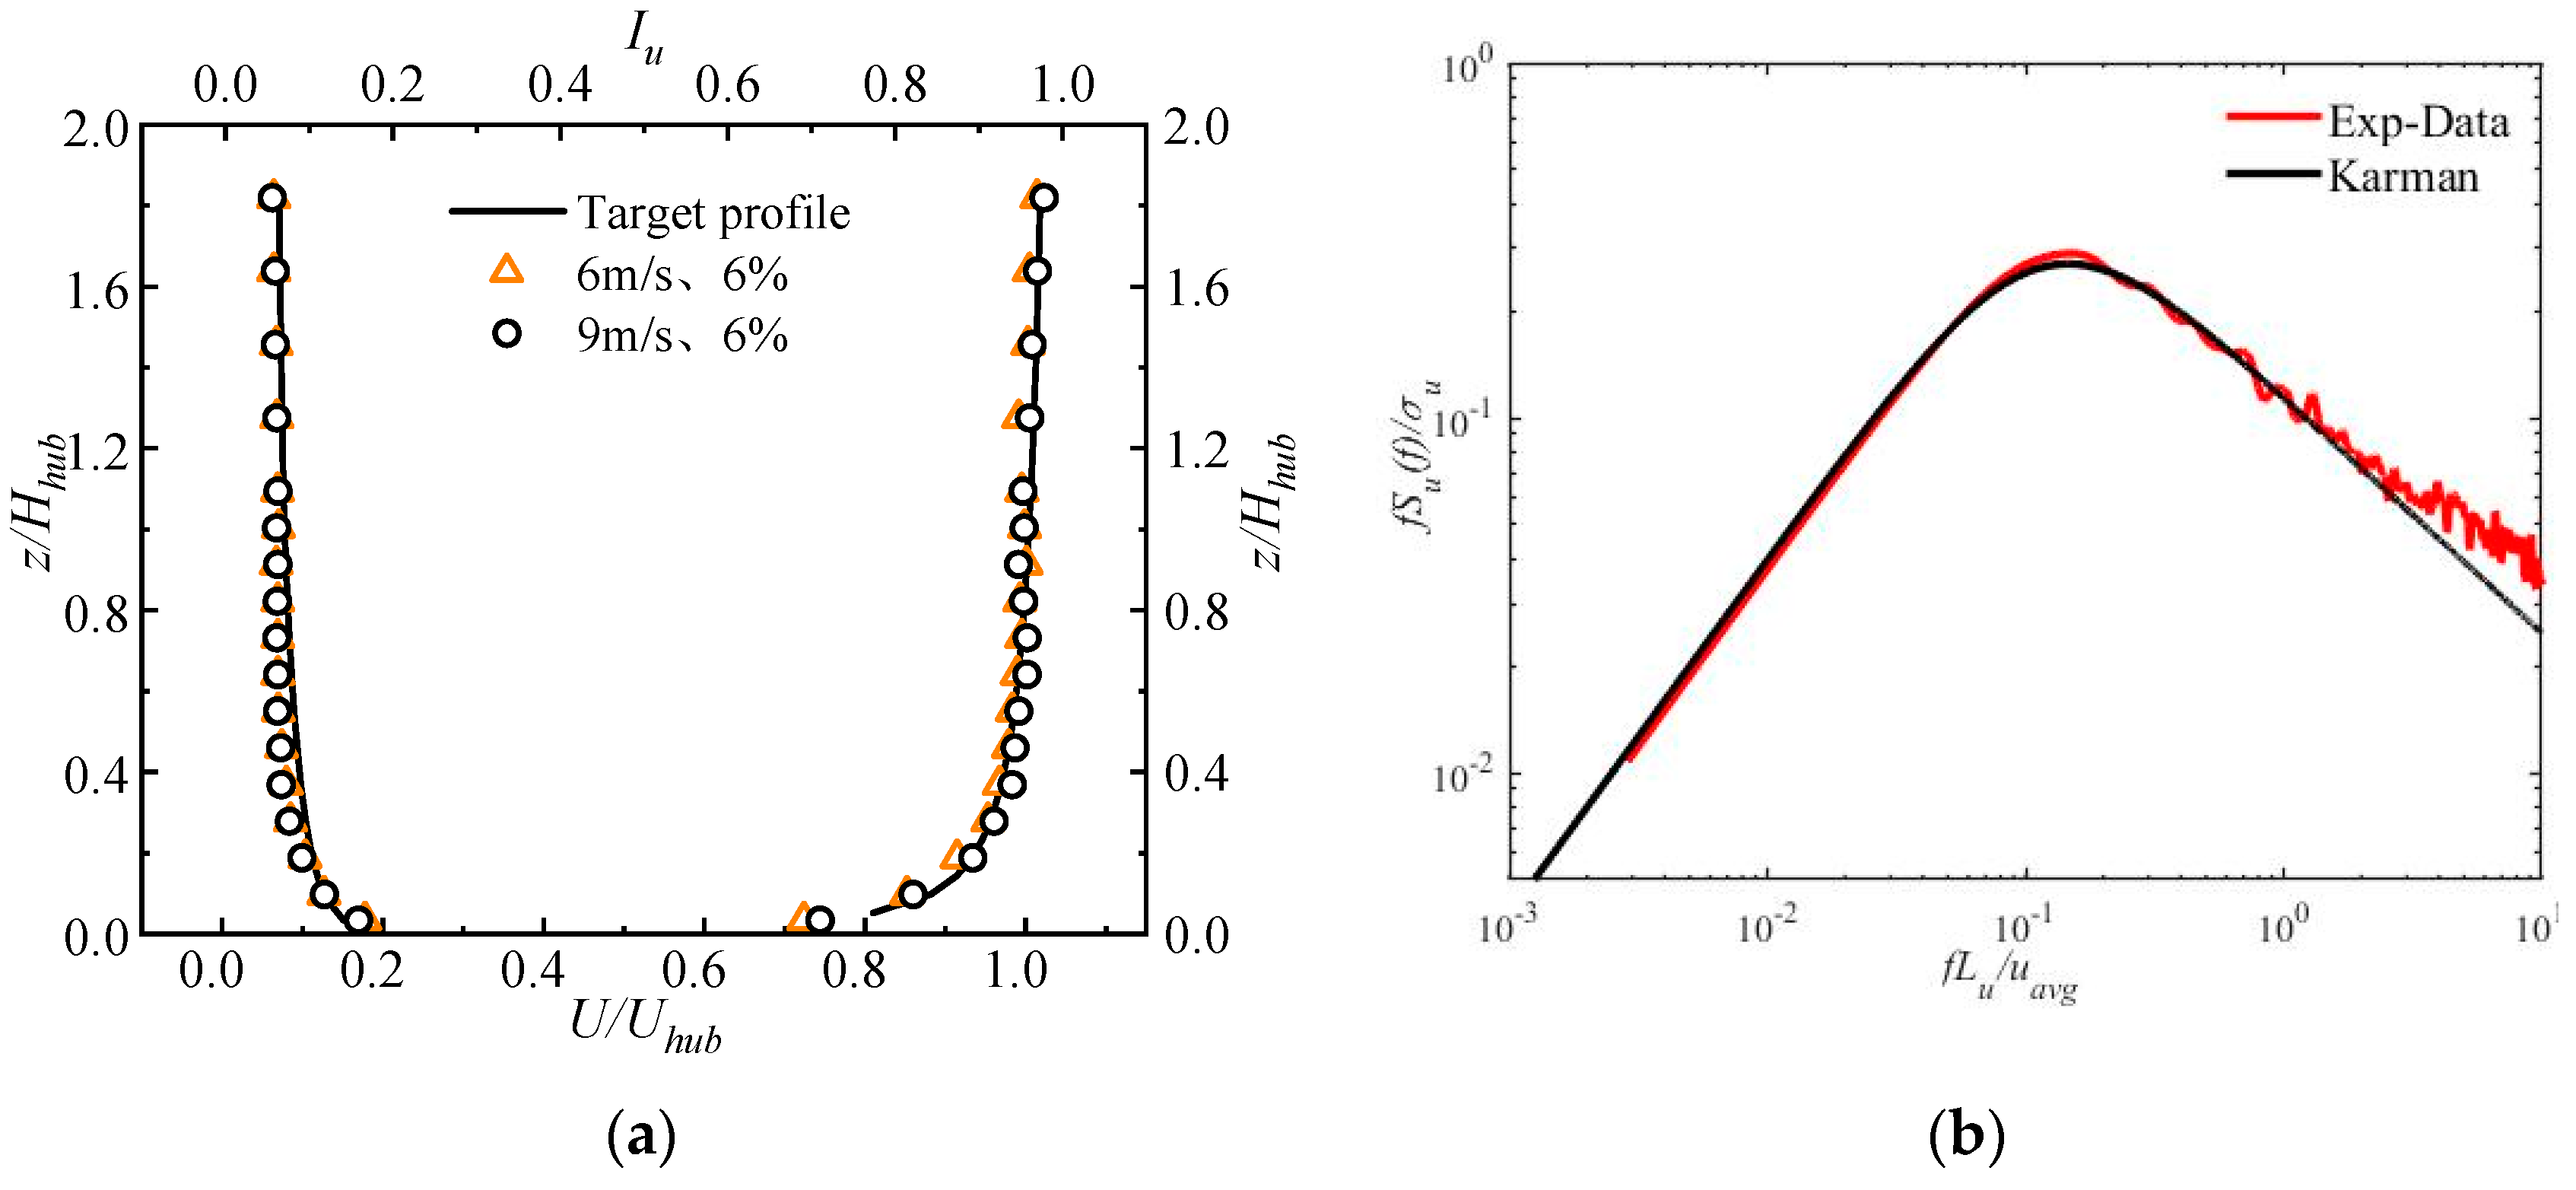
Figure 2 shows the profiles of the mean wind speed and turbulence intensity and the wind velocity spectrum simulated in the wind tunnel tests. Additionally, we measured the flow characteristics at the wind turbine model installation position (2D) and behind the wind turbine model (4D) to check the horizontal homogeneity of the upstream flows in the test region. The maximum deviation of these velocity profiles from the target ABL flow was no higher than 3%, demonstrating that the inflow had fully developed before reaching the wind turbine. Meanwhile, the blockage ratio of the wind turbine model in the wind tunnel test was about 4.47%. It has been found that when the blockage ratio of an experimental model is less than 10%, the wake expansion is similar to that in free flow [9]. Therefore, the influence of the side wall and ceiling of the wind tunnel on the wind turbine wake could be ignored when ensuring the full development of the wake in the test area.
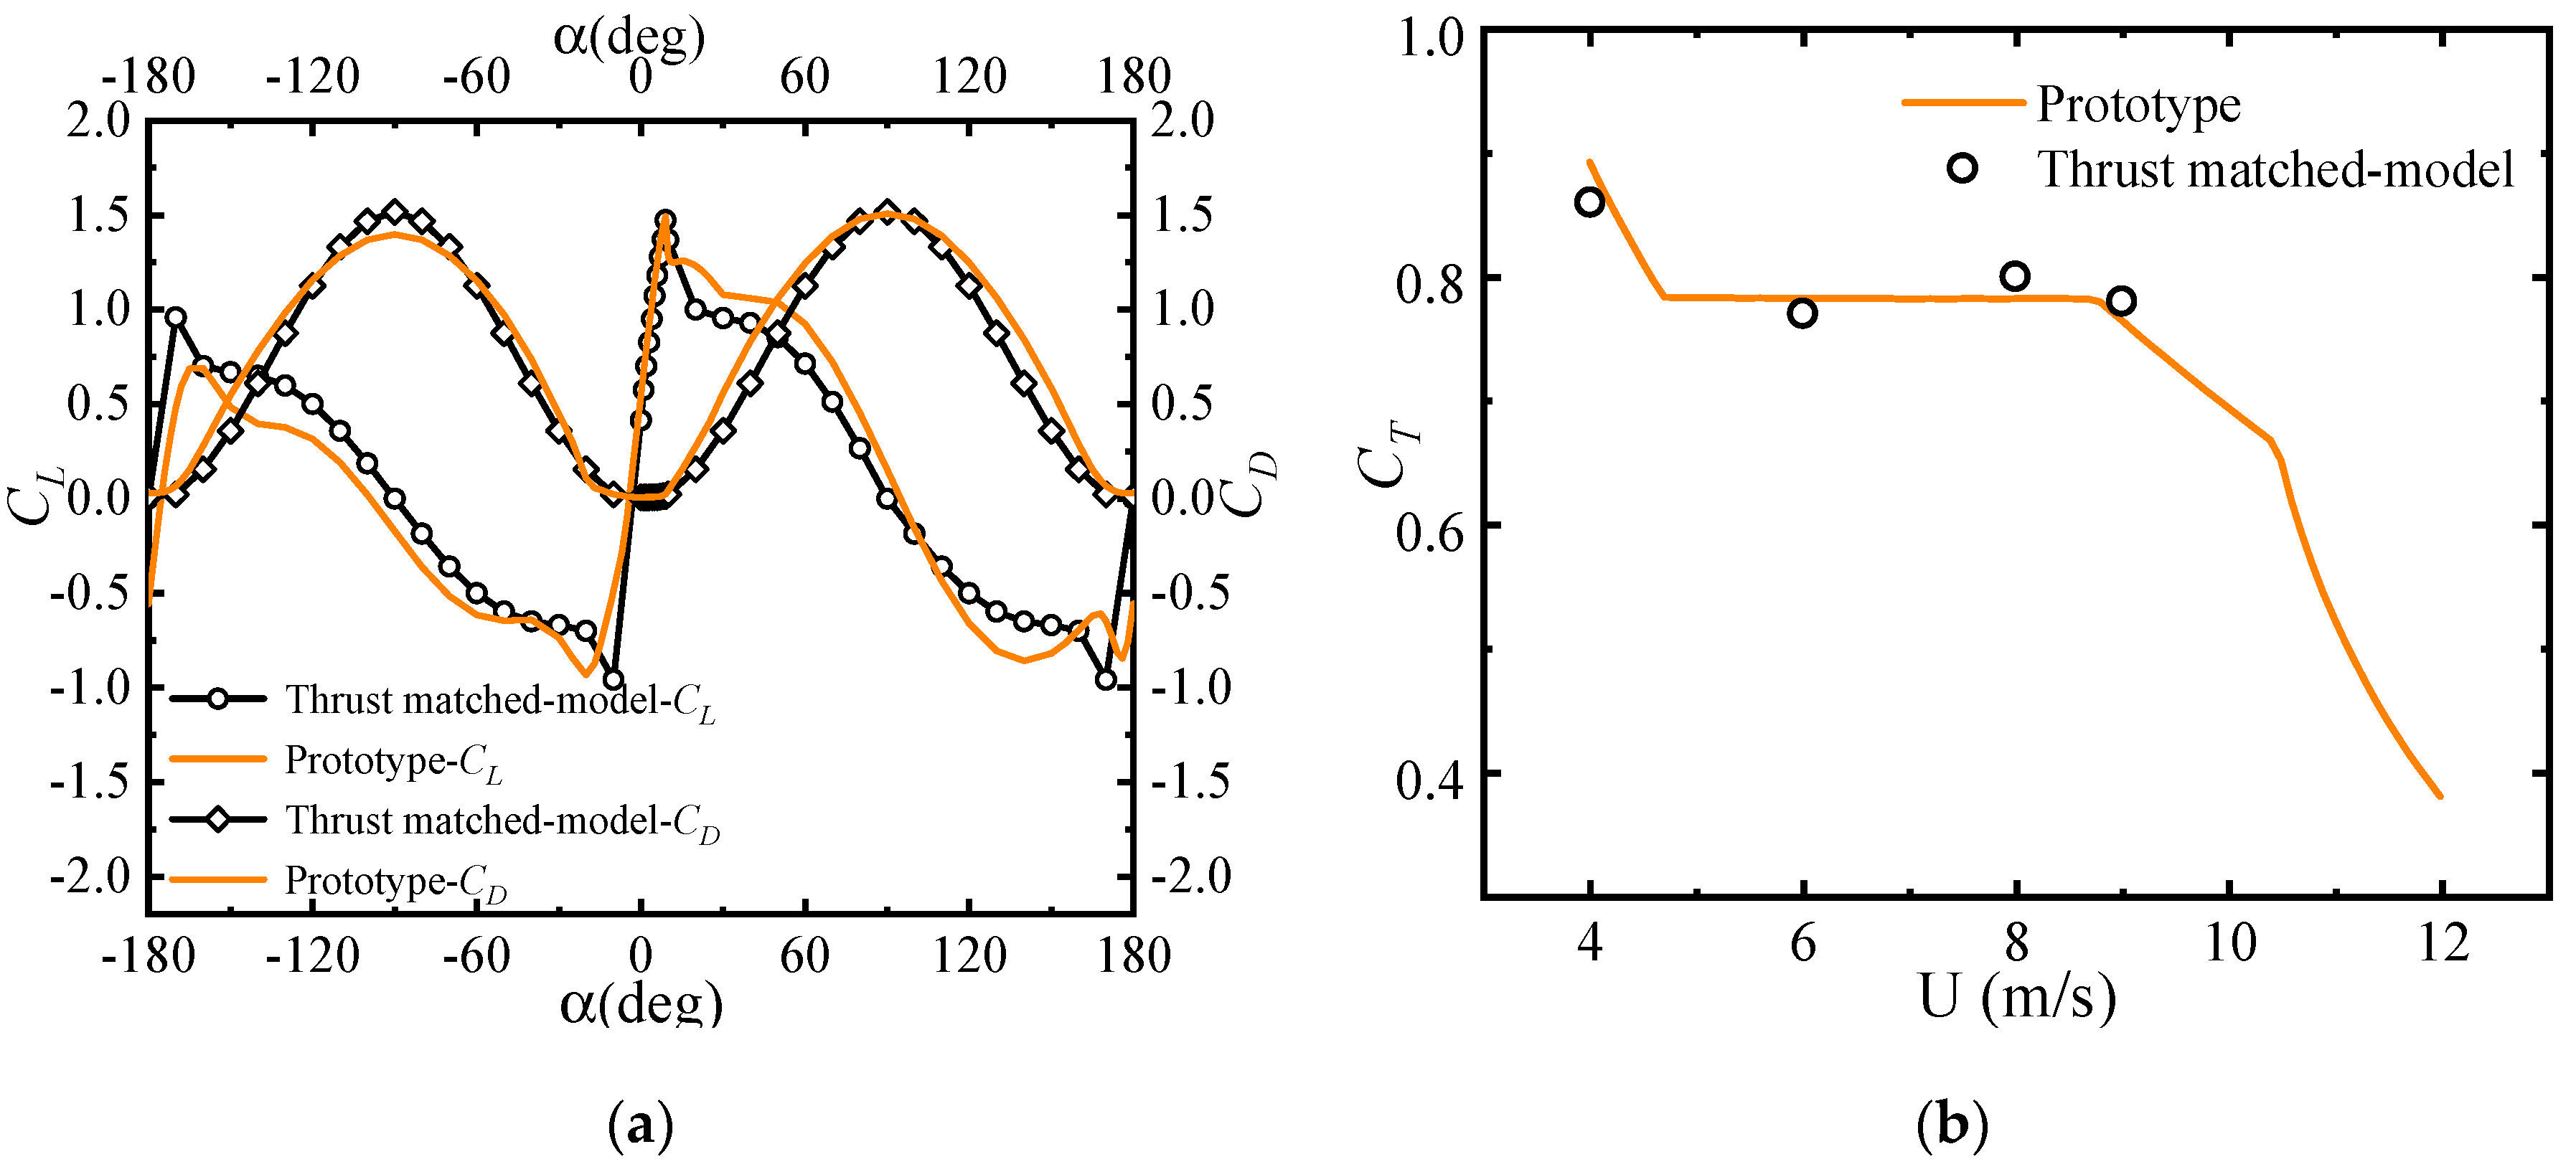
The geometrically similar wind turbine model was designed by directly scaling a working 5 MW wind turbine and maintaining strict geometric similarity, while the airfoil of the thrust-optimized wind turbine model was redesigned using the optimization methodology proposed in our previous research. The redesigned blade airfoils could appropriately mimic the thrust performance under low-Reynolds-number conditions. The geometric dimensions of the wind turbine tower and nacelle were similar to those of the prototype. Both types of blade were made of aluminum alloy by three-dimensional printing, and the surface was polished and painted to ensure smoothness. The rotational frequency of the turbine model was controlled by the servo motor placed inside the turbine nacelle to ensure kinematic similarity, which meant that the blade tip speed ratio ( λ = ω R / U h u b ) of the turbine model was consistent with that of the full-scale wind turbine. Under the incoming flow conditions of 6 m·s−1, as shown in Table 1, the rotary speed of the wind turbine was 1942 rpm, while under the incoming flow conditions of 9 m·s−1, the rotor speed of the wind turbine was 2835 rpm. The full-scale wind turbine usually operates at a blade tip speed ratio ranging from 6 to 8. Therefore, our model was designed to operate at the optimum tip speed ratio. The Reynolds number based on the blade tip velocity and chord length was defined by Equation (2). The total length of a 5 WM full-scale wind turbine blade is 73.5 m, and an airfoil with a thickness-to-chord ratio of 23.95 and radial lengths ranging from 23 m to 53 m is used. The airfoil Reynolds number (Rec) of the geometrically similar blades was 3.1 × 10⁴, while that of the thrust-optimized blades was 4 × 10⁴, revealing that the Reynolds number of the blade airfoil was two orders of magnitude lower than that of the full-scale wind turbine operating under atmospheric flow.
R e c = U t i p c ν
where U t i p is the tip velocity, c is the chord length, and ν is the kinematic viscosity of the air.
The tower of the wind turbine model was made of a stainless-steel tube to ensure its stiffness and stability under the high wind and rotary speeds. The model was almost rigid, so the influence of wind turbine vibration on the wake could be ignored. In the present study, a high-accuracy multi-axis force/torque sensor (ATI-DELTA) was mounted at the tower base of the wind turbine model to measure the dynamic wind loads acting on the wind turbine model. This sensor can provide instantaneous measurements of the aerodynamic forces and moment (torque) along all three axes. The measurement range of the ATI-DELTA multi-axis force/torque sensor is 165 N for x-axis forces and 15 N·m for torque, as shown in Table 3. During the experiments, the sampling rate of the wind load data was 1 kHz. For each test case, the sampling time was set to 60 s to obtain sufficient samples of thrust forces. The force/torque sensor was deliberately calibrated before the wind tunnel tests, and the accuracy of the load balance was verified within ±1%. The drag force of the tower was excluded from the measurements by separately testing the parked wind turbine model; thus, the net thrust forces acting on the swept area of the turbine blades could be deducted.
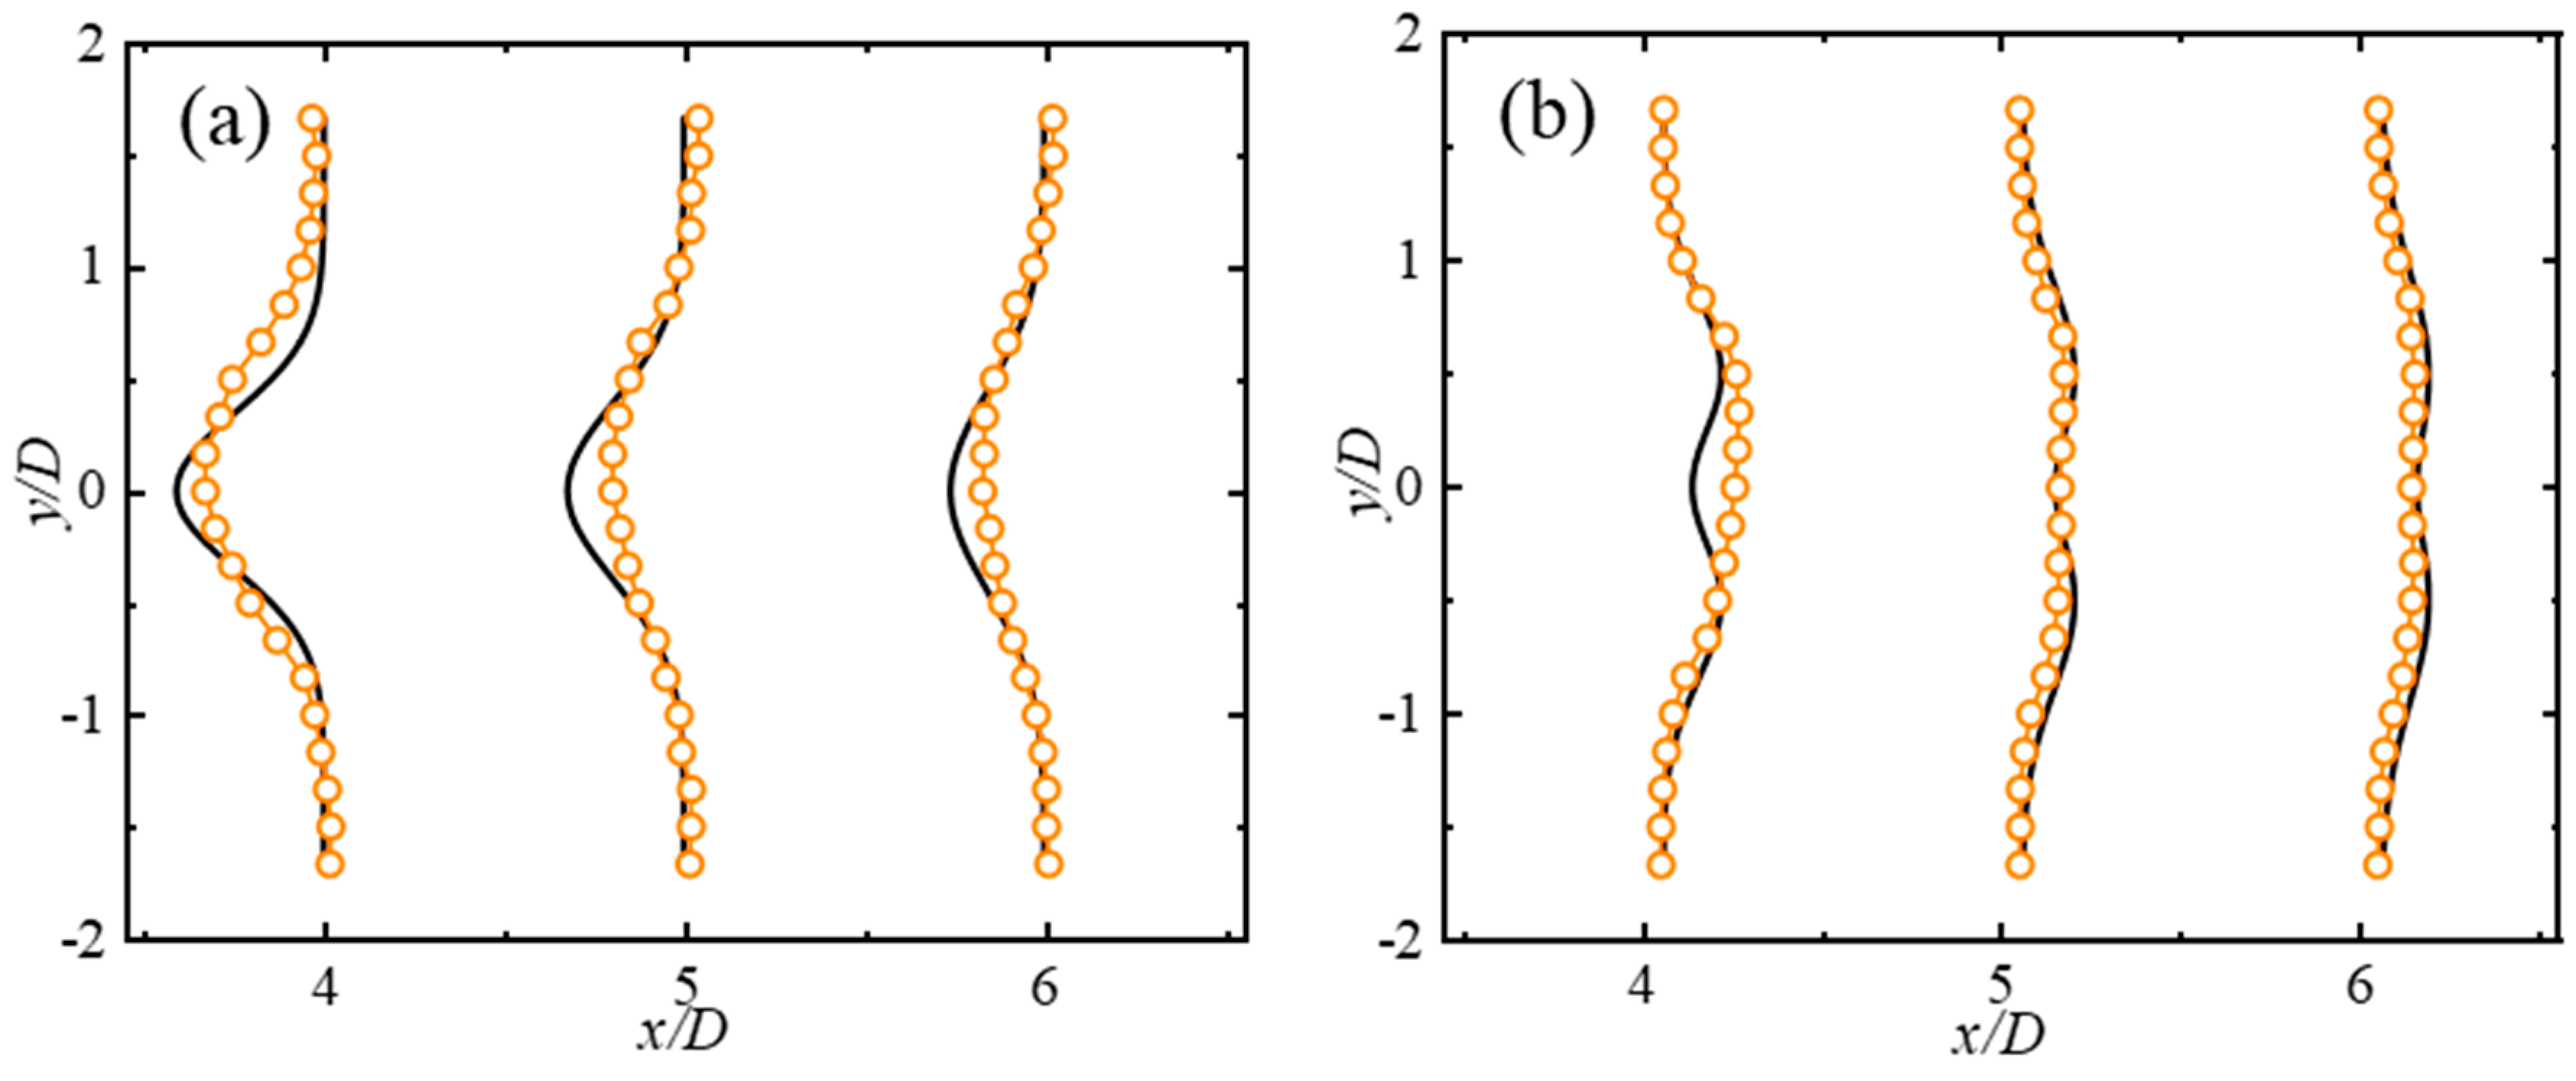
A TFI Cobra Probe anemometry system was installed in the three-dimensional traversing mechanism in the wind tunnel to measure the turbulence in the far wake regions 4D, 5D, and 6D behind the wind turbine model. The experimental setup is shown in Figure 3, in which the streamwise direction is the x-axis, the spanwise direction is the y-axis, and the vertical direction is the z-axis. By using this Cobra Probe, all three components of the velocity vector could be measured instantaneously. During the experiments, the maximum flow velocity measured in the wind tunnel was approximately 10 m·s−1. Both a pitot-static tube and a temperature probe were used to calibrate the inflow velocity at the hub height. The accuracies of all the other velocity values measured in the present study were within ±0.15 m·s−1. The sampling rate of the instantaneous velocity measurement was 500 Hz, with a sampling period of 60 s at each point of interest.

3. Theoretical Basis and Verification of the Dynamic Similarity

This section presents the similarity analysis of the scaled wind turbine model wake and the verification of the scaled wind turbine model’s dynamic similarity.

3.1. Similarity Analysis of Wake Characteristics of Scaled Wind Turbine Model

To further elucidate the differences in aerodynamic performance between the wind turbine model with geometrically similar scaled blades and the full-scale wind turbine blades, this section summarizes the basic similarity principles of wind tunnel tests for wind turbine wakes. It is generally believed that kinematic and dynamic similarity should be satisfied to reasonably reproduce wake characteristics. The tip speed ratio (λ) is usually kept the same as the corresponding full-scale turbine in terms of kinematic similarity, while it is quite challenging to resolve the inconsistency in the Reynolds number between a full-scale wind turbine and a scaled model, due to the limitations of wind tunnel test areas. Instead, the thrust force of the swept area of an operating wind turbine is the key factor, as it represents the relationship between the inflow characteristics and the rotor dynamic behaviors similar to the full-scale wind turbine. In this paper, the dynamic performance of the wind turbine is expressed by the thrust coefficient parameter, C T , which is defined as follows:
C T = T 1 2 ρ U 2 A D
The relationship between the force acting on the wind turbine and the momentum sink could be derived based on the non-rotating actuator disk theory of momentum conservation under one-dimensional steady flow. It is generally believed that the actuator disk causes the attenuation of the wind speed, and the speed of airflow changes by U U W   when passing through the swept area of a wind turbine. According to the theory of momentum conservation, the momentum sink of the flow is equal to the change in the wind speed multiplied by the mass flow rate, which is equal to the thrust acting on the wind turbine, as follows:
T = ( p D + p D )   A D = ( U W U ) ρ A D U ( 1 a )
The Bernoulli equation was used to obtain the relationship between the flow potential energy at inflow infinity and in front of the wind turbine, as well as the relationship between the air potential energy at wake infinity and behind the wind turbine, thereby obtaining the pressure difference before and after the wind turbine, as follows:
p D + p D = 1 2 ρ ( U 2 U W 2 )
By substituting Equation (4) into Equation (3), the relationship between wake velocity and incoming velocity could be obtained, as follows:
U W = U ( 1 2 a )
From this, C T = T 1 2 ρ U 2 A D = 2 ρ A D U 2 a ( 1 a ) 1 2 ρ U 2 A D = 4 a ( 1 a ) , a 1 2 ( 1 1 C T ) could be derived, and so Equation (5) could be simplified as follows:
U W U = 1 C T
where T is the thrust force received by the rotor, ρ is the air density, A D is the swept area of the rotor, U is the incoming flow velocity, U W is the wind speed of the distant wake, p D + is the static pressure in front of the wind rotor, p D is the static pressure behind the wind rotor, p is atmospheric pressure, and a is the axial induction factor.
In summary, C T is only related to the incoming flow velocity U and the wind speed at wake infinity U W . Therefore, the thrust coefficient is an important factor determining the development of the wake.

3.2. Experimental Verification of Thrust Forces of Scaled Wind Turbine Model

The thrust coefficients of the scaled wind tunnel models with geometrically scaled blades and thrust-optimized blades measured in the wind tunnel tests are shown in Figure 4. The thrust coefficient of the geometrically similar blades was only 35–40% of the full-scale targets under a low Reynolds number, resulting in significant deviations. The thrust forces acting on the blades resulted from aerodynamic lift and drag, which were caused by the pressure drop of the airflow through the blade. The lift coefficient and drag coefficient of the wind turbine blade airfoil are the key components of the airfoil section distributed lift F L and distributed drag F D . The blade of a 5 WM full-scale wind turbine adopts an airfoil with a thickness-to-chord ratio of 23.95 and a span ranging from 23 m to 53 m. The calculation of the lift and drag coefficient of the airfoil plays a key role in analyzing the main factors affecting the difference in aerodynamic performance between a geometrically similar scaled wind turbine model and a full-scale wind turbine, contributing to a better understanding of the reasons for the degradation in wind rotor performance. The calculation of the lift and drag coefficient relied on the simulation calculation method to analyze the parameter sensitivity of the airfoil for blade analysis and design. As shown in Figure 5, the lift coefficient of the thick airfoil under low-Reynolds-number operation was much smaller than that under high-Reynolds-number operation. It is worth mentioning that there is little difference in the drag coefficient between the conditions of two Reynolds numbers. This result is attributed to the fact that the lift coefficient of the thick airfoil with a high Reynolds number adopted by the full-scale blade was highly sensitive in the low-Reynolds-number operating environment, while the drag coefficient was not sensitive to the large change in Reynolds number, resulting in a reduction in the performance of the thick airfoil in the low-Reynolds-number operating environment. The overall performance difference was determined by the mismatch between the aerodynamic performance of the geometrically similar model wind turbine under the conditions of a low Reynolds number and the full-scale wind turbine. The above theoretical analysis explains the reason for the poor aerodynamic performance of the wind turbine in Figure 4.
A significant change in the Reynolds number had a significant impact on the performance of the wind turbine, which was realized by changing the airfoil lift coefficient C L and drag coefficient C D . However, it remained necessary to verify this theoretical analysis with experiments. The optimization algorithm was used to redesign and process the model blade. The lift and drag coefficient of the thrust-optimized blade were calculated by numerical simulation, as shown in Figure 5a. Good agreement was observed between the thrust-optimized model and the full-scale turbine in the pitch angle range of −10°~10°. The same scenario was reproduced in the laboratory, and the thrust coefficient test was conducted again to obtain experimental data for comparative analysis, as shown in Figure 5b. Under the conditions of a low Reynolds number, the thrust coefficient of the thrust-optimized blades reached the same level as the thrust coefficient of the full-scale turbine, and the error was no more than 5% when the wind speed was lower than 10 m·s−1.

4. Results and Discussion

Figure 6 shows the normalized average velocity profile (a) and turbulence intensity profile (b) of the geometric similarity model and thrust-optimized model at the hub height and the streamwise distance of x/D = 4, 5, and 6 for an inflow velocity of 6 m·s−1 and turbulence intensity of 6%. The results of the geometric similarity model and thrust-optimized model are represented by black dashed lines and orange dashed lines, respectively.

4.1. Comparison of Wake Characteristics between Geometrically Scaled Model and Thrust-Optimized Model

A quantitative experimental analysis of the wake flow development of the wind turbine model was carried out to verify the feasibility of the blade optimization method. As shown in Figure 6, the wake width of the geometrically similar model was much smaller than that of the thrust-optimized model, which could indicate that the wake expansion of the wind turbine model is associated with the thrust coefficients. This is consistent with the conclusion obtained by the authors of [10]. Even though the wake distribution profiles of the geometrically similar model in this study maintained favorable self-similarity in their patterns, the magnitude of the variation in the lateral mean velocity profiles at different streamwise positions remained insignificant. This indicates that the velocity deficit in the wake of the geometrically similar model required a longer distance to recover the freestream flow conditions. The reason attributed to this phenomenon is that the flow attachment of this airfoil was not in a similar state to that of the full-scale blade. This resulted in the low-Reynolds-number flow of a low-Reynolds-number field environment, leading to the lower turbulence and slower velocity recovery of the wake, due to the relatively large chord thickness of the geometrically similar blade. In contrast, the recovery of the velocity deficit in the wake of the thrust-optimized model was much faster, and it can be speculated that the formation, shedding, and breaking of non-constant vortices in the wake of the optimized blade model turbine had faster dissipation and earlier wake vortex breakup relative to the direct scale model. There was stronger turbulence intensity and greater mixing in the wake, which promoted the vertical transport of kinetic energy. This resulted in the entrainment of high-speed airflow from around the wake, and the kinetic energy recharging led to faster velocity recovery. These conditions were also confirmed in the lateral wake turbulence intensity profiles obtained at different locations downstream, where the geometrically similar model had significant shortcomings as compared to the thrust-optimized model in terms of turbulence intensity and influence range. In general, the wake distribution of the geometrically similar model differed significantly from the thrust-optimized model due to the smaller thrust coefficients, which were far from those of the target turbine. Accordingly, there was a significant difference between the lateral mean velocity profiles extracted at a further downstream location for these two cases.

4.2. Comparison of Wake Characteristics of Thrust-Optimized Model and Gaussian Model

Analytical models for wake flow are generally based on idealized assumptions and derived through experimental or theoretical analysis. This model has a more concise format, lowers the complexity of flow–rotor interaction, achieves a faster calculation speed, ensures a certain computational accuracy, and is widely used in engineering. The author of [12] proposed a Gaussian analytical model of wake flow considering the effects of ambient turbulence intensity, thrust coefficient, and yaw angle through numerical simulation studies. The Gaussian wake model predicts the wake deflection, velocity deficit, and net turbulence intensity of the wake in the far wake region, achieving good agreement with the numerical simulation results. The Gaussian wake model parameters are determined as a function of the ambient turbulence intensity and thrust coefficient, which makes the model applicable under various conditions. The authors compared the experimental data of the thrust-optimized model under no yaw angle with the normalized mean velocity profile and turbulence profile of the Gaussian wake model in the hub-height horizontal plane at different locations downwind, as shown in Figure 7. The normalized mean velocity profiles of the experimental data at different locations downwind displayed essentially similar trends to the Gaussian wake model, and the velocity deficit distribution of the wake showed good symmetry. The experimental data were consistent with Gaussian distribution and self-similarity. The authors of [18] pointed out that the wake generated by wind turbines presents a very complex vortex flow, which comprises various spatial and temporal scales of wake vortex structure. In addition to the periodic shedding of tip vortices and root vortices at the tip and root of the wind turbine blades, non-constant vortex structures were found to be generated on the upper and lower surfaces of the wind turbine nacelle that were similar to the shedding of von Karman vortex streets in the tower. It was found that the formation, shedding, and breaking of non-constant wake vortices were the main factors affecting the flow characteristics in the posterior near wake region of the wind turbine. It is noteworthy that the experimental data showed a difference in the peak velocity deficit between the wake profiles at different locations downwind and the Gaussian wake model. This is significant since the Gaussian wake model does not consider the effect of the nacelle and tower on wake development, resulting in a lower turbulence intensity in the analytical model relative to the real model and variations in the turbulence intensity profiles at different downstream locations in the thrust-optimized model flow direction. This phenomenon also occurred in the larger-scale vortices generated at the nacelle when separated from the fragmentation, which resulted in a stronger turbulence intensity in the near wake and faster velocity deficit recovery. However, this effect gradually dissolved into the background turbulence in the far wake region, and the normalized mean velocity profile and turbulence intensity profile gradually agreed with the developmental regularity of the Gaussian wake model.
The two-dimensional cross-section of the flow field data measured with the Cobra Probe shows the detailed physical characteristics of the wake in the vertical direction x–z, which reflects the contours of the wake of the nacelle and tower, the non-uniform velocity field, the turbulence intensity distribution, and the wake width. In the velocity contour plot in Figure 8 and the turbulence intensity contour plot in Figure 9, the black dashed line surrounds the area where the mean wind speed was equal to 95% of the freestream speed, indicating the wake boundary, and the white solid circle represents the center of the wake minimum wind speed, which was calculated by identifying the position of the minimum wind speed. By comparing the two-dimensional flow field cross-section of the experimental data with the contour plot of the spatial gradient distribution of the Gaussian wake model, it was found that the height of the center of the minimum wind speed for the wind turbine wake in the wind tunnel experiment gradually decreased with increasing distance, and the turbulence measurements showed a wake behavior similar with that of the velocity measurements. The above characteristics may be related to the slight inhomogeneity of the axial velocity distribution in the wind tunnel and the influence of the bottom wall. The effect of constraining and pulling down the wake was the main cause of the wake deformation, which was seen more clearly further downstream. In conclusion, the thrust-optimized model roughly matched the wake distribution range and velocity deficit magnitude in the far wake region of the Gaussian wake model.

4.3. Effects of Incoming Flows and Yaw Angles on the Wake Characteristics

The wake distributions under different inflow conditions were compared to verify whether the change in inflow wind speed had a significant impact on the wake distributions of the thrust-optimized model. Figure 10 shows the profiles of the horizontal normalized mean wind speed and turbulence intensity at several downstream positions of the wind turbine model. The average velocity profiles and turbulence intensity profiles extracted at different downstream locations of the flow direction were in good agreement, maintaining consistent self-similarity, wake recovery rate, and wake distribution range. This indicates that the variation in the inflow wind speed was not a key factor affecting the wake development.
Experiments investigating the wake characteristisc of a wind turbine model under yawed conditions are essential to establish and validate wake information. Under non-yawed conditions, only wake diffusion occurs, while under yawed conditions, both deflection and diffusion of the wake occur simultaneously. The wake behavior of wind turbines under yawed conditions in non-constant flow is not yet fully understood. This study elucidated the effect of the wake behavior of upstream wind turbines on the performance of downstream wind turbines. Figure 11 reflects the variation in the lateral normalized mean velocity profile according to downstream distance for the thrust-optimized model under the same inflow conditions. In comparison to the development of the wake that produced only axial flow for the 0° yaw angle, the wake under the 10°, 20°, and 30° yaw angles was significantly deflected, as was expected. With the increase in the yaw angle, the offset distance of the maximum velocity deficit gradually increased; the offset distance also gradually increased with the increase in the downstream distance. The lateral offset distance at position x = 6D under a 30° yaw angle was close to 0.7D. At this point, the center of the maximum wake deficit of the upstream wind turbine avoided the main windward side of the downstream wind turbine. Therefore, the wake effects of the upstream wind turbine under yawed conditions could be significantly mitigated for the downstream wind turbine, which significantly improved its power generation efficiency and fatigue lifetime. The wake deficit also recovered gradually with increasing downstream distance, but the recovery of the deficit rate during wake development was slightly slower compared to the non-yawed conditions. It should also be noted that the turbulence intensity distribution in the wake became asymmetric when the wind turbine was yawed. This resulted in asymmetric recovery rates on both sides of the wake, leading to an asymmetric wake velocity deficit profile in the wake spreading direction. These findings are similar to those in [19].

5. Conclusions

In this paper, the wake characteristics of geometrically similar and thrust-optimized models, designed by considering only geometrical similarity and motion similarity, respectively, were investigated in depth. Subsequently, we carried out further study of the wake characteristics of the thrust-optimized model. The major observations, results, and conclusions are listed below:
  • The thrust coefficient of the geometrically similar model was only 35%–40% of that of the full-scale wind turbine. The wake characteristics of the geometrically similar model differed significantly from the thrust-optimized model in terms of the normalized mean velocity deficit and the recovery rate. This indicates that obvious deviations in reproducing the wake characteristics of a full-scale wind turbine occur if only geometric and kinematic similarity are considered.
  • The wake distribution of the thrust-optimized model showed good agreement with the Gaussian wake model in the far wake region. Furthermore, it was found that the height of the center of the wake’s minimum velocity in the wind tunnel test decreased gradually with increasing downstream distance; a similar lowering of the wake center was observed for changes in the turbulence intensity. Furthermore, it is worth mentioning that the turbulence intensity distribution of the wake became asymmetric when the wind turbine was under yawed conditions. This led to an uneven recovery rate on both sides of the wake and an asymmetric wake velocity deficit profile in the spreading direction.
  • The normalized mean velocity profile and turbulence intensity profiles under the two inflow velocity conditions were identical, and the results for self-similarity, recovery rate, and wake distribution range were consistent. This indicates that the variation in the velocity of the inflow was not a key factor affecting the wake development.
  • Compared with the wake development under non-yawed conditions, the wakes under 10°, 20°, and 30° yaw angles were significantly deflected, as expected. The larger the yaw angle, the more obvious the deflection effect. The maximum lateral deflection distance downstream was close to 0.7D. The variation in the lateral normalized mean velocity profile according to the downstream distance for the thrust-optimized model under yawed conditions was verified.
The results of this study show that the problem of the mismatched performance between subscaled model blades and prototype blades was resolved. This experimental study combined theoretical analysis and experimental data in an attempt to solve the difficulties of aerodynamic evaluation in wind tunnel experiments involving geometrically similar models designed based on geometric and kinematic similarity with full-scale wind turbines. We revealed the mechanisms of the aerodynamic performance differences between geometrically similar models and full-scale wind turbines. Addtionally, we proposed a method for improving the aerodynamic performance of blades by using optimized airfoil shapes applicable to low-Reynolds-number conditions. The outcomes of this study could provide a useful reference and reasonable guidance for future wind tunnel tests of turbine wakes and supply the benchmark data for validating and verifying numerical simulations of wind turbine wakes.

Author Contributions

W.Y.: writing (review and editing), supervision, resources, project administration, funding acquisition; M.Y.: investigation, formal analysis, software, validation, visualization, writing (original draft), data curation; B.Y.: conceptualization, formal analysis, writing (review and editing), supervision, resources; G.H.: writing (review and editing), funding acquisition; Q.Y.: writing (review and editing), funding acquisition; T.H.: writing (review and editing); S.Z.: methodology; X.Z.: methodology, investigation; X.D.: writing (review and editing). All authors have read and agreed to the published version of the manuscript.

Funding

This research was funded by 111 Project of China (B18062), the Key Support Program of China for foreign experts (zcsf2021008), Fundamental Research Funds for the Central Universities 2022CDJQY-009, and Science and Technology R & D Project of Shandong Academy of Sciences (Contract Nos. 2020QN007).

Institutional Review Board Statement

Not applicable.

Informed Consent Statement

Not applicable.

Data Availability Statement

Not applicable.

Acknowledgments

The authors would like to acknowledge the financial support from 111 Project of China (B18062), the Key Support Program of China for foreign experts (zcsf2021008), Fundamental Research Funds for the Central Universities 2022CDJQY-009, and Science and Technology R & D Project of Shandong Academy of Sciences (Contract Nos. 2020QN007).

Conflicts of Interest

The authors declare no conflict of interest.

References

  1. Yang, X.; Howard, K.B.; Guala, M.; Sotiropoulos, F. Effects of a Three-Dimensional Hill on the Wake Characteristics of a Model Wind Turbine. Phys. Fluids 2015, 27, 25103. [Google Scholar] [CrossRef]
  2. Kozmar, H.; Allori, D.; Bartoli, G.; Borri, C. Complex Terrain Effects on Wake Characteristics of a Parked Wind Turbine. Eng. Struct. 2016, 110, 363–374. [Google Scholar] [CrossRef]
  3. Chamorro, L.P.; Porté-Agel, F. A Wind-Tunnel Investigation of Wind-Turbine Wakes: Boundary-Layer Turbulence Effects. Bound. Layer Meteorol. 2009, 132, 129–149. [Google Scholar] [CrossRef]
  4. Adaramola, M.; Krogstad, P.-Å. Experimental Investigation of Wake Effects on Wind Turbine Performance. Renew. Energy 2011, 36, 2078–2086. [Google Scholar] [CrossRef]
  5. Vermeer, L.J.; Sørensen, J.N.; Crespo, A. Wind Turbine Wake Aerodynamics. Prog. Aerosp. Sci. 2003, 39, 467–510. [Google Scholar]
  6. Zhang, W.; Markfort, C.D.; Porté-Agel, F. Wind-Turbine Wakes in a Convective Boundary Layer: A Wind-Tunnel Study. Bound. Layer Meteorol. 2013, 146, 161–179. [Google Scholar] [CrossRef]
  7. Tian, W.; Ozbay, A.; Hu, H. An Experimental Investigation on the Aeromechanics and Wake Interferences of Wind Turbines Sited Over Complex Terrain. J. Wind. Eng. Ind. Aerodyn. 2018, 172, 379–394. [Google Scholar] [CrossRef]
  8. Howard, K.B.; Hu, J.S.; Chamorro, L.P.; Guala, M. Characterizing the Response of a Wind Turbine Model Under Complex Inflow Conditions: Characterizing Wind Turbine Model Response to Complex Inflow. Wind. Energy 2015, 18, 729–743. [Google Scholar] [CrossRef]
  9. McTavish, S.; Feszty, D.; Nitzsche, F. An Experimental and Computational Assessment of Blockage Effects on Wind Turbine Wake Development. Wind. Energy 2014, 17, 1515–1529. [Google Scholar] [CrossRef]
  10. Haans, W.; Sant, T.; Van Kuik, G.; Van Bussel, G. Measurement of Tip Vortex Paths in the Wake of a HAWT Under Yawed Flow Conditions. J. Sol. Energy Eng. 2005, 127, 456–463. [Google Scholar] [CrossRef]
  11. Martin, H.R.; Kimball, R.W.; Viselli, A.M.; Goupee, A.J. Methodology for Wind/Wave Basin Testing of Floating Offshore Wind Turbines. J. Offshore Mech. Arct. Eng. 2014, 136, 20905. [Google Scholar] [CrossRef]
  12. Ishihara, T.; Qian, G. A New Gaussian-Based Analytical Wake Model for Wind Turbines Considering Ambient Turbulence Intensities and Thrust Coefficient Effects. J. Wind. Eng. Ind. Aerodyn. 2018, 177, 275–292. [Google Scholar] [CrossRef]
  13. Medici, D.; Alfredsson, P.H. Measurements on a Wind Turbine Wake: 3D Effects and Bluff Body Vortex Shedding. Wind Energy 2006, 9, 219–236. [Google Scholar] [CrossRef]
  14. Massouh, F.; Dobrev, I. Exploration of the Vortex Wake Behind of Wind Turbine Rotor. J. Phys. Conf. Ser. 2007, 75, 012036. [Google Scholar] [CrossRef]
  15. Whale, J.; Papadopoulos, K.H.; Anderson, C.G.; Helmis, C.G.; Skyner, D.J. A Study of the Near Wake Structure of a Wind Turbine Comparing Measurements from Laboratory and Full-Scale Experiments. Sol. Energy 1996, 56, 621–633. [Google Scholar] [CrossRef]
  16. Barthelmie, R.J.; Schepers, J.G.; Van Der Pijl, S.P.; Rathmann, O.; Frandsen, S.T.; Cabezón, D.; Politis, E.; John, P.; Rados, K.; Hansen Kurt, S.; et al. Flow and Wakes in Complex Terrain and Offshore: Model Development and Verification in UpWind. In Proceedings of the European Wind Energy Conference & Exhibition (EWEC 2007), Milan, Italy, 7–10 May 2007. [Google Scholar]
  17. Zhang, W.; Markfort, C.D.; Porté-Agel, F. Near-Wake Flow Structure Downwind of a Wind Turbine in a Turbulent Boundary Layer. Exp. Fluids 2012, 52, 1219–1235. [Google Scholar] [CrossRef]
  18. Tian, W.; Ozbay, A.; Hu, H. Effects of Incoming Surface Wind Conditions on the Wake Characteristics and Dynamic Wind Loads Acting on a Wind Turbine Model. Phys. Fluids 2014, 26, 125108. [Google Scholar] [CrossRef]
  19. Zong, H.; Porté-Agel, F. Experimental Investigation and Analytical Modelling of Active Yaw Control for Wind Farm Power Optimization. Renew. Energy 2021, 170, 1228–1244. [Google Scholar] [CrossRef]
Figure 1. Experimental setup of scaled wind turbine in the wind tunnel test: (a) photo of passive devices for ABL flows; (b) scaled model of the wind turbine.
Energies 15 06165 g001
Figure 2. Upstream atmospheric boundary layer flows simulated in the wind tunnel tests: (a) vertical profiles of normalized mean wind velocity; (b) wind velocity spectrum of U hub = 6 m/s.
Energies 15 06165 g002
Figure 3. (a) Schematic diagram of the experimental setup and measurements in the wind tunnel; (b) the layout of the measurement positions.
Energies 15 06165 g003aEnergies 15 06165 g003b
Figure 4. Comparisons of aerodynamic forces of scaled wind turbine models with geometrically scaled blades. (a) Thrust coefficient ( C T ) of the scaled wind turbine model; (b) lift coefficient ( C L ) and drag coefficient ( C D ) of the blade airfoil.
Energies 15 06165 g004
Figure 5. Comparisons of aerodynamic forces of scaled wind turbine models with the thrust-optimized blades. (a) Lift coefficient ( C L ) and drag coefficient ( C D ) of the blade airfoil; (b) thrust coefficient ( C T ) of the scaled wind turbine model.
Energies 15 06165 g005
Figure 6. Wake characteristics of the geometrically similar model and the thrust-optimized model at hub height (geometrically similar model—black solid lines; thrust-optimized model—orange dotted lines). (a) Normalized mean velocity profile; (b) turbulence intensity profile.
Energies 15 06165 g006
Figure 7. Wake characteristics of the thrust-optimized model and the Gaussian wake model at hub height (Gaussian wake model—black solid lines; thrust-optimized model—orange dotted lines). (a) Normalized mean velocity profile; (b) turbulence intensity profile.
Energies 15 06165 g007
Figure 8. Contours of normalized mean velocity of the Gaussian wake model and the thrust-optimized model for U06-Iu06-γ00-Opt case. (a,c,e) are Gaussian wake model at x/D = 4, 5, and 6, respectively; (b,d,f) are thrust-optimized model at x/D = 4, 5, and 6, respectively.
Energies 15 06165 g008
Figure 9. Contours of turbulence intensity of the Gaussian wake model and the thrust-optimized model for U06-Iu06-γ00-Opt case. (a,c,e) are Gaussian wake model at x/D = 4, 5, and 6, respectively; (b,d,f) are thrust-optimized model at x/D = 4, 5, and 6, respectively.
Energies 15 06165 g009
Figure 10. Comparison of the wake characteristics with different inflow velocities for U06-Iu06-γ00 and U09-Iu06-γ00 (U06-Iu06-γ00-Opt—orange dotted lines; U09-Iu06-γ00-Opt—black rhomb lines). (a) Normalized mean velocity profile; (b) turbulence intensity profile.
Energies 15 06165 g010
Figure 11. Comparisons of the wake characteristics with different yaw angles (U06-Iu06-γ00-Opt—orange dotted lines; U06-Iu06-γ10-Opt—red diamond dotted lines; U06-Iu06-γ20-Opt—blue star dotted lines; U06-Iu06-γ30-Opt—black rhomb lines). (a) Normalized mean velocity profile; (b) turbulence intensity profile.
Energies 15 06165 g011
Table 1. Experimental scenarios in this study.
Experiment CaseExponential Value U hub   ( m / s ) I u   ( % ) Model Blade TypeYaw Angle γ (°)
U06-Iu06-γ00-Geo0.061766Geometrically scaled model0
U06-Iu06-γ00-Opt0.061766Thrust-optimized scaled model0
U09-Iu06-γ00-Opt0.061796Thrust-optimized scaled model0
U06-Iu06-γ10-Opt0.061766Thrust-optimized scaled model10
U06-Iu06-γ20-Opt0.061766Thrust-optimized scaled model20
U06-Iu06-γ30-Opt0.061766Thrust-optimized scaled model30
Table 2. Comparison of design parameters between scaled and full-scale wind turbine.
PropertyFull-ScaleScaled Model
Rated power5 MW200 W
Optimal rotor speed7.77/11.34 rpm1942/2835 rpm
Rotor diameter152 m0.608 m
Tower height137.5 m0.55 m
Blade chord length4.187 m0.033 m
Table 3. The performance parameters of the measuring equipment.
DeviceRange AbilityAccuracyFrequency Response
ATI-DELTA Multi-Axis Force/Torque SensorFx0~165 N0.5%0~1500 Hz
Tx0~15 N·m0.5%0~1700 Hz
TFI Series 100 Cobra Probe2~40 m·s−1±0.15 m·s−10~2000 Hz
Publisher’s Note: MDPI stays neutral with regard to jurisdictional claims in published maps and institutional affiliations.

