Article

Fine-Tuning the Aeration Control for Energy-Efficient Operation in a Small Sewage Treatment Plant by Applying Biokinetic Modeling

Faculty of Water Science, University of Public Service, 6500 Baja, Hungary
Energies 2022, 15(17), 6113; https://doi.org/10.3390/en15176113
Submission received: 20 July 2022 / Revised: 10 August 2022 / Accepted: 19 August 2022 / Published: 23 August 2022

Abstract

:
Wastewater treatment is an energy-intensive process for treating liquid-phase pollutants in urban settlements. The aerobic processes of the biological treatment involve a significant air demand. An optimal control strategy could be used to minimize the amount of excess air entering the system due to safety factors applied in the design procedures. A plant-wide mechanistic modeling approach including an activated sludge model and one-dimensional settler model was proposed as an effective tool for predicting the actual air demand and for selecting the optimal aeration strategy. In this study, a sewage treatment plant receiving strong influent flow was investigated. At the sludge ages of 14–18 days, the plant was capable of achieving a 90% organic matter reduction and 85% nutrient reduction. By applying a constant dissolved oxygen concentration of 1.5 mg/L, the air demand decreased by 25%, which could be further increased by 10% if the cascade ammonium control approach was applied at peak periods. The dependence of the aeration energy demand on the temperature and dissolved oxygen was formulated, meaning the operators could select the optimal setpoint and minimize the energy consumption while the effluent quality requirements were met.

1. Introduction

Wastewater treatments remove pollutants from the liquid medium that are harmful to the environment by applying mechanical, chemical, and biological processes. The use of intensive technologies accelerates the degradation processes occurring in the environment, resulting in a smaller footprint and higher volume of treatment, but requiring an external energy input, which significantly increases the operating costs. A key element of sustainable urban water management is to strive for energy minimization, which basically refers to reducing the energy demand or recovering energy via technological processes [1]. The efficiency of the wastewater treatment processes should be considered in relation to the energy used; however, an increase in energy efficiency should not be at the expense of the pollutant removal efficiency [2]. The trade-off between the energy use and treatment efficiency can be achieved by means of a life cycle assessment [3]. Performance indicators have to be introduced to quantify the energy efficiency; some examples are mentioned by Di Fraia et al. (2018), e.g., the overall energy consumption compared to the volume of treated wastewater or to the amount of degraded organic matter measured via the chemical oxygen demand (COD) [4].
The energy consumption can be direct (e.g., blower, pump energy demand) or indirect (e.g., energy used on production of chemicals used), and the offset is the energy produced during the treatment [5]. Energy-neutral plants could be achieved via the utilization of wastewater as an energy resource [6], but to date there are still many challenges to constructing self-sufficient sewage treatment plants (STPs), particularly in developing countries [7]. Kollman et al. (2017) went further and proposed that STPs could provide local available renewable sources of energy for public energy distribution grids to meet external consumption demands [8]. In most cases, however, it is a significant step forward to reduce the energy used, especially in small-capacity plants where the unit cost of the treatment is higher. The present research is also concerned with the energy-efficiency-based operation optimization of small-capacity STPs, for which there are several attempts in the literature.
A comparative study of more than 100 STPs confirmed that the operating costs and energy consumption increase as the plant size decreases. The difference in energy consumption between small and large plants is mainly due to the type of sludge stabilization process [9]. This finding is supported by a study of STPs in Slovakia, which examined 51 large- and 17 small-capacity treatment plants. The average energy consumption of the large plants was 0.485 kWh/m3, while the average energy consumption of the small plants was 0.915 kWh/m3 [10].
When large amounts of storage are available, load-shifting can be an effective means of meeting the backup energy demands. The peak loads can be stored and the energy consumption of the mechanical equipment can be minimized via the intermittent operation of the pumps. However, the use of a storage tank can increase the capital and operating expenditures [11]. For example, if advanced treatment processes are targeted, the cumulative energy demands for the activated carbon used as an adsorbent can significantly exceed the energy demands of the STP [12].
Figure 1 summarizes the energy reduction possibilities in STPs. One direction is recovery through anaerobic digestion or other heat-generating waste products [13]. Not all of the digesters operate at full capacity all the time, meaning the implementation of flexible co-substrate dosages could enhance the efficiency, but it could also deteriorate the side-stream quality of the sludge [14]. The digestion process can decrease the cumulative energy demands by 13–26% [15]; however, the potential for thermal energy is much higher than for chemical energy [16].
The optimization of the air demands can be achieved in several ways, as Figure 1 shows: (i) by reducing the overall biological oxygen demand; (ii) by improving the factors affecting oxygen delivery; or (iii) by manipulating the air supply in time and space.
The aeration of aerobic reactors enhances the oxidation process, but also affects the sedimentation characteristics of the flocs [17] and the hydrodynamics [18]. This implies that in addition to the biological air demands, the air volume required for the reactor mixing and suspension of flocs must also be provided in activated sludge systems and the operation of such reactors cannot be based solely on the stoichiometric ratios.
Compared to conventional nitrification–denitrification processes (e.g., the Sharon–Anammox process [19]), shorter conversion pathways could be used to reduce the total biological oxygen demands. The oxygen transport between the gas and liquid phases can be described by the so-called alpha factor, which represents the difference in oxygen diffusion between the effluent and the clean water. This parameter is often treated as a constant within the reactor, but its value depends on the local conditions (e.g., suspended solids, volatile fatty acids, COD), meaning its evolution along the reactor must be modeled dynamically [20] and complemented by oxygen-off-gas calculations [21]. The efficiency of the oxygen transfer also depends on a number of other factors, such as the density and locations of the diffusers and the residence time of the air bubbles.
The calculation of the actual oxygen demands for use during operation is quite complex and requires numerical methods. Biokinetic modeling for wastewater treatments is a predictive tool used to forecast the treatment efficiency under various conditions. A calibrated model can ensure that the numerical results are in good accordance with the full-scale plant data. The mathematical models developed for activated sludge (ASM—activated sludge model) are numerous, but these differ only in the number of processes and variables to be considered [22,23,24]. In wastewater treatment, control strategies are designed to provide the energy or chemicals needed for the treatment in a way that avoids the over- or under-use of energy resources. The control system is based on the collection of data on the current state of the system. The control logic calculates and minimizes the error between the actual state and the setpoint. In aeration control, the most common process is the control of the DO (dissolved oxygen concentration), since the DO can be easily measured using sensors and gives the status of the reactor’s oxygenation. The control of the DO with a variable-frequency drive (VFD) can reduce the electrical energy consumption during aeration by two-thirds [25] compared to a preset constant airflow, which can satisfy the peak aeration demands. Increasing the DO beyond a certain value does not provide any added benefit, meaning the excess air becomes redundant. In an activated system, this value is around 2.0–2.5 mg/L, while in biofilm systems it is 5–6 mg/L. The explanation for the increased DO in the attached growth system is that the solute is transported between the liquid and solid phases [26].
The ammonium-based feedback control approach detects the concentration of ammonium in the aerobic zone and controls the airflow via a VFD [27], or when used in cascade control provides feedback to the DO setpoint, which then controls the airflow. The feed-forward volume control approach is more effective in dealing with the NH4-N peak inflow than feedback control, which may be slower to respond in such a situation [28]. In wastewater aeration, ON/OFF control can be used to switch between aerobic, anoxic, and anaerobic conditions within the basin, which is important to control the activity levels of certain microorganisms and the degradation processes. When the nitrate concentration reaches a certain value, the aeration can be switched off and denitrification could develop [29], ensuring the high rate of nitrogen removal, since the gaseous end-product is released from the liquid phase. Pulse and intermittent aeration is a subtype of ON/OFF aeration control where predetermined time intervals are responsible for the oxygen supply, which can also control the partial nitrification [30].
Several aeration control strategies have been outlined, the choice of which should be made on the basis of the treatment plant, the characteristics of the raw effluent, and the process parameters. The site-specific decisions are made by the operators, mainly on a trial-and-error basis. The objective of this study is to investigate the possible aeration control strategies in small-capacity sewage treatment plants receiving high and uneven loads. The aim is to select and fine-tune the most energy-efficient aeration strategy. In order to achieve the research goal, a small wastewater treatment plant is selected and the potential for energy reduction is calculated by applying numerical models. The specialty of the study is the strong incoming unequalized wastewater coming to a small site, which has not been in focus of other mainstream research studies.

2. Materials and Methods

2.1. Site Layout

The selected site situated in the center region of the Great Plain, Hungary, has an average capacity of 4700 m3/d and receives a peak hourly flow of 1.8, resulting in a hourly maximum flow of 353 m3/h without equalization capacity. The plant is capable of biological nutrient removal, consisting of a mechanical treatment with screening, grit removal, and a primary treatment, followed by an activated sludge system using a modified Ludzack–Ettinger (MLE) reactor layout [31]. The volume of the biological reactor is 2500 m3, of which 40% is the anoxic zone and 60% is the aerobic zone. There is internal recirculation from the aerobic zone to the anoxic zone to transfer soluble nitrate for denitrification. The flow rate is three times the influent flow rate. The biological basin is followed by the final clarifier, from which most of the settled sludge is returned to the anoxic zone at a sludge flow rate equal to the influent flow. This recirculation maintains the required biomass concentration of 3.0–4.5 g/L in the basin. The wasted sludge from the secondary clarifier controls the desired SRT and the flow is transferred to the sludge treatment area, which consists of sludge thickening and dewatering. The nutrient-rich reject water is recirculated upstream of the primary clarifier.
The process units of the virtualized plant and the fluid flows connecting them are shown in Figure 2. The activated sludge reactor consisted of 4 compartments and the first reactor received the primary effluent. Figure 2 does not show the internal recirculation area, but it existed between reactor compartment Nr. 4 and reactor compartment Nr. 1. In line with the research objective, this plant configuration included the elements necessary to study the aeration efficiency, and 12″ fine bubble disc diffusers were installed at 4.8 m depth of the biological basin with a diffuser density of 0.23. The pre-mechanical treatment only slightly altered the components under investigation and could have, therefore, been omitted from the layout. In contrast, the sludge flow calculation needed to be taken into account due to the recycled leachate. The primary clarifier had a surface area of 120 m2 and the secondary clarifier had a surface area of 200 m2, while both clarifiers had a depth of 4.0 m. The solid capture of the gravity thickener was 0.9 and that of the mechanical dewatering 0.95, which meant that 10% and 5% of the solids, respectively, were not separated and returned to the head of the waterline.

2.2. Model Concept

The ASM2D biokinetic model was selected in this paper, since it describes biological phosphorous removal with simultaneous nitrification–denitrification in activated sludge systems [32]. It included heterotrophic, nitrifying, and phosphate-accumulating biomasses and processes involving hydrolysis, biomass growth, and decay, as well as phosphorous accumulation. Basically, the zero-dimensional convective and non-diffusive transport equation were extended with kinetic terms [33] and solved for all model components as follows:
V d C d t = Q ( C i n C ) + r
where: V is the reactor volume (m3); C is the concentration of the process variable (g/m3); Q is the influent flow rate (m3/s); Cin is the concentration of the process variable entering the reactor (g/m3); r is the reaction rate (g/s).
This form of equation assumes that the wastewater component entering the reactor is perfectly mixed with the matter in the reactor. The longitudinal variation within the reactor can, therefore, be accounted for by several reactors connected in series. This is referred to as the tank-in-series model. Equation (1) was solved for all process variables introduced in ASM2D.
The transport equation for the DO was extended with the oxygen transfer between the gas and liquid phases as follows [33]:
V d D O d t = Q ( D O i n D O ) + K L a ( D O s a t D O ) V + r
where: DO is the concentration of dissolved oxygen (g/m3); DOsat is the DO saturation concentration in field conditions; KLa is the oxygen mass transfer coefficient in field conditions (1/s).
The reaction rate in Equation (2) refers to the biomass respiration rate and the oxygen required for substrate oxidation.
The correction factors for the temperature, diffuser fouling, and effluent characteristics were introduced to calculate the oxygen mass transfer. The alpha factor (α) is the ratio of the oxygen diffusion measured in the effluent to that measured in the clean water. The alpha correlates with the particulate matter in the incoming wastewater. Taking into account the trade-off between numerical accuracy and simulation speed, the Runge–Kutta–Fehlberg 2 numerical scheme was used [34]. The GPS-X 7.0 simulation environment published by Hydromantis was applied for the calculations.
In the first step of the simulation process, the plant units and their interconnections with the wastewater treatment plant were represented virtually. The next step was to determine the fractionation of the raw wastewater from the measured data [35]. Then, the calibration of the model parameters was performed, which was a systematic, multi-step process. Several guidelines and protocols have been published [36,37,38], and in this research the widely accepted plant-wide IWA Good Modeling Practice Unified Protocol [39] was followed. The sequence for fine-tuning the model parameters involved the (i) hydrodynamics (the determination of the number of fully mixed zones), (ii) sludge retention time (SRT), sludge production, (iii) sludge settling characteristics, (iv) aeration, and (v) biokinetics. The sedimentation in the clarifiers was modeled using the double-exponential sedimentation model developed by Takács (1992), a one-dimensional approach that separates the hindered and flocculent sedimentation zones [40]. The simulation setups are summarized in Table 1.

2.3. Data Reconciliation and Processing

Data on the raw and treated wastewater quality were collected twice a week for a year. The components measured were the COD, biological oxygen demand (BOD5), total suspended solids (TSS), ammonium nitrogen (NH4-N), total nitrogen (TN), total phosphorus (TP), and alkalinity. Outliers were removed as part of the sanity check and the plausibility of the data was tested by generating BOD5/COD and NH4-N/TN ratios. After the measured data were reconciled, the model input data were generated using a wastewater characterization procedure [35]. The COD-based fractionation resulted in the estimation of soluble (readily biodegradable, inert) and particulate (slowly biodegradable, inert) fractions by fine-tuning the fraction ratios to match the measured BOD5 and TSS values. The flow discharge and temperature sensor data were analyzed, and after a sanity check, daily average data series were generated, followed by an analysis of the daily flow fluctuations; the hourly peak values were determined and compared with the daily average flow values.

2.4. Simulation Scenarios

Dynamic runs were performed with the calibrated model, which took into account the daily fluctuations of the wastewater arriving at the STP. The following aeration control strategies were simulated:
  • No control: A constant airflow was set to cover the air demand during the peak periods;
  • DO control: A constant DO was set to cover the air demand during the peak periods;
  • Cascade control: The DO setpoint was adjusted based on the incoming ammonium load, which manipulates the blower via the VFD. The DO adjustment sequence was the simulation output.
The air demand and associated energy demand were compared in each case. A sensitivity analysis was performed on the alpha factor, which captures the effects of changes in effluent quality on the aeration. Since the air demand is highly dependent on the wastewater temperature, three temperatures were considered in each case, representing the average effluent temperatures for the winter (12 °C), spring or autumn (18 °C), and summer (24 °C) periods. From the air demand, the power delivered by the blowers was calculated using the adiabatic compression equation [41]. The power output at each time step was divided by the total efficiency of the plant, then the cumulative daily energy consumption was calculated and normalized by the volume of treated effluent. This resulted in a ratio that could be easily compared with different calculation scenarios and was independent of the size of the STP.

3. Results and Discussion

3.1. Plant Performance Results

3.1.1. Field Data Analysis

An analysis of the measured wastewater quality showed that due to the reduced household water consumption, the raw influent water was more concentrated than the world average; a typical value for the COD in untreated wastewater is 430 mg/L, whereas the TN is 40 mg/L and TP is 7 mg/L [33]. High variability was observed for both the organic matter indicators (COD, BOD5) and nutrients. The alkalinity was also high (200 mg/L is the world average [33]) due to the high ion concentration in the aquifers and was assumed to be sufficient for nitrification. Table 2 shows site-specific data for the influent and effluent, confirming that the full-scale plant is capable of efficient organic matter removal, full nitrification, and enhanced biological phosphorus removal. The average treatment efficiency values were calculated from the averaged measured effluent and influent data and demonstrated that the STP investigated here has high treatment efficiency rates of more than 90% for organic removal and around 85% for nutrient removal.
The plant process parameters collected from the field showed that the concentrations of mixed-liquor-suspended solid (MLSS) in the biological reactor were 4.2 g/L in winter and 3.6 g/L in summer. The associated SRT values were 18 d and 14 d, respectively, allowing for complete nitrification and sufficient denitrification in the reactor. The wasted sludge flow rates varied between 78 and 112 m3/d, with a dry solids content range of 0.62–0.8%. The sludge volume index values ranged from 128 to 145 mL/g, indicating good settling properties.

3.1.2. Model Calibration and Verification

Firstly, the influent raw wastewater fractionation was carried out and then steady-state simulations were performed to match the measured field data to the numerical results. A summary of the calibrated parameters is shown in Table 3.
The results of the calibration showed that 43% of the COD was a soluble fraction, 57% was a particulate fraction, 3% of the total COD was an inert soluble fraction, and 15% was an inert particulate fraction, which is in line with the literature data for municipal wastewater [33]. The relatively high biodegradability of the organic components was in favor of the biological treatment stage. The majority of the particulate fraction could be removed via sedimentation and there was no need to use coagulants to precipitate the soluble fraction, since its concentration was low (3% of the total COD).
Regarding the calibration of the biokinetic parameters, two main groups of microorganisms (heterotrophic and autotrophic) were selected. The heterotrophic biomass yield and ammonia oxidizer yield were adjusted to obtain a good agreement between the measured and modeled treated effluent quality. The results can be seen in Table 3; all parameters reflect how much biomass could be built from the incoming substrate. As the result of the fine-tuning of the process performance parameters, the volumetric organic loading rate and the F/M (food-to-microorganism) ratio indicated optimal microorganism activity and that the system was not under- nor uploaded [33].
Table 4 shows the simulated effluent values, which correlated well with the full plant size data. The variation in the influent was also observed via the fluctuations in effluent quality. The parameters responsible for the organic content of the wastewater (COD, BOD5, TSS) showed a high rate of treatment, with the removal of the COD being slightly overpredicted, whereas the removal rates for the BOD5 and TSS were underpredicted. This could be the improved by fine-tuning the sedimentation model. The goodness of the TSS prediction is a function of the influent flow, influent load, influent fractionation, and sedimentation. The removal of nitrogen depends on a number of factors (e.g., the anoxic/oxic volume ratio, DO, readily biodegradable fraction of the COD, internal recirculation), but as Table 4 reveals, the simulation captured the processes occurring in the full-scale plant, since the calculated influent values showed full nitrification and an appropriate rate of denitrification. The phosphorous removal efficiency was around 80%, which could be further enhanced via the addition of chemicals. No alkalinity measurements were made in the effluent, but the model predictions confirmed that this was sufficient for full nitrification, since there was remaining alkalinity. In summary, the calculated and measured values were in good agreement and the model was verified using the full-scale plant data.

3.2. Aeration Control Energy Efficiency Results

3.2.1. Energy Demand at Constant Air Flow

The sewage treatment plant’s operation has to meet the effluent quality requirements all times; therefore, we assumed the highest possible incoming load and the worst possible oxygen transport rate. Evidently, this caused the overuse of energy compared to during normal operation, where the plant has real-time responses to the actual circumstances. The investigative dynamic simulations were performed by applying one-hour time steps. After each time step, the incoming load was updated. As a baseline for a comparison of the effectiveness of the control strategies, a constant airflow was set at the summer temperature and with an alpha value of 0.4. This resulted in an energy demand of 0.42 kWh per cubic meter of treated effluent. The standard air flow per diffuser varied from 43.2 to 63.4 m3/d throughout the course of a day.

3.2.2. Energy Demand at a Constant DO Level

Applying the DO control as outlined in Section 2 required a constant DO setpoint of 1.5 mg/L. The dissolved oxygen control approach meets the oxygen demand of the higher load coming into the plant by feeding more air into the system during the critical load periods. However, it also means that less energy is required during periods with low wastewater discharges. The model runs were performed at three temperatures and the alpha values ranged from 0.4 to 0.65. The relative aeration demand is depicted in Figure 3a.
It can be seen that higher effluent temperatures clearly hinder the oxygen dissolution, requiring more air to be introduced into the system, while the lower alpha values also imply higher relative energy demands. It could be concluded that the effect of the temperature is less pronounced at higher alpha values. With the DO control, the specific energy demand for aeration would be 0.32 kWh/m3 at the critical alpha of 0.4. The DO control could handle the varying wastewater quality levels, since the blower releases more air if the oxygen diffusion deteriorates. With an average temperature of 12 °C and assuming an average alpha of 0.55, the specific energy demand is only 0.23 kWh/m3, whereas it is further decreased to 0.19 kWh/m3 when assuming an alpha of 0.65.

3.2.3. Energy Demand when Applying Cascade Control

If the DO setpoint is not constant within a day then a greater reduction in energy demands is achievable. The change in the DO setpoint could depend on the ammonium load arriving at the plant. The control logic was as follows: DO = 2.0 mg/L was set if the plant received 1.3 times the average load, otherwise DO = 1.0 mg/L was set. Thus, the aeration demand was only elevated around the peak periods of a day. For the cascade control, a sensitivity test for the temperature and alpha factor was also performed, the results of which are shown in Figure 3b. It was also found that the role of the temperature was significant in the lower alpha range. Compared to the DO control, about 6–16% less energy was required.
In summary, the DO control resulted in more significant air demand savings compared to the constant airflow in terms of the daily average air flow, which was between 28 and 34%, which could be further increased by about 10% with the ammonium control. A similar result was obtained by Revollar et al. (2020), whereby the aeration energy demand per treated wastewater volume decreased from 0.204 kWh/m3 to 0.184 kWh/m3 when the simple DO control was changed to a cascade control approach by applying an ammonium setpoint of 1.0 mg/L [42]. Rieger et al. (2021) studied three Swiss plants and calculated energy savings of 30% for the different aeration control strategies using dynamic numerical simulations, but it was pointed out that this figure could be lower in reality, as the operation of the control strategy also consumes energy [43]. Pre-controlled ammonium control with a higher oxygen dosing rate is recommended1–2 h before the start of the load [44].

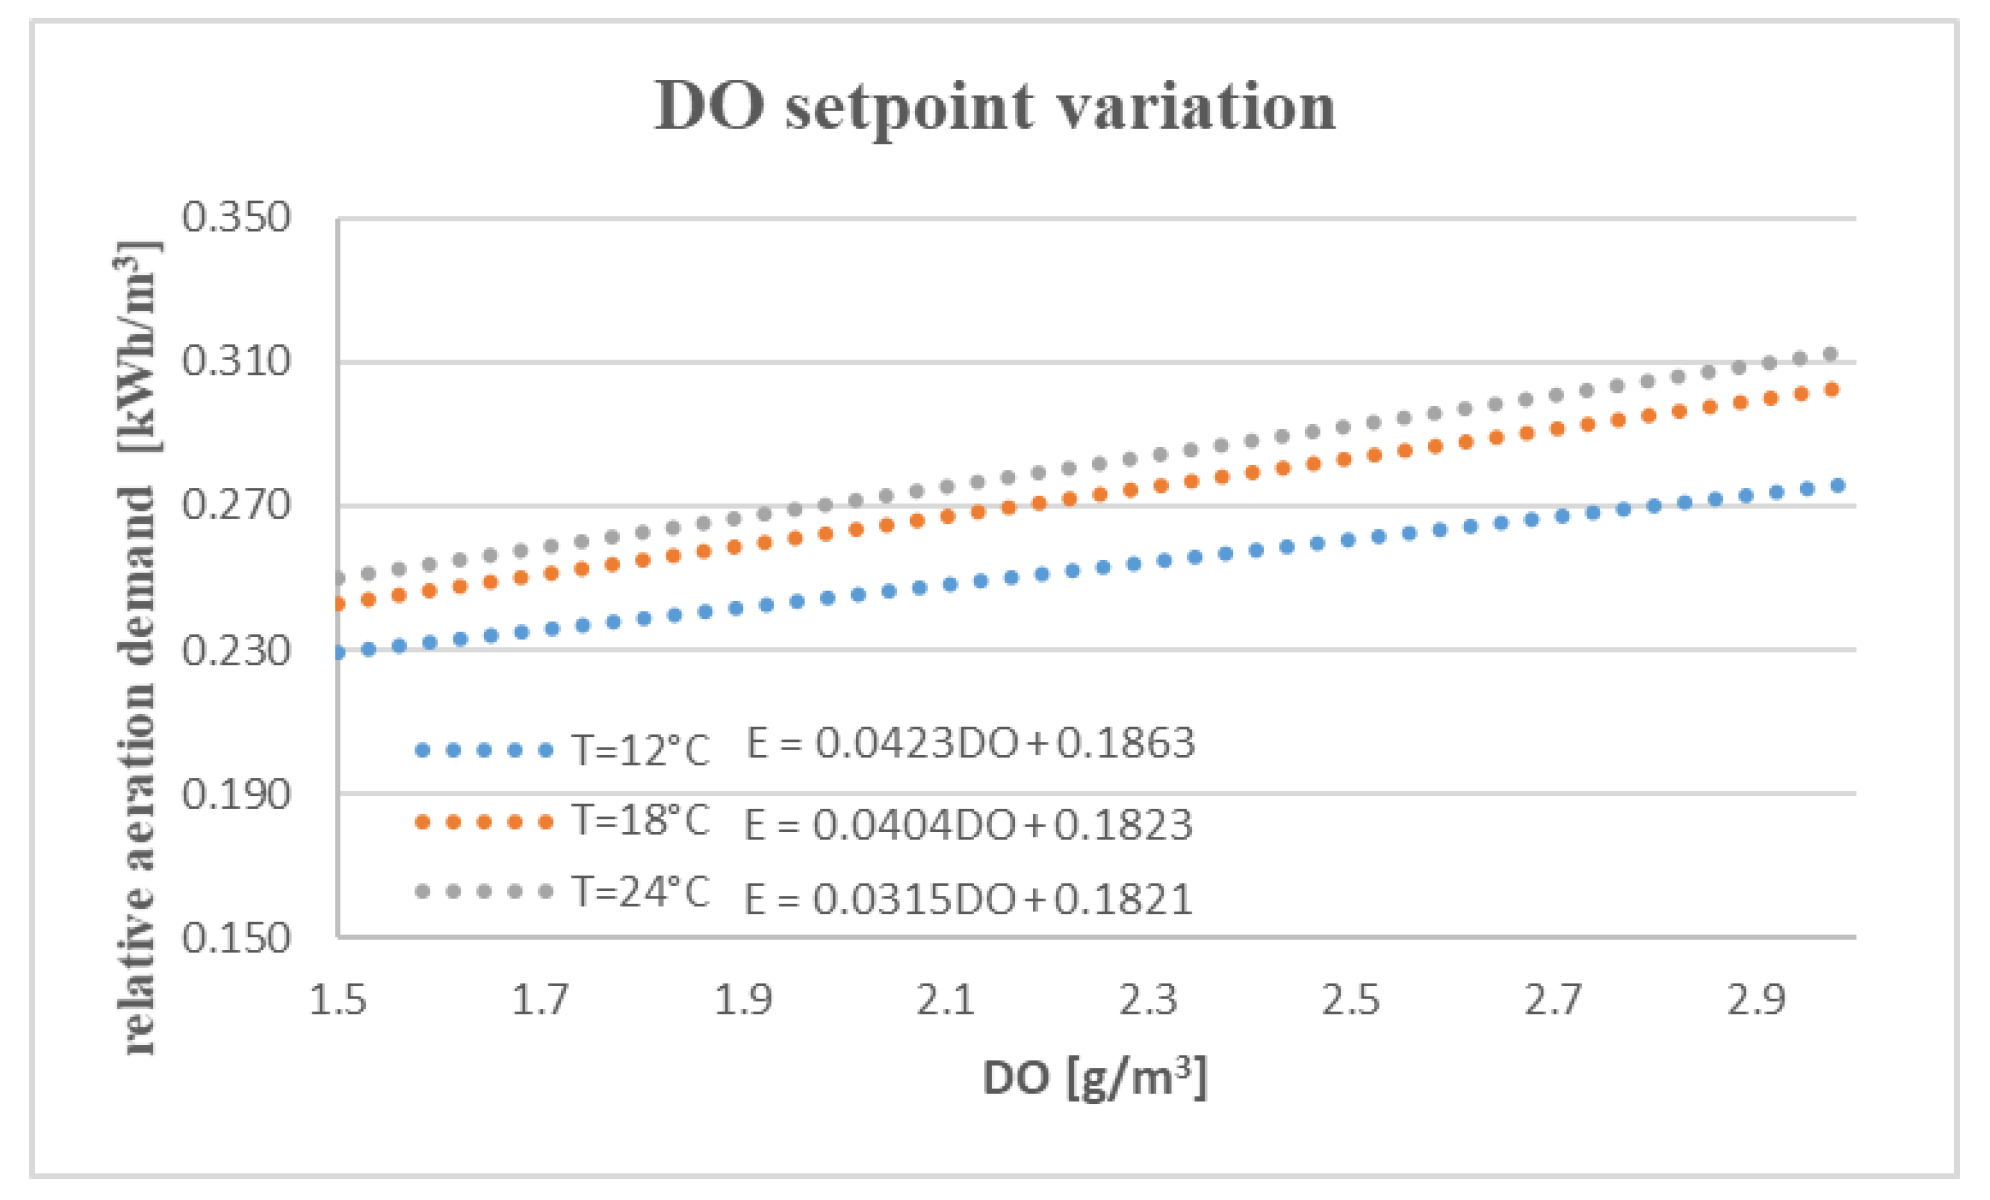
3.2.4. Sensitivity Analysis of the DO Setpoint

A sensitivity analysis was carried out regarding the DO setpoint. In the calculations the DO setpoints varied between 1.5 and 3.0 mg/L and the liquid temperatures were 12 °C, 18 °C, and 24 °C. The specific energy requirements were calculated in each scenario and the results are summarized in Figure 4. It can be seen that the difference in aeration demands was larger at temperatures between 12 °C and 18 °C than between 18 °C and 24 °C. This could be explained by the kinetics of the microbiological degradability and the associated oxygen uptake, since the biomass growth and substrate consumption increased with the increasing temperature. It can also be observed that there was no substantial improvement in the treated effluent quality with a higher DO setpoint (ammonium effluent during peak load hours decreases from 1.9 mg/L to 1.2 mg/L with an increase from DO = 1.5 mg/L to DO = 3.0 mg/L), but the energy demand increased by 20–25%. However, the nitrification during peak load hours is partial and unstable in the tested plant if DO setpoint is less than 1.5 mg/L.
The relative aeration demand has a relationship with the DO and temperature. The dependence on the DO could be approximated via linear regression (R2 = 0.997). The relative aeration demand is not linearly dependent on the temperature, and the second-degree polynomial fit gives acceptable results (R2 = 0.991). If the DO and temperature dependence are combined, the following regression could be built, which is formulated in Equation (3) as follows:
E = ( 9 · 10 5 T 2 + 0.0043 T 0.0058 ) D O + 1.35 · 10 4 T 2 0.00475 T + 0.218
where E is the relative aeration demand, which is the energy required for the oxygenation of one cubic meter of wastewater (kWh/m3)
Equation (3) is a site-specific formula that is valid over the DO range of 1.5–3.0 mg/L and temperature range of 12–24 °C. Equation (3) was determined via numerical calculations and could be used as a hands-on tool by the operator for the estimation of the DO manipulation cost. Chen et al. (2022) went further and elaborated a tool to determine the optimal DO setpoint. The authors used the DO and wastewater discharge as the control variables; the substrate, biomass, and effluent concentrations were the state variables; and the minimum energy consumption was the objective function. With this mathematical model, the optimal DO could be determined and 20% of the energy savings were achieved [45], consistent with the results of this study.
The limitation of this study was that the standard oxygen transfer efficiency was a constant value of 0.3 and was not correlated with the alpha factor, which may have led to uncertainties in the plant-wide modeling of the aeration system described by Leu et al. [46].
Ideal mixing conditions were assumed, but computational fluid dynamics can provide a closer picture of the actual flow pattern and associated mixing conditions induced by aeration [47]. The conventional method of calibrating the sedimentation parameters was used, but the more advanced technique described by Ngo et al. (2021) can provide a mechanistic account of flocculent sedimentation [48]. The control strategies were tested through trial and error using a mechanistic model. An advanced mechanistic–soft computing hybrid tool could be proposed for adaptive dissolved oxygen control in the future [49].

4. Conclusions

The energy-efficient operation of wastewater treatment plants requires real-time and adaptive responses to constantly changing influent load conditions. Small-capacity STPs in particular are subject to diurnal fluctuations. Different aeration strategies could be used to reduce the daily air consumption. Plant-wide numerical tools such as biokinetic and transport modeling approaches could be used to predict the plant’s performance and to fine-tune the parameters for the aeration process, proving them to be effective tools to reach the research objectives. The main findings of the study were the following:
  • The strong incoming wastewater with a high diurnal peak factor could be treated effectively (>90% organic removal, >85% nutrient removal) at high sludge ages (SRT = 14–18 d);
  • The calibrated and verified biokinetic model could predict the plant performance effectively;
  • The DO control approach with a constant setpoint could reduce the air demand by 24–25% compared to fixed air flow systems;
  • The cascade control approach applying a feed-forward ammonium loop at peak periods could result in an additional 10% savings;
  • The oxygen diffusion factor significantly affects the aeration energy demand. The typical range of alpha factor values varies from 0.4 to 0.65 in activated sludge systems, resulting in an approximately 60% aeration energy demand difference between the two borders of the range;
  • For the dependence of the relative energy demand on the temperature and DO, a site-specific function was established, which could be utilized in decision-making related to the plant’s operation.

Funding

This research received no external funding.

Institutional Review Board Statement

Not applicable.

Informed Consent Statement

Not applicable.

Data Availability Statement

The data are contained within the article.

Conflicts of Interest

The author declare no conflict of interest.

References

  1. Capodaglio, A.G.; Olsson, G. Energy issues in sustainable urban wastewater management: Use, demand reduction and recovery in the urban water cycle. Sustainability 2019, 12, 266. [Google Scholar] [CrossRef] [Green Version]
  2. Borzooei, S.; Campo, G.; Cerutti, A.; Meucci, L.; Panepinto, D.; Ravina, M.; Zanetti, M. Optimization of the wastewater treatment plant: From energy saving to environmental impact mitigation. Sci. Total Environ. 2019, 691, 1182–1189. [Google Scholar] [CrossRef] [PubMed]
  3. Corominas, L.; Byrne, D.M.; Guest, J.S.; Hospido, A.; Roux, P.; Shaw, A.; Short, M.D. The application of life cycle assessment (LCA) to wastewater treatment: A best practice guide and critical review. Water Res. 2020, 184, 116058. [Google Scholar] [CrossRef] [PubMed]
  4. Di Fraia, S.; Massarotti, N.; Vanoli, L. A novel energy assessment of urban wastewater treatment plants. Energy Convers. Manag. 2018, 163, 304–313. [Google Scholar] [CrossRef]
  5. Awe, O.W.; Liu, R.; Zhao, Y. Analysis of energy consumption and saving in wastewater treatment plant: Case study from Ireland. J. Water Sus. 2016, 6, 63–76. [Google Scholar]
  6. Maktabifard, M.; Zaborowska, E.; Makinia, J. Energy neutrality versus carbon footprint minimization in municipal wastewater treatment plants. Biores. Technol. 2020, 300, 122647. [Google Scholar] [CrossRef]
  7. Gu, Y.; Li, Y.; Li, X.; Luo, P.; Wang, H.; Wang, X.; Li, F. Energy self-sufficient wastewater treatment plants: Feasibilities and challenges. Energy Procedia 2017, 105, 3741–3751. [Google Scholar] [CrossRef]
  8. Kollmann, R.; Neugebauer, G.; Kretschmer, F.; Truger, B.; Kindermann, H.; Stoeglehner, G.; Narodoslawsky, M. Renewable energy from wastewater—Practical aspects of integrating a wastewater treatment plant into local energy supply concepts. J. Clean. Prod. 2017, 155, 119–129. [Google Scholar] [CrossRef]
  9. Haslinger, J.; Lindtner, S.; Krampe, J. Operating costs and energy demand of wastewater treatment plants in Austria: Benchmarking results of the last 10 years. Water Sci. Technol. 2016, 74, 2620–2626. [Google Scholar] [CrossRef]
  10. Bodik, I.; Kubaska, M. Energy and sustainability of operation of a wastewater treatment plant. Environ. Prot. Eng. 2013, 39, 15–24. [Google Scholar] [CrossRef]
  11. Musabandesu, E.; Loge, F. Load shifting at wastewater treatment plants: A case study for participating as an energy demand resource. J. Clean. Prod. 2021, 282, 124454. [Google Scholar] [CrossRef]
  12. Mousel, D.; Palmowski, L.; Pinnekamp, J. Energy demand for elimination of organic micropollutants in municipal wastewater treatment plants. Sci. Total Environ. 2017, 575, 1139–1149. [Google Scholar] [CrossRef] [PubMed]
  13. Masłoń, A.; Czarnota, J.; Szaja, A.; Szulżyk-Cieplak, J.; Łagód, G. The enhancement of energy efficiency in a wastewater treatment plant through sustainable biogas use: Case study from Poland. Energies 2020, 13, 6056. [Google Scholar] [CrossRef]
  14. Lensch, D.; Schaum, C.; Cornel, P. Examination of food waste co-digestion to manage the peak in energy demand at wastewater treatment plants. Water Sci. Technol. 2016, 73, 588–596. [Google Scholar] [CrossRef] [PubMed]
  15. Remy, C.; Jekel, M. Energy analysis of conventional and source-separation systems for urban wastewater management using Life Cycle Assessment. Water Sci. Technol. 2012, 65, 22–29. [Google Scholar] [CrossRef]
  16. Hao, X.; Li, J.; van Loosdrecht, M.C.; Jiang, H.; Liu, R. Energy recovery from wastewater: Heat over organics. Water Res. 2019, 161, 74–77. [Google Scholar] [CrossRef] [PubMed]
  17. Giberti, M.; Dereli, R.K.; Flynn, D.; Casey, E. Predicting wastewater treatment plant performance during aeration demand shifting with a dual-layer reaction settling model. Water Sci. Technol. 2020, 81, 1365–1374. [Google Scholar] [CrossRef]
  18. Pechaud, Y.; Pageot, S.; Goubet, A.; Quintero, C.D.; Gillot, S.; Fayolle, Y. Size of biological flocs in activated sludge systems: Influence of hydrodynamic parameters at different scales. J. Environ. Chem. Eng. 2021, 9, 105427. [Google Scholar] [CrossRef]
  19. Arora, A.S.; Nawaz, A.; Qyyum, M.A.; Ismail, S.; Aslam, M.; Tawfik, A.; Lee, M. Energy saving anammox technology-based nitrogen removal and bioenergy recovery from wastewater: Inhibition mechanisms, state-of-the-art control strategies, and prospects. Renew. Sustain. Energy Rev. 2021, 135, 110126. [Google Scholar] [CrossRef]
  20. Bencsik, D.; Takács, I.; Rosso, D. Dynamic alpha factors: Prediction in time and evolution along reactors. Water Res. 2022, 216, 118339. [Google Scholar] [CrossRef]
  21. Pan, Y.; Dagnew, M. A new approach to estimating oxygen off-gas fraction and dynamic alpha factor in aeration systems using hybrid machine learning and mechanistic models. J. Water Process. Eng. 2022, 48, 102924. [Google Scholar] [CrossRef]
  22. Hasan, A.; Salem, A.R.; Hadi, A.A.; Qandil, M.; Amano, R.S.; Alkhalidi, A. The power reclamation of utilizing micro-hydro turbines in the aeration basins of wastewater treatment plants. J. Energy Resour. Technol. 2021, 143, 081301. [Google Scholar] [CrossRef]
  23. Gernaey, K.V.; Van Loosdrecht, M.C.; Henze, M.; Lind, M.; Jørgensen, S.B. Activated sludge wastewater treatment plant modelling and simulation: State of the art. Environ. Model. Softw. 2004, 19, 763–783. [Google Scholar] [CrossRef]
  24. Glover, G.C.; Printemps, C.; Essemiani, K.; Meinhold, J. Modelling of wastewater treatment plants—How far shall we go with sophisticated modelling tools? Water Sci. Technol. 2006, 53, 79–89. [Google Scholar] [CrossRef] [PubMed]
  25. Wu, X.; Yang, Y.; Wu, G.; Mao, J.; Zhou, T. Simulation and optimization of a coking wastewater biological treatment process by activated sludge models (ASM). J. Environ. Manag. 2016, 165, 235–242. [Google Scholar] [CrossRef]
  26. Phanwilai, S.; Kangwannarakul, N.; Noophan, P.L.; Kasahara, T.; Terada, A.; Munakata-Marr, J.; Figueroa, L.A. Nitrogen removal efficiencies and microbial communities in full-scale IFAS and MBBR municipal wastewater treatment plants at high COD: N ratio. Front. Environ. Sci. Eng. 2020, 14, 115. [Google Scholar] [CrossRef]
  27. Husin, M.H.; Rahmat, M.F.; Wahab, N.A.; Sabri, M.F.M.; Suhaili, S. Proportional-integral ammonium-based aeration control for activated sludge process. In Proceedings of the 2020 13th International UNIMAS Engineering Conference (EnCon), Kota Samarahan, Malaysia, 27–28 October 2020; IEEE: Piscataway, NJ, USA, 2020; pp. 1–5. [Google Scholar] [CrossRef]
  28. Drewnowski, J.; Remiszewska-Skwarek, A.; Duda, S.; Łagód, G. Aeration process in bioreactors as the main energy consumer in a wastewater treatment plant. Review of solutions and methods of process optimization. Processes 2019, 7, 311. [Google Scholar] [CrossRef] [Green Version]
  29. Åmand, L.; Olsson, G.; Carlsson, B. Aeration control—A review. Water Sci. Technol. 2013, 67, 2374–2398. [Google Scholar] [CrossRef] [Green Version]
  30. Wang, S.; Deng, L.; Zheng, D.; Wang, L.; Zhang, Y.; Yang, H.; Huang, F. Control of partial nitrification using pulse aeration for treating digested effluent of swine wastewater. Biores. Technol. 2018, 262, 271–277. [Google Scholar] [CrossRef]
  31. Capodaglio, A.G.; Hlavínek, P.; Raboni, M. Advances in wastewater nitrogen removal by biological processes: State of the art review. Rev. Ambient. Agua 2016, 11, 250–267. [Google Scholar] [CrossRef] [Green Version]
  32. Henze, M.; Gujer, W.; Mino, T.; Matsuo, T.; Wentzel, M.C.; Marais, G.V.R.; Van Loosdrecht, M.C. Activated sludge model no. 2d, ASM2d. Water Sci. Technol. 1999, 39, 165–182. [Google Scholar] [CrossRef]
  33. Burton, F.L.; Stensel, H.D. Wastewater Engineering: Treatment and Reuse; Tchobanoglous, G., Ed.; McGraw-Hill: New York, NY, USA, 2003. [Google Scholar]
  34. Simos, T.E. A Runge-Kutta Fehlberg method with phase-lag of order infinity for initial-value problems with oscillating solution. Comput. Math. Appl. 1993, 25, 95–101. [Google Scholar] [CrossRef] [Green Version]
  35. Orhon, D.; Çokgör, E.U. COD fractionation in wastewater characterization—The state of the art. J. Chem. Technol. Biotechnol. 1997, 68, 283–293. [Google Scholar] [CrossRef]
  36. Petersen, B.; Gernaey, K.; Henze, M.; Vanrolleghem, P.A. Calibration of activated sludge models: A critical review of experimental designs. In Biotechnology for the Environment: Wastewater Treatment and Modeling, Waste Gas Handling; Springer: Dordrecht, The Netherlands, 2003; pp. 101–186. [Google Scholar]
  37. Zhu, A.; Guo, J.; Ni, B.J.; Wang, S.; Yang, Q.; Peng, Y. A novel protocol for model calibration in biological wastewater treatment. Sci. Rep. 2015, 5, 8493. [Google Scholar] [CrossRef] [PubMed] [Green Version]
  38. Mannina, G.; Cosenza, A.; Vanrolleghem, P.A.; Viviani, G. A practical protocol for calibration of nutrient removal wastewater treatment models. J. Hydroinformatics 2011, 13, 575–595. [Google Scholar] [CrossRef] [Green Version]
  39. Rieger, L.; Gillot, S.; Langergraber, G.; Ohtsuki, T.; Shaw, A.; Takacs, I.; Winkler, S. Guidelines for Using Activated Sludge Models; IWA Publishing: London, UK, 2012. [Google Scholar]
  40. Patry, G.G.; Takács, I. Settling of flocculent suspensions in secondary clarifiers. Water Res. 1992, 26, 473–479. [Google Scholar] [CrossRef]
  41. Mueller, J.; Boyle, W.C.; Popel, H.J. Aeration: Principles and Practice, Volume 11; CRC Press: Boca Raton, FL, USA, 2002. [Google Scholar] [CrossRef]
  42. Revollar, S.; Vilanova, R.; Vega, P.; Francisco, M.; Meneses, M. Wastewater Treatment Plant Operation: Simple Control Schemes with a Holistic Perspective. Sustainability 2020, 12, 768. [Google Scholar] [CrossRef] [Green Version]
  43. Rieger, L.; Takács, I.; Siegrist, H. Improving nutrient removal while reducing energy use at three Swiss WWTPs using advanced control. Water Envrion. Res. 2012, 84, 170–188. [Google Scholar] [CrossRef]
  44. Bolles, S. Modeling Wastewater Aeration Systems to Discover Energy Savings Opportunities; Process Energy Services LLC: Londonderry, NH, USA, 2006. [Google Scholar]
  45. Chen, Y.; Zhang, H.; Yin, Y.; Zeng, F.; Cui, Z. Smart energy savings for aeration control in wastewater treatment. Energy Rep. 2022, 8, 1711–1721. [Google Scholar] [CrossRef]
  46. Leu, S.Y.; Rosso, D.; Jiang, P.; Larson, L.E.; Stenstrom, M.K. Real-Time efficiency monitoring for wastewater aeration systems. Water Pract. Technol. 2008, 3, wpt2008064. [Google Scholar] [CrossRef]
  47. Samstag, R.W.; Ducoste, J.J.; Griborio, A.; Nopens, I.; Batstone, D.J.; Wicks, J.D.; Laurent, J. CFD for wastewater treatment: An overview. Water Sci. Technol. 2016, 74, 549–563. [Google Scholar] [CrossRef] [PubMed] [Green Version]
  48. Ngo, K.N.; van Winckel, T.; Massoudieh, A.; Wett, B.; Al-Omari, A.; Murthy, S.; De Clippeleir, H. Towards more predictive clarification models via experimental determination of flocculent settling coefficient value. Water Res. 2021, 190, 116294. [Google Scholar] [CrossRef] [PubMed]
  49. Han, H.G.; Qiao, J.F. Adaptive dissolved oxygen control based on dynamic structure neural network. Appl. Soft. Comput. 2011, 11, 3812–3820. [Google Scholar] [CrossRef]
Figure 1. Energy efficiency improvement possibilities in STPs.
Energies 15 06113 g001
Figure 2. Layout of the sewage treatment plant.
Energies 15 06113 g002
Figure 3. Relative aeration demand as a function of the alpha (a) DO control and (b) cascade control.
Energies 15 06113 g003
Figure 4. Relative aeration demands at various DO setpoints.
Energies 15 06113 g004
Table 1. The applied plant-wide modeling approach.
Simulation Setup
Biokinetic modelASM2D [32]
Influent fractionation modelCOD fractions [35]
Hydrodynamic modelTank-in-series
Sedimentation model1D double exponential [40]
Aeration modelDO control, cascade control
Numerical modelRunge–Kutta–Fehlberg 2 [34]
Simulation environmentGPS-X 7.0
Simulation ProtocolIWA Good Modeling Practice Unified Protocol [39]
Table 2. Measured raw influent and treated effluent data in mg/L. The averages are in brackets and the treatment efficiency is shown as a percentage.
Measured InfluentMeasured EffluentAverage Removal Efficiency
COD560–970 (776)35–68 (44)94%
BOD5265–465 (352)5–19 (7)98%
TSS162–386 (294)6–18 (9)97%
NH4-N49–97 (70)0.1–3.5 (1.4)98%
TN64–121 (94)6.0–18.2 (13.1)86%
TP6.9–14.1 (13.4)0.7–3.6 (2.2)84%
Alkalinity395–420 (401)n.d. 1-
1 No data available.
Table 3. Calibration parameters.
Calibration Parameter GroupParameter NameValue/Proportion
Raw influent fractionssoluble inert COD3%
particulate inert COD15%
readily biodegradable COD44%
particulate biodegradable COD42%
ammonium to TN65%
ortho-phosphate to TP76%
Biokinetic parametersheterotrophic yield [gCOD/gCOD]0.76
ammonia oxidizing yield [gCOD/gN)0.16
Process performance parametersvolumetric organic loading rate [kgBOD5/m3]0.55
F/M ratio [kgBOD5/kg MLVSS.d]0.2
Table 4. Modeled treated effluent data in mg/L, the averages are in brackets and treatment efficiency as a percentage.
Modeled EffluentAverage Modeled Removal EfficiencyModeled and Measured Treatment Difference
COD32–46 (39)95%1%
BOD59–14 (12)97%1%
TSS8–13 (10)97%<1%
NH4-N0–4.2 (1.0)99%1%
TN9.4–15.2 (11.3)88%2%
TP1.9–3.2 (2.5)81%3%
Alkalinity210–270 (245)39%-
Publisher’s Note: MDPI stays neutral with regard to jurisdictional claims in published maps and institutional affiliations.

