Article

Insight into Class G Wellbore Cement Hydration and Mechanism at 150 °C Using Molecular Dynamics

1
State Key Laboratory of Shale Oil and Gas Enrichment Mechanisms and Effective Development, SINOPEC Research Institute of Petroleum Engineering Co., Ltd., Beijing 102206, China
2
College of Petroleum Engineering, China University of Petroleum (Beijing), Beijing 102249, China
3
State Key Laboratory for Geomechanics & Deep Underground Engineering, School of Mechanics and Civil Engineering, China University of Mining and Technology, Xuzhou 221116, China
4
School of Mechanics and Civil Engineering, China University of Mining and Technology (Beijing), Beijing 100083, China
*
Author to whom correspondence should be addressed.
Energies 2022, 15(16), 6045; https://doi.org/10.3390/en15166045
Submission received: 18 July 2022 / Revised: 9 August 2022 / Accepted: 16 August 2022 / Published: 20 August 2022
(This article belongs to the Section H1: Petroleum Engineering)

Abstract

:
Neat well cement experience significant strength retrogression at high temperatures above 110 °C, especially at approximately 150 °C. To reveal the mechanism of performance degradation and guide the preparation of high-performance cement, we investigate the hydration process, mechanical behavior, and fracture process for well cement at the temperature of 150 °C based on molecular dynamics simulations and experiments. From triaxial pressure tests and Brazilian splitting tests, the strength, elastic modulus, and Poisson’s ratio of well cement decrease drastically with temperature increases from 80 °C to 150 °C. According to XRD, TG/DTG/DSC, and SEM, the hydration degree is insufficient, and larger pores exist in the microstructures. As the main binding phase of well cement, the mechanism of calcium silicate hydrates (C-S-H) influenced by curing temperatures is investigated through molecular dynamics simulations. C-S-H with calcium/silicon ratios (C/S) of 1.1 and 1.8 are simulated in the aqueous and solid states to investigate precipitation and mechanical behaviors. By reducing the C/S ratio to 1.1, the strength rebounds to a certain extent, and the adequacy of the hydration degree improved. It is found from the polymerization process that the increasing temperature promotes the polymerization rate, which is higher with C/S = 1.8 than that of 1.1. However, an increase in the C/S ratio will lead to a decrease in bridging oxygen content, thus a lower polymerization degree. The fracture simulations of C-S-H gels at different temperatures indicate that the failure of the C-S-H structure is mainly attributed to the disassembling of the calcium oxygen layers. With a higher temperature, there are fewer Ca-O bonds breaking, thus less strain energy consumed, resulting in worse performance. The elasticity of C-S-H, including Young’s and shear moduli, also exhibits certain degradations at a higher temperature. The elastic behavior of C-S-H with a low C/S ratio is generally higher than the high C/S.

1. Introduction

In recent years, there has been increased interest in oil and gas production from unconventional resources [1,2]. However, recovering these energy reserves often requires overcoming hostile downhole conditions, such as high temperatures and high pressures (HTHP). The HTHP environment amplifies the risks of wellbore cementing and longer-term well integrity. At temperatures of 140–250 °C for unconventional resources, especially at approximately 150 °C, wellbore cement has significant strength retrogression [3,4,5,6].
Through macroscopic and microscopic observations, the main reason for the drop in the strength of cement is that the hydration products (mainly hydrated calcium silicate, C-S-H) and the microstructure formed with pores have considerably changed in hydration reactions [3,7,8,9,10,11]. High temperatures alter the chemical composition of cement as the thermal response of C-S-H strongly depends on α-C2SH, and Hillebrandite was mostly known to form at 130 °C [3] and Hillebrandite and β-tricalcium silicate hydrate at 150 °C [7,12,13] in neat well cement. Furthermore, more α-C2SH was found at 130 °C [7], Tobermorite at 175 °C, and Xonotlite at 200 °C in well cement with 35% silica [3]. Moreover, these types of cement show mechanical degradation after a curing time of 1 year, irrespective of the content of silica, because crystal growth in the cement matrix causes more capillary pores and coarsening structure [11].
Some research at the microscale and mesoscale [14,15] was performed to capture the hierarchical characteristics of cementitious materials under high temperatures, such as the decomposition and degradation of hydration products [9]. The scales of these models are much larger than that of the C-S-H gel. Therefore, the intrinsic damage mechanism cannot be fully captured at a more fundamental scale. Thus, the dynamics at the atomic scale [16] are used to study the effect of temperature on the structure and mechanical properties of C-S-H grains [10,17,18]. The structure of C-S-H changes at a high temperature, for instance, the silicate chains in C-S-Hm depolymerize due to the hydrolytic reaction with water molecules [17]. Furthermore, the stretching of the Si-O bonds leads to the distortion of the silicate tetrahedron structure, which manifests an increase in Si-O bond lengths and varying O-Si-O angles. Moreover, high temperatures lead to the evaporation of water molecules in C-S-H, thus affecting the mechanical performance of C-S-H [10]. C-S-H systems associated with a lower C/S ratio have been reported to undergo amorphization under higher temperatures [4,9,10,17,18,19]. Du et al. [19] present the history of early-age precipitation of C-S-H gels with varying C/S ratios. The degree of polymerization of the C-S-H gel decreases with the C/S. However, the temperature range of 140–250 °C is for unconventional resources, particularly approximately 150 °C, at which the properties of well cement experience strength degradation [3,4,5,6]. To date, few studies have focused on the intrinsic characteristics of well cement at 150 °C (the critical temperature for wellbore cement in unconventional resources), especially using the atomic scale dynamics. A better understanding of the mechanism of strength retrogression at high temperatures also facilitates the development of high-performance cement.
In this work, we investigate the hydration process and mechanical performance of well cement at the temperature of 150 °C through a combination of molecular dynamics (MD) simulations and experiments. The mechanical performance of well cement at 150 °C is measured using triaxial pressure tests and Brazilian splitting tests. Diffraction X-rays (XRD), Thermogravimetry/Derivative thermogravimetry/Differential scanning calorimetry (TG/DTG/DSC), and scanning electron microscope (SEM) tests identify the crystal phase, hydration products, and microstructure of hydrated well cement. MD simulations are carried out to study the hydration process including the precipitation kinetics of different C-S-H gels. Additionally, the effects of temperature on the mechanical properties (including both elastic and fracture behaviors) of C-S-H are investigated through axial tensile simulations.

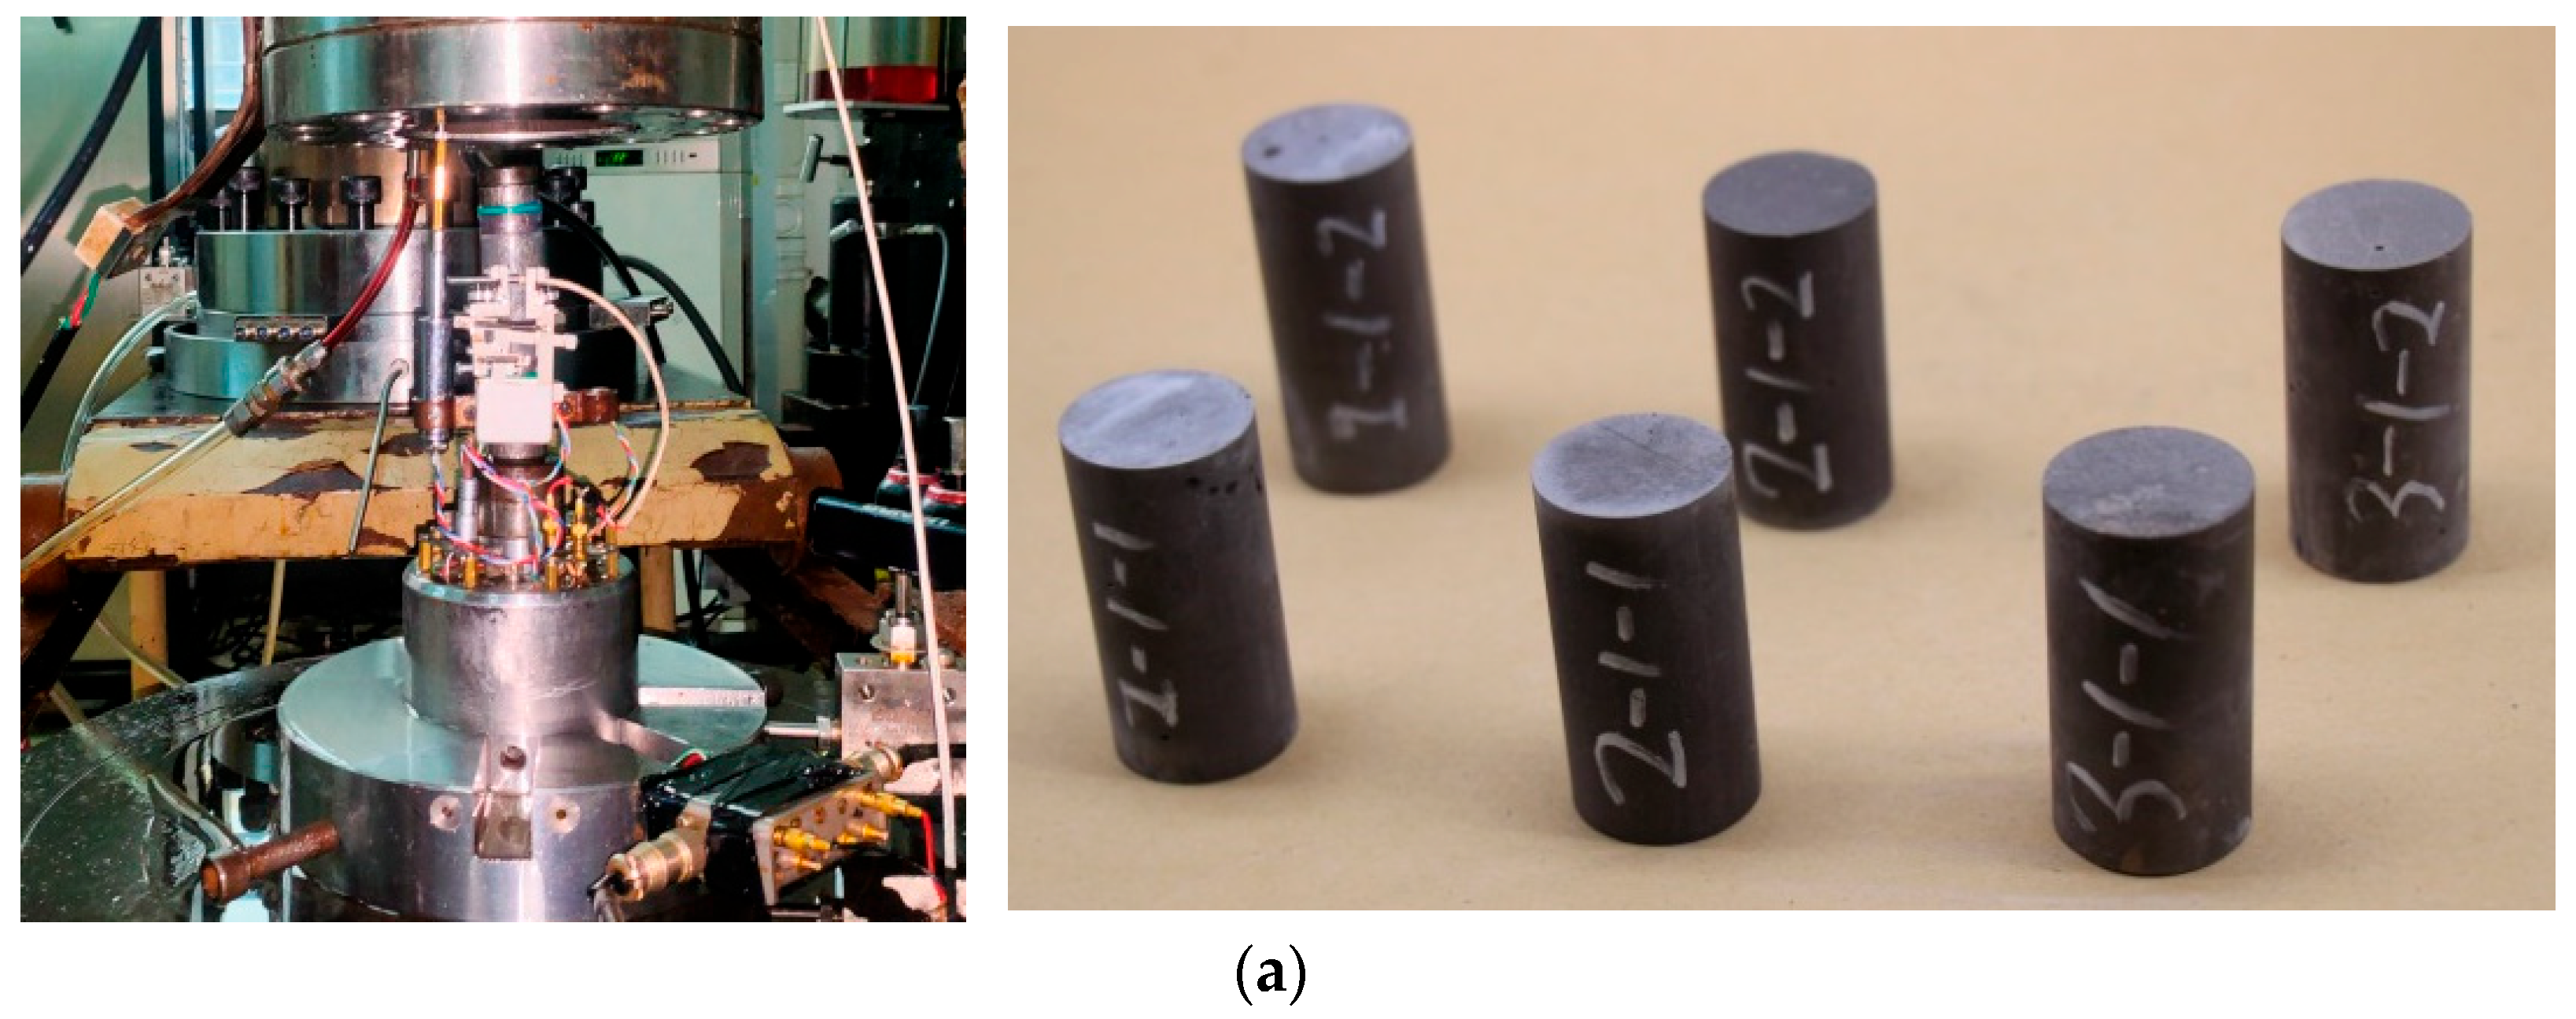
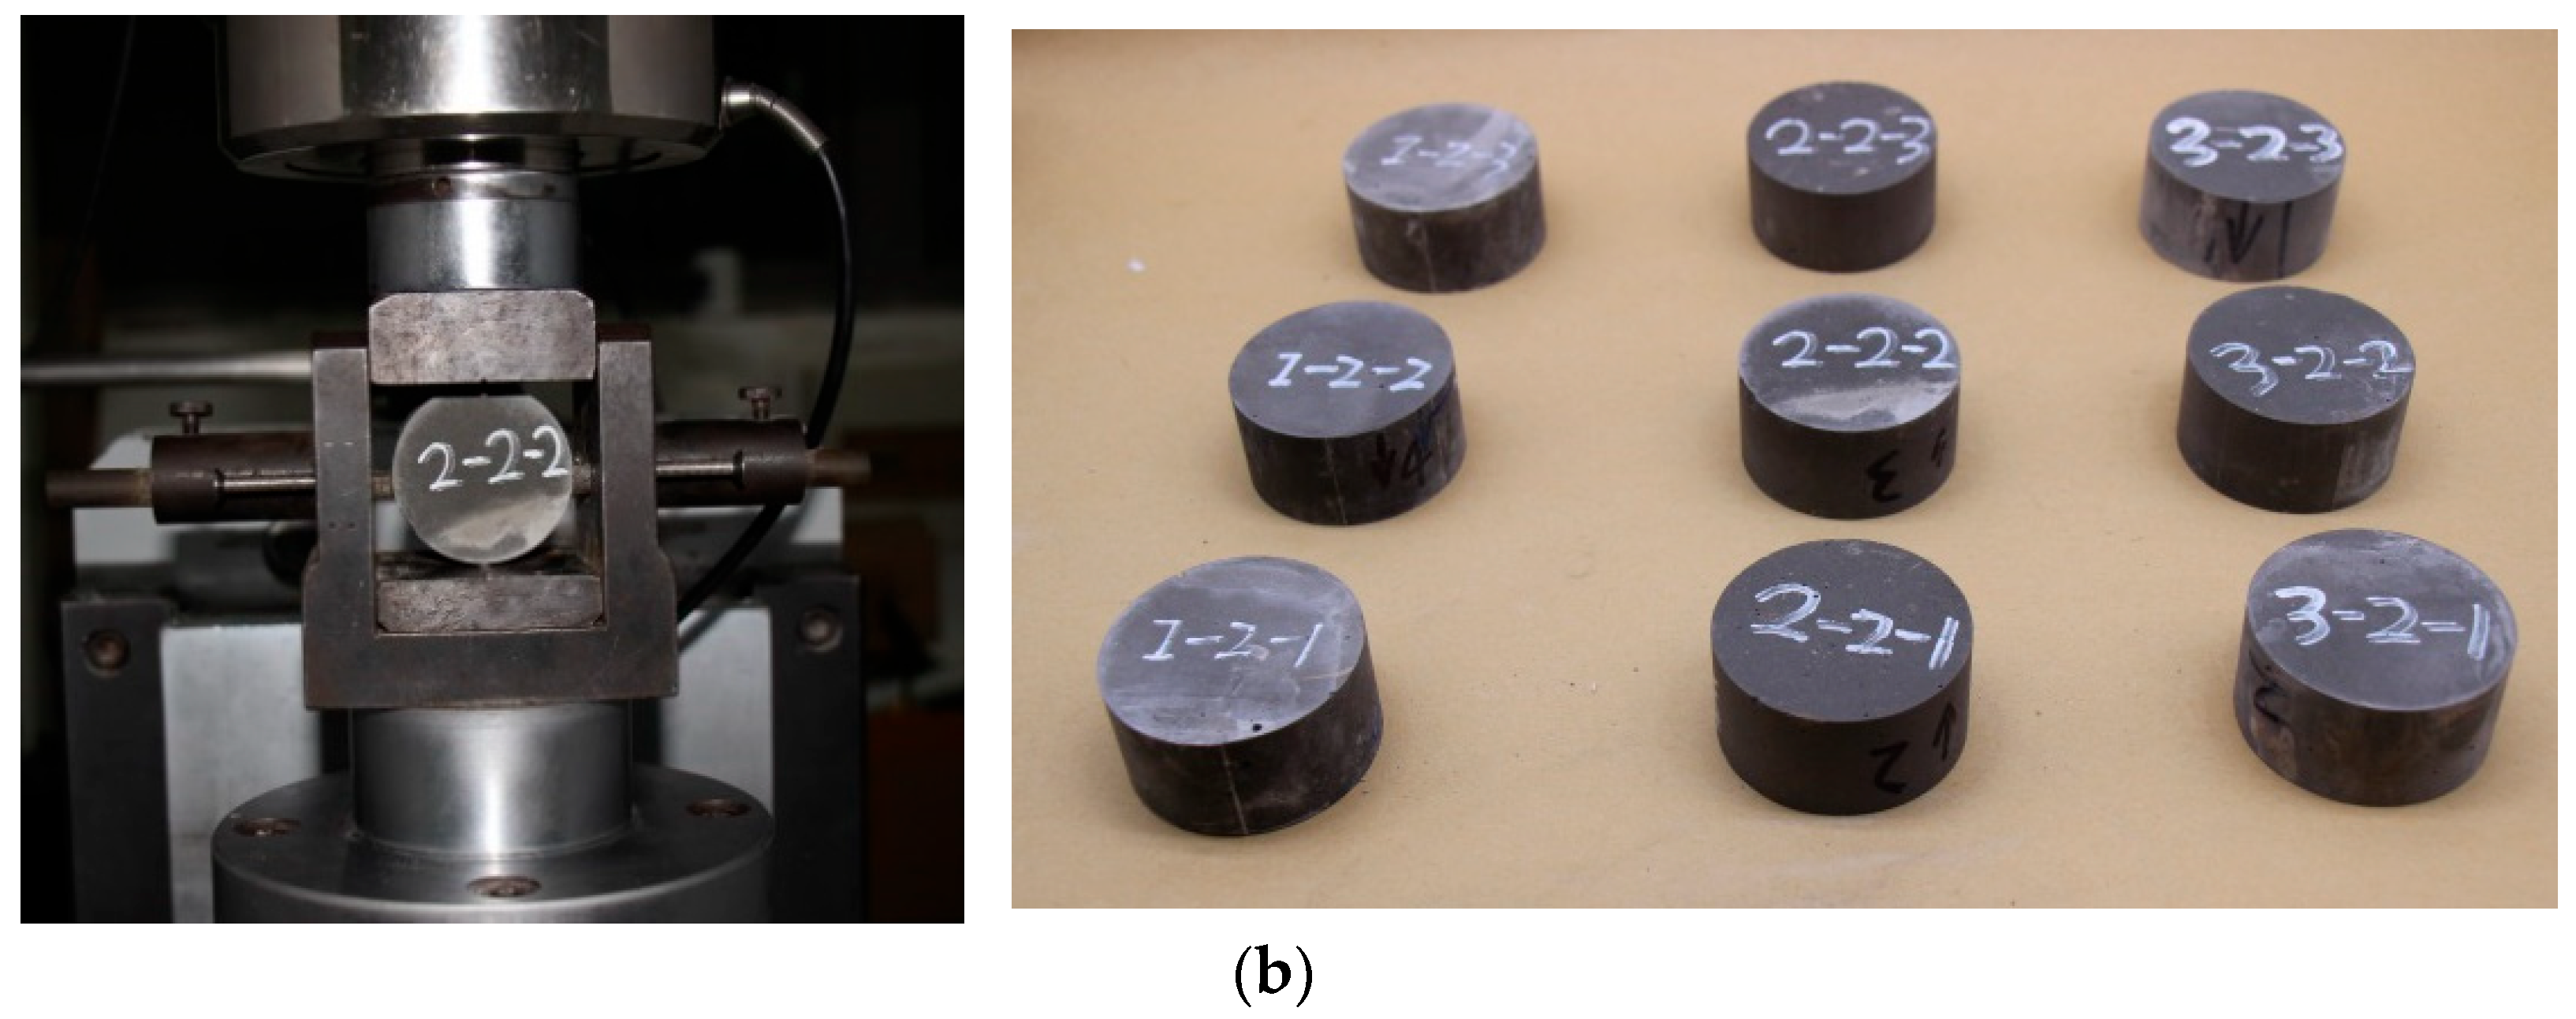
2. Experimental Data

The triaxial pressure tests and Brazilian splitting tests of well cement were conducted to study the mechanical performance of well cement under 150 °C and 15 MPa. Cement specimens were prepared, according to API RP 10B-2 [20], using Class G cement with 44% water By Weight of Cement (BWOC). As a chemical strategy, typical 35% BWOC silica flour was added to avert the strength deterioration of well cement at high temperatures [3,11]. The curing temperature of 80 °C (conventional temperature for wellbore) was used for the control specimen and 150 °C was used for the specimen of interest. Table 1 shows the components, C/S, and curing conditions of the specimens in each test. Cylindrical specimens 25.4 mm in diameter and 38.1 mm in length were prepared for triaxial tests (Figure 1a), and cylindrical specimens 50 mm in diameter and 25 mm in length were used for splitting tests (Figure 1b). For each cement batch, the strength values of two specimens (Figure 1a) were averaged for compressive tests, and three specimens (Figure 1b) were averaged for splitting tests.
XRD, TG/DSC, and SEM tests assessed the hydration process and microscale structure. Phase compositions of hydration products were analyzed with an Empyrean high-voltage (40 kV), high-current (40 mA) X-ray diffractometer (Cu kα). Linear continuous scanning mode was used, and the scanning angle was from 5° to 70° at a scanning rate of 5°/min. The divergence slit (αDS) and anti-scattering slit (αSS) were 1/16°, the receiving slit (RS) was 1/8°, and the influence resolution was 7.5°. TG/DSC tests were performed with the TGA Q5000 IR thermogravimeter. The sensitivity was 0.1 μg, the weighing accuracy was ±0.1%, temperature accuracy was ±1 °C, and the heating rate was 10 °C/min. N2 was used as a protective gas to prevent the samples from carbonization during the heating process. The micro-morphology of the samples was investigated with the FEI Quanta 200 FEG scanning electron microscope. Freshly fractured sample surfaces were prepared and coated with platinum.

3. Molecular Dynamics Simulation Methods

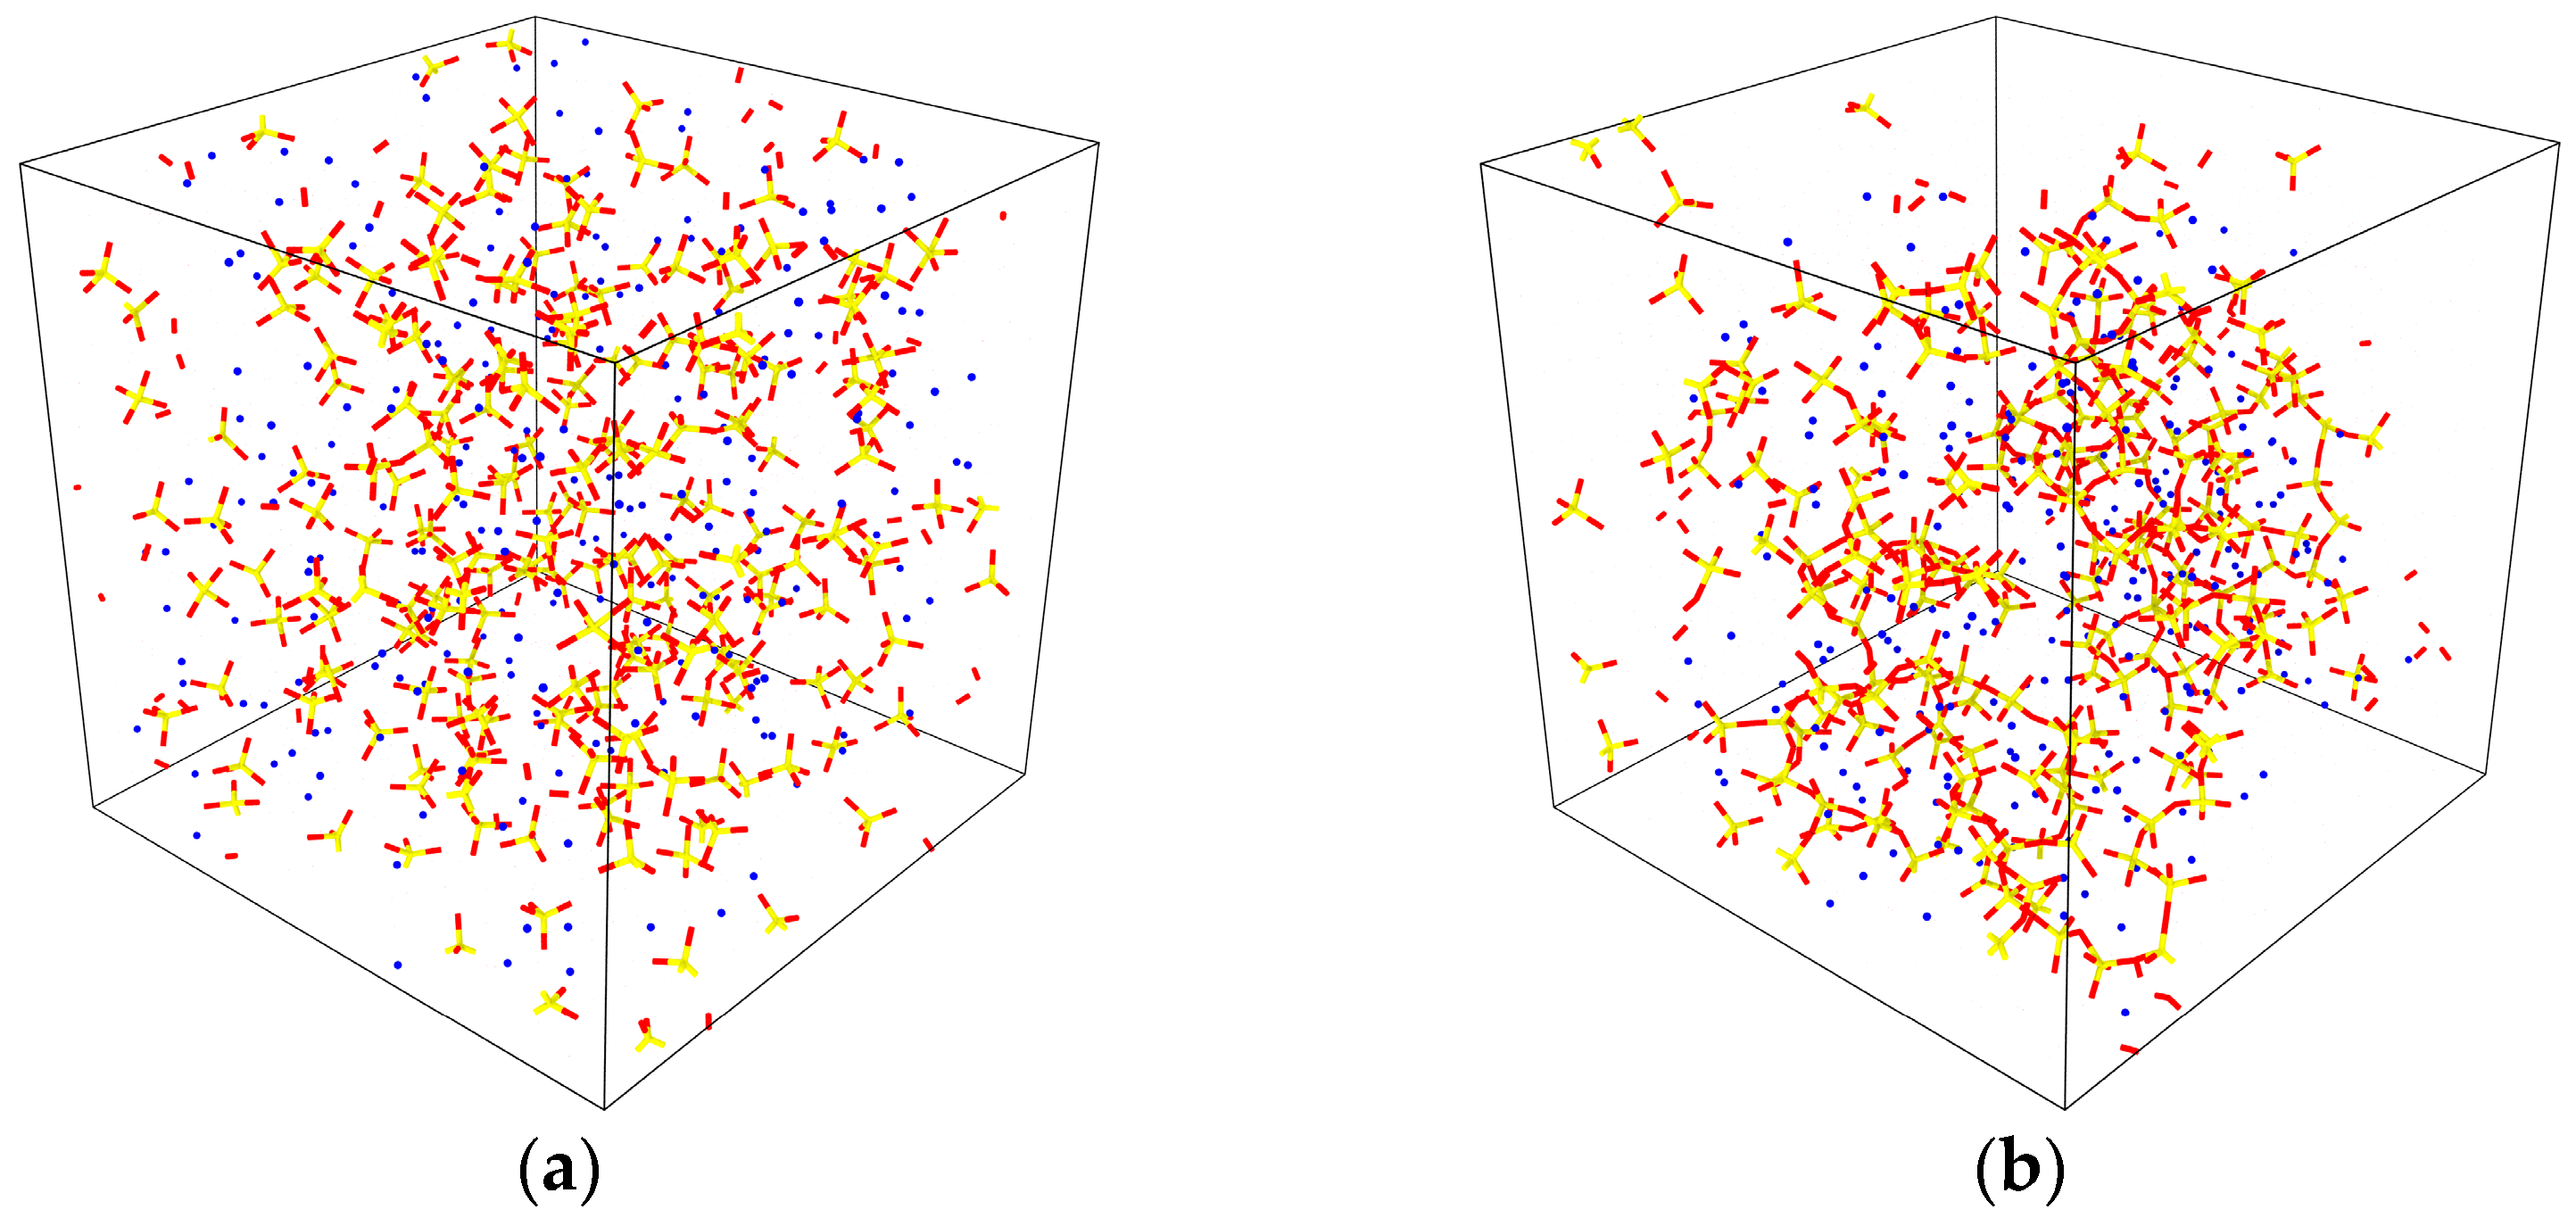
3.1. Molecular Model of C-S-H for the Early Hydration Process

To reveal the effect of temperature on the hydration kinetics of C-S-H polymerization, we simulated the polymerization process of C-S-H with C/S ratios of 1.1 and 1.8 under different conditions. First, we investigated the effect of high temperatures on the gelation process and structural evolution of C-S-H. Molecular dynamics simulations were conducted using the LAMMPS software [21].
The early-age C-S-H precipitation process was simulated using the method of sol-gel simulation from Refs. [19,22]. The CaO-SiO2-H2O systems were constructed by randomly placing Ca(OH)2, Si(OH)4 and H2O molecules in a box through PACKMOL software [23]. The tolerance distance between molecules was selected to be 2Å to ensure the absence of any unrealistic overlap between the atoms. Periodic boundary conditions were applied in all directions. We selected two C-S-H models with C/S = 1.1 and 1.8, respectively. C/S = 1.8 corresponds to no silica flour and C/S = 1.1 represents 35% BWOC silica flour in well cement. The inset molecule numbers of Ca(OH)2, Si(OH)4, and H2O are 238, 216, and 648 for C/S = 1.1, and for C/S = 1.8 they are 389, 216, and 648, respectively. The atomic snapshot of C/S = 1.1 before the reaction is shown in Figure 2a.
These particles are equilibrated at T = 300 K (27 °C) using MD simulations in the canonical (NVT) ensemble, then relaxed at T = 300 K and P = 15 MPa in the NPT ensemble. Since the energy barrier associated with the breakage of Si-O-H and the formation of Si-O-Si is high, following Refs. [19,24], the polymerization simulations are carried out at an elevated temperature in the NVT ensemble to accelerate the reaction, thus reducing the time cost, i.e., 1000 K, 1500 K, and 2000 K are used for evaluating the effects of temperature on the hydration process [19,22]. The interactive interactions were described by a reactive potential adopted from Ref. [25]. The potential has been successfully adopted in describing the chemical reactions of silicate materials [26,27,28], including the formation and breakage of bonds and charge transfers among atoms. The atom structure after the reaction in the box is shown in Figure 2b.

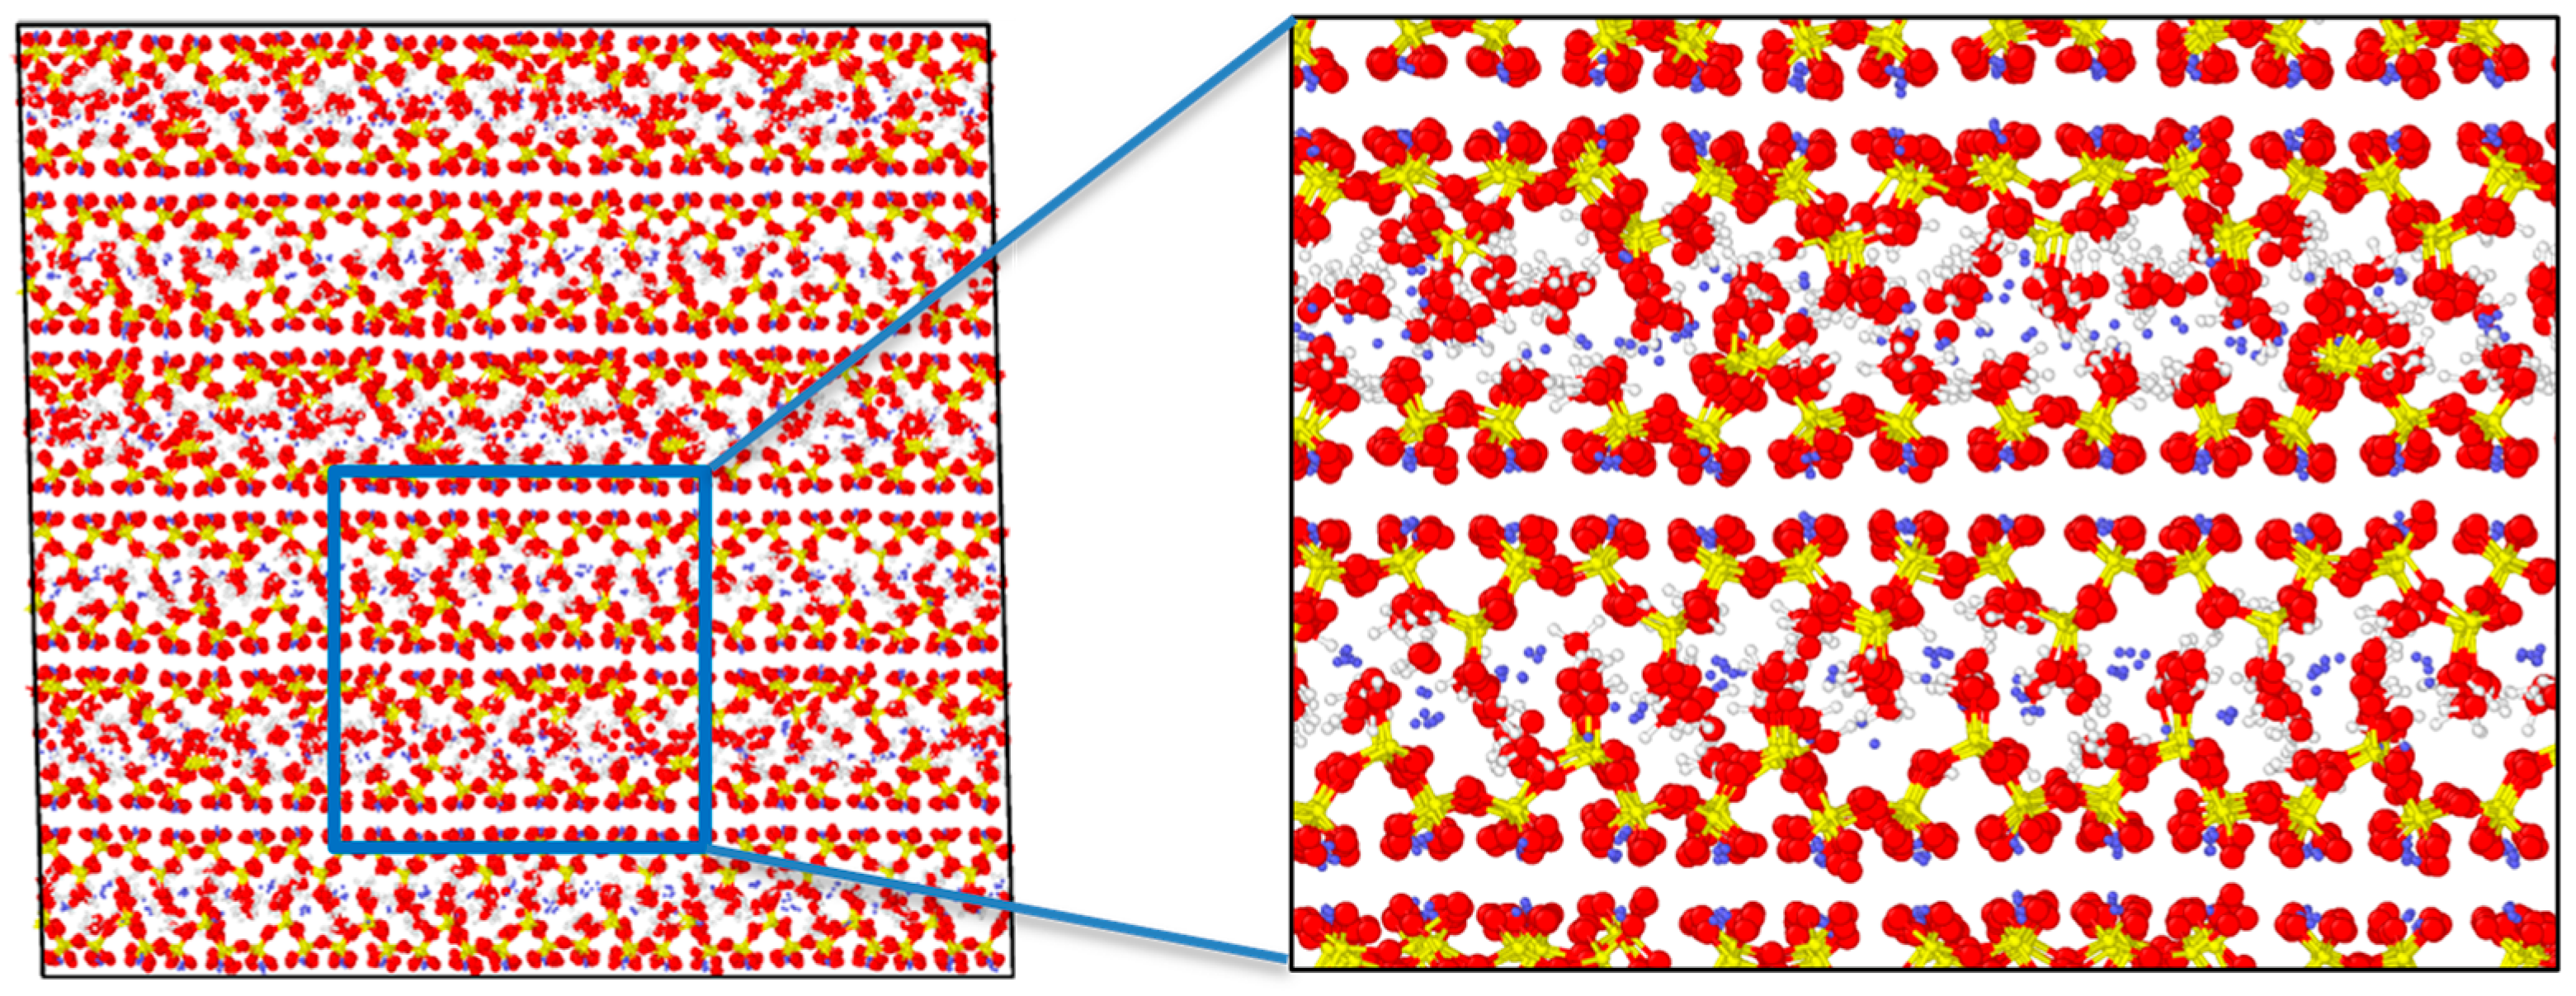
3.2. Molecular Model of C-S-H for Mechanical Properties and Fracture Behavior

3.2.1. Model of C-S-H

Here, we constructed the C-S-H model based on the defected tobermorite structure following the method developed by Pellenq et al. [16,29]. Specifically, the C-S-H with different C/S ratios were created by randomly removing charge-neutral SiO2 groups from a Tobermorite-11Å crystal. The C-S-H samples with C/S = 1.1 and 1.8 were taken according to the proportions in experiments and engineering. The interatomic potential used was the same ReaxFF as the sol-gel simulation. The models were further replicated by 2 × 2 × 3 to be subjected to axial tension tests. The NPT ensemble is used to access the desired temperature (353 K and 423 K, i.e., 80 °C and 150 °C) and pressure (15 MPa) for relaxing. The simulated model of C-S-H with C/S = 1.1 and a magnified image are shown in Figure 3. The tensile deformation was applied along the z-direction of the model (perpendicular to the Ca-O layer, i.e., the weakest direction) to investigate the mechanical properties and fracture behavior of C-S-H.

3.2.2. Elasticity

The stiffness of C-S-H phases under 353 K and 423 K were subjected to elastic property analysis. This can be achieved by stepwise deformation of the relaxed simulation box in the NVT ensemble. The box is deformed along a normal or shear direction, while other directions remain under constant stress, and the resultant stress is recorded to access the stiffness [10]. The macroscopic elastic properties of C-S-H grains can be approximated by orientational averaging using the Voigt–Reuss–Hill method [30] considering anisotropic elasticity [29] at the atomic scale. The upper bounds of the bulk and shear moduli for the C-S-H are KV (Equation (1)) and GV (Equation (4)), and the lower bounds are KR (Equation (2)) and GR (Equation (5)). The average values of bulk and shear moduli are computed by Equation (3) (KVR) and Equation (6) (GVR).
9 K V = ( C 11 + C 22 + C 33 ) + 2 ( C 12 + C 23 + C 31 )
1 / K R = ( s 11 + s 22 + s 33 ) + 2 ( s 12 + s 23 + s 31 )
K V R = ( K V + K R ) / 2
15 G V = ( C 11 + C 22 + C 33 ) ( C 12 + C 23 + C 31 ) + 3 ( C 44 + C 55 + C 66 )
15 / G R = 4 ( s 11 + s 22 + s 33 ) 4 ( s 12 + s 23 + s 31 ) + 3 ( s 44 + s 55 + s 66 )
G V R = ( G V + G R ) / 2
where Cij is the elastic stiffness tensor and sij = Cij1 is the compliance tensor. Young’s modulus is calculated as follows.
E = 9 K V R G V R / ( 3 K V R + G V R )

4. Results and Discussions

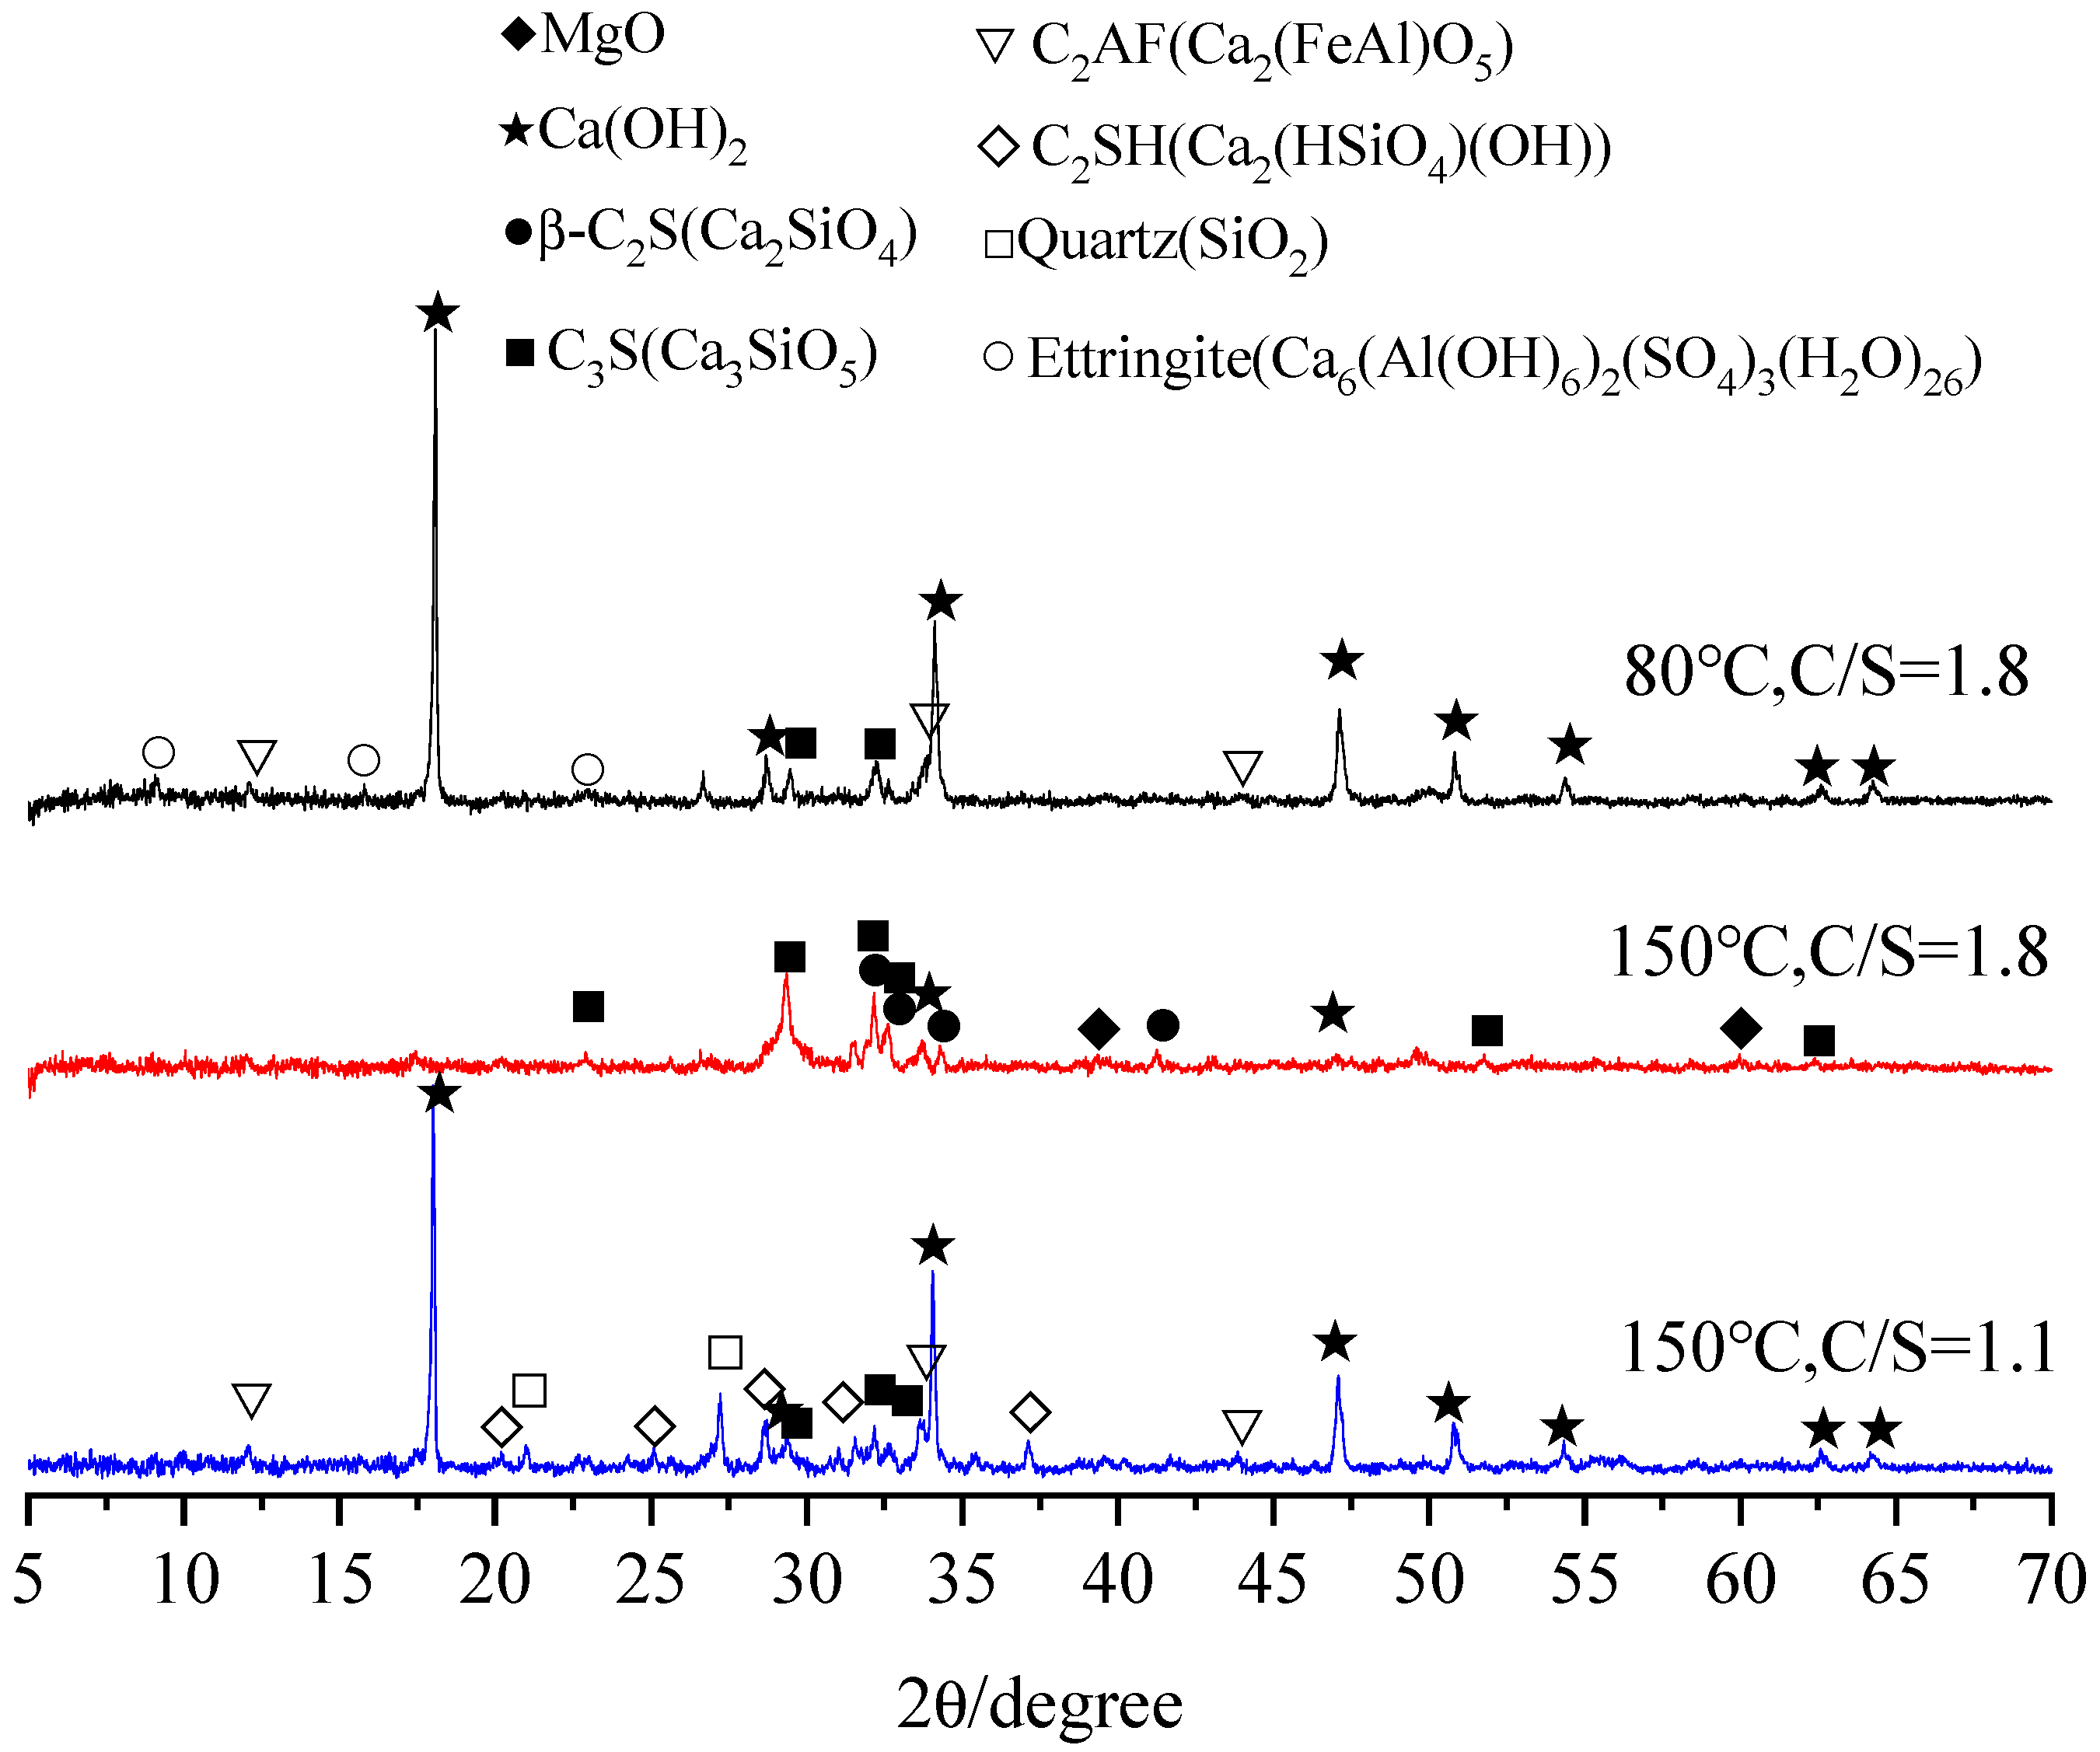
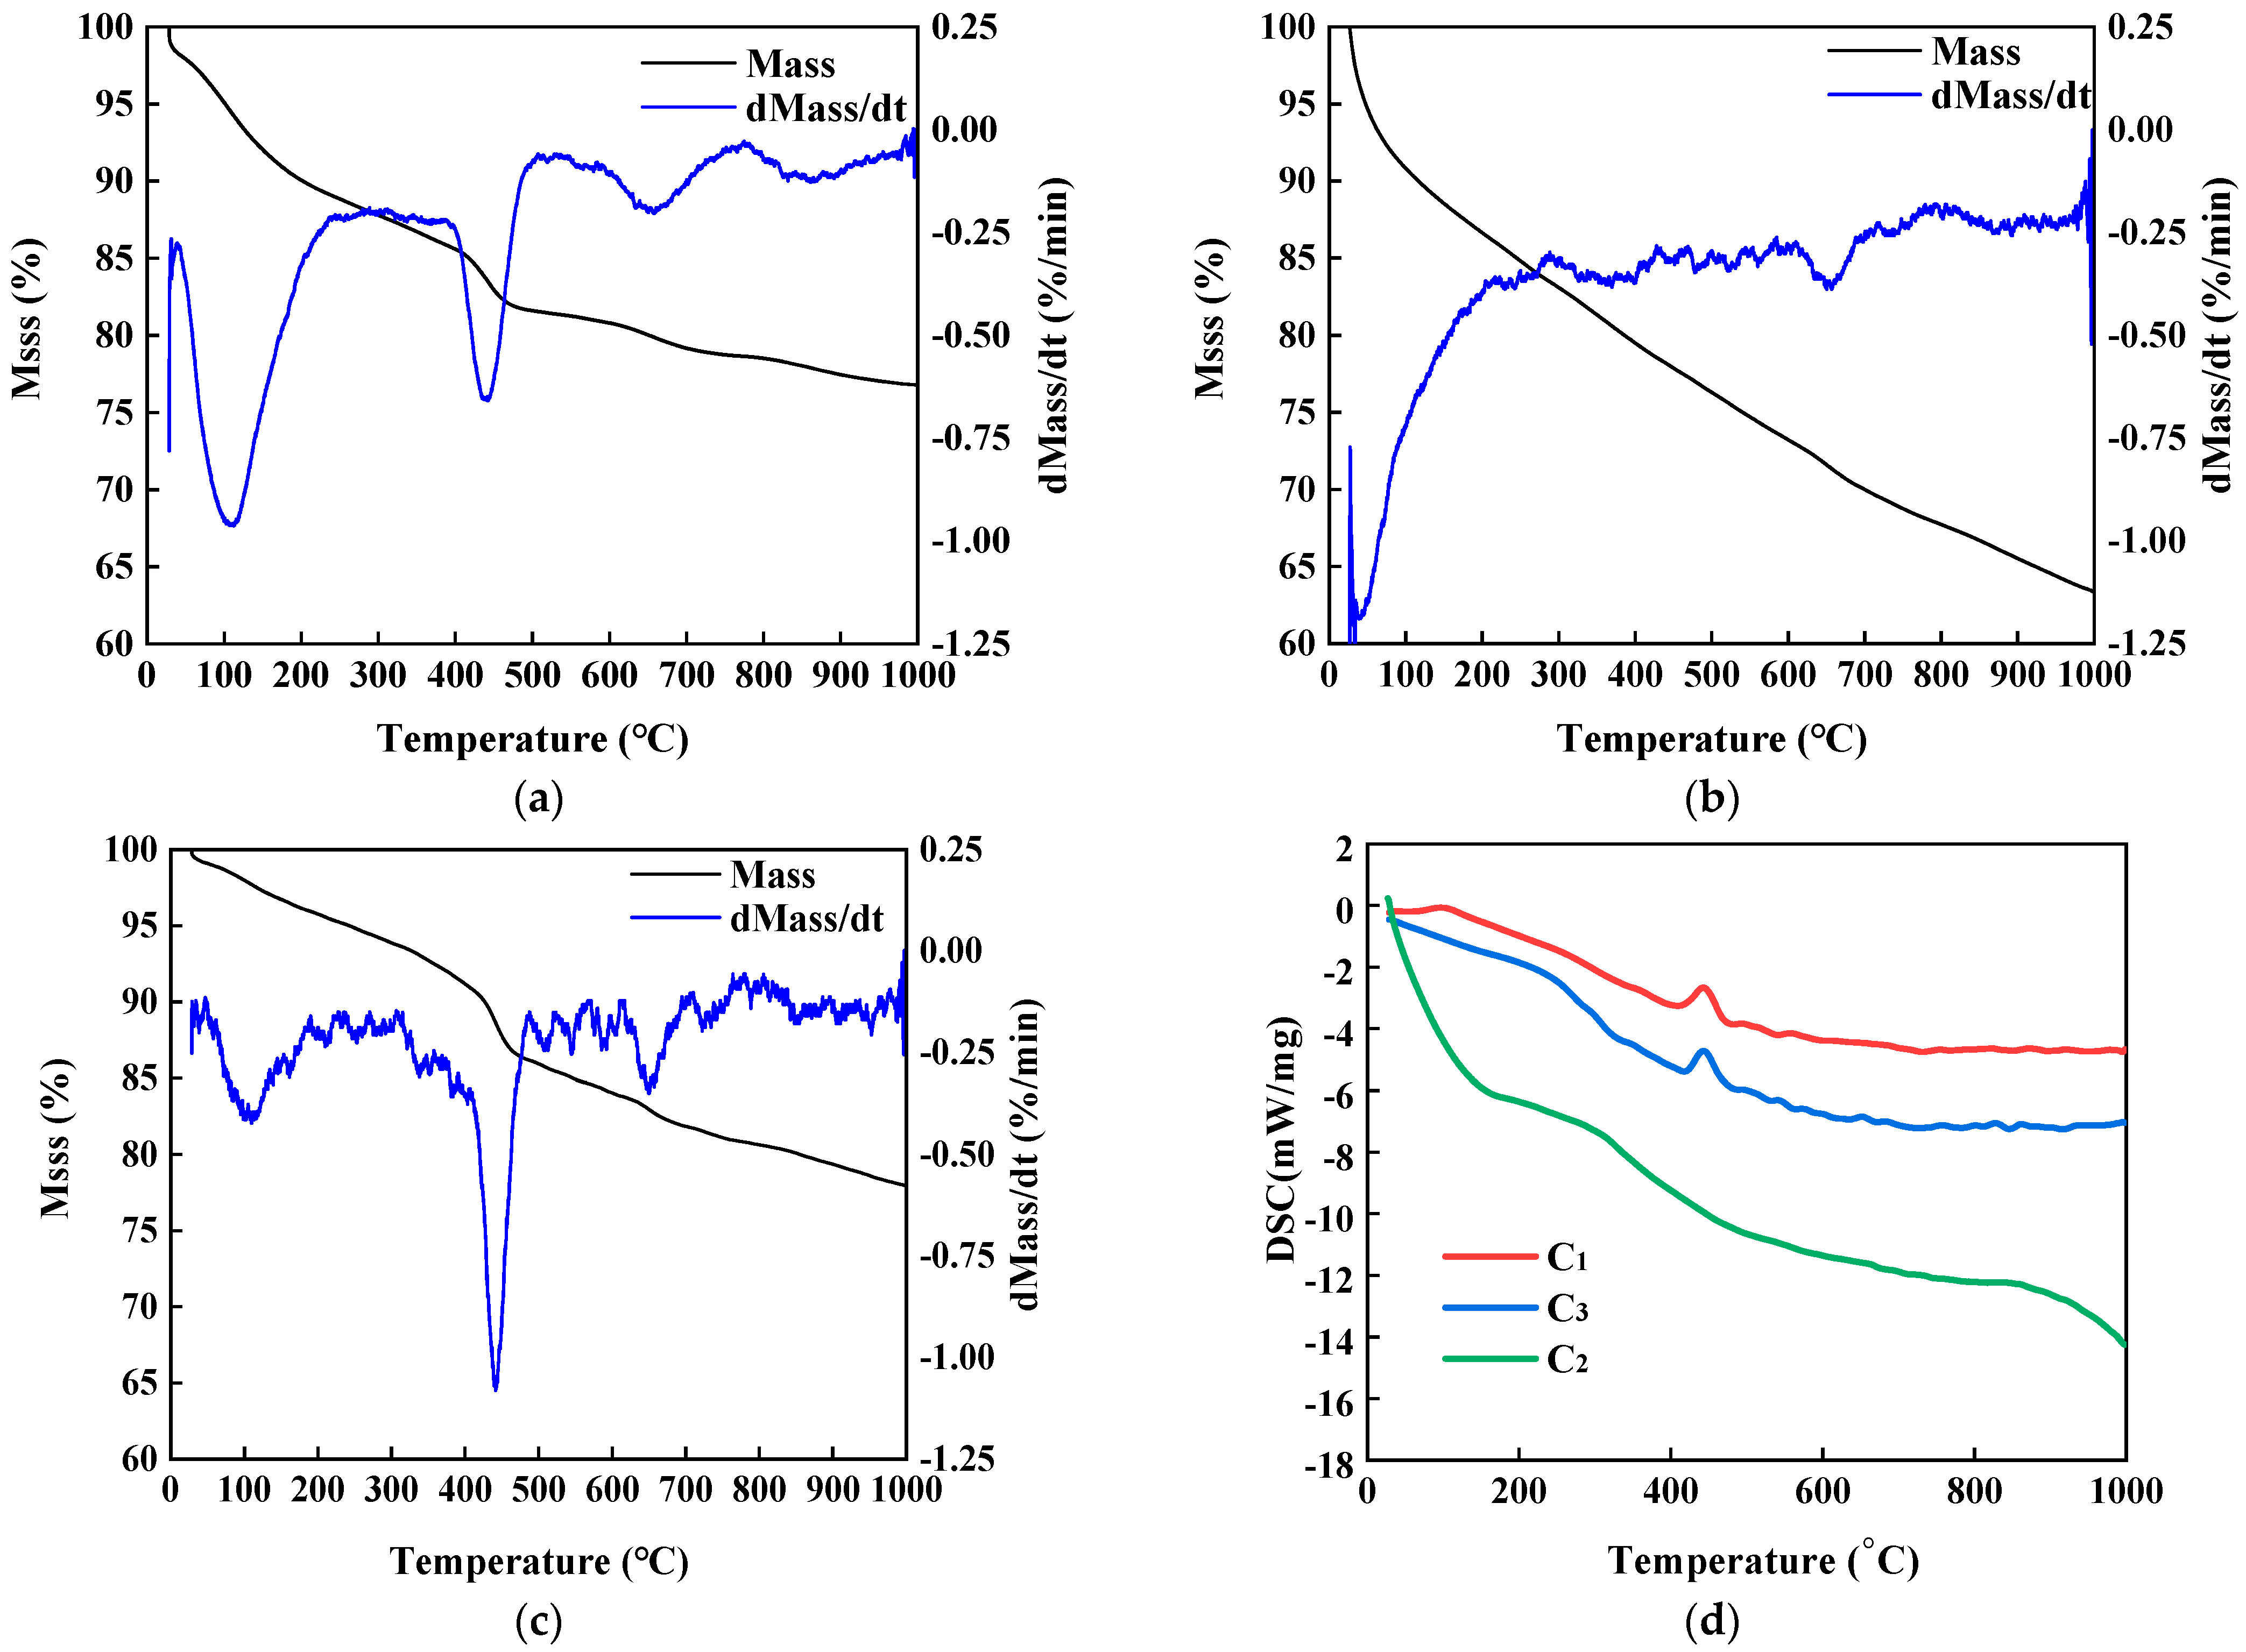
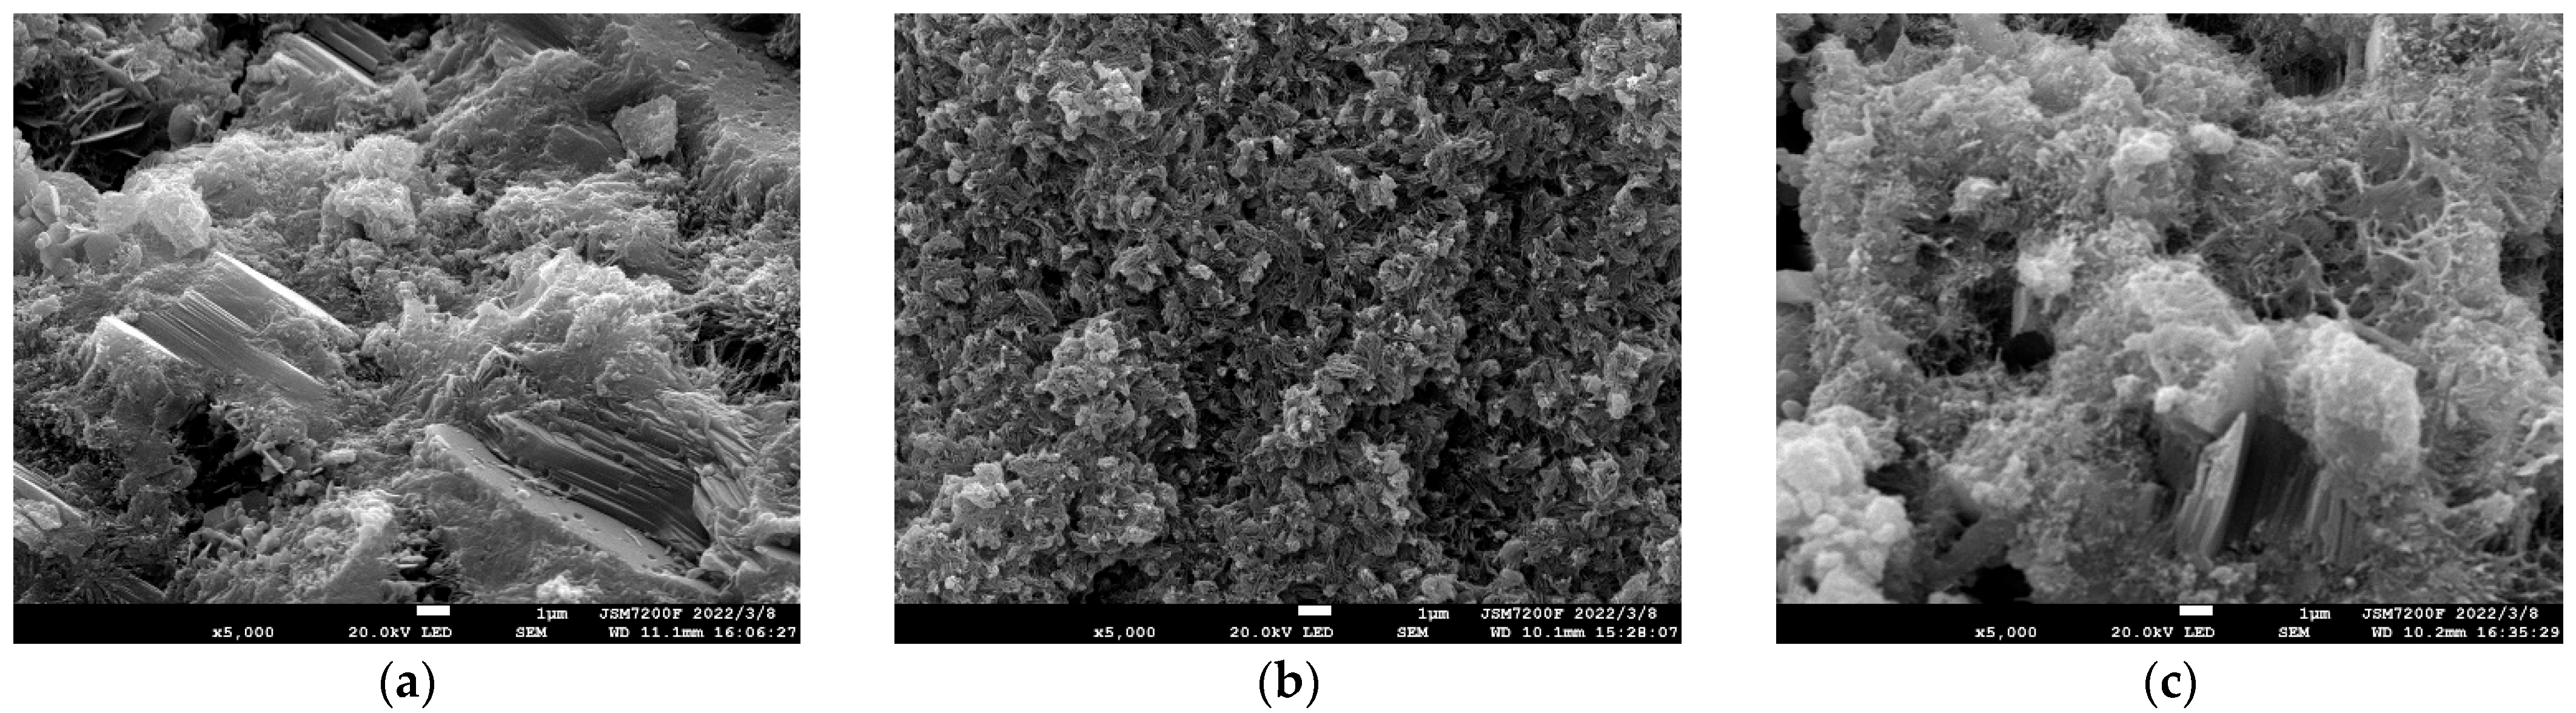
4.1. Experimental Results

The results of triaxial compressive and Brazilian splitting tests are shown in Table 2. The compressive strength, tensile strength, Young’s modulus, and Poisson’s ratio decrease with the temperature increase up to 150 °C. Compared to 80 °C, the compressive strength at 150 °C declines drastically by 65%, the tensile strength by 72%, Young’s modulus by 87%, and Poisson’s ratio by 22% at C/S = 1.8. By increasing silica content, the strength and modulus rise to some extent, while Poisson’s ratio is further reduced. At 1.1 C/S, the compressive strength at 150 °C decreases by 24%, the tensile strength by 16%, Young’s modulus by 72%, and Poisson’s ratio by 39% compared to 80 °C.
The results of the XRD tests are shown in Figure 4. At 80 °C and 1.8 of C/S, we find C3S (2θ = 29.3°, 32.1°), Ca(OH)2 (2θ = 18.0°, 34.1°, 47.1°, 50.8°, 54.3°, 62.6°, 64.2°), ettringite (2θ = 9.0°, 15.8°, 22.9°, 37.1°), and C2AF (2θ = 12.1°33.6°, 43.8°).
At 150 °C and 1.8 of C/S, more C3S (2θ = 22.9°, 29.3°, 32.1°, 32.6°, 51.8°, 62.4°) is found, and either C2S(2θ = 32.1°, 32.6°, 41.3°). C3S and C2S are dehydrated products. Furthermore, the peak of Ca(OH)2 (2θ = 34.1°, 47.1°) is lower than that at 80 °C, which means it has a smaller amount of Ca(OH)2. One possible reason for these findings is that CH participates in the reaction and produces some other crystallographic hydration products [3,7,12,13], although we did not detect them, or some reactions generate other hydration products instead of CH at 150 °C and 1.8 of C/S. These may result in a low diffraction peak of CH. Additionally, the high temperature makes the hydration rate faster, which may lead to the rapid formation of a dense cladding layer of CSH, resulting in insufficient hydration of cement in the layer, thus showing C3S and C2S diffraction peaks. Through increasing the content of silica (C/S = 1.1, 150 °C), the peaks of C3S decline (2θ = 29.3°, 32.1°, 32.6°), and the peak and amount of Ca(OH)2 (2θ = 18.0°, 34.1°, 47.1°, 50.8°, 54.3°, 62.6°, 64.2°) rise compared to that at C/S = 1.8, 150 °C. In addition, many C2SH and C2AF are found. Ca(OH)2, C2SH, and C2AF are all hydration products. Adding more silica consumes more C3S and produces more hydration products, implying that more silica promotes sufficient hydration reaction. However, at C/S = 1.1 and 150 °C, some C2SH are lime-rich alpha-dicalcium silicate hydrate α-C2SH (2θ = 27.28°, 25.10°) [3] which is commonly accepted as a weaker type of crystal phase [31]. Moreover, some SiO2 is found (2θ = 20.98°, 27.18°) in the C3 curve because some SiO2 may not participate in the hydration after a large amount of SiO2 was added to the C3 specimen.
As shown in Figure 5a,c, the DTG curves of C1 and C3 have peaks at approximately 110 °C due to the dehydration of C-S-H gel and Ettringite. The absolute peak value of the DTG curve for C1 (Figure 5a) is greater than that of C3 (Figure 5c) at approximately 110 °C. Accordingly, a small endothermic peak appears in the DSC curve for C1 (Figure 5d). The DTG and DSC curves of C2 have no peak near 110 °C (Figure 5b). This implies that C1 generates more C-S-H in hydration, C3 generates some but relatively few, while C2 has the least. The peak value of the DTG curve at approximately 400 °C is mainly the dehydration of Ca (OH)2. The DTG curves of C1 (Figure 5a) and C3 (Figure 5c) peak at approximately 400 °C, and the endothermic peaks appear in the DSC curve (Figure 5d). The DTG peak of C3 is larger than C1, and there is still no obvious peak value for C2. This means that C3 generates more Ca(OH)2, followed by C1, and almost no for C2. The peak value of the DTG curves of C1, C2, and C3 at approximately 650 °C is mainly CaCO3 dehydration, indicating that CaCO3 exists in all three samples. Based on the TG curve, C3 has the most weight loss (Figure 5c), C1 takes second place (Figure 5a), and C2 has the least weight loss (Figure 5b). This may be due to the fact that C2 has less removable water. In summary, C1 produces the most hydration products, indicating that its hydration is the most sufficient, C3 takes second place with some hydration, and C2 has the least hydration products and the least degree. These results are consistent with the XRD results.
The SEM micrographs of well cement stone under different curing conditions and C/S are shown in Figure 6. Under conventional curing conditions (80 °C, 15 MPa), even if the C/S is very high (1.8), the cement stone is very dense (Figure 6a). However, as the temperature rises to 150 °C, as shown in Figure 6b, there are many pores in the matrix, and the phase appears needle shape. This may be due to the fact that many phases of C3S and C2S are not involved in hydration based on the XRD results. At the same temperature of 150 °C, when the C/S is reduced to 1.1, the cement stone becomes denser (Figure 6c) than that at C/S = 1.8 (Figure 6b), but the pores are slightly larger than those at 80 °C (Figure 6a). Again, it indicates that increasing the proportion of silicon can promote a sufficient hydration process to a certain extent.

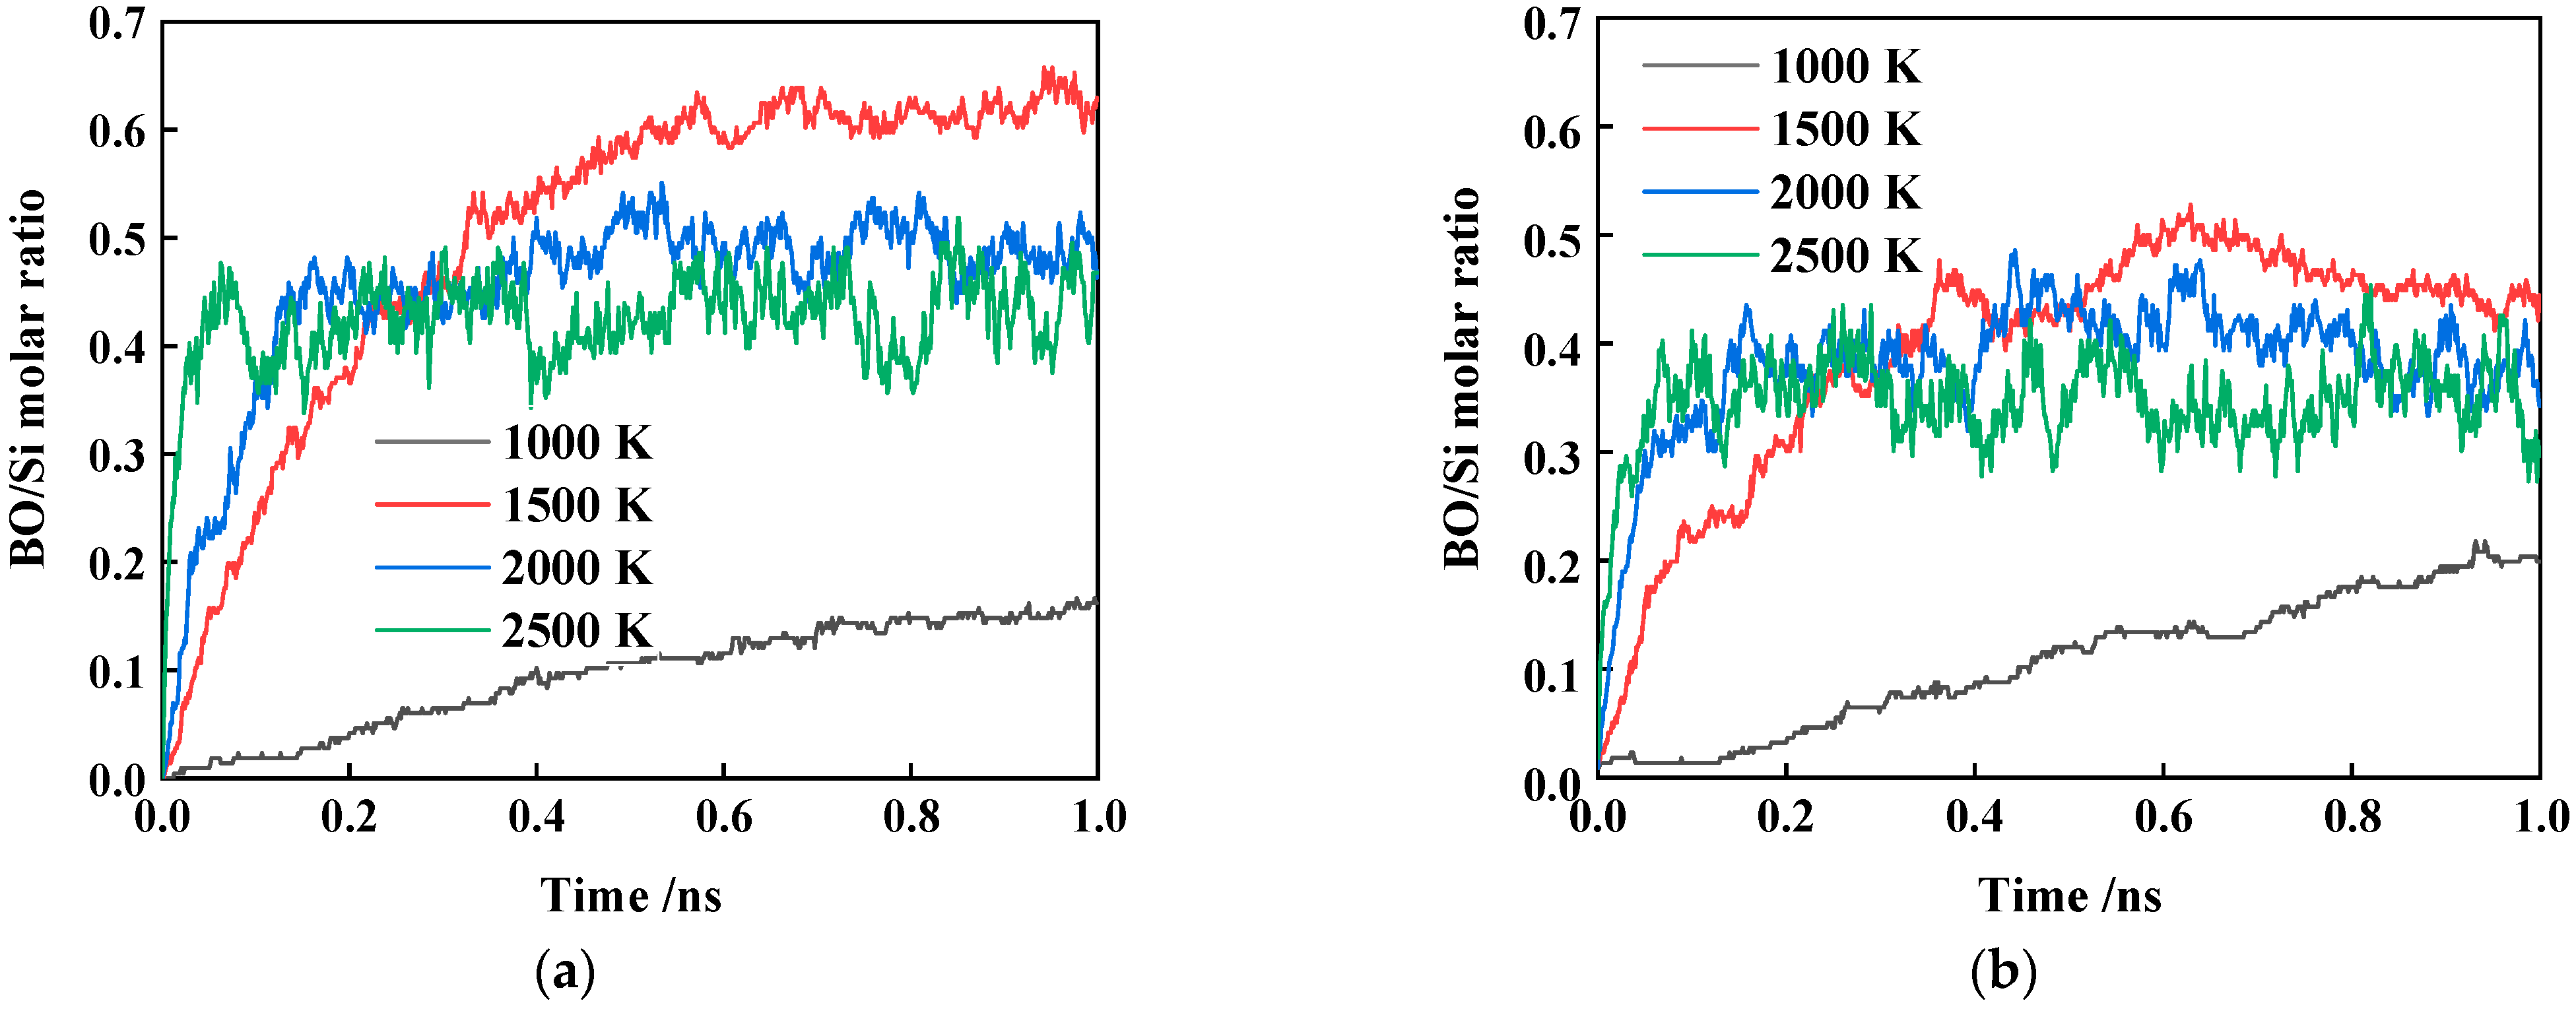
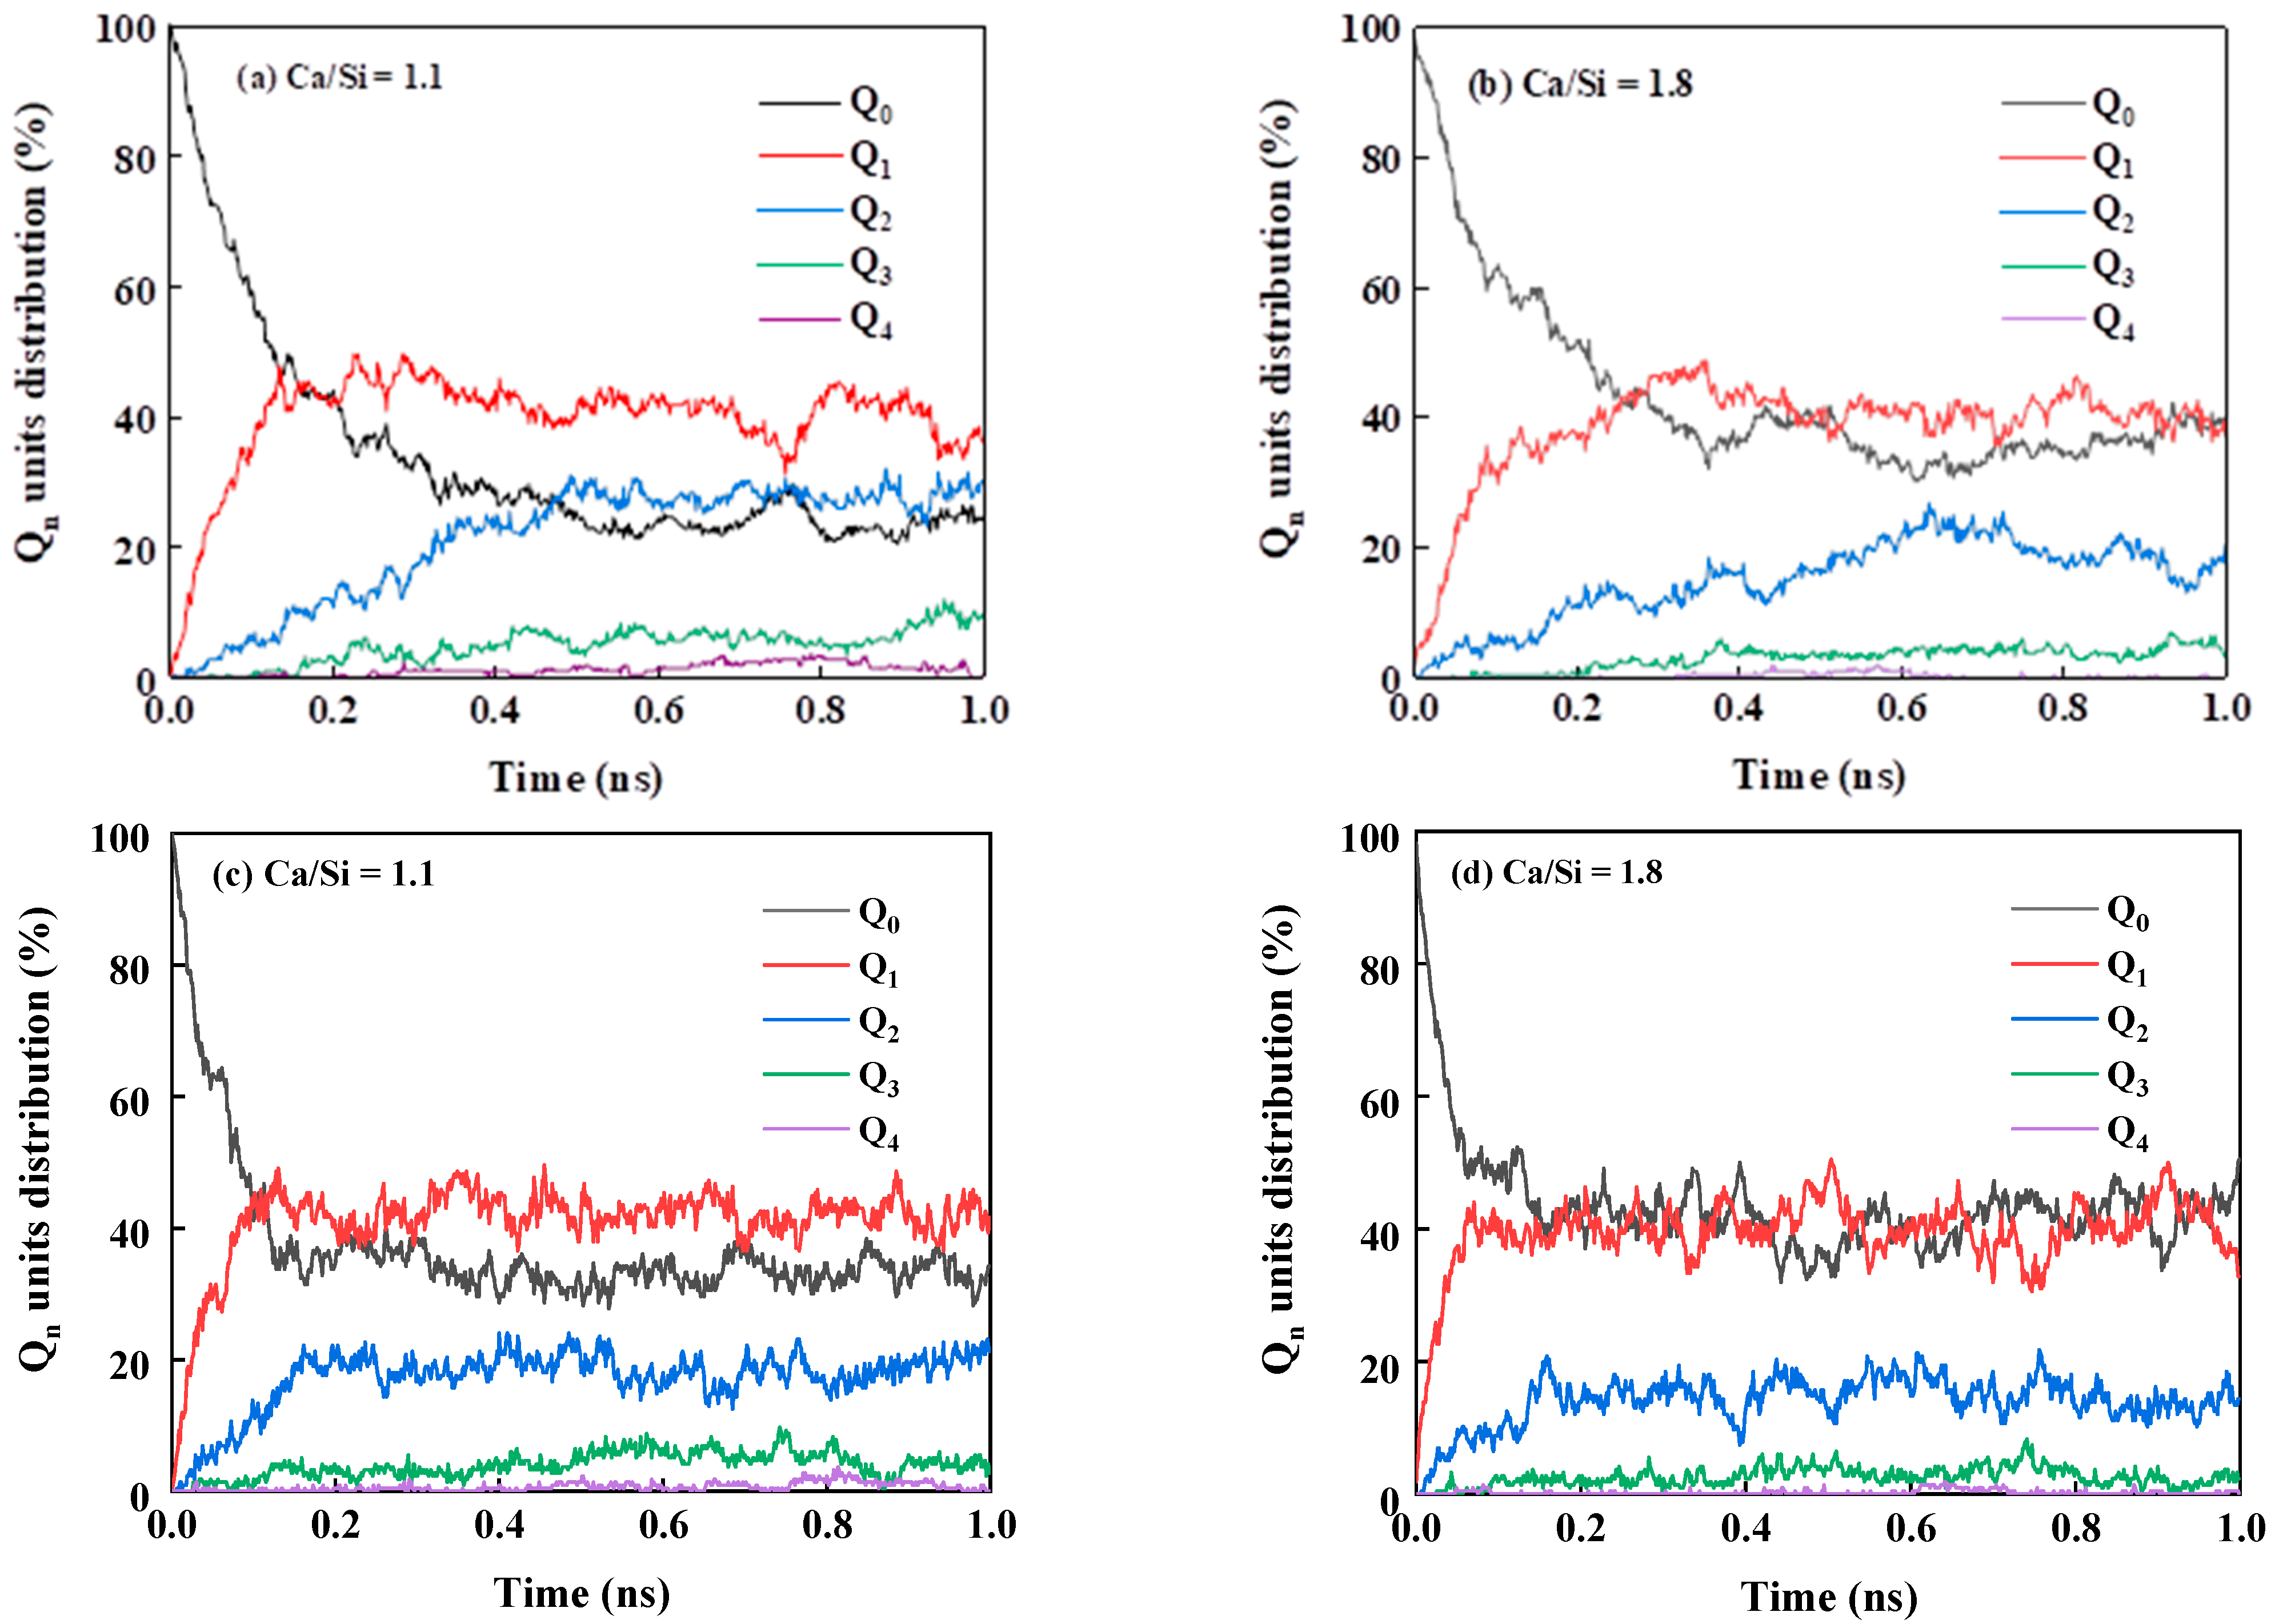
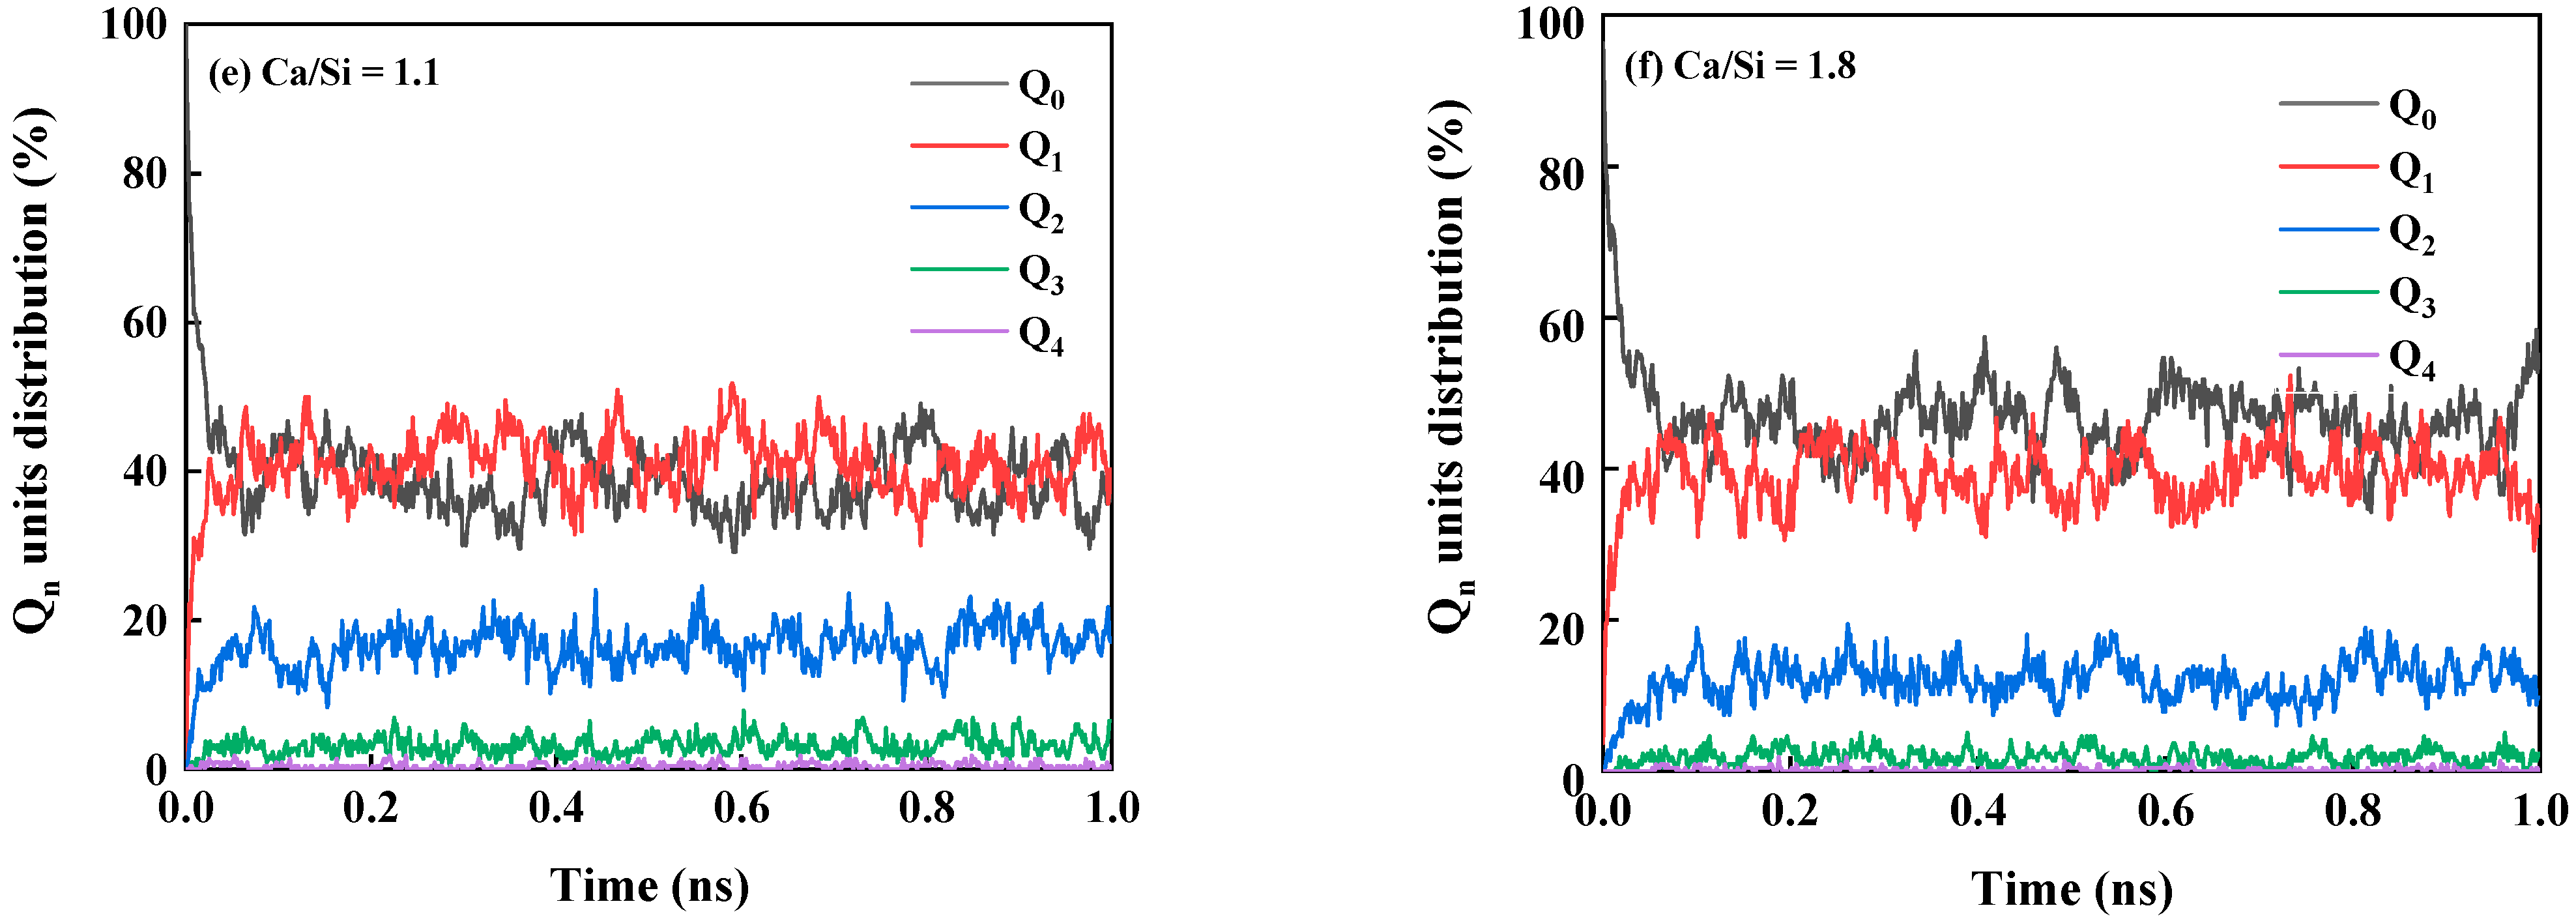
4.2. Influence of Temperature and C/S on Polymerization Degree, Polymerization Rate, and Microstructure of C-S-H

The polymerization process from the fracture of the Si-O-H bond to the formation of the Si-O-Si bond needs to overcome high energy barriers. Therefore, the reaction rate is very slow and cannot be accomplished within the MD simulation process. According to Refs. [19,22], the reaction can be effectively accelerated by increasing the simulation temperature. As such, the simulations are under elevated temperatures, and the influence of temperature on the gelation process is analyzed.
The content of bridging oxygen (BO) reflects the overall degree of polymerization of C-S-H. The higher the amount of BO, the higher the degree of polymerization, and the more favorable it is for the formation of macro strength. As shown in Figure 7, the degree of polymerization of all C-S-H systems can reach a stable state from 0.3 ns, indicating that the reaction time is long enough. The higher the temperature is, the greater the initial polymerization rate (the initial slope of curves) is. The final amount of BO is relatively small with the temperature, indicating that the polymerization degree of gel decreases. However, by increasing the proportion of silicon to C/S = 1.1, the hydration rate (slope) is relatively lower, and more BO is formed (Figure 7a) compared to those with C/S = 1.8 (Figure 7b).
According to the shape of the BO/Si curve in Figure 7, the first-order exponential decay function [19] is used to fit the curve to obtain the initial polymerization rate, as shown in Table 3. The polymerization rate increases with the temperature, while it slows down with the decrease in C/S.
The distribution of different silicon atoms (Qn, n = 0–4) can reflect the topological structure of the C-S-H gel. Qn corresponds to the type of silicon atom connected to n BO. The content of Qn can characterize the change in the topological structure of C-S-H during the polymerization reaction. A larger n in Qn indicates a more polymerized structure, which is favorable for the development of macro strength. Before the reaction, all conformations contain only the Q0 unit, as shown in Figure 8. The relative contents of Q1 and Q2 gradually increase, and a certain number of Q3 and Q4 units form with the continuous consumption of Q0 units in reactions. For the same C/S, the reaction generates less Qn (n = 1–4) and retains more Q0 when the temperature increases (Figure 8a–f). It shows that high temperatures weaken the degree of sufficient hydration and stability of the gel structure. For the same temperature, with the increase in silicon proportion, the generated Qn (n = 1–4) increases, especially Q2, Q3, and Q4 (Figure 8a–f), indicating that reducing C/S is helpful in forming a more stable microstructure.
Based on the above experimental and simulation results, the initial polymerization rate is too fast for the initial hydration with the increase in temperature. Furthermore, the amount of generated BO is smaller, and the C-S-H structure is less polymerized. This implies that the degree of polymerization is low and insufficient at this temperature. If the initial hydration rate is too fast, the hydration is not more diffused, and then products are not uniformly dispersed in the microstructure of cement particles. At the same time, the cement particles are wrapped by a dense gel layer and are not fully hydrated. These factors affect the sufficient hydration of cement, resulting in a low degree of polymerization and poor stability of the C-S-H structure, thereby affecting the further development of strength. Therefore, reducing the initial hydration rate is suggested to promote an adequate hydration reaction of well cement at high temperatures. Reducing C/S can increase the initial hydration rate based on the experimental and simulation results, and improve the sufficiency of the reaction, and then the strength of cement.

4.3. Influence of Temperature and C/S on Mechanical Properties and Fracture Behavior of C-S-H

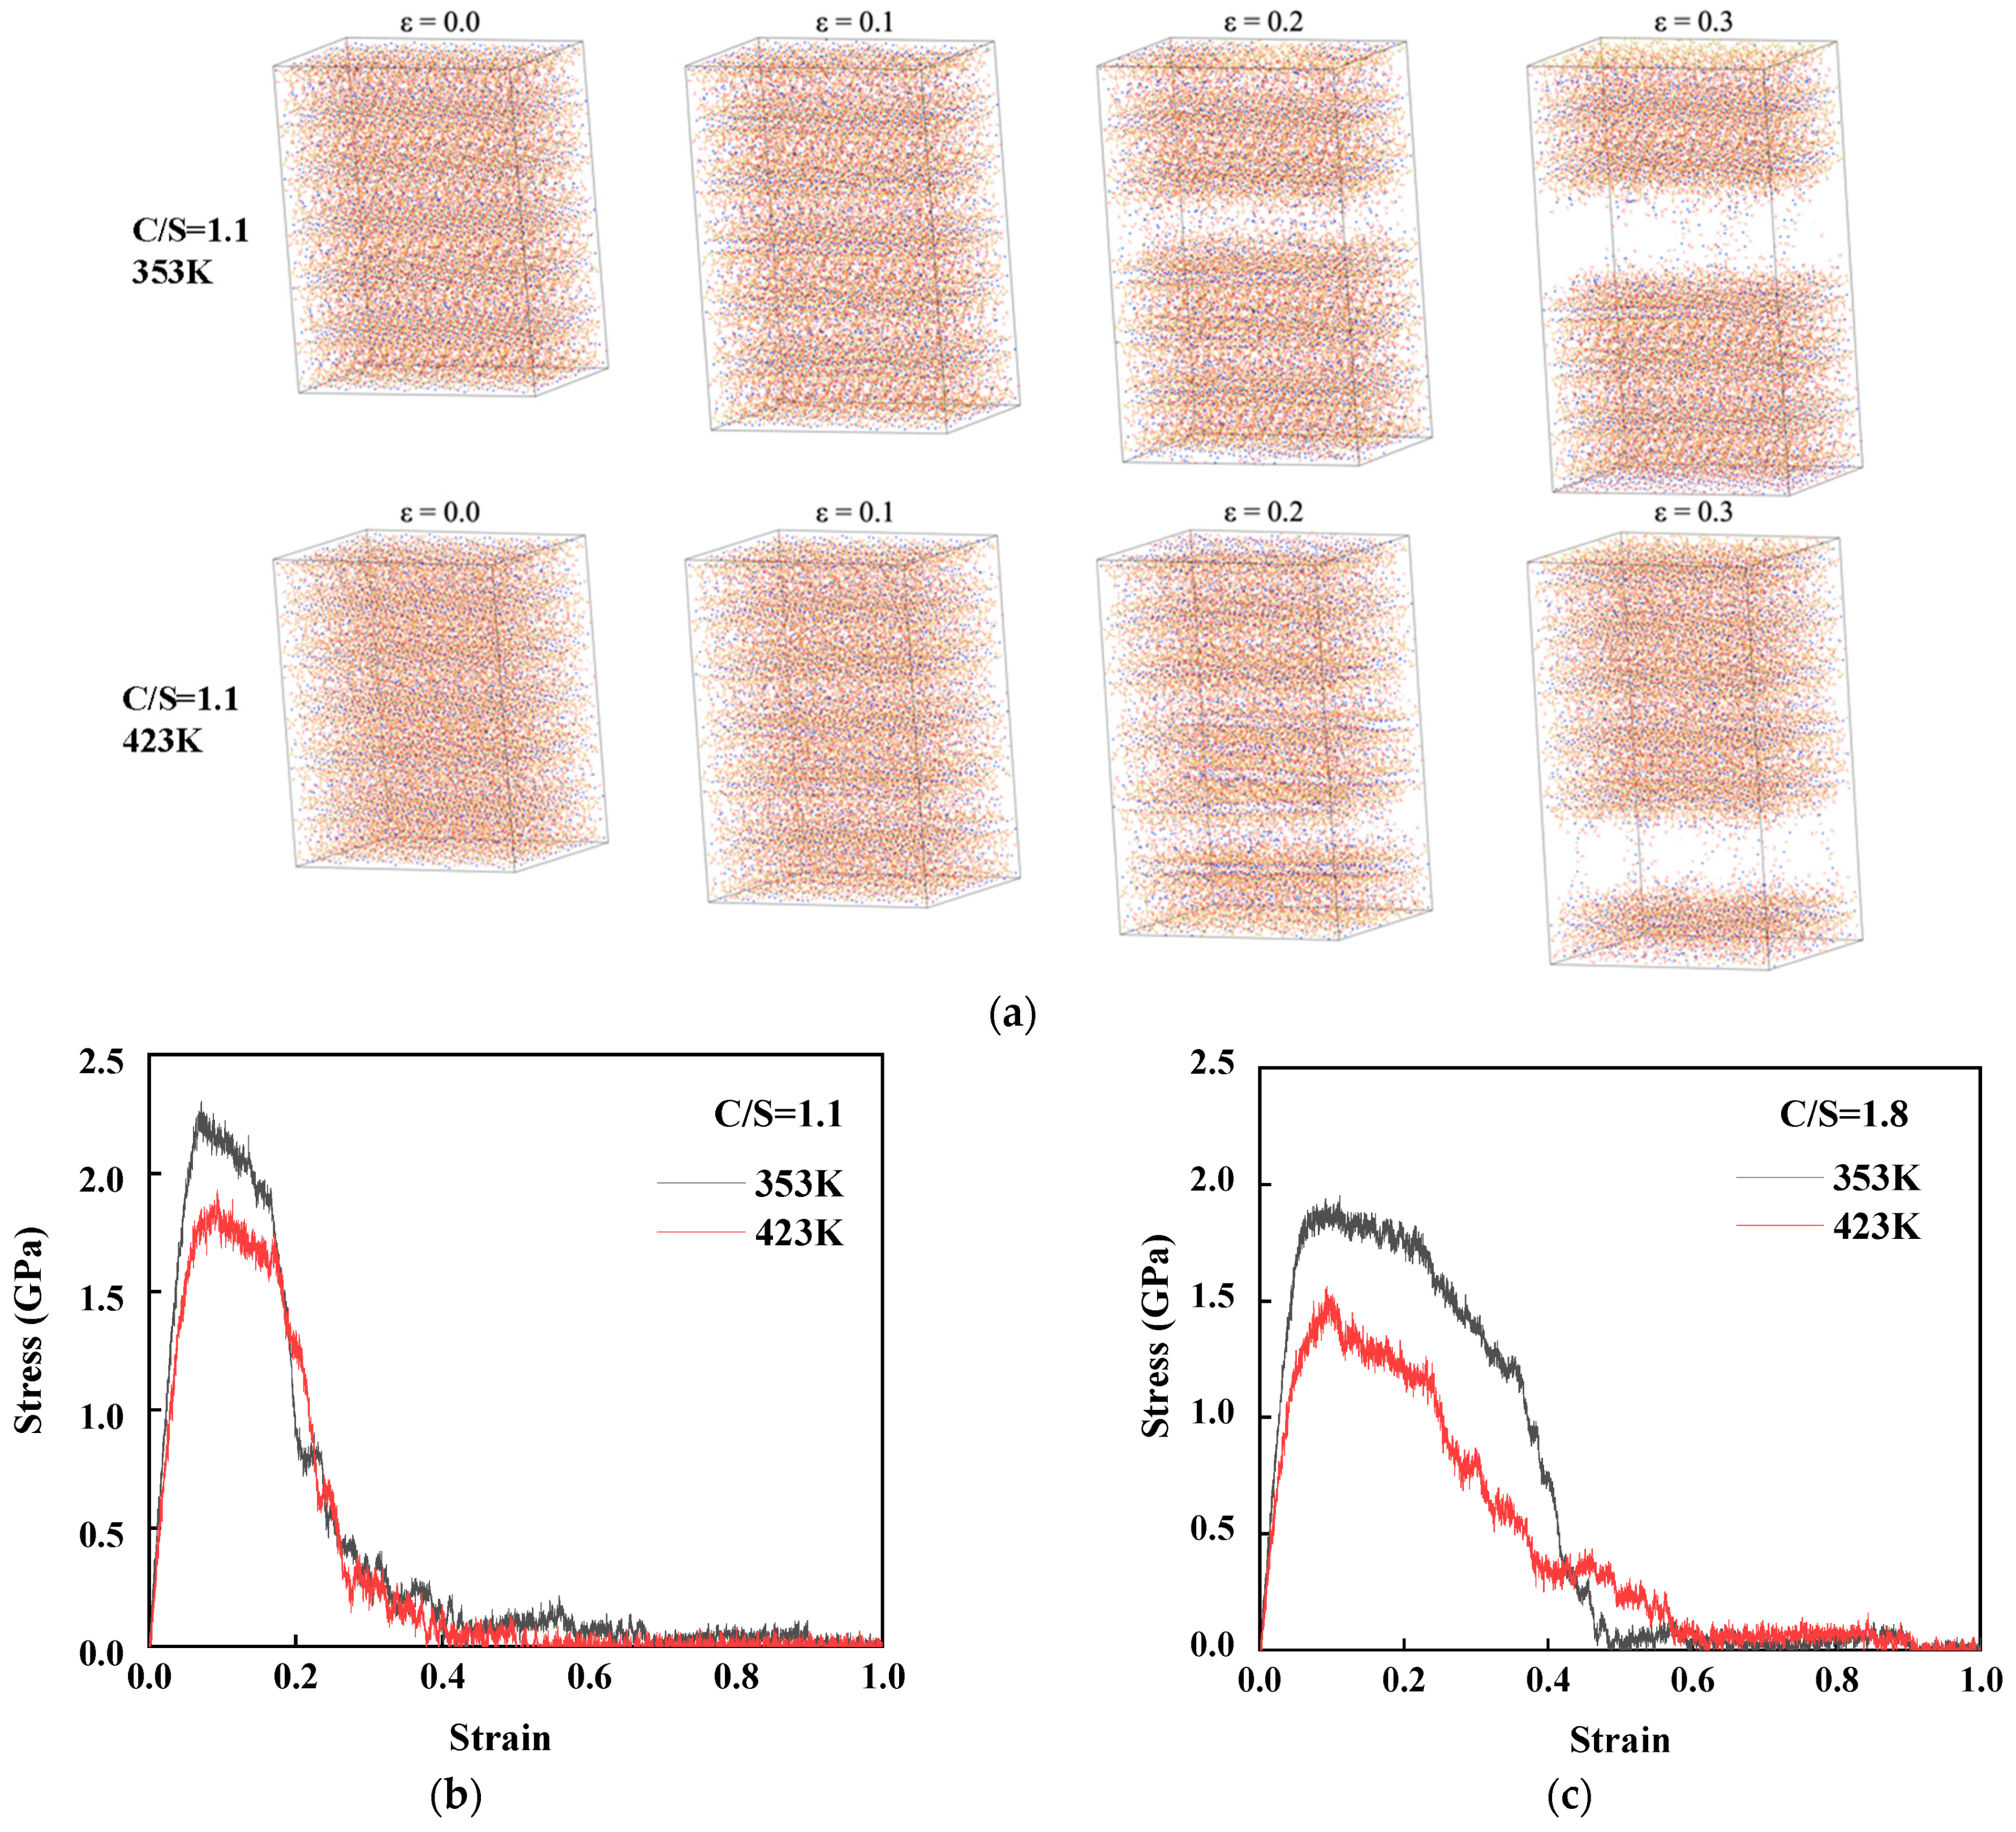
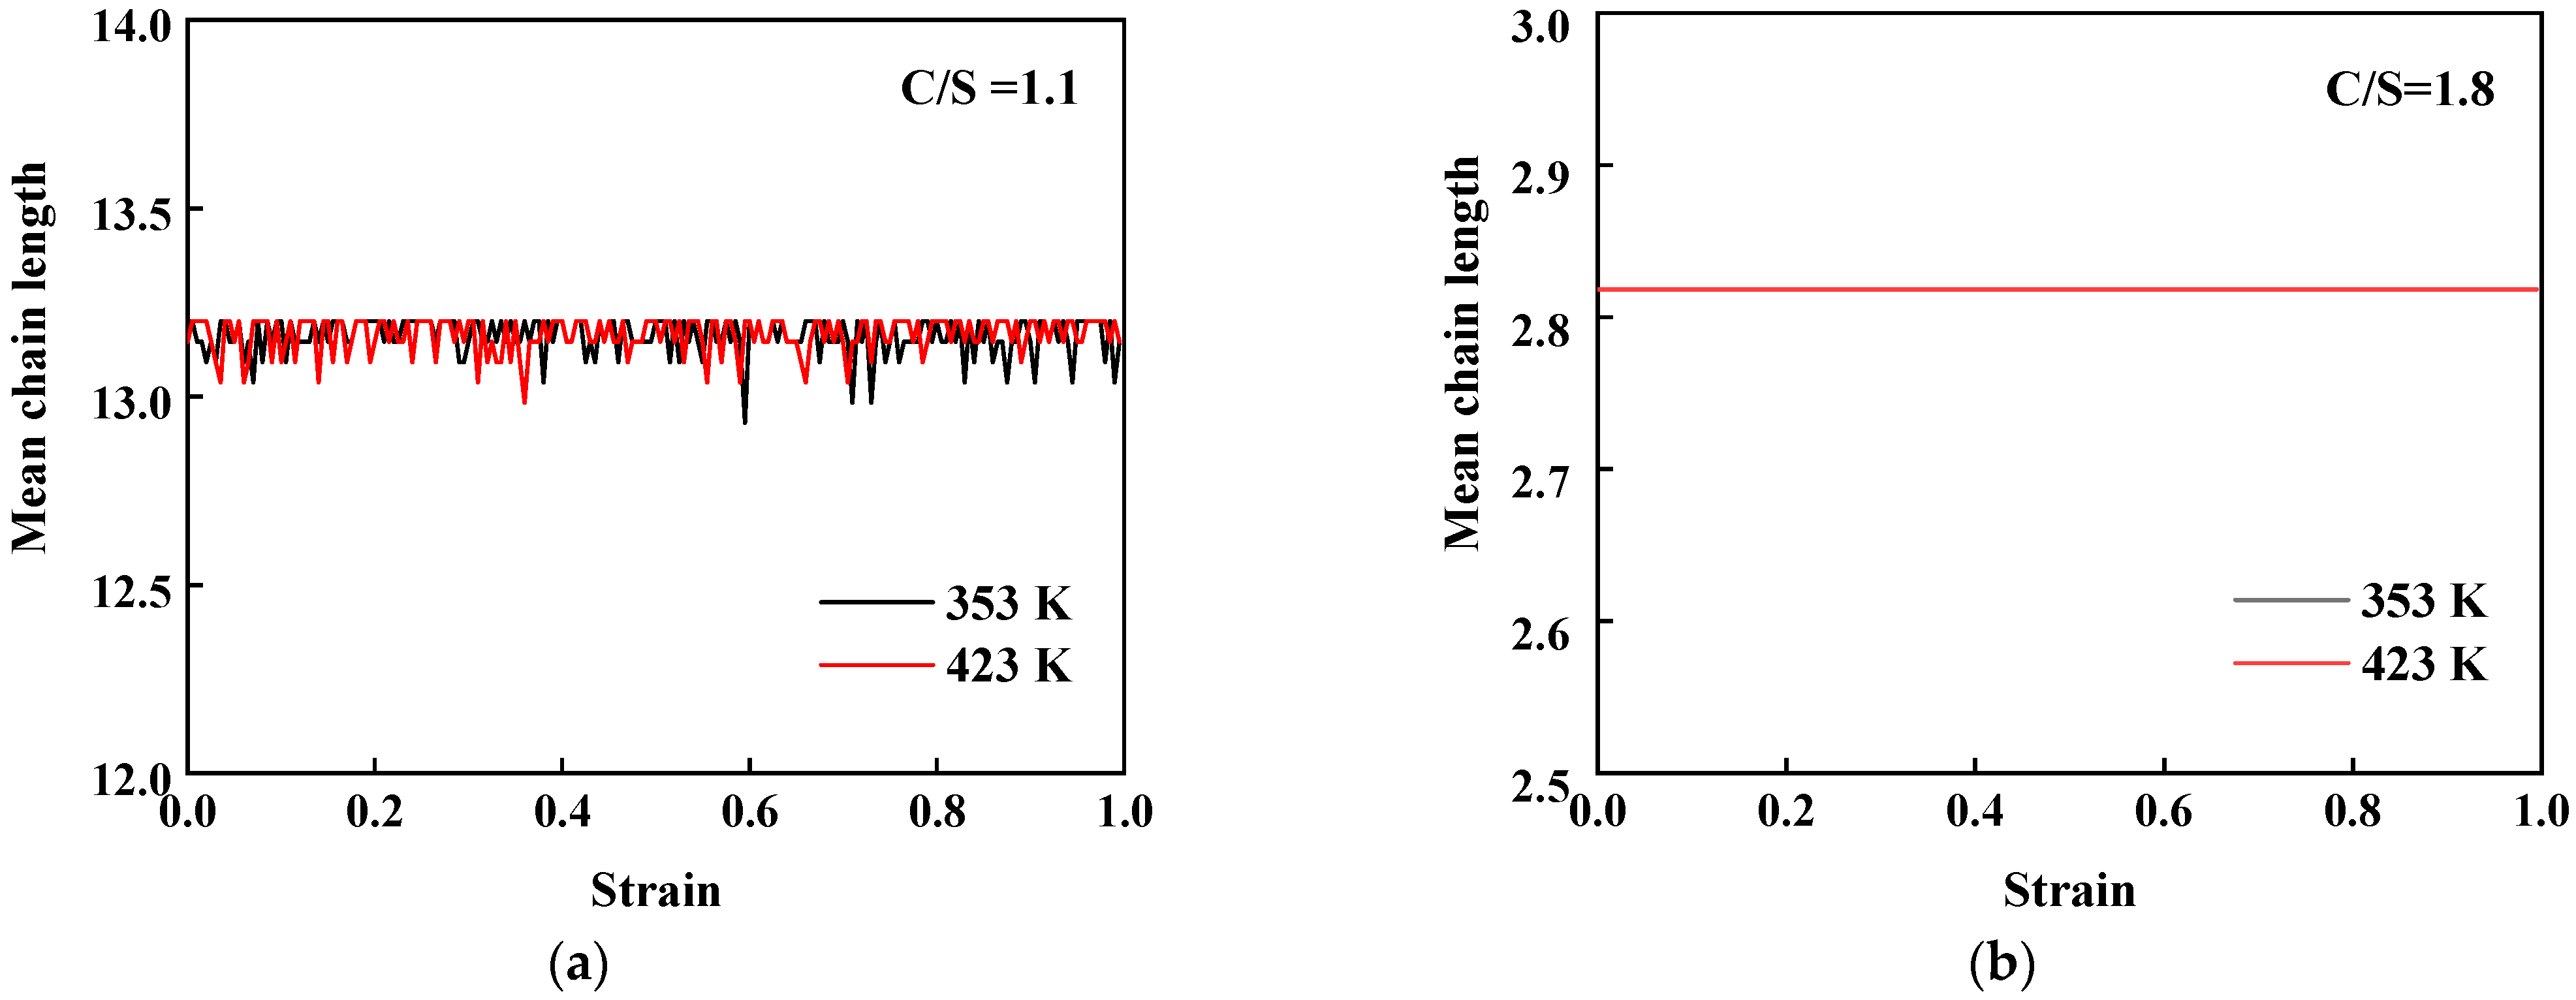
4.3.1. Mechanical Behavior and Fracture Process

Figure 9a shows the structural development of the model during tension. The modeling method is described in Section 3.2. The z-direction is the weakest direction of strength, and the strength obtained in the x- and y-directions is higher than that in the z-direction. Therefore, the tensile process and related properties in the z-direction are investigated here. The loading rate is 0.004 strain per picosecond. The failure occurs in the calcium oxide layer, and the model breaks with the increase in strain (Figure 9a).
As shown in Figure 9b,c, the strength decreases with the temperature from 353 K (80 °C) to 423 K (150 °C), but it increases by reducing C/S. In the tensile process, at high C/S (1.8), the length of the Si-O chain does not change with the temperature, as shown in Figure 10b. However, from Figure 11b, the peak value of the coordination number of Ca is larger with a higher temperature, indicating that there are fewer breakage of calcium oxygen bonds and less absorbed strain energy, resulting in worse performance than that at 353 K. In addition, high C/S contains more calcium, which is equivalent to more defects and lower strength. At low C/S (1.1), with the increase in temperature, the length of the Si-O chain experiences a change (Figure 10a). Even a tiny change in the Si-O chain has a more significant impact on the macro strength of cement. Furthermore, the peak value of the coordination number of Ca is slightly larger (Figure 11a), indicating that there is less fracture in the Ca-O bond, resulting in less absorbed strain energy and worse performance. In addition, Yao et al. [10] point out that the calcium oxide layer becomes irregular with the temperature. For example, when the temperature rises to 1000 K, the calcium oxide layer collapses. This is also the reason for the decrease in macro strength.

4.3.2. Elastic Behaviors

The elastic properties of different C-S-H gels are shown in Table 4. Under the same C/S, Young’s modulus and the shear modulus decrease with an increasing temperature. Reducing C/S to 1.1 will increase Young’s and shear modulus. This trend is consistent with the previous simulation and experimental data [29] because the topological constraint density in atomic networks decreases with the C/S ratio [32].

5. Conclusions

The results of triaxial pressure tests and Brazilian splitting tests show that when the curing temperature increases from 80 °C to 150 °C at C/S = 1.8, the compressive and tensile strength of well cement decline drastically by approximately 70%, and the modulus and Poisson’s ratio by 87% and 22%. By reducing the C/S to 1.1, the strength rebounded. The compressive and tensile strength decreased by approximately 20%, and the modulus and Poisson’s ratio by 72% and 39%. From the results of XRD, TG/DTG/DSC, and SEM, with an increase in temperature to 150 °C, more phases are not involved in hydration, resulting in insufficient hydration and more large pores in the microstructures. By increasing the calcium silicon ratio to 1.1, the adequacy of hydration degree will be improved to a certain extent.
As the main binding phase of cement, the hydration and mechanical behaviors of C-S-H under different curing temperatures were further investigated through molecular dynamics simulations. Through the hydration simulations, it was found that the polymerization rate of C-S-H in the initial hydration process is higher at a higher temperature to carry out sufficient hydration reaction, resulting in a small amount of BO, a low degree of polymerization, and low stability of the C-S-H topological structure, thereby affecting the macro strength. Therefore, reducing the initial hydration rate is suggested to ensure more sufficient hydration reactions. Decreasing C/S can reduce the initial hydration rate and improve reaction sufficiency and strength.
Molecular dynamics simulate the mechanical behavior and fracture process, and the failure occurs in the calcium oxygen layer. The strength decreases with the temperature but increases by reducing the C/S ratio. With the increase in temperature to 423 K (150 °C), C-S-H has fewer calcium oxygen bond breaks to absorb strain energy, resulting in worse performance. The length of silicate chains does not change at C/S = 1.8, while it changes at C/S = 1.1. Under the same C/S, Young’s modulus and the shear modulus decline with the temperature. Decreasing C/S to 1.1 will increase Young’s modulus and the shear modulus.

Author Contributions

Conceptualization, S.Z.; Data curation, Y.L.; Formal analysis, Y.L.; Funding acquisition, R.L. and P.L.; Investigation, R.L., Y.L. and T.D.; Methodology, Y.L.; Project administration, P.L.; Software, T.D.; Supervision, S.Z. and Y.W.; Validation, Y.W.; Writing—original draft, Y.L.; Writing—review & editing, Y.L. and T.D. All authors have read and agreed to the published version of the manuscript.

Funding

We are grateful for the support provided through the Basic Research Program on Deep Petroleum Resource Accumulation and Key Engineering Technologies (No. U19B6003), the Project of the Sinopec Key Laboratory of well cementing and completion (No. 35800000-21-ZC0607-0044), the Project of China University of Petroleum, and the Natural Science Foundation of Jiangsu Province (No. BK20200655).

Conflicts of Interest

The authors declare no conflict of interest.

References

  1. DeBruijn, G.; Skeates, C.; Greenaway, R.; Harrison, D.; Parris, M.; James, S.; Mueller, F.; Ray, S.; Riding, M. High-pressure, high-temperature technologies. Oilfield Rev. 2008, 20, 46–60. Available online: https://www.slb.com/resource-library/oilfield-review/defining-series/defining-hpht (accessed on 17 August 2022).
  2. Ali, M.; Jarni, H.H.; Aftab, A.; Ismail, A.R.; Saady, N.M.C.; Sahito, M.F.; Keshavarz, A.; Iglauer, S.; Sarmadivaleh, M. Nanomaterial-based drilling fluids for exploitation of unconventional reservoirs: A review. Energies 2020, 12, 3417. [Google Scholar] [CrossRef]
  3. Krakowiak, K.J.; Thomas, J.J.; Musso, S.; James, S.; Akono, A.-T.; Ulm, F.-J. Nano-chemo-mechanical signature of conventional oil-well cement systems: Effects of elevated temperature and curing time. Cem. Concr. Res. 2015, 67, 103–121. [Google Scholar] [CrossRef]
  4. Pernites, R.B.; Santra, A.K. Portland cement solutions for ultra-high temperature wellbore applications. Cem. Concr. Compos. 2016, 72, 89–103. [Google Scholar] [CrossRef]
  5. Eilers, L.H.; Root, R.L. Long-term effects of high temperature on strength retrogression of cements. In Proceedings of the SPE California Regional Meeting, Long Beach, CA, USA, 7–9 April 1974; p. 5871. [Google Scholar] [CrossRef]
  6. Yang, Z.; Cui, H.; Xiao, Z. Change of cement stone strength in the deep high temperature oil well. Acta Pet. Sin. 2008, 29, 435–437. [Google Scholar]
  7. Nelson, E.B.; Guillot, D. Well Cementing, 2nd ed.; Schlumberger: Houston, TX, USA, 2006. [Google Scholar]
  8. Liang, X.; Wu, C.; Yang, Y.; Li, Z. Experimental study on ultra-high performance concrete with high fire resistance under simultaneous effect of elevated temperature and impact loading. Cem. Concr. Compos. 2019, 98, 29–38. [Google Scholar] [CrossRef]
  9. Zhang, Y.; Ju, J.W.; Zhu, H.; Yan, Z. A novel multi-scale model for predicting the thermal damage of hybrid fiber-reinforced concrete. Int. J. Damage Mech. 2019, 29, 19–44. [Google Scholar] [CrossRef]
  10. Zhang, Y.; Zhou, Q.; Ju, J.W.; Bauchy, M. New insights into the mechanism governing the elasticity of calcium silicate hydrate gels exposed to high temperature: A molecular dynamics study. Cem. Concr. Res. 2021, 141, 106333. [Google Scholar] [CrossRef]
  11. Krakowiak, K.J.; Thomas, J.J.; James, S.; Abuhaikal, M.; Ulm, F.-J. Development of silica-enriched cement-based materials with improved aging resistance for application in high-temperature environments. Cem. Concr. Res. 2018, 105, 91–110. [Google Scholar] [CrossRef]
  12. Luke, K. Phase studies of pozzolanic stabilized calcium silicate hydrates at 180 °C. Cem. Concr. Res. 2004, 34, 1725–1732. [Google Scholar] [CrossRef]
  13. Nelson, E.B.; Eilers, L.H. Cementing steamflood and fireflood wells e slurry design. J. Can. Pet. Technol. 1985, 24, 58–63. [Google Scholar] [CrossRef]
  14. Jennings, H.M. Refinements to colloid model of C-S-H in cement: CM-II. Cem. Concr. Res. 2008, 38, 275–289. [Google Scholar] [CrossRef]
  15. Ioannidou, K.; Del Gado, E.; Ulm, F.J.; Pellenq, R.J.M. Inhomogeneity in cement hydrates: Linking local packing to local pressure. J. Nanomech. Micromech. 2017, 7, 3–8. [Google Scholar] [CrossRef]
  16. Pellenq, R.J.-M.; Kushima, A.; Shahsavari, R.; Van Vliet, K.J.; Buehler, M.J.; Yip, S.; Ulm, F.-J. A realistic molecular model of cement hydrates. Proc. Natl. Acad. Sci. USA 2009, 106, 16102–16107. [Google Scholar] [CrossRef] [Green Version]
  17. Hou, D.; Li, D.; Zhao, T.; Li, Z. Confined water dissociation in disordered silicate nanometer-channels at elevated temperatures: Mechanism, dynamics and impact on substrates. Langmuir 2016, 32, 4153–4168. [Google Scholar] [CrossRef]
  18. Krishnan, N.M.A.; Wang, B.; Falzone, G.; Le Pape, Y.; Neithalath, N.; Pilon, L.; Bauchy, M.; Sant, G. Confined water in layered silicates: The origin of anomalous thermal expansion behavior in calcium-silicate hydrates. ACS Appl. Mater. Interfaces 2016, 8, 35621–35627. [Google Scholar] [CrossRef]
  19. Du, T.; Li, H.; Zhou, Q.; Wang, Z.; Sant, G.; Ryan, J.V.; Bauchy, M. Chemical composition of calcium-silicate-hydrate gels: Competition between kinetics and thermodynamics. Phys. Rev. Mater. 2019, 3, 065603. [Google Scholar] [CrossRef]
  20. API RP 10B-2; Recommended Practice for Testing Well Cements. American Petroleum Institute: Washington, DC, USA, 2013.
  21. Plimpton, S. Fast Parallel Algorithms for Short-Range Molecular Dynamics. J. Comput. Phys. 1995, 117, 1–19. [Google Scholar] [CrossRef] [Green Version]
  22. Côté, A.S.; Cormack, A.N.; Tilocca, A. Influence of Calcium on the Initial Stages of the Sol-Gel Synthesis of Bioactive Glasses. J. Phys. Chem. B 2016, 120, 11773–11780. [Google Scholar] [CrossRef]
  23. Martínez, L.; Andrade, R.; Birgin, E.G.; Martínez, J.M. PACKMOL: A package for building initial configurations for molecular dynamics simulations. J. Comput. Chem. 2009, 30, 2157–2164. [Google Scholar] [CrossRef]
  24. Du, T.; Li, H.; Sant, G.; Bauchy, M. New insights into the sol-gel condensation of silica by reactive molecular dynamics simulations. J. Chem. Phys. 2018, 148, 234504. [Google Scholar] [CrossRef]
  25. Pitman, M.C.; Duin, A. Dynamics of confined reactive water in smectite clay-zeolite composites. J. Am. Chem. Soc. 2012, 134, 3042. [Google Scholar] [CrossRef]
  26. Hou, D.; Hu, C.; Li, Z. Molecular Simulation of the Ions Ultraconfined in the Nanometer-Channel of Calcium Silicate Hydrate: Hydration Mechanism, Dynamic Properties, and Influence on the Cohesive Strength. Inorg. Chem. 2017, 56, 1881–1896. [Google Scholar] [CrossRef]
  27. Côté, A.S.; Cormack, A.N.; Tilocca, A. Reactive molecular dynamics: An effective tool for modelling the sol–gel synthesis of bioglasses. J. Mater. Sci. 2017, 52, 9006–9013. [Google Scholar] [CrossRef]
  28. Manzano, H.; Pellenq, R.J.M.; Ulm, F.-J.; Buehler, M.J.; van Duin, A.C.T. Hydration of calcium oxide surface predicted by reactive force field molecular dynamics. Langmuir 2012, 28, 4187–4197. [Google Scholar] [CrossRef]
  29. Qomi, M.A.; Krakowiak, K.; Bauchy, M.; Stewart, K.; Shahsavari, R.; Jagannathan, D.; Brommer, D.; Baronnet, A.; Buehler, M.; Yip, S.; et al. Combinatorial molecular optimization of cement hydrates. Nat. Commun. 2014, 5, 4960. [Google Scholar] [CrossRef]
  30. Gale, J.D.; Rohl, A.L. The general utility lattice program (GULP). Mol. Simul. 2003, 29, 291–341. [Google Scholar] [CrossRef]
  31. Gibson, S. Novel solution to cement strength retrogression. In Proceedings of the SPE/IADC Drilling Conference and Exhibition, Amsterdam, The Netherlands, 1–3 March 2011; p. 138852. [Google Scholar] [CrossRef]
  32. Yang, K.; Yang, B.; Xu, X.; Hoover, C.; Smedskjaer, M.M.; Bauchy, M. Prediction of the Young’s modulus of silicate glasses by topological constraint theory. J. Non-Cryst. Solids 2019, 514, 15–19. [Google Scholar] [CrossRef]
Figure 1. Testing and specimens. (a) Triaxial compression tests and specimens. (b) Brazilian splitting tensile strength tests and specimens.
Energies 15 06045 g001aEnergies 15 06045 g001b
Figure 2. Atomic structures of C-S-H with C/S = 1.1 before (a) and after (b) reactions at 1500 K. Note: Yellow for silica atoms; red for oxygen atoms; blue for calcium atoms.
Energies 15 06045 g002
Figure 3. The model of C-S-H for mechanical properties and fracture behavior estimation.
Energies 15 06045 g003
Figure 4. XRD patterns of cement under different C/S and curing conditions.
Energies 15 06045 g004
Figure 5. TG/DTG/DSC patterns of cement under different C/S and curing conditions. (a) TG/DTG tests for C1 (80 °C, C/S = 1.8); (b) TG/DTG tests for C2 (150 °C, C/S = 1.8); (c) TG/DTG tests for C3(150 °C, C/S = 1.1); (d) DSC tests.
Energies 15 06045 g005
Figure 6. SEM micrographs of cement under different C/S and curing conditions. (a) 80 °C, 15 MPa; C/S = 1.8; (b) 150 °C, 15 MPa; C/S = 1.8; (c) 150 °C, 15 MPa; C/S = 1.1.
Energies 15 06045 g006
Figure 7. BO/Si molar ratio of C-S-H by different C/S ratios and temperatures. (a) C/S = 1.1; (b) C/S = 1.8.
Energies 15 06045 g007
Figure 8. Content of Qn by different C/S ratios and temperatures. (a) C/S = 1.1, 1500 K; (b) C/S = 1.8, 1500 K; (c) C/S = 1.1, 2000 K; (d) C/S = 1.8, 2000 K; (e) C/S = 1.1, 2500 K; (f) C/S = 1.8, 2500 K.
Energies 15 06045 g008aEnergies 15 06045 g008b
Figure 9. Stress–strain curve of C-S-H during tension with different temperatures and C/S. (a) Development of the model in tension process with C/S = 1.1 at different temperatures; (b) stress–strain curve with C/S = 1.1; (c) stress–strain curve with C/S = 1.8.
Energies 15 06045 g009
Figure 10. Mean chain length of silicate structure of C-S-H with different C/S ratios as a function of strain. (a) C/S = 1.1; (b) C/S = 1.8.
Energies 15 06045 g010
Figure 11. Coordination number of Ca of C-S-H with different C/S ratios as a function of strain. (a) C/S = 1.1; (b) C/S = 1.8.
Energies 15 06045 g011
Table 1. Experimental specimens.
SpecimenCement/gWater/BWOCSilica Flour/BWOCC/SCuring ConditionsTesting
C180044%01.880 °C, 1 atm, 7 dUsed in triaxial tests (80 °C, 15 MPa), XRD,TG/DSC,SEM
C280044%01.8150 °C, 15 MPa, 7 dUsed in triaxial tests (150 °C, 15 MPa), XRD,TG/DSC,SEM
C380044%35%1.1150 °C, 15 MPa, 7 dUsed in triaxial tests (150 °C, 15 MPa), XRD,TG/DSC,SEM
T180044%01.880 °C, 1 atm, 7 dUsed in splitting tests (22 °C, 1 atm)
T280044%01.8150 °C, 15 MPa, 7 dUsed in splitting tests (22 °C, 1 atm)
T380044%35%1.1150 °C, 15 MPa, 7 dUsed in splitting tests (22 °C, 1 atm)
Table 2. Results of mechanical experiments under different conditions.
SpecimenCuring ConditionsC/STesting ConditionsCompression Strength/GPaTensile Strength/GPaYoung’s Modulus/GPaPoison’s Ratio/GPa
C180 °C,1 atm, 7 d1.8Triaxial, 80 °C, 15 MPa58.24 6.010.23
C2150 °C, 15 MPa, 7 d1.8Triaxial, 150 °C, 15 MPa20.46 0.790.18
C3150 °C, 15 MPa, 7 d1.1Triaxial, 150 °C, 15 MPa44.53 1.710.14
T180 °C, 1 atm, 7 d1.8Splitting, 22 °C, 1 atm 1.28
T2150 °C, 15 MPa, 7 d1.8Splitting, 22 °C, 1 atm 0.36
T3150 °C, 15 MPa, 7 d1.1Splitting, 22 °C, 1 atm 1.07
Table 3. Initial polymerization rate of C-S-H by different temperatures and C/S ratios.
Temperature/KPolymerization Rate/ns−1
Ca/Si = 1.1Ca/Si = 1.8
4233.8343 × 10−77.404 × 10⁻⁷
10000.1837205480.21385269
15004.7498190695.96347172
200012.7204074720.3511005
Table 4. Bulk, shear, and Young’s moduli under different temperature and C/S ratios.
C/STemperature/KK/GPaG/GPaE/GPa
1.135365.626.870.8
42360.625.667.3
1.835343.422.256.8
42343.620.152.2
Publisher’s Note: MDPI stays neutral with regard to jurisdictional claims in published maps and institutional affiliations.

