Article

A Novel Permeability Model of Coal Considering Gas Slippage and Gas Sorption-Induced Strain

1
College of Information Engineering, Wuhan Business University, Wuhan 430056, China
2
Faculty of Engineering, China University of Geosciences, Wuhan 430074, China
*
Author to whom correspondence should be addressed.
Energies 2022, 15(16), 6036; https://doi.org/10.3390/en15166036
Submission received: 18 July 2022 / Revised: 14 August 2022 / Accepted: 15 August 2022 / Published: 20 August 2022
(This article belongs to the Section H: Geo-Energy)

Abstract

:
As an unconventional natural gas, coalbed methane (CBM) has been recognized as a significant fuel and chemical feedstock that should be recovered. Permeability is a key factor that controls CBM transport in coal. The slippage effect is an influential phenomenon that occurs during gas penetration processes, especially in low-permeable media. Apparent permeability may differ greatly from intrinsic permeability due to gas slippage. However, the gas slippage effect has not been considered in most analytical permeability models. Based on the cubic law, a new analytical model suited for the permeability analysis of coal under different stress conditions is derived, taking into consideration gas slippage and matrix shrinkage/swelling due to gas desorption/adsorption. To enhance its application, the model is derived under constant hydrostatic stress and pore pressure. The new analytical model is then compared with the existing models, and its reliability is verified by the comparison between the analytical prediction and the experimental permeability data under different stress conditions.

1. Introduction

As a porous adsorption medium, coal is both the source rock and reservoir rock for coalbed methane (CBM). To exploit CBM, water in a reservoir is drained first to reduce the reservoir pressure. After the fluid pressure decreases below the critical desorption pressure level, CBM begins to desorb and diffuse into cleats or fractures and then penetrates into the shaft. Permeability is a key controlling factor of gas transport in coal and gas production through which CBM recovery rates and economic benefits are influenced.
To investigate the permeability characteristics of coal, many permeability models have been derived by numerous researchers since Gray (1987) [1,2,3,4,5,6,7,8,9,10,11,12] proposed the first one. Seidle and Huitt (1995) [13] derived a permeability model for coal that only considers the effects of matrix expansion and shrinkage. Palmer and Mansoori (1996 [14], 1998 [4]) considered the comprehensive effects of pore pressure and matrix expansion and shrinkage on changes in porosity. Based on the linear elasticity mechanics of an isotropic porous medium, a commonly applied permeability model was derived by Shi and Durucan (2004 [5], 2005 [6]). Liu and Rutqvist (2010) [15] accommodated the role of swelling strains, not only over contact bridges, but also across non-contact areas between these bridges. Liu et al. (2011) [16] improved their former permeability model by applying a “free expansion plus push back” approach, whereby coal was allowed to expand freely due to gas sorption and was then pushed back by the applied effective stress to the original constrained conditions. In addition, anisotropic characteristics have been considered in some permeability models [17]. However, these models are not suitable for the investigation of permeability evolution under laboratory conditions. Permeability experiments often cause variable changes in confining, axial, and air pressures. In addition, gas adsorption/desorption could cause the sample to expand/shrink [8]. Therefore, some permeability models that are better suited for laboratory permeability analysis are proposed [18,19,20]. The McKee model and the Robertson model were modified in Zou et al. (2016) [8].
Klinkenberg (1941) [21] proposed the gas slippage effect, which describes the phenomenon that when gas is flowing through porous media, the migration velocity of gas molecules at the wall hole is not zero. The slippage effect can be described as
k g = k ( 1 + 4 c λ γ )
where kg is the apparent permeability under the pore pressure p; k is the Klinkenberg permeability or the absolute permeability; c is a scale factor; λ is the mean free path of gas molecules; and γ is the average pore radius.
Experiments have shown that the average pore radius is inversely proportional to the average pore pressure p [8,21,22,23,24,
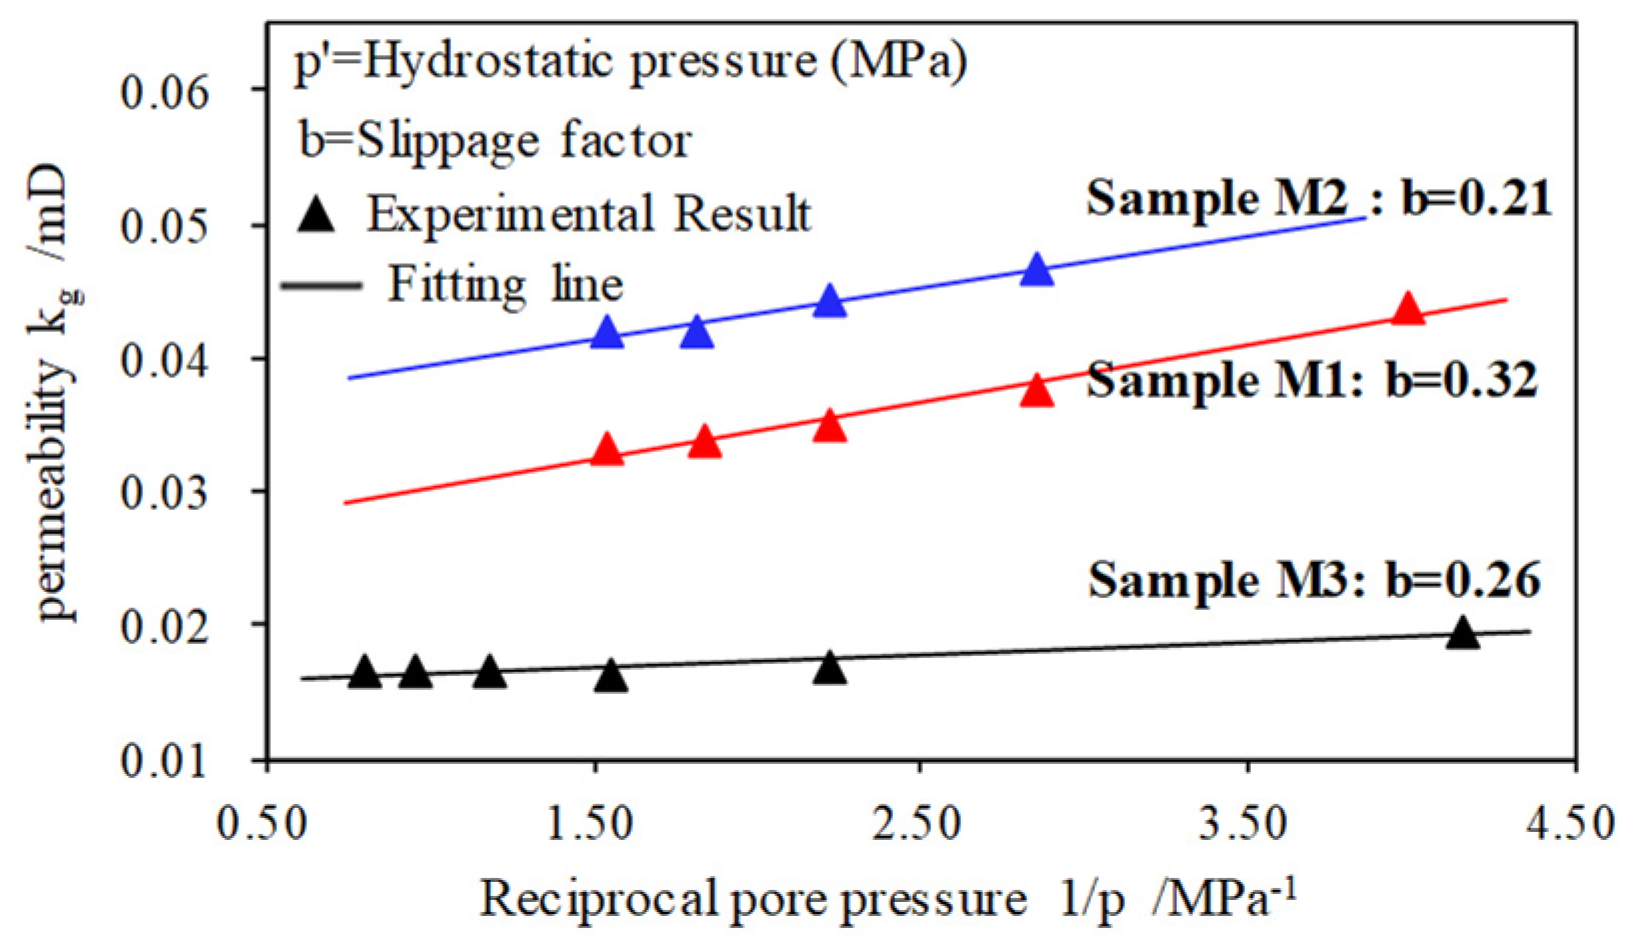
25]; therefore, Equation (1) can also be expressed as
k g = k ( 1 + b p ) ,   b = 4 c γ λ p
The average pore pressure p is determined by the inlet and outlet gas pressures, i.e., p = ( p i n + p o u t ) / 2 , where pin and pout represent the inlet and outlet pressures, respectively; and b is the slippage factor.
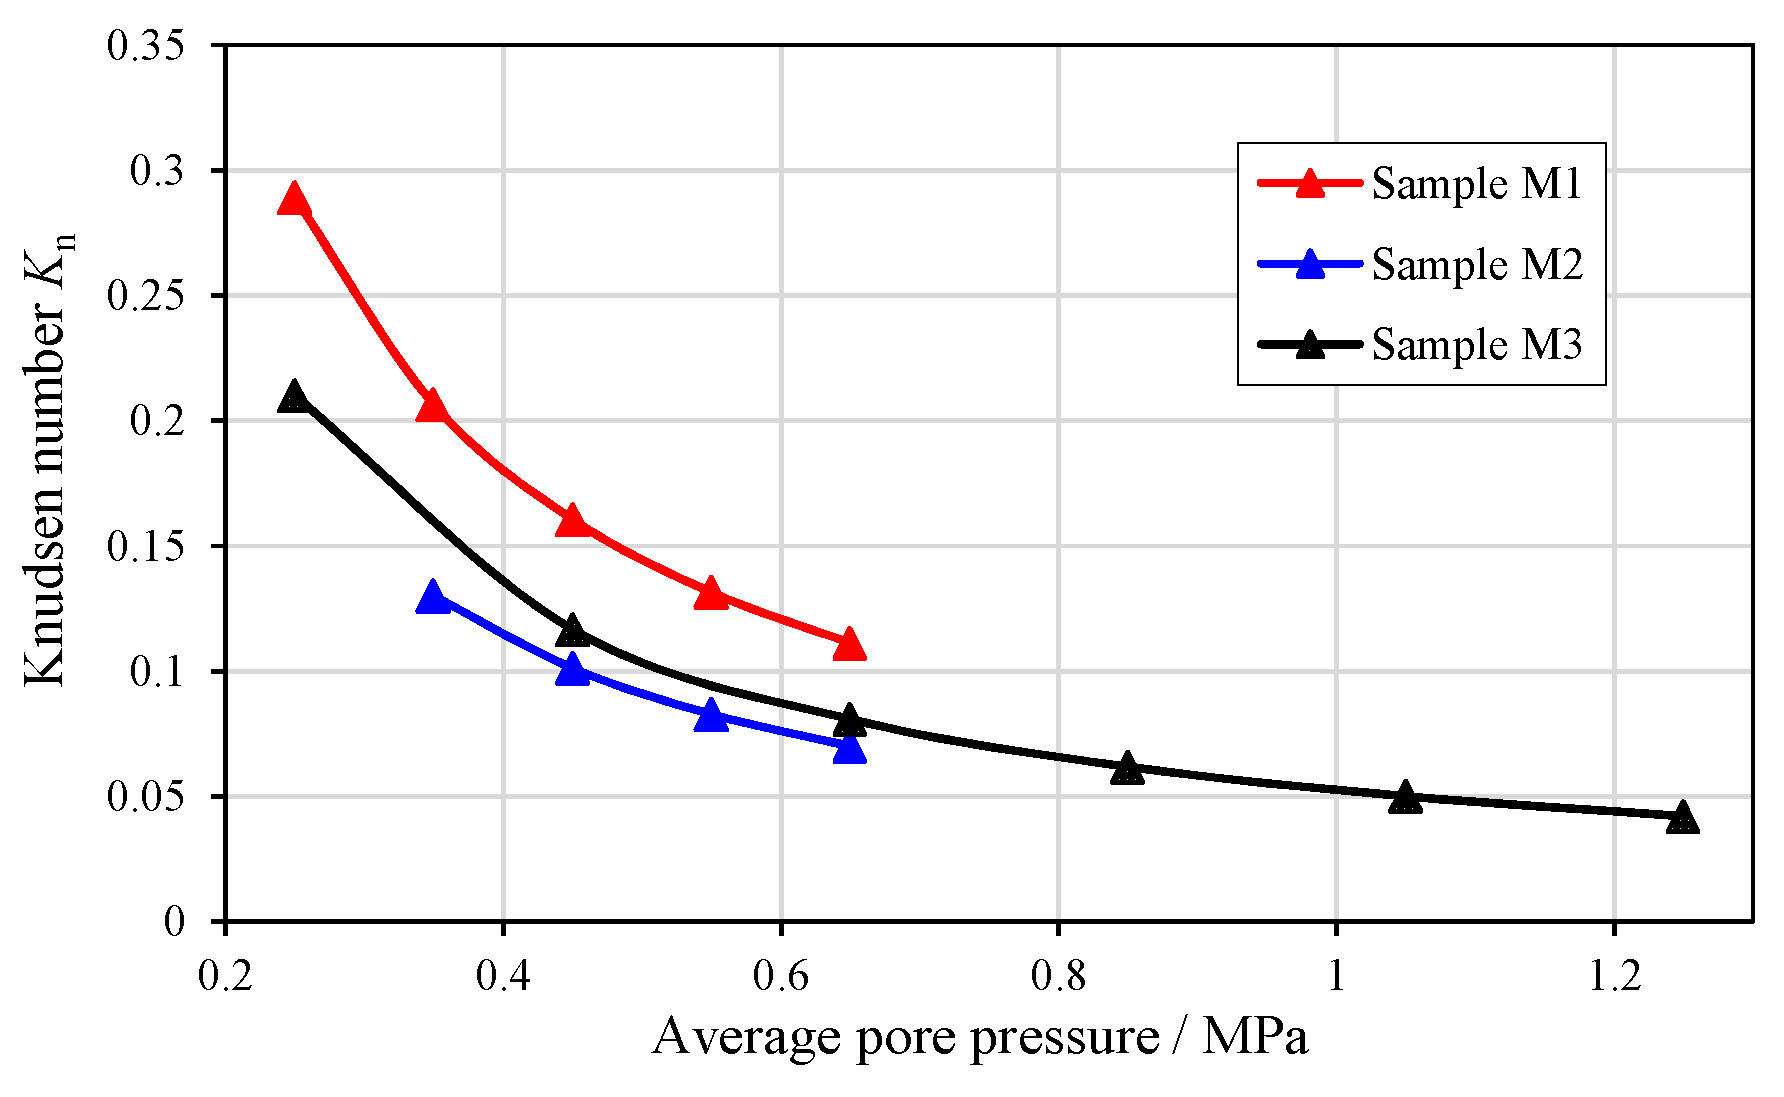
The gas slippage effect has a strong impact on penetration, especially in less permeable media. The impact of the slippage effect on the permeability could be interpreted by the Knudsen number Kn. The Knudsen number is commonly used to classify flow regimes in small pores [24,25]. This number is defined as the ratio of the molecular mean free path to a characteristic length, such as pore size. Table 1 shows the gas flow regimes with different Knudsen number ranges [26]. Within the transition flow regime, the slip flow and the diffused flow co-exist. For low-permeability media (within the slip flow regime and transition flow regime), permeability models that neglect the gas slippage effect are not sufficiently accurate.
Based on the cubic law, which has been widely applied to describe permeability changes with respect to porosity changes [4,14,27], a new analytical model suited for permeability analysis of coal under different stress conditions is derived considering the effects of matrix shrinkage/swelling due to gas desorption/adsorption and gas slippage.

2. Derivation of the Permeability Model

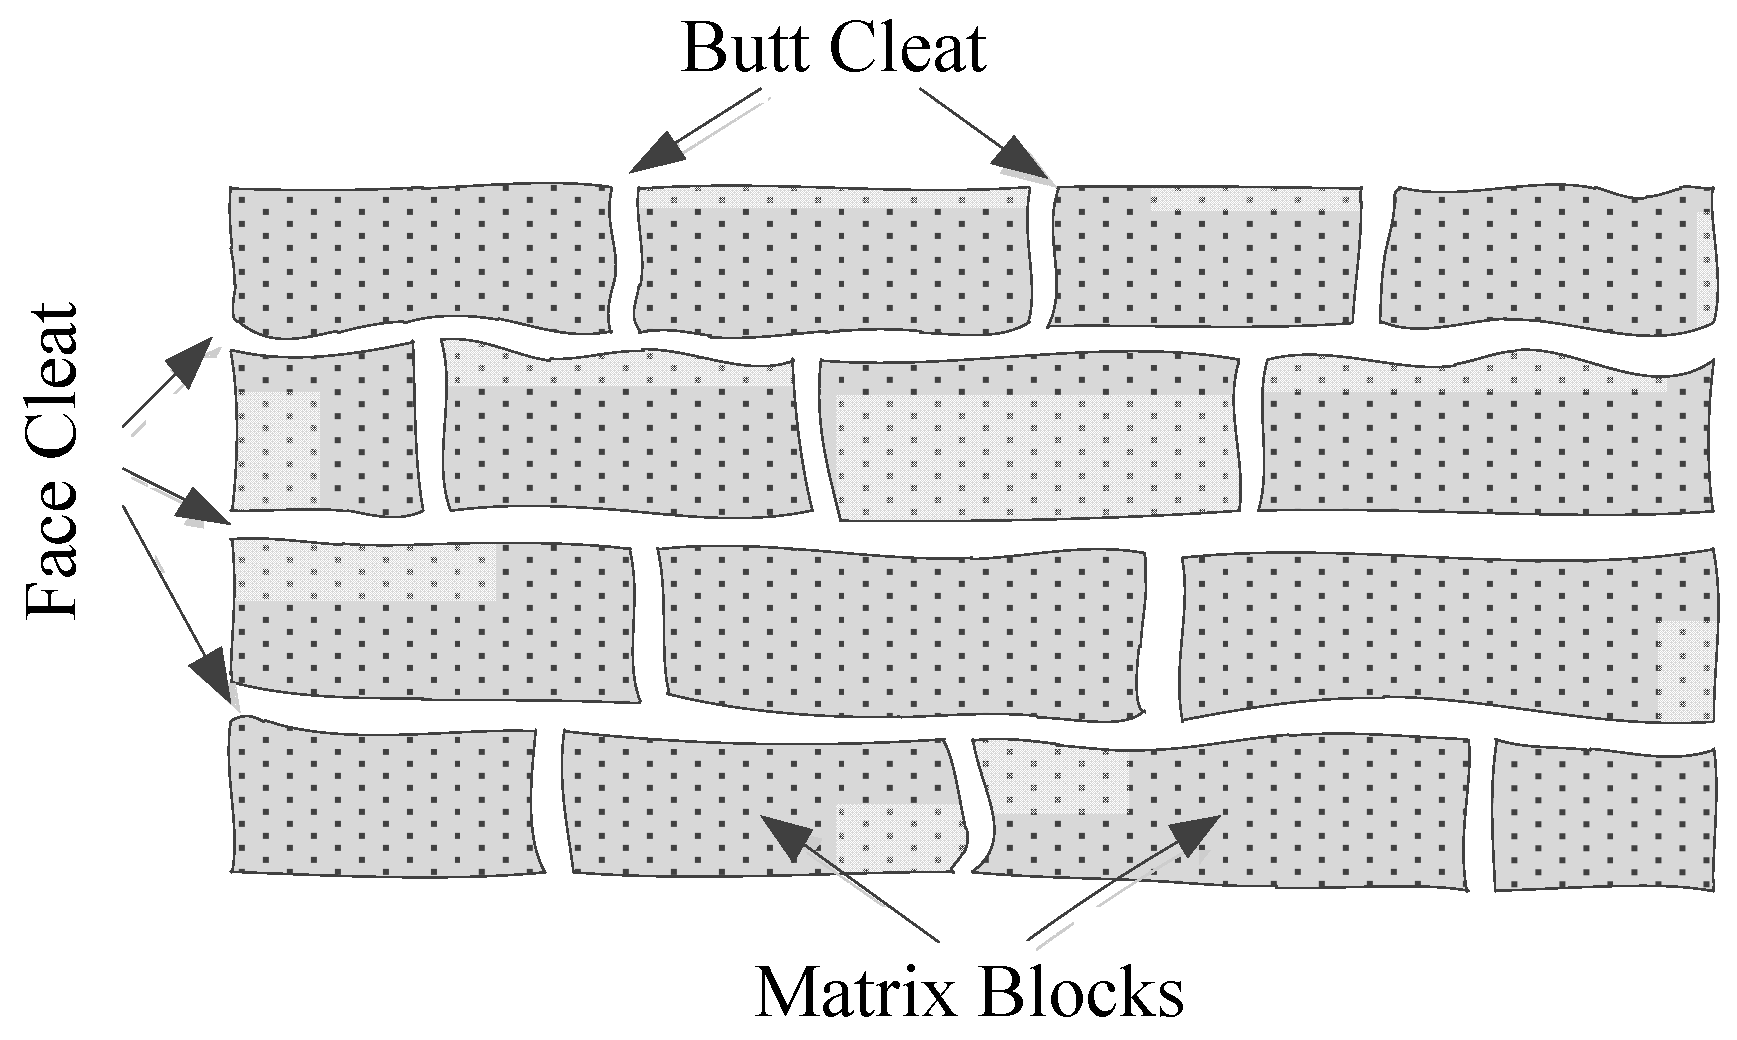
Coal cleats take two forms: face cleats and butt cleats. These cleats are often normal to the bedding and are perpendicular to one another [28,29]. A conceptual schematic of a coal fracture or cleat system is shown in Figure 1, and the matrix blocks are often surrounded by fractures or cleats. Coalbed methane molecules can be adsorbed within the pores and onto the surface of a matrix block or can exist in a fracture or cleat system in a free state.
The cubic law proposed by Reiss (1980) [30], which has been widely applied to describe permeability changes with respect to porosity changes [4,9,10,27,31], is used for the derivation of the permeability model in the present study. It can be expressed as
k k 0 = ( ϕ ϕ 0 ) 3
where ϕ0 is the original porosity, and k0 is the original permeability.
An equation that describes coal porosity with respect to the matrix dimension and fracture width was proposed by Robertson and Christiansen (2006) [19] and is expressed as Equation (4). This equation assumes that the fracture width η is far smaller than the matrix block dimension δ.
ϕ = 3 η δ
Combining Equations (3) and (4) results in
k k 0 = ( 3 η δ / 3 η 0 δ 0 ) 3
It could also be written in the form of the fracture width change and matrix dimension change
k k 0 = [ ( Δ η η 0 + 1 ) / ( Δ δ δ 0 + 1 ) ] 3
On a large scale, coal is anisotropic due to its layered characteristics. While in a matrix block, however, coal behaves in a more isotropic manner, i.e., the linear strain in all directions is equivalent to one-third of the volumetric strain [3]. It is assumed that elastic deformation occurs in a matrix block during the gas penetration process [5,6,15,27,31]. Based on Hooke’s law, strains occurring in different directions of a matrix can be expressed as
{ Δ ε x = 1 E [ Δ σ x ν ( Δ σ y + Δ σ z ) ] Δ ε y = 1 E [ Δ σ y ν ( Δ σ x + Δ σ z ) ] Δ ε z = 1 E [ Δ σ z ν ( Δ σ x + Δ σ y ) ]
where E is the elastic modulus; v is Poisson’s ratio; and σx, σy, and σz are effective stresses in different directions.
The stresses of different principal directions for coal are equivalent when coal is subjected to hydrostatic stress. Elastic strains can be written as
Δ ε x = Δ ε y = Δ ε z = 1 E Δ σ ( 1 2 ν )
In recognizing the strains of a matrix block as the change in dimension divided by the original dimension, strains can also be expressed as
Δ ε x = Δ ε y = Δ ε z = Δ δ 1 δ 0
Substituting Equation (9) into Equation (8) produces
Δ δ 1 = δ 0 E Δ σ ( 1 2 ν )
The increase in the fracture opening due to a single effect of matrix shrinkage can be expressed as [19]
Δ η 1 = Δ δ 1 = δ 0 E Δ σ ( 1 2 ν )
Several studies have demonstrated that coal matrix deformation is significantly influenced by gas adsorption or desorption [3,31,32,33,34]. Shrinkage/swelling strain due to gas desorption/adsorption can be expressed as [2,13,35]
Δ ε s = S max ( p p + p L p 0 p 0 + p L )
where Smax and pL are sorption constants. Smax is the Langmuir strain, which represents the matrix strain at infinite adsorption pressure. pL is the Langmuir pressure, which represents the pressure when the adsorption strain is Smax/2.
Similar to Equation (9), the swelling strain induced by gas adsorption can be written as
Δ ε s = Δ δ 2 δ 0
Substituting Equation (13) into Equation (12) produces
Δ δ 2 = δ 0 S max ( p p + p L p 0 p 0 + p L )
The increase in the fracture opening due to a single effect of matrix swelling resulting from gas adsorption can be expressed as [19]
Δ η 2 = Δ δ 2 = δ 0 S max ( p p + p L p 0 p 0 + p L )
The effective stress of a porous medium is expressed as
σ = σ t β p
where σ is the effective stress; σt is the total stress; p is the average pore pressure; and β is the effective stress coefficient, where 0 ≤ β ≤ 1. The effective stress coefficient could be determined by the following equation [36,37,38]
β = 1 K v / K s
where Kv is the bulk modulus and Ks represents the bulk modulus of solid grain material.
We all know that the effective stress coefficient is less than 1 [8,39,40]. However, most current permeability models assume an effective stress factor of 1, which leads to an overestimation of gas permeability for the same stress change [28].
It is assumed that the effective stress coefficient of coal does not change with pore pressure and confining stress; therefore,
Δ σ = Δ σ t β Δ p
The cleat compressibility Cf was defined by Amyx et al. (1960) [41] as Equation (19)
C f = 1 ϕ 0 Δ ϕ Δ σ
Combining Equations (4), (18) and (19) produces
Δ η 3 = η 0 C f ( Δ σ t β Δ p )
The actual deformation of the coal matrix during gas permeation is the sum of the deformations caused by external stress and gas desorption/adsorption. Combining Equation (10) with (14) produces the total deformation of the coal matrix
Δ δ t = Δ δ 1 + Δ δ 2 = δ 0 E ( Δ σ t β Δ p ) ( 1 2 ν ) + δ 0 S max ( p p + p L p 0 p 0 + p L )
Similarly, the actual deformation of a fracture opening can be obtained by combining Equations (11), (15) and (20).
Δ η t = Δ η 1 + Δ η 2 + Δ η 3 = δ 0 E ( Δ σ t β Δ p ) ( 1 2 ν ) η 0 C f ( Δ σ t β Δ p ) δ 0 S max ( p p + p L p 0 p 0 + p L )
Substituting Equations (21) and (22) into Equation (6) yields an equation for permeability changes with respect to other parameters:
k k 0 = [ ( Δ σ t β Δ p ) [ δ 0 ( 1 2 v ) E η 0 C f ] E δ 0 S max Δ p + E η 0 η 0 ( Δ σ t β Δ p ) ( 1 2 v ) + E η 0 S max Δ p + E η 0 ] 3
where
Δ p = p p + p L p 0 p 0 + p L
Combining Equations (23) and (4) produces
k k 0 = [ ( Δ σ t β Δ p ) [ 3 6 v C f ] 3 E S max Δ p + E ϕ 0 ϕ 0 ( Δ σ t β Δ p ) ( 1 2 v ) + E ϕ 0 S max Δ p + E ϕ 0 ] 3
McKee et al. (1988) [18] noted that the cleat compressibility Cf is a function of the effective stress. According to Mckee and coworkers, Cf can be expressed as
C f = C 0 α ( Δ σ t Δ p ) { 1 exp [ α ( Δ σ t Δ p ) ] }
where C0 is the cleat compressibility, and α is the declining rate of cleat compressibility.
The cleat compressibility Cf expressed as Equation (26) is modified as Equation (27).
C f = C 0 α ( Δ σ t β Δ p ) { 1 exp [ α ( Δ σ t β Δ p ) ] }
The gas slippage effect is considered in our model. Rearranging Equation (2) produces the relationship between the apparent permeability ratio and the absolute permeability ratio, which is expressed as
k g k g 0 = k k 0 · p + b p 0 + b 0 · p 0 p
The subscript “0” represents the initial state of each parameter.
Combining Equations (25) and (28) produces
k g k g 0 = [ ( Δ σ t β Δ p ) [ 3 6 v C f ] 3 E S max Δ p + E ϕ 0 ϕ 0 ( Δ σ t β Δ p ) ( 1 2 v ) + E ϕ 0 S max Δ p + E ϕ 0 ] 3 · p + b p 0 + b 0 · p 0 p
Equation (29) is the expression of permeability model that considers the gas slippage effect.

3. Results and Discussion

Long flame coal from the Hunchun coalfield in the Jilin province of China was used. All samples had dimensions of Φ 50 × 100 mm. The properties of studied coal have been introduced in detail in our previous research [8]. Figure 2 shows the low-permeability rock test system. The testing method is a steady-state method. The high-pressure nitrogen cylinder provides a stable gas pressure on the upper surface of the coal sample. The loading error of the rock test system is less than 0.5%. The gas penetration rate is measured at the outlet end after forming a steady-state flow under the differential gas pressure.

3.1. Model Parameters

The mechanical properties of coal have been introduced in our previous research [8]. The elastic modulus of coal samples is approximately 2.0 GPa, and Poisson’s ratio is 0.31.
Two types of coal porosities were considered. The coal fracture porosity was obtained by a density testing method, which is expressed as
ϕ = [ ( ρ t ρ a ) / ρ t ] × 100 %
where ρt is the density of the coal matrix, and ρa is the apparent density of the coal sample. The fracture porosities of coal samples that were drilled at different depths in the Hunchun coalfield are listed in Table 2.
The mercury injection test is carried out to determine the pore size distribution characteristics of coal matrix and coal matrix porosity, and the results are shown in Figure 3. The average porosity of the coal matrix determined by the mercury injection test is 0.11.
A Langmuir stress of PL = 2.86 MPa was obtained via sorption tests. Robertson et al. (2005 [35], 2006 [19]) obtained an extremely small Langmuir strain of Anderson and Gilson coals with an average value of 0.0025 via N2 adsorption [8]. An average compressibility change rate of α = 0.44 MPa−1 was also obtained by combining the results of McKee et al. (1988) [18].
Several investigations show that the effective stress coefficient is less than 1 [19,20,31,39,40,41,42]. Walsh (1981) [43] found that β = 0.9 for a rock mass containing a polished joint, and Kranzz (1979) [44] found that β = 0.56. Through our previous work, an effective stress coefficient of our coal is 0.53 [8].

3.2. Hydrostatic Stress Remains Constant

The permeability of the coal samples subjected to different gas pressure levels was tested via N2 under different hydrostatic stresses. The confining stress remains constant, and only the pore pressure changes. In this case, we assume that the gas slippage factor remains constant b = b0. If the gas slippage factor varies with the pore pressure, the formula will become extremely complicated and impractical. The change in σt is zero when the hydrostatic stress applied to a coal sample remains constant, i.e.,
Δ σ t = 0
By substituting Equation (31) into Equation (29) and by adding Equation (27), we arrive at a permeability model that considers the gas slippage effect when hydrostatic stress remains constant during experiments.
k g k g 0 = [ 3 α β Δ p ( 1 2 v ) E ϕ 0 C 0 [ 1 exp ( α β Δ p ) ] 3 E α S max Δ p + E α ϕ 0 α ϕ 0 [ β Δ p ( 1 2 v ) + E S max Δ p + E ] ] 3 · p + b p 0 + b 0 · p 0 p
The permeability model that neglects the gas slippage effect can be expressed as
k k 0 = [ 3 α β Δ p ( 1 2 v ) E ϕ 0 C 0 [ 1 exp ( α β Δ p ) ] 3 E α S max Δ p + E α ϕ 0 α ϕ 0 [ β Δ p ( 1 2 v ) + E S max Δ p + E ] ] 3

3.2.1. Results Obtained When Considering the Gas Slippage Effect and Discussion

The permeability model (Equation (32)) is fitted with experimental results under the hydrostatic stress of 8 MPa. Figure 4 shows the fitting result, and the parameters obtained from the fitting are listed in Table 3.
To evaluate the validity of the model parameters, the slippage factors are also obtained by fitting the slippage effect using Equation (2) using the same experimental results. The process for fitting the slippage effect is shown in Figure 5. The permeability increases linearly with the reciprocal of the pore pressure. The slippage factors obtained from the experimental permeability data are within a range of 0.21~0.32 MPa, with an average value of 0.26 MPa. This value approaches the average value of the slippage factors that were obtained by the model fitting.
The Knudsen number is defined as the ratio of a molecular mean free path to a characteristic length, such as pore size. According to the classification of flow regimes [24,25], a flow is considered a continuum for Kn < 0.001, and the system is considered a free molecular flow for Kn > 10. The intermediate values of 0.001 < Kn < 0.1 are representative of a slip flow regime, and those within the range of 0.1 < Kn < 10 are associated with a transition flow regime. Within the transition flow regime, the slip flow and the diffused flow co-exist. The molecular mean free path or N2 in this paper is assumed at the constant of 3.8 × 10⁻⁸ m, and the pore size distribution under different pressures is determined by the mercury injection test (see Figure 3). The Knudsen numbers at different average pore pressures are calculated, and the results are presented in Figure 6. The Knudsen numbers are within the range of 0.04~0.29, belonging to the slip flow regime and the transition flow regime.
To further verify the conclusions, the model parameters shown in Table 3 are added to Equation (32), and the experimental results when the hydrostatic stresses are 10 MPa, 12 MPa, and 14 MPa are predicted. A comparison of the calculated results and the experimental ones is shown in Figure 7. Well-matching results are found, which indicates that coal permeability could be predicted reliably by our model.
Figure 8 shows the model calculation results under a hydrostatic stress of 8 MPa and a broader range of pore pressure levels, and Figure 9 shows the results of sample M1 under different hydraulic stresses. The permeability follows a hook-shaped path with increasing average pore pressure. Considering the gas slippage effect, the gas permeability will decrease when the pore pressure increases with a lower pore pressure range. However, the effects of gas slippage decline with increasing gas pressure [23] and approximately diminish when the gas pressure increases beyond 2.0 MPa. At this point, the mean free path of gas molecules (diameter of approximately 0.98 Å) is far lower than the aperture of coal cleats (3–40 um) [29]. Within the higher pore pressure range, the coal permeability is mainly influenced by the effective stress [8]. As shown in Figure 8 and Figure 9, the permeability increases with increasing pore pressure when the pore pressure changes within a higher scale.

3.2.2. Results Obtained When Neglecting the Gas Slippage Effect and Discussion

The permeability model that neglects the gas slippage effect (Equation (33)) is fitted with experimental results under the hydrostatic stress 8 MPa. The fitting process is shown in Figure 10. The permeability increases exponentially with an increase in pore pressure. Without considering the slippage effect, the permeability model cannot achieve better matching results from experimental data; therefore, the permeability model that does take into consideration the gas slippage effect is more accurate for coal with low permeability.

3.2.3. Comparison with Other Permeability Models

In our previous study [8], the McKee (1988) [18] and the Robertson (2006) [19] models were modified as follows: ① the effective stress coefficient in the effective stress item of the model equation is changed from 1 to β (0 < β < 1); and ② the gas slippage effect is considered.
The modified McKee permeability model is expressed as:
k g k g 0 = p + b p 0 + b 0 · p 0 p exp { 3 C f 0 α [ 1 e α ( Δ σ t β Δ p ) ] }
and the modified Robertson and Christiansen permeability model:
k g k g 0 = p + b p 0 + b 0 · p 0 p exp { 3 C f 0 1 e α β Δ p α + 9 ϕ 0 [ 1 2 ν E Δ p S max p L ( p 0 + p L ) ln ( p + p L p 0 + p L ) ] }
Figure 11, Figure 12 and Figure 13 compare the calculated results of the three permeability models under a hydrostatic stress of 12 MPa and the corresponding experimental data. All three permeability models achieve good matching with the experimental permeability data. For a wider pore pressure range, the permeability calculated with three models all follow a hook-shaped path with increasing pore pressure.

3.2.4. Model Verification with CO2 Permeability Experimental Data

Coal differs from other porous media [45,46], and the gas permeability varies with the gases tested. The different adsorbability of N2, CO2, and CH4 to the coal matrix results in a significant difference of gas permeability under the same pressure [40,47]. Pini et al. (2009) [48] observed that the swelling of coal due to CO2 was larger than that due to N2. Pan and Connell (2011) [17] measured bituminous coal swelling strains caused by CH4, N2, and CO2 perpendicular and parallel to the bedding direction. The Gilson coal (bituminous coal) permeability was measured in the laboratory for pure CO2 gas by Robertson (2005) [35], and their results are used to verify our permeability model in this paper. The mechanical properties and swelling parameters are directly obtained from Robertson (2005) [35], as shown in Table 4. The modified McKee and Robertson models are also calculated for comparison. The model calculation results and laboratory experimental data are shown in Figure 14. Because different models require different parameters, the calculation results for the three permeability models vary greatly. However, a relatively good match is obtained between our model results and the experimental results.

3.3. Pore Pressure Remains Constant

The change in p is zero when gas pressure is unchanged, i.e.,
Δ p = 0
By substituting Equation (36) into Equation (25) and by adding Equation (27), we arrive at a permeability model with a pore pressure that remains constant during the experiments expressed as
k k 0 = [ α ϕ 0 Δ σ t ( 1 2 v ) E C 0 [ 1 exp ( α Δ σ t ) ] + E α α Δ σ t ( 1 2 v ) + E α ] 3
The permeability k in Equation (37) is the intrinsic permeability. Coal permeability under different hydrostatic and gas pressure levels is tested via N2. Experimental results are published in our former research paper [8]. The intrinsic permeability is obtained by fitting the slippage effect (Equation (2)) with the laboratory permeability data, which are listed in Table 5.
A comparison between the experimental data and the model calculation results is shown in Figure 15, which shows a good matching result. This validates the rationality of our model.

4. Conclusions

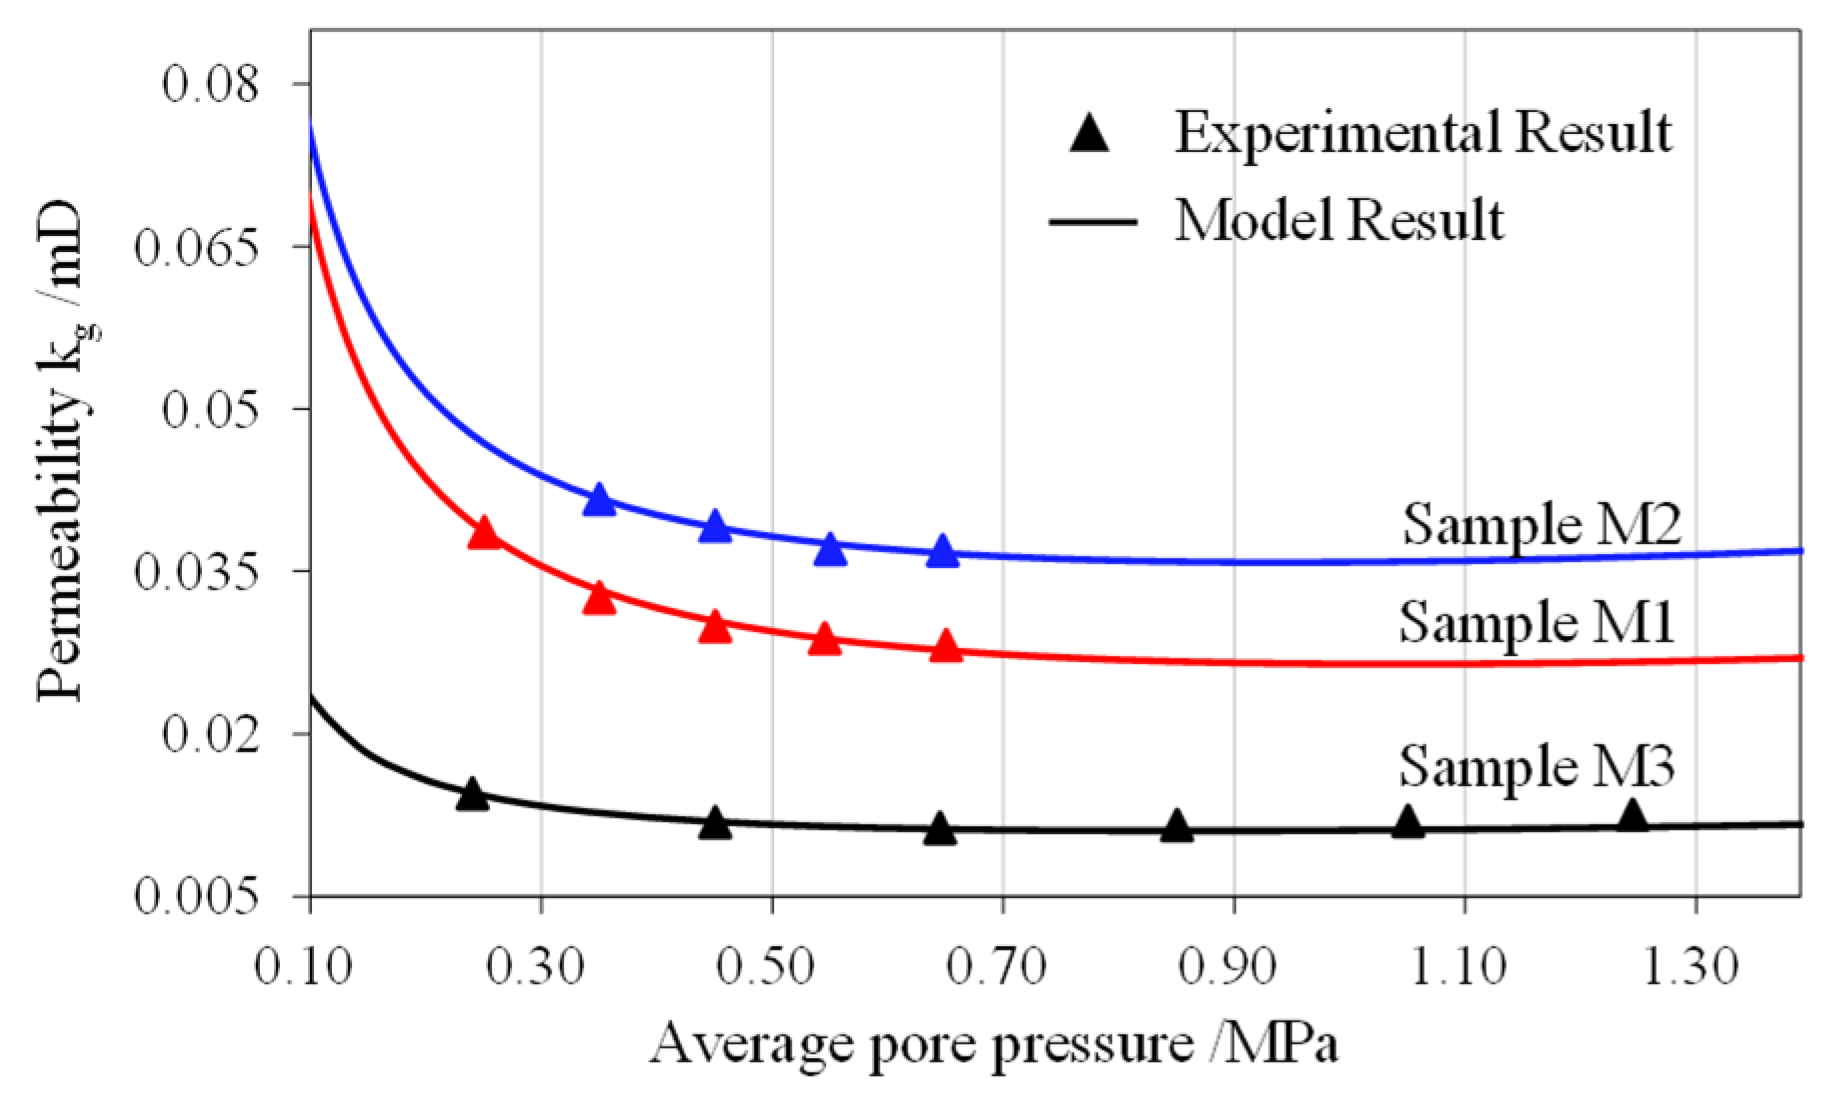
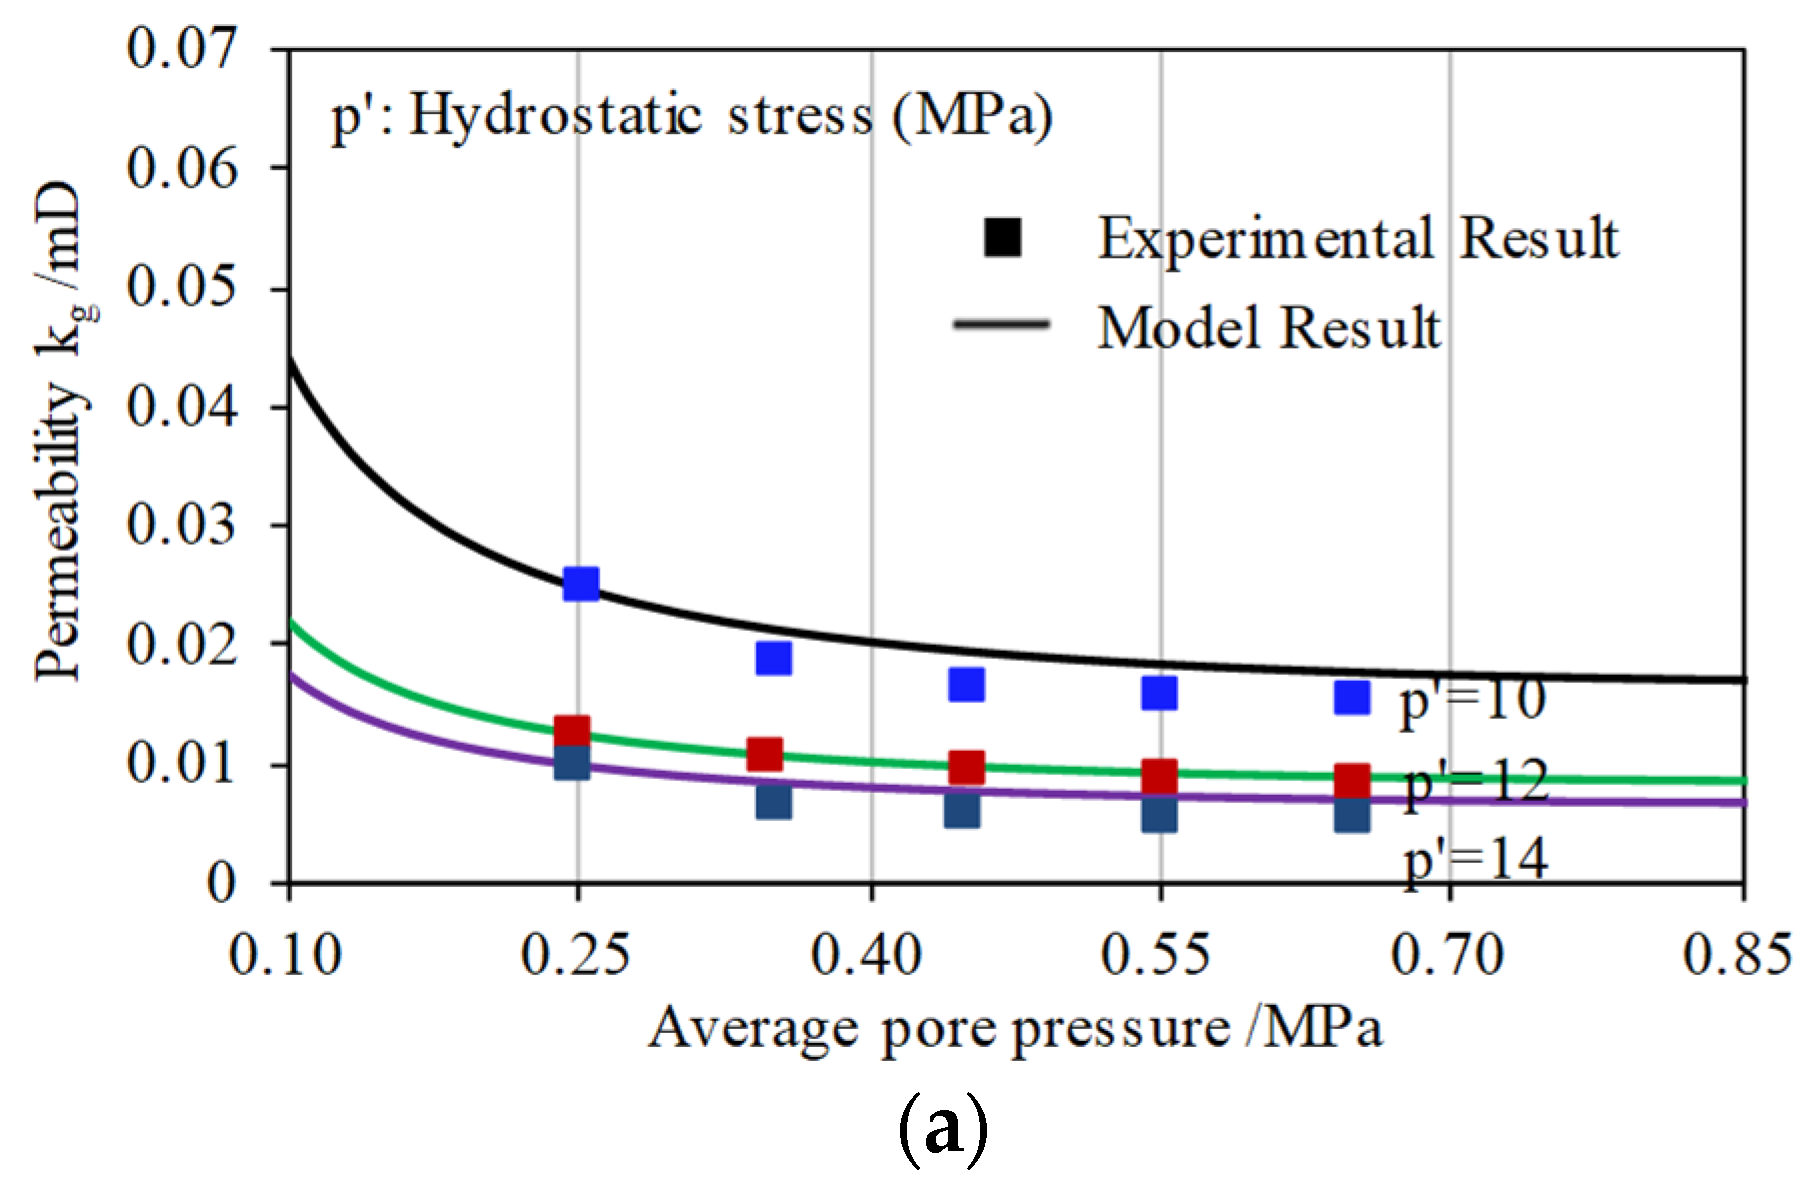
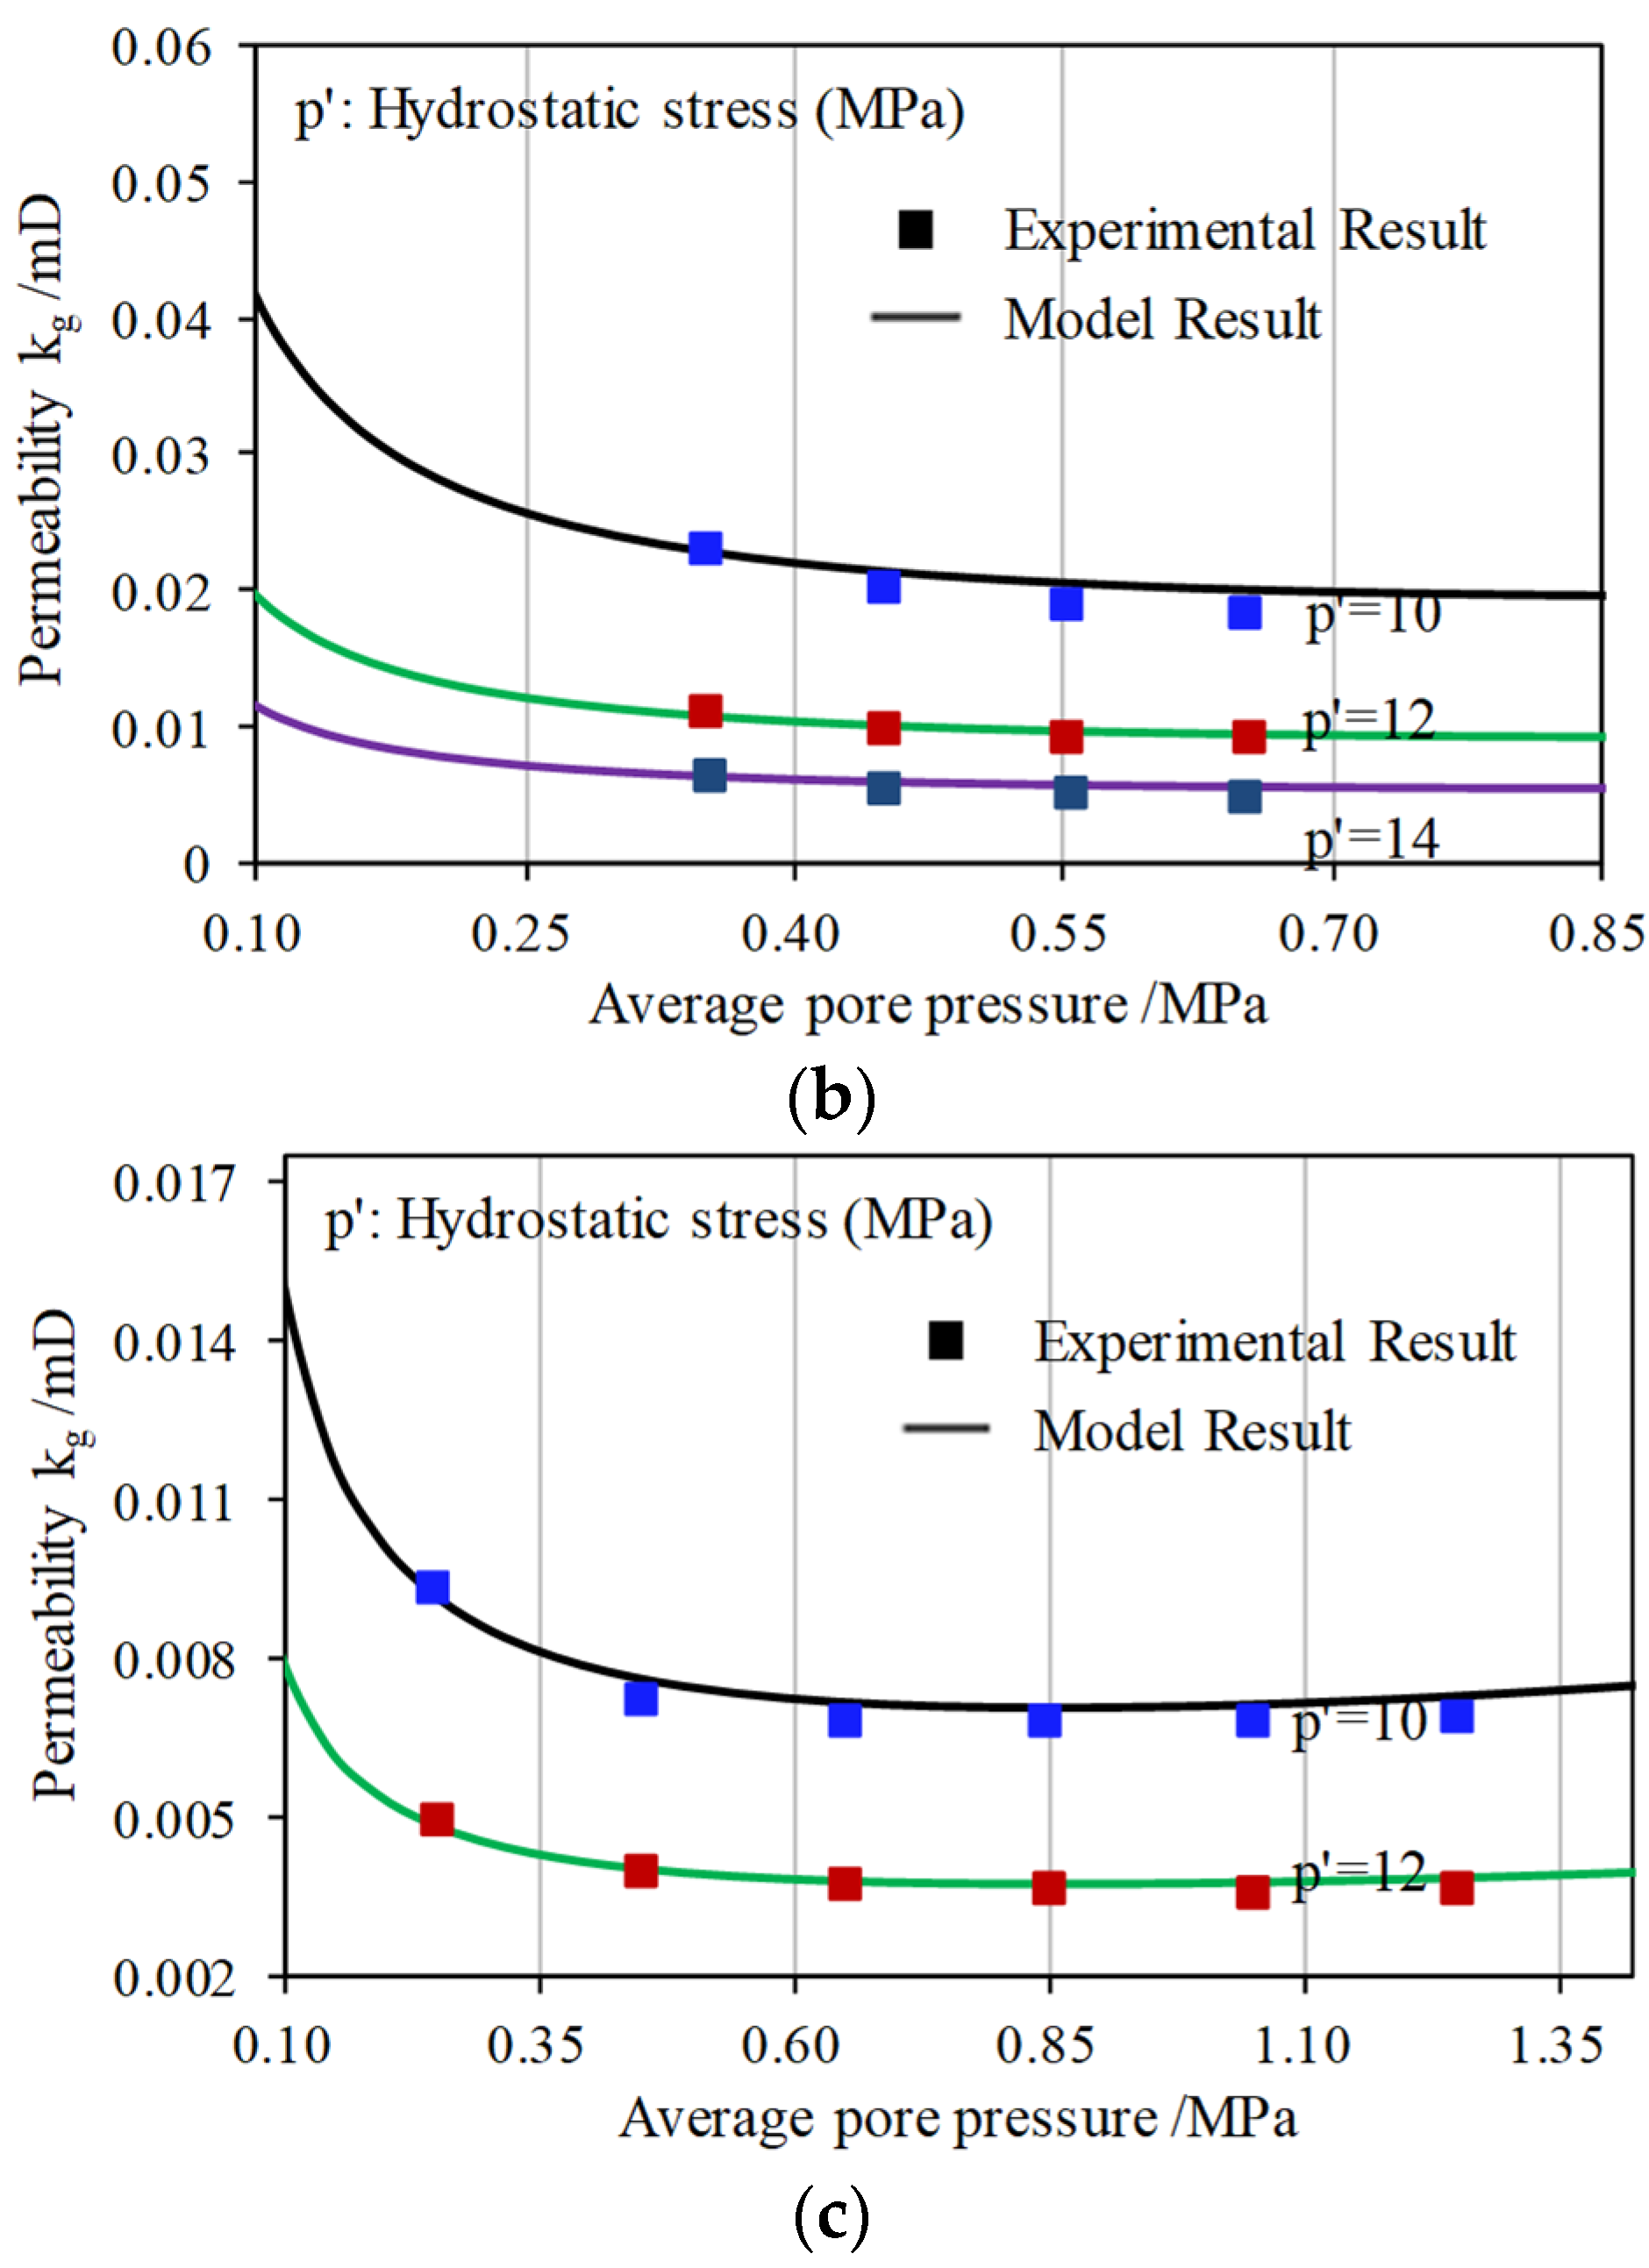
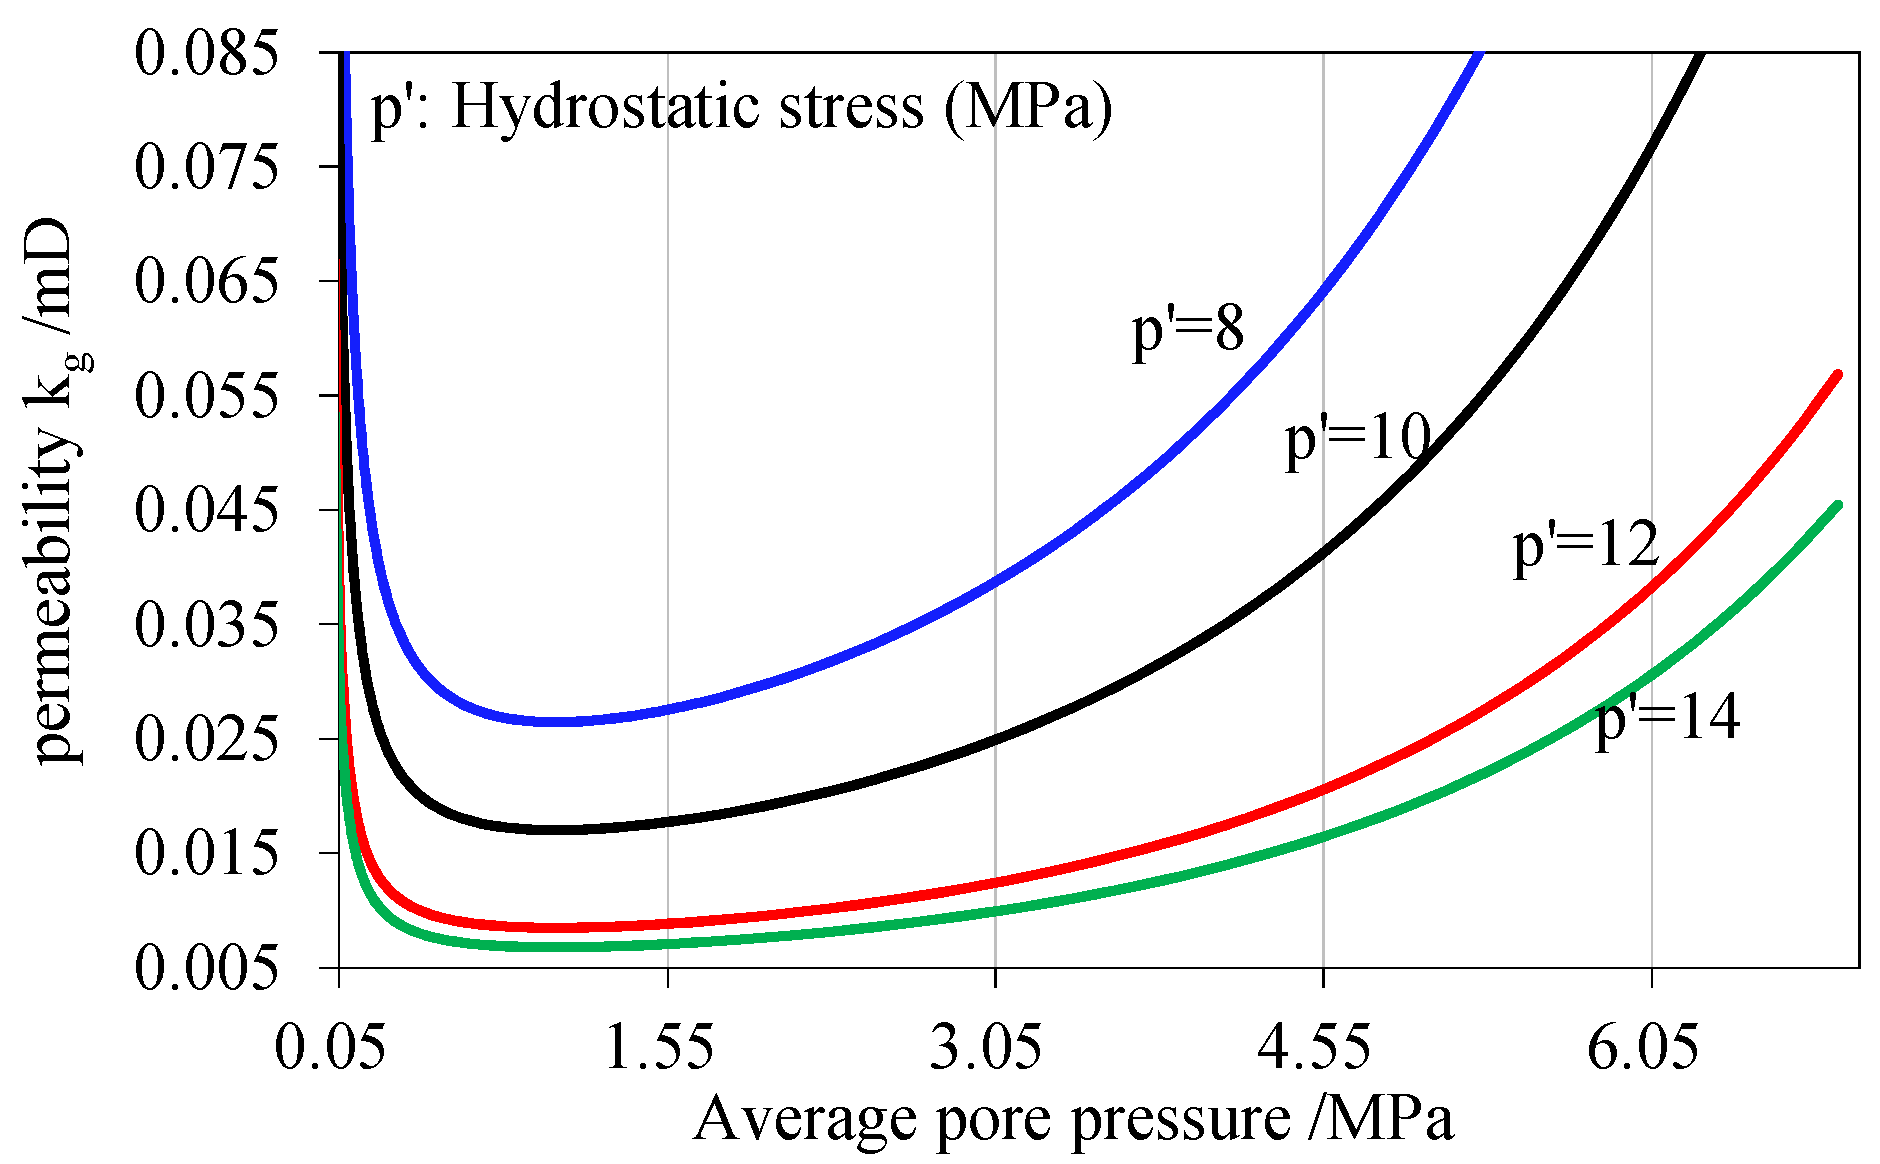
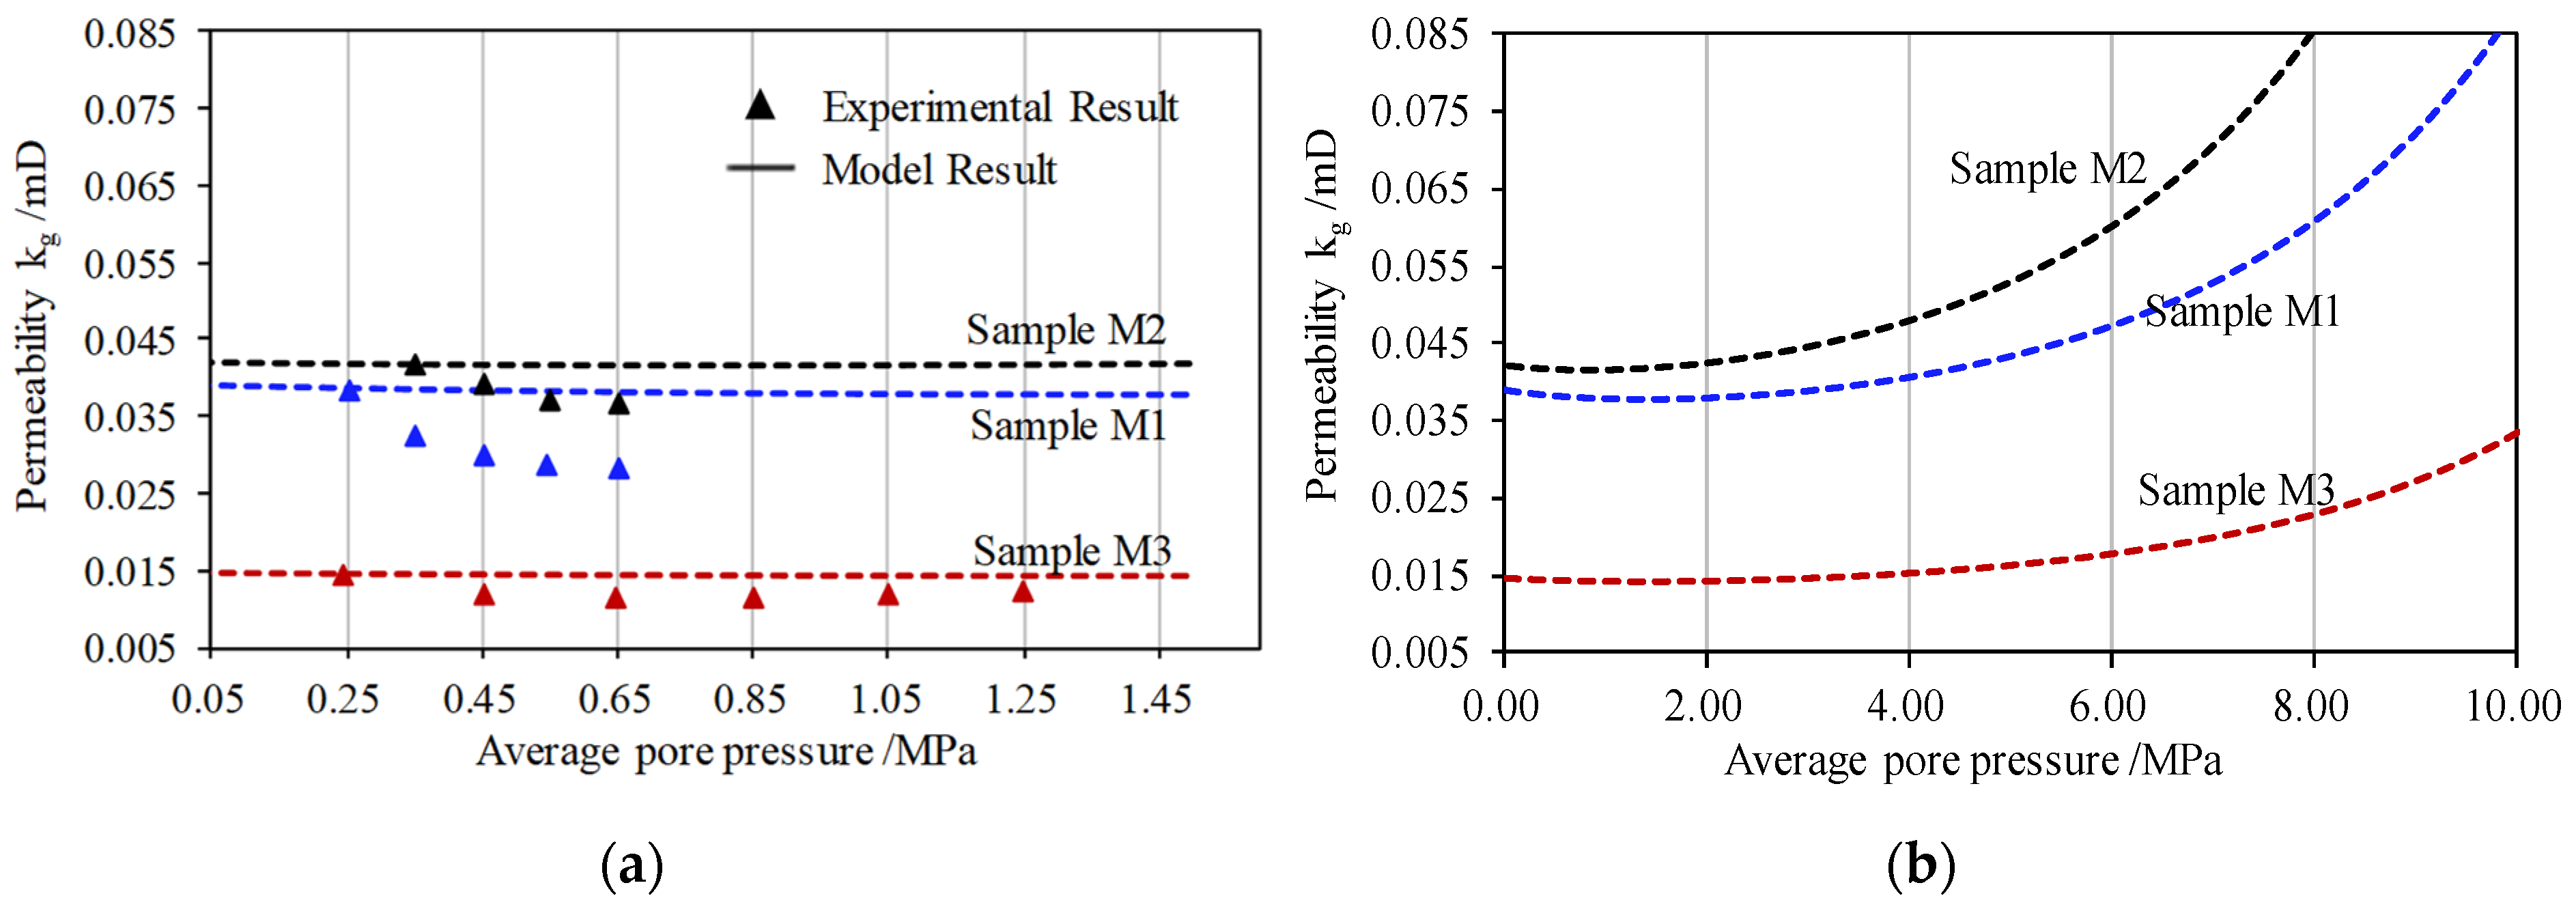
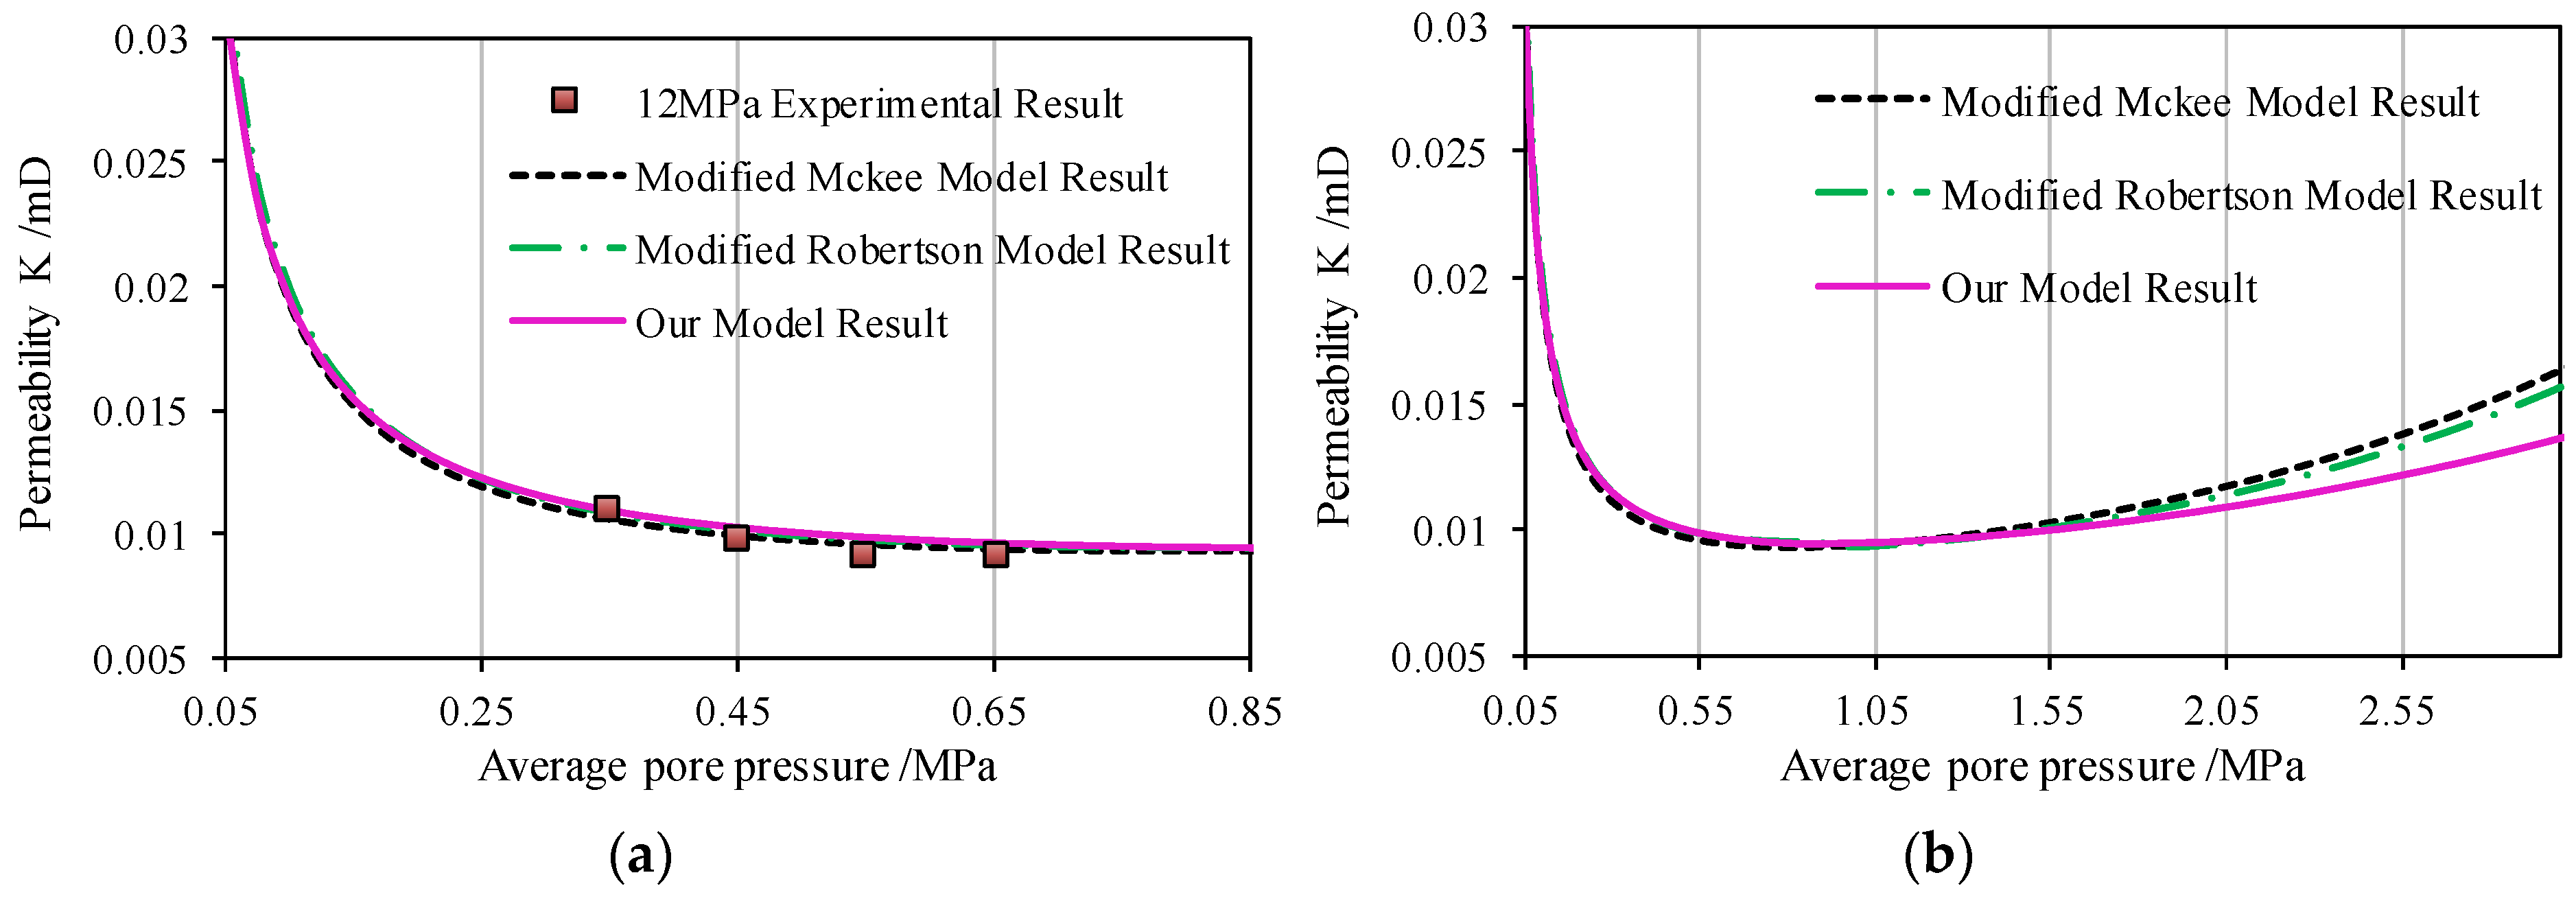
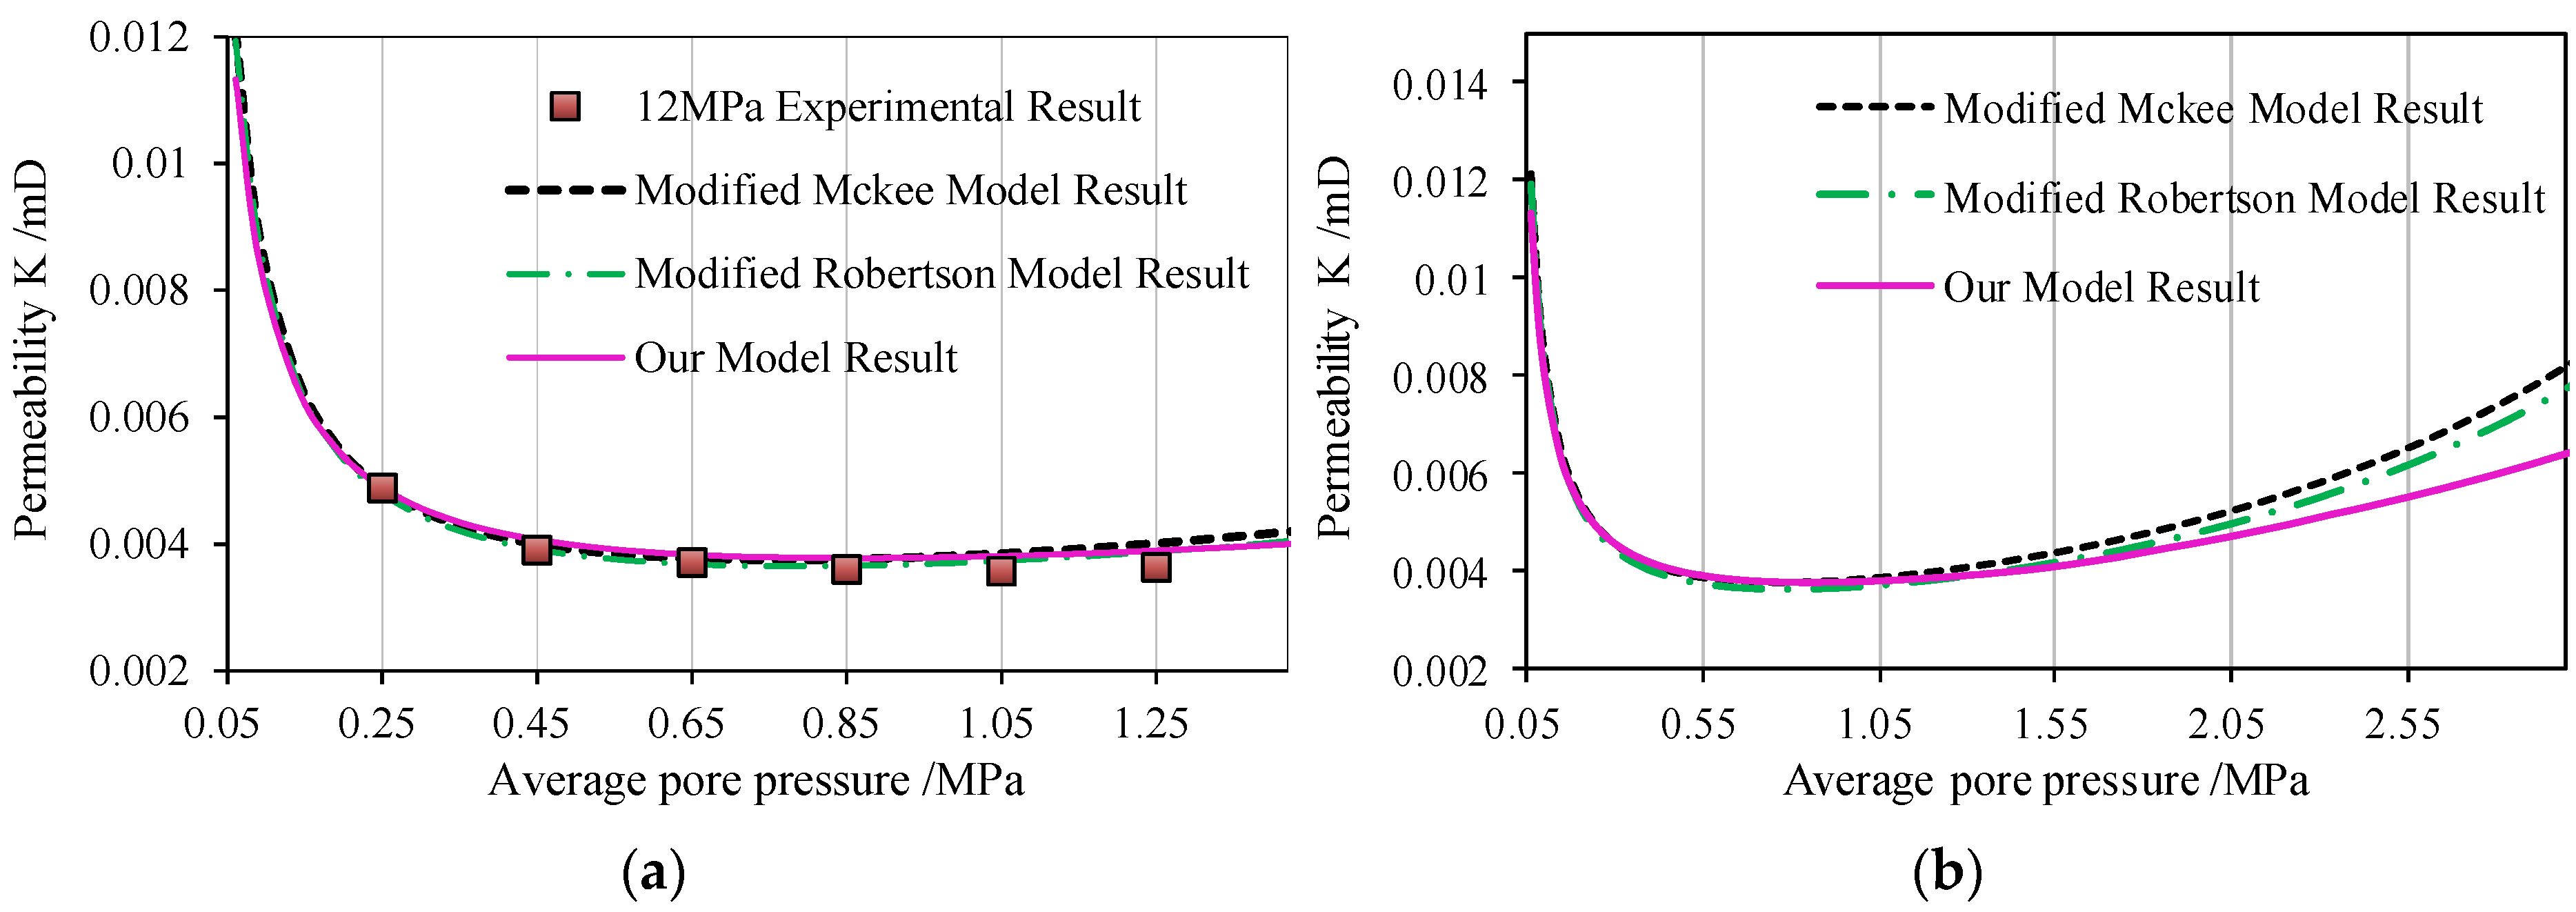
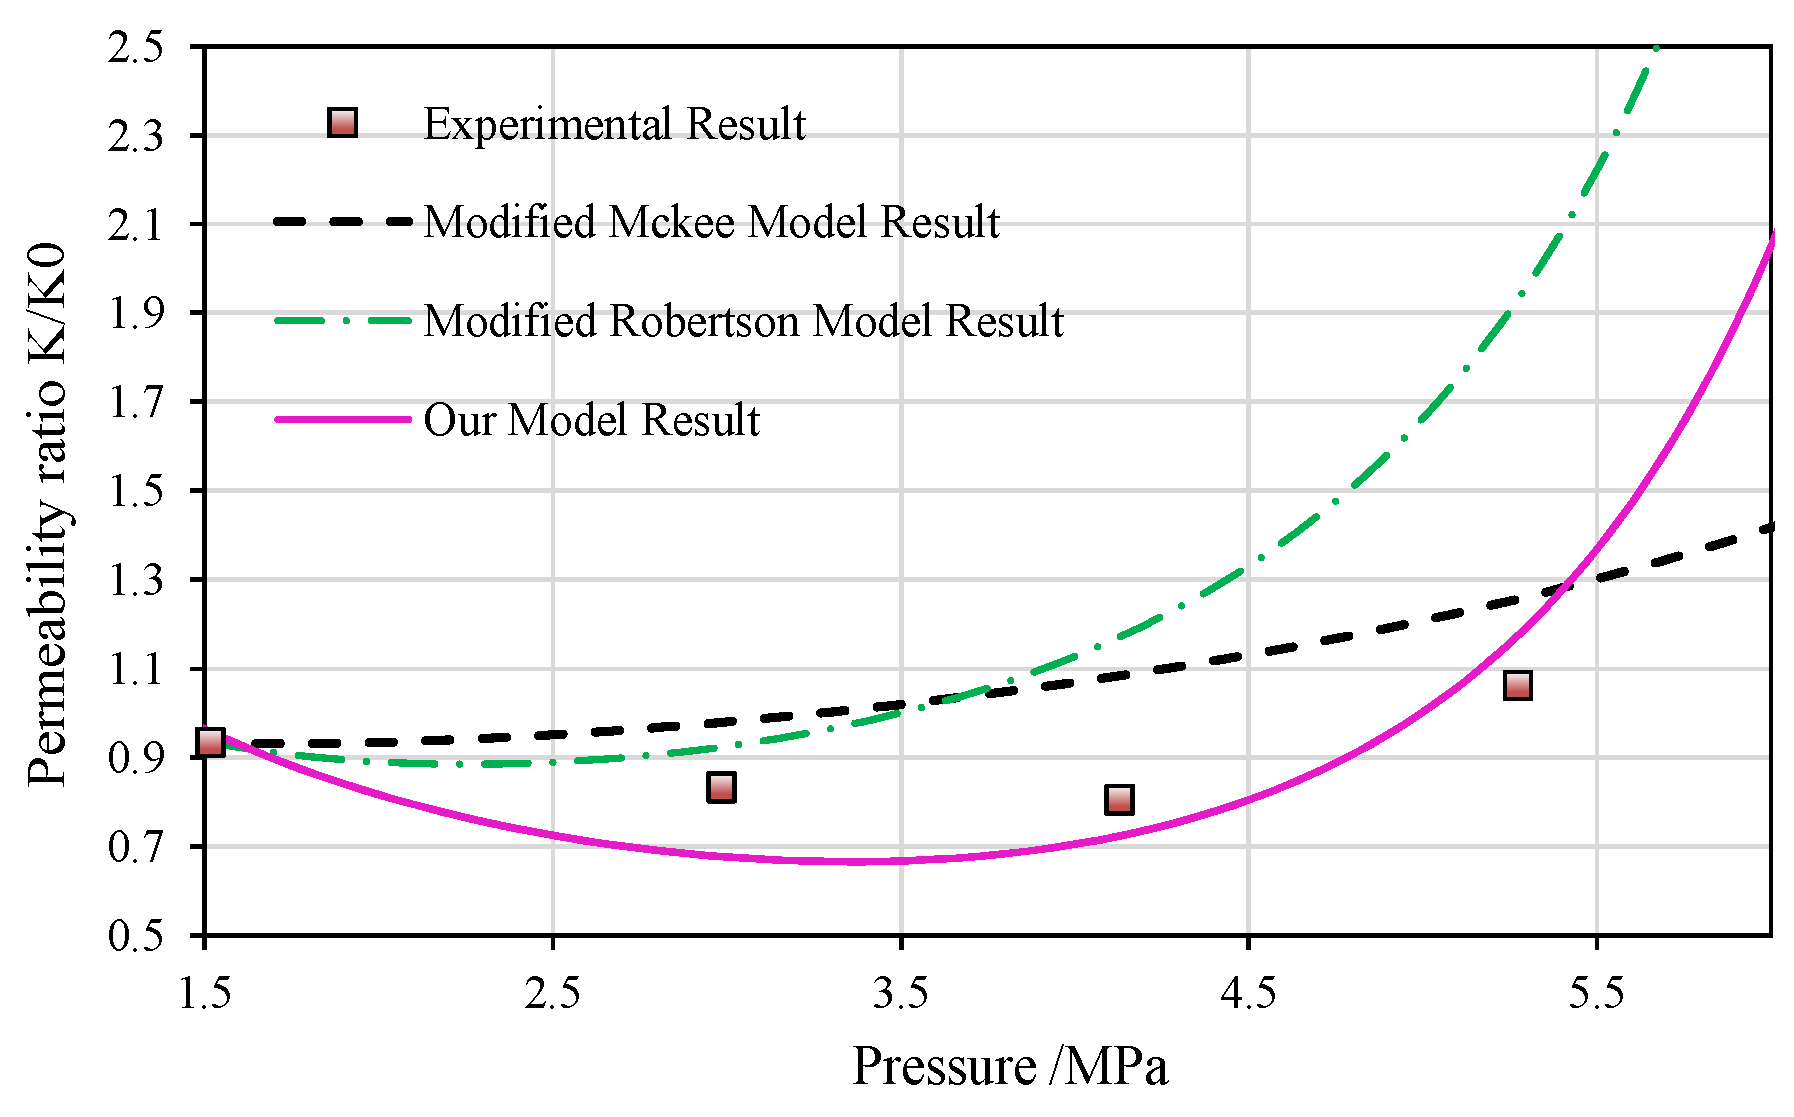
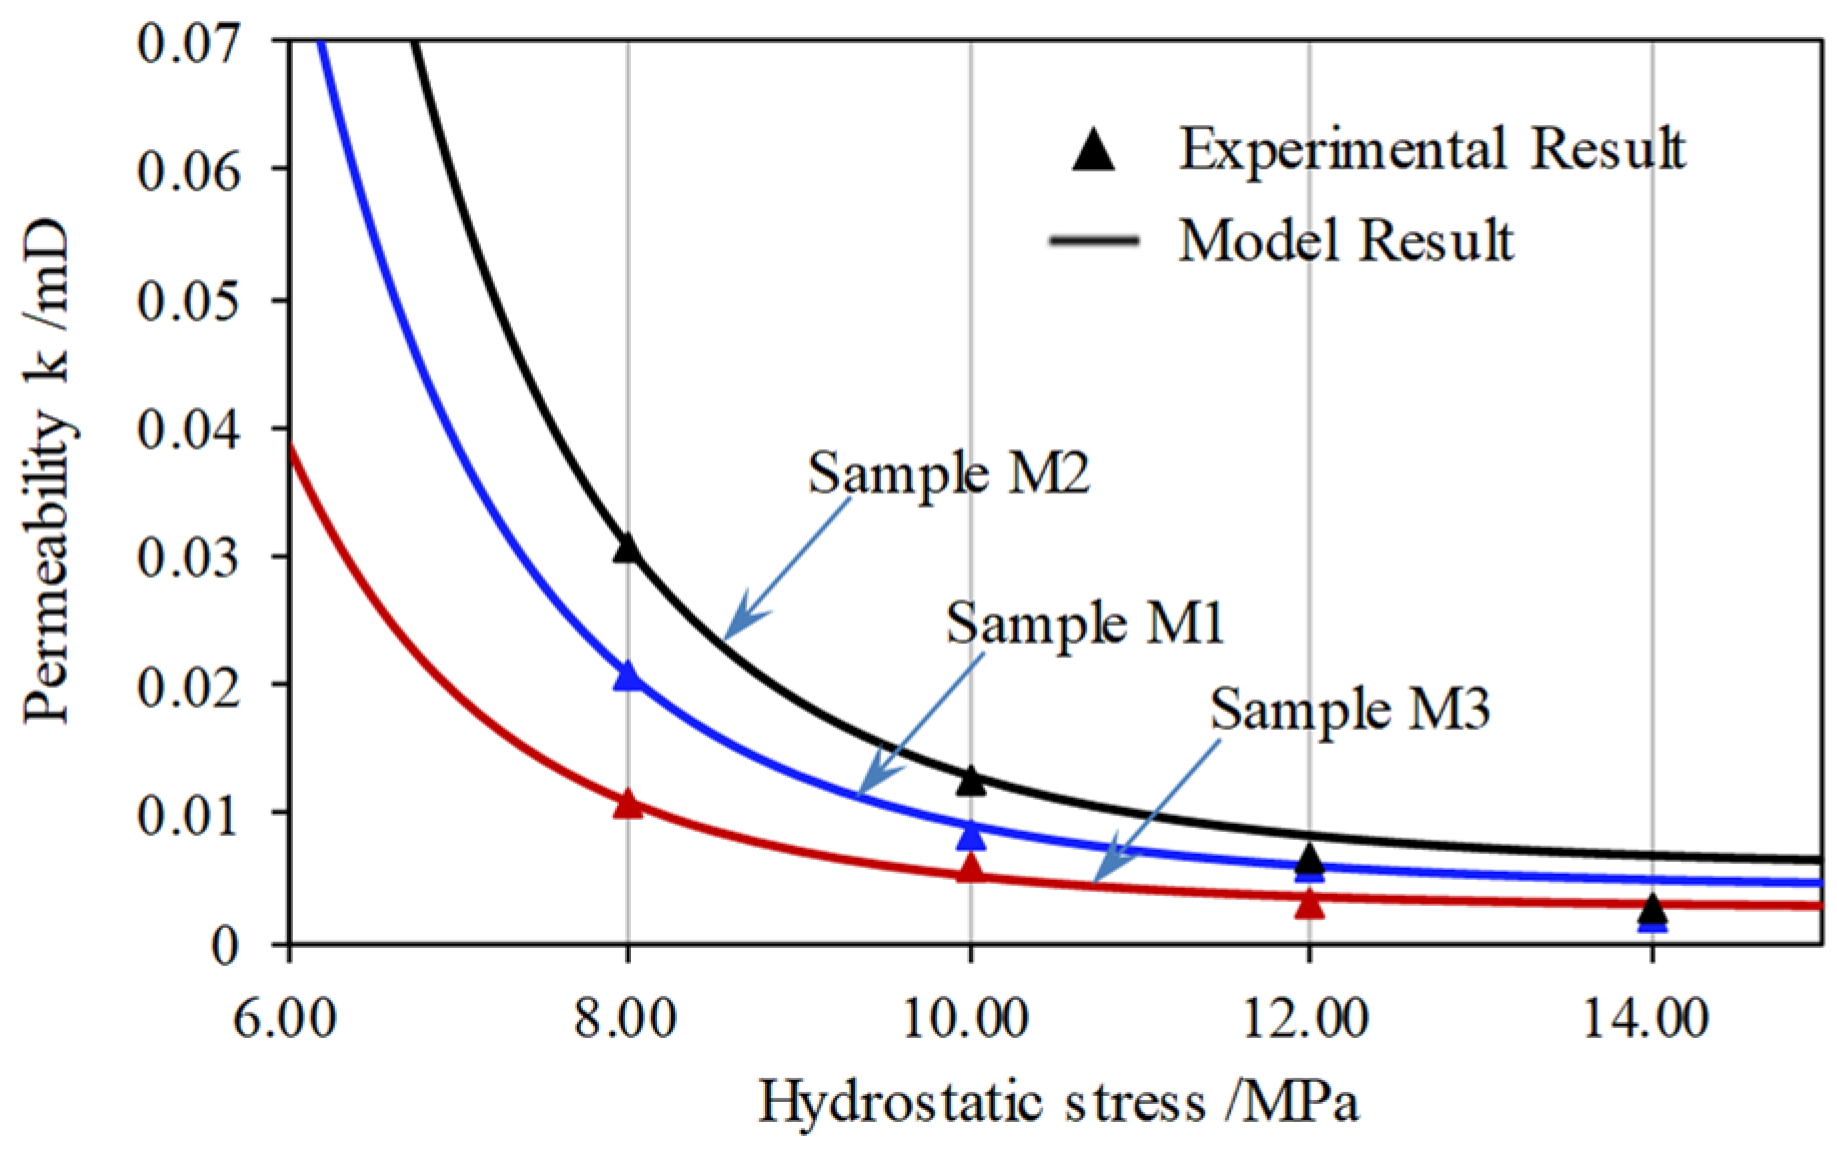
Based on the cubic law, which has been widely applied to describe permeability evolution with respect to porosity changes and considering gas slippage and matrix shrinkage/swelling due to gas desorption/adsorption, a new analytical model suited for permeability analysis of coal under different stress conditions is derived. To enhance its application, the permeability model is derived under constant hydrostatic stress and pore pressure, respectively. Comparisons between the calculated results and N2 and CO2 experimental permeability data show good matching results and thus indicate that coal permeability can be reliably predicted from our permeability model.
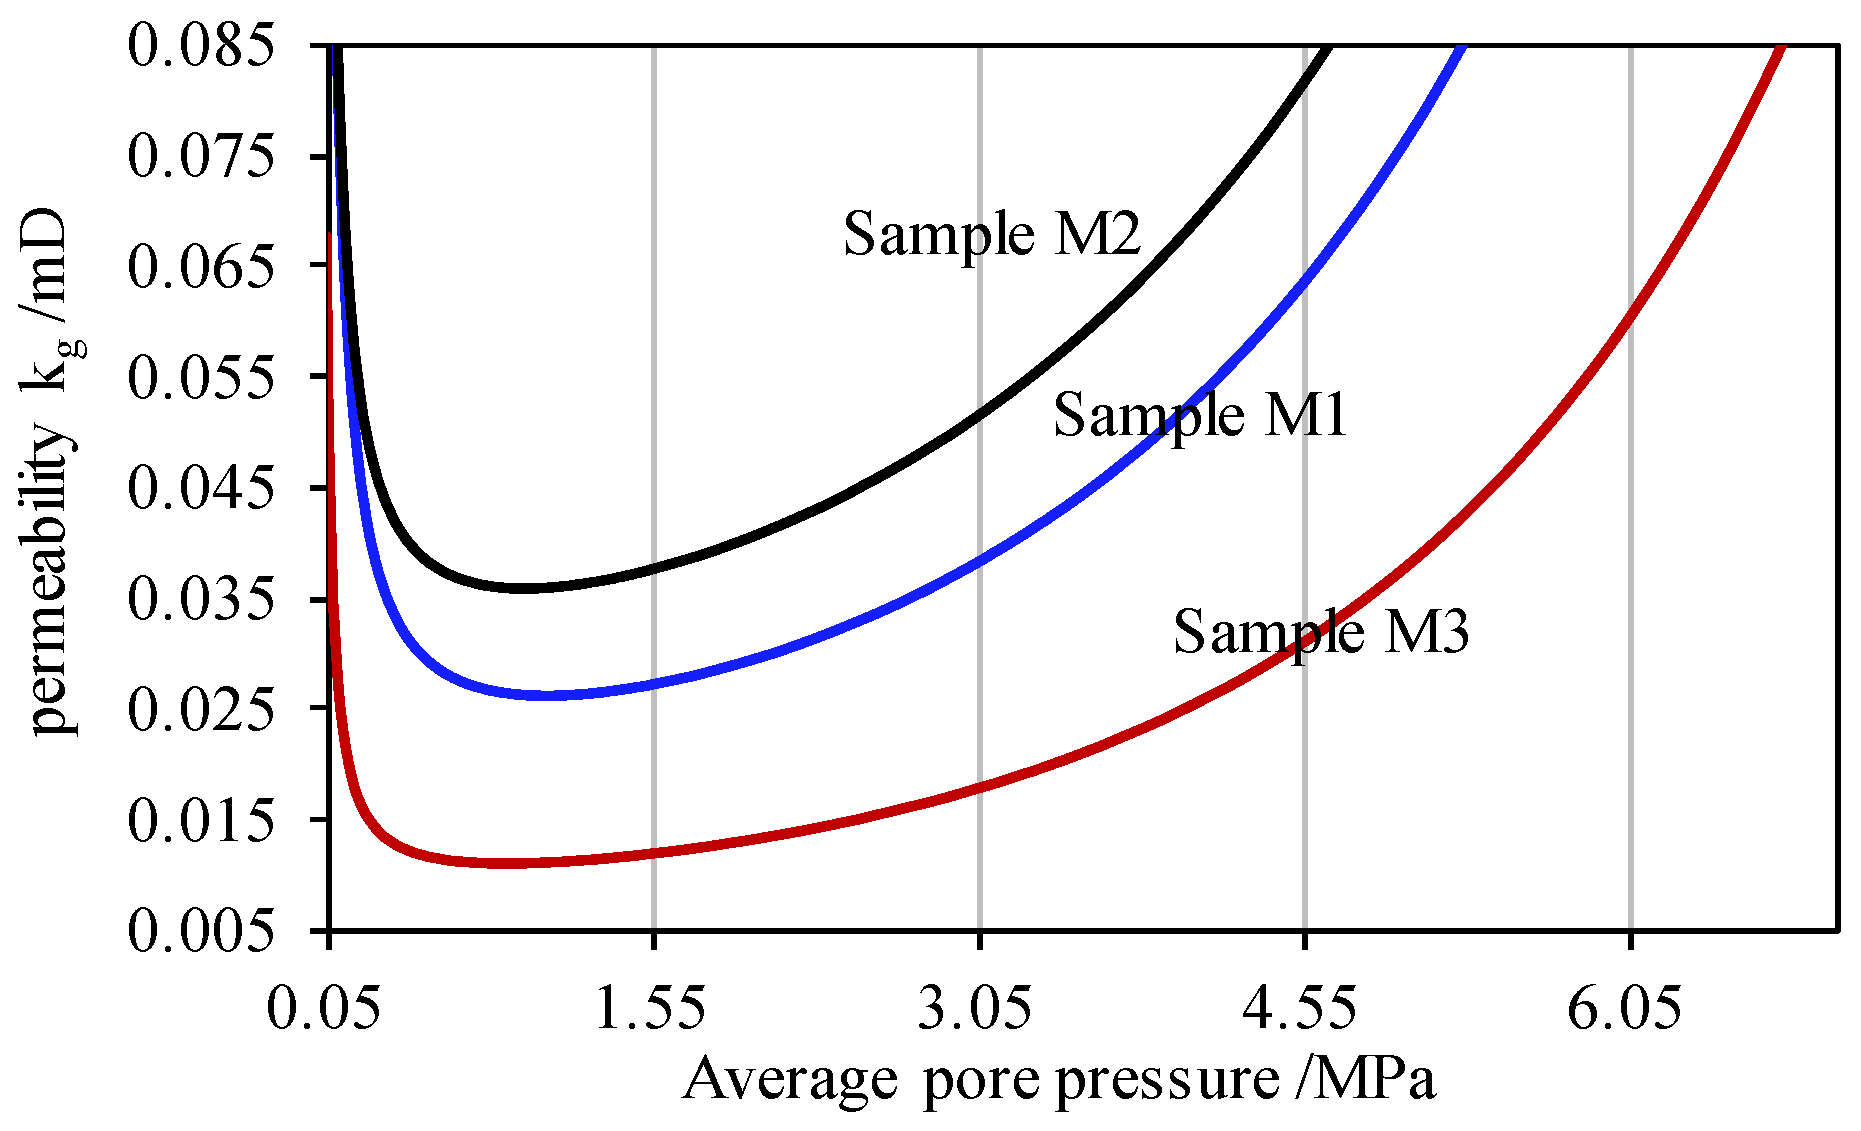
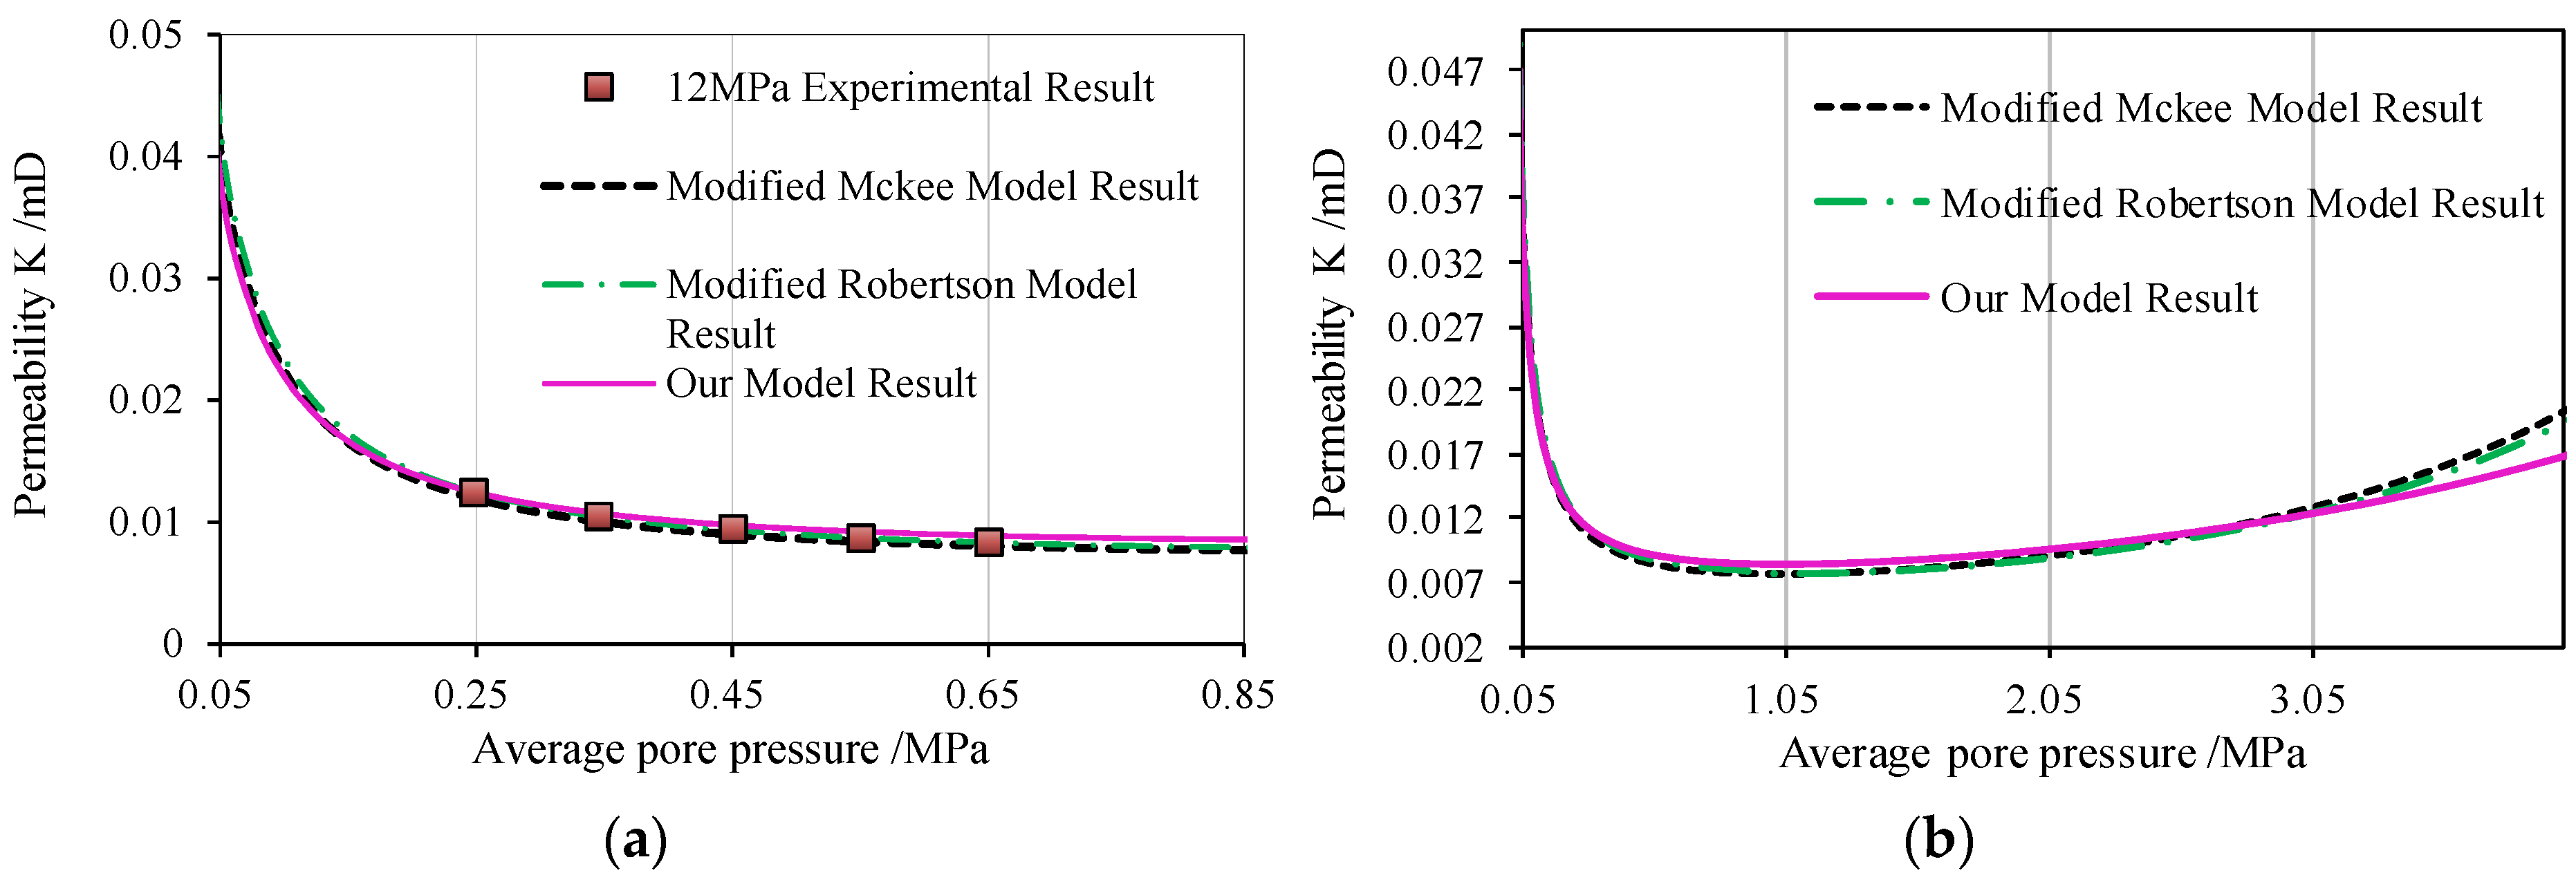
When the slippage effect is considered, the permeability follows a hook-shaped path with increasing average pore pressure. The gas slippage effect leads to a decline in permeability when the pore pressure increases within a lower pore pressure range. However, the effects of gas slippage decline with increasing gas pressure. Compared with an analytical permeability model that neglects the gas slippage effect, the model that does consider the gas slippage effect achieves better matching results from the experimental data. Therefore, the latter is more accurate for coal permeability analysis.

Author Contributions

Conceptualization, J.Z.; Investigation, J.Z.; Methodology, M.W. and J.Z.; Validation, M.W.; Visualization, M.W.; Writing—original draft, M.W.; Writing—review and editing, J.Z. All authors have read and agreed to the published version of the manuscript.

Funding

This work was supported by the China National Natural Science Foundation (No. 42177152 and 41902293), the Guiding Project of the Scientific Research Plan of the Hubei Provincial Department of Education (No. B2021272), and the Doctoral Fund of Wuhan Business University (No. 2019KB004).

Institutional Review Board Statement

Not applicable.

Informed Consent Statement

Not applicable.

Data Availability Statement

Data were obtained from Korea Energy Economics Institute and are available with the permission of Korea Energy Economics Institute.

Conflicts of Interest

All data used during this study are available from the corresponding author by request.

List of Symbols

kgapparent permeability
kKlinkenberg permeability or the absolute permeability
λmean free path of gas molecules
γaverage pore radius
paverage pore pressure
pin and poutthe inlet and outlet pressures
bslippage factor
KnKnudsen number
ϕporosity
ηfracture width
δmatrix block dimension
Eelastic modulus
vPoisson’s ratio
σeffective stress
SmaxLangmuir strain
pLLangmuir pressure
βeffective stress coefficient
Kvbulk modulus
Ksbulk modulus of solid grain material
Cfcleat compressibility
ρtdensity of the coal matrix
ρaapparent density of the coal sample

References

  1. Gray, I. Reservoir engineering in coal seams: Part 1-The physical process of gas storage and movement in coal seams. SPE Reserv. Eng. 1987, 2, 28–34. [Google Scholar] [CrossRef]
  2. Harpalani, S.; Chen, G. Estimation of changes in fracture porosity of coal with gas emission. Fuel 1995, 74, 1491–1498. [Google Scholar] [CrossRef]
  3. Levine, J.R. Model study of the influence of matrix shrinkage on absolute permeability of coal bed reservoirs. Geol. Soc. Spec. Publ. 1996, 109, 197–212. [Google Scholar] [CrossRef]
  4. Palmer, I.; Mansoori, J. Permeability depends on stress and pore pressure in coalbeds, a new model. SPE Reserv. Eval. Eng. 1998, 1, 539–544. [Google Scholar] [CrossRef]
  5. Shi, J.Q.; Durucan, S. Drawdown induced changes in permeability of coalbeds: A new interpretation of the reservoir response to primary recovery. Transp. Porous Media 2004, 56, 1–16. [Google Scholar] [CrossRef]
  6. Shi, J.Q.; Durucan, S. A model for changes in coalbed permeability during primary and enhanced methane recovery. SPE Reserv. Eval. Eng. 2005, 8, 291–299. [Google Scholar] [CrossRef]
  7. Massarotto, P.; Iyer, R.S.; Wang, F.; Rudolph, V. Laboratory studies of the 3D mechanical properties and permeability of Australian high volatile bituminous coal. In Proceedings of the 3rd Asia Pacific Coalbed Methane Symposium, Brisbane, Australia, 3–6 May 2011. [Google Scholar]
  8. Zou, J.P.; Chen, W.Z.; Yang, D.S. The impact of effective stress and gas slippage on coal permeability under cyclic loading. J. Nat. Gas Sci. Eng. 2016, 31, 236–248. [Google Scholar] [CrossRef]
  9. Liu, G.; Fan, Z.; Lu, Y.; Li, S.; Feng, B.; Xia, Y.; Zhao, Q. Experimental determination of gas relative permeability considering slippage effect in a tight formation. Energies 2018, 11, 467. [Google Scholar] [CrossRef] [Green Version]
  10. Wang, Z.; Fink, R.; Wang, Y.; Amann-Hildenbrand, A.; Krooss, B.M.; Wang, M. Gas permeability calculation of tight rocks based on laboratory measurements with non-ideal gas slippage and poroelastic effects considered. Int. J. Rock Mech. Min. Sci. 2018, 112, 16–24. [Google Scholar] [CrossRef]
  11. Li, Y.; Tang, D.; Xu, H.; Meng, Y.; Li, J. Experimental research on coal permeability: The roles of effective stress and gas slippage. J. Nat. Gas Sci. Eng. 2014, 21, 481–488. [Google Scholar] [CrossRef]
  12. Yu, X.; Xu, L.; Regenauer-Lieb, K.; Jing, Y.; Tian, F.B. Modeling the effects of gas slippage, cleat network topology and scale dependence of gas transport in coal seam gas reservoirs. Fuel 2020, 264, 116715. [Google Scholar] [CrossRef]
  13. Seidle, J.R.; Huitt, L.G. Experimental measurement of coal matrix shrinkage due to gas desorption and implications for cleat permeability increases. In International Meeting on Petroleum Engineering; Society of Petroleum Engineers: Canton, OH, USA, 1995. [Google Scholar]
  14. Palmer, I.; Mansoori, J. How permeability depends on stress and pore pressure in coalbeds: A new model. In SPE Annual Technical Conference and Exhibition; Society of Petroleum Engineers: Canton, OH, USA, 1996. [Google Scholar]
  15. Liu, H.H.; Rutqvist, J. A new coal-permeability model: Internal swelling stress and fracture–matrix interaction. Transp. Porous Media 2010, 82, 157–171. [Google Scholar] [CrossRef] [Green Version]
  16. Liu, J.; Chen, Z.; Elsworth, D. Evolution of coal permeability from stress-controlled to displacement-controlled swelling conditions. Fuel 2011, 90, 2987–2997. [Google Scholar] [CrossRef]
  17. Pan, Z.; Connell, L.D. Modelling of anisotropic coal swelling and its impact on permeability behaviour for primary and enhanced coalbed methane recovery. Int. J. Coal Geol. 2011, 85, 257–267. [Google Scholar] [CrossRef]
  18. McKee, C.R.; Bumb, A.C.; Koenig, R.A. Stress-dependent permeability and porosity of coal and other geologic formations. SPE Form. Eval. 1988, 3, 81–91. [Google Scholar] [CrossRef]
  19. Robertson, E.P.; Christiansen, R.L. A permeability model for coal and other fractured, sorptive-elastic media. In SPE Eastern Regional Meeting; Society of Petroleum Engineers: Canton, OH, USA, 2006. [Google Scholar]
  20. Wang, G.X.; Massarotto, P.; Rudolph, V. An improved permeability model of coal for coalbed methane recovery and CO2 geosequestration. Int. J. Coal Geol. 2009, 77, 127–136. [Google Scholar] [CrossRef]
  21. Klinkenberg, L.J. The permeability of porous media to liquids and gases. In Drilling and Production Practice; American Petroleum Institute: Washington, DC, USA, 1941. [Google Scholar]
  22. Zheng, Q.; Yu, B.; Duan, Y. A fractal model for gas slippage factor in porous media in the slip flow regime. Chem. Eng. Sci. 2013, 87, 209–215. [Google Scholar] [CrossRef]
  23. Wang, G.; Ren, T.; Wang, K. Improved apparent permeability models of gas flow in coal with Klinkenberg effect. Fuel 2014, 128, 53–61. [Google Scholar] [CrossRef]
  24. Schaaf, S.A.; Chambré, P.L. Flow of Rarefied Gases; Princeton University Press: Princeton, NJ, USA, 1961. [Google Scholar]
  25. Anez, L.; Calas-Etienne, S.; Primera, J. Gas and liquid permeability in nano composites gels: Comparison of Knudsen and Klinkenberg correction factors. Microporous Mesoporous Mater. 2014, 200, 79–85. [Google Scholar] [CrossRef]
  26. Ziarani, A.S.; Aguilera, R. Knudsen’s permeability correction for tight porous media. Trans Porous Media 2012, 91, 239–260. [Google Scholar] [CrossRef]
  27. Cui, X.; Bustin, R.M. Volumetric strain associated with methane desorption and its impact on coalbed gas production from deep coal seams. AAPG Bull. 2005, 89, 1181–1202. [Google Scholar] [CrossRef]
  28. Pan, Z.; Connell, L.D. Modelling permeability for coal reservoirs: A review of analytical models and testing data. Int. J. Coal Geol. 2012, 92, 1–44. [Google Scholar] [CrossRef]
  29. Laubach, S.E.; Marrett, R.A.; Olson, J.E.; Scott, A.R. Characteristics and origins of coal cleat: A review. Int. J. Coal Geol. 1998, 35, 175–207. [Google Scholar] [CrossRef]
  30. Reiss, L.H. The Reservoir Engineering Aspects of Fractured Formations; Editions Technip: Ashland, OH, USA, 1980. [Google Scholar]
  31. Cui, X.; Bustin, R.M.; Chikatamarla, L. Adsorption-induced coal swelling and stress: Implications for methane production and acid gas sequestration into coal seams. J. Geophys. Res. Solid Earth 2007, 112. [Google Scholar] [CrossRef]
  32. George, J.D.S.; Barakat, M.A. The change in effective stress associated with shrinkage from gas desorption in coal. Int. J. Coal Geol. 2001, 45, 105–113. [Google Scholar] [CrossRef]
  33. Karacan, C.Ö. Heterogeneous sorption and swelling in a confined and stressed coal during CO2 injection. Energy Fuels 2003, 17, 1595–1608. [Google Scholar] [CrossRef]
  34. Wang, G.X.; Wei, X.R.; Wang, K. Sorption-induced swelling/shrinkage and permeability of coal under stressed adsorption/desorption conditions. Int. J. Coal Geol. 2010, 83, 46–54. [Google Scholar] [CrossRef]
  35. Robertson, E.P. Measurement and Modeling of Sorption-Induced Strain and Permeability Changes in Coal. Ph.D. Thesis, Colorado School of Mines, Golden, CO, USA, 2005. [Google Scholar]
  36. Geertsma, J. The effect of fluid pressure decline on volumetric changes of porous rocks. Trans. AIME 1957, 210, 331–340. [Google Scholar] [CrossRef]
  37. Nur, A.; Byerlee, J.D. An exact effective stress law for elastic deformation of rock with fluids. J. Geophys. Res. 1971, 76, 6414–6419. [Google Scholar] [CrossRef]
  38. Robin, P.Y.F. Note on effective pressure. J. Geophys. Res. 1973, 78, 2434–2437. [Google Scholar] [CrossRef]
  39. Zhao, Y.S.; Hu, Y.Q.; Wei, J.P. The experimental approach to effective stress law of coal mass by effect of methane. Transp. Porous Media 2003, 53, 235–244. [Google Scholar]
  40. Chen, Z.; Pan, Z.; Liu, J. Effect of the effective stress coefficient and sorption-induced strain on the evolution of coal permeability: Experimental observations. Int. J. Greenh. Gas Control. 2011, 5, 1284–1293. [Google Scholar] [CrossRef]
  41. Amyx, J.W.; Bass, D.M.; Whiting, R.L. Petroleum Reservoir Engineering: Physical Properties; McGraw-Hill College: New York, NY, USA, 1960. [Google Scholar]
  42. Zou, J.; Hu, X.; Jiao, Y.Y.; Chen, W.; Wang, J.; Shen, L.; Tang, Z.; Gong, S. Dynamic Mechanical Behaviors of Rock’s Joints Quantified by Repeated Impact Loading Experiments with Digital Imagery. Rock Mech. Rock Eng. 2022. [Google Scholar] [CrossRef]
  43. Walsh, J.B. Effect of pore pressure and confining pressure on fracture permeability. Int. J. Rock Mech. Min. Sci. Geomech. Abstr. 1981, 18, 429–435. [Google Scholar] [CrossRef]
  44. Kranzz, R.L.; Frankel, A.D.; Engelder, T. The permeability of whole and jointed Barre granite. Int. J. Rock Mech. Min. Sci. Geomech. Abstr. 1979, 16, 225–234. [Google Scholar] [CrossRef]
  45. Tang, Z.C.; Wu, Z.L.; Zou, J.P. Appraisal of the number of asperity peaks, their radii and heights for three-dimensional rock fracture. Int. J. Rock Mech. Min. Sci. 2022, 153, 105080. [Google Scholar] [CrossRef]
  46. Jiao, Y.Y.; Wu, K.B.; Zou, J.P.; Zheng, F.; Zhang, X.F.; Wang, C.; Li, X.; Zhang, C. On the strong earthquakes induced by deep coal mining under thick strata-a case study. Geomech. Geophys. Geo-Energy Geo-Resour. 2021, 7, 97. [Google Scholar] [CrossRef]
  47. Perera, M.S.A.; Ranjith, P.G.; Choi, S.K.; Airey, D. Investigation of temperature effect on permeability of naturally fractured black coal for carbon dioxide movement: An experimental and numerical study. Fuel 2012, 94, 596–605. [Google Scholar] [CrossRef]
  48. Pini, R.; Ottiger, S.; Burlini, L.; Storti, G.; Mazzotti, M. Role of adsorption and swelling on the dynamics of gas injection in coal. J. Geophys. Res. Solid Earth 2009, 114. [Google Scholar] [CrossRef]
Figure 1. Conceptual schematic of a coal fracture or a cleat system.
Energies 15 06036 g001
Figure 2. Low-permeability rock test system. 1—triaxial chamber; 2—rock sample; 3—rubber membrane; 4—the heater; 5—nitrogen; 6—regulator valve; 7—gas pressure sensor; 8—bubble flow meter; 9—microflow meter; 10—transfer switch; 11—oil; 12—axial and confining loading systems; 13—temperature and experimental data acquisition equipment; 14—computers.
Energies 15 06036 g002
Figure 3. Mercury intrusion–extrusion data. The green line is the result of sample YG-1, the black is the result of sample YG-2, the blue is the result of sample YG-3, and the red line is the result of sample YG-4.
Energies 15 06036 g003
Figure 4. Fitting of the permeability model with experimental results under the hydrostatic stress of 8 MPa.
Energies 15 06036 g004
Figure 5. The fitting process of the slippage effect.
Energies 15 06036 g005
Figure 6. The Knudsen numbers at different average pore pressures.
Energies 15 06036 g006
Figure 7. Comparison between the experimental data and model calculation. (a) Sample M1, (b) Sample M2, (c) Sample M3.
Energies 15 06036 g007aEnergies 15 06036 g007b
Figure 8. Permeability model calculation results under a hydrostatic stress of 8 MPa.
Energies 15 06036 g008
Figure 9. Permeability model calculation results of sample M1 under different hydraulic stresses.
Energies 15 06036 g009
Figure 10. Permeability model calculation results without considering the gas slippage effect. (a) Fitting of the permeability model with the experimental data. (b) Permeability results for a wider pore pressure range.
Energies 15 06036 g010
Figure 11. Calculation results of the permeability models under a hydrostatic stress of 12 MPa and the corresponding experimental data of sample M1. (a) Comparison of the permeability models with the experimental data. (b) Calculation results for a wider pore pressure range.
Energies 15 06036 g011
Figure 12. Calculation results of the permeability models under a hydrostatic stress of 12 MPa and the corresponding experimental data of sample M2. (a) Comparison of the permeability models with the experimental data. (b) Calculation results for a wider pore pressure range.
Energies 15 06036 g012
Figure 13. Calculation results of the permeability models under a hydrostatic stress of 12 MPa and the corresponding experimental data of sample M3. (a) Comparison of the permeability models with experimental data. (b) Calculation results for a wider pore pressure range.
Energies 15 06036 g013
Figure 14. Calculation results of the permeability models and the corresponding experimental data.
Energies 15 06036 g014
Figure 15. Comparison between the experimental data and model calculation results.
Energies 15 06036 g015
Table 1. Knudsen number and flow regime classifications for porous media [26].
Flow RegimeKnudsen NumberModel to Be Applied
Continuum flowKn < 0.01Darcy’s equation for laminar flow and Forchheimer’s equation for turbulent flow
Slip flow0.01 < Kn < 0.1Darcy’s equation with Klinkenberg or Knudsen’s correction
Transition flow0.1 < Kn < 10Darcy’s law with Knudsen’s correction or Burnett’s equation with slip boundary conditions
Free molecular flowKn > 10Knudsen’s diffusion equation alternative methods are DSMC and lattice Boltzmann
Table 2. Fracture porosities of coal samples drilled at different depths in the Hunchun coalfield.
Drill Hole No.Coal Seam No.Sample Depth/mPorosity/%
271119#248.68–248.9011.49
271119a#254.56–255.3010
271120#287.0010.56
231323#117.90–119.3514.63
70423#666.9012.67
70421#615.40–616.908.39
70423a#657.70–658.705.67
K-420#361.00–363.206.38
K-423#422.46–425.0610.39
150820#447.95–448.6511.81
Average--10.20
Table 3. Parameters obtained from the fitting.
ParametersSample M1Sample M2Sample M3Average
Cleat compressibility C0 (MPa−1)0.140.1240.1540.14
Slippage factor b (MPa)0.2890.1820.210.23
Table 4. Mechanical properties and swelling parameters obtained from Robertson (2005) [35].
ParametersPoisson’s RatioElastic Modulus (GPa)Langmuir StrainLangmuir Stress (MPa)Cleat Compressibility (MPa−1)
Values0.351.380.0153.830.041
Table 5. Coal intrinsic permeability under different hydrostatic stresses (×10−2 mD).
SamplesHydrostatic Stress (MPa):
8101214
M12.090.840.570.21
M23.061.260.670.26
M31.100.590.32
Publisher’s Note: MDPI stays neutral with regard to jurisdictional claims in published maps and institutional affiliations.

