Article

Green Credit of China’s Coal Power Enterprises during Green Transformation: A Tripartite Evolutionary Game Analysis

1
School of Economics and Management, Tongji University, Shanghai 200092, China
2
School of Management Engineering, Shandong Jianzhu University, Jinan 250101, China
3
School of Economics and Management, Shanghai University of Electric Power, Shanghai 200090, China
*
Author to whom correspondence should be addressed.
Energies 2022, 15(16), 5911; https://doi.org/10.3390/en15165911
Submission received: 8 July 2022 / Revised: 10 August 2022 / Accepted: 12 August 2022 / Published: 15 August 2022
(This article belongs to the Section C: Energy Economics and Policy)

Abstract

:
China’s green credit has mostly been invested in new energy areas with positive environmental externalities in recent years, while coal power enterprises have been neglected. This paper constructs a tripartite evolutionary game model among government, coal power enterprises, and banks to clarify the key factors and mechanisms for coal power enterprises undergoing green transformation. The research results show that: Firstly, to realize the spontaneous green transformation of coal power enterprises, spontaneous profitability must be achieved before the removal of policy incentives, which is reflected in the continuous increase in electricity price, carbon emission trading price, and decrease in green transformation cost. Secondly, the green credit adjustment factor cannot determine whether a company chooses to undertake green transition, but it provides a valuable window of green transition for companies. When the relative benefits of green transformation projects are greater than the relative costs, coal power enterprises will undergo green transformation spontaneously. Thirdly, lower green credit interest rates are not better. An optimal green credit interest rate exists, that allows coal power enterprises to obtain the longest transition window in which to achieve spontaneous profitability for green transition projects.

1. Introduction

The overwhelming magnitude of existing coal infrastructure makes it highly uncertain whether China can decarbonize its heavily coal-reliant power system [1]. China remains unable to declare a “coal phase-out”, as coal is likely to occupy an important position in China’s energy system in the short term [2]. The work of energy conservation and carbon reduction should be based on industrial transformation, which could be advanced through reasonable industrial structure adjustment. Energy intensity can be reduced, and the aim of carbon reduction can be achieved without affecting economic growth [3]. Although coal power is the main source of carbon emissions [4], its high efficiency of power generation and the stability of the energy supply are crucial for maintaining China’s energy security and stable economic growth, and thermal power generation is the basis for the development of green industries at this early stage [5]. Meanwhile, the strict financing constraints of traditional energy reduce the demand for the application of cleaner coal production technology, thus hindering the development of the cleaner coal power production industry. Therefore, an analysis of the green credit policy during green transformation and a clarification of the key factors of transformation are of great practical value for accelerating the transformation of China’s energy structure.
Most studies have employed empirical methods to evaluate the effect of the green credit policy. One view is that green credits make a significant positive contribution to green economic growth as well as the structural transformation of industry [6,7,8,9,10,11,12,13,14,15,16,17,18]. Another view is that the green credit policy increases the financing cost of enterprises and hurts their development [19,20,21,22,23,24]. Such studies have failed to systematically analyze the interaction mechanisms of multiple subjects under the green credit policy, and have been unable to form consistent conclusions due to the differences in the research objects and dimensions employed.
To explore the multi-subject game process in the context of green incentives more systematically, some scholars have used game theory to analyze the evolutionary game process of the multiple subjects of enterprises [25,26,27,28,29,30,31,32,33,34]. Existing studies have failed to build a game payment matrix around the green transformation of coal power enterprises that combines the key factors of green transformation; therefore, it is difficult to analyze the influence of the green credit interest rate on the evolutionary path of green transformation, and therefore, the proposed policy recommendations are weakly targeted.
This paper helps to explain the mechanism of green credit in order to assist coal power enterprises in achieving green transformation: what the important influencing factors are in the green transformation process, how these factors affect the green transformation process, and how the credit rate can be set so that coal power enterprises have the maximum probability of achieving green transformation. We focus on the green credit policy during the green transformation of coal power enterprises and construct a tripartite evolutionary game model of government, coal power enterprises, and banks in order to clarify the process of development and the key factors of green transformation. We simulate real cases using MATLAB, and visualize the influence of important influencing factors on the green transformation process, as well as measuring the most available credit rate adjustment factor. In this way, we provide a reference for decision making for the promotion of the green transformation of coal power enterprises.

2. Literature Review

There is a vast literature related to green credit attempting to evaluate the effect of its implementation on green credit policy. One view is that green credit makes a significant positive contribution to green economic growth as well as industrial structural transformation [6,7,8,9,10,11,12,13,14,15,16,17,18]. Green credit is closely related to enterprises’ financing capacity, investment level, degree of technological innovation, and performance [6,7]. Bank credit policies play an important role in enterprises’ ability to achieve technological progress, and deregulation of financing has a significant positive impact on the quantity and quality of innovation activities. The ability of enterprises to maintain a certain scale of external financing is key to their capacity to improve productivity, achieve growth and development, and maintain their competitive advantage [8], and there exists a significant positive correlation between the size of an enterprise’s loans and its degree of innovation [9]. In terms of impact, developed financial markets can significantly increase the level of external financing available for renewable energy enterprises, in turn resulting in a reduction in CO2 emissions [10]. Green credit policies together with government fiscal incentives can further guide corporate supply chains to effectively reduce pollution levels [11]. In terms of the impact of green credit on industrial structure, this occurs mainly through the capital and financing channels of enterprises. Green credit in China has a significant impact on the transformation of industrial structure, and there are some differences in the impact of green credit on industrial structure among different regions [12]. In terms of research on the impact mechanism, it has been shown that green credit, by imposing long-term credit constraints on highly polluting firms, forces firms to favor pollution prevention at the source rather than end-of-pipe treatment, greatly improving corporate environmental and financial performance [13,14,15]. In addition, enterprises practicing green management and environmental information disclosure are able to obtain more bank loans and take advantage of the positive feedback of green credit to support their green transformation, in turn improvin energy use efficiency and green total factor productivity [16,17,18].
Another view is that the green credit policy increases the financing cost of enterprises and hurts their development. As the demand side of cleaner production technologies, energy companies with high pollution levels are constrained by green loan financing. This also hinders the introduction of green projects and thus the development of cleaner production technologies [19,20,21,22,23,24]. When studying the impact of heavily polluting enterprises, some scholars have used the official implementation of the Green Credit Guidelines in 2012 as a basis on which to construct a quasi-natural experiment, and found that new investment in large heavily polluting enterprises decreased significantly, the cost of debt significantly increased for heavily polluting enterprises, and their operational performance significantly decreased [19,20], resulting in a decline in total factor productivity [21]. Green credit increases the cost of debt financing for highly polluting enterprises and fails to achieve the goal of adjusting loan amounts and maturity with the aim of helping highly polluting enterprises to achieve technological transformation and industrial upgrade [22,23]. In an impact study of renewable energy, He et al. [24] analyzed the degree of green finance development and investment efficiency of 141 listed renewable energy enterprises in China, and found that the development of green finance reduced the bank credit of renewable energy enterprises and negatively affected the efficiency of renewable energy investment. For over-invested renewable energy enterprises, green finance development reduced renewable energy investment by reducing bank credit allocation; for under-invested renewable energy enterprises, green finance failed to alleviate their under-investment.
The above studies assessed the impact of green credit policies on single subjects on the basis of empirical tests and other methods, but failed to systematically analyze the mechanisms of interaction of multiple subjects under the green credit policy, and were not able to form consistent conclusions due to their having different research objects and dimensions.
Since the current international definition of green finance does not include the clean utilization of coal except in China [25], we next draw on international cases of green incentives to provide a comprehensive reference for analyzing the green transformation process of China’s coal power industry under green credit policies [26,27,28,29,30,31,32,33,34,35]. Some scholars believe that green incentives have a significant positive effect on industrial development. Hafezalkotob et al. [26] considered the impact of environmental policies on green production and supply chains using a multi-level game theory approach, and found that the government was able to reduce the negative environmental impacts of supply chains and encourage green production by means of taxes and subsidies with the aim of encouraging green production. Subsequently, Hafezalkotob and Mahmoudi [27] conducted research work on the effects of government policy on competition in traditional thermal power plants. The dependence of the production strategy of power plants on governmental tax policy was investigated using evolutionary game theory. The evaluation results showed that tax and environmental protection policies have obvious influences on power plants, and the government can introduce a green energy source as an ESS for competitive power plants by imposing appropriate tariffs. Kuang [28] explored the process of constructing a new energy subsidy system using game theory and found that energy management and the overall optimization of energy structure play important roles in national economic development and industrial structure upgrade. Tian et al. [29] used a system dynamics model to analyze the relationship between the interests of government, enterprises, and consumers in the automobile manufacturing industry, highlighting that manufacturer subsidies are more beneficial than consumer subsidies at enhancing the effect of green supply chain management. Xu and Zhou [30] analyzed the strategic choice to implement a green supply chain in the home appliance industry based on government subsidies using a tripartite game model incorporating government, enterprises, and consumers, and demonstrated the necessity of government subsidies. Sheu and Chen [31] found that government subsidy policies can effectively promote green supply chain management by analyzing the relationship between government, enterprises, and consumers, while manufacturer subsidies can promote the implementation of a green supply chain better than consumer subsidies. Geng et al. [32] showed that both the central and local governments in China play a leading role in promoting cleaner production by coordinating stakeholders, providing financial support, stipulating appropriate policies, and implementing construction plans.
Other scholars have noted that the current green incentive policy has some disadvantages, and should be formulated with caution. Dong et al. [33] found that the price of green certificates was too low, potentially resulting in the policy being ineffective at alleviating pressure on government funding subsidies. Therefore, energy authorities should set a lower limit on the price of a green certificate transaction. Zhao et al. [34] found, using a game model, that the government should increase environmental regulations such as subsidies and penalties to induce enterprises to implement environmental management policies. Zhang et al. [35] used the trilateral evolutionary game model to study regional disparities in energy storage access to electricity markets, finding that government subsidies require substantial input to achieve a small visible promotion effect. This strategy is likely to backfire for small power companies. The subsidy strategy of governments should be carefully set, and a system of fines can prevent cheating.
The effect of green incentives determined using the evolutionary game model is highly dependent on the relevant models and the parameter settings, and the existing studies failed to reach consistent conclusions as a result of employing different model settings. At the same time, since few existing studies have built game models related to the green transformation process of China’s coal power industry, it is important to build an evolutionary game model that is consistent with reality and covers the key influencing factors.

3. The Evolutionary Game Model

3.1. Assumptions

To analyze the evolutionary game process of government, coal power enterprises, and banks in the context of the green transformation of Chinese coal power enterprises, the influence of coal price, power generation, electricity price, carbon emissions trading, credit interest rate, and other factors influencing the game process in the business processes of coal power enterprises are considered, with the relevant variables being set in Table 1.
π 1 ( Q ) is the economic benefit provided to society by the electricity generated by the coal power enterprises, which is assumed to be an increasing function of electricity generation Q , and π 2 ( C Q ) is the environmental benefit provided to society by the reduction in carbon emissions of coal power enterprises, which is assumed to be a decreasing function of carbon emissions C Q . C is the management cost incurred by the government to implement the green credit policy, which includes the supervision of the green credit projects of banks and the verification of the carbon emissions of coal power enterprises. Since green credit projects usually have long payback periods and are not profitable in the short term, the government grants a certain amount of green credit financial subsidies R to banks at the beginning of the project to alleviate the financial pressure arising from the issuance of green credits, ensuring the smooth implementation of the green credit policy. The tariff of coal power enterprises is P , the cost of purchasing coal is C C . The power generation of green transformation coal power enterprises is Q 1 , the power generation without green transformation coal power enterprises is Q 2 .
The carbon emissions of coal power enterprises undergoing green transformation is C Q 1 , the carbon emissions of coal power enterprises not undergoing green transformation is C Q 2 . The letter r denotes the interest rate of loans to coal power enterprises, and m is the loan amount for the green transformation project. Green credit aims to encourage uses of loans that are consistent with sustainable economic and social development, so a certain discount is given to the interest rate for green transformation project loans. k is the green credit interest rate adjustment coefficient, and 0 < k < 1 . The cost to the bank is B C ; banks implementing green credit policies will result in additional operating costs, so it is assumed that the cost to the bank of the implementation of the green credit policy scenario B C 1 is greater than the cost in a traditional loan scenario B C 2 . The evolutionary game matrix of government, coal power enterprises, and banks is shown in Table 2.

3.2. Model Analysis

3.2.1. Expected Return Function

Government expectations of providing green credit incentives to banks:
U x = y × z × π 1 ( Q 1 ) + π 2 ( C Q 1 ) C R + 1 z × π 1 ( Q 1 ) + π 2 ( C Q 1 ) C + 1 y × z × π 1 ( Q 2 ) + π 2 ( C Q 2 ) C + 1 z × π 1 ( Q 2 ) + π 2 ( C Q 2 ) C
Government expectations of not providing green credit incentives to banks:
U 1 x = y × z × π 1 ( Q 1 ) + π 2 ( C Q 1 ) + 1 z × π 1 ( Q 1 ) + π 2 ( C Q 1 ) + 1 y × z × π 1 ( Q 2 ) + π 2 ( C Q 2 ) + 1 z × π 1 ( Q 2 ) + π 2 ( C Q 2 )
Expectations of coal power enterprises choosing to undergo green transformation:
U y = z x × ( P C C ) × Q 1 ( C Q 1 A ) × C P r × m × k + 1 x ( P C C ) × Q 1 ( C Q 1 A ) × C P r × m × k + 1 z x × ( P C C ) × Q 1 ( C Q 1 A ) × C P r × m + 1 x ( P C C ) × Q 1 ( C Q 1 A ) × C P r × m
Expectations of coal power enterprises choosing to passively reduce production:
U 1 y = z x × ( P C C ) × Q 2 ( C Q 2 A ) × C P + 1 x ( P C C ) × Q 2 ( C Q 2 A ) × C P + 1 z x × ( P C C ) × Q 2 ( C Q 2 A ) × C P + 1 x ( P C C ) × Q 2 ( C Q 2 A ) × C P
Bank expectations of providing green credit to coal power enterprises:
U z = x y r × m × k B C 1 + R + 1 y × 0 + 1 x y r × m × k B C 1 + 1 y × 0
Bank expectations of providing traditional credit to coal power enterprises:
U 1 z = x y r × m B C 2 + 1 y × 0 + 1 x y r × m B C 2 + 1 y × 0

3.2.2. Equilibrium Point Solution

The dynamic replication equations for government, coal power enterprises, and banks are expressed as follows:
L x = d x d t = x 1 x U x U 1 x = x × 1 x × y × z × R C
L y = d y d t = y 1 y U y U 1 y = y × 1 y × ( P C C ) × ( Q 1 Q 2 ) ( C Q 1 C Q 2 ) × C P r × m × 1 z + z × k
L z = d z d t = z 1 z U z U 1 z = z × 1 z × x × y × R + y × k × r × m r × m B C 1 + B C 2
Let L x = 0 , L y = 0 , L z = 0 . Eight equilibrium points can be obtained as follows: E 1 0 , 0 , 0 ,   E 2 1 , 0 , 0 ,   E 3 0 , 1 , 0 ,   E 4 0 , 0 , 1 ,   E 5 1 , 1 , 0 ,   E 6 1 , 0 , 1 ,   E 7 0 , 1 , 1 ,   E 8 1 , 1 , 1 .

3.3. Asymptotic Stability Analysis

To further analyze the asymptotic stability of the system game, the replicated dynamics of the government, enterprises, and banks are derived separately:
L x = 1 2 x × y × z × R C = 1 2 x × β x
L y = 1 2 y × ( P C C ) × ( Q 1 Q 2 ) ( C Q 1 C Q 2 ) × C P r × m × 1 z + z × k = 1 2 y × β y
L z = 1 2 z × x × y × R + y × k × r × m r × m B C 1 + B C 2 = 1 2 z × β z

3.3.1. Asymptotic Stability Analysis of Government

In Equation (10), when y × z × R C = 0 and L x = 0 , and x in the interval range are steady states, government decisions do not change over time, and are in a strategic steady state, as shown in Figure 1a. When y × z × R C > 0 , let L x = 0 , that is, x = 0 or x = 1 . L x ( 0 ) > 0 and L x ( 1 ) < 0 ; therefore, the evolutionary stabilization strategy of the government is x = 1 , and it will choose to give fiscal incentives to employ green credit, as shown in Figure 1b. When y × z × R C < 0 , let L x = 0 , that is x = 0 or x = 1 . L x ( 0 ) < 0 and L x ( 1 ) > 0 ; therefore, the evolutionary stabilization strategy of the government is x = 0 , and it will choose not to give fiscal incentives to employ green credit, as shown in Figure 1c.

3.3.2. Asymptotic Stability Analysis of Coal Power Enterprises

In Equation (11), when ( P C C ) × ( Q 1 Q 2 ) ( C Q 1 C Q 2 ) × C P r × m × 1 z + z × k = 0 , L y = 0 , and y in the interval range are steady states, the decisions of coal power enterprises do not change over time, and are in a strategic steady state, as shown in Figure 2a. When ( P C C ) × ( Q 1 Q 2 ) ( C Q 1 C Q 2 ) × C P r × m × 1 z + z × k > 0 , let L y = 0 , that is, y = 0 or y = 1 , L y ( 0 ) > 0 and L y ( 1 ) < 0 . Therefore, the evolutionary stabilization strategy for the coal power enterprises is y = 1 , and enterprises will choose to undergo green transformation, as shown in Figure 2b. When ( P C C ) × ( Q 1 Q 2 ) ( C Q 1 C Q 2 ) × C P r × m × 1 z + z × k < 0 , let L y = 0 , that is, y = 0 or y = 1 , L y ( 0 ) < 0 and L y ( 1 ) > 0 . Therefore, the evolutionary stabilization strategy of the coal power enterprises is y = 0 , and enterprises will choose to passively reduce production, as shown in Figure 2c.

3.3.3. Asymptotic Stability Analysis of Banks

In Equation (12), when x × y × R + y × k × r × m r × m B C 1 + B C 2 = 0 , let L z = 0 , and z in the interval range are steady states, the decisions of banks do not change over time, and are in a strategic steady state, as shown in Figure 3a. When x × y × R + y × k × r × m r × m B C 1 + B C 2 > 0 , let L z = 0 , that is z = 0 or z = 1 , L z ( 0 ) > 0 and L z ( 1 ) < 0 . Therefore, the bank’s evolutionary stabilization strategy is z = 1 , and the bank will choose to provide green credit subsidies, as shown in Figure 3b. When x × y × R + y × k × r × m r × m B C 1 + B C 2 < 0 , let L z = 0 , that is z = 0 or z = 1 , L z ( 0 ) < 0 and L z ( 1 ) > 0 . Therefore, the bank’s evolutionary stabilization strategy is z = 0 , and the bank will choose not to give green credit subsidies, as shown in Figure 3c.

4. Equilibrium Analysis

To determine which equilibrium constitutes an evolutionarily stable strategy, further stability analysis is required. Friedman [36] proposed the use of Jacobi matrices to determine the stability of equilibria, and that the stability of each equilibrium could be judged on the basis of the values of the matrix determinant and the positive and negative signs of the traces of the matrix. The corresponding equilibrium point is only an evolutionarily stable strategy (ESS) when the three eigenvalues of the Jacobian matrix are negative at the same time.
As shown in Equations (13)–(22), the partial derivatives of L x , L y , L z are obtained separately for the Jacobi matrix:
J = F x x F x y F x z F y x F y y F y z F z x F z y F z z
F x x = 1 2 x y R z C
F x y = x 1 x × R × z
F x z = x 1 x × y × R
F y x = 0
F y y = 1 2 y × P C C × Q 1 Q 2 C Q 1 C Q 2 × C P r × m × 1 z + z × k
F y z = 1 k × r × m 1 y × y
F z x = z × 1 z × y × R
F z y = z × 1 z × x × R + k × r × m r × m
F z z = 1 2 z × x × y × R + y × k r m r m B C 1 + B C 2

4.1. Game Equilibrium Point Analysis

As shown in Table 3, ( P C C ) × ( Q 1 Q 2 ) is the difference between the profit of coal power generation under green transformation and passive reduction scenarios. It is assumed that coal power enterprises undergoing green transformation have higher power generation efficiencies. Based on the premise of the same total installed capacity, units undergoing green transition will be less affected by the carbon reduction policy, while those units not undergoing green transition will be subject to larger-scale production restrictions; therefore, we assume that Q 1 > Q 2 . This paper focuses on analyzing the green transformation process of coal power companies in the normal business scenario, and therefore it is assumed that the feed-in price of power generation P is greater than the cost of power generation C C , and therefore ( P C C ) × ( Q 1 Q 2 ) > 0 . ( C Q 1 C Q 2 ) × C P is the difference in the number of carbon credits purchased by coal power enterprises due to the difference in carbon emissions between the two scenarios. Although the power generation capacity of coal units not undergoing green transformation is about 20% less than that of units undergoing green transformation due to the “Notice of National Development and Reform Commission and National Energy Administration on the Orderly Decentralization of Electricity Consumption Plan”, their carbon emissions are higher than those of units undergoing green transformation, because they have not undergone green transformation. We assume that C Q 1 < C Q 2 , and ( C Q 1 C Q 2 ) × C P < 0 . r × m is the loan interest rate necessary for carrying out the green transformation project.
The stability of (0,1,0) is unknown, and needs to be further judged based on the symbol of the eigenvalues λ 1 , λ 2 , λ 3 , while all other equilibrium points are unstable. On the basis of a λ 2 of (0,1,0), it can be known that whether coal power enterprises are able to spontaneously choose to undergo green transition depends on whether the difference between the value of the change in power generation revenue ( P C C ) × ( Q 1 Q 2 ) and the value of the change in carbon emission cost ( C Q 1 C Q 2 ) × C P is greater than the credit cost r × m . Before the introduction of the green credit policy, the difference between ( P C C ) × ( Q 1 Q 2 ) and ( C Q 1 C Q 2 ) × C P was usually smaller than the cost of credit r × m , that is λ 2 < 0 in (0,1,0); therefore, coal power enterprises would not choose green transformation without external incentives, and (0,1,0) is not an evolutionarily stable strategy.
To stimulate the green transformation of enterprises, a green credit policy should be introduced, and banks should give green credit subsidies to enterprises, r × m × ( 1 k ) ; thereby, when the green credit adjustment factor k is decreased, the difference between ( P C C ) × ( Q 1 Q 2 ) and ( C Q 1 C Q 2 ) × C P of coal power enterprises will attain a value greater than r × m × k , resulting in λ 2 < 0 in (0,1,1). Then, the system will be (0,1,1), that is, the government does not provide green incentives, enterprises choose green transformation, and banks provide green credit. However, bank green credit subsidies r × m × ( 1 k ) and the relative cost B C 1 B C 2 of implementing green credit are both positive, and bank performance will be under continuous pressure at (0,1,1), λ 3 > 0 ; therefore, (0,1,1) is not an evolutionarily stable strategy.
To reduce the financial pressure on banks to grant green credit, the government must provide green credit incentives, and the difference between the value of the changes in transition benefits ( P C C ) × ( Q 1 Q 2 ) and the value of the changes in the cost ( C Q 1 C Q 2 ) × C P of coal and electricity enterprises in this state is greater than the cost of green credit r × m × k , that is λ 2 < 0 in (1,1,1), and it is also clear from the λ 3 of (1,1,1) that the green credit incentives R provided by the government to banks need to be greater than the amount of loan subsidies given by banks to coal and electricity enterprises r × m × ( 1 k ) and the sum of the change in the cost of providing green credit in order to make λ 3 < 0 in (1,1,1), whereby the system evolves into (1,1,1), that is, the government provides green credit incentives to the banks, enterprises choose green transformation, and the banks choose green credit.
The (0,1,0) to (0,1,1) to (1,1,1) evolution track is driven by policy and is an unnatural evolutionary process, which will reverse when the policy expires or the relevant policy objectives are gradually completed.
Since λ 1 > 0 in (1,1,1), the incentives are not sustainable, and (1,1,1) is not an evolutionarily stable strategy. When the policy ends, the government evolves from giving green credit incentives to not giving them, which means that (1,1,1) will evolve into (0,1,1). In (0,1,1), the government has stopped giving green credit incentives, and since the adjustment coefficient k of the green credit given by banks to coal power enterprises is lower than 1, the amount of subsidies r × m × ( 1 k ) of green credit given by banks will be positive, and the management costs of green credit will always be higher than those of traditional credit policies, meaning that B C 1 B C 2 will be positive; at this point λ 3 > 0 , and therefore it is difficult for banks to maintain their green credit policy, and the adjustment coefficient k of green credit will continue to increase, returning to 1, and banks will eventually evolve from granting green credit to only providing traditional credit.

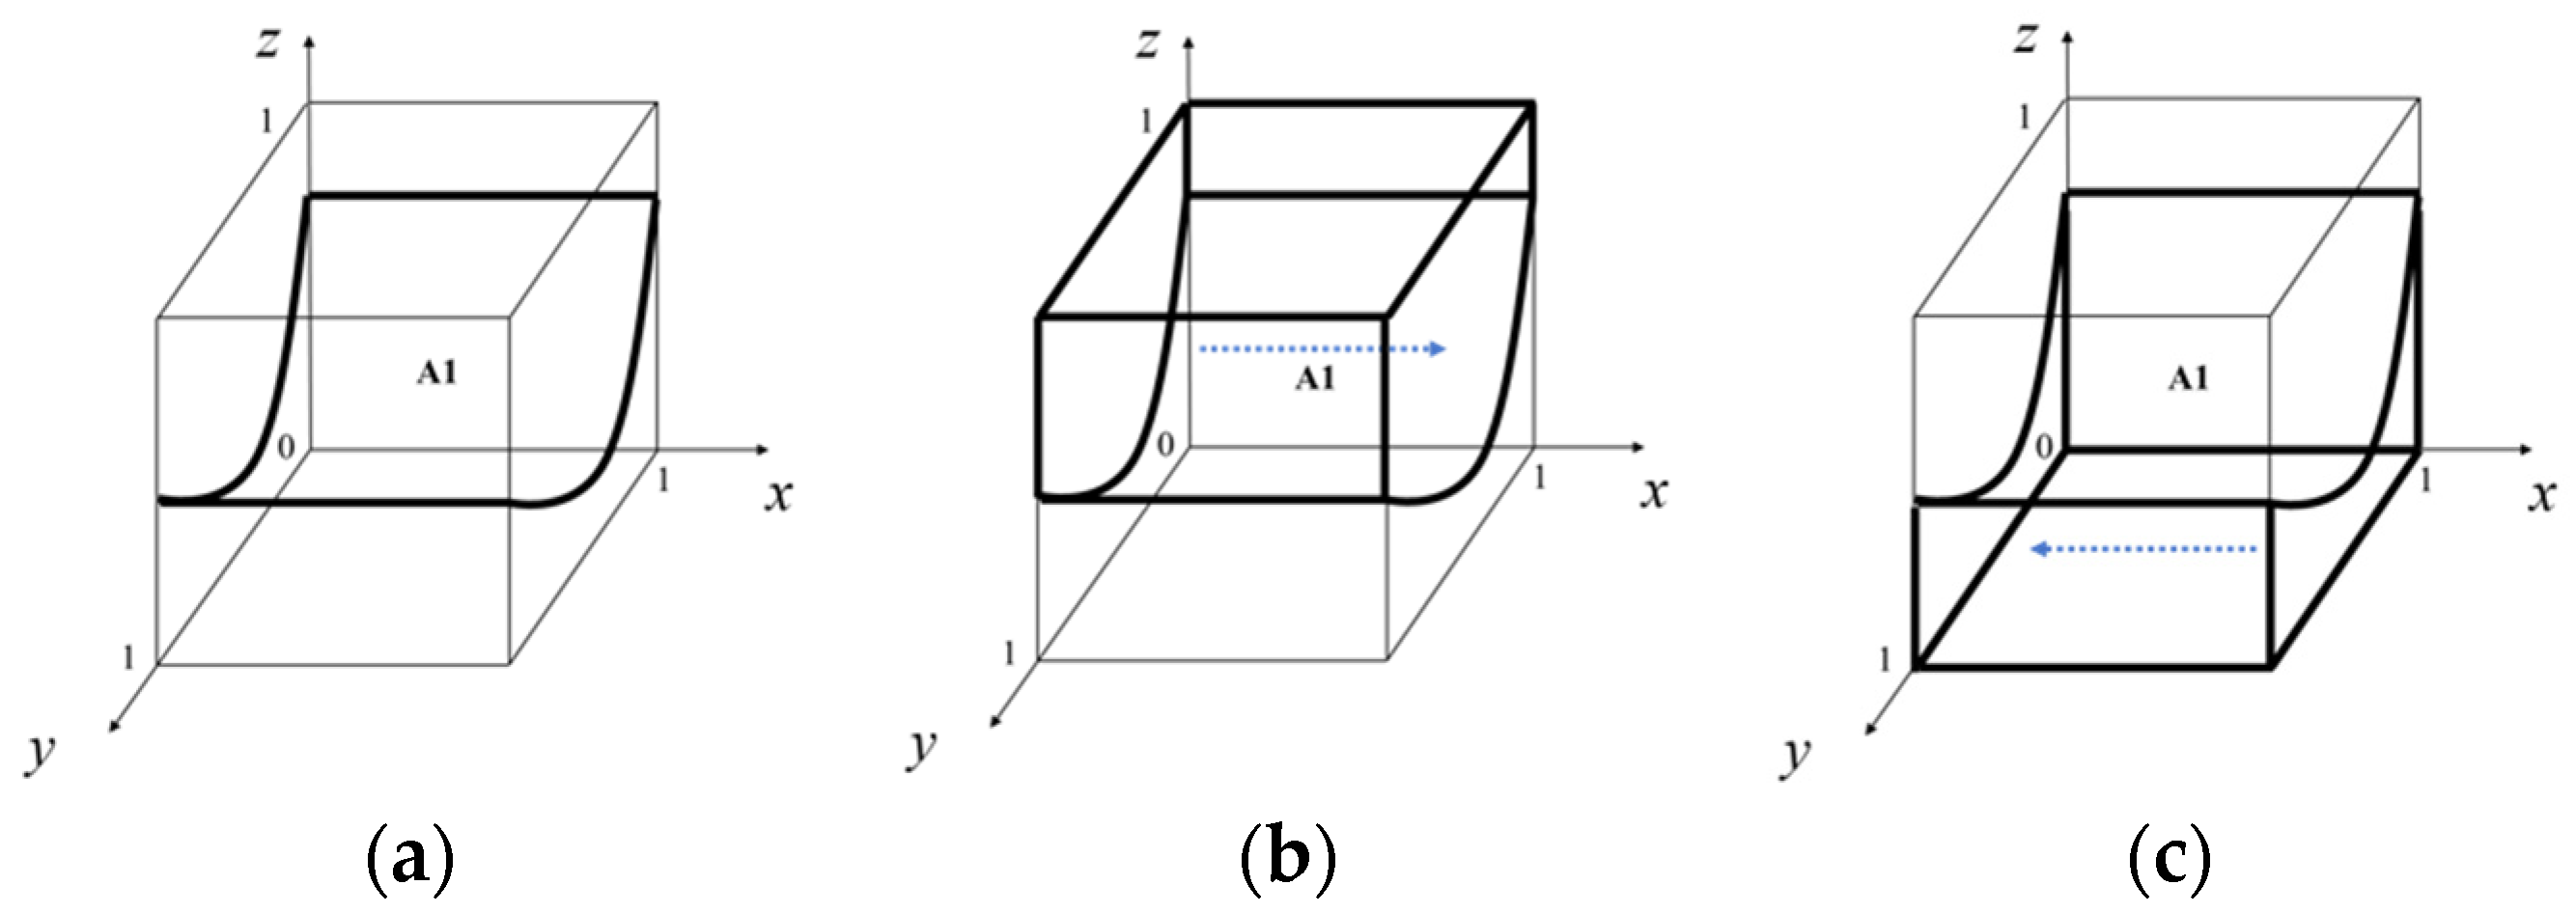
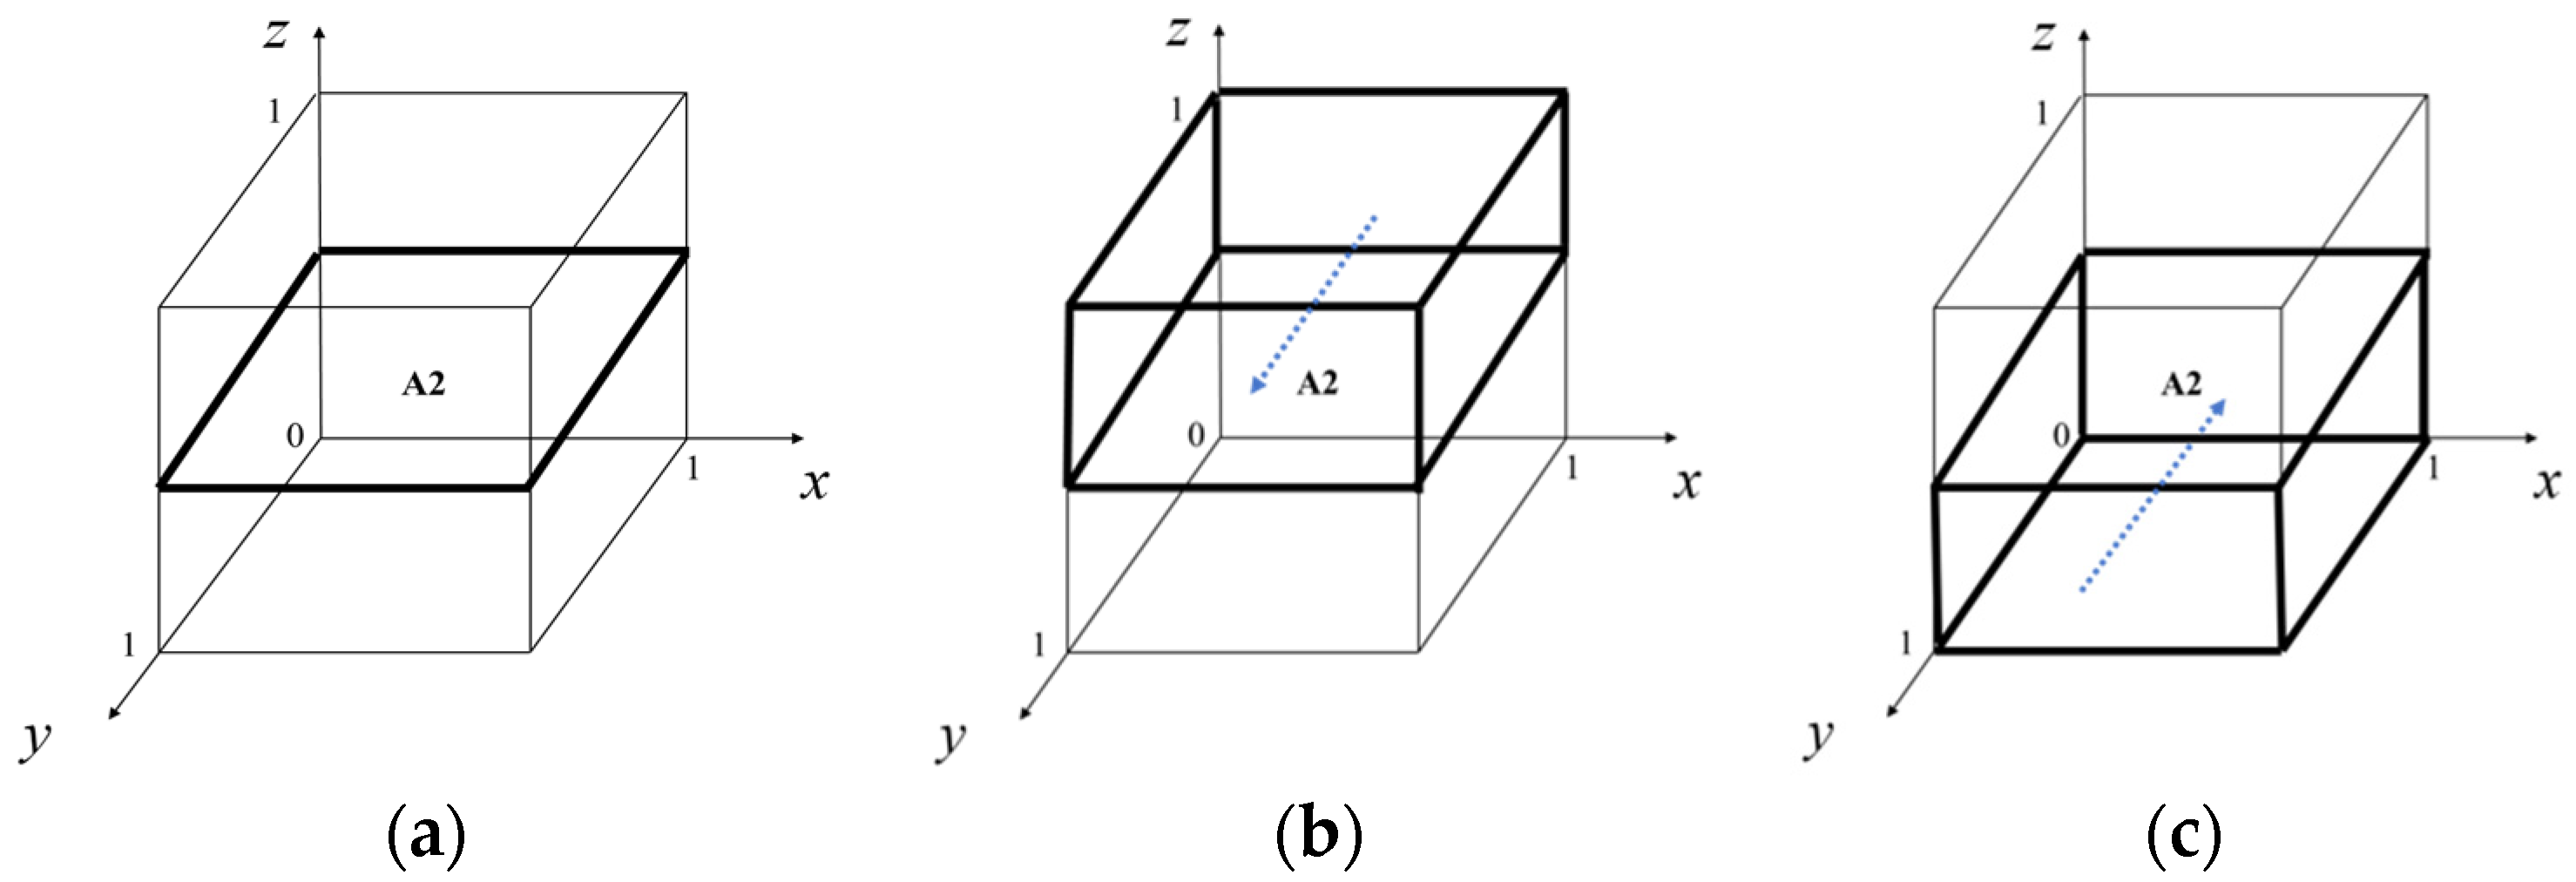
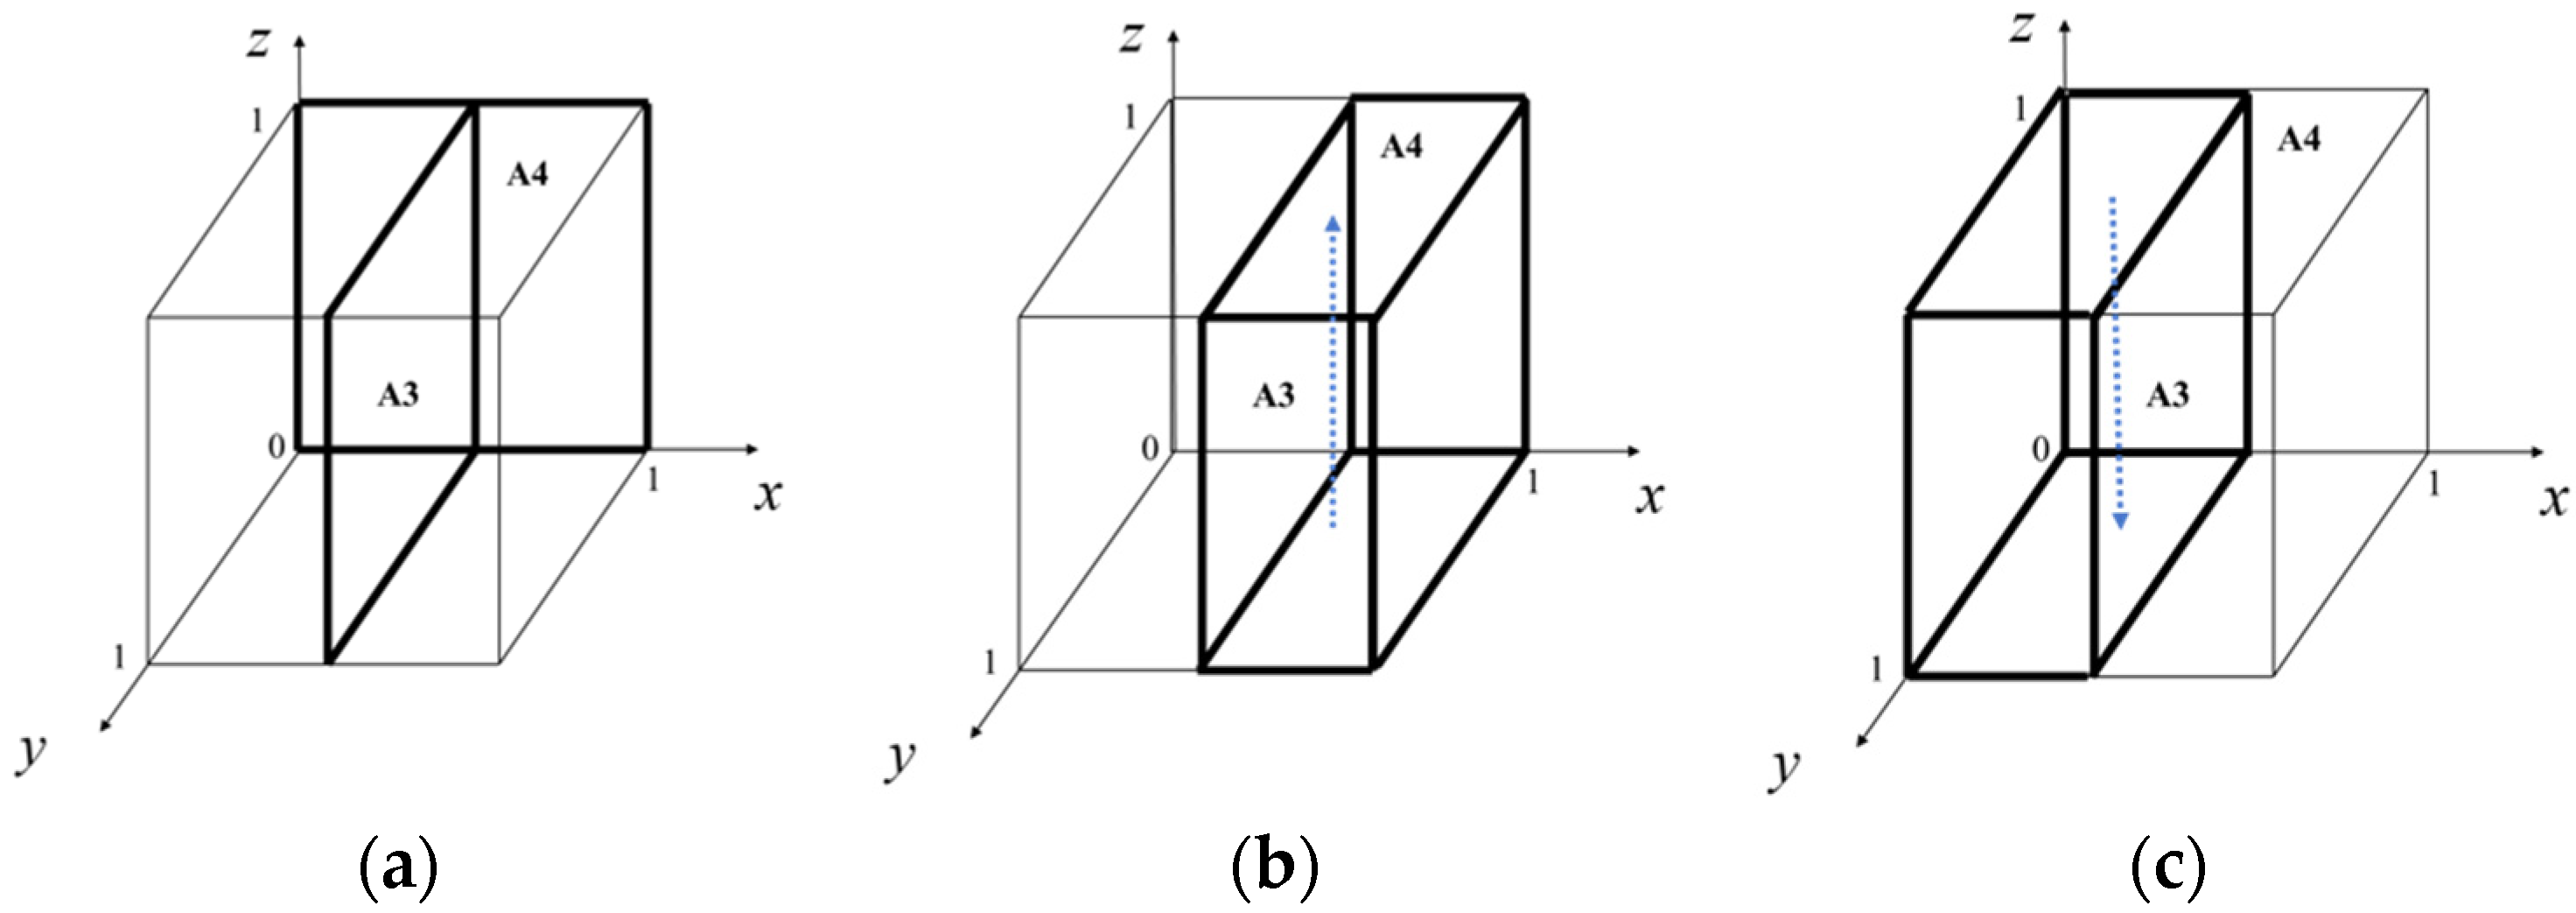
4.2. Evolutionary Path Analysis

As can be seen from Table 4, in Scenario 1, the relative benefits of coal power green transformation projects are less than the relative cost state, that is, λ 2 = ( P C C ) × ( Q 1 Q 2 ) ( C Q 1 C Q 2 ) × C P r × m > 0 in (0,1,0), and there is no stable point; when the green credit incentives from the government and banks are removed, coal power enterprises will not be able to achieve a stable spontaneous green transformation state. In Scenario 2, the relative benefits of coal power green transformation projects are greater than the relative cost state, that is, λ 2 = ( P C C ) × ( Q 1 Q 2 ) ( C Q 1 C Q 2 ) × C P r × m < 0 in (0,1,0), and the evolutionary equilibrium point is (0,1,0), which has three negative eigenvalues, and coal power enterprises will still be able to maintain spontaneous green transformation when the green credit incentives from the government and banks are removed.
The evolutionary path of the tripartite evolutionary game is (0,0,0) to (0,1,1) to (1,1,1), and in reverse to (0,1,1) or (0,1,0). Initially, in Scenario 1, the green transformation project is difficult to make profitable, so enterprises will not choose to undergo green transformation spontaneously, and it is necessary for banks to provide green credit, reduce the green credit adjustment coefficient k , and provide loan preferences so that the relative benefits of the green transformation of enterprises will be greater than the relative costs, shifting the evolutionary game process from the (0,0,0) state to the (0,1,1) state. On this basis, it is also necessary for the government to provide green credit incentives to banks in order to relieve the pressure on their capital, thus shifting the (0,1,1) state to the (1,1,1) state.
The process described above in Scenario 1 needs to be driven by “external forces”, and the maintenance of the (1,1,1) state requires continuous provision of green credit incentives and coverage of administrative costs on the part of the government. The government will not always provide financial incentives for green credit, and the (1,1,1) state will eventually evolve to (0,1,1) and (0,1,0) or (0,0,0) when the policy incentives end. To reach the (0,1,1) state, it is necessary for the green credit adjustment coefficient k to increase gradually and return to 1. To reach the (0,1,0) evolutionarily stable state described in Scenario 2, it is necessary for the relative benefits ( P C C ) × ( Q 1 Q 2 ) of the green transformation of coal power enterprises, the relative costs ( C Q 1 C Q 2 ) × C P of green transformation, and the costs of green transformation projects r × m to keep rising, while it is necessary for the costs of power generation and green transformation to keep falling, along with the continued expansion of the scale of production restriction for coal power enterprises that have not undergone green transformation in order to maintain the condition λ 2 = ( P C C ) × ( Q 1 Q 2 ) ( C Q 1 C Q 2 ) × C P r × m × k < 0 in the (0,1,1) state. Following the cessation of the policy, if the condition λ 2 = ( P C C ) × ( Q 1 Q 2 ) ( C Q 1 C Q 2 ) × C P r × m < 0 in the (0,1,0) state is met, an evolutionarily stable state of coal power enterprises will be realized in which enterprises will spontaneously decide to undergo green transformation.

5. Numerical Simulations

5.1. Basic Scenario

The socio-economic benefit function π 1 ( Q ) , socio-environmental benefit function π 2 ( C Q ) , and carbon emission limit A do not affect the stability of the equilibrium point and are not parameterized. Taking the 300 MW unit without CCS as an example, the 300 MW unit is started for 4000 h per year, as 4419 annual utilization hours of Chinese coal power units in 2019 [37]. The power generation capacity is 1,200,000,000 kWh. The coal consumption for electricity supply is 300 g/kWh, which means that 360,000 tonnes of coal are consumed in one year. Burning 1 tonne of lignite emits about 2.6 tonnes of CO2 without CCS, which results in CO2 emission of about 936,000 tonnes in 1 year for a 300 MW unit without CCS. The parameters of the green transformation project are set with reference to the data regarding the Guohua Shenmu oxyfuel combustion renovation project [38], which is one of the large-scale oxyfuel combustion demonstration projects currently being promoted in China, with a budgeted cost of CNY 1.6 billion and an annual CO2 capture of about 918,000 tonnes with CCS. The carbon emission trading price is set as CNY 50 per tonne. According to the National Development and Reform Commission’s 2022 coal LTA, signed for consultation, the benchmark price of coal is 700 CNY/tonne, and considering transportation costs and the price fluctuation of coal, the arrival price is set at 1000 CNY/tonne, on the basis of which the cost of power generation can be calculated to be 0.3 CNY/kWh. The thermal power feed-in price is set as 0.4 CNY/kWh. According to the relevant policy requirements, the planned power generated by existing coal-fired power enterprises should be reduced year by year. The planned hours of energy-saving and environment-friendly units can be increased appropriately, but not by more than 85%, and the planned electricity to be obtained from other coal-fired units should be set no higher than 80% of the planned hours obtained from thermal power in the previous year [39]. Considering the recent adjustment of the policy direction of “carbon reduction in motion”, in this paper sets it is assumed that coal power units in green transition will not be subject to reduced production, while coal power units that have not undergone green transition will reduce production by 20%.
On the basis of the above assumptions, a 300 MW coal power unit is set to run for 4000 h a year, generating 1,200,000,000 kWh, consuming 360,000 tonnes of coal, and emitting 936,000 tonnes of carbon dioxide without CCS, with carbon emissions of 18,000 tonnes following carbon capture by CCS; the power generation capacity of the unit following passive reduction is 3200 h (80% of the original production capacity of 4000 h), which is 960,000,000 kWh, with an annual carbon emission of 748,800 tonnes without CCS. The People’s Bank of China’s LPR of 4.45% over 5 years in August 2022 was selected as the loan interest rate. Referring to the Implementing Rules of the Policy on Promoting the Development of Green Financial Support by Banking Financial Institutions in Xiamen City, the annual accumulated green subsidy for a single banking institution is capped at CNY 30 million, the government financial subsidy is set at CNY 30 million, and the regulatory cost is set at CNY 5 million.

5.2. Sensitivity Analysis

In the next step, we set the initial values of x , y , z and explore the impact of different values of green credit adjustment factor k , project cost m , carbon emission price C P , and electricity price P on the evolutionary path and for the probability of companies choosing to undergo green transformation. Since the evolutionary paths from (0,0,0) to (0,1,1) to (1,1,1) are mainly driven by policy, we start from the (1,1,1) state. The evolutionary game parameter settings are presented in Table 5.

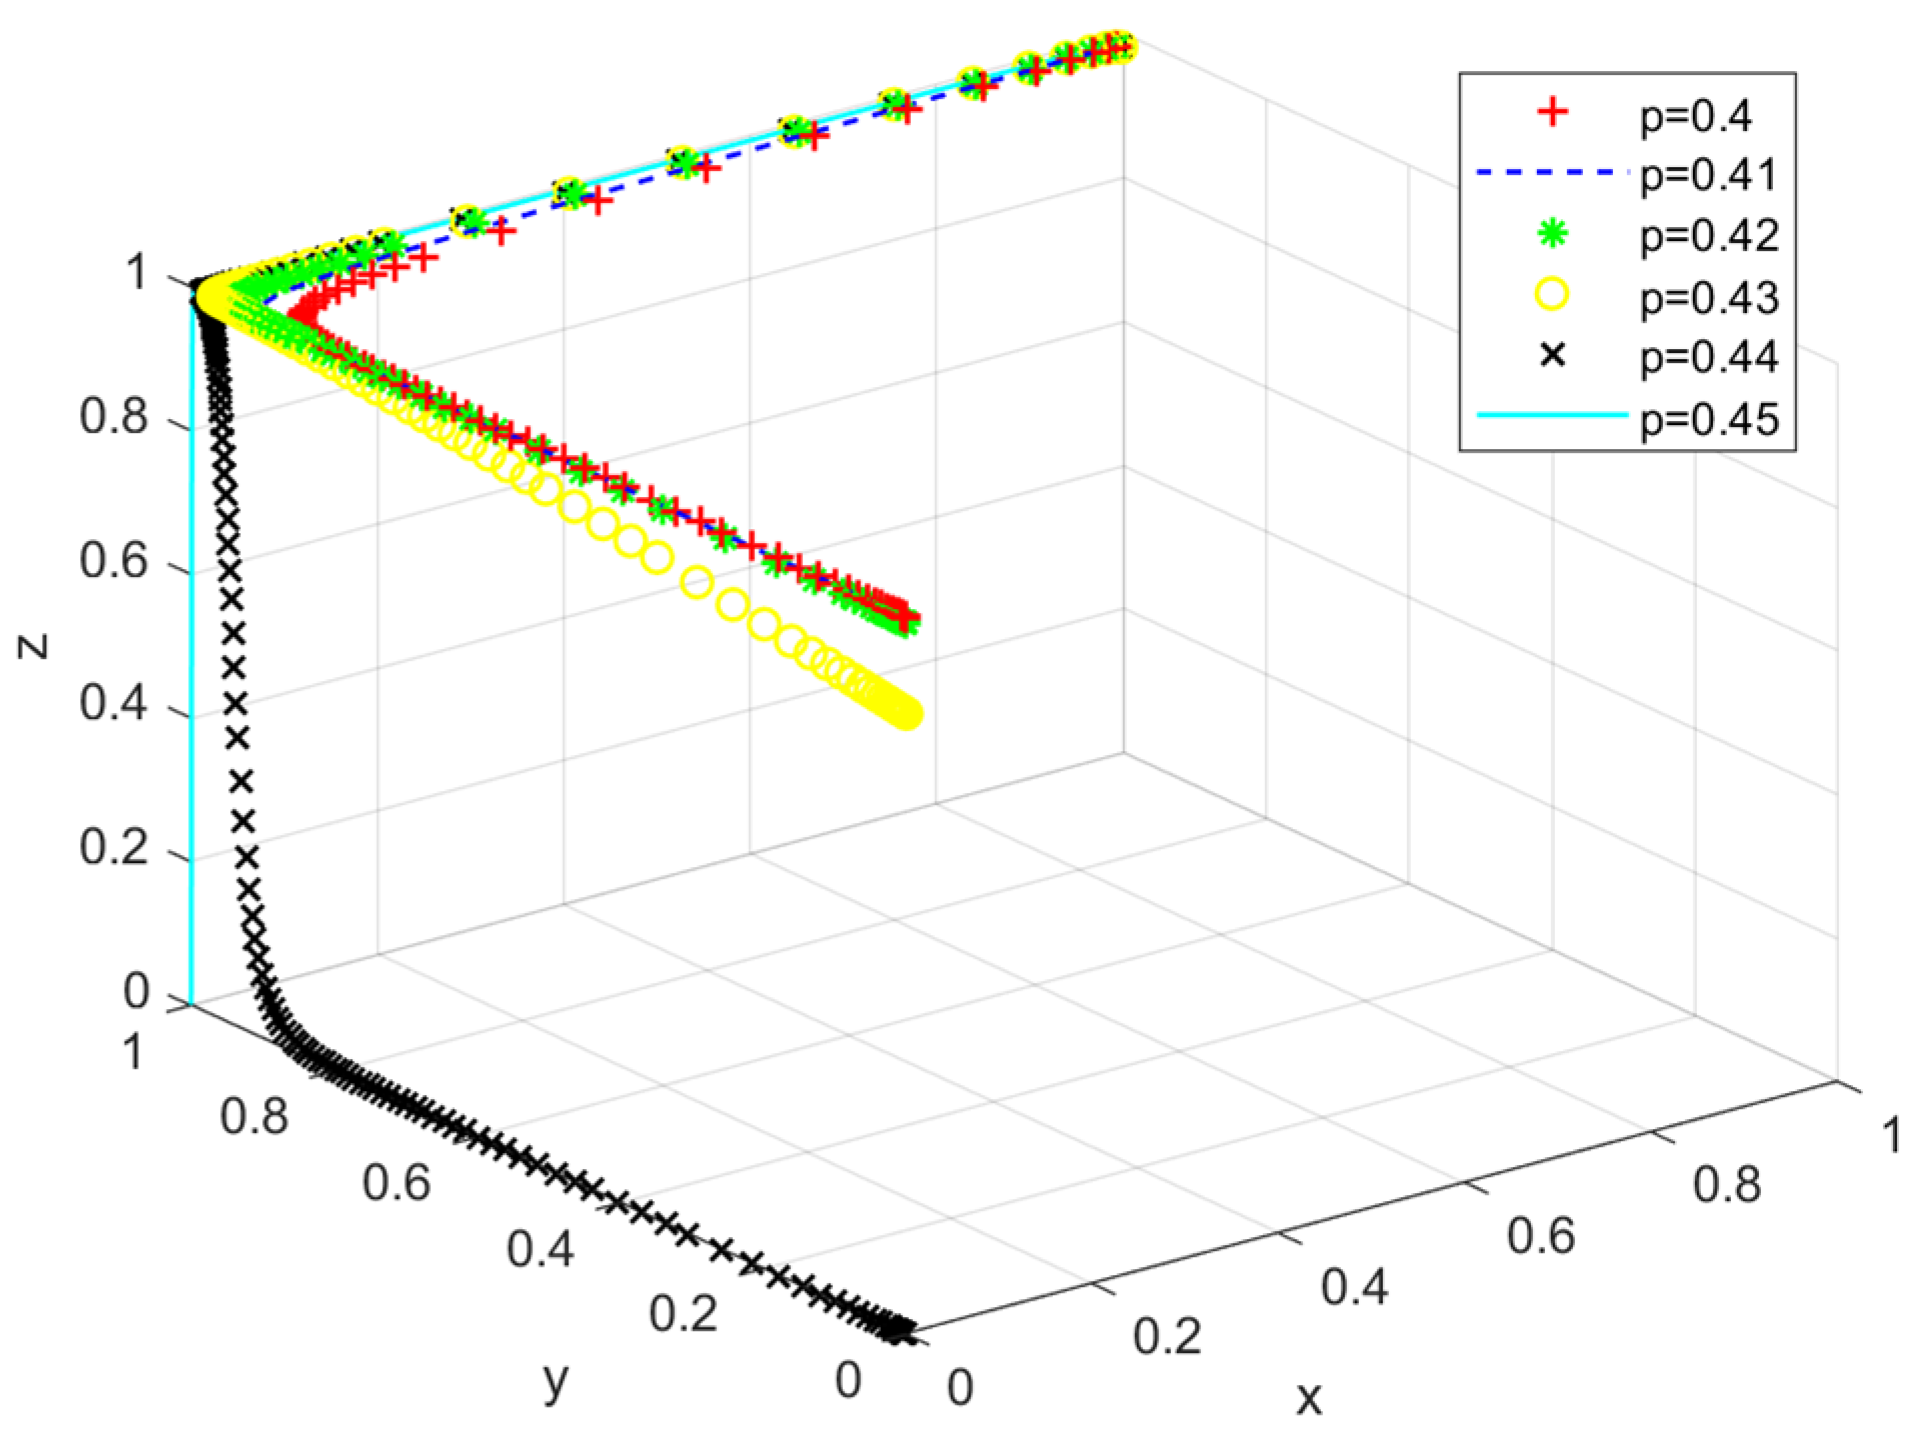
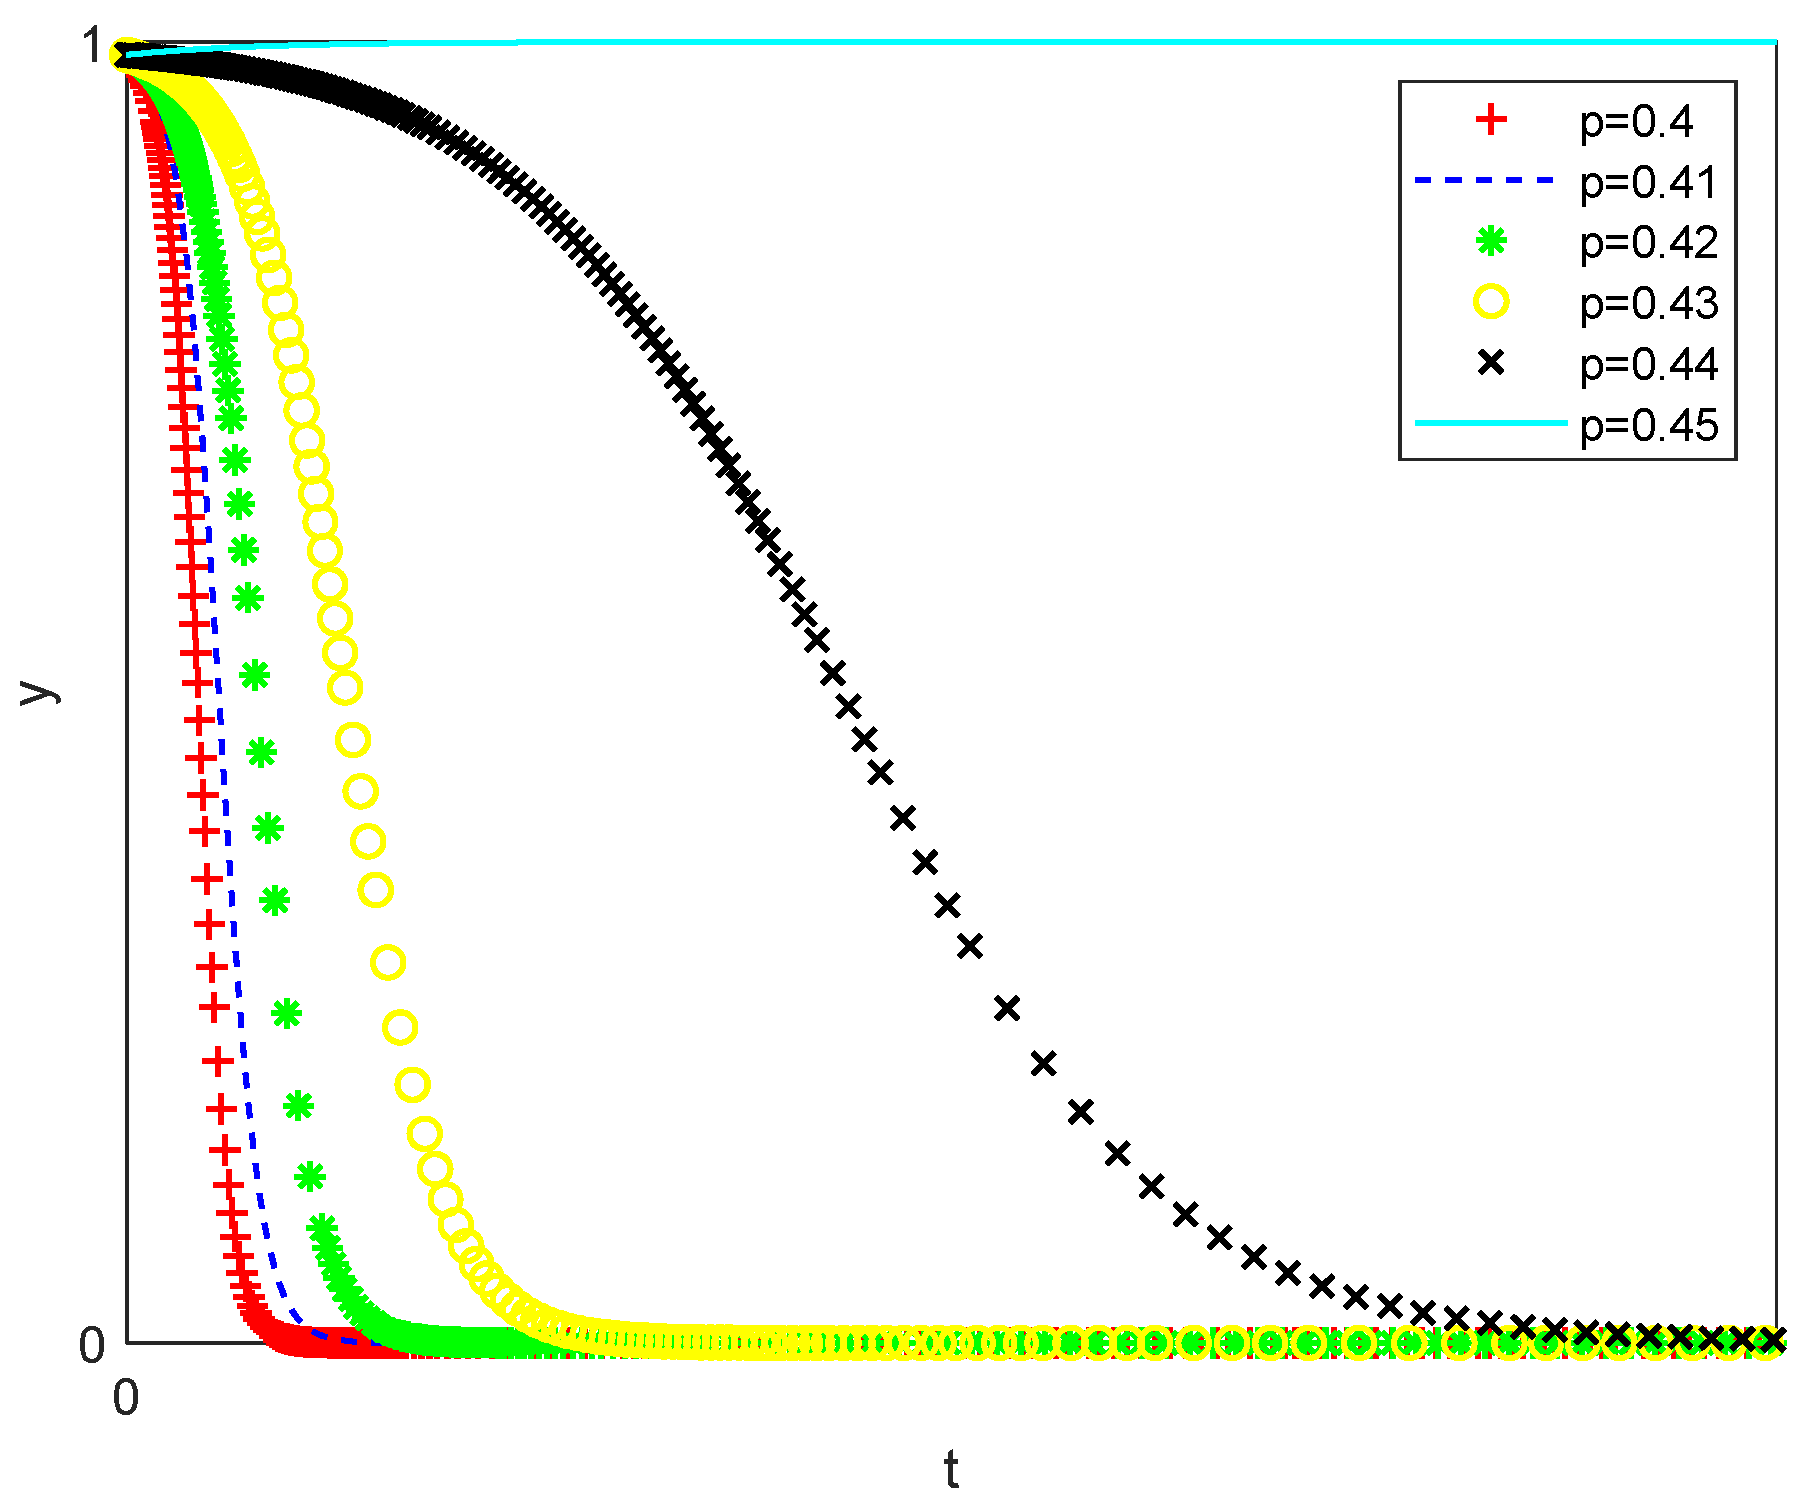
5.2.1. Electricity Price

When the electricity price is greater than or equal to CNY 0.45, coal power companies will all choose to undergo green transition. The impact of electricity price on evolutionary paths is shown in Figure 4. Initially motivated by green credit and financial incentives from banks and governments, the coal power companies all choose to undergo green transition. Upon the withdrawal of the policy, coal power companies will choose differently in response to different electricity prices. When the electricity price is 0.40/0.41/0.42/0.43/0.44 CNY/kWh, respectively, coal power companies will not eventually choose to undergo green transition. When the electricity price is 0.45 CNY/kWh, coal power companies will choose to undergo green transition.
The higher the price of electricity, the more favorable it is for companies to actively choose to undergo green transition. The impact of electricity prices on the probability of green transformation of coal power enterprises is shown in Figure 5. It can be concluded, in line with Figure 4, that coal power companies will choose to undergo green transition when the electricity price is 0.45 CNY/kWh but will not choose to undergo green transition at electricity prices of 0.40/0.41/0.42/0.43/0.44 CNY/kWh, respectively.

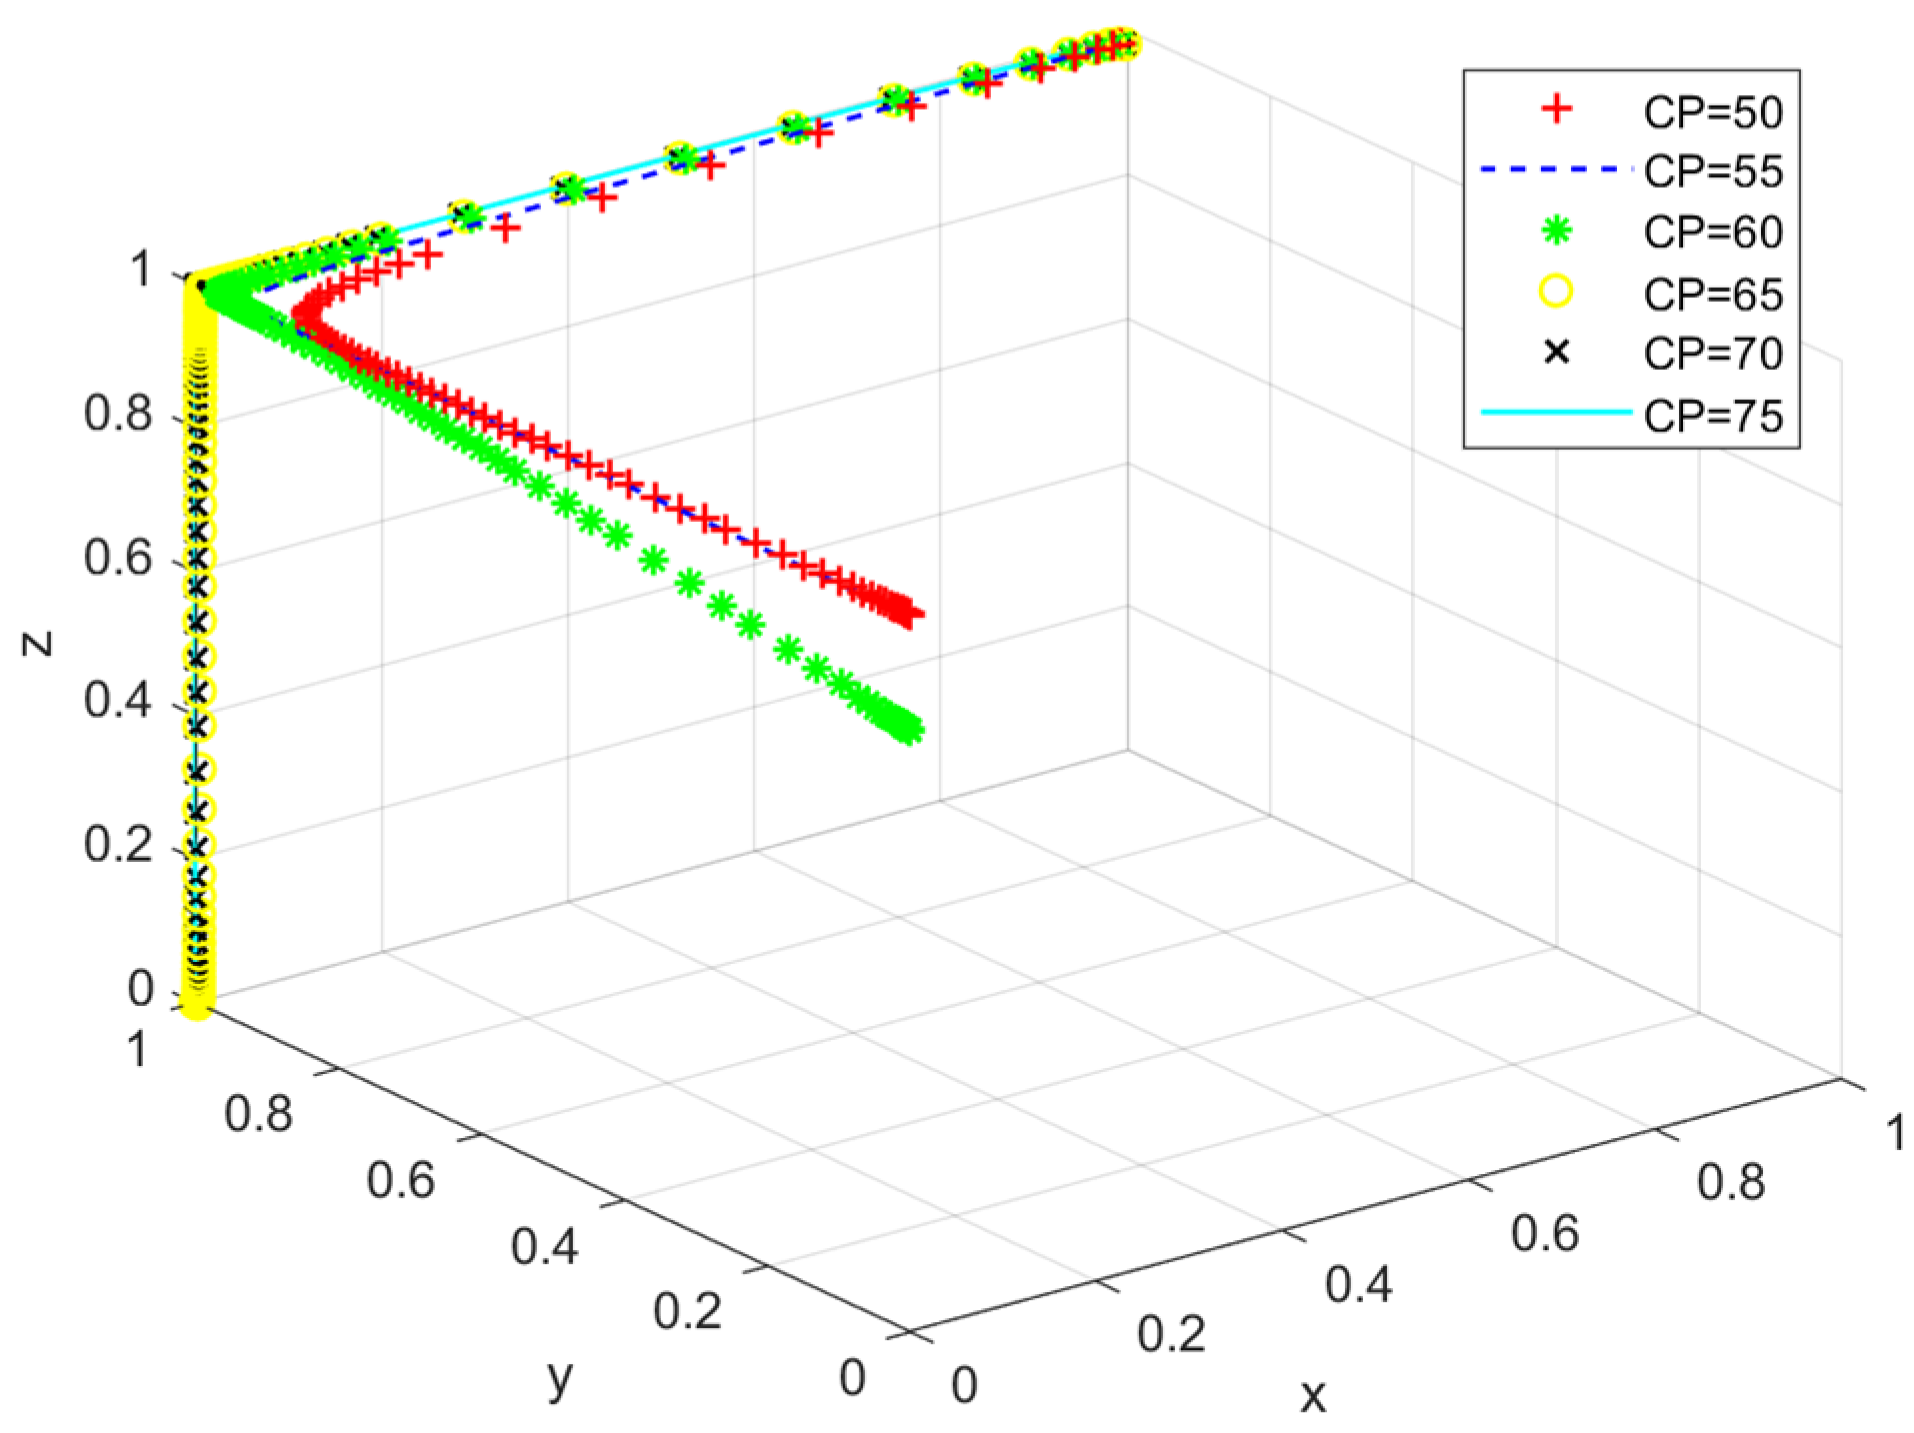
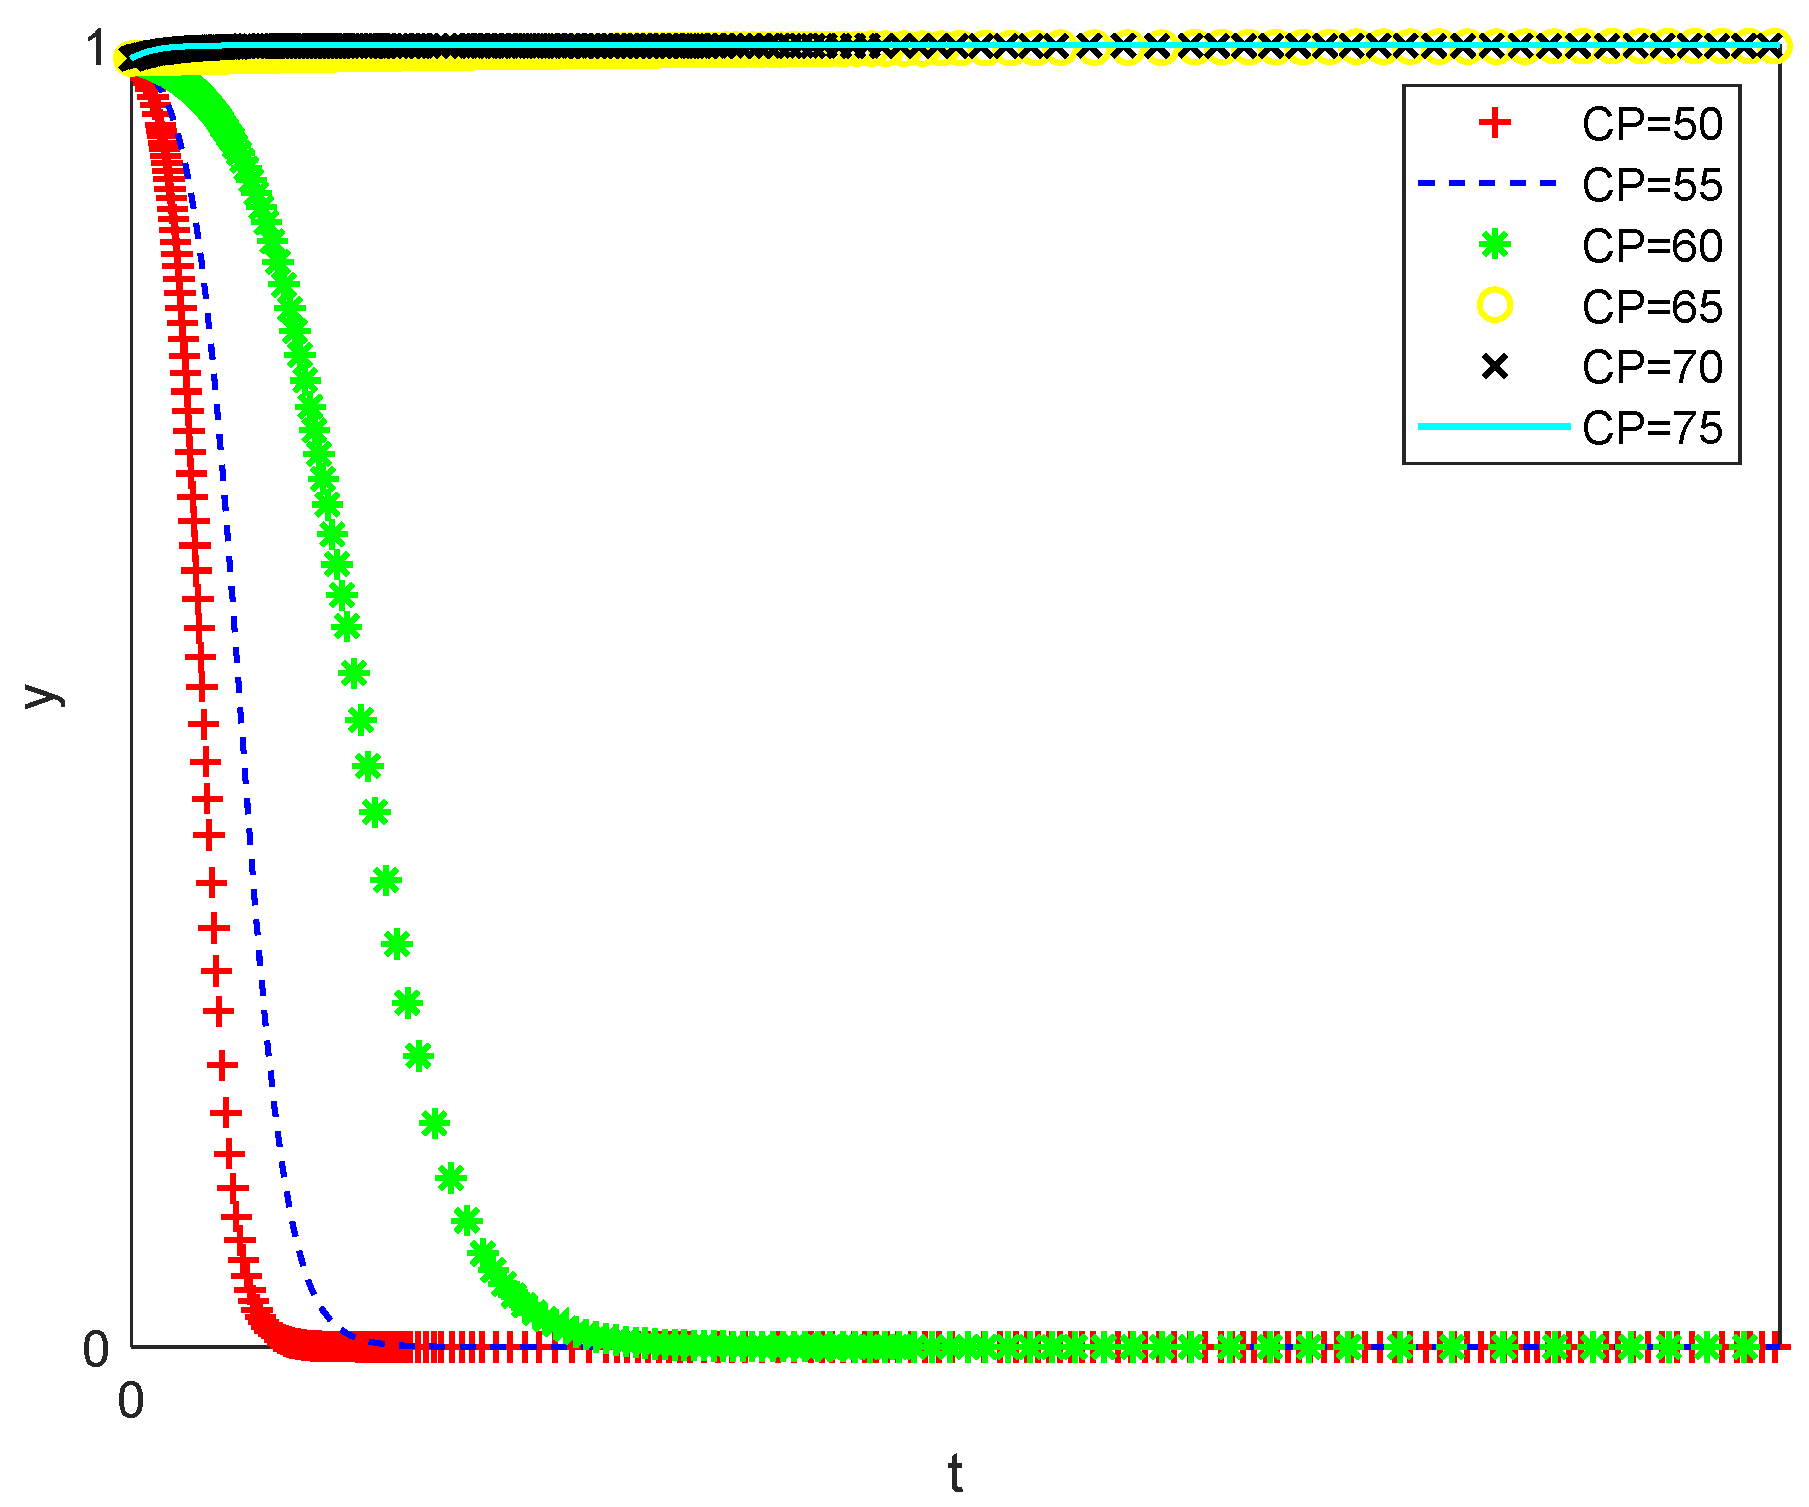
5.2.2. Carbon Emission Trading Price
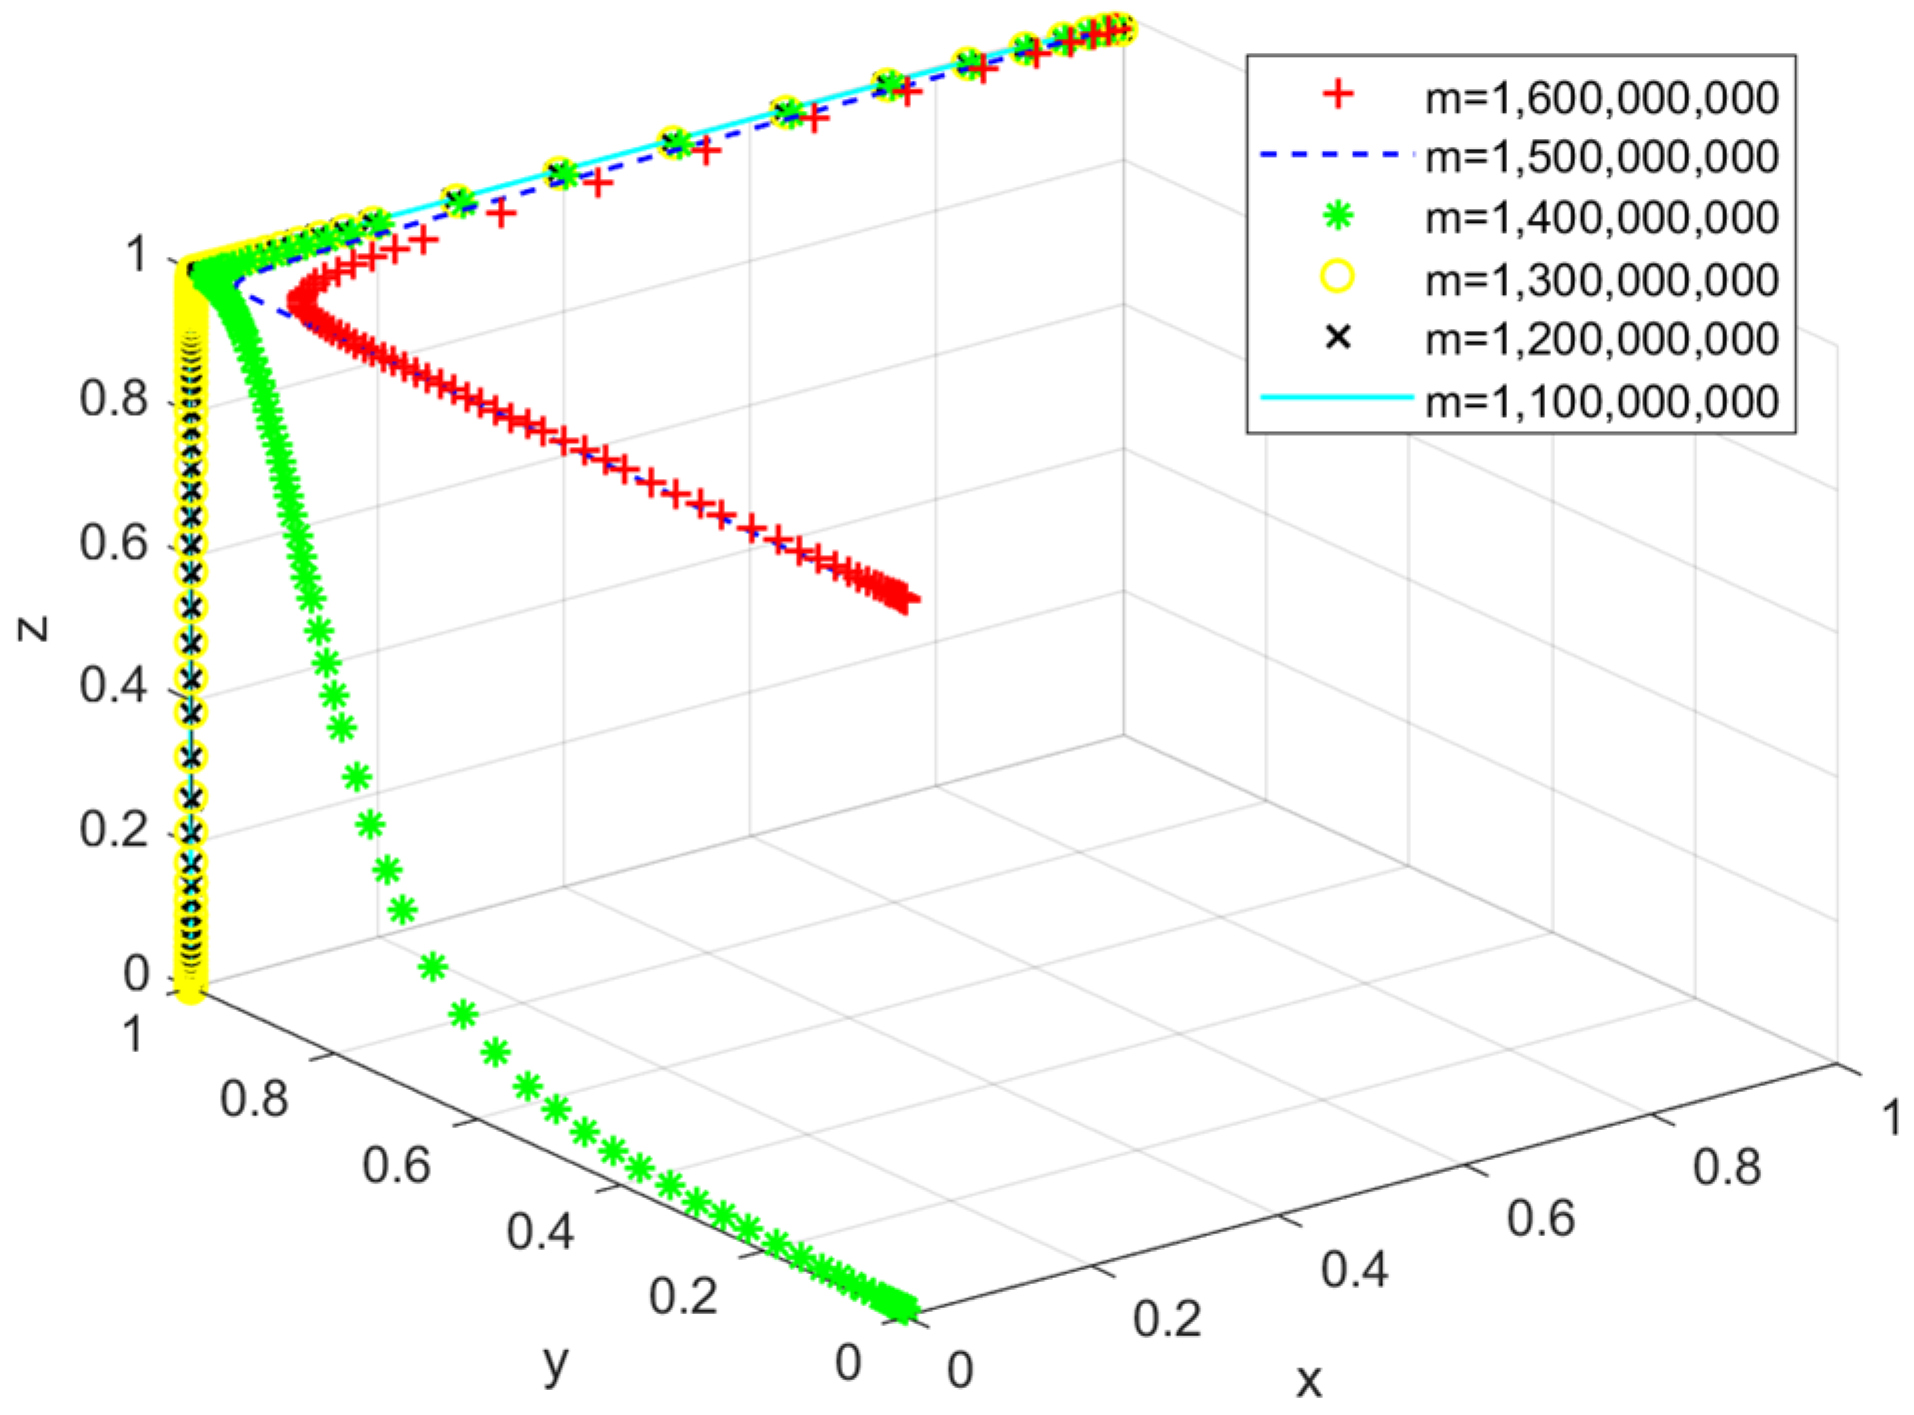
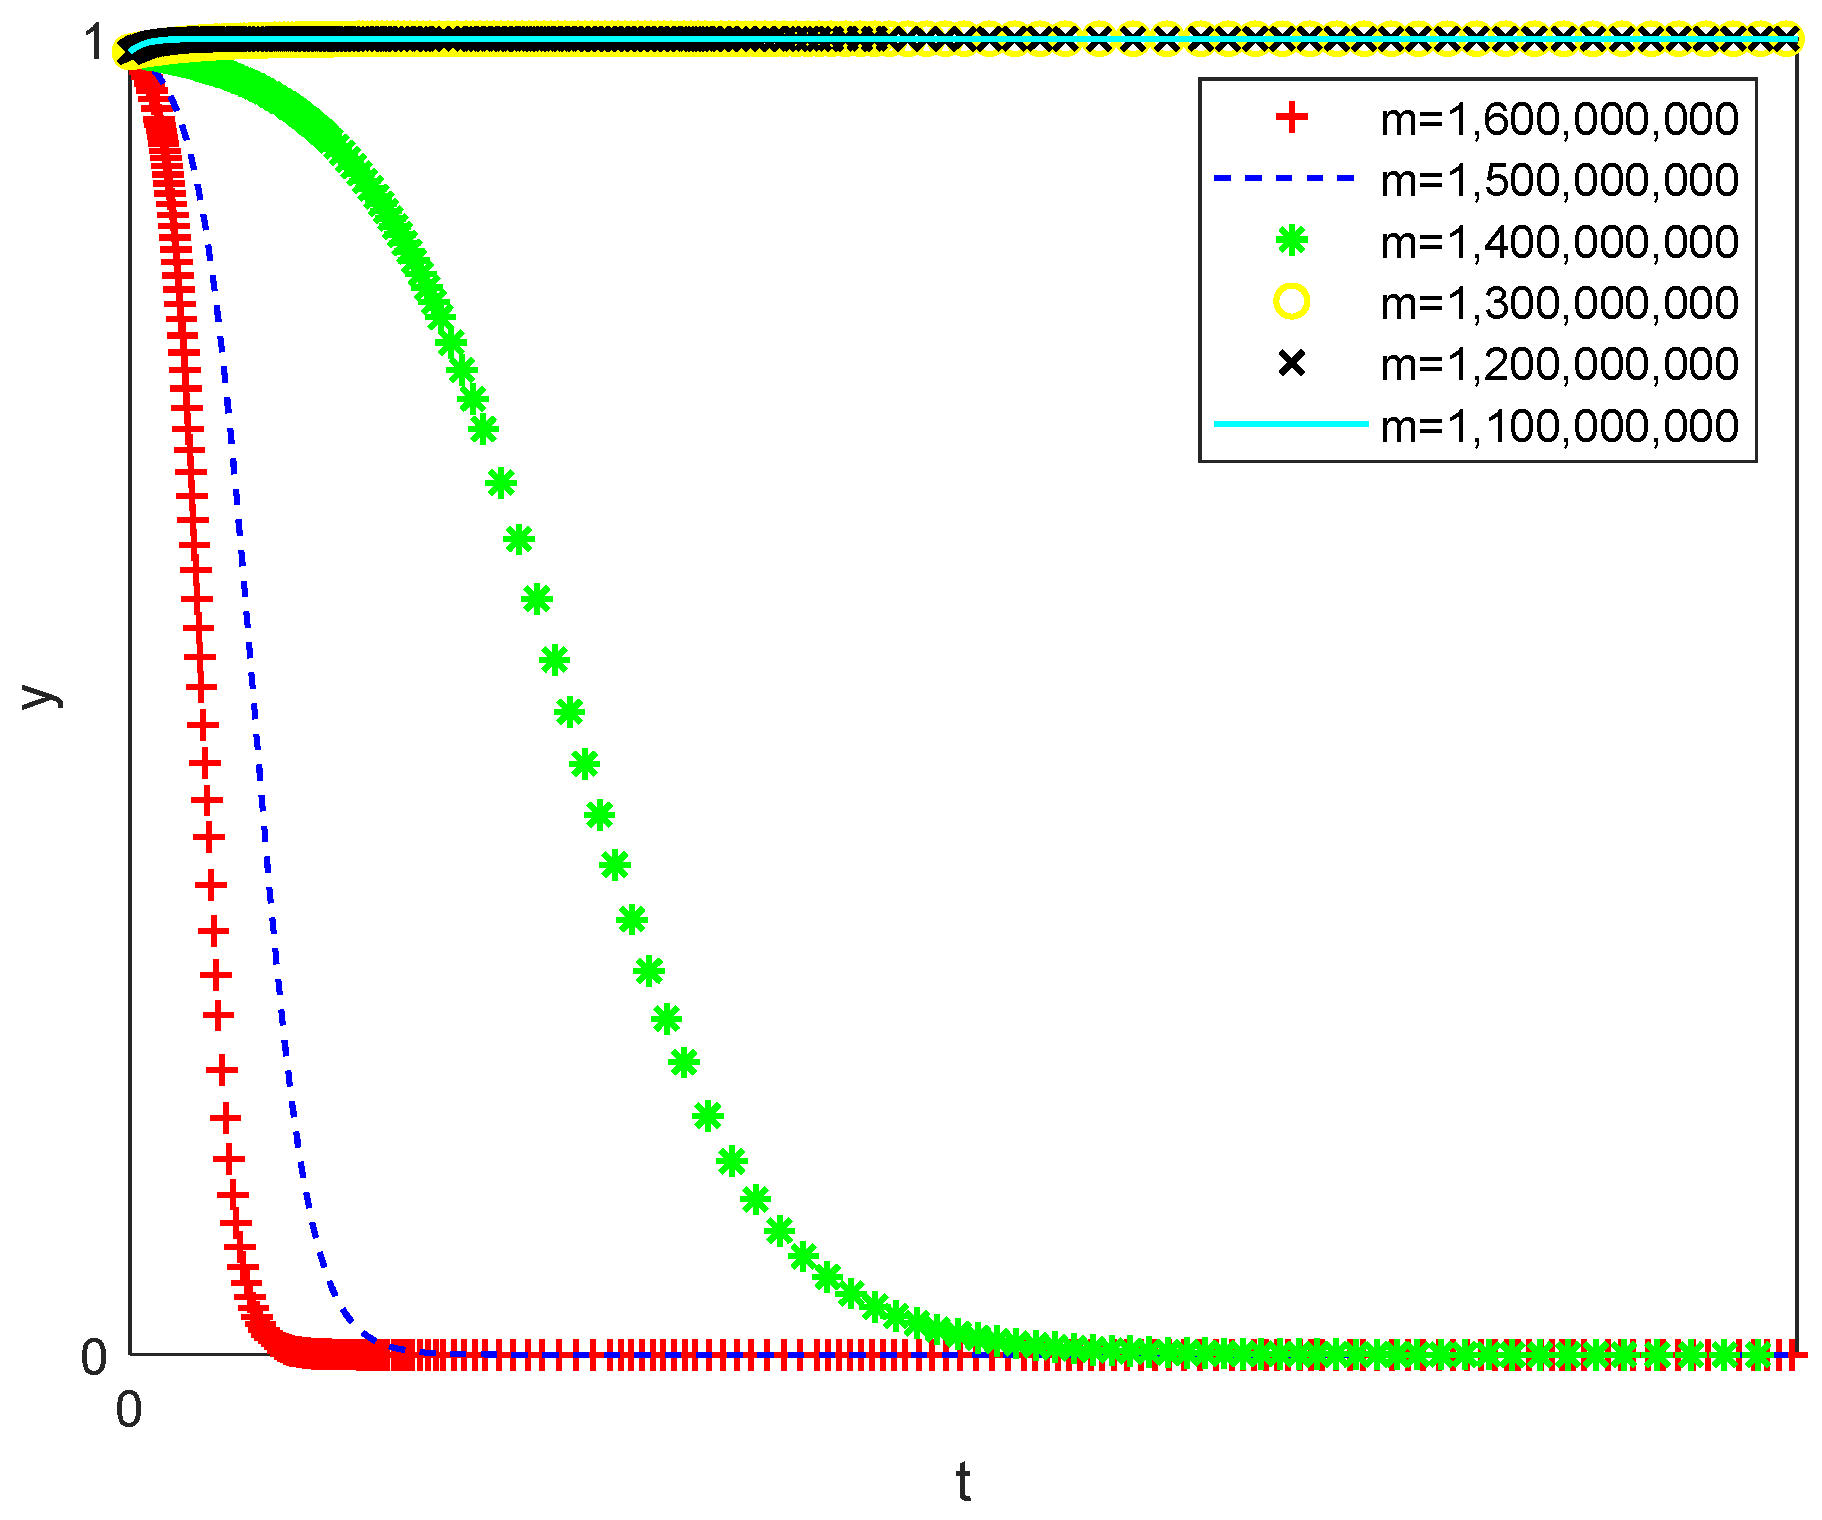
When the carbon emission trading price is higher than CNY 65, coal power companies will all choose to undergo green transition. The impact of carbon emission trading prices on the evolutionary paths is shown in Figure 6. Initially motivated by green credit and financial incentives from banks and governments, coal power companies all choose to undergo green transition. With the withdrawal of the policy, coal power companies will choose differently in response to different carbon emission trading prices. When the carbon emission trading price is 50/55/60 CNY/tonne, respectively, coal power companies will not eventually choose to undergo green transition. When the carbon emission trading price is 65/70/75 CNY/tonne, respectively, coal power companies will choose to undergo green transition.
The higher the price of carbon emissions trading, the more favorable it is for companies actively choosing to undergo green transition. The impact of carbon emission trading prices on the probability of coal power companies choosing to undergo green transformation is shown in Figure 7. It can be concluded, in line with Figure 6, that coal power companies will choose to undergo green transition when the carbon emission trading price is 65/70/75 CNY/tonne, respectively, and will not choose to undergo green transition when the carbon emission trading price is 50/55/60 CNY/tonne, respectively.

5.2.3. Project Cost

When the project cost is less than or equal to CNY 1,300,000,000, coal power companies will all choose to undergo green transition. The impact of project costs on the evolutionary paths is shown in Figure 8. Initially motivated by green credit and financial incentives from banks and governments, coal power companies all choose to undergo green transition. With the withdrawal of the policy, coal power companies will choose differently in response to differences in project costs. When the project cost is CNY 1,600,000,000/1,500,000,000/1,400,000,000, respectively, coal power companies will not eventually choose to undergo green transition. When the project cost is CNY 1,300,000,000/1,200,000,000/1,100,000,000, respectively, coal power companies will choose to undergo green transition.
The lower the cost of the project, the more favorable it is for companies to proactively choose to undergo green transition. The impact of project costs on the probability of coal enterprises choosing to undergo green transformation is shown in Figure 9. It can be concluded, in line with Figure 8, that coal power companies will choose to undergo green transition when the project cost is CNY 1,300,000,000/1,200,000,000/1,100,000,000, respectively, and will not choose to undergo green transition when the project cost is CNY 1,600,000,000/1,500,000,000/1,400,000,000, respectively.

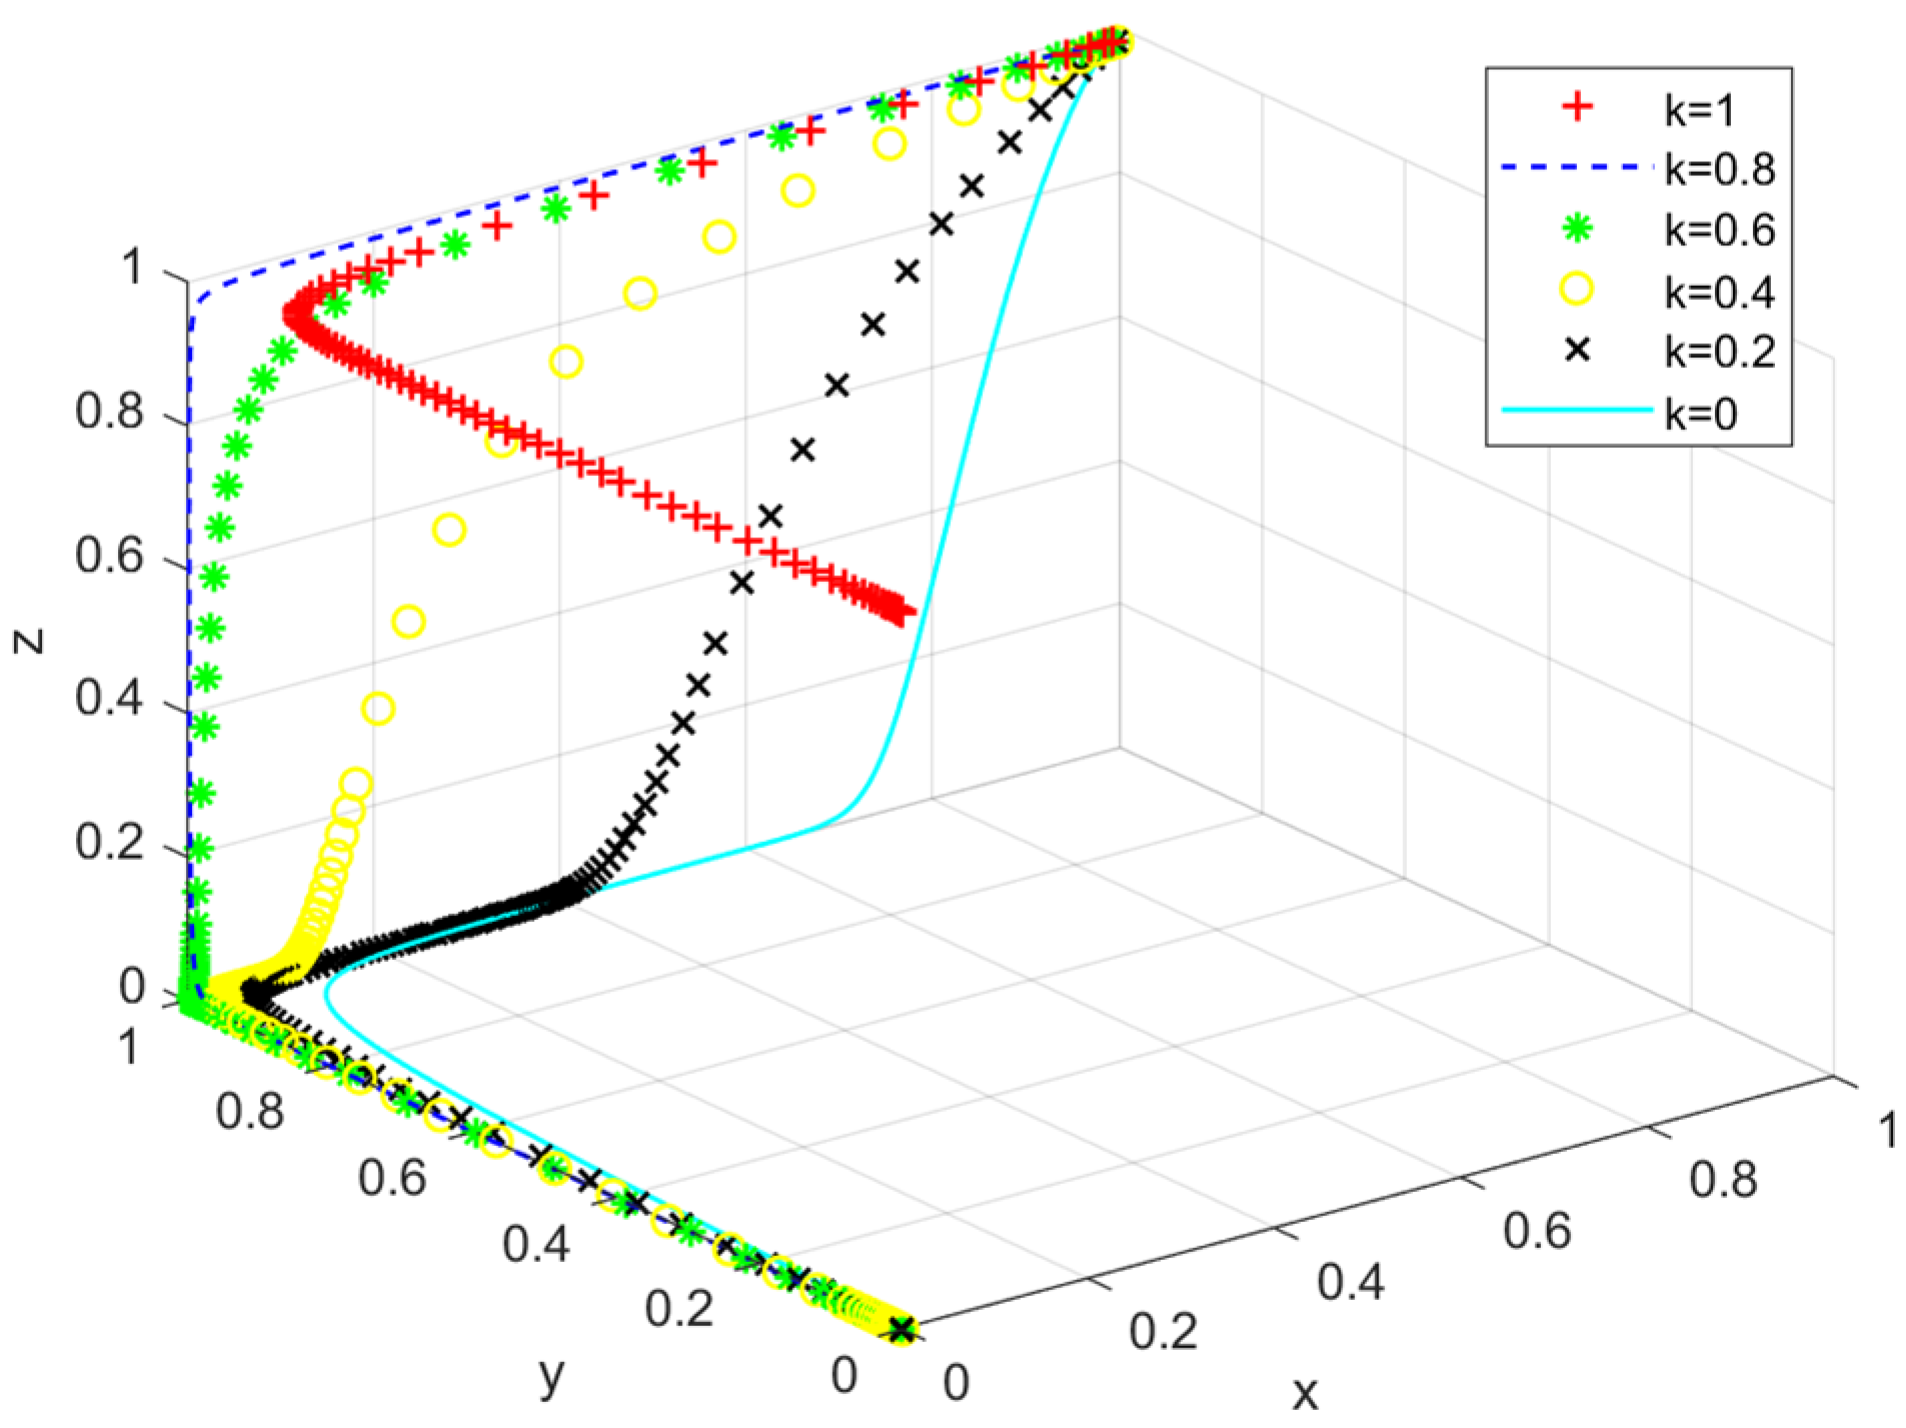
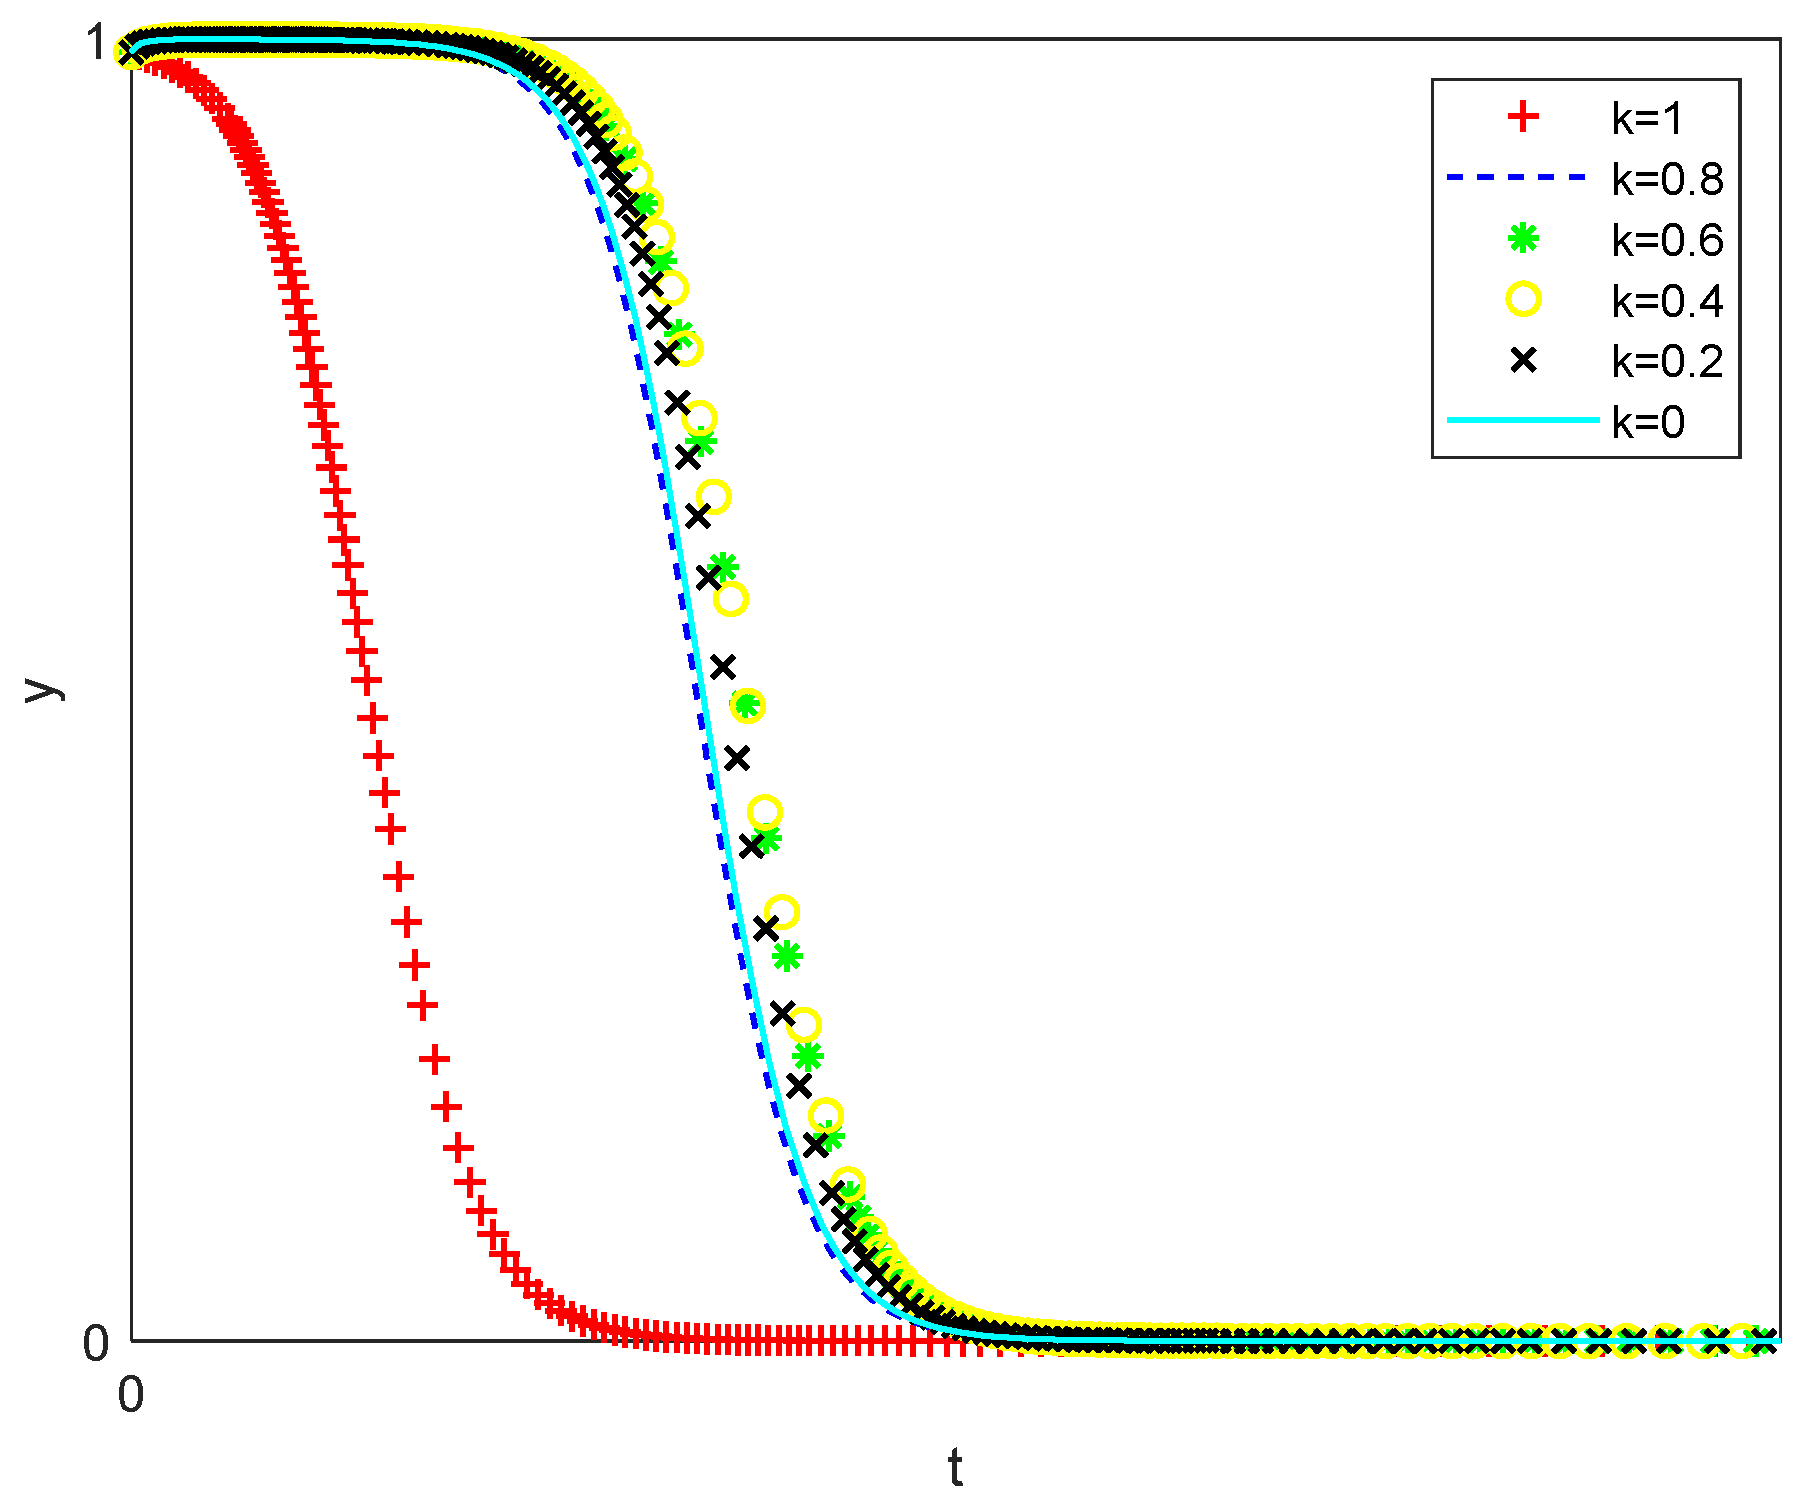
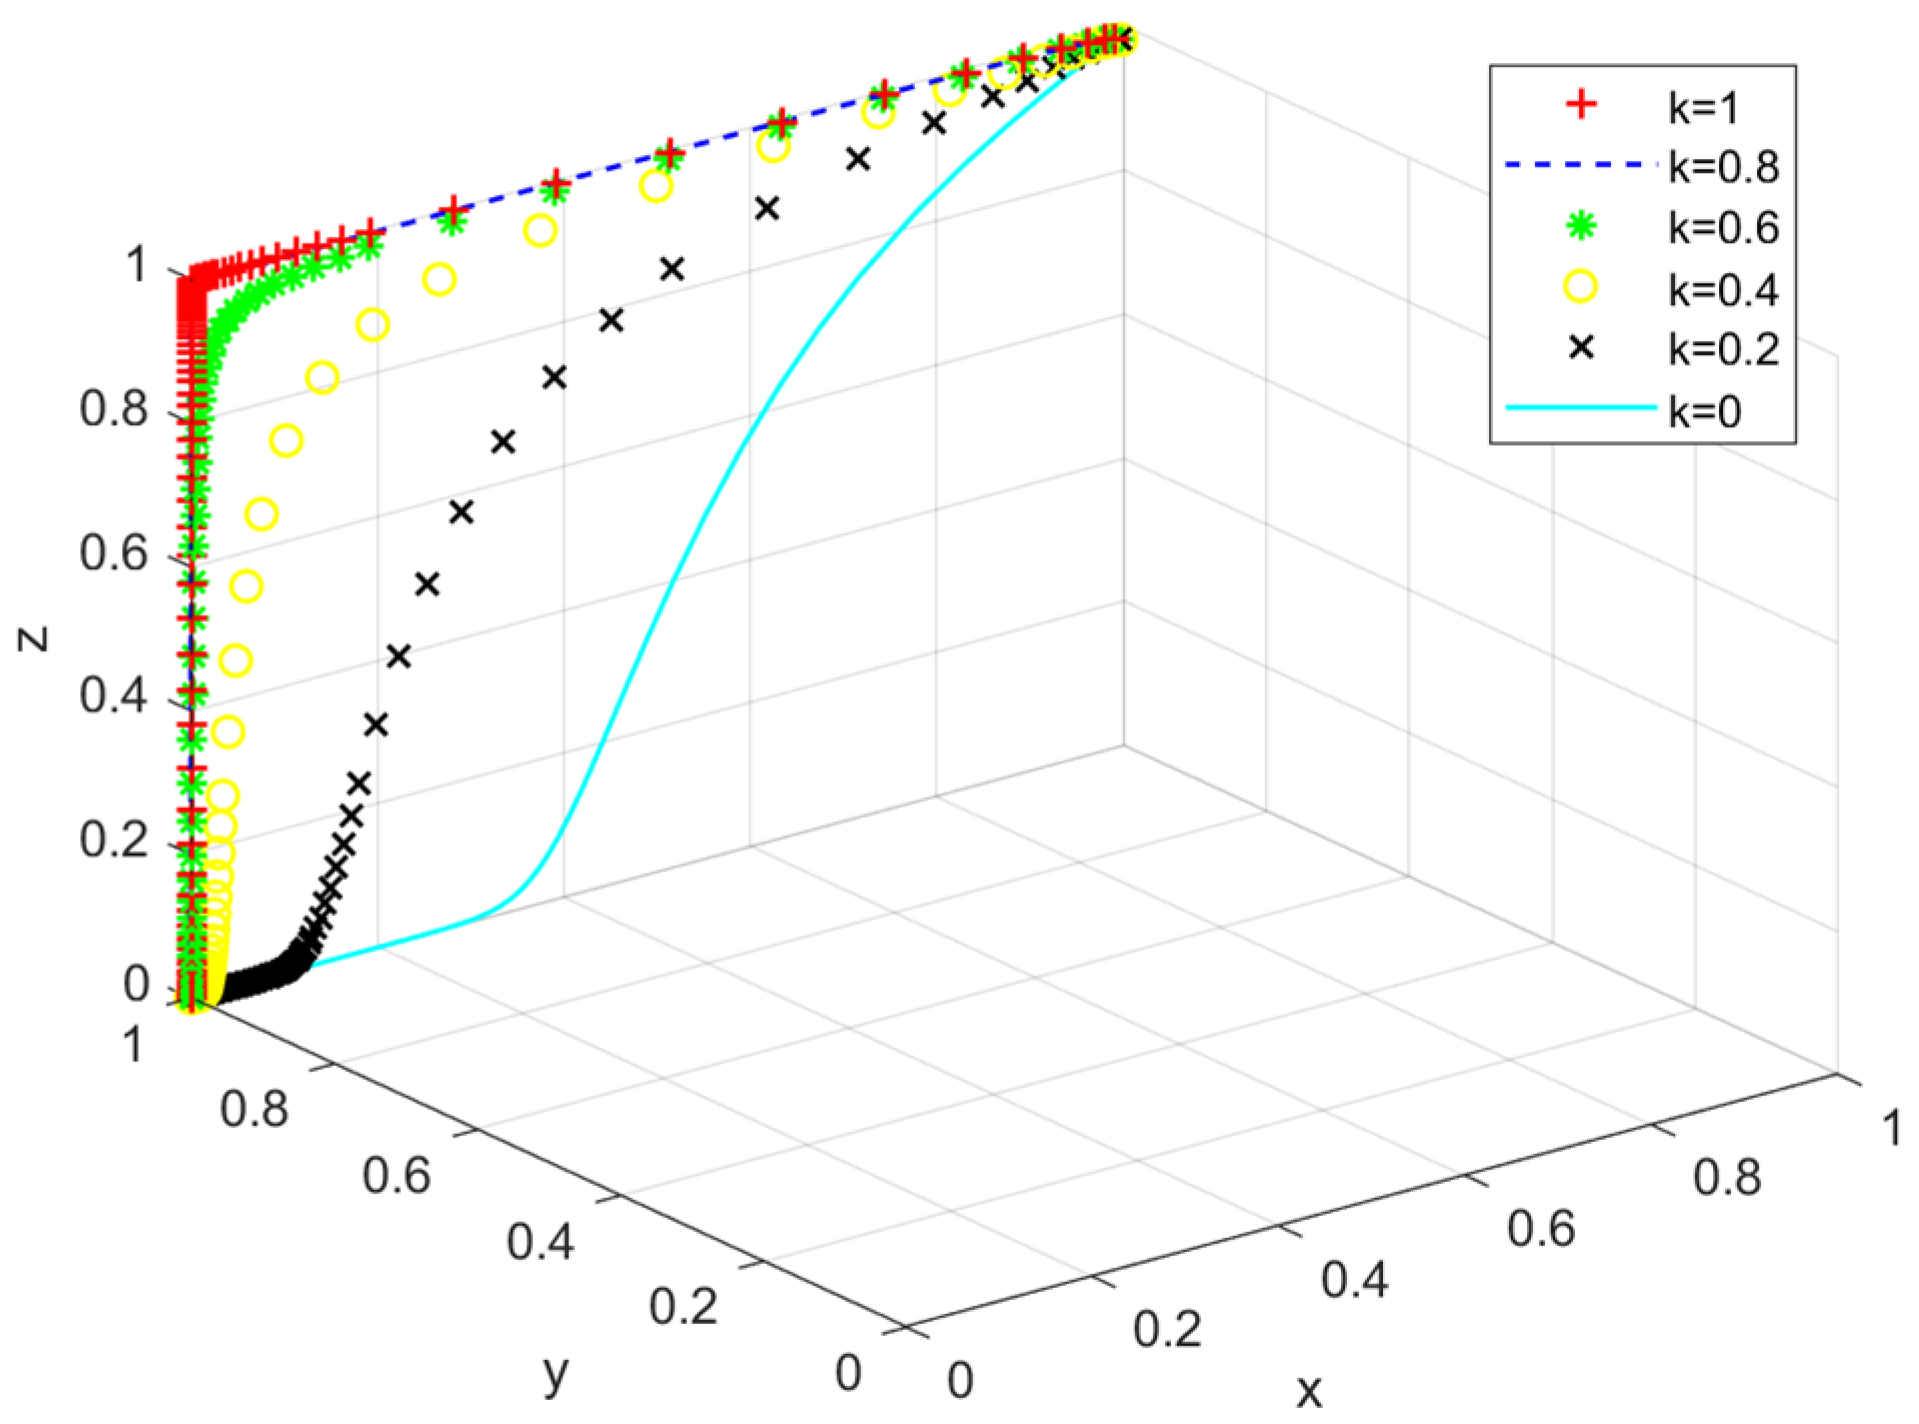
5.2.4. Green Credit Adjustment Factor

The green credit adjustment factor cannot be used to determine whether a company will choose to undergo green transition, but it does provide a valuable window of possibility for the green transition for companies. The impact of the green credit adjustment factor on the evolutionary paths is shown in Figure 10. Since the relevant parameter values are all consistent with those of Scenario 1, i.e., the relative benefits of green transformation are less than the relative costs, regardless of the value of the green credit adjustment factor, in the end, coal power companies will not choose to undergo green transformation. This does not mean that the green credit adjustment factor is meaningless; on the contrary, its value is crucial to coal power companies choosing to undergo green transformation, because the green credit adjustment factor is easy to control, while electricity prices and carbon emission trading prices are subject to market influence, and excessive fluctuations can affect people’s livelihoods. Project costs are constrained by the limitations of the green transition technology currently available, and are difficult to reduce artificially. As can be seen from Figure 10, although the change in the green credit adjustment factor does not affect the final game equilibrium point, it provides a valuable transition window for the green transformation of coal power enterprises.
Green credit adjustment factor values that are too low or too high are not good; when the green credit adjustment factor is equal to 0.6, the best green transition window is obtained for the company. The impact of the green credit adjustment factor on the probability of a coal power enterprise choosing to undergo green transformation is shown in Figure 11. It can be concluded, in line with Figure 10, that regardless of the value of the green credit adjustment factor, companies will not eventually choose to undergo green transition. This is because the relevant parameter values are the same as those set in Scenario 1, and the relative benefits of green transformation are lower than the relative costs. However, it can be observed from Figure 11 that with decreasing value of green credit adjustment factor, the speed of enterprises choosing not to undergo green transition first decreases and then slightly increases, and when the value of the green credit adjustment factor is about 0.6, the maximum probability of coal electricity enterprises choosing to undergo green transition in the same period is reached, with enterprises having the longest window of opportunity for green transition at this point. When the value of the green credit adjustment factor is too low, greater pressure will be put on banks and the government to fund green credit subsidies, making it difficult to maintain green credit policies over longer periods of time. When the value of the green credit adjustment factor is too high, it becomes difficult for coal power companies to achieve profitability from green transformation projects and the slow development of cleaner production-related industries, in turn making it difficult to obtain funds for further iterations of related technologies.
From Figure 12, it can be seen that when the relevant parameter values are set to satisfy Scenario 2, coal power companies will all choose to undergo green transition. However, Scenario 2 needs to satisfy the requirement that the benefits of undergoing green transformation are greater than the relative costs. Although the value of the green credit adjustment factor cannot be used to determine the equilibrium position of the evolutionary game, choosing an appropriate value for the green credit adjustment factor can provide more time in which to perform the transition from Scenario 1 to Scenario 2, and the best green transition window is obtained when the value of the green credit adjustment factor is 0.6, with banks reducing the loan rate for coal power enterprises by 40%, resulting in the longest green transition window for coal power companies.

6. Conclusions

This study focuses on the green credit policy during the green transformation of coal power enterprises, which it evaluates by constructing a tripartite evolutionary game model of government, coal power enterprises, and banks, clarifying the evolutionary path and key factors of green transformation, reaching the following main findings:
Firstly, to realize the spontaneous green transformation of coal power enterprises, spontaneous profitability must be achieved before the removal of government and bank policy incentives, which are reflected in continuous increases in electricity and carbon emissions trading prices, the carbon emission reduction resulting from green transformation projects, decreases in the costs of power generation and green transformation, and the increasing restriction of the scale of production of coal power enterprises that have not undergone green transformation. The sensitivity analysis of this paper shows that when the electricity price rises to CNY 0.45, the carbon emission trading price rises to CNY 65 or the cost of the CCS project is less than or equal to CNY 1,300,000,000, cleaner coal-fired production projects will be able to achieve self-generated profit, and enterprises will choose to undergo green transformation.
Secondly, the green credit adjustment factor cannot be used to determine whether a company will choose to undergo green transition, but it does provide a valuable window of green transition for companies. At the early stage of green transformation, since cleaner production projects are difficult to make profitable, external financial support is needed: banks need to provide green credit preferences for coal power enterprises, and the government needs to provide green credit financial incentives for banks, resulting in a continuous decrease in the green credit adjustment factor. With the cancellation of the green credit policy, the process described above will reverse, and banks and the government will gradually cancel their green credit incentives, causing the green credit adjustment factor to return to 1. Finally, when the relative benefits of carrying out green transformation projects are greater than the relative costs, coal power enterprises will undergo green transformation spontaneously.
Thirdly, lower green credit interest rates are not necessarily better. An optimal green credit interest rate exists, which will allow coal power enterprises to obtain the longest transition window in which to achieve spontaneous profitability as a result of green transition projects. Based on the case data modeling simulation, the longest green transition window can be obtained for coal power enterprises when the green credit interest rate adjustment factor is 0.6.

7. Discussion

On the basis of the analysis in this paper, it is clear that coal power companies need support from green credit policies to be able to achieve green transformation and provide a window for the renewed iteration of cleaner production. Therefore, when implementing green credit policies, it is necessary to set reasonable green credit interest rates in accordance with the actual situation of projects in order to provide adequate support to coal power enterprises. Green credit audits should also be strengthened to prevent fraudulent borrowing by enterprises. The financial pressure to which local governments and banks are subjected should also be considered, and the use of green credit subsidy budgets should be planned in a reasonable way in order to prevent the support from green credit policies being insufficient.
Among the other important factors influencing green transformation, changes in the values of each parameter present extreme difficulties, and may have a great impact on people’s daily lives; for example, increases in the prices of electricity and carbon emissions will increase inflationary pressure, while the cost of clean production projects is difficult to reduce in the short term due to the constraints of the relevant technology level. Therefore, it is necessary to always pay attention to the relevant price fluctuations in order to prevent potential inflationary risks arising from green transformation, while at the same time strengthening investment in R&D of cleaner production technologies and seizing the window of opportunity provided by green credit policies to realize the iterative upgrade of relevant industrial technologies and reduce the cost of green transformation.

Author Contributions

Conceptualization, F.C. and P.L.; methodology, M.T.; validation, M.T. and P.L.; formal analysis, P.L.; investigation, C.H.; resources, F.C.; data curation, F.C.; writing—original draft preparation, F.C.; writing—review and editing, P.L.; supervision, C.H.; project administration, F.C.; funding acquisition, M.T. All authors have read and agreed to the published version of the manuscript.

Funding

This research was funded by the National Natural Science Foundation of China, grant number 71972127, 71874123, 71974122, and the Shanghai Science and Technology Committee, grant number 21010501800, 22010501900, 19DZ1209202.

Institutional Review Board Statement

Not applicable.

Informed Consent Statement

Not applicable.

Data Availability Statement

Not applicable.

Conflicts of Interest

The authors declare no conflict of interest.

References

  1. Cui, R.Y.; Hultman, N.; Cui, D.; McJeon, H.; Yu, S.; Edwards, M.R.; Sen, A.; Song, K.; Bowman, C.; Clarke, L.; et al. A plant-by-plant strategy for high-ambition coal power phaseout in China. Nat. Commun. 2021, 12, 1468. [Google Scholar] [CrossRef] [PubMed]
  2. Kou, J.; Sun, F.; Li, W.; Jin, J. Could China Declare a “Coal Phase-Out”? An Evolutionary Game and Empirical Analysis Involving the Government, Enterprises, and the Public. Energies 2022, 15, 531. [Google Scholar] [CrossRef]
  3. Mi, Z.F.; Pan, S.Y.; Yu, H.; Wei, Y.M. Potential impacts of industrial structure on energy consumption and CO2 emission: A case study of Beijing. J. Clean. Prod. 2015, 103, 455–462. [Google Scholar] [CrossRef]
  4. Li, J.; Zhang, Y.; Tian, Y.; Cheng, W.; Yang, J.; Xu, D.; Ku, A.Y. Reduction of carbon emissions from China’s coal-fired power industry: Insights from the province-level data. J. Clean. Prod. 2020, 242, 118518. [Google Scholar] [CrossRef]
  5. Li, C.K.; Caineng, Z.; Weihe, H.; Jianning, Y.; Haixia, H. China’s Energy Demand Projection and Energy Transition Trends under Carbon Peak and Carbon Neutrality Situation. Pet. Sci. Technol. Forum. 2022, 41, 9–17. [Google Scholar] [CrossRef]
  6. Su, D.; Lian, L. Does green credit policy affect corporate financing and investment? Evidence from publicly listed enterprises in pollution-intensive industries. J. Financ. Res. 2018, 12, 123–137. Available online: http://www.jryj.org.cn/EN/Y2018/V462/I12/123 (accessed on 7 July 2022).
  7. Ling, S.; Han, G.; An, D.; Hunter, W.C.; Li, H. The impact of green credit policy on technological innovation of enterprises in pollution-intensive industries: Evidence from China. Sustainability 2020, 12, 4493. [Google Scholar] [CrossRef]
  8. Amore, M.D.; Schneider, C.; Žaldokas, A. Credit supply and corporate innovation. J. Financ. Econ. 2013, 109, 835–855. [Google Scholar] [CrossRef]
  9. Nanda, R.; Nicholas, T. Did bank distress stifle innovation during the Great Depression? J. Financ. Econ. 2014, 114, 273–292. [Google Scholar] [CrossRef]
  10. Kim, J.; Park, K. Financial development and deployment of renewable energy technologies. Energy Econ. 2016, 59, 238–250. [Google Scholar] [CrossRef]
  11. Kang, H.; Jung, S.Y.; Lee, H. The impact of Green Credit Policy on manufacturers’ efforts to reduce suppliers’ pollution. J. Clean Prod. 2020, 248, 119271. [Google Scholar] [CrossRef]
  12. Hu, Y.; Jiang, H.; Zhong, Z. Impact of green credit on industrial structure in China: Theoretical mechanism and empirical analysis. Environ. Sci. Pollut. Res. 2020, 27, 10506–10519. [Google Scholar] [CrossRef] [PubMed]
  13. Sun, J.; Wang, F.; Yin, H.; Zhang, B. Money talks: The environmental impact of China’s green credit policy. J. Policy Anal. Manag. 2019, 38, 653–680. [Google Scholar] [CrossRef]
  14. Li, Z.; Liao, G.; Wang, Z.; Huang, Z. Green loan and subsidy for promoting clean production innovation. J. Clean. Prod. 2018, 187, 421–431. [Google Scholar] [CrossRef]
  15. Zhang, D. Green credit regulation, induced R&D and green productivity: Revisiting the Porter Hypothesis. Int. Rev. Financ. Anal. 2021, 75, 101723. [Google Scholar] [CrossRef]
  16. Xing, C.; Zhang, Y.; Wang, Y. Do banks value green management in China? The perspective of the green credit policy. Financ. Res. Lett. 2020, 35, 101601. [Google Scholar] [CrossRef]
  17. Song, M.; Xie, Q.; Shen, Z. Impact of green credit on high-efficiency utilization of energy in China considering environmental constraints. Energy Policy 2021, 153, 112267. [Google Scholar] [CrossRef]
  18. Zhang, K.; Li, Y.; Qi, Y.; Shao, S. Can green credit policy improve environmental quality? Evidence from China. J. Environ. Manag. 2021, 298, 113445. [Google Scholar] [CrossRef]
  19. Wang, F.; Yang, S.; Reisner, A.; Liu, N. Does green credit policy work in China? The correlation between green credit and corporate environmental information disclosure quality. Sustainability 2019, 11, 733. [Google Scholar] [CrossRef]
  20. Yao, S.; Pan, Y.; Sensoy, A. Green credit policy and firm performance: What we learn from China. J. Energy Econ. 2021, 101, 105415. [Google Scholar] [CrossRef]
  21. Wen, H.; Lee, C.C.; Zhou, F. Green credit policy, credit allocation efficiency and upgrade of energy-intensive enterprises. Energy Econ. 2021, 94, 105099. [Google Scholar] [CrossRef]
  22. Wang, E.; Liu, X.; Wu, J.; Cai, D. Green credit, debt maturity, and corporate investment—Evidence from China. Sustainability 2019, 11, 583. [Google Scholar] [CrossRef]
  23. Xu, X.; Li, J. Asymmetric impacts of the policy and development of green credit on the debt financing cost and maturity of different types of enterprises in China. J. Clean. Prod. 2020, 264, 121574. [Google Scholar] [CrossRef]
  24. He, L.; Liu, R.; Zhong, Z.; Wang, D.; Xia, Y. Can green financial development promote renewable energy investment efficiency? A consideration of bank credit. Renew. Energ. 2019, 143, 974–984. [Google Scholar] [CrossRef]
  25. Berrou, R.; Ciampoli, N.; Marini, V. Defining Green Finance: Existing Standards and Main Challenges. In The Rise of Green Finance in Europe; Palgrave Studies in Impact Finance; Migliorelli, M., Dessertine, P., Eds.; Palgrave Macmillan: Cham, Switzerland, 2019. [Google Scholar] [CrossRef]
  26. Hafezalkotob, A.; Alavi, A.; Makui, A. Government financial intervention in green and regular supply chains: Multi-level game theory approach. Int. J. Manag. Sci. Eng. Manag. 2016, 11, 167–177. [Google Scholar] [CrossRef]
  27. Hafezalkotob, A.; Mahmoudi, R. Selection of energy source and evolutionarily stable strategies for power plants under financial intervention of government. J. Ind. Eng. Int. 2017, 13, 357–367. [Google Scholar] [CrossRef]
  28. Kuang, Y. Research on the Game Theory and Logic Optimization and the Applications on Construction of China’s New Energy Subsidy System. DEStech Transactions on Social Science Education and Human Science (asshm). 2016. Available online: http://dpi-journals.com/index.php/dtssehs/article/view/8366 (accessed on 21 January 2022).
  29. Tian, Y.; Govindan, K.; Zhu, Q. A system dynamics model based on evolutionary game theory for green supply chain management diffusion among Chinese manufacturers. J. Clean. Prod. 2014, 80, 96–105. [Google Scholar] [CrossRef]
  30. Xu, A.; Zhou, Z. A Game Model for the Pricing of the Government’s Subsidy in the Green Supply Chain for Home Appliances Industry in China. WHICEB 10. 2013. Available online: https://aisel.aisnet.org/cgi/viewcontent.cgi?article=1109&context=whiceb2013 (accessed on 17 March 2022).
  31. Sheu, J.B.; Chen, Y.J. Impact of government financial intervention on competition among green supply chains. Int. J. Prod. Econ. 2012, 138, 201–213. [Google Scholar] [CrossRef]
  32. Geng, Y.; Xinbei, W.; Qinghua, Z.; Hengxin, Z. Regional initiatives on promoting cleaner production in China: A case of Liaoning. J. Clean. Prod. 2010, 18, 1502–1508. [Google Scholar] [CrossRef]
  33. Dong, F.; Shi, L.; Ding, X.; Li, Y.; Shi, Y. Study on China’s Renewable Energy Policy Reform and Improved Design of Renewable Portfolio Standard. Energies 2019, 12, 2147. [Google Scholar] [CrossRef]
  34. Zhao, R.; Neighbour, G.; Han, J.; McGuire, M.; Deutz, P. Using game theory to describe strategy selection for environmental risk and carbon emissions reduction in the green supply chain. J. Loss. Prev. Process. Ind. 2012, 25, 927–936. [Google Scholar] [CrossRef]
  35. Zhang, T.; Cao, S.; Pan, L.; Zhou, C. A Policy Effect Analysis of China’s Energy Storage Development Based on a Multi-Agent Evolutionary Game Model. Energies 2020, 13, 6293. [Google Scholar] [CrossRef]
  36. Friedman, D. Evolutionary games in economics. Econometrica 1991, 59, 637–666. [Google Scholar] [CrossRef]
  37. China Electricity Council. 2019–2020 National Electricity Supply and Demand Situation Analysis and Forecast Report 2020. Available online: https://cec.org.cn/detail/index.html?3-277104 (accessed on 17 March 2022).
  38. Zhao, X.; Bai, Y.; Ding, L.L. Can carbon sentiment contribute to the development of carbon capture and storage projects? China Manag. Sci. 2020. (In Chinese) [Google Scholar] [CrossRef]
  39. National Development and Reform Commission of the People’s Republic of China. National Development and Reform Commission National Energy Administration on Notice on the Orderly Release of Electricity Consumption Plans 2017. Available online: https://www.ndrc.gov.cn/fzggw/jgsj/yxj/sjdt/201704/t20170410_986939.html?code=&state=123 (accessed on 18 March 2022).
Figure 1. Government evolutionary stabilization strategy: (a) β x = 0 ; (b) β x > 0 ; (c) β x < 0 .
Energies 15 05911 g001
Figure 2. Evolutionary stabilization strategy of coal power enterprises: (a) β y = 0 ; (b) β y > 0 ; (c) β y < 0 .
Energies 15 05911 g002
Figure 3. Bank evolutionary stabilization strategy: (a) β z = 0 ; (b) β z > 0 ; (c) β z < 0 .
Energies 15 05911 g003
Figure 4. The impact of electricity price on evolutionary paths.
Energies 15 05911 g004
Figure 5. The impact of electricity price on the probability of coal power enterprises choosing to undergo green transformation.
Energies 15 05911 g005
Figure 6. The impact of carbon emission trading price on evolutionary paths.
Energies 15 05911 g006
Figure 7. The impact of carbon emission trading price on the probability of coal power enterprises choosing to undergo green transformation.
Energies 15 05911 g007
Figure 8. The impact of project cost on evolutionary paths.
Energies 15 05911 g008
Figure 9. The impact of project cost on the probability of coal power enterprises choosing to undergo green transformation.
Energies 15 05911 g009
Figure 10. The impact of green credit adjustment factor on evolutionary paths.
Energies 15 05911 g010
Figure 11. The impact of the green credit adjustment factor on the probability of coal power enterprises choosing to undergo green transformation.
Energies 15 05911 g011
Figure 12. The impact of green credit adjustment factor on evolutionary paths in Scenario 2.
Energies 15 05911 g012
Table 1. System parameters for the trilateral strategy evolution game.
SubjectParametersDefinition
Government π 1 ( Q ) Socio-economic benefit function
π 2 ( C Q ) Socio-environmental benefit function
C Regulatory costs
R Green credit financial subsidy
Coal power enterprises P Electricity prices
C C Coal prices
Q 1 Green transition enterprise power generation
Q 2 Passive reduction of enterprise power generation
C Q 1 Green transition carbon emissions
C Q 2 Passive reduction of carbon emissions
A Carbon emission allowance
C P Carbon emission trading price
Commercial Banks r Loan interest rate
m Project loan amount
k Green adjustment factor
B C 1 Implementation of green credit bank costs
B C 2 Implementation of traditional credit bank costs
Table 2. Payoff matrix of government, coal power enterprises, and banks.
SubjectBanks
Implementation of Green Credit Policy (z) Implementation of Traditional Credit Policies (1 − z)
Govern-ment green   incentives   ( x ) Coal power enterprisesGreen transformation
( y )
π 1 ( Q 1 ) + π 2 ( C Q 1 ) C R π 1 ( Q 1 ) + π 2 ( C Q 1 ) C
( P C C ) × Q 1 ( C Q 1 A ) × C P r × m × k ( P C C ) × Q 1 ( C Q 1 A ) × C P r × m
r × m × k B C 1 + R r × m B C 2
Passive   reduction   ( 1 y ) π 1 ( Q 2 ) + π 2 ( C Q 2 ) C π 1 ( Q 2 ) + π 2 ( C Q 2 ) C
( P C C ) × Q 2 ( C Q 2 A ) × C P ( P C C ) × Q 2 ( C Q 2 A ) × C P
00
No   green   incentive   ( 1 x ) Green transformation
( y )
π 1 ( Q 1 ) + π 2 ( C Q 1 ) π 1 ( Q 1 ) + π 2 ( C Q 1 )
( P C C ) × Q 1 ( C Q 1 A ) × C P r × m × k ( P C C ) × Q 1 ( C Q 1 A ) × C P r × m
r × m × k B C 1 r × m B C 2
Passive   reduction   ( 1 y ) π 1 ( Q 2 ) + π 2 ( C Q 2 ) π 1 ( Q 2 ) + π 2 ( C Q 2 )
( P C C ) × Q 2 ( C Q 2 A ) × C P ( P C C ) × Q 2 ( C Q 2 A ) × C P
00
Table 3. Equilibrium point stability.
Equilibrium
Point
EigenvalueSymbolsStability
λ1λ2λ3
(0,0,0) C ( P C C ) × ( Q 1 Q 2 ) ( C Q 1 C Q 2 ) × C P r × m 0−, N, 0Instability
(1,0,0) C ( P C C ) × ( Q 1 Q 2 ) ( C Q 1 C Q 2 ) × C P r × m 0+, N, 0Instability
(0,1,0) C ( P C C ) × ( Q 1 Q 2 ) ( C Q 1 C Q 2 ) × C P r × m r × m × ( 1 k ) ( B C 1 B C 2 ) −, N, −Uncertain
(0,0,1) C ( P C C ) × ( Q 1 Q 2 ) ( C Q 1 C Q 2 ) × C P r × m × k 0−, N, 0Instability
(1,1,0) C ( P C C ) × ( Q 1 Q 2 ) ( C Q 1 C Q 2 ) × C P r × m R r × m × ( 1 k ) ( B C 1 B C 2 ) +, N, NInstability
(1,0,1) C ( P C C ) × ( Q 1 Q 2 ) ( C Q 1 C Q 2 ) × C P r × m × k 0+, N, 0Instability
(0,1,1) R C ( P C C ) × ( Q 1 Q 2 ) ( C Q 1 C Q 2 ) × C P r × m × k r × m × ( 1 k ) + B C 1 B C 2 −, N, +Instability
(1,1,1) R + C ( P C C ) × ( Q 1 Q 2 ) ( C Q 1 C Q 2 ) × C P r × m × k R r × m × ( 1 k ) ( B C 1 B C 2 ) +, N, −Instability
Note: “+” indicates a positive value, “−” indicates a negative value, and “N” indicates uncertainty.
Table 4. Analysis of changes in evolutionarily stable strategies in the system under different scenarios.
Equilibrium
Point
Scenario 1Scenario 2
Eigenvalue SymbolsStabilityEigenvalue SymbolsStability
(0,0,0)−, −, 0Unstable−, +, 0Unstable
(1,0,0)+, −, 0Unstable+, +, 0Unstable
(0,1,0)−, +, −Unstable−, −, −Stable
(0,0,1)−, N, 0Unstable−, N, 0Unstable
(1,1,0)+, +, NUnstable+, −, NUnstable
(1,0,1)+, N, 0Unstable+, N, 0Unstable
(0,1,1)−, N, +Unstable−, N, +Unstable
(1,1,1)+, N, −Unstable+, N, −Unstable
Note: “+” indicates a positive value, “−” indicates a negative value, and “N” indicates uncertainty.
Table 5. Initial assignment of system parameters.
SubjectParametersUnitAssignment
Government π 1 ( Q ) //
π 2 ( C Q ) //
C CNY5,000,000
R CNY30,000,000
Coal power enterprises P CNY/kWh0.40/0.41/0.42/0.43/0.44/0.45
C C CNY/kWh0.3
Q 1 kWh1,200,000,000
Q 2 kWh960,000,000
C Q 1 Tonnes18,000
C Q 2 Tonnes748,800
A //
C P CNY/tonne50/55/60/65/70/75
Banks r /0.0445
m CNY1,600,000,000/1,500,000,000
/1,400,000,000/1,300,000,000
/1,200,000,000/1,100,000,000
k /0/0.2/0.4/0.6/0.8/1
B C 1 CNY15,000,000
B C 2 CNY10,000,000
Publisher’s Note: MDPI stays neutral with regard to jurisdictional claims in published maps and institutional affiliations.

