1. Introduction
In terms of the flow of materials in a distribution network, supply chain management deals with transport from suppliers to distribution centers, warehousing processes, inventory and last-mile delivery to the customers. With reference to this, designing a distribution network may be considered a multi-echelon optimization problem [
1]. Sung and Yang [
2] propose a branch-and-price algorithm as an exact algorithm for the cross-dock (XD) supply chain network design problem; this deals with optimizing the locations of XD facilities and allocating vehicles for transport between origin and destination nodes via an XD facility to meet a given set of freight demands at minimum cost, subject to the given lead time. Mohtashami et al. [
3] considered cross-docking in a supply chain and proposed a multi-objective mathematical model for minimizing the make-span, transport costs and the number of truck trips in the supply chain. The proposed model allows deliveries from suppliers to the XD facility, but also direct deliveries from suppliers to end-customers.
This research is focused on the possibilities for energy savings in warehouse docking operations. The loading dock area is typically the hub of warehouse activities, with vehicles, inventory and personnel constantly moving in and out. The efficiency of docking operations has a significant impact on the inventory level and response time to the customers. To ensure the loading dock and door area are safe and running at maximum efficiency, companies need to constantly monitor and improve their logistics processes and mitigate potential risks that can affect it. Mirčetić et al. [
4] carried out a case study on the central warehouse of a beverage company, where the proper engagement of forklifts in loading operations is crucial for maintaining the defined customer-service level. To deal with the problem of forklift engagement, they created two expert system (ES) models, using several machine learning (ML) models. The models try to mimic expert decisions while determining the forklifts’ engagement in the loading operations.
Besides infrastructure and docking technology, the major issue in optimizing docking processes is truck-to-gate assignment, which has been addressed by numerous researchers. Due to the intensity of the working activities, the loading dock area should also be considered in terms of energy saving possibilities, as current trends in the logistics industry focus on sustainability and energy efficiency.
The methodology for optimizing cross-dock gate assignment by applying a linear programming mathematical model is outlined in a practical example of an I-shaped cross-dock facility by the authors of [
5]. Kuo Y. [
6] proposed a model for calculating the docking operations’ make-span, integrated with a variable neighborhood search (VNS), to optimize the sequencing of inbound and outbound trucks. In [
7], the authors analyzed operational cross-docking decisions that concern CO
2 emission and energy consumption, directly related to moving products from inbound trucks to outbound trucks. Rijal et al. [
8] studied an integrated approach to solving the problem of scheduling trucks and assigning them to the terminal dock doors, where dock doors can operate in a mixed service mode (both inbound and outbound trucks can be processed at these mixed-mode doors).
The application of artificial intelligence in optimizing automated storage and retrieval systems (ASRS) (computer-controlled systems that automatically place and retrieve items from storage locations in a facility with precision, accuracy and speed; the system is usually comprised of predefined locations where machines can follow established routes to obtain items) as a recent trend in the logistics industry has been addressed by numerous researchers. Brezovnik et al. [
9] designed an optimization algorithm to determine the path and the final position for each product entering the ASRS. They demonstrated how to plan ASRS using multiple-objective ant colony optimization (ACO). Foumani et al. [
10] considered a robotic ASRS whereby a Cartesian robot picks and palletizes items onto a mixed pallet for any order. They developed an avoidance strategy to prevent collisions that might cause the unsafe handling of hazardous items. Due to the complexity of the problem, they applied the cross-entropy (CE) method. Cardenas et al. [
11] dealt with the problem of high-power-demand peaks due to the simultaneous operation of the ASRS machines in an automated warehouse, which might cause the electric system to turn unstable. They presented a genetic algorithm approach to implement demand-side management (DSM) in the automated warehouse, to minimize instantaneous power demand while keeping the system store and retrieval times. Mostofi and Erfanian [
12] examined the optimization of multi-shuttle ASRS machine scheduling in shared storage, in fuzzy and dynamic environments, to minimize travel time. They presented a fuzzy linear programming mathematical model and used a genetic algorithm (GA) with Matlab software to obtain optimal solutions.
The results of the aforementioned research papers are mainly evaluated against the logistics key performance indicators (KPIs) (a key performance indicator (KPI) is a quantifiable measure used to evaluate the success of an organization or a process in meeting a specific objective), commonly used in supply chain management, such as the distance travelled, quantity of goods moved, shipment lead time, cost of transport, infrastructure or inventory. For this reason, it may be difficult to transparently correlate the improvements achieved by optimization with specific KPIs, set by the company stakeholders, in a particular case. This issue was addressed by Stanković and Božić in [
13], who proposed a linear programming model (LP model) to optimize the truck-to-gate assignment and designed a simulation model of inbound docking operations to quantify the respective reduction in waiting time in docking operations, which were the KPIs set in that case. Generally, these simulation methods have been widely used in designing and optimizing logistics processes and systems [
14,
15,
16,
17,
18,
19,
20], since the time when researchers started needing to use general-purpose computer language (such as C) to write program code that would enable the performance of simulation experiments [
21], until the present, when advanced simulation software packages (such as FlexSim) provide user-friendly development interfaces supported by automatic program-code generation.
Although energy consumption constantly gains importance and has become one of the major issues in supply chain management, it is ranked against other company priorities, where the conventional KPIs, directly related to company competitiveness, remain at the top of the list [
22]. To draw more attention to the possibilities for reducing energy consumption, they should be transparently correlated to improvements in the logistics processes. Additionally, the rationalization for the adopted measures and investments in energy saving must be justified by the savings achieved.
In this article, we propose a solution for both improving the docking process effectiveness and reducing the energy consumption of electric forklifts in performing docking operations. Therefore, the results achieved by optimizing the docking process are quantified by the respective savings in forklift energy consumption. Moreover, the proposed solution requires no investments in infrastructure or additional equipment at the distribution center; reorganizing truck handling is sufficient. The solution is based on optimizing truck-to-gate assignment using a linear programming mathematical model, while the respective energy savings are quantified using a simulation model. The solution we outlined in this article may motivate researchers and companies to find similar possibilities in some other logistics processes that could be adopted in practice.
2. Materials and Methods
The materials and methodology of the research consist of four stages. In the first stage, we conducted a case study of a local FMCG (fast-moving consumer goods) distributor’s logistics center, to collect the data and information needed for modeling inbound docking operations and performing simulation experiments.
The second stage encompassed designing a mathematical model of the inbound docking operations and obtaining optimal truck-to-gate assignment using a linear programming method, using an MS Excel spreadsheet optimizer (Solver).
In the third stage of the research, we designed a simulation model of the inbound docking operations, and carried out simulation experiments with varied parameters using the FlexSim simulation software package. The values of the simulation experiment parameters are related to the FMCG distributor’s empirical truck-to-gate assignment and to the optimal truck-to-gate assignment obtained in the previous stage. In performing the simulation experiments, the electric energy consumption of the forklifts was monitored as the primary key performance indicator (KPI).
In the fourth stage of the research, the forklifts’ energy consumption was related to the optimization of the inbound dock door allocation, and the electric energy savings were quantified based on the simulation study results.
There are two main reasons for which we decided to follow this four-stage methodology. First, we wanted to evaluate the optimal solutions obtained in the LP model by correlating the improvements achieved thereof with the respective energy savings in performing the docking operations that were quantified in the simulation model.
The second reason refers to the way in which the energy efficiency issue needed to be presented to the stakeholders of the distributor. Due to the strict time-window scheduling of the incoming trucks, the distributor has never encountered a situation in which all the trucks could not have been handled within the time frame allocated for receiving goods or with insignificant delay, so this KPI has been continuously met. Therefore, the distribution center managers have never paid more attention to the truck-to-gate assignment, nor to the possibilities of the energy savings that could be achieved with reference to that. To bring this issue to their attention, we needed to demonstrate, in a transparent way, that both the logistics process effectiveness and the energy efficiency could be raised with existing resources, only by optimizing the warehouse dock door allocation. The most convenient way to do so was to perform a demonstration in a 3D simulated model of the warehouse. In addition to the statistics on the warehouse performance, the simulation model also enables experimentation with different layouts, equipment, truck scheduling, etc.
2.1. Case Study: Inbound Docking Operations at the FMCG Distribution Center
The case study was carried out in February 2022 at the logistics center operated by one of the leading Croatian FMCG distributors (hereinafter referred as Distributor). The name of the company is not quoted due to General Data Protection Regulation (GDPR).
The aim of the case study is to learn the logic of the inbound docking operations, determine the activities and resources involved in performing those operations, and collect and process the respective data. With reference to this, the inbound side of the distribution warehouse was analyzed, where suppliers deliver the goods on daily basis according to the orders placed by the Distributor’s procurement department. The facility is a conventional distribution warehouse with manually operated electric forklifts.
Each supplier is assigned a time window for his truck to arrive. The total time allocated for receiving goods (suppliers deliver palletized goods to the distribution warehouse) is limited to the period from 08:00 AM to 01:00 PM, divided into five time windows of one hour each, while a truck must arrive within the first half of the time window. The inbound dock doors (Gates 1 to 8) are assigned to the trucks according to the arrival order, meaning the first truck to arrive within a time window is assigned to Gate 1, the second truck to arrive is assigned Gate 2, etc. A sample of the truck arrival sequence is shown in
Table 1. The columns, from left to right, refer to: date of arrival, time of arrival, total time in seconds elapsed from the beginning of the shift (08:00 AM) to the truck arrival (these data are calculated for the purpose of simulation experiments), the truck reference (name), the gate assigned to the truck, and the number of pallets for each storage zone (there are seven storage zones: SZ1 to SZ7).
These data were needed as input data for optimizing the inbound dock door allocation and for performing the simulation experiments. The data were recorded on three different working days, in three different weeks in February 2022.
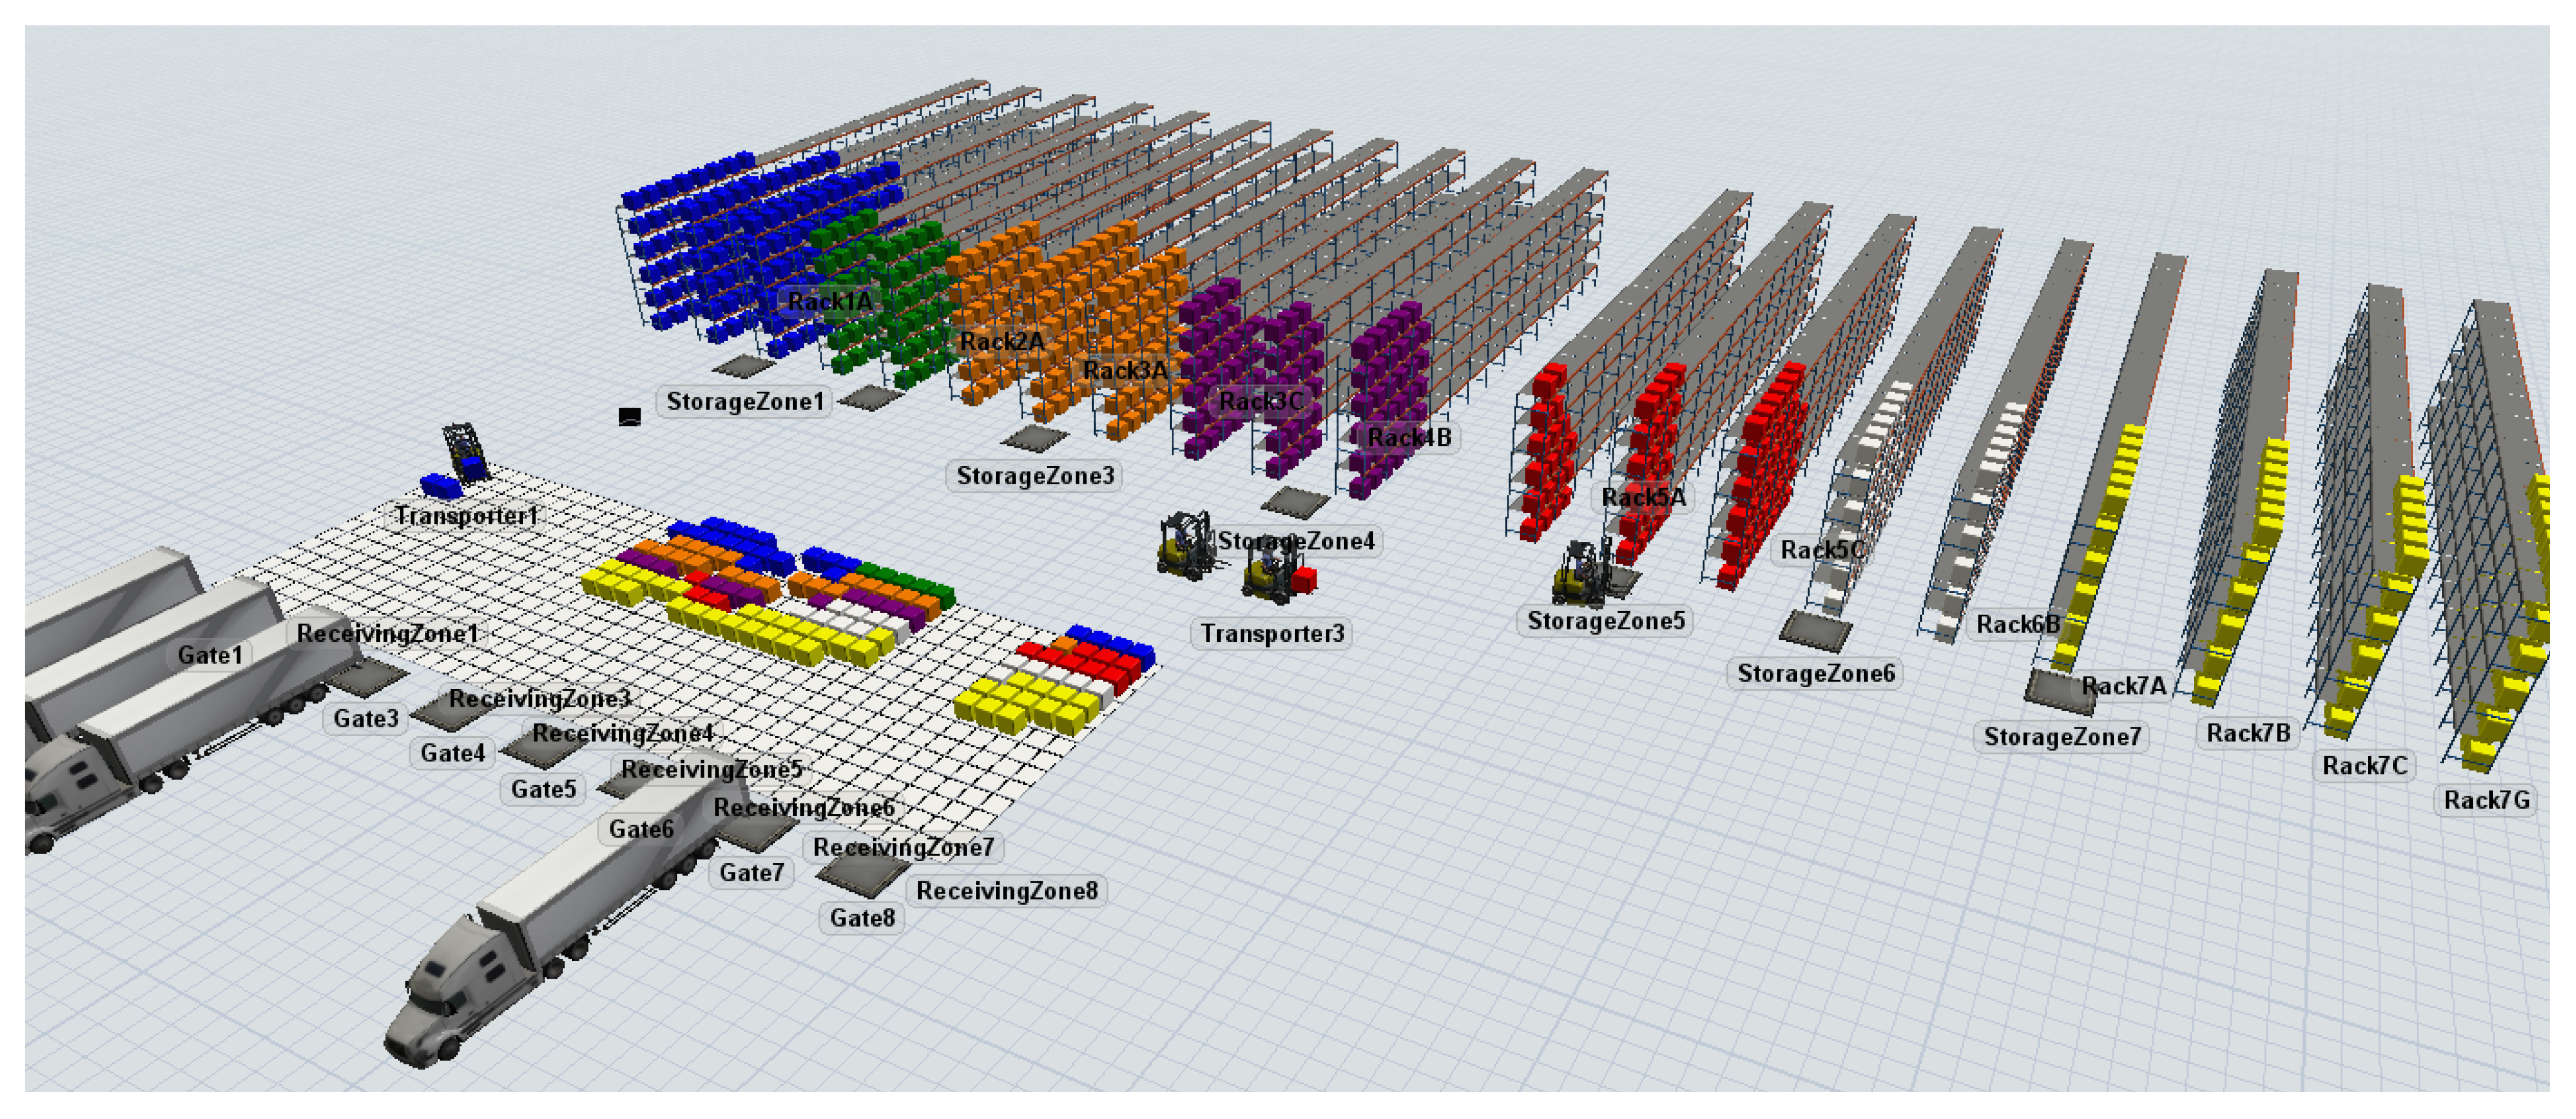
The pallets are unloaded from the truck to the receiving zone corresponding to the gate which is assigned to that truck (there are eight receiving zones corresponding to eight gates: Receiving Zone 1 corresponds to Gate1, Receiving Zone 2 corresponds to Gate 2, etc.).
From the receiving zone, the pallets are moved to their respective storage zone and placed in their designated address in the pallet rack. Each of seven storage zones consists of two (SZ2 and SZ6), three (SZ1, SZ3, SZ4 and SZ5) or four (SZ7) pallet racks. Moving pallets to the storage zones is performed using electric forklifts (there are four electric forklifts allocated to this operation).
A simplified layout of the inbound side of the distribution warehouse is depicted in
Figure 1. The pallets are painted in different colors with reference to their respective storage zones. The layout was designed in FlexSim, scaled against the real warehouse structure and space.
In addition to the truck arrivals data, for the purpose of designing the simulation model and simulating the inbound docking operations, the following data were collected and recorded:
The dimensions of the warehouse sections and objects;
The length of the forklift paths;
The forklift travel speed, loading time and unloading time;
The duration of the docking operations.
Since the forklifts’ energy consumption is the main issue here, the docking operations not performed using forklifts, such as unloading pallets from the trucks to the receiving zones, checking goods against orders and placing pallets into the racks, are detailed only to the extent that is sufficient for obtaining the desired simulation results.
The energy consumption of the forklifts is given by the manufacturer’s technical specifications: 4.3 kWh/h according to EN16796:2016 (this European Standard specifies the general test criteria and requirements for measuring energy consumption for self-propelled industrial trucks during operation; for electric trucks, the efficiency of the battery and the battery charger is included).
2.2. Optimizing Inbound Dock Door Allocation at the Logistics Center
Determining the optimal truck-to-gate assignment is a resource-allocation problem which can be approximated by a linear programming model, i.e., a resource-allocation model. Incoming trucks are assigned to the inbound dock doors (gates) with reference to the quantity of goods (number of pallets) and the length of the path a forklift travels to move the pallets from a particular receiving zone to the respective storage zone. The rectilinear metric (in a rectilinear metric, the distance between two points in a plane consists of paths which are always parallel to the axes at right angles; the rectilinear distance is also referred as the Taxicab distance or Manhattan distance) is used instead of the Euclidean metric since the forklifts follow similar geometry when travelling across transport corridors within the warehouse.
We designed a linear programming mathematical model to describe the problem of optimizing inbound dock door allocation (truck-to-gate assignment). The structure of the model is explained hereinafter.
Objective function:
The criterion of optimality is to minimize the number of pallets moved over the distances travelled by the forklifts, which is equal to the sum of the products of the number of pallets and respective rectilinear distances, as given by Equation (1).
Constraints:
Each incoming truck must be assigned a gate, as given by Inequity (2);
Each gate can be assigned to only one or no incoming trucks, as given by Inequity (3);
The decision variable xgt is binary, as given by Expression (4);
The total number of incoming trucks must not exceed the total number of gates (receiving zones), as given by Inequity (5).
Input data:
The number of incoming trucks;
The number of pallets for each storage zone in each incoming truck;
The total number of gates (receiving zones);
The total number of storage zones;
The rectilinear distances from the gates (receiving zones) to the storage zones.
The mathematical formulation of the model is given by the Expressions (1)–(5):
where:
ptz = the number of pallets in incoming truck t to be placed into the storage zone z;
rgz = the rectilinear distance between the gate (receiving zone) g and storage zone z;
xgt = the decision variable:
m = the total number of gates (receiving zones);
n = the total number of storage zones;
l = the total number of incoming trucks.
The optimal solution to the inbound dock door allocation was obtained using the model with an MS Excel spreadsheet optimizer (Solver) (Solver is a Microsoft Excel add-in program that uses techniques from operations research to find optimal solutions to all kinds of optimization and decision problems). We found this software tool suitable for several reasons. It uses the Simplex algorithm for solving linear problems, which is made flexible and easy to use, as well as fast, for problems of the dimensions we were dealing with. Even if the limitations of Solver could have affected the quality of the results, which is not the case here, it would have an insignificant impact on the final outcomes of the research. The optimization results obtained by applying Solver were merely used to create different scenarios for the simulation experiments.
Moreover, using Solver requires no additional installation besides the standard MS Office, which has been generally used, making it suitable for daily use in real situations.
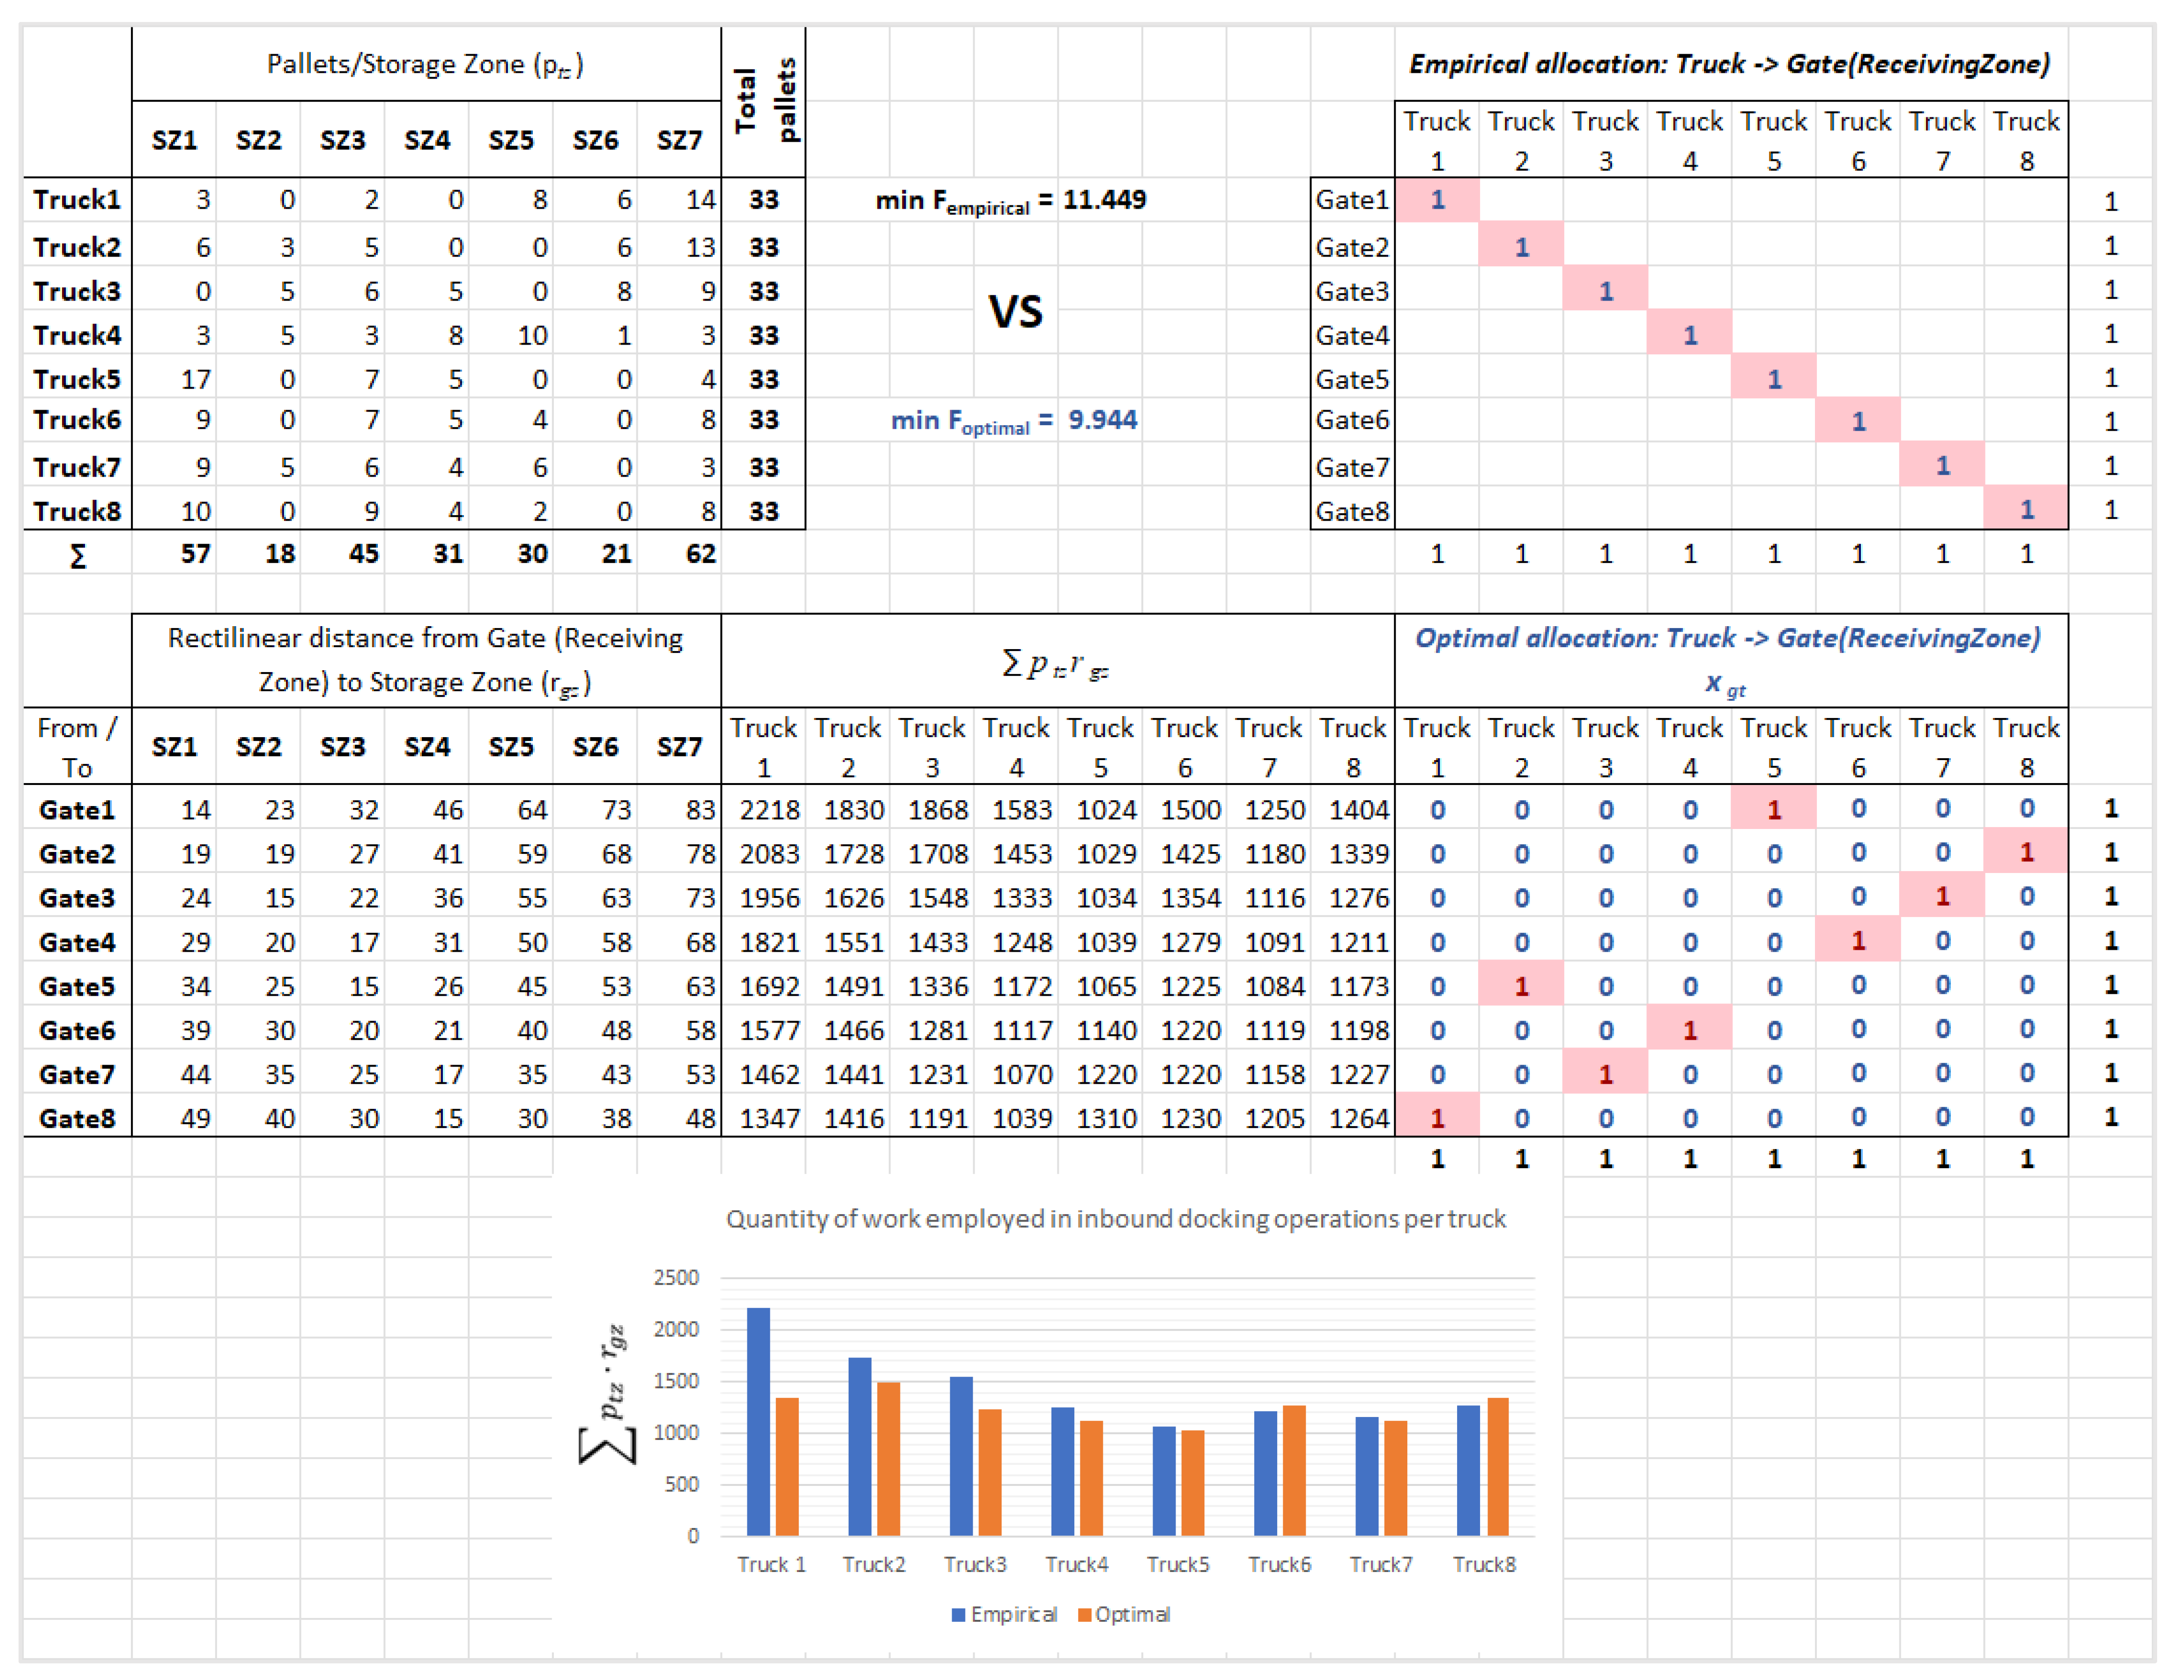
The solution applied by the Distributor (empirical solution) and the optimal solution of the inbound dock door allocation for the first time window, on 1 February 2022, are shown in
Figure 2.
In the Distributor’s empirical allocation, the gates are assigned to the incoming trucks according to the arrival sequence: Gate 1 is assigned to Truck 1, Gate 2 is assigned to Truck 2, Gate 3 is assigned to Truck 3, …, Gate 8 is assigned to Truck 8.
In the optimal allocation, the gates are assigned to the incoming trucks according to the values of the decision variables (xgt): Gate 1 is assigned to Truck 5, Gate 2 is assigned to Truck 8, Gate 3 is assigned to Truck 7, Gate 4 is assigned to Truck 6, Gate 5 is assigned to Truck 2, Gate 6 is assigned to Truck 4, Gate 7 is assigned to Truck 3 and Gate 8 is assigned to Truck 1.
The improvement achieved via optimization is quantified by the decrease in the objective function value, which cannot be expressed in a physical dimension. This is not an issue here, because the energy consumption of the forklifts is to be quantified in the simulation model, in different scenarios, which are switched with respect to the inbound dock door allocation (empirical vs. optimal).
2.3. Simulation Study of the Inbound Docking Operations
The aim of the simulation study is to quantify the impact of the inbound dock door allocation on the electric energy consumption of the forklifts when performing inbound docking operations. For this purpose, the input data collected in the case study were analyzed, and the current-state simulation model was designed to simulate inbound docking operations. The energy consumption of the forklifts was monitored in simulation experiments, which were performed with the arrivals’ input data recorded on 1, 7 and 25 February 2022. Each experiment consisted of two scenarios, one with the empirical and the other with the optimal inbound dock door allocation, as the parameters of the simulation model.
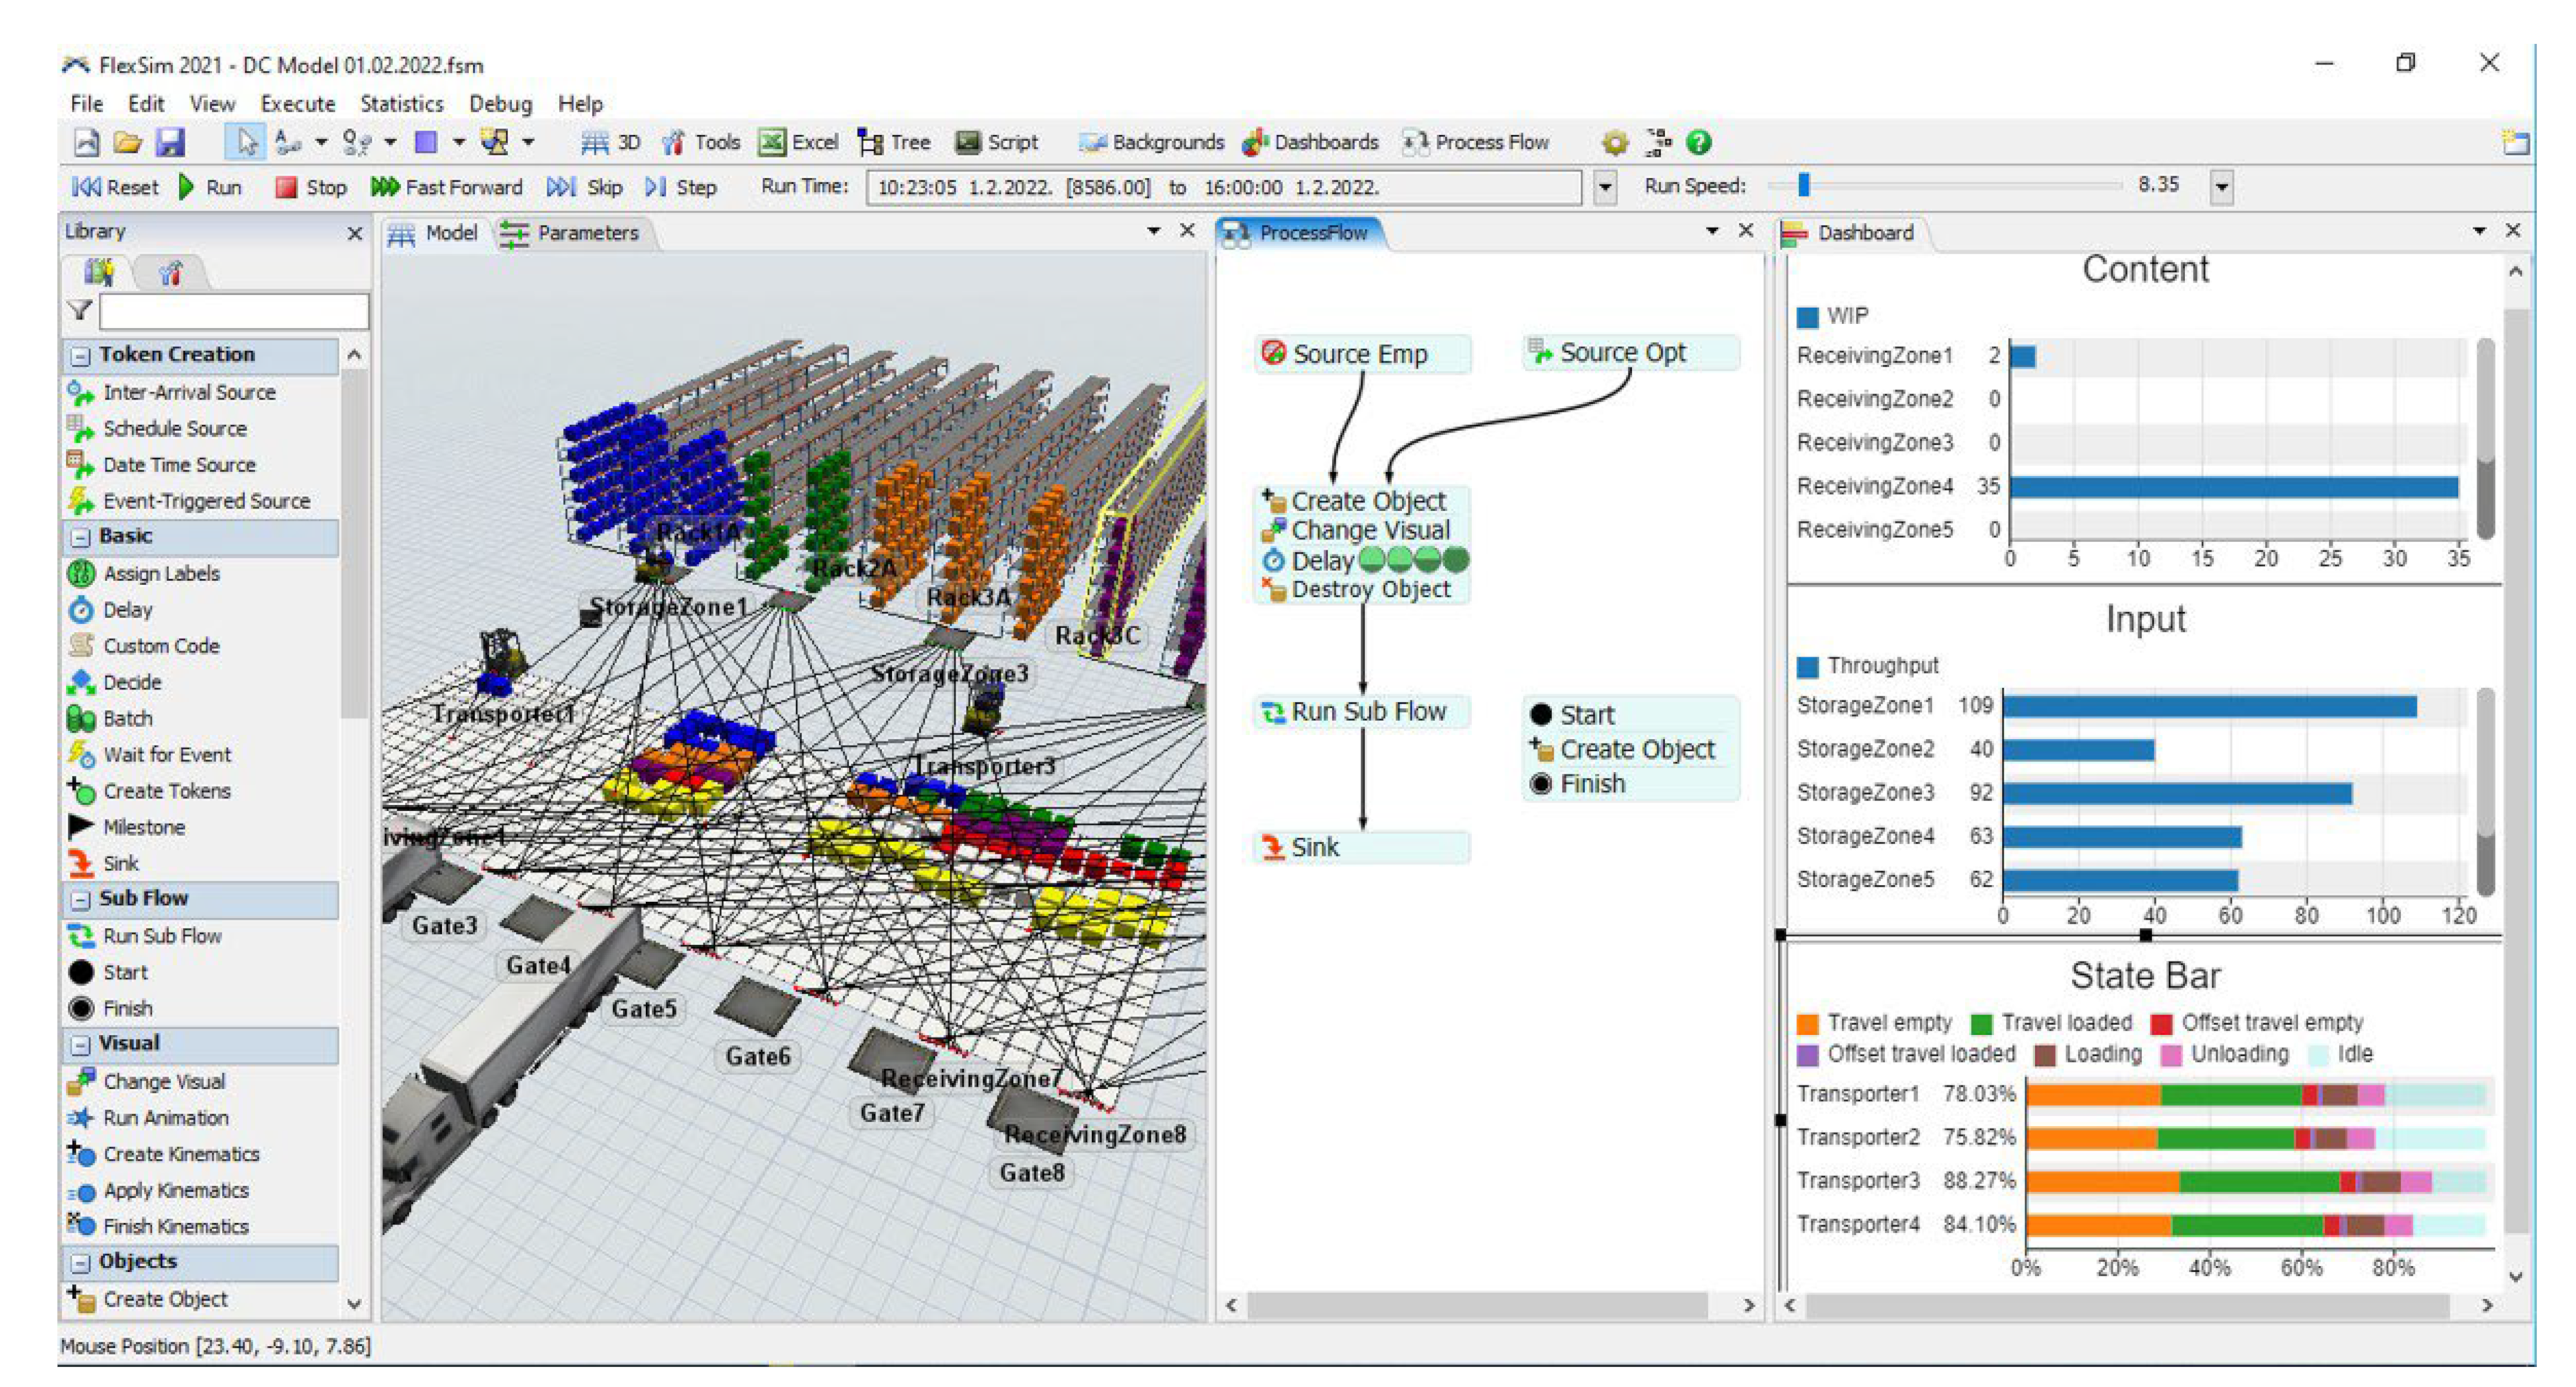
The simulation study was carried out by using FlexSim simulation software (version 2021.1.2), which is a professional software tool that models, simulates, predicts and visualizes business systems in a variety of industries: manufacturing, material handling, healthcare, warehousing, mining, logistics and more. We used FlexSim simulation software due to its powerful 3D engine, which enabled us to present the research findings to the stakeholders of the Distributor in a proper way. Since they are not academics, the presentation could not be too abstract, but more technical and as transparent as possible. Therefore, we produced a real-time 3D animation of the docking operations with a dynamic display of the state and performance indicators.
The simulation model was built using two user interfaces: the 3D model and the Process Flow tool. The 3D model is where the inbound docking operations are visualized using 3D graphics. The Process Flow tool is where the logic that powers the 3D model is defined, as shown in
Figure 3.
Figure 3 also shows the dashboard, which is used to dynamically (in the real time) display the state and performance indicators of the objects in the simulation model, as well as to record the respective statistical data for further processing.
4. Discussion
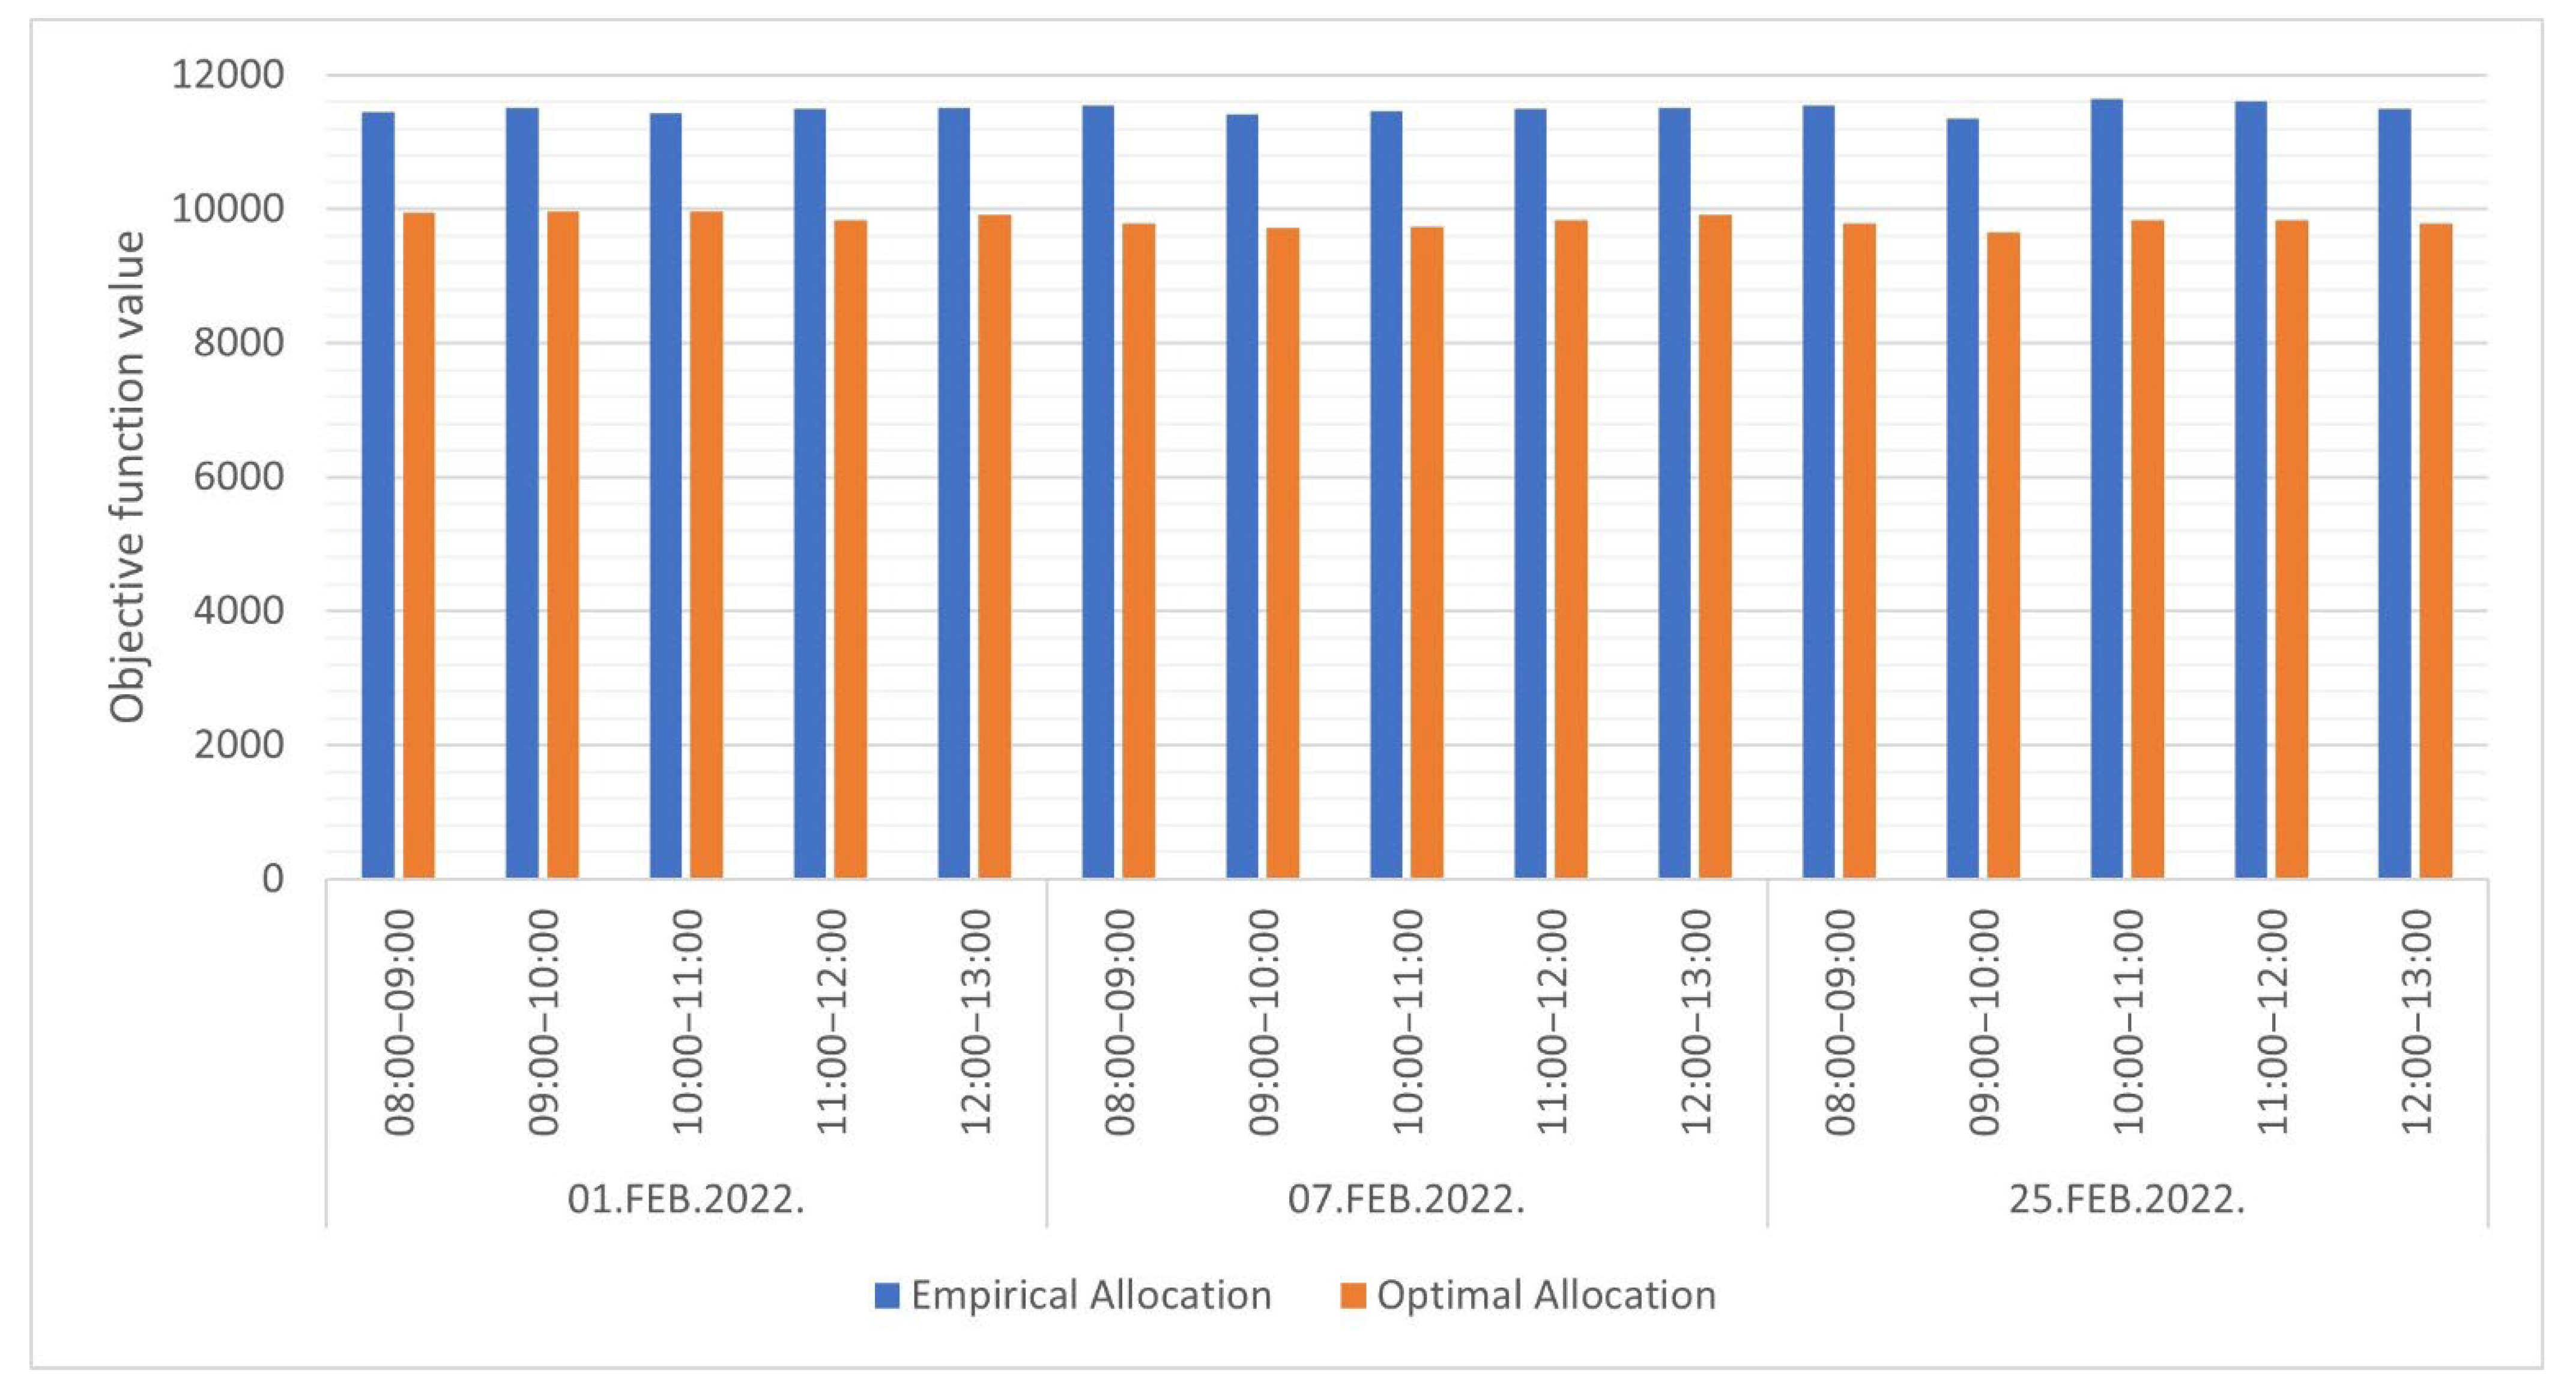
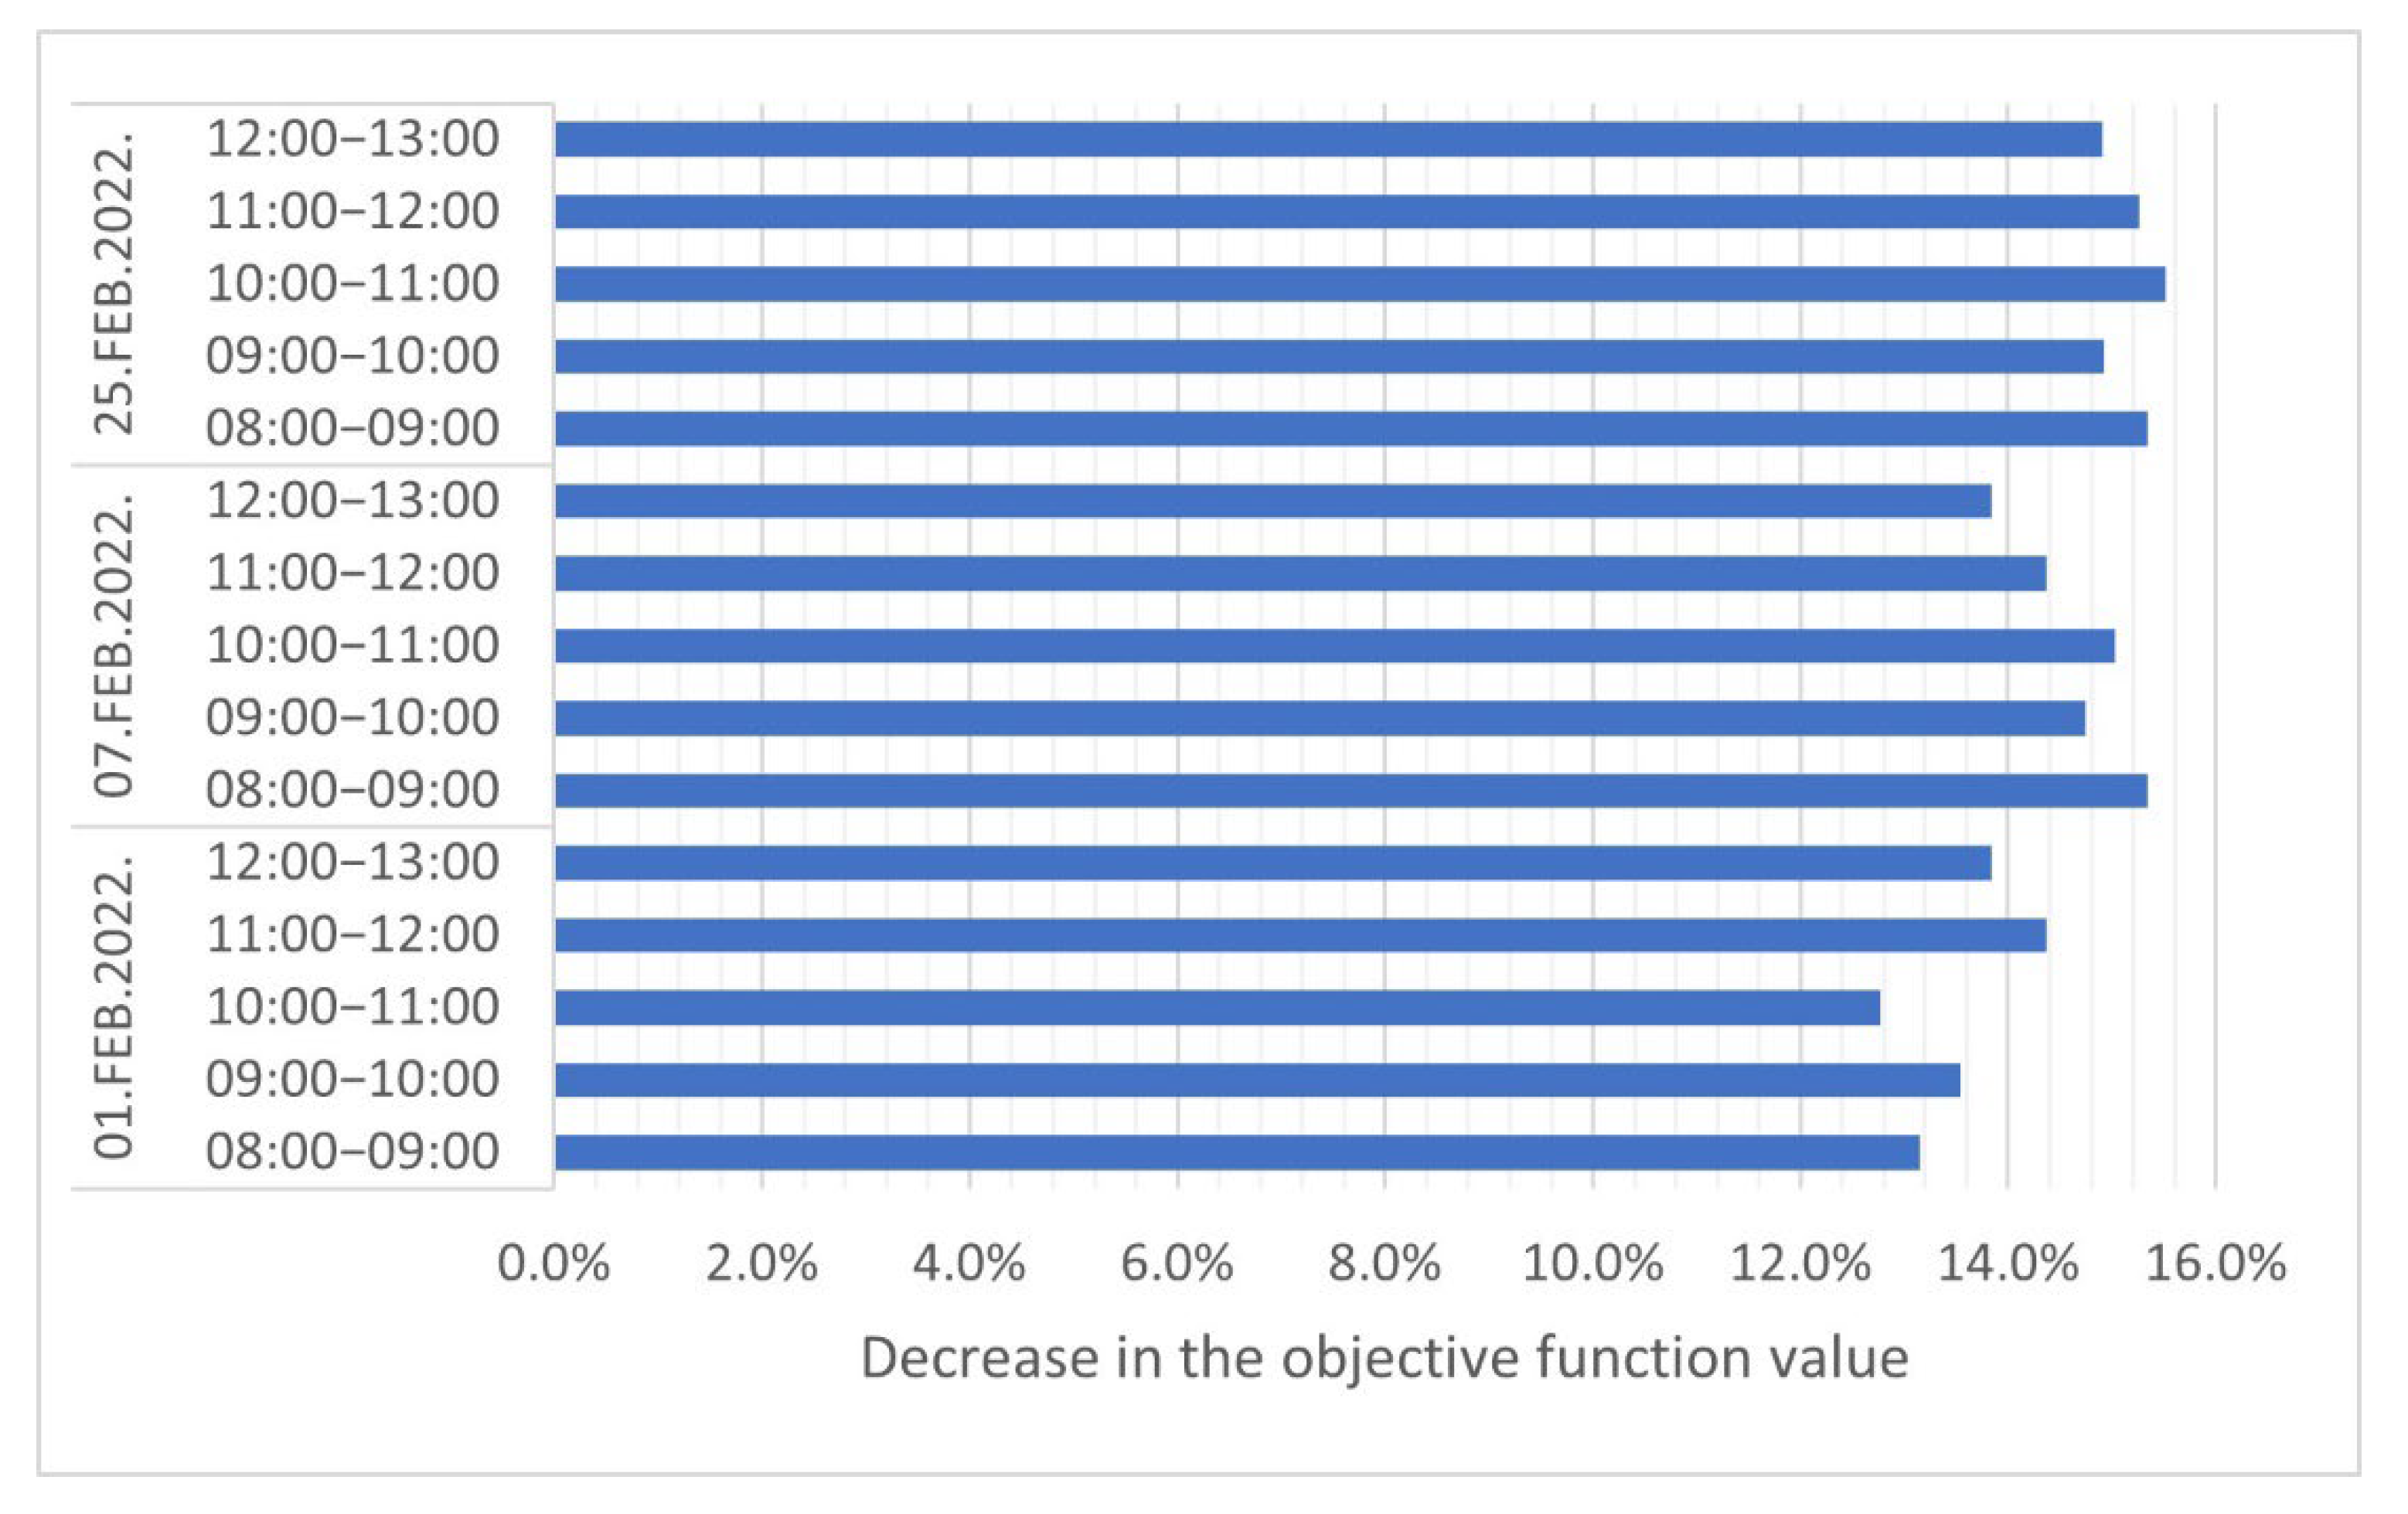
Optimizing the inbound dock door allocation reduced the quantity of work employed in performing the inbound docking operations. The improvements achieved thereof are quantified by a decrease in the objective function value (obtained using the linear programming model). The decrease in the objective function values across working days and time windows ranged from a minimum of 12.8% to a maximum of 15.5%, as shown in
Figure 8. The average decrease achieved in the sample (the three working days) equals 14.5%.
The optimal values of the linear programming model decision variables, representing the optimal inbound dock door allocation, were used as parameters in the simulation model.
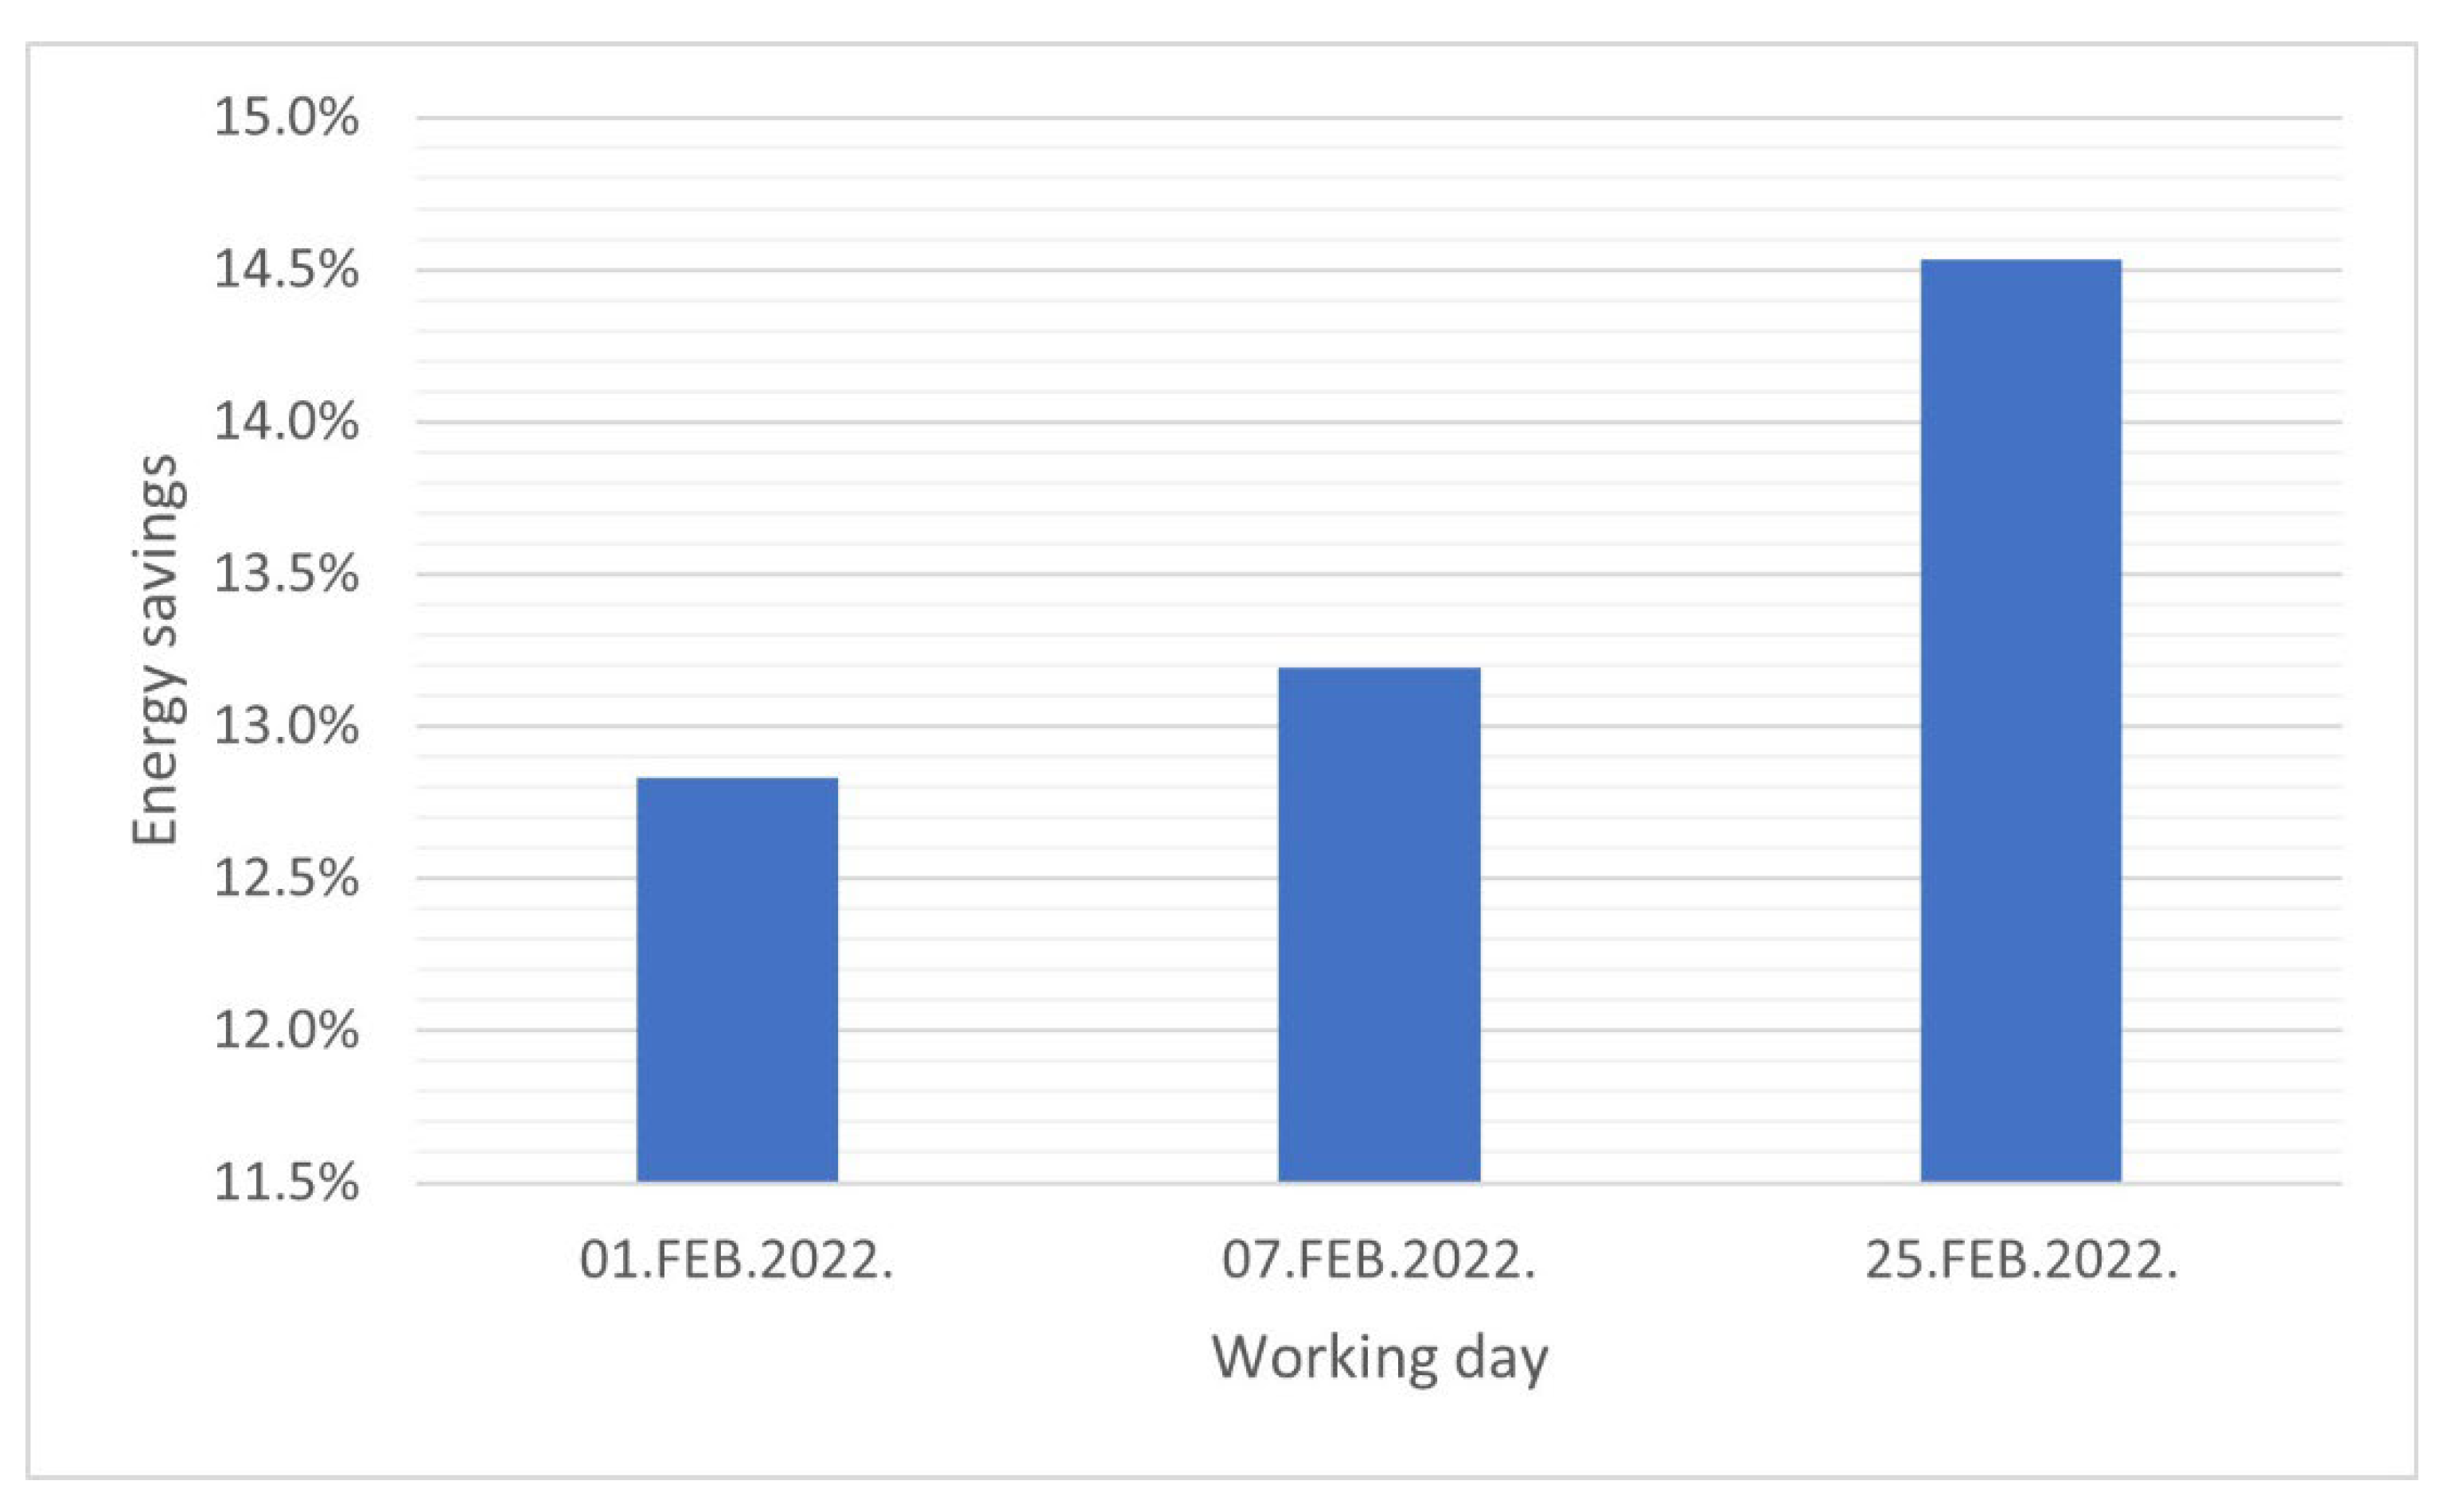
The results of the simulation study enable comparison of the forklifts’ energy consumption in performing inbound docking operations in two scenarios (empirical vs. optimal dock door allocation) and quantification of the reduction achieved by optimizing the inbound dock door allocation, as the main KPI in this research. Across the working days (1, 7 and 25 February 2022.), the following reductions in the forklifts’ energy consumption were recorded: 12.8%, 13.2% and 14.5%, as shown in
Figure 9. The average reduction achieved in the sample (the three working days) equals 13.5%.
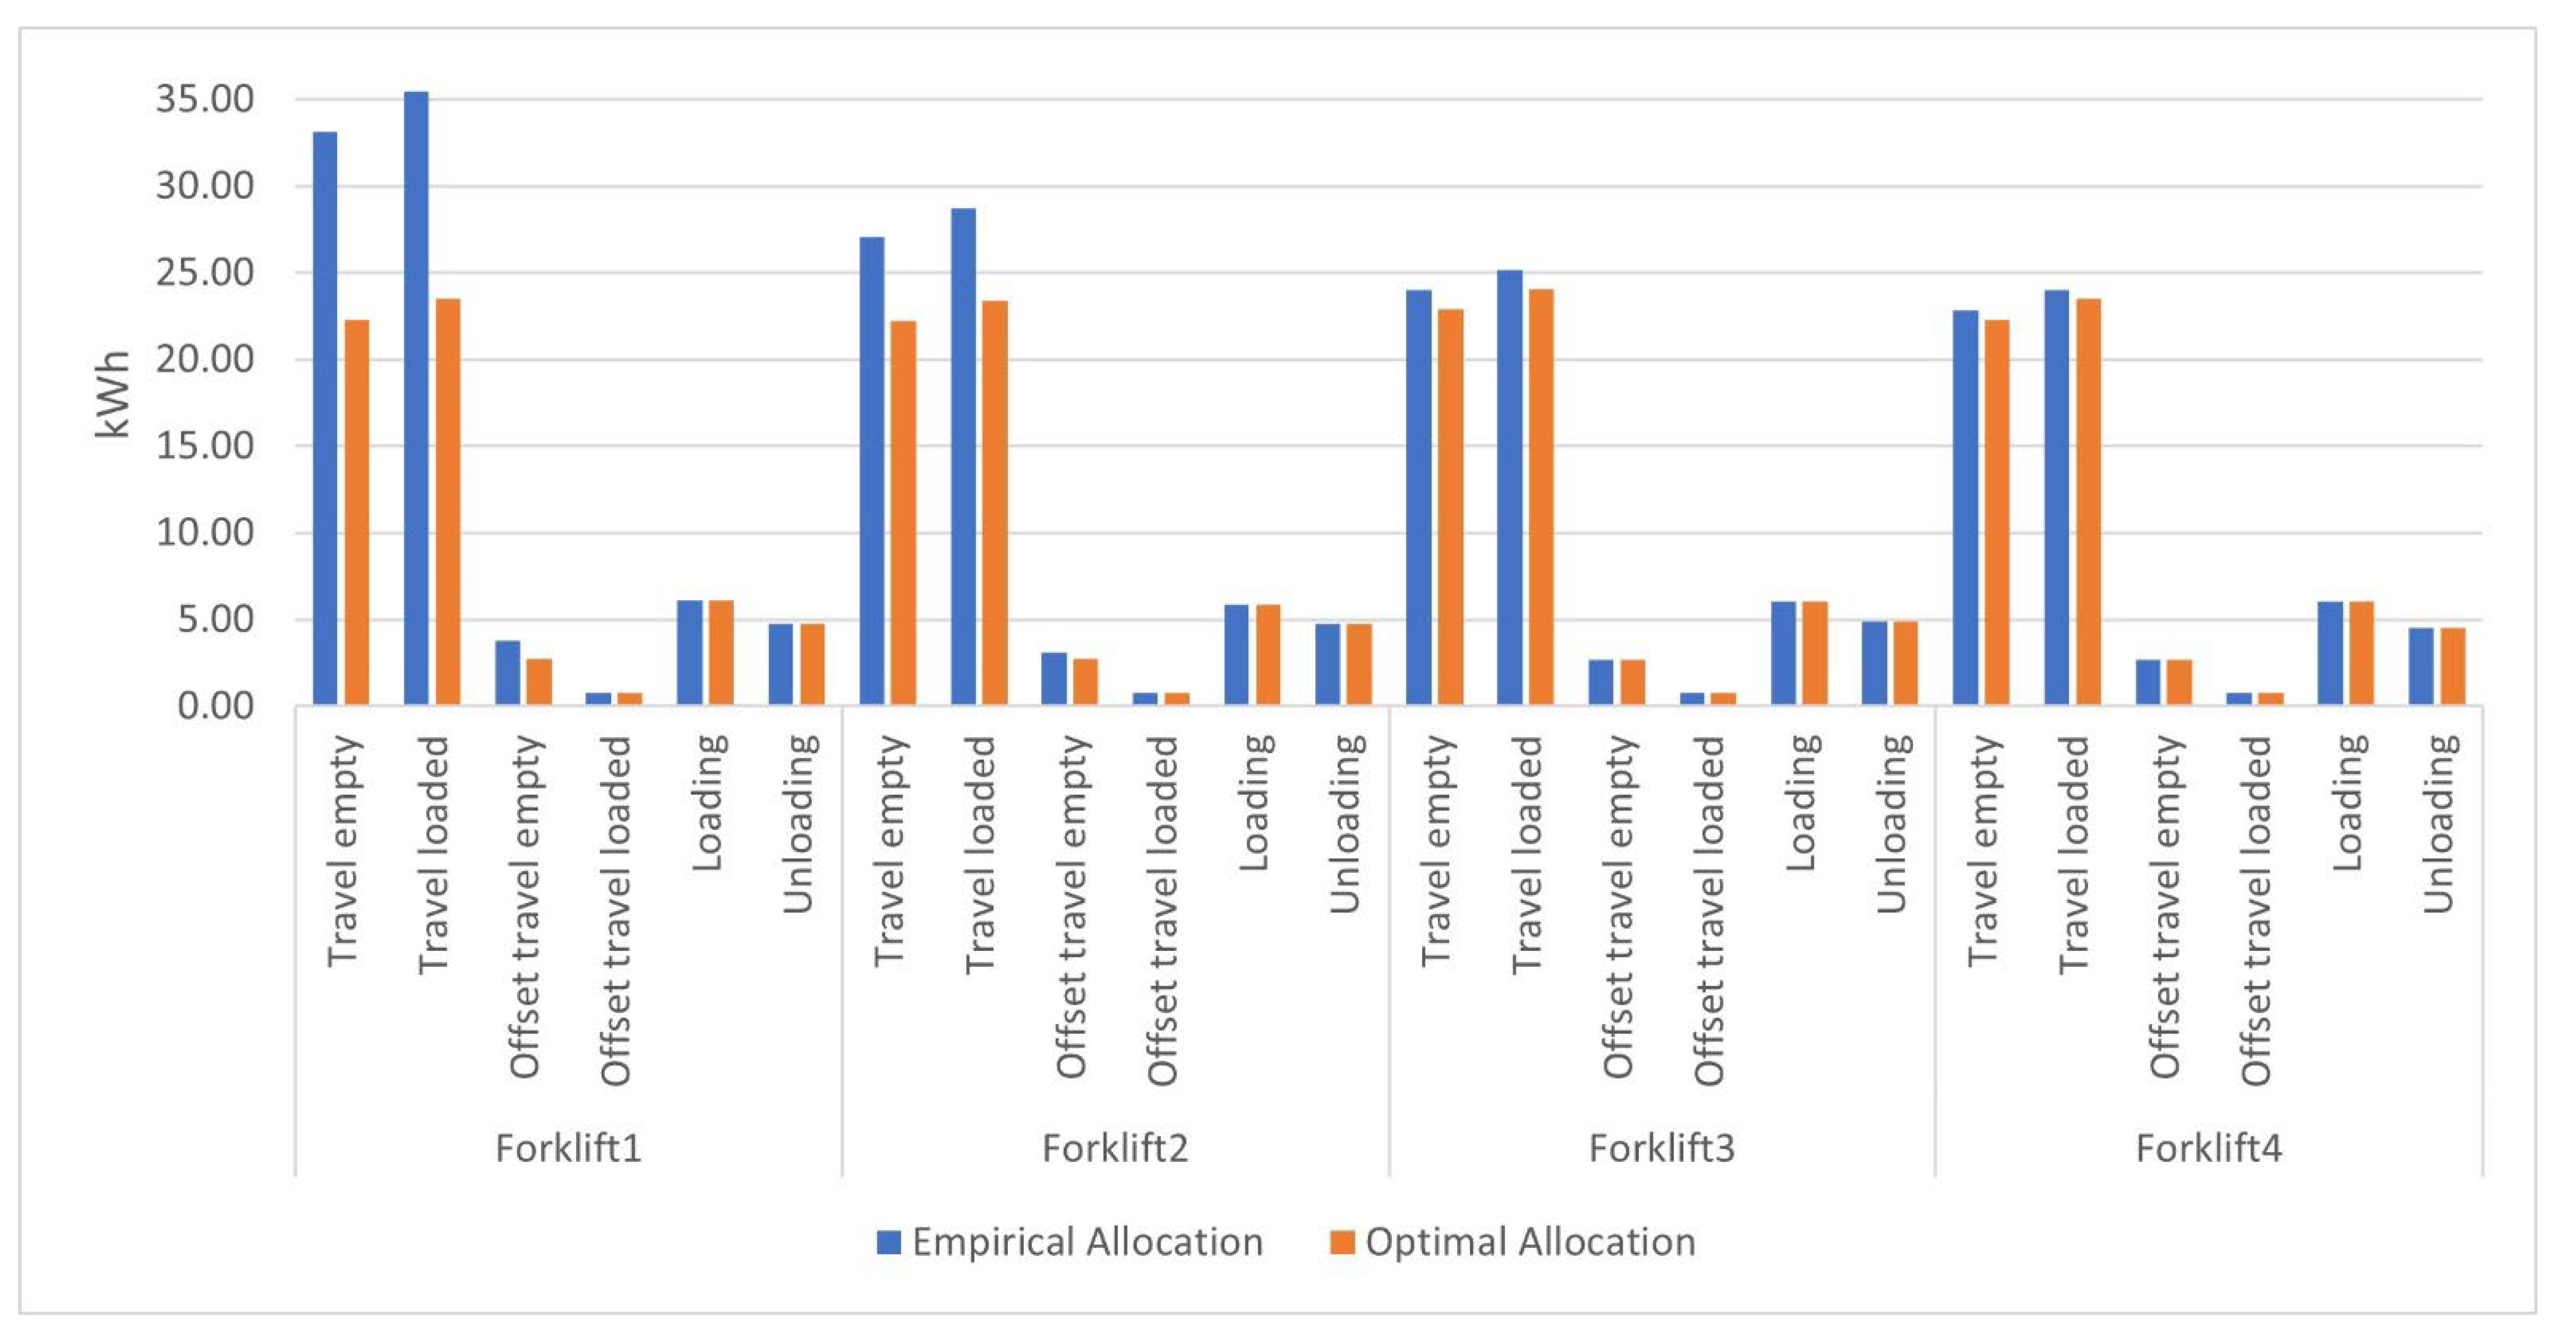
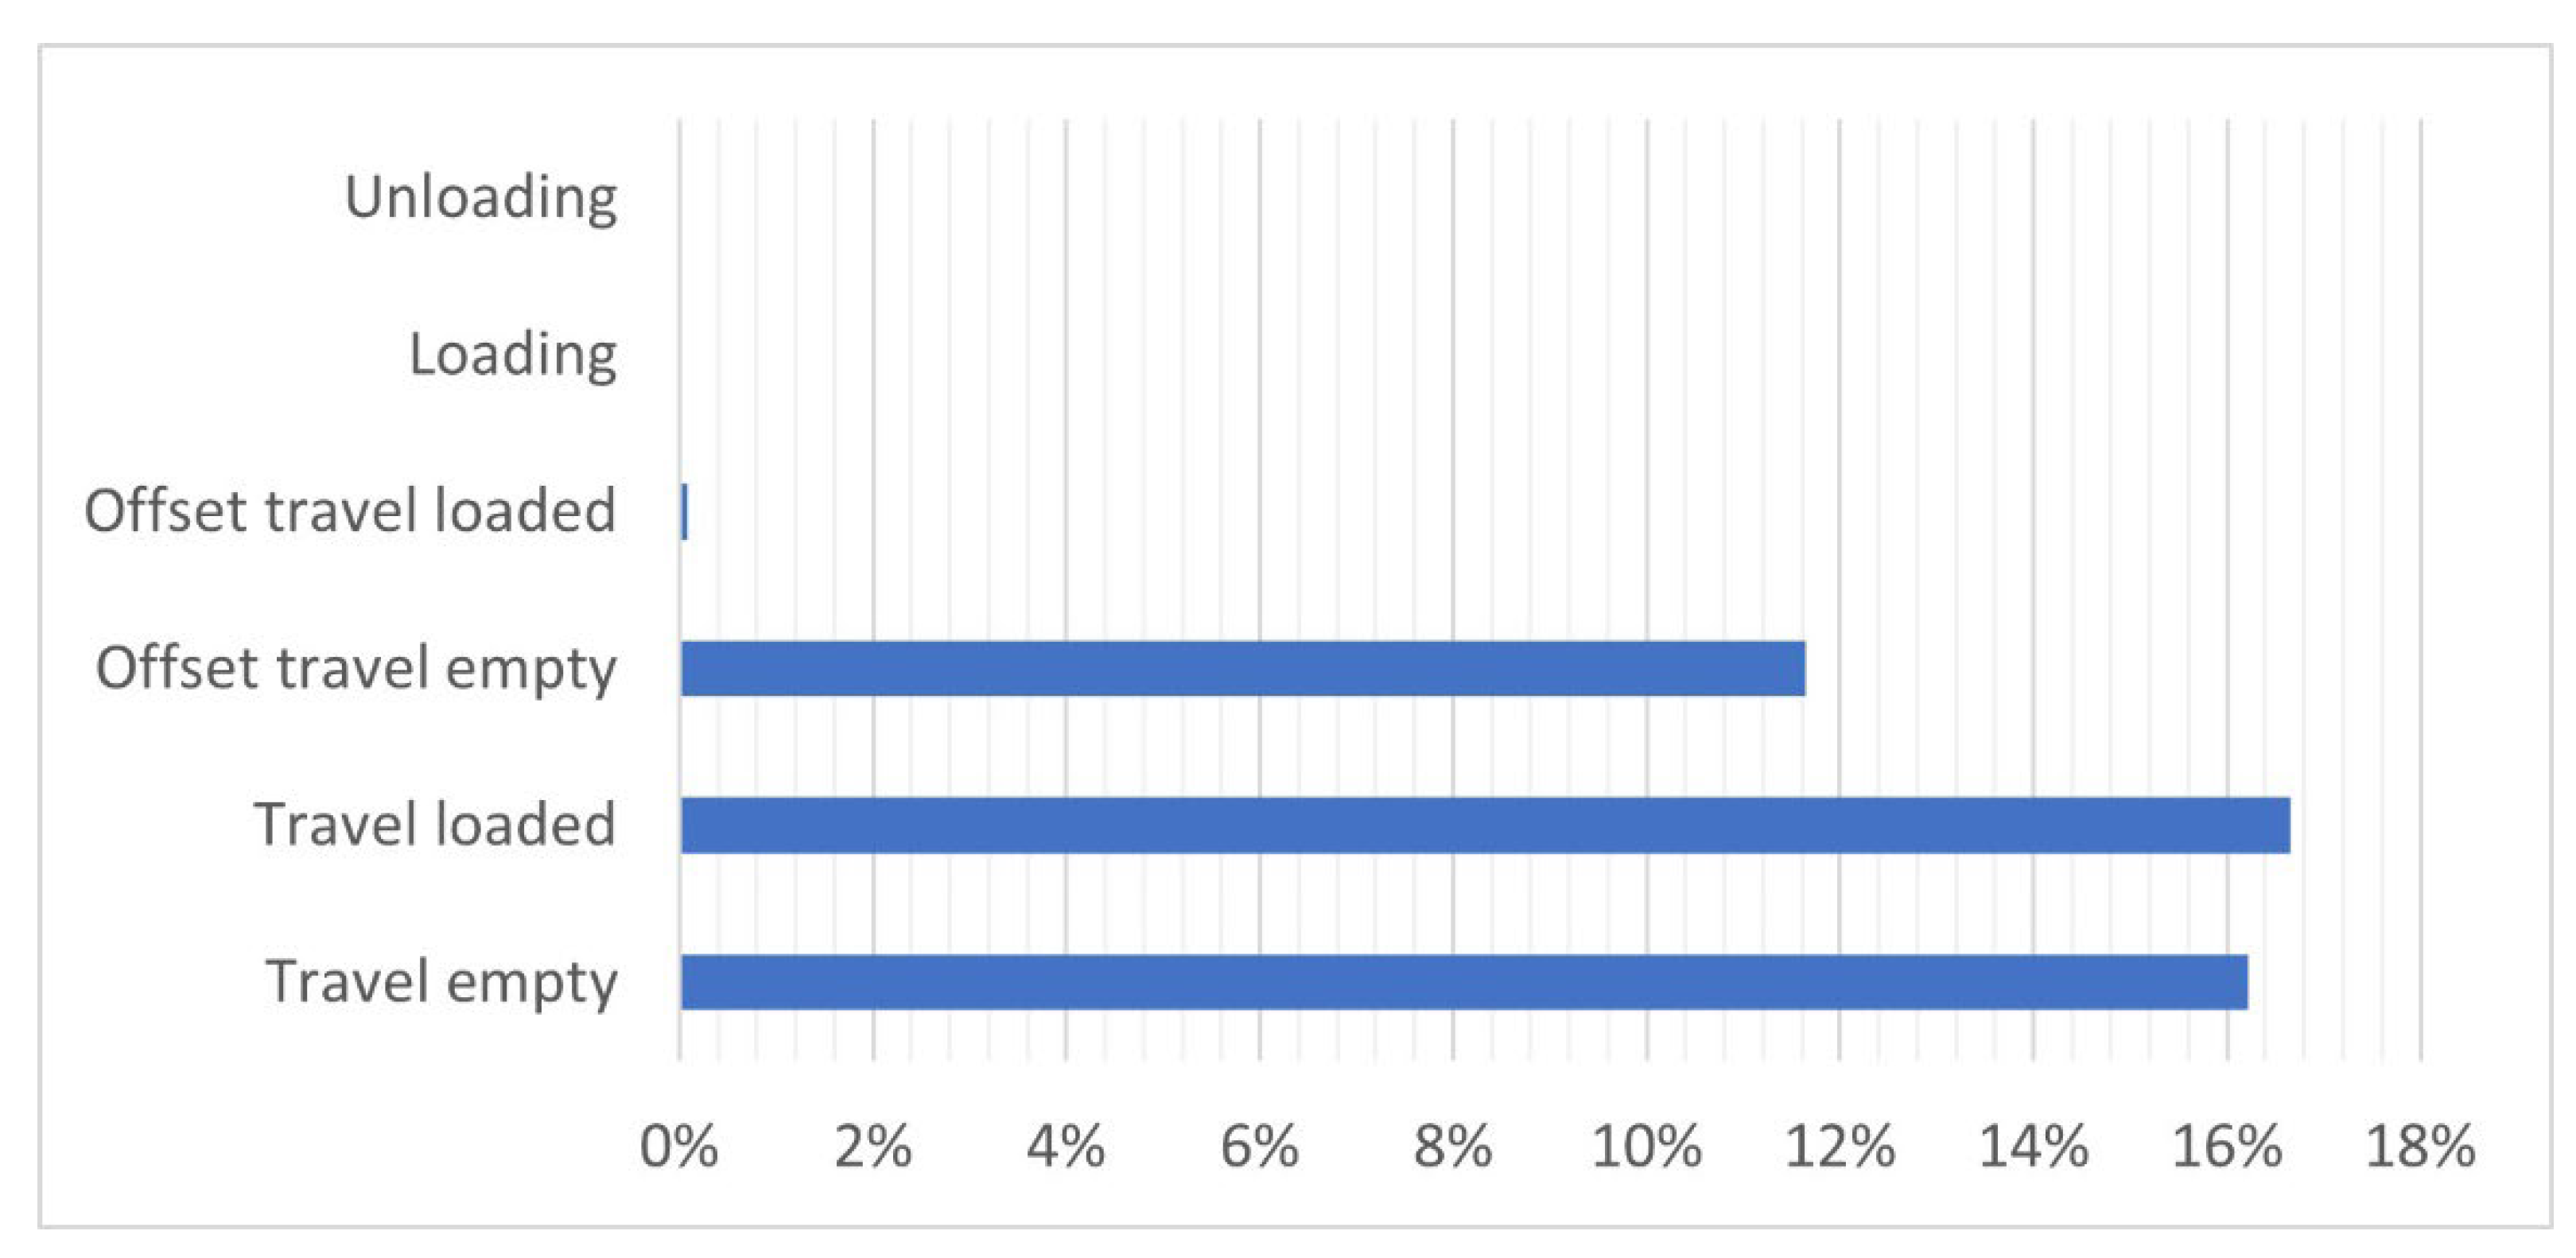
The average reduction in the forklifts’ energy consumption (13.5%) does not correspond with the average decrease in the objective function value (14.5%), because each inbound docking operation is not equally affected by the optimization (cf.
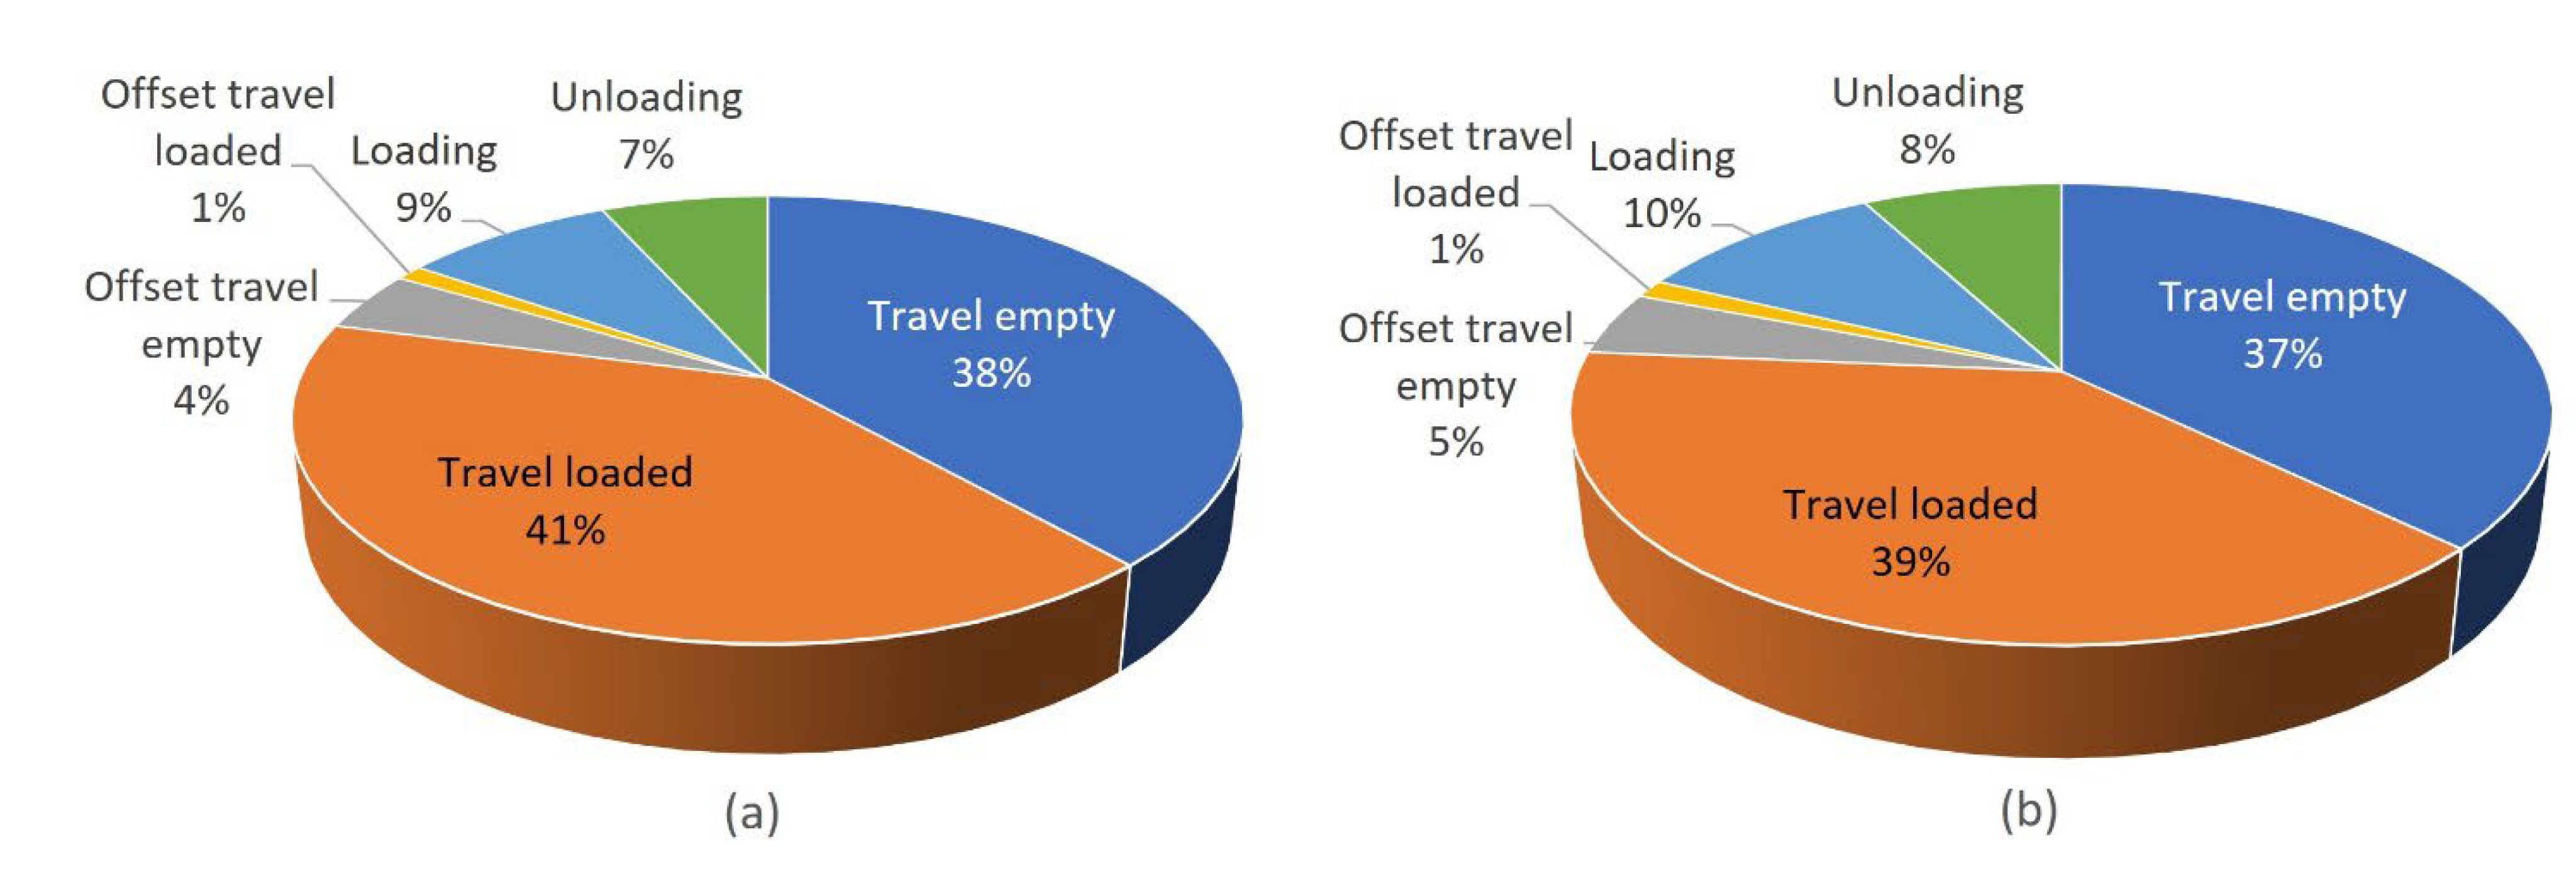
Figure 7). Additionally, the shares of particular docking operations in the total energy consumption are different (cf.
Figure 6).
To obtain more accurate results, future research should include a bigger sample and perhaps consider the possibilities of energy savings by optimizing other sections of the distribution center, such as cross-docking or outbound docking operations.
5. Conclusions
Applying a business policy oriented towards sustainability and minimizing environmental impact while developing competitive advantages makes companies more focused on the possibilities for reducing energy consumption when performing their activities. We proposed a solution for reducing the energy consumption of electric forklifts in performing docking operations by optimizing inbound dock door allocation.
The proposed solution enables a reduction in the quantity of work employed in performing inbound docking operations, which results in savings in the energy consumption of the forklifts. The energy savings were quantified in kWh using the FlexSim simulation model in a sample of three working days: 1, 7 and 25 February 2022. The average energy saving achieved across the time windows in the a.m. working days, determined by comparing the forklifts’ energy consumption in two scenarios (empirical dock door allocation vs. optimal dock door allocation) was 13.5%.
Companies that have not encountered difficulties in meeting their logistics KPIs may be reluctant to pay more attention to the optimization of their logistics processes, or to the possibilities of the energy savings that could be achieved thereof. Therefore, the intended contribution of this paper is not limited to outlining the possibility of achieving energy savings in performing inbound docking operations, but also aims to draw the attention of more researchers and companies to the possibilities of raising the effectiveness and energy efficiency of logistics processes.
In this research we also showed that energy savings can be achieved by optimizing logistics processes, which may not necessarily require investments in infrastructure or additional equipment. The proposed solution may inspire research into similar possibilities in some other logistics processes that could easily be adopted by companies.


