Article

Thermal Performance Evaluation of Window Shutters for Residential Buildings: A Case Study of Abu Dhabi, UAE

by
Abdullah Khalid Abdullah
,
Abeer Darsaleh
,
Shaimaa Abdelbaqi
and
Maatouk Khoukhi
*
College of Engineering, United Arab Emirates University, Al Ain 15551, United Arab Emirates
*
Author to whom correspondence should be addressed.
Energies 2022, 15(16), 5858; https://doi.org/10.3390/en15165858
Submission received: 25 June 2022 / Revised: 25 July 2022 / Accepted: 28 July 2022 / Published: 12 August 2022
(This article belongs to the Special Issue Energy Efficiency of the Buildings)

Abstract

:
The research is aimed at comparing residential building windows’ thermal performance with and without thermal shutters, and at examining thermal shutters’ performance upon being insulated with various types of insulation, glares, outside temperatures, and solar radiation. As an example, one case study based out of the UAE is chosen, covering the status of the housing typology and traits of building energy consumption. The study uses the primary tool of computer simulation software “DesignBuilder” to examine the impact of window shutters design on energy consumption and environmental impact. It was found that the usage of conventional insulating materials within the shutters is sufficient for the house to attain a reduction in heat gain of up to 50%. Furthermore, the application of the rolling shutters with analyzed control strategies recorded a potential reduction in equivalent CO2 emissions level, up to 15%, which would decrease the environmental burden on a national level. The simulations have shown high insulating materials did not differ much in the reduction in energy when running a simulation for a whole unit of housing rather than experimenting a window unit separably as reviewed in the literature. The findings can be applicable to other regions with similar climatic conditions and cultural constraints, such as those of the Middle East and the GCC countries.

Graphical Abstract

1. Introduction

Buildings’ energy consumption represents almost 40% of the worldwide primary energy resources consumption [1]. Hence, in the past decades, the energy performance of buildings has elicited growing attention from researchers, the government, and non-governmental organizations to enhance energy conservation. Many researchers suggest that the energy performance of buildings can help prevent global climate change, by focusing on increasing the number of buildings that are energy-efficient [2,3]. Furthermore, technological interventions at the operational stage, coupled with the community awareness concerning energy consumption, as well as the applicable standards and regulations, will significantly lower the building sector’s overall energy consumption [1,4].
Consumption of building energy linked with residential buildings has elicited scholarly attention worldwide [5]. Middle Eastern nations are confronting complex scenarios, including the depletion of natural resources. As per estimates, residential buildings in Gulf countries have been reported to account for approximately 48% of electricity usage [6,7]. The extreme weather conditions in these nations that need high cooling energy, coupled with the fast-paced economic/demographic growth, have increased energy consumption. The UAE’s electrical consumption was nearly 127,000 gigawatt-hours (GWh) in 2017, making the country one of the highest consumers per capita globally [8]. Moreover, based on current consumption, Saudi Arabia will require nearly 120 GW to provide electricity to the entire housing sector by 2050. In these nations, buildings account for a significant part of energy consumption [9]. The global energy consumption per capita per nation reported by The United Nations World Water Development [10] shows that middle countries’ annual consumption per person is 44 to 73 Watts. As per the nations’ ranking based on energy consumption, except Yemen, the Middle East region is classified into medium-to-high-energy consumers per capita, which denotes a diminished execution of strategic plans towards sustainability. Based on this viewpoint, most countries in the Middle East, including all GCC countries, entail the same energy consumption patterns involving high energy use and fewer energy standards, as shown in Table 1. However, the execution of such standards in all countries in the Middle East region varies based on their economic and political status.
Table 1 shows that between 2012 and 2020, the GCC countries’ energy consumption has enhanced by 5.4% to 6.0% per annum, while the recorded worldwide average is 2.2%. Hence, in the absence of a domestic building energy strategy, electricity demand will continue to grow. Therefore, the energy sector will soon be unable to satisfy the increasing energy demands if these issues remain unresolved.
Notably, energy consumption is nearly doubled within 20 years [11]). Hence, there is a need to develop a strategy for a sustainable construction sector. There is a need to promote building energy efficiency and develop energy performance criteria to overcome this problem. Another significantly correlated issue is the energy source. In 2018, most electrical energy generated (98% of the overall generated electricity) was sourced from natural gas [12]. Similarly, oil is the main source of energy in GCC countries. This anticipated high demand for fossil fuel will pressurize global energy strategies because the Middle East is one of the biggest oil producers globally. Since the Middle East’s demography is mostly similar, countries in the region will witness growing energy demand in a similar manner, especially for housing purposes.
The burning of fossil fuels to produce energy is one of the main driver factors for the release of greenhouse gas emissions (GHG) that causes and contribute to global warming [13,14]. UAE is considered one of the largest emitters of CO2 as ranked by the International Energy Agency (IEA) [15], in the beginning of the second decade of the new century, it was estimated that UAE emits 18 ton of CO2 per capita per year [14]. There are multiple potential effects of climate change that can be expected, as noted by Abu Dhabi Quality and Conformity Council, such as sea-level rise, coastal flooding, increased salinity and temperature of the ocean, and coastal aquifers. Further changes can be: impacts on the marine environment, heat wave/heat stress, and built-environment impacts, while more extreme weather events, such as droughts and dust storms are of increased risk possibility [16].

1.1. Factors Affecting the Buildings’ Energy Performance

Numerous studies have discussed the factors that affect the buildings’ energy performance [17,18,19,20], some of which can be controlled. Examples include shape, building’s technical systems, orientation, and building façade.
The mechanical and electrical systems within the building are known to be the main causes of increased energy consumption, it is possible to keep the buildings comfortable while using a system which entails lower utilization of purchased energy, such as natural gas and electricity [21]. Such systems can be heat pumps providing air-conditioning, heat recovery ventilators, radiant heating, as well as highly efficient electric lighting. Several energy-producing systems can form part of active systems. Building automation, high-efficiency appliances, drain water heat recovery, electro-mobility, on-demand hot water, greywater re-use, reversible ceiling fans, and solar thermal energy [22].
The effect of shading either the passive or the active on the heat gain through the window is one of the most critical elements affecting the energy performance of buildings. Taken into consideration the placement of the shading systems, the external shading were reported to be of higher performance in comparison to the internal systems [23]. The adequate window-to-wall ratio can potentially lower reduce energy consumption. However, the importance of daylighting and the building’s design could affect the element of heat gain. Hernandez et al. [24] aimed to achieve optimum visual comfort and energy consumption in an experimental study for an office building of which had a high percentage of glazing. The study was concluded with reduction in cooling energy up to 68% by utilizing static louvers shading system. The effect of orientation on the visual comfort once shading devices are implemented for a building has been investigated by Evoal et al. [25]. The shading devices were of high reflective properties with control strategies while the glass contained smart dynamic sensors of which changes the optical properties of glass when needed. The author concluded that it is difficult to draw generic recommendations applicable for various buildings, and dynamic simulation and optimization is required to achieve optimum results that would suit each case by itself.

1.2. Effect of Shading on Energy Consumption

Shading in buildings, when applied to the building cavities, plays a key role in controlling the amount of solar radiation transmitted into the building; shading is also more efficient because cavities transmit the greatest amount of solar radiation inside the buildings [18,26]. The shading coefficient measures the building glass’s thermal performance; it is the ratio between a particular fenestration’s solar heat gain to that of a single clear glass that is 3 mm thick [27]. The shading coefficient must be considered when calculating cooling and heating demands [28] as this approach can help achieve significant energy savings throughout the year [29]. However, the measurement of the shading coefficient depends on the angle of incidence of solar rays. As this is not fixed, it is not possible to have a fixed shading coefficient [30]. Several studies have developed reliable calculation techniques for overcoming these challenges [30,31].
Due to the decrease in the heat gain, the advantages of high shading coefficients are more significant in hot climates than in cold climates; it is important for the shading coefficient to be moderate [29]. Factors such as neighboring buildings, vegetation, implementation of shading devices on the façade, or by the building shape itself can provide shading on buildings. Adopting appropriate methods of shading can enhance thermal, as well as visual comfort within the buildings.

1.2.1. Passive Shading System

Passive building design describes designs utilizing natural methods for maintaining indoor thermal comfort throughout long periods [32]. It helps enhance energy efficiency in many ways, such as better thermal comfort, reduced greenhouse gas emissions from operational energy usage, a better quality of indoor air, lower electricity bills, greater affordability, and lower overall societal energy consumption. The following passive design strategies have been identified based on a detailed literature review: building orientation, windows and openings for ventilation, shading devices, and roof and wall insulation. Passive shading systems, however, may also contribute to reduced daylight levels [33]. Additionally, shading impacts buildings differently in terms of energy efficiency depending upon the type of prevalent climate [18].
Another vital element of many energy-efficient strategies of building design is the use of sun control and shading devices. More specifically, buildings employing daylighting or passive solar heating are predicated on how sun control and shading devices are designed. Amid cooler weather, external window shading can help prevent the entry of unwanted solar. Either natural landscaping or building elements, such as awnings, overhangs, and trellises can provide shading. It is also possible for some shading devices, such as light shelves to serve as reflectors; these bounce natural light for daylighting into the interiors of buildings.
How effective shading devices are designed hinges on a particular building façade’s solar orientation. As a case in point, simple fixed overhangs are excellent as shading south-facing windows during hotter seasons when sun angles are high. However, during peak heat gain periods in the summer, it cannot block low afternoon sun from entering west-facing windows. Exterior shading devices, when used in conjunction with clear glass facades, are particularly effective. Having said that, high-performance glazing with very low shading coefficients (SC) are now available. Upon being specified, the new glass products lower the need for exterior shading devices. Thus, a wide range of building components can offer solar control, such as:
  • Exterior elements like overhangs or vertical fins;
  • Horizontal reflecting surfaces called light shelves;
  • Landscape features like hedge rows or mature trees;
  • Low shading coefficient (SC) glass;
  • Interior glare control devices including adjustable louvers or Venetian blinds.

1.2.2. Active Systems

However, the cost of some of these techniques is a challenge, costing between 100 and 1000 USD per square meter, which makes them less affordable than smart glazing types [34]. Unlike other types of glazing, it needs extensive maintenance [35]. Other problems include UV-sensitive (low durability) [36], rapid coloration, as well as heightened surface temperature [37].
Rolling shutters for windows are conventionally utilized for residential building’s façade to reduce heat gain, thermal comfort, and ultimately energy consumption. During the initial part of the 20th century, solar radiation through windows was reduced, and thermal performance was improved by leveraging window protection features, such as shutters. Apart from maintaining privacy, having the shutters extended also helps achieve energy savings. Thermal shutters could improve buildings’ energy efficiency by lowering heat loss via windows. Meanwhile, insulation also plays a key role in maintaining thermal shutters’ overall efficiency. Various types of insulation have been recommended in window shutter applications. Some recommended high thermal resistance, while others advocated the use of low thermal resistance [38,39].
Thermal shutters capable of achieving thermal insulation are capable of lowering heat loss by 60% on conventional windows [32]. Traditional thermal insulation materials would require greater thickness in thermal window shutter applications to achieve the lowest U-value because of their higher thermal conductivity values in the range of 0.020–0.070 W/mK. It may not be necessary to boost the thickness of thermal insulation materials to improve thermal transmission values and achieve smart windows. Thus, it is necessary to examine alternative materials insulation with low U-values and associated costs.
Prior studies looking into the relationship between window shutters and energy performance have mainly aimed to investigate the thermal performance of a single unit fixed for a window. Theoretically, this outcome was valuable, but it does not cover multiple aspects, such as the inclusion of occupancy patterns for different spaces within the building which affects the scheduling of HVAC equipment to achieve thermal comfort, inclusion of other technical systems (lighting and electrical), thus incurring high energy consumption. In addition, the pre-defined control strategies by the users for the active shading system is taken into consideration within this study. This study will test the design as opposed to the entire building. Generally, there is limited scholarly information on such studies and their impact on energy consumption. The main goal of the study is to compare the thermal performance of residential building windows with conventional and non-conventional insulating material. Furthermore, an estimation of greenhouse gas emissions will be conducted to discuss the possible reduction in environmental impact through the utilization of these rolling shutters. One case from the United Arab Emirates is used as an example, including information on the condition of the dwelling type, building energy consumption characteristics, resident habits, and usage patterns.

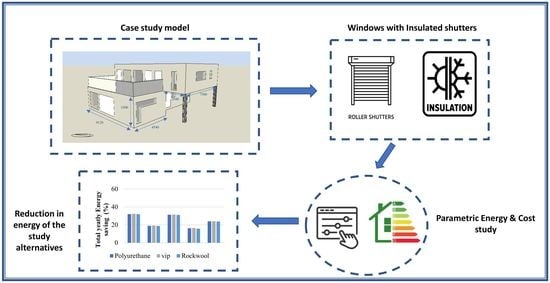
2. Materials and Methods

This research primarily depends on simulating building performance via EnergyPlus 9.4.0.001 software, DesignBuilder V7.0.1.006, Gloucestershire, United Kingdom, to examine the effect of implementing exterior shading devices on energy consumption [40]. DesignBuilder is an hour-by-hour energy simulation program that will also look into the effect of parameters performance of window shutters while evaluating methods for improving it. When designed properly, window shutters can help reduce energy usage by lowering the heat gain.
This paper makes a comparison between low, medium, and high U-values for thermal insulation materials, such as Rockwool, Polyurethane, and Vacuum insulation panels in external thermal window shutters within various window glass scenarios. It investigates the effect of implementing affordable window shutters into the building’s window on the residential building’s energy performance when compared with upgrading the thermal insulation of window shutters and implementing various control strategies, such as solar radiation incident on window, indoor glare index, and outside temperature. The process whereby the research method will be implemented is elucidated below.

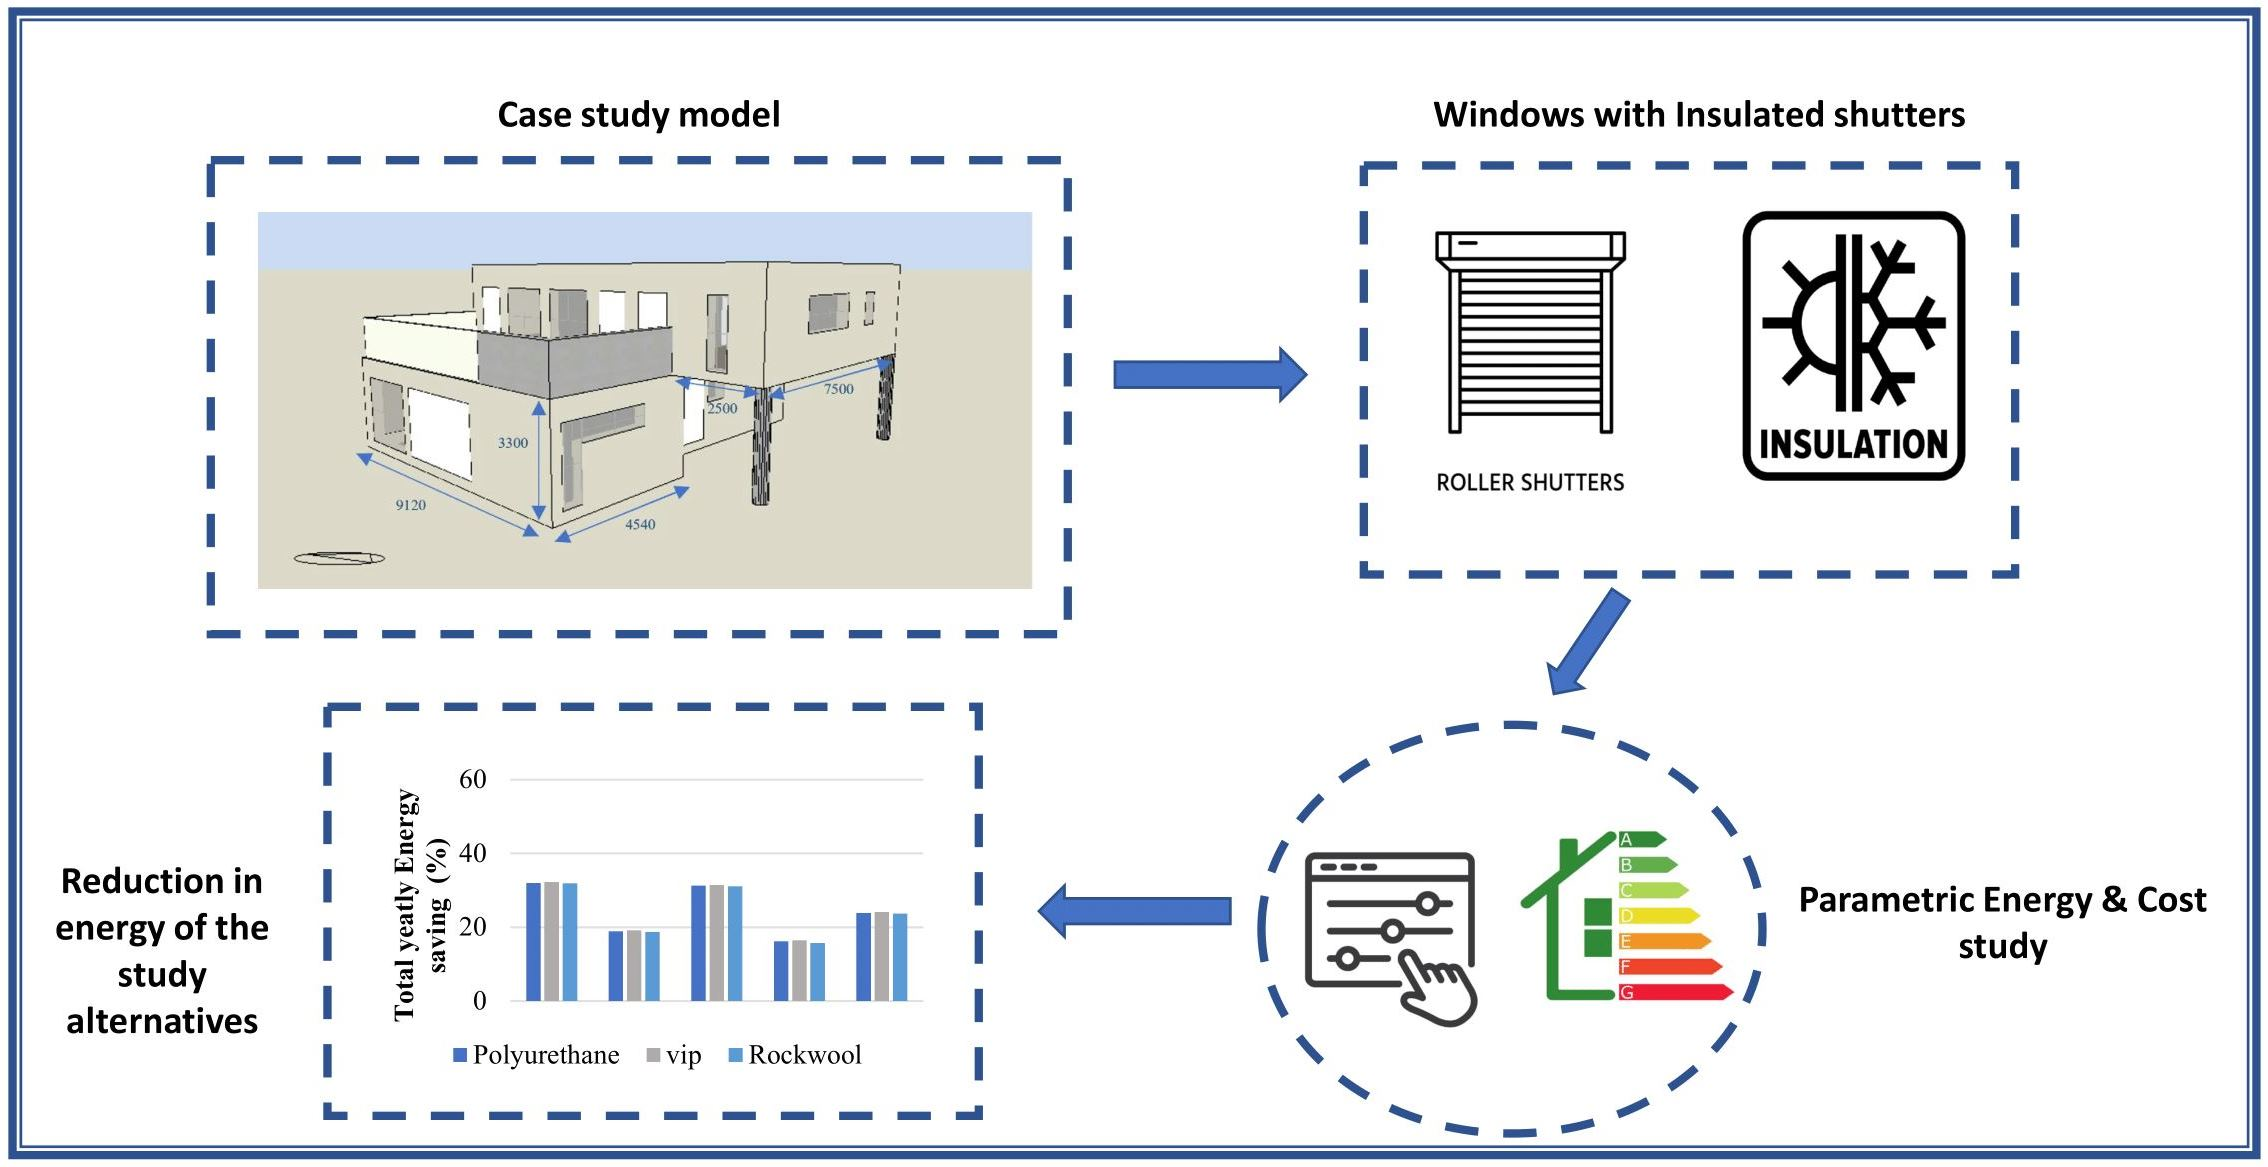
2.1. Building Selection and Description

2.1.1. Building Location

In the UAE (Abu Dhabi city), the building has been chosen on account of unsustainable construction practices across the GCC countries and the unregulated consumption of energy. This resulted in heightened energy consumption per capita. The energy use per capita increase is likely to continue to grow, as has been the case over the past four decades. The peak demand for electricity was reported to be 14.4 GW in 2017 and expected to grow till 24.4 GW by 2024 [41,42]. In relation to sustainability, it demonstrates a rising gap in people’s lives between the past and present.

2.1.2. Building Morphology Type

GCC countries experience high energy consumption in residential buildings. The region’s energy consumption in the residential sector accounts for 48% to 55% of the total energy consumption while in the industrialized countries, this is estimated to be between 30% and 35% [43].
The urban design of selected case study city (Abu Dhabi) allocates the housing in the suburbs while in the city, the majority of the buildings there are high rise building and sky scrapers [44]. The case study chosen to reflect the evolution of housing typology (modern design) in the gulf region which is becoming the norm of the real estate market [45,46].
Studying the type of houses, namely villa, Arabic house, and apartment in relation to energy consumption demonstrates that villa type consumes the majority of the energy with annual consumption that reaches up to 25 MWh followed by Arabic house and apartment types of accommodations, with approximate annual consumption that ranges between 15 and 16 MWh [47].

2.2. Weather Analysis Study in Abu Dhabi

The study examined the weather data of Abu Dhabi city. According to the Köppen–Geiger climate classification, the United Arab Emirates is characterized by a hot desert climate with significant variations in daily and yearly temperatures [46].
The climate consultant software shows that the month of August records the highest temperature of nearly 34.2 °C, while January witnesses the lowest average temperature of 18.2 °C; annually, the temperature variation is 16 °C. When the WeatherSpark data website is used, Abu Dhabi’s perceived humidity shows extreme variations in climate; 29 July is the muggiest day of the year (91%), whereas the least muggy day is January 16 (4%).
As per the aforementioned findings, it is necessary to consider the element of temperature in the cooling design within the numerical model. This is attributed to the fact that during summers, outdoor ambient temperatures exceed 40 °C between the months of May and September. This also underscores the significance of the present study in retrofitting Abu Dhabi’s existing buildings that are not implementing the standardized energy-saving codes to enhance the envelope’s thermal resistance and reduce the energy consumption of buildings.

2.3. Platform Model Description

The numerical model adopts a more abstracted as well as detailed approach to investigate the variables of the window shutters found to have better energy-saving potentials.
The simulation computer software, DesignBuilder is an advanced interface for EnergyPlus which is the primary tool to assess the impact of applying the window shutters on energy consumption. It is a powerful and dependable software tool that has been developed by the U.S. Department of Energy (DOE), the Building Technologies Office (BTO), as well as the OpenStudio. DesignBuilder was selected due to these reasons [40]. It supports integrated solutions for the conditions of different thermal zones’ without assuming that the HVAC system meets the specified zones’ loads. In addition to providing a heat balance-based solution of convective and radiant effects for generating temperature, condensation, as well as thermal comfort calculations, it combines heat and mass transfer and offers various parameters of window shutters. Designbuilder allows you to choose pre-defined templates of each activity that matches the space requirements within the model, to calculate the energy consumption. This includes the following: HVAC system, lighting system, domestic water heating system, and equipment used for each space.

2.3.1. Building Model Description

In stage one, the model is customized in an identical manner to that of a standardized villa. A two-level villa is used in this study. Figure 1 presents a 3D external model of a UAE residential villa.
The building is graphically shown using the graphical user interface of Design-Builder. Meanwhile, energy simulated is bolstered with control optimization setpoints, such as schedule, inside air temp, solar, daylight, outside air temp, and glare. Table 2 shows the descriptions of the building in the context of weather analysis and the window details.

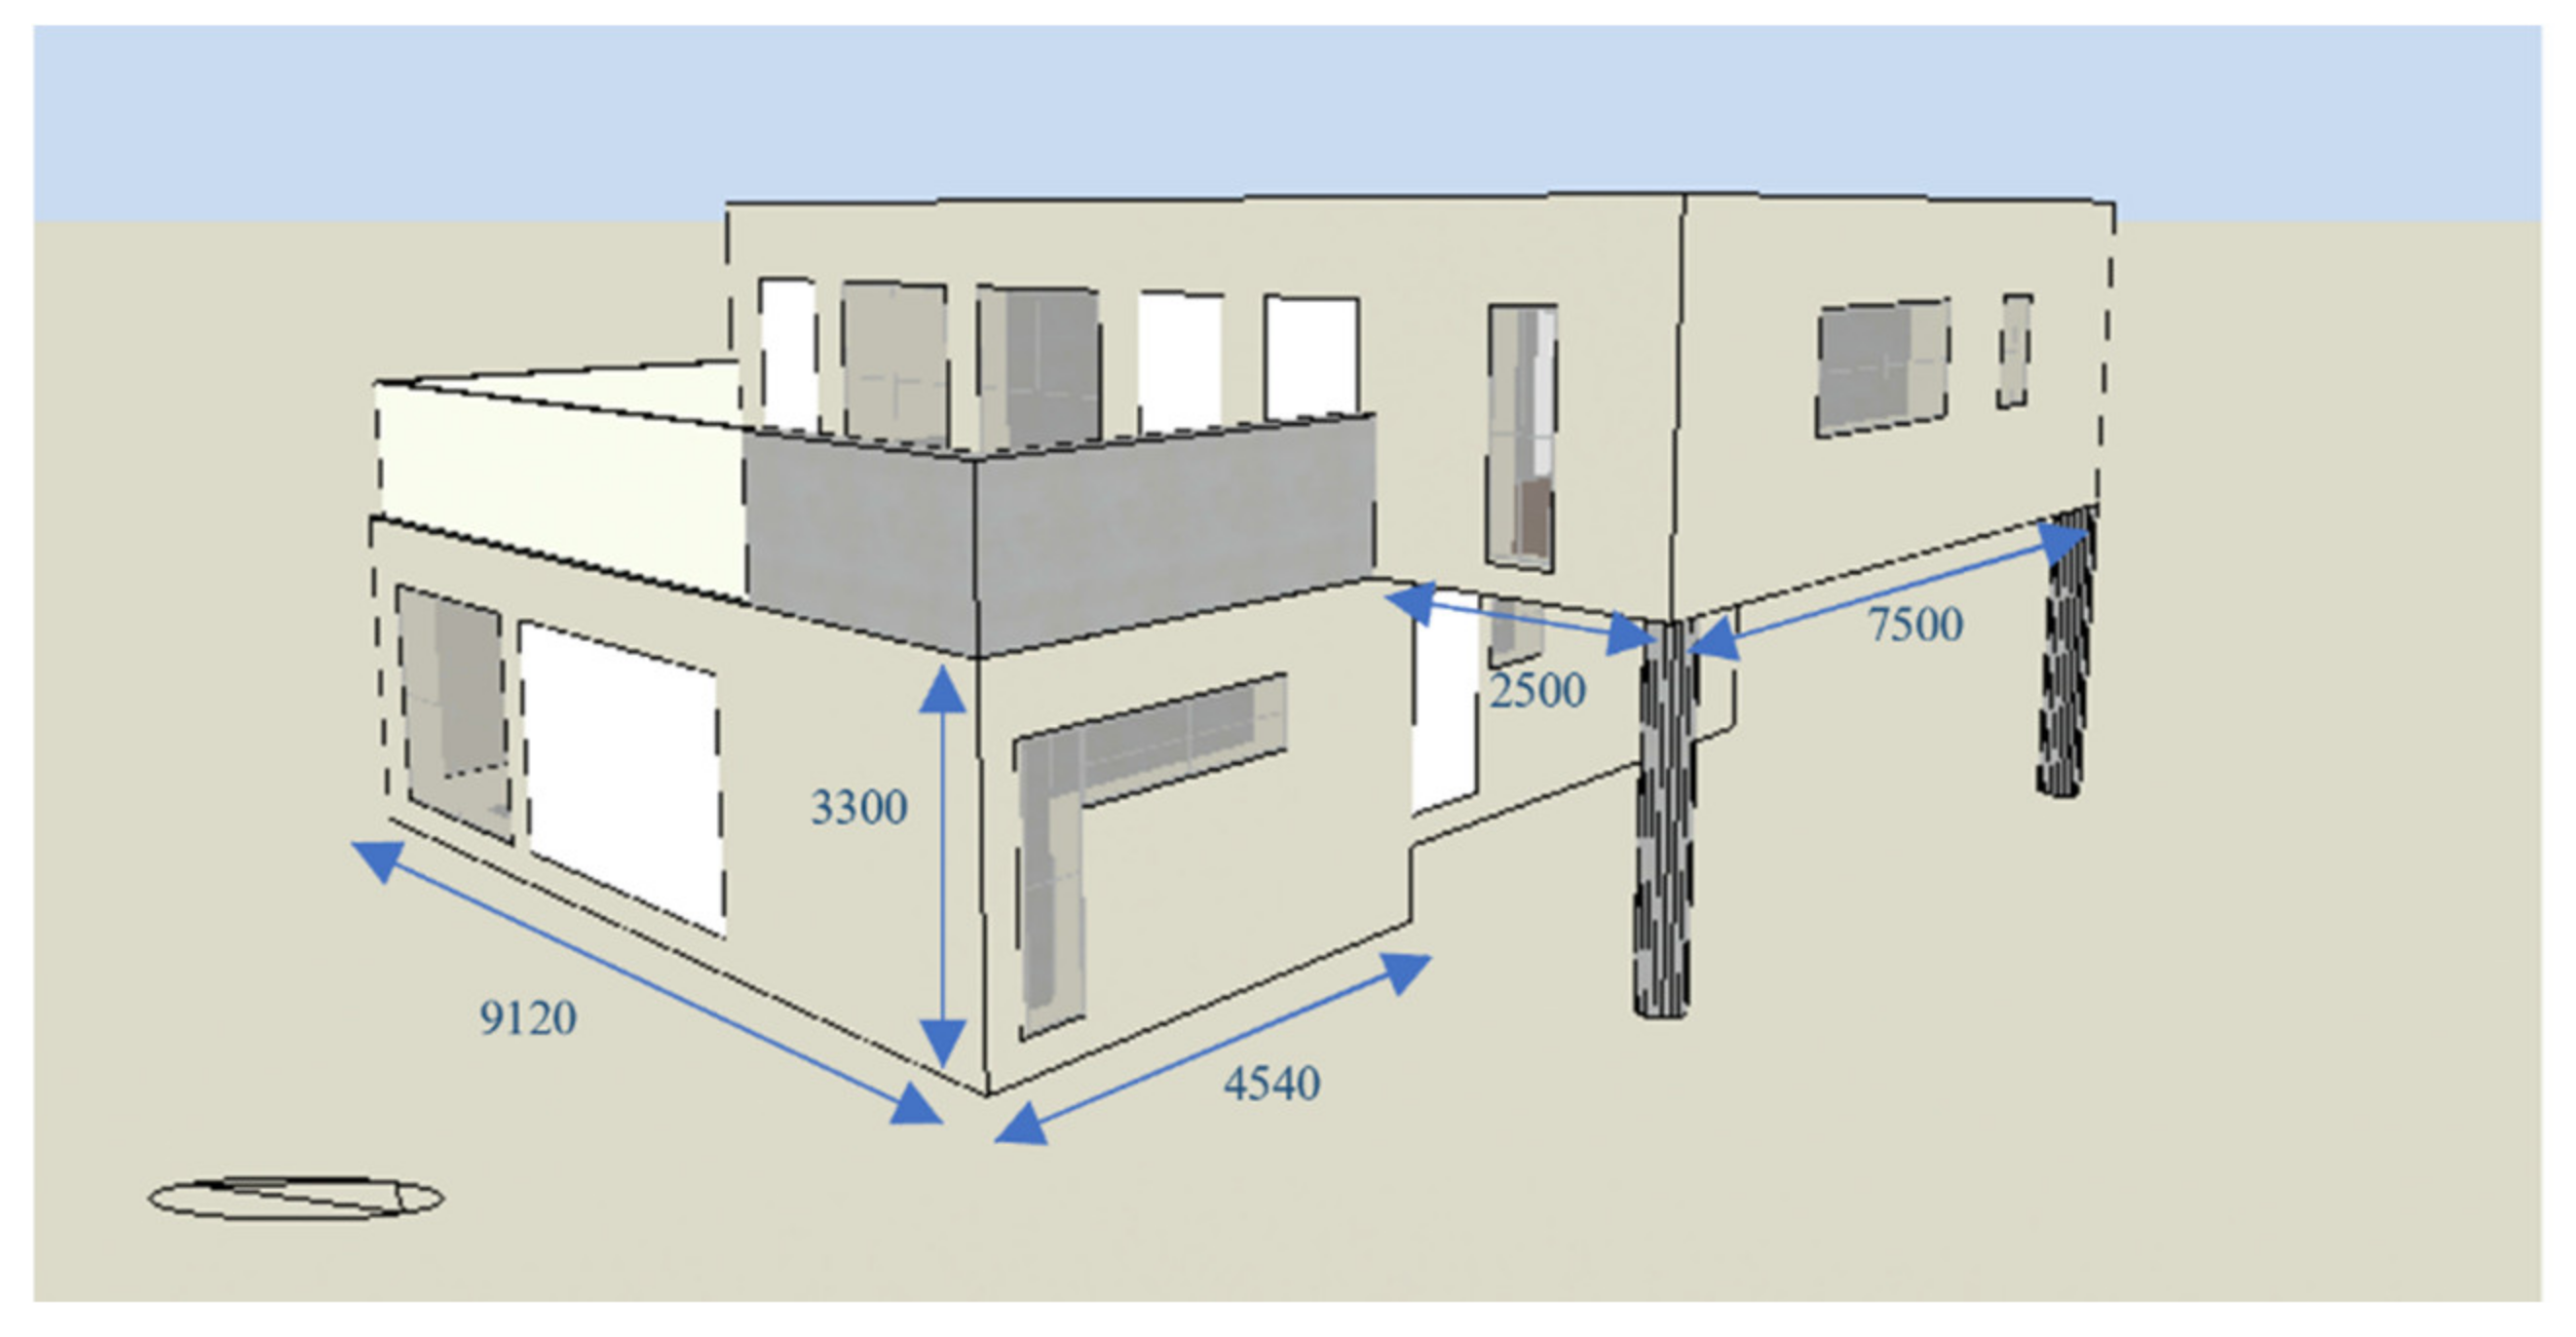
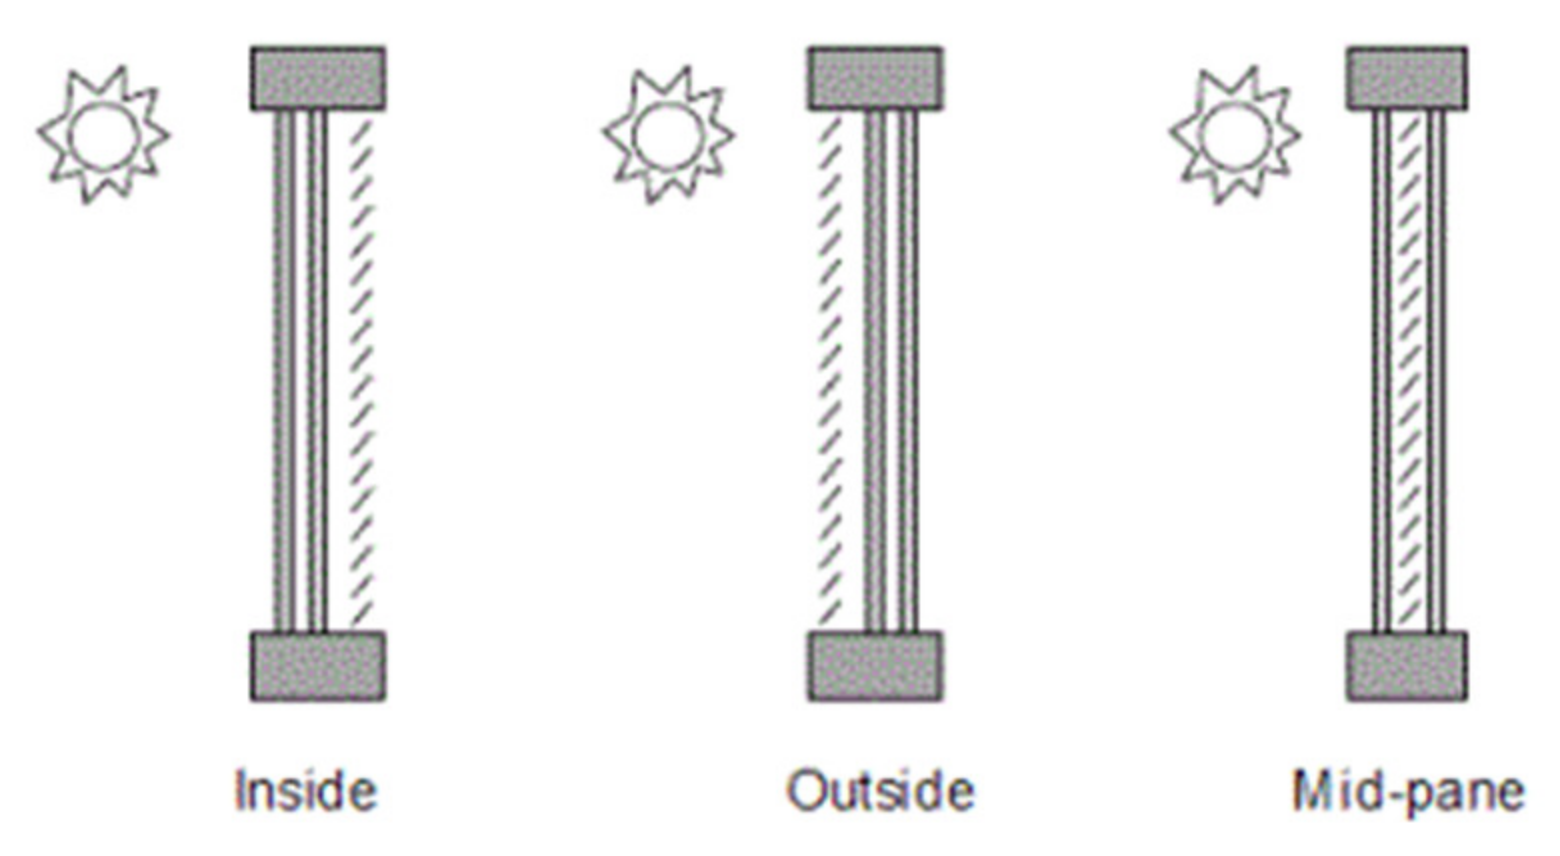
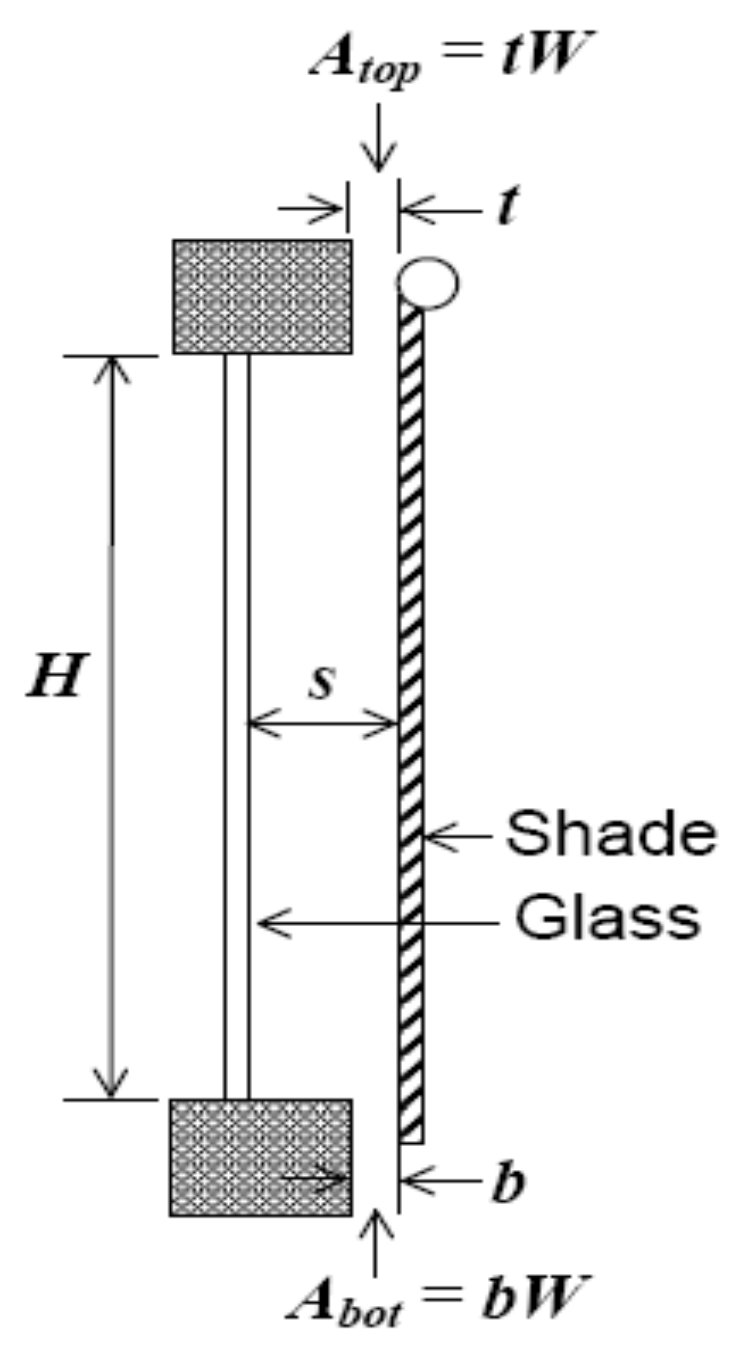
2.3.2. Window Shutter Model Description

A window shutter comprises a set of slats. The shutter with horizontal slats is angled to admit light while blocking direct discomforting sunshine. A window shutter can be configured to be positioned inside or outside of a building/house façade (Figure 2), and exterior shutters, which are used externally. Configurations of windows with the different shading strategies have been examined to ascertain the optimal savings.
The type of shutter utilized for this research is fixed and mainly focused on the exterior rolling shutters (outside the building) to avoid the accumulation of heat between the glass and internal shutters. The mechanism of the selected shutters as to completely cover the window area when the conditions of the control strategy is met (e.g., heat gain, solar intensity, etc.) Figure 3 presents the configuration of the studied rolling window shutters. Table 3 shows the details of the window shutters.
The decline in overall heat gain (in percentage) and energy-saving were analyzed in the findings.
Two methods of evaluation—annual heat gain via the windows and the selected buildings’ total energy consumption—were implemented to evaluate the application of external window shutters.

2.3.3. Impact of Shading Devices on Environmental Impact (Primary Energy Source)

To evaluate the environmental impact in relation to the installation of rolling shutters on the exterior of windows, this study estimates the annual greenhouse gas emissions in the equivalence of CO2 and the possible reduction from applying these devices. First, the building consumption is calculated through the simulation software. Then, the building consumption is converted to source energy consumption (Energy generated from the utility/power plant in kWh) by identifying the related source energy conversion factor. It is worth to note that Abu Dhabi has mainly relied on natural gas as a source energy and gradually eliminated other sources of energy for generation of electricity and water recently in the last couple of years [48]. Finally, the source consumption is multiplied by the generation factor (0.4333) as specified by the local electricity and water authority to predict the amount of CO2 emitted annually (kgCO2eq per kWh) to provide an insight to potential of reduction on a national level [49].

2.4. Evaluation Parameters

Multiple scenarios were set for the analysis of the rolling shades to evaluate their performance within the selected model, the evaluation parameters were as follows:
  • The thermal conductivity of various embedded insulation within the rolling shading shutters. Conventional insulations, such as polyurethane (0.041 W/mK); Rockwool (0.020 W/mK); and non-conventional insulation, such as the vacuum insulation panel (Vip), which has a relatively lower thermal conductivity (0.005–0.008 W/mK);
  • Direct solar irradiance: two points of solar intensity will be set as a control mechanism for the roller shaders to operate within the simulation, a high intensity point (400 W/m2) and relatively lower point (189 W/m2);
  • Indoor glare’s index: a glare index is set for the visual comfort of the spaces, once the sensors or the control of the shade is triggered, the simulation will automatically deploy the window shading, to decrease glare below a specified comfort level. The Unified Glare Index (UGR) was utilized, the range of the index should be from 16 to 19;
  • Shading device location: an alternating parametric analysis on the location (Façade) of the rolling shutter devices will be applied to the model to determine its effect on the performance.

3. Results

3.1. Real Case Simulation

Table 4 shows the base case material selection for each of the building construction elements with its characteristics and the achieved U-value. The base case simulation suggests that the selected building consumes around 31,411 kWh each year.

3.2. Glass Type Effect

For energy saving purposes, five common alternatives for the glass materials type were tested: single glass clear, single reflected tint, double clear, double glass reflected tint, and double glass low e clear. Table 5 presents the yearly heat gain through the window and the total yearly energy consumption.

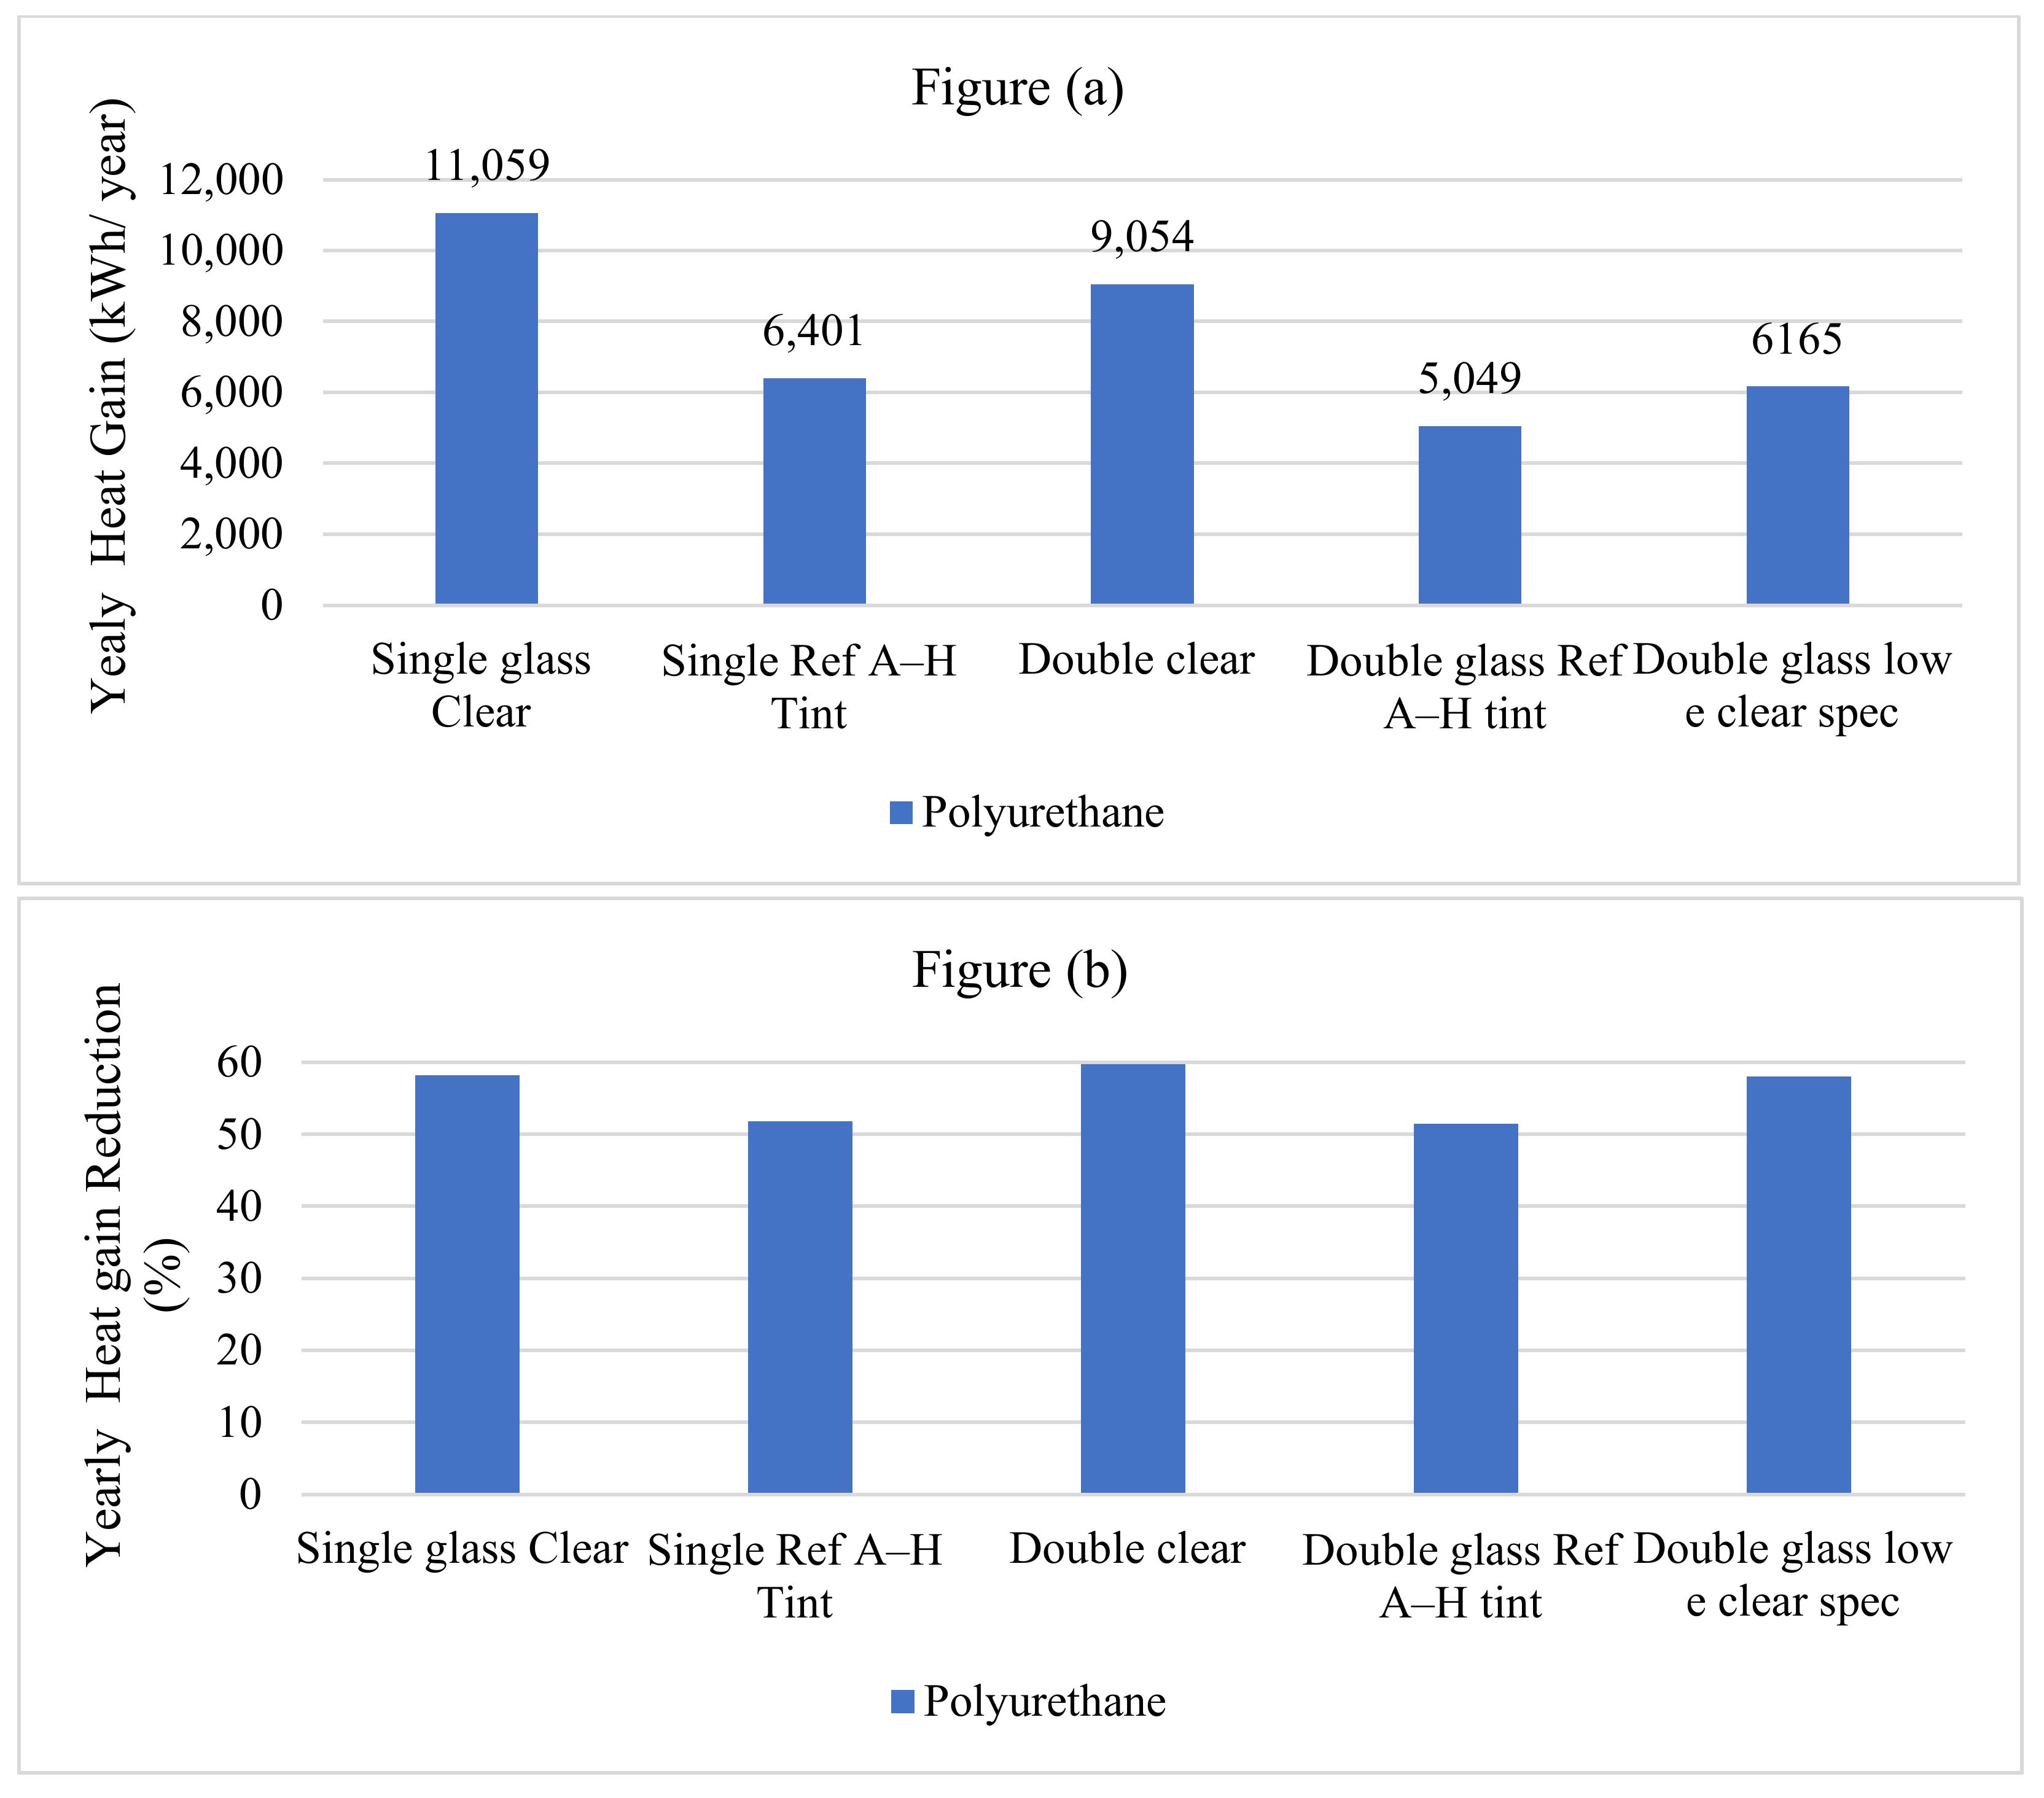
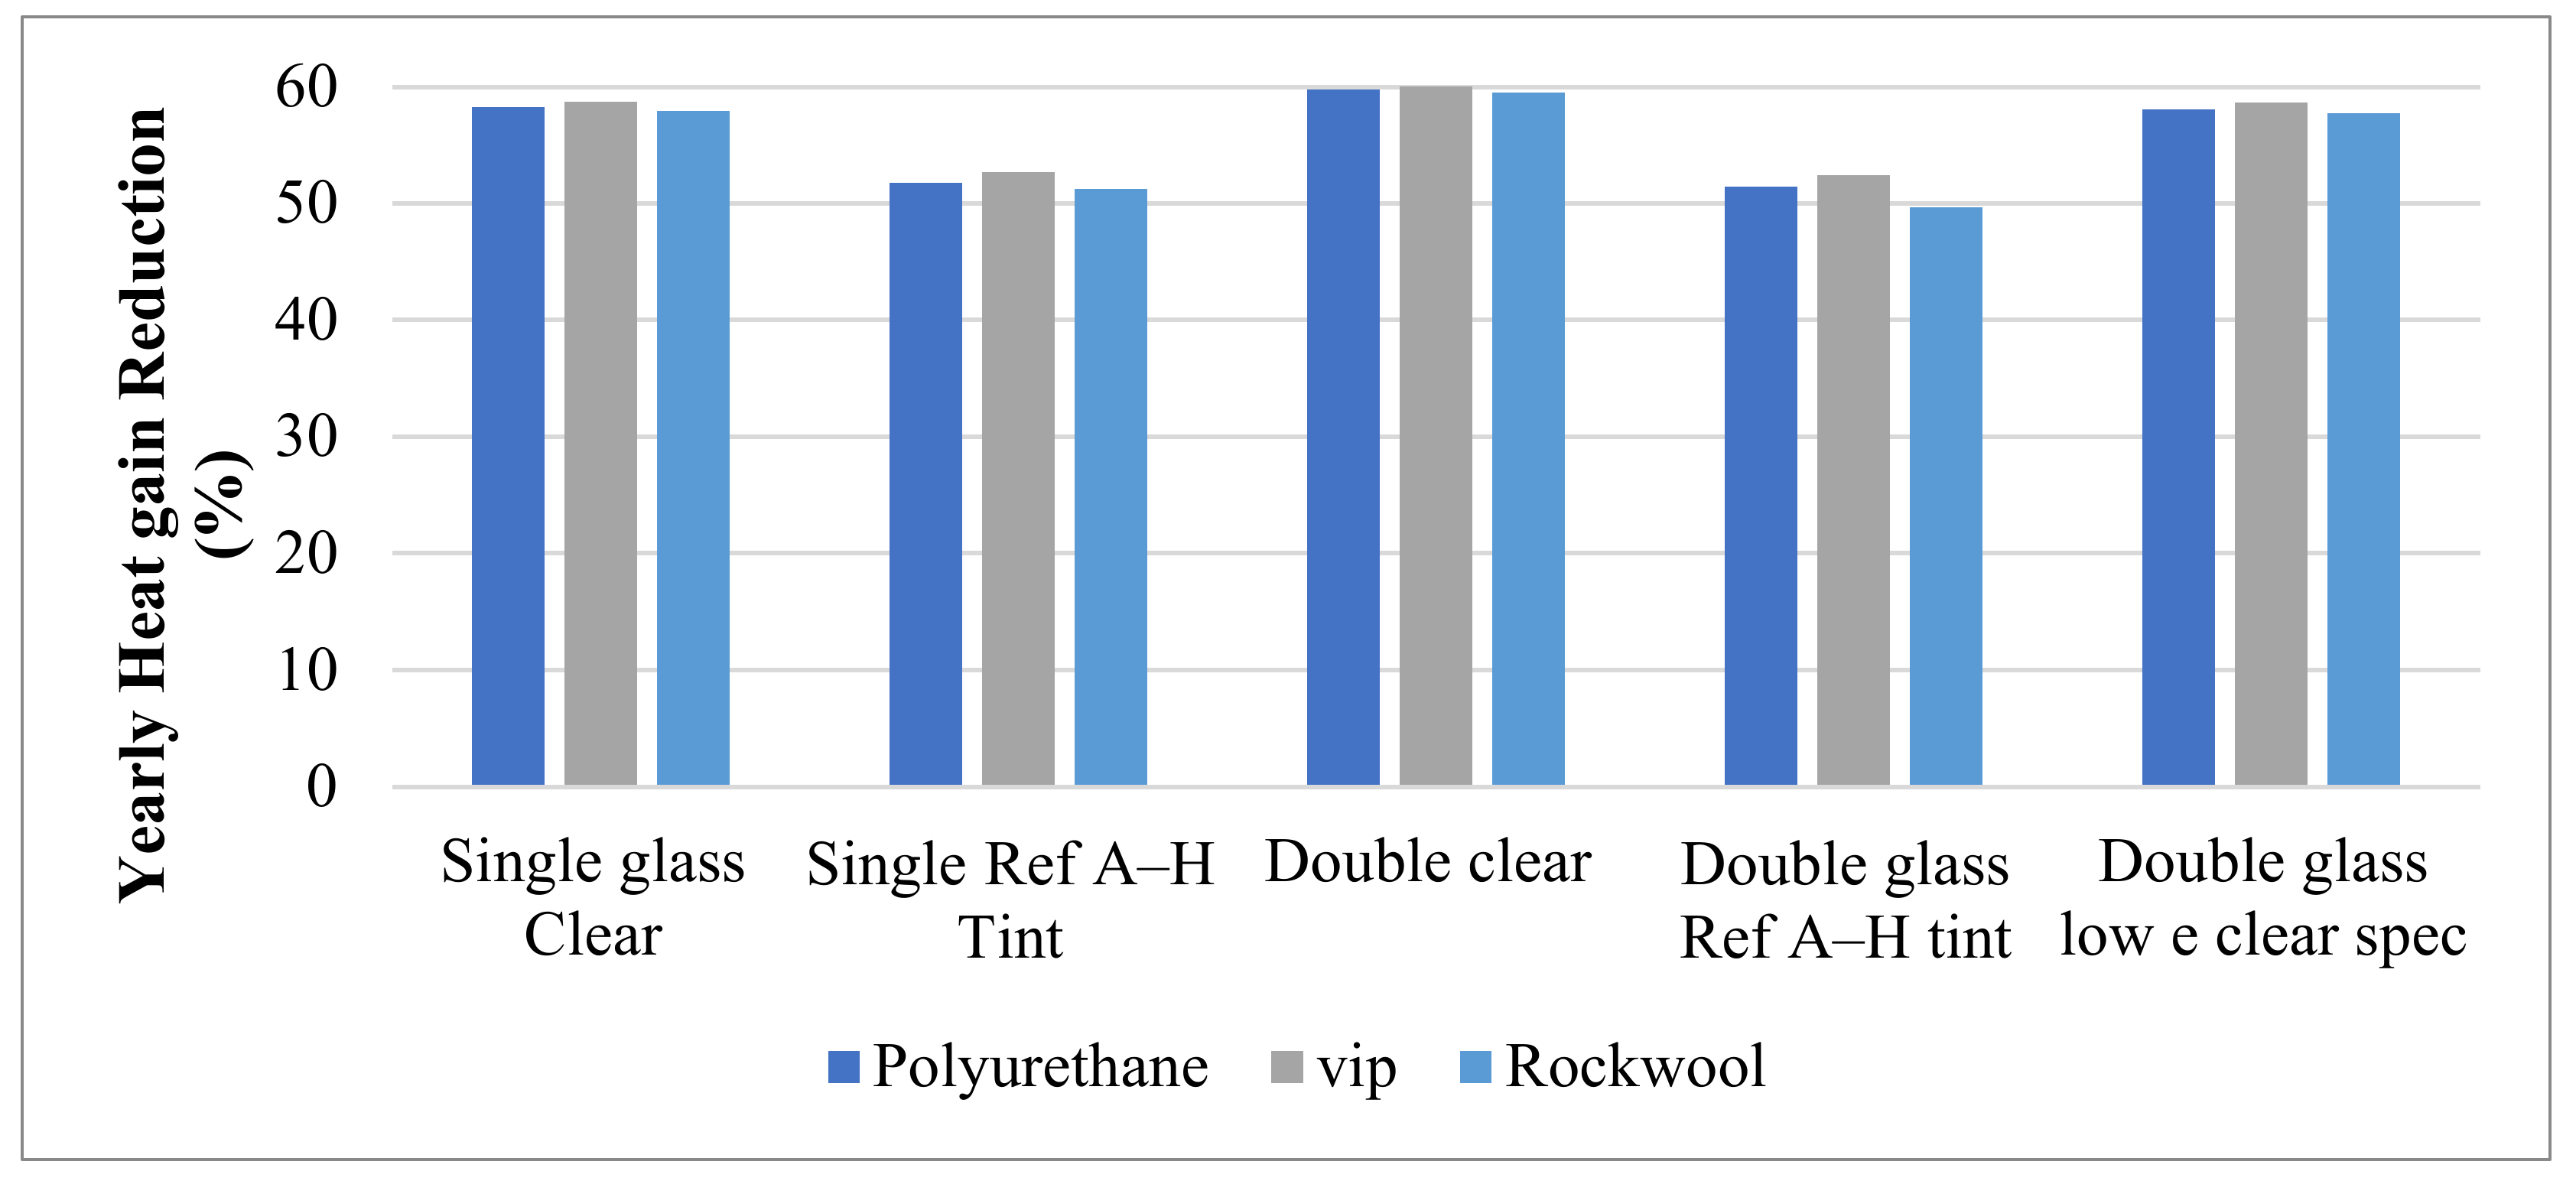
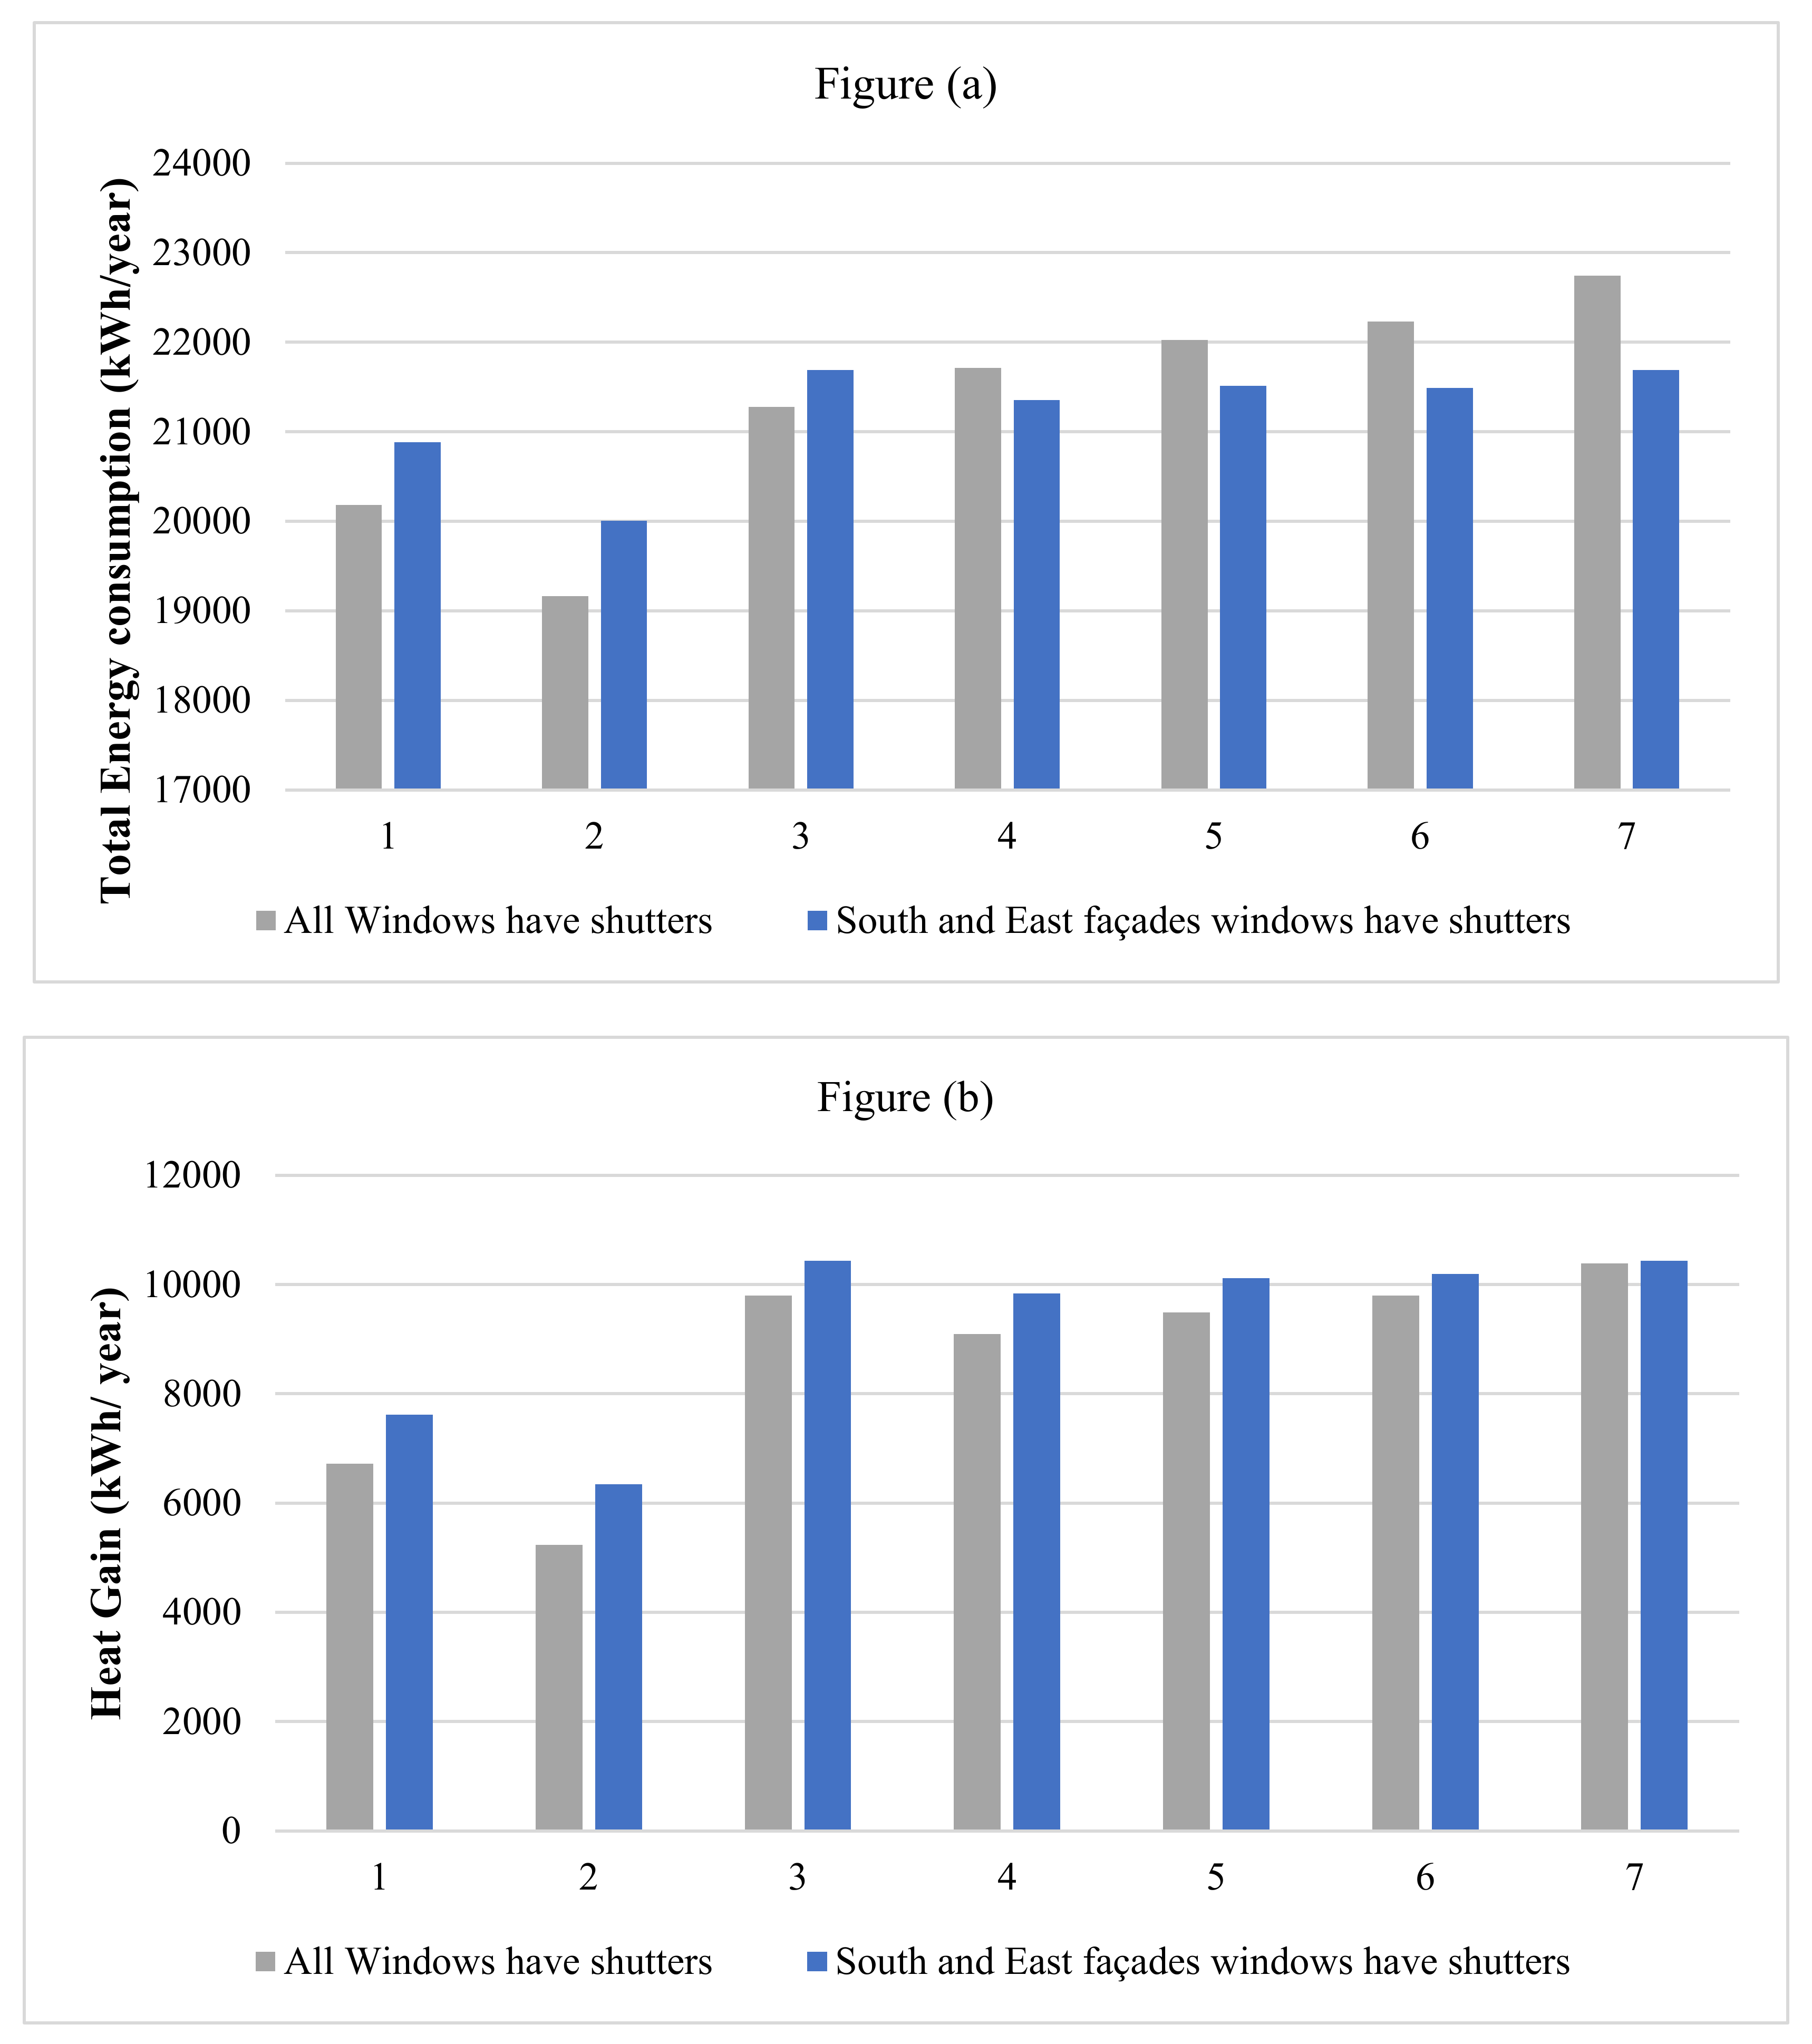
3.2.1. Effect of Window Shutters on Yearly Heat Gain

The impact of applying shutters with an embedded polyurethane insulation layer on the aforementioned glass types was trialed by applying a medium solar intensity of 189 W/m2 [50]. Figure 4a shows the annual total heat gain through the window by implementing window shutters of different window glass types whereas Figure 4b depicts the related yearly reduction.

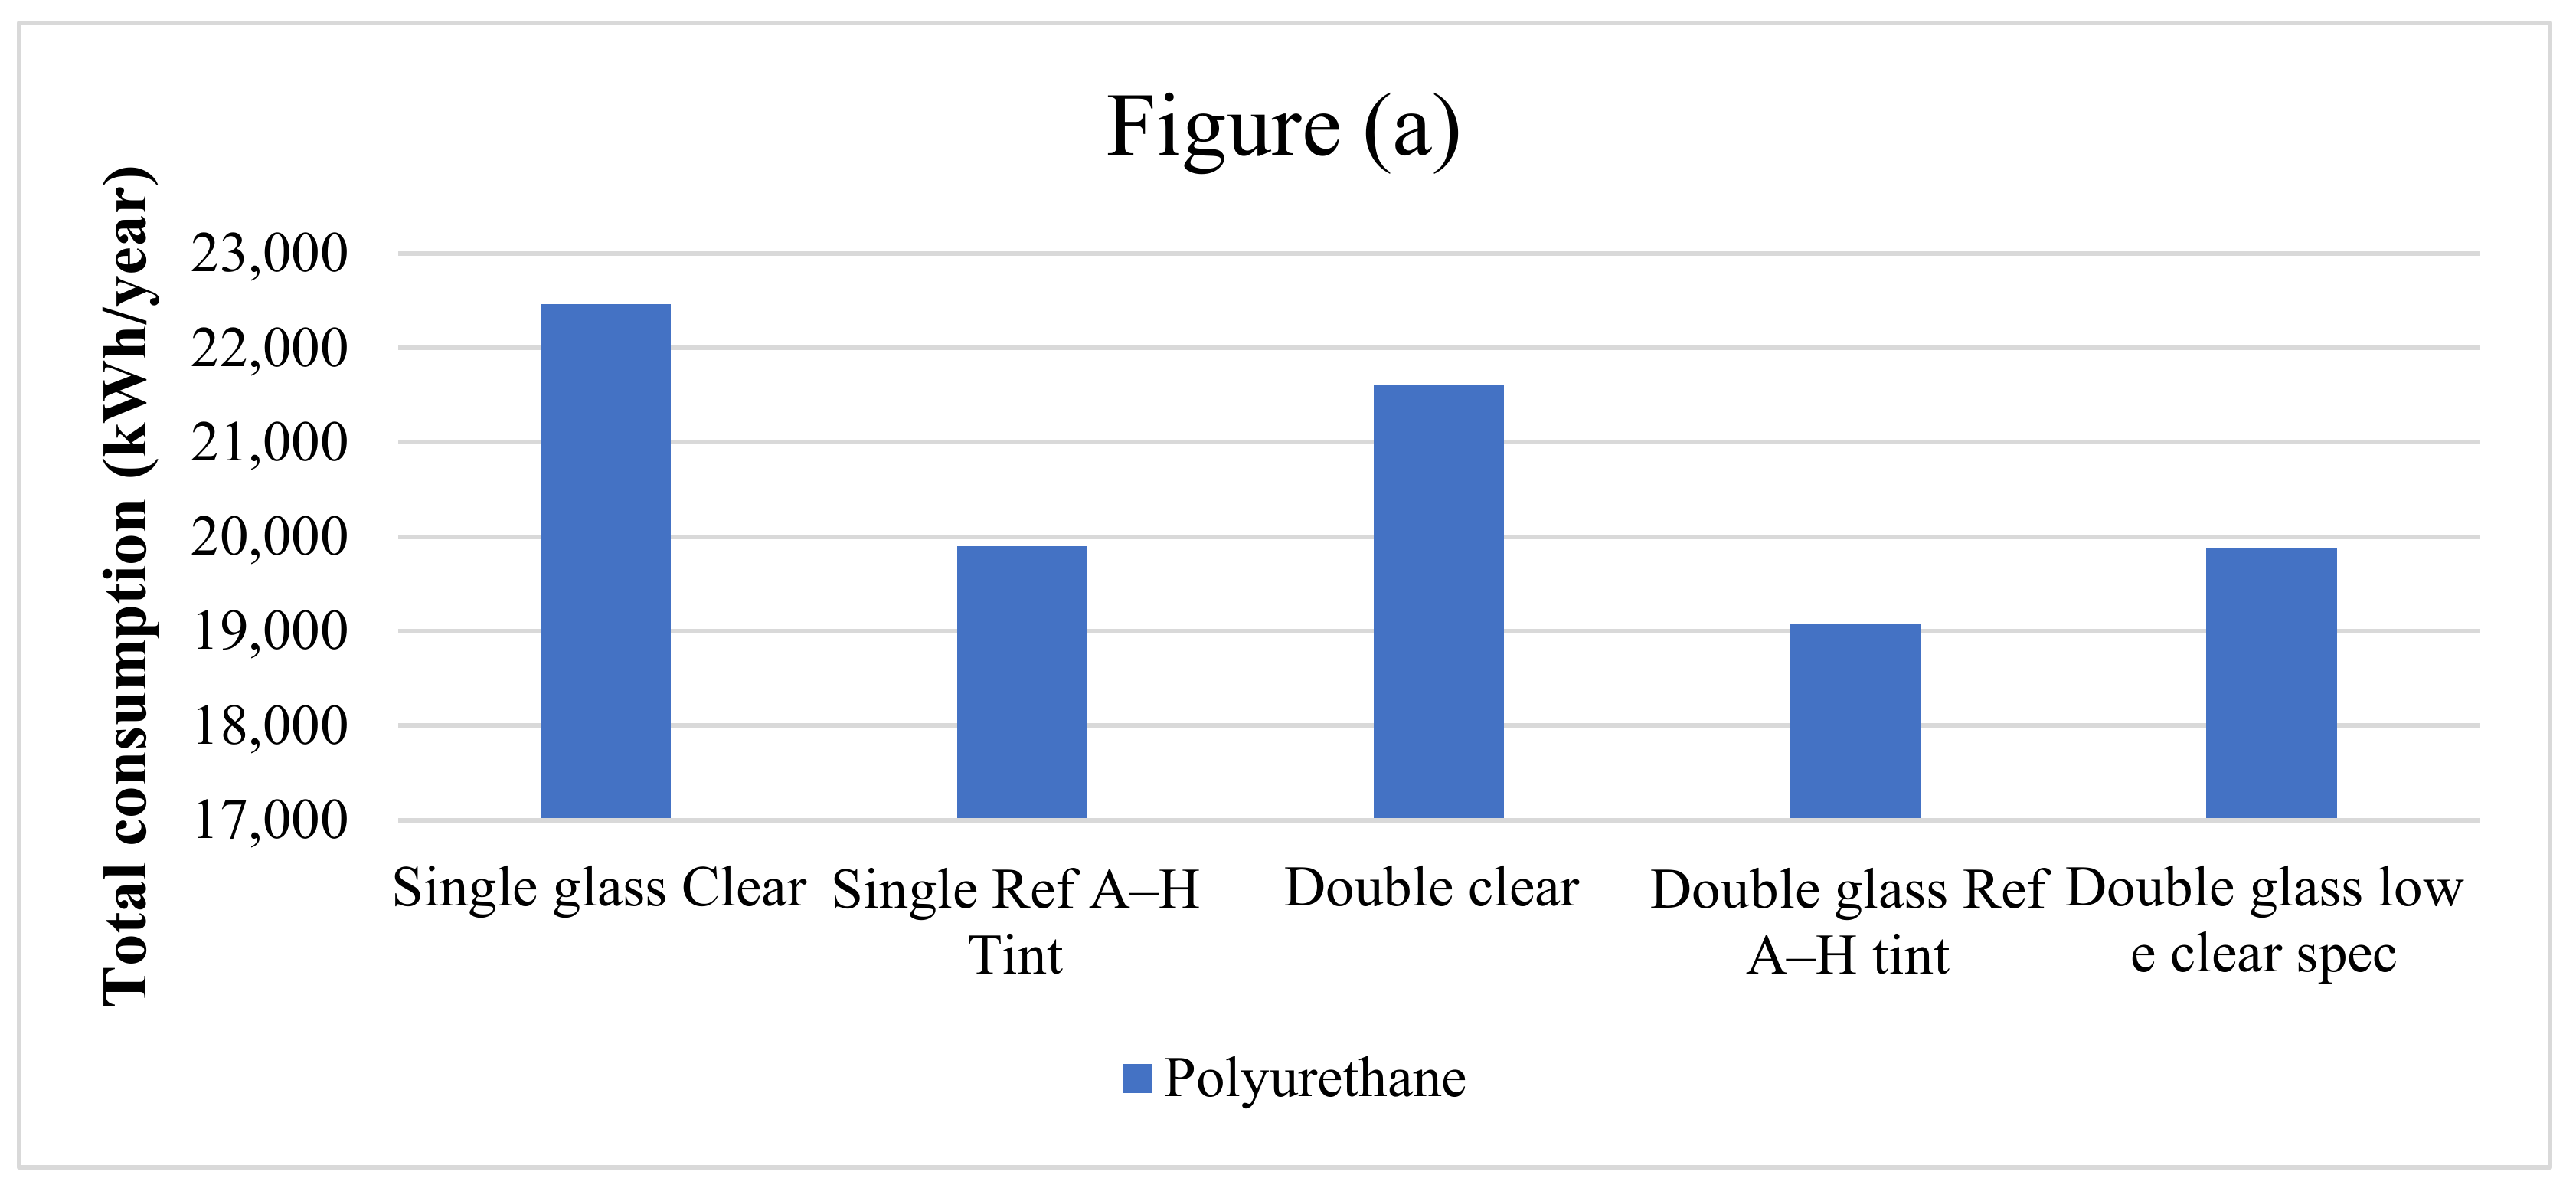
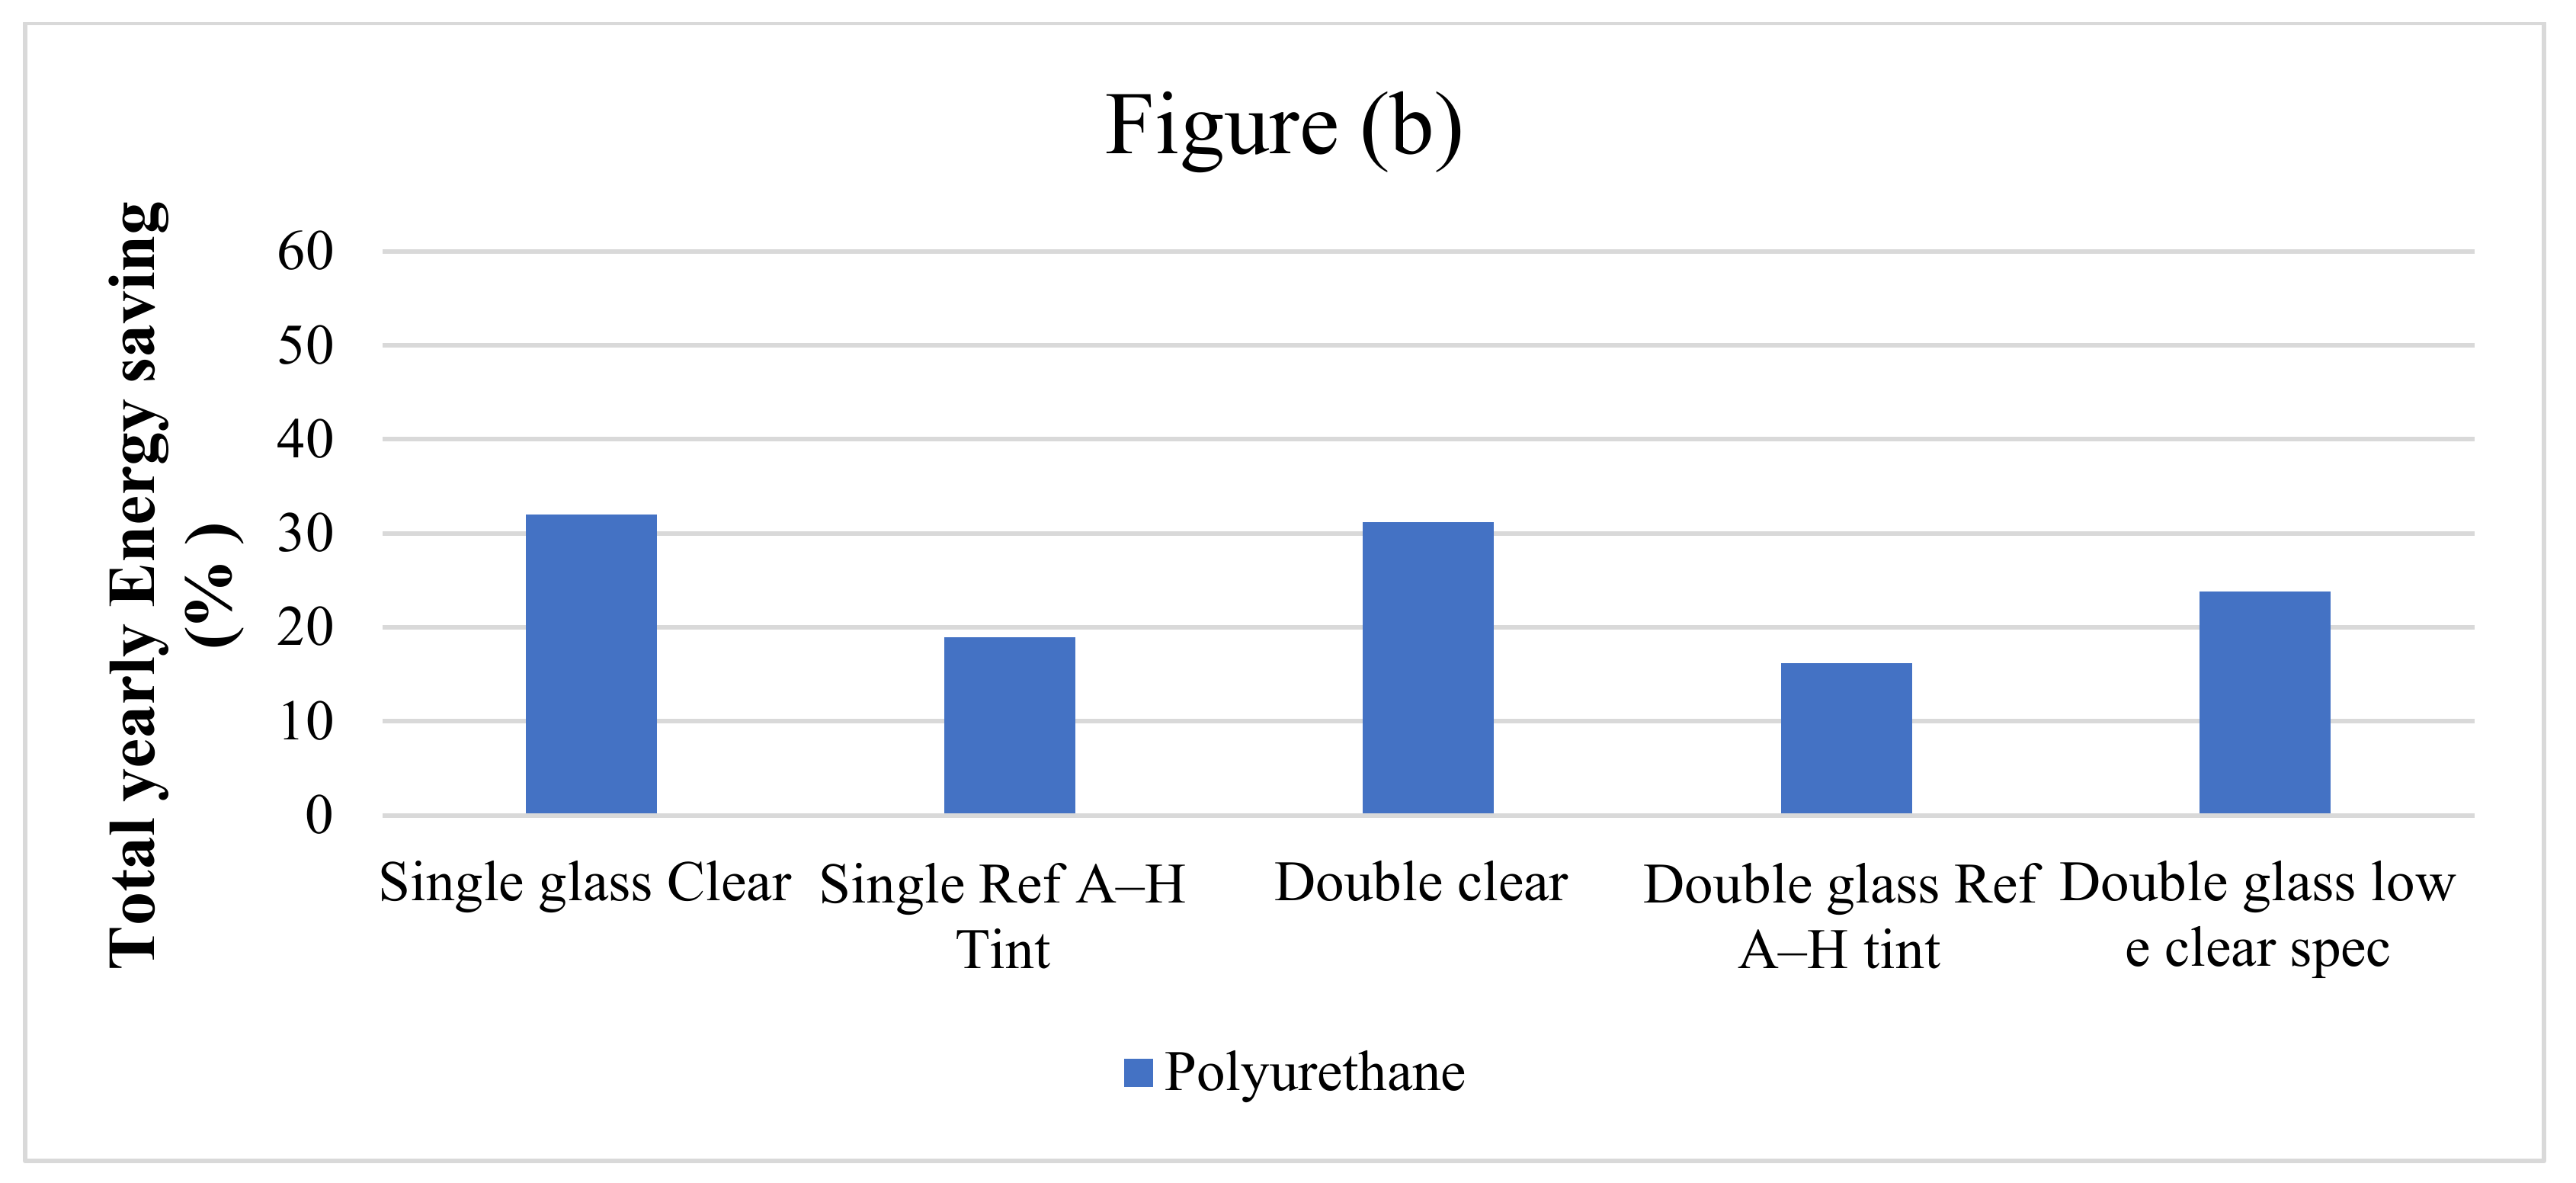
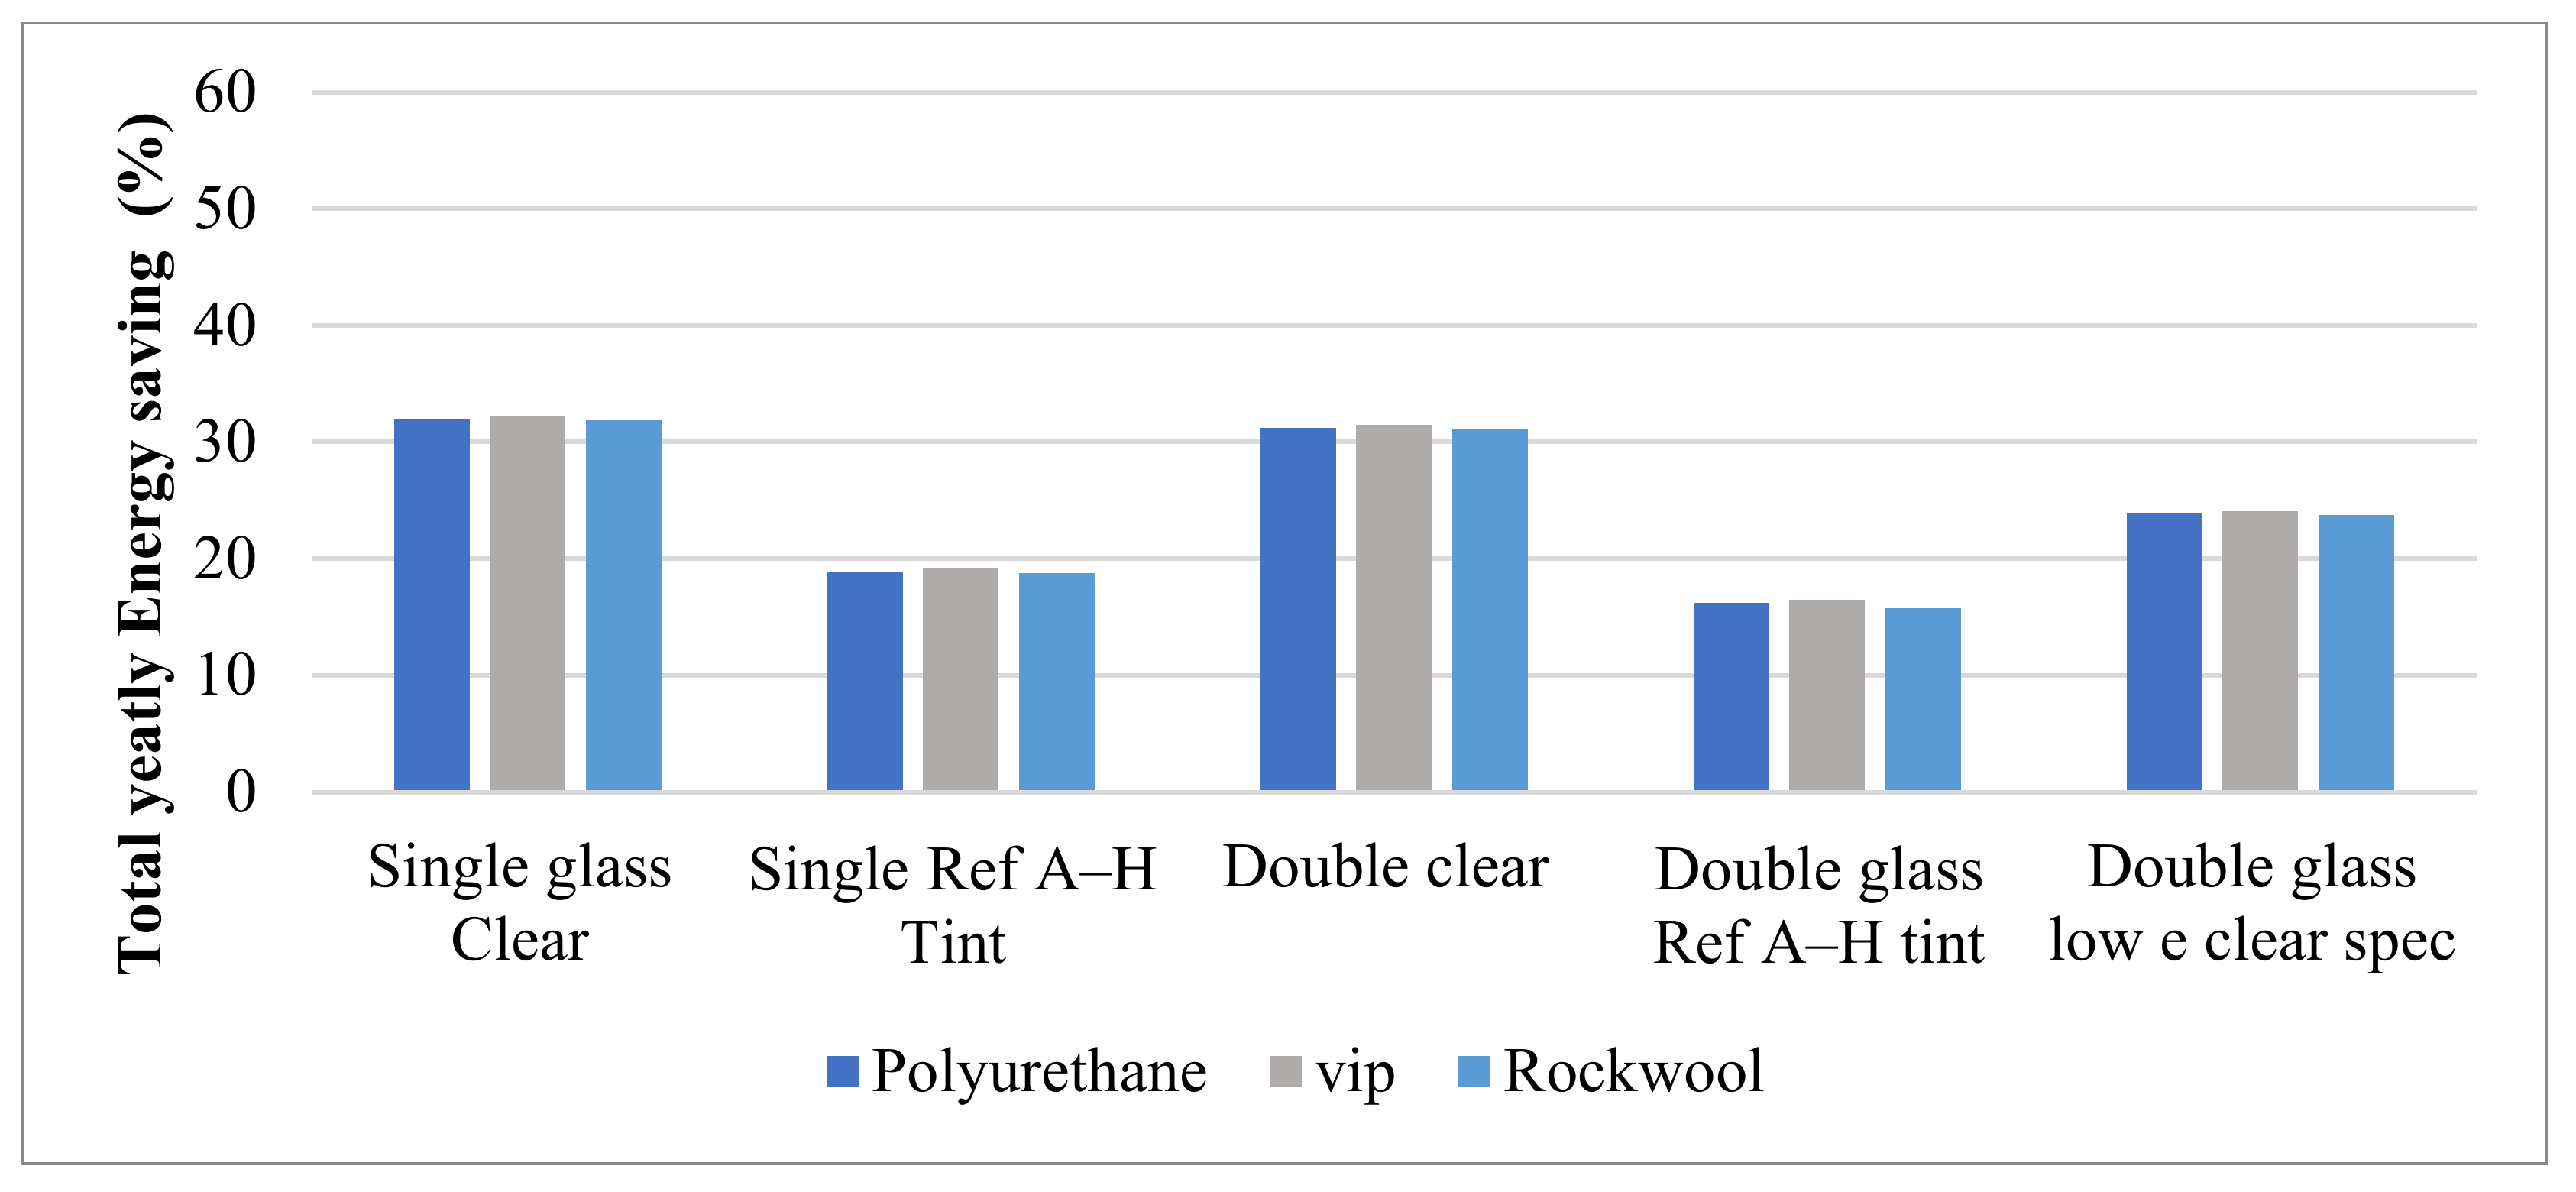
3.2.2. Effect of Window Shutters on the Building’ Yearly Energy Consumption

Figure 5a illustrates the building’s annual total energy consumption after the application of window shutters of various types of window glass types and Figure 5b depicts the related total energy savings.

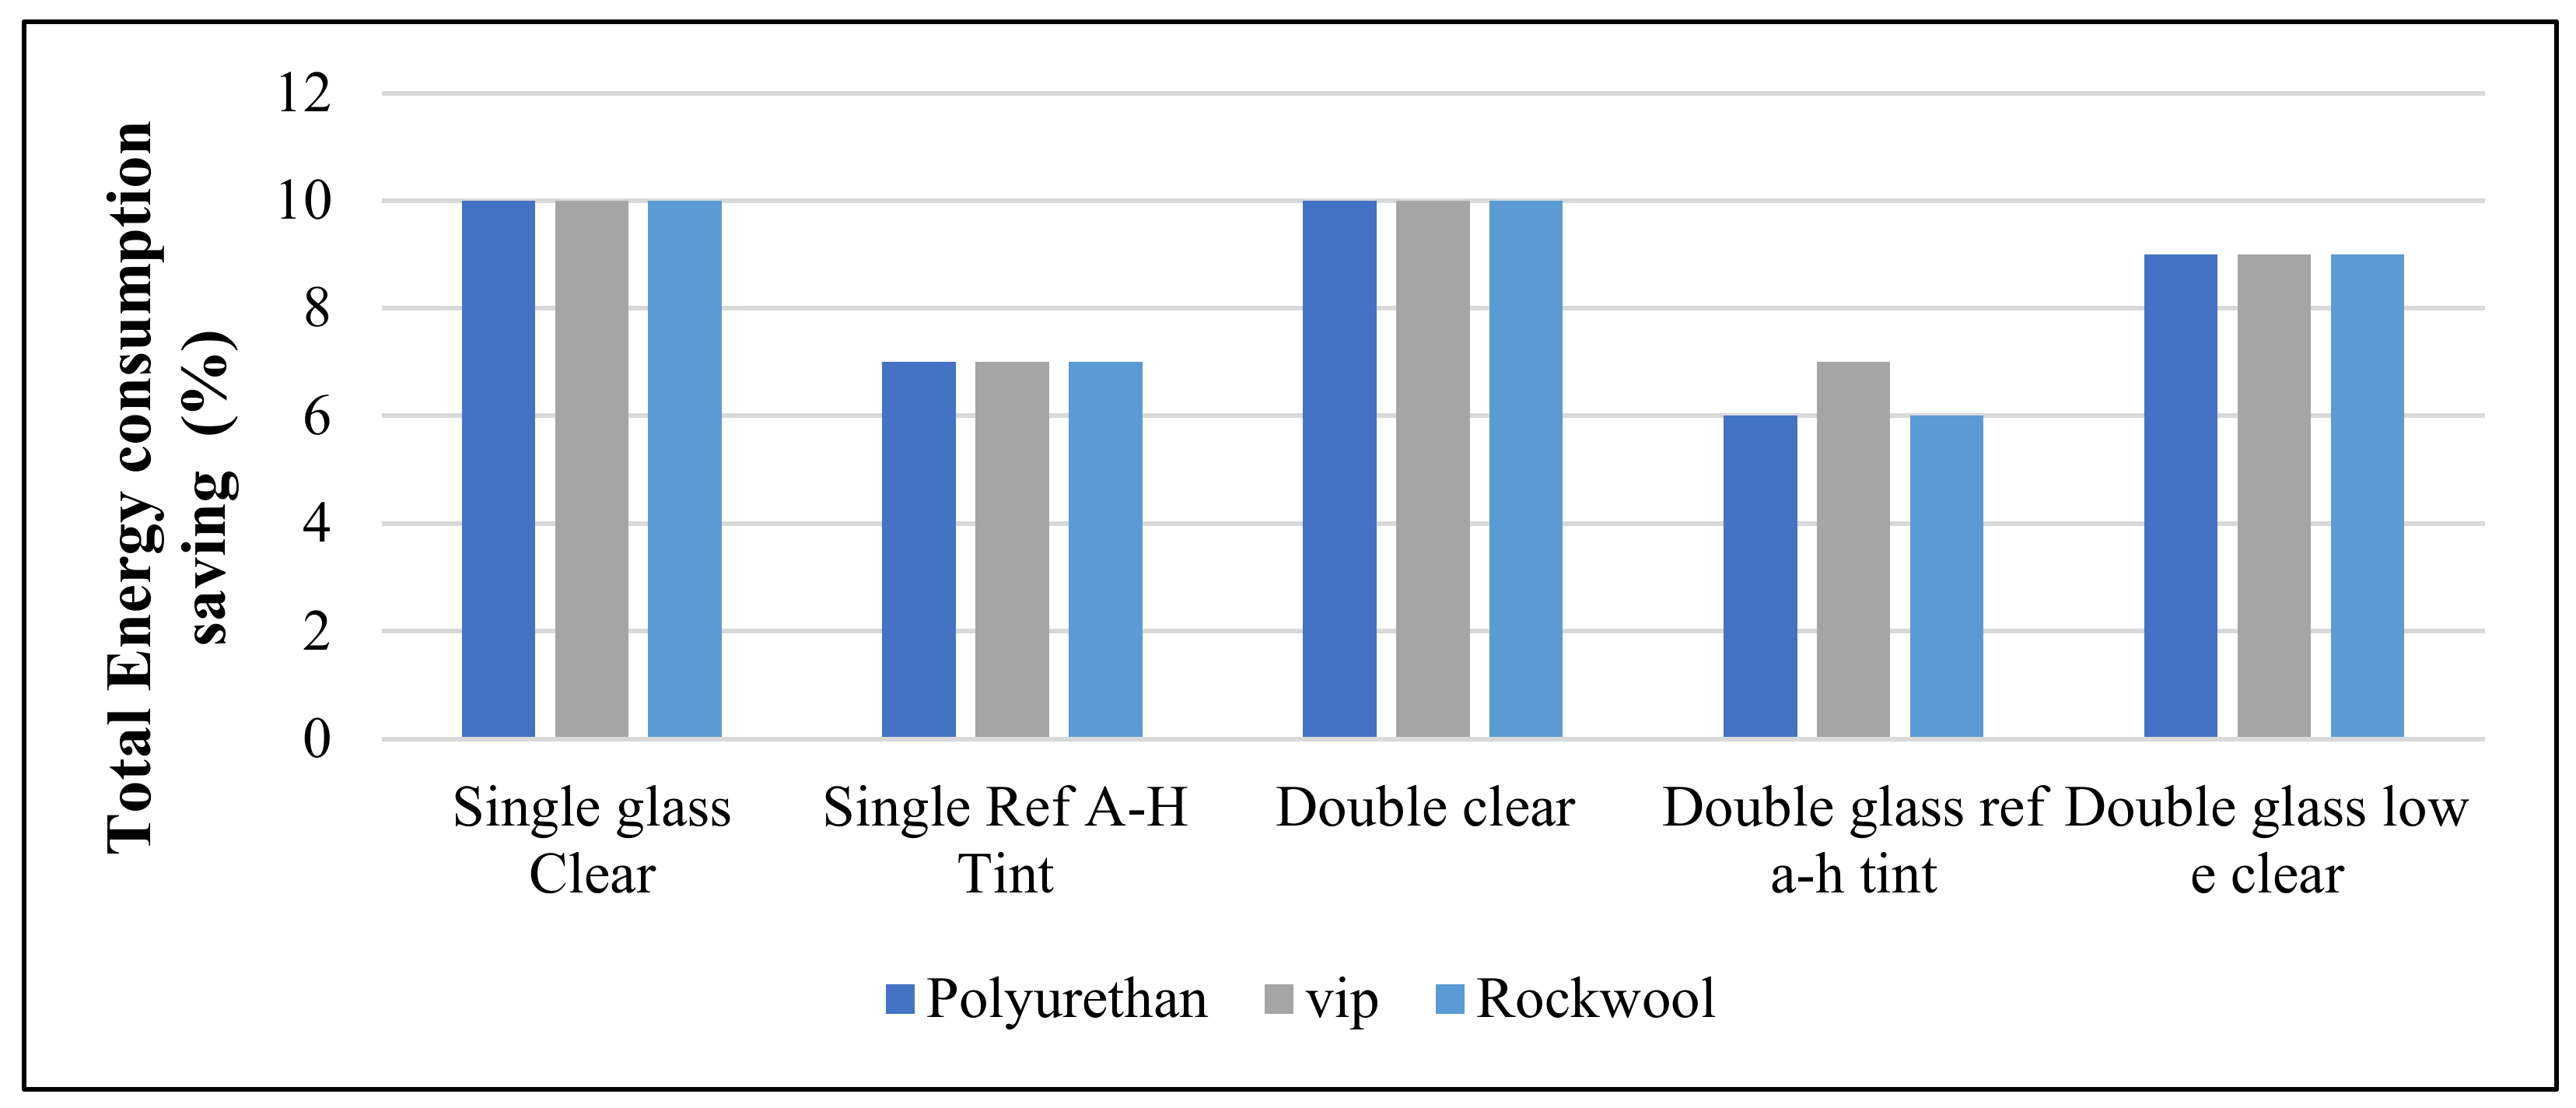
3.3. Embedded Insulations in the Window Shutters’ Impact

A test of the insulations of three alternatives was carried out on the base case: Polyurethane, vacuum, and Rockwool (Figure 6) with varying scenarios of glass type to denote the total consumption of energy along with the overall reduction after implementing windows shutters. The thermal conductivity of Rockwool and Polyurethane is 0.020 W/mK and 0.041 W/mK with the density being 32 and 65~160 kg/m3, respectively.

Impact of Embedded insulation in Window Shutters on Yearly Heat Gain

Figure 6 presents the annual decline in the overall heat gain via the studied building’s different types of window glass after implementing three types of insulations of window shutters: Polyurethane, Vacuum, and Rockwool.
Figure 7 shows the correlated annual overall energy savings of the building after implementing various windows glass types after the integration of the three types of window shutters’ insulations mentioned above. Results show that double glass with a reflection tint provides the best performance. The remaining analysis was conducted on shutters with this type of glazing.

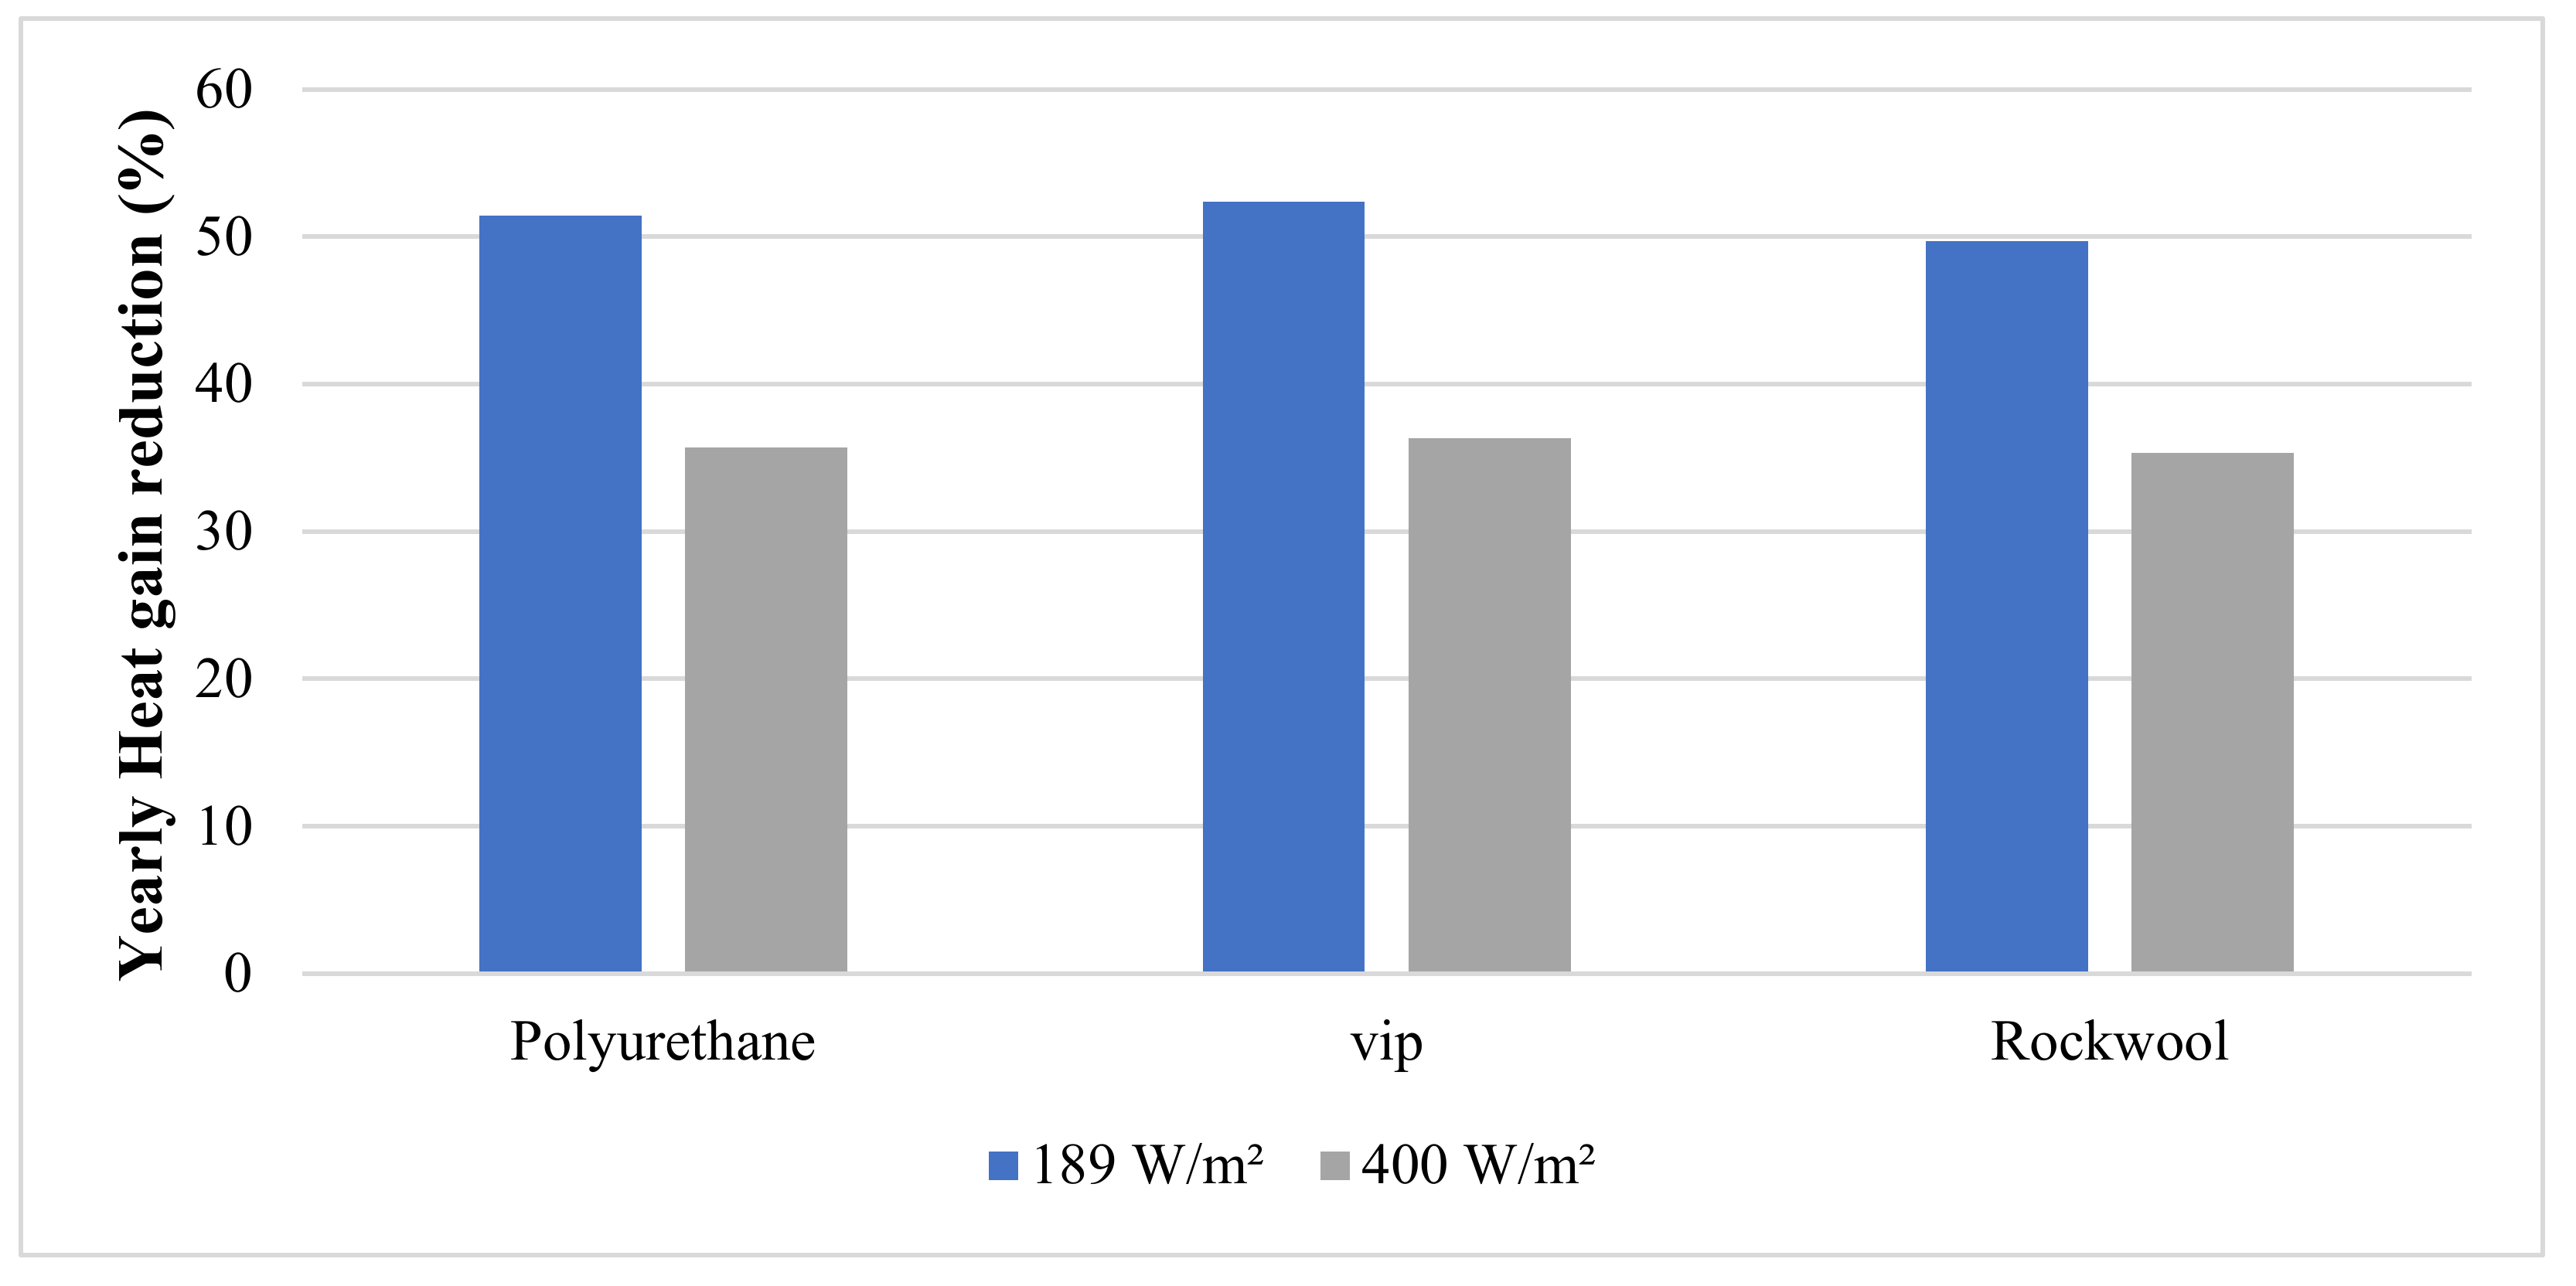
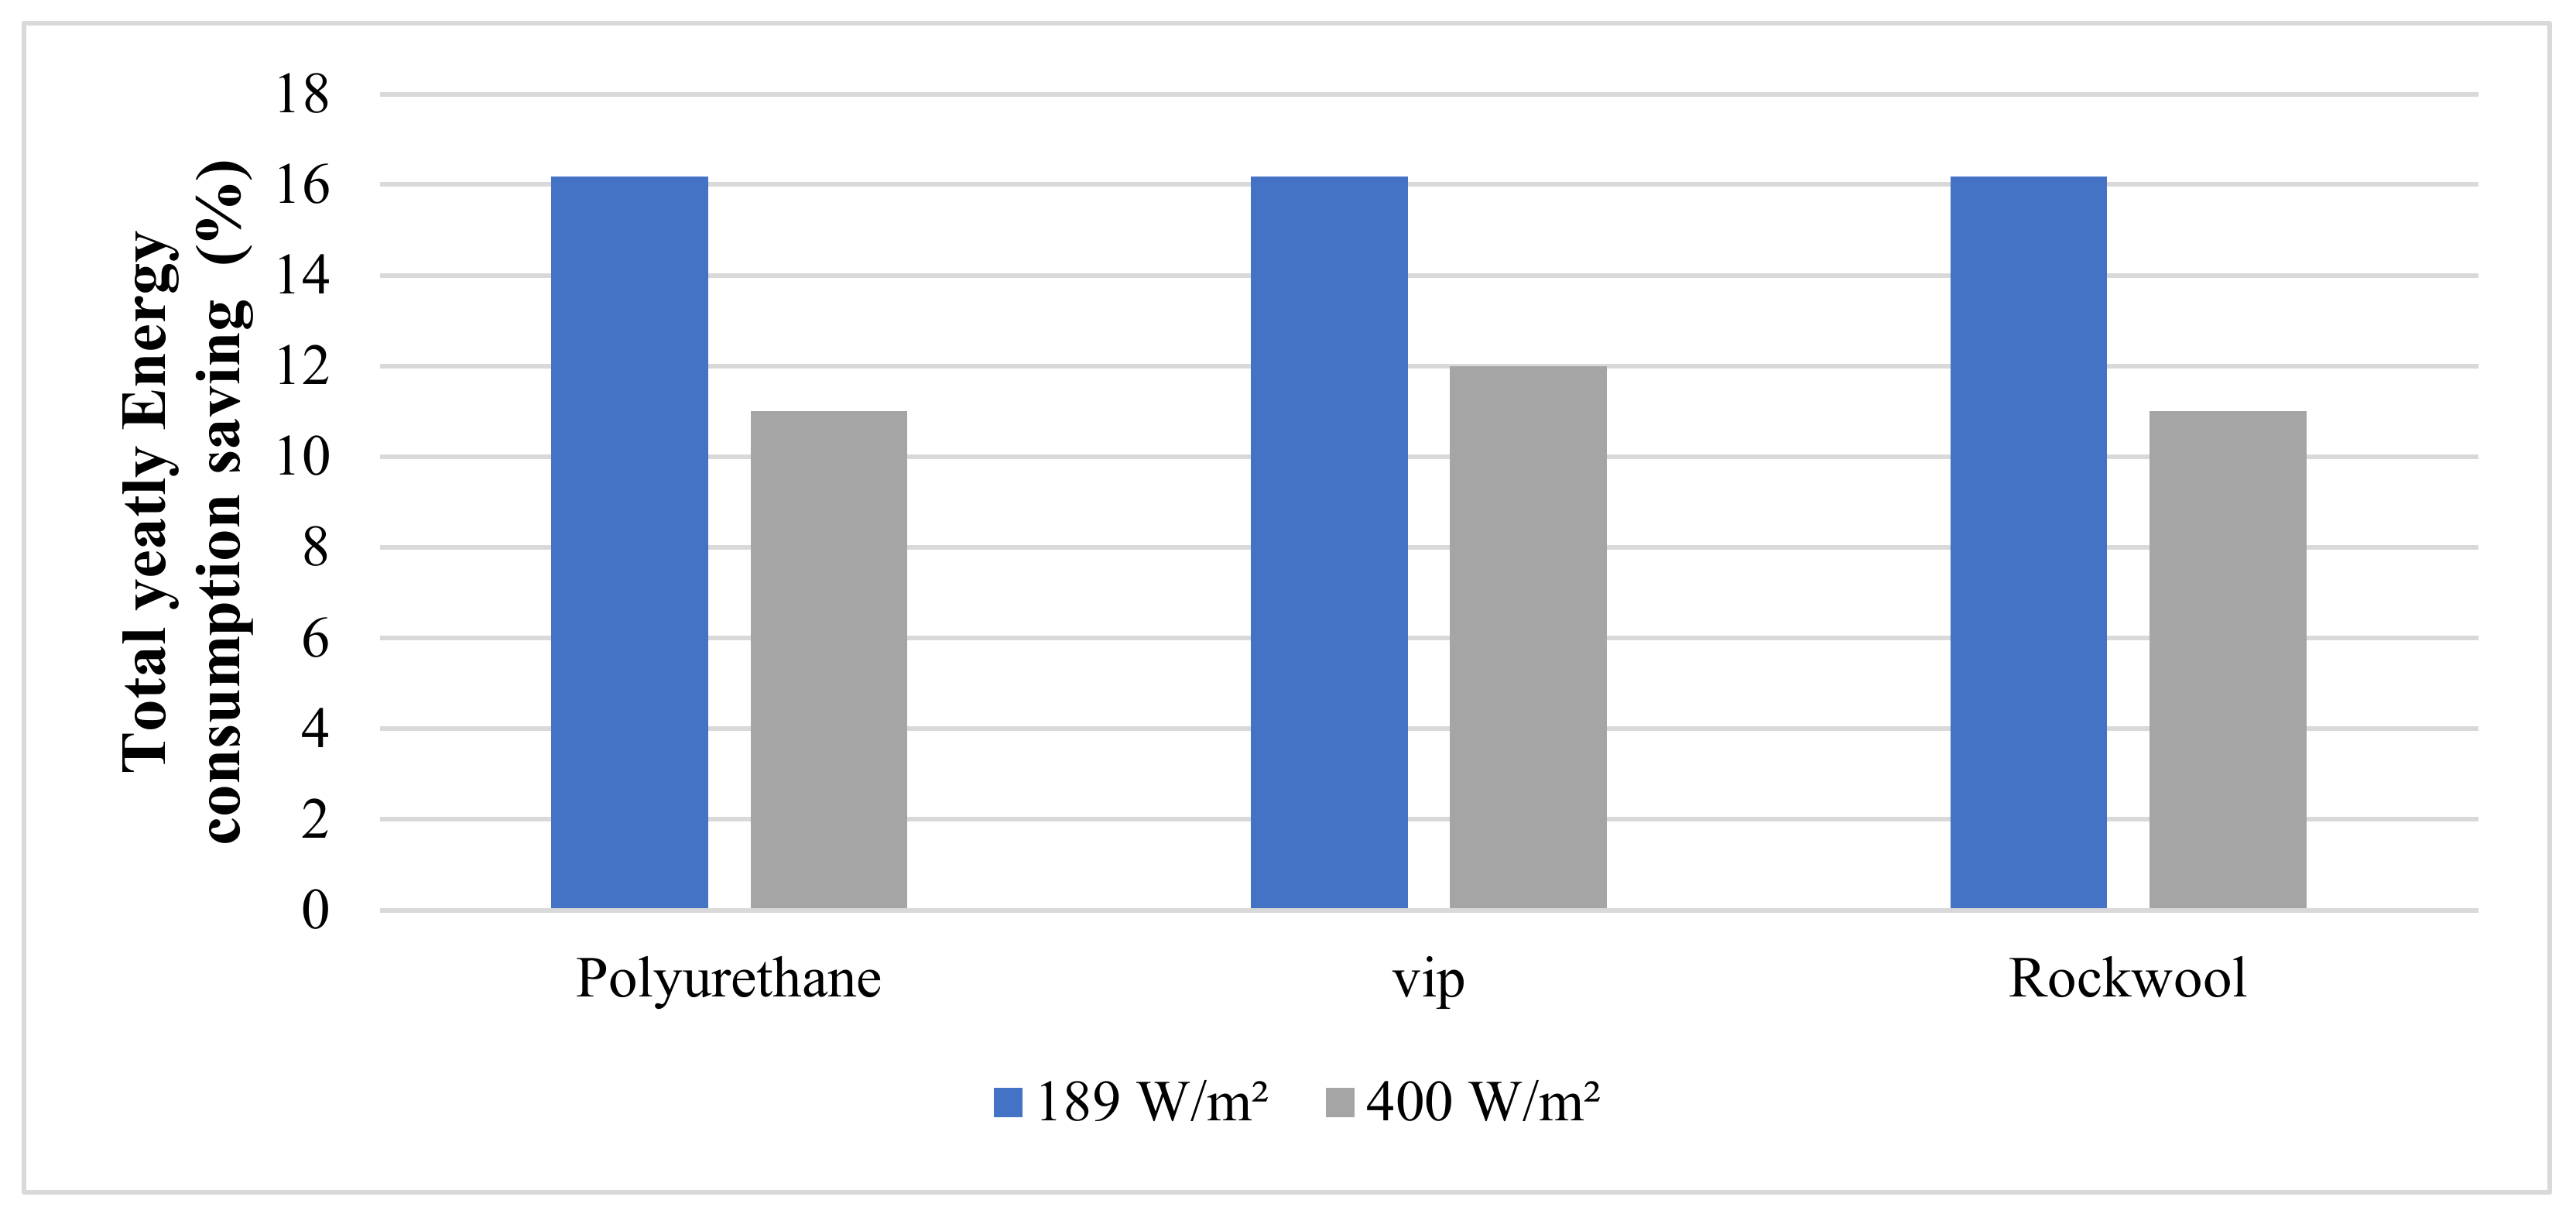
3.4. Solar Intensity Control Mechanism

Various solar radiation calculated from the weather data of the Abu Dhabi were applied. The simulation software utilized in this research EnergyPlus, which takes into consideration the local total solar radiation incident on the window, combining direct and diffuse radiation. The monthly variable radiation reaching the maximum vertical intensity of 700 w/m2. The control strategy for solar radiation is applied and the software triggers the operation of the shade when a user-specified setpoint is met. Two control points were suggested from the authors to allow the shading device to work when the user selected one of them based upon their preference. The effect of controlling the shading shutters through the control strategy of radiation intensity were calculated, therefore specified high and low control intensity setpoints are selected to compare for case scenarios. The effect of two recommended insulation types on energy savings were evaluated applying two solar setpoints, low (189 W/m2) and high (400 W/m2)were chosen [50].

3.4.1. Effect of Solar Intensities Control Set Points on Yearly Heat Gain

Figure 8 shows the annual decline in overall heat gain through windows of the building under investigation by implementing three types of insulations of window shutters: Polyurethane, Vacuum, and Rockwool for the two applied control set-points namely, 189 W/m2 and 400 W/m2 on the variant solar intensity.

3.4.2. Effect of Solar Intensity Control Set Point on Yearly Energy Saving

Figure 9 presents the studied building’s annual overall energy saving percentage after applying the two-set control-points: Dhabi, 189 W/m2 and 400 W/m2 on the solar intensity of the Abu of the three types of window shutters’ insulations.

3.5. Glare’s Index Control Effect

An evaluation of the more commonly utilized glass type with/without glare index control strategy was carried out for all three selected insulation alternatives.
Figure 10 shows the overall energy saving for different window glass types with three types of insulations of window shutters after the glare application.

3.6. Window Shutters Location Application
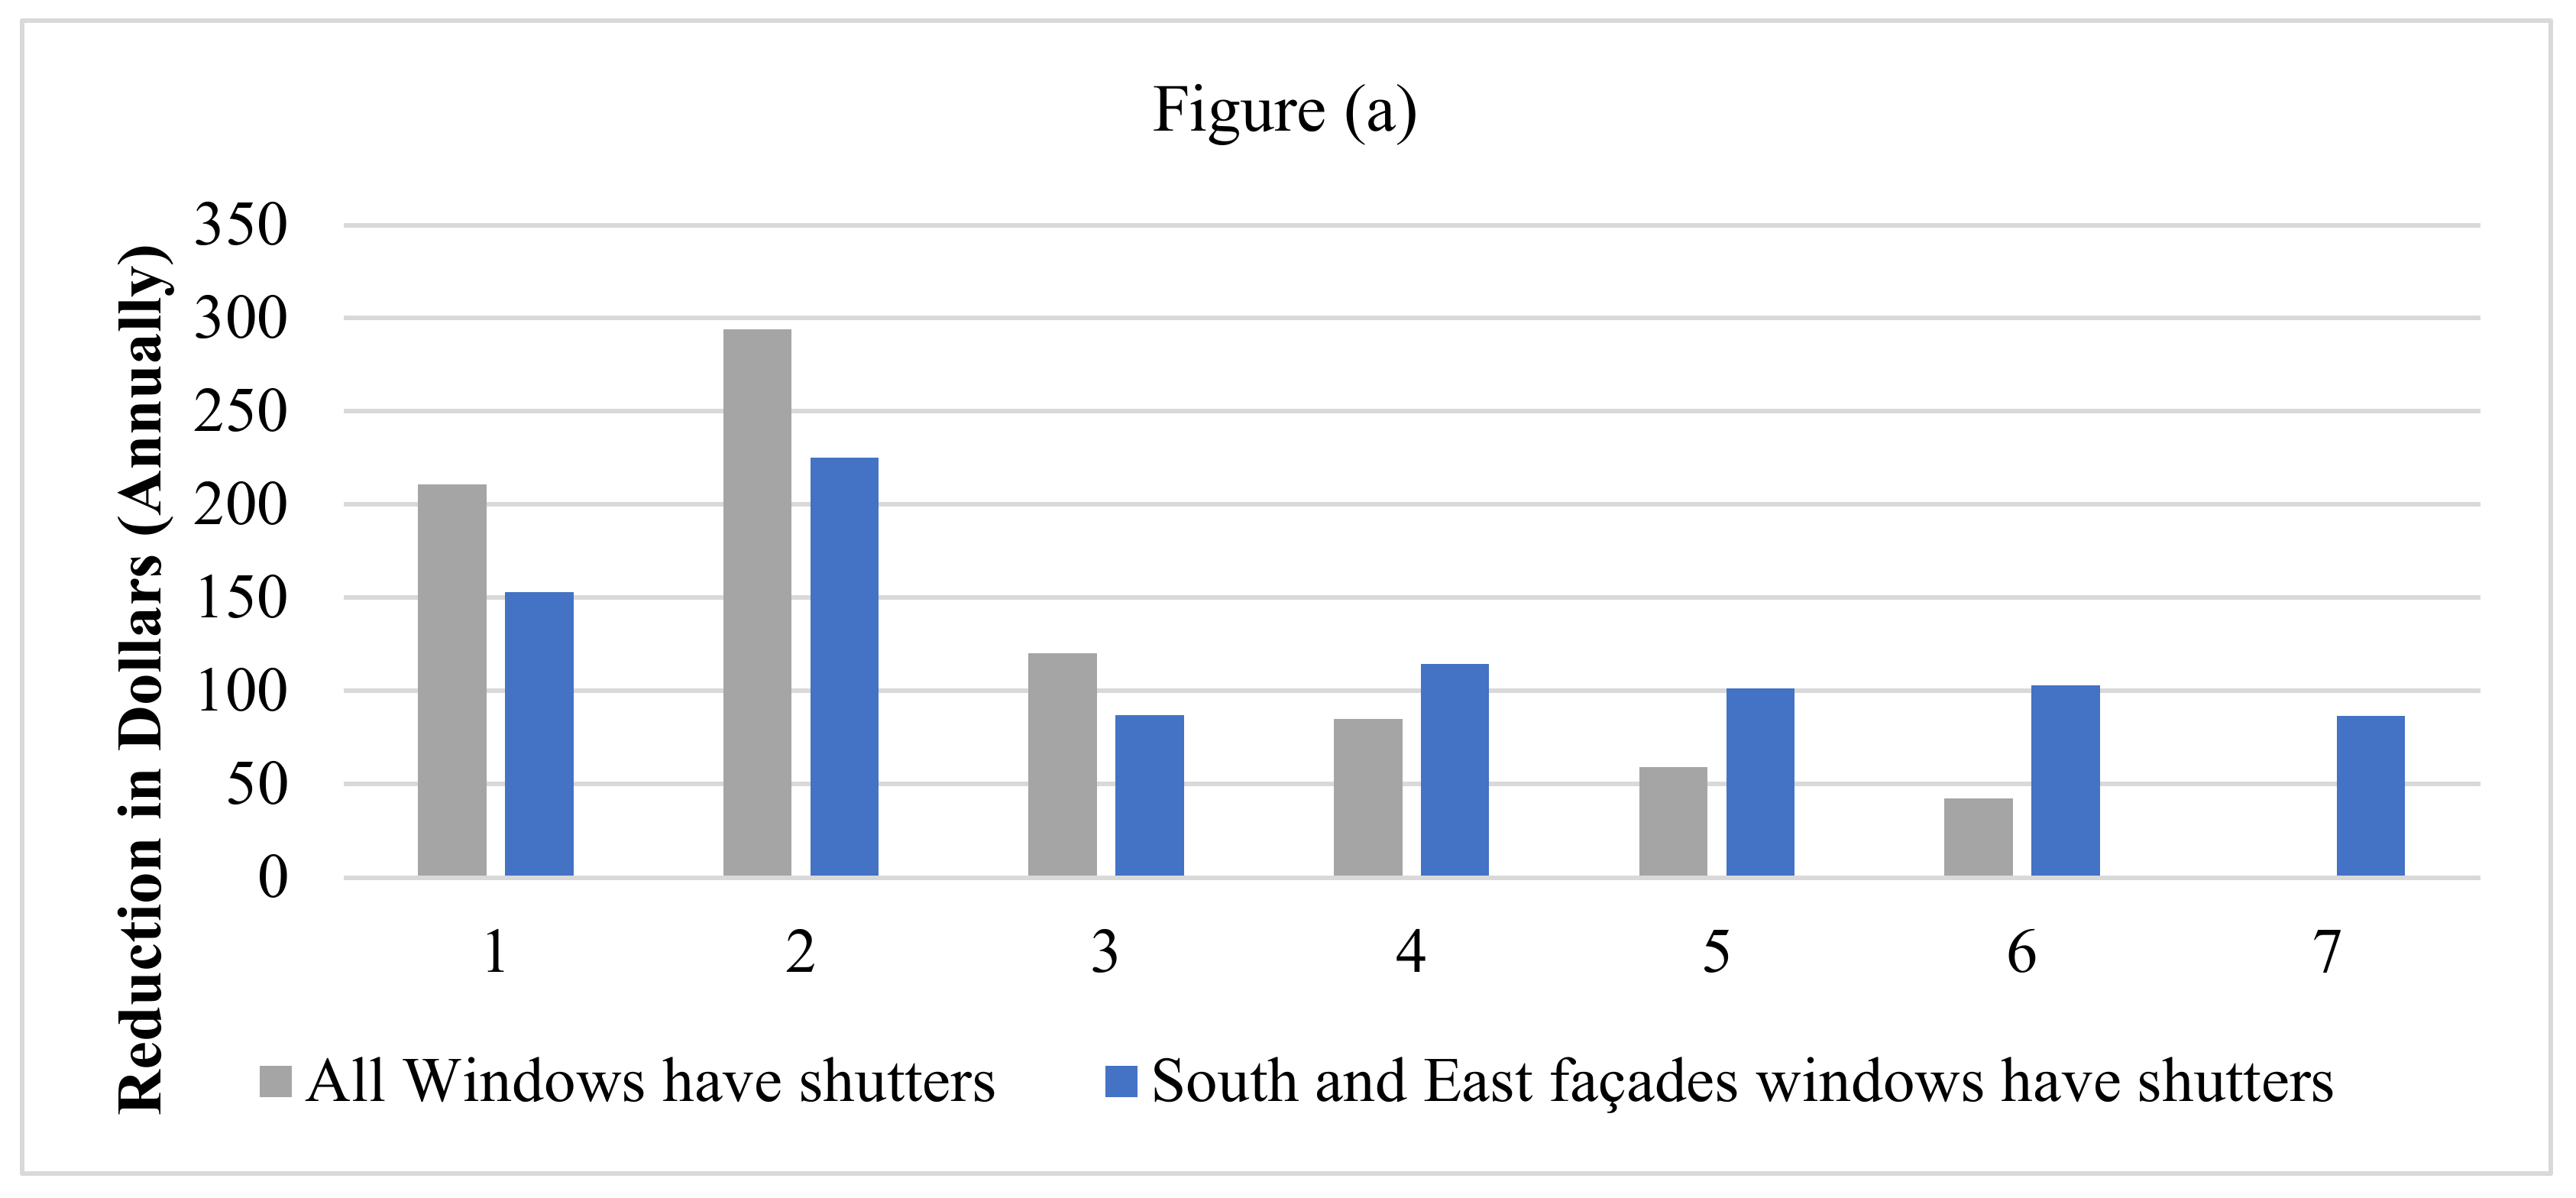
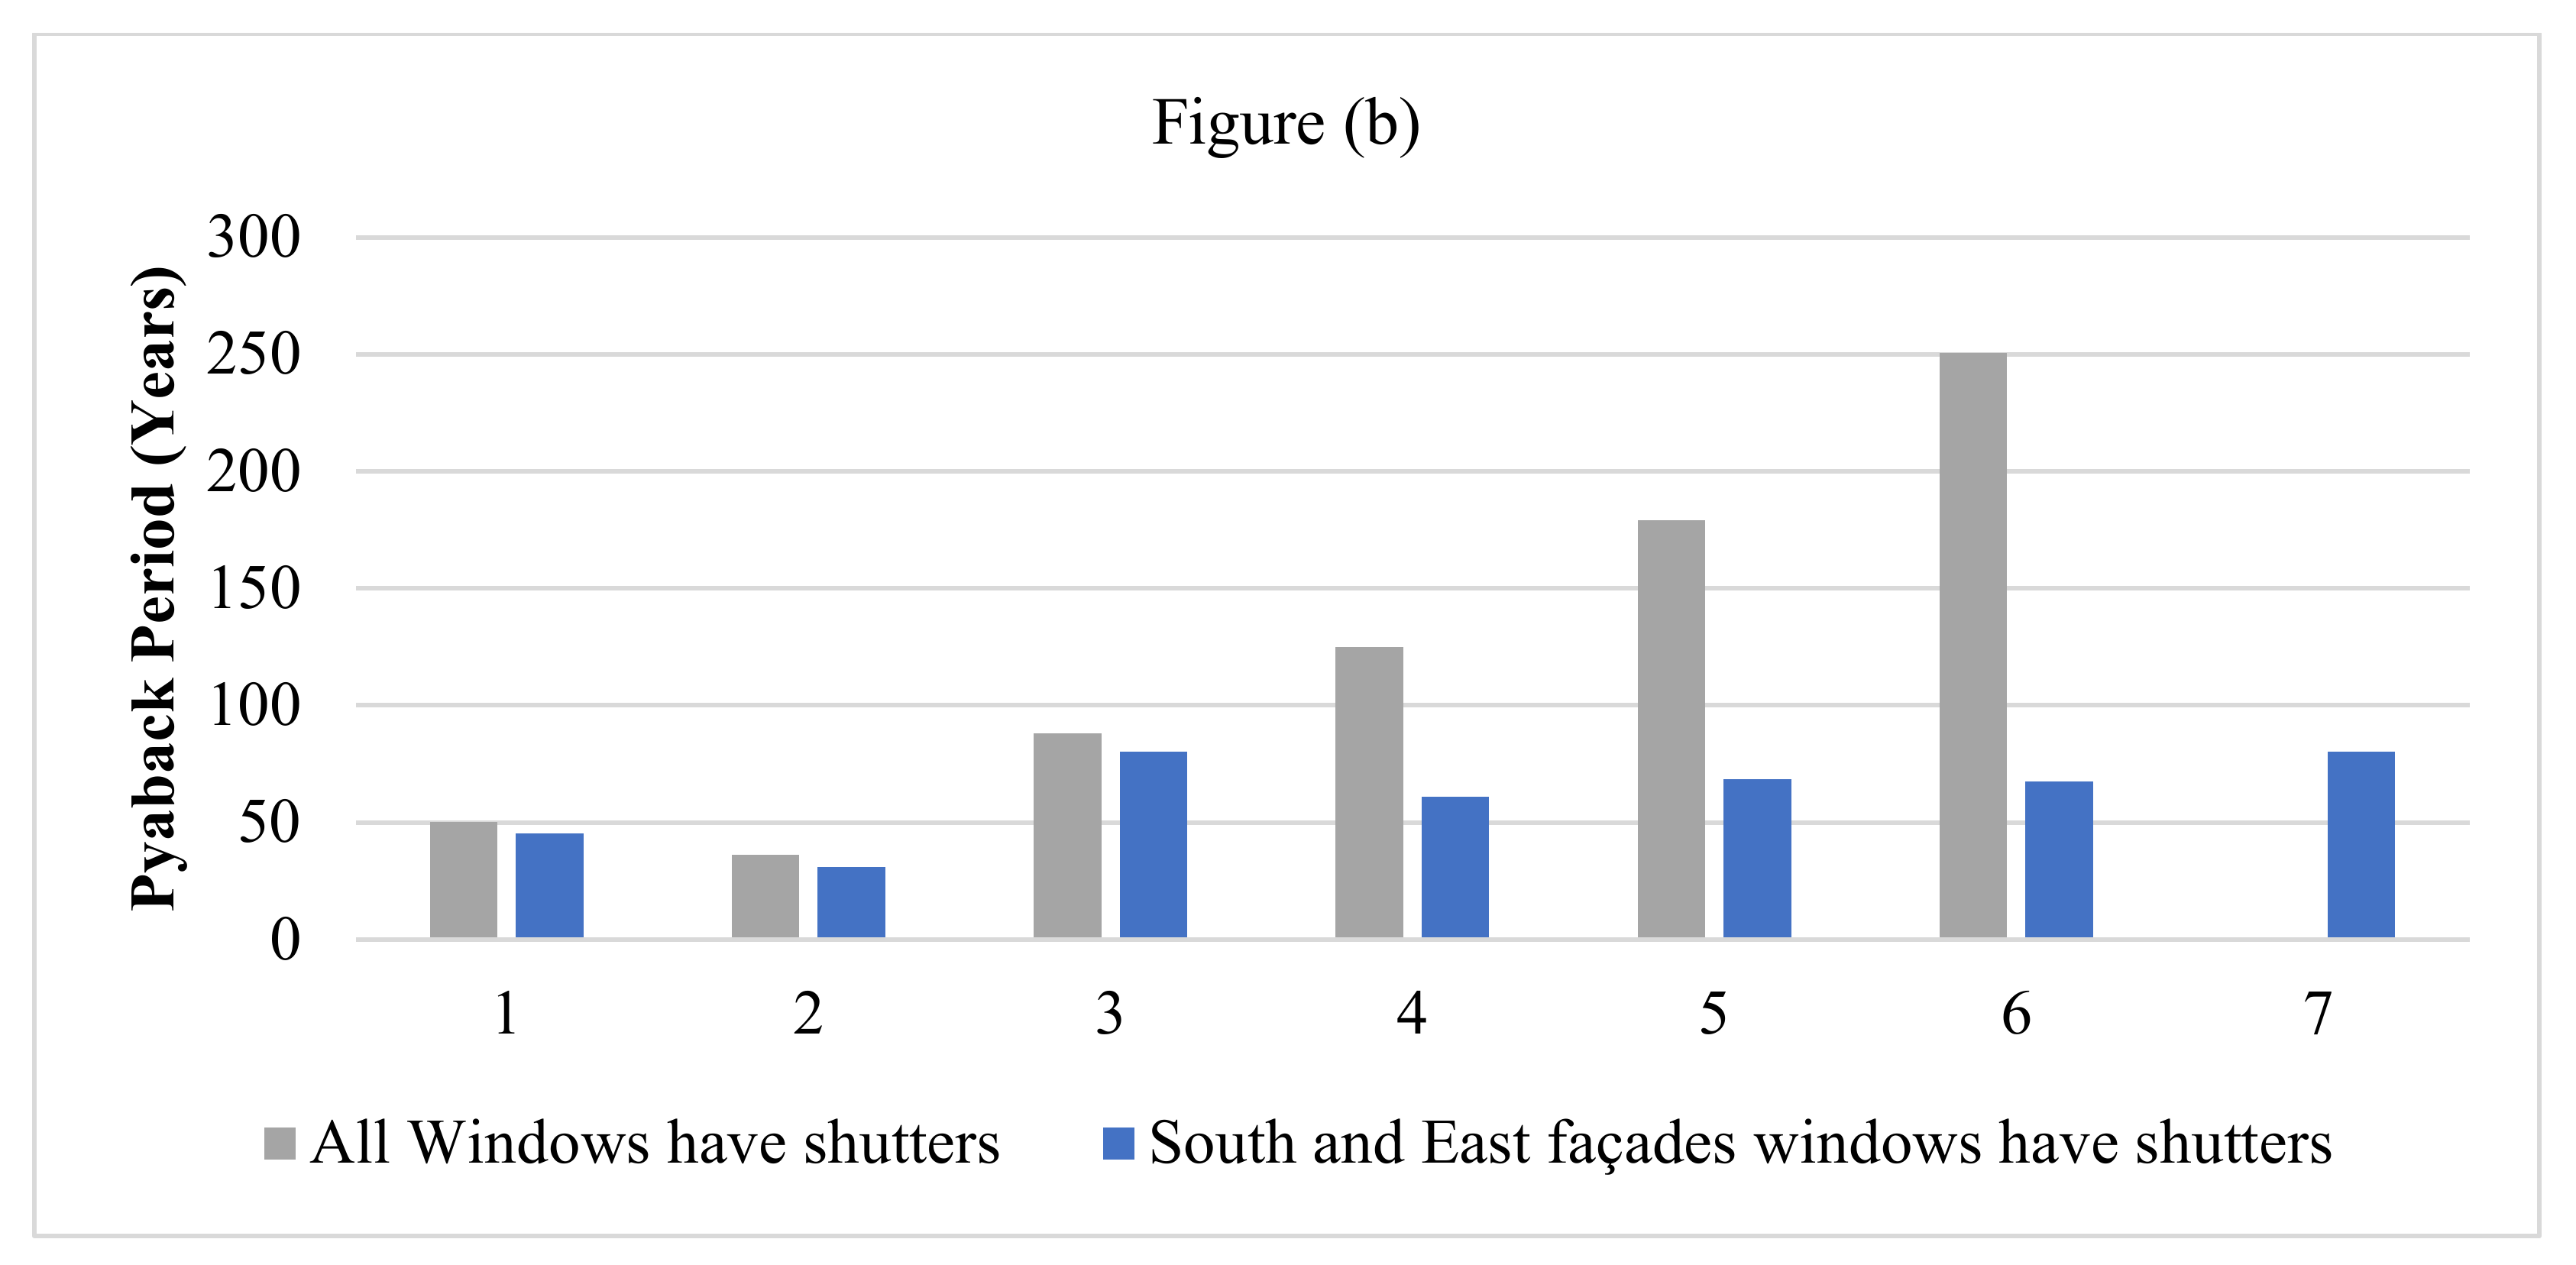
Figure 11 shows the difference between the overall energy consumption and heat gain after shutters are applied to the entire building, encompassing an area of 47 m2, in contrast with only the south/east facades having shutters, the two facades’ window area cover approximately 24 m2 and 7 m2, respectively, the south and east façade of the house combined comprises 65% of the house model’s glazing area along with their exposure to high heat gains and rays that causes glares. Similarly, Table 6 shows the alternating 7 scenarios of shading devices implemented with the seven-windows shutter control mechanism.

3.7. Cost Analysis

Given that numerous alternatives differ in cost, specifications, and energy consumption, it is necessary to make a comparison between them to strike a balance between cost and building energy efficiency in order to define the economic feasibility for these alternatives. The evaluation of cost-effectiveness is predicated on the cost, as well as available materials in the UAE. Table 7 and Table 8 show the various alternatives options for glass type and window shutter insulations, respectively.
Based on the data used for Appendix A, Table A1, Microsoft Excel was used to draw Figure 12 for evaluating the linkage between cost decline in dollars annually and both scenarios’ payback period. As shown in Table 6, all windows have shutters, whereas only the east and south windows have shutters with seven different mechanisms of window shutters. The scenario of which combined the control mechanism of outside temperature and high solar intensity showed negligible reduction, therefore its reduction and payback period is not reflected on the chart below.

3.8. Estimation of CO2eq Emissions

Table 9 illustrates the likely global warming effect by installing the rolling window shutters in the 7 scenarios in comparison with the baseline scenario. The highest reduction in greenhouse gas emissions reaches an approximate percentage of 15.76% in scenario 2; its control strategy is the low solar radiation setpoint for the rolling window shutter (189 W/m2), while the remaining scenarios ranges from 2 to 11.30% (scenario 7, as noted previously is negligible in effect).

4. Discussions

A simulated residential building (base case) located in Abu Dhabi was built using DesignBuilder software (Table 4) based on the Estidama minimum requirements, considering all elements that led to the overall building energy consumption of 31,411 kWh (Table 5). Although, the study of the effect of using roller shading shutter device was evaluated in Abu Dhabi housing as a case study, the result can be applicable for the gulf countries since the weather of the Abu Dhabi/UAE is similar in comparison to multiple major cities within the region [51].
Taking into consideration single clear glass as the base case, the double clear glass displays lower gain of heat via the window. This is then followed by single reflected, double glass while the double glass reflected provides the minimum percentage of heat addition, as shown in Figure 4a.
As methods of assessment, annual heat gain and the overall yearly energy saving were evaluated. Five types of glass materials were namely single glass clear with 6 mm thickness, single reflected A–H tint with 6 mm thickness, double clear with 6 mm/6 mm thickness, double glass reflected a–h tint 6 mm, and double glass low e clear spec 6 mm/6 mm air
These findings underscore the importance of implementing these window shutters, particularly for the building using the single clear glass type, thus suggesting that integrating this device in the window with clear glass will help achieve a 59% decline in heat gain via the window. For double glass reflected windows, this value is relatively lower as the heat gain via this type of glass without shutters was significantly lower. However, the shutters’ application will help reduce heat gain by up to as shown in 50% Figure 4b.
Different types of insulation such as Polyurethane, Vacuum, and Rockwool were involved. The choice of Rockwool in the window shutters yields improved findings than the tested types for all types of glass. As per Figure 6, Vacuum insulation panels (Vip) is the best option for the insulation type.
The impact of these insulation types on the overall energy usage and its associated drop in the overall energy consumption for all glass types were examined as well. In line with expectations, the finding shows that the clear glass type impacts total energy usage more strongly as compared to the double glass reflected glass, which shows the lowest value of the energy consumption as depicted in Figure 7. The percentage of decline in terms of the integration of window shutters into different glass types had similarities when it came to the decline in heat gains via the window for the same glass types shown in Figure 6. Having said that, the peak reduction percentage obtained was nearly 31% for clear glass with the lowest being 15% for double reflected glass. As per these findings, the integration of simple devices in the existing building can help yield energy savings in the range of 15% to 31% (Figure 7). Meanwhile, the impact of insulation type was not found to reflect in the overall energy reduction, based on which it can be inferred that in this case, the dominating selection factors will be cost and environmental aspects. It is possible to explain this due to the effect of thermal bridging that may significantly impact the performance of thermal shutters as stated in a previous study [52].
The testing of two solar radiation control strategies by specifying low and high setpoints was carried out: low 189 and high 400. The average decline for low set point of solar intensity (189 W/m2) was 51% while for high set point of solar intensity (400 W/m2), it was maintained at 36%, as per Figure 8. This trend was found to be similar for all types of insulations of window shutters. However, the VIP type exhibited a higher percentage of reduction. In addition, a simulation run was conducted to reveal the differences in heat addition and energy consumption, after implementing the glare with index 18 into different types of window glass, which caused the overall energy savings to be around 6% in the case of double glass and 10% in the case of single clear glass (Figure 10). Previous studies’ findings have confirmed that the difference between the implemented insulations into the window shutters is insignificant due to the effect of thermal bridging around the window. Furthermore, it is worthwhile to note that the simulations were run for individual window units and not taking into consideration the building. The overall energy reduction was tested while applying the shutters to all windows of the building when compared with implementing them only on west and south facades. According to the comparison, no major difference was seen in the total energy consumption. A cost analysis for the insulation type inside the shutters did not reveal any major differences in the overall energy consumption after selecting a high or medium thermal insulation. However, when considering cost factors, medium insulation Rockwool was shown to be ten-fold more expensive, as depicted in Table 6. Upon additional analysis of the windows shutter’s application case scenarios, all windows were found to have shutters whereas the assessment of only south and east windows have shutters were conducted, as shown in Figure 11. Concerning the Rockwool insulation using different mechanisms, no differences were found with respect to cost decline.
Another aspect of the evaluation within the study, is the prediction of greenhouse gas emissions from the house, the utilization of shading devices on houses can allow the coping with sustainability in the efforts to reduce global warming within the nation. The maximum reduction in emissions achieved by this study reached up to 15% from the baseline, as, currently, UAE generates electricity through the burning of natural gas, implementation of such strategies over the scale of the country or multiple districts would reduce the carbon footprint coming from the utility plants supplying residential regions.

5. Conclusions

It is essential to reduce the energy demand in buildings whilst ensuring that buildings do not harm the health, well-being, and comfort of the people in order to achieve a sustainable building environment. This is because people tend to spend more than 80% of their time indoors. Ensuring the overall health and energy efficiency of a building is necessary to consider when designing it. Consequently, energy consumption has grown over the past few decades and the use of shading devices has been undermined. In this study, a roadmap for applying rolling window shutters as automatic shading devices was discussed to overcome the adverse effects of energy consumption in residential buildings. As an example, a case study involving the UAE is put forward. The study investigated multiple shading control strategy for the window shutters of housings positioned on the exterior façade of the building for the aim to evaluate its feasibility, thermal performance, and its effect on global warming to encourage homeowners and designers. Low, medium, and high U-values for thermal insulation materials including Rockwool, Polyurethane, and Vacuum, within exterior window shutters—within different window glass scenarios were analyzed.
The following conclusions and recommendations can be drawn:
  • Simulations showed that the use of non-conventional (Vacuum insulation panels) insulation materials within the rolling shutters have small influence in thermal performance in comparison to conventional materials (Rockwool), which leads to the effect caused by the control strategies;
  • The economic feasibility can be obtained through the selection of conventional insulating materials that cost almost 10 times less in initial cost of the material rather than savings from the annual energy consumptions as shown in the cost analysis section, especially for building that would have larger windows area;
  • The utilization of the automatic rolling shutters can be a practical retrofitting solution that would yield high reduction in heat gain and energy consumption for households that have glazing with low thermal efficiency as heat gain through reductions achieved 59% and energy consumption reduction that could reach up to 32% for the single glazing windows within this study;
  • The effect of installing the automatic shading devices can extend to decrease the environmental burden that is caused by electricity consumption, the study showed that the reduction in equivalent CO2 Emissions can vary, however in certain scenarios can reach up to 15%;
  • The control strategies implemented for these automatic rolling shades can be user specific and it is recommended that households have control systems that can alter the setpoints based on optimized on-site analysis.
The present study has analyzed the above parameters to evaluate the performance of the examined shading device with alternating insulating material and control strategies. An expansion of this work can be completed by analyzing various type of buildings as it would require different parameters to achieve optimum performance; inclusion of further parameters, such as showcasing the internal illuminance of spaces, and Daylighting Autonomy (DA); further control strategies and evaluation parameters can be explored for future work, as well as impact of insulation on heating vs. cooling demand. Cost analysis could include maintenance costs of these shutters.

Author Contributions

Formal analysis, A.D.; Investigation, A.K.A. and S.A.; Methodology, M.K., A.K.A., A.D. and S.A.; Project administration, M.K.; Software, A.K.A., A.D. and S.A.; Supervision, M.K.; Validation, A.K.A. and A.D.; Writing—original draft, A.K.A., A.D. and S.A.; Writing—review and editing, M.K. All authors have read and agreed to the published version of the manuscript.

Funding

This research received no external funding.

Conflicts of Interest

The authors declare no conflict of interest.

Appendix A

Table A1. Cost analysis of windows scenarios.
All Windows Have Shutters
Case ScenarioTotal Consumption (kWh)Reduction from No ShuttersReduction in DollarsPayback Period
Base case_ No shutters22,747
Double glass ref a–h tint 6 mm/Solar 40020,1792568210.57650
Double glass ref a–h tint 6 mm/Solar 18919,1623585293.9736
Double glass ref a–h tint 6 mm/glare 1821,2801467120.29488
Double glass ref a–h tint 6 mm air Day cooling and solar (189 W/m2)21,712103584.87125
Double glass ref a–h tint 6 mm air Day cooling and solar (400 W/m2)22,02672159.122179
Double glass ref a–h tint 6 mm air outside air and solar (38c/189 W/m2)22,23151642.312250
Double glass ref a–h tint 6 mm air outside air and solar (45c/400 W/m2)22,74160.49221,534
South and East Windows have Shutters
Case scenarioTotal consumption (kWh)Reduction from no shuttersReduction in DollarsPayback period
Base case_ No shutters22,747
Double glass ref a–h tint 6 mm/Solar 40020,8811866153.01245
Double glass ref a–h tint 6 mm/Solar 18920,0052742224.84431
Double glass ref a–h tint 6 mm/glare 1821,688105986.83880
Double glass ref a–h tint 6 mm air Day cooling and solar (189 W/m2)21,3531394114.30861
Double glass ref a–h tint 6 mm air Day cooling and solar (400 W/m2)21,5101237101.43469
Double glass ref a–h tint 6 mm air outside air and solar (38c/189 W/m2)21,4911256102.99268
Double glass ref a–h tint 6 mm air outside air and solar (45c/400 W/m2)21,691105686.59280

References

  1. Shen, L.; He, B.; Jiao, L.; Song, X.; Zhang, X. Research on the development of main policy instruments for improving building energy-efficiency. J. Clean. Prod. 2016, 112, 1789–1803. [Google Scholar] [CrossRef]
  2. Olonscheck, M.; Holsten, A.; Kropp, J.P. Heating and cooling energy demand and related emissions of the German residential building stock under climate change. Energy Policy 2011, 39, 4795–4806. [Google Scholar] [CrossRef]
  3. Brown, M.A.; Cox, M.; Staver, B.; Baer, P. Modeling climate-driven changes in U.S. buildings energy demand. Clim. Change 2016, 134, 29–44. [Google Scholar] [CrossRef]
  4. Curtis, J.; Pentecost, A. Household fuel expenditure and residential building energy efficiency ratings in Ireland. Energy Policy 2015, 76, 57–65. [Google Scholar] [CrossRef]
  5. Chen, D.; Wang, X.; Ren, Z. Selection of climatic variables and time scales for future weather preparation in building heating and cooling energy predictions. Energy Build. 2012, 51, 223–233. [Google Scholar] [CrossRef]
  6. Dubey, K.; Krarti, M. An Evaluation of High Energy Performance Residential Buildings in Bahrain. KAPSARC, KS-2017--DP16; KAPSARC: Riyadh, Saudi Arabia, 2017; pp. 1–36. [Google Scholar]
  7. Felimban, A.; Prieto, A.; Knaack, U.; Klein, T.; Qaffas, Y. Assessment of Current Energy Consumption in Residential Buildings in Jeddah, Saudi Arabia. Buildings 2019, 9, 163. [Google Scholar] [CrossRef]
  8. EIA. International Energy Outlook 2017. 2017; IEO2017, p. 143. Available online: https://www.eia.gov/outlooks/ieo/pdf/0484(2017).pdf (accessed on 13 April 2022).
  9. Meir, I.A.; Peeters, A.; Pearlmutter, D.; Halasah, S.; Garb, Y.; Davis, J.M. An assessment of regional constraints, needs and trends. Adv. Build. Energy Res. 2012, 6, 173–211. [Google Scholar] [CrossRef]
  10. WWAP. The United Nations World Water Development Report 2014; United Nations Educational, Scientific and Cultural Organization: Paris, France, 2014; Volume 1, ISBN 9789231042591. [Google Scholar]
  11. World Bank. World Bank Annual Report; World Bank: Washington, DC, USA, 2013. [Google Scholar]
  12. Dudley, B. BP Statistical Review of World Energy. 2019. Available online: https://www.bp.com/content/dam/bp/business-sites/en/global/corporate/pdfs/energy-economics/statistical-review/bp-stats-review-2019-full-report.pdf (accessed on 27 April 2022).
  13. Radhi, H. Evaluating the potential impact of global warming on the UAE residential buildings—A contribution to reduce the CO2 emissions. Build Environ. 2009, 44, 2451–2462. [Google Scholar] [CrossRef]
  14. Treyer, K.; Bauer, C. The environmental footprint of UAE’s electricity sector: Combining life cycle assessment and scenario modeling. Renew. Sustain. Energy Rev. 2016, 55, 1234–1247. [Google Scholar] [CrossRef]
  15. IEA. CO2 Emissions from Fuel Combustion 2020 Edition; International Energy Agency: Paris, France, 2020; pp. 1–92. Available online: www.iea.org (accessed on 27 April 2022).
  16. ADQCC. Abu Dhabi Technical Report-Greenhouse Gas Emissions Factors. 2015. Available online: http://qcc.abudhabi.ae/en/PublicationsStandards/2015-07TechnicalReport-PreliminaryAssessmentforGHGEFs_rev7.pdf (accessed on 27 April 2022).
  17. Ross, B.M. Design with Energy in Mind: Toward a Low-Load and High-Satisfaction Civic Architecture in the Great Lakes Basin. Master’s Thesis, University of Waterloo, Waterloo, ON, Canada, 2009. [Google Scholar]
  18. Pacheco, R.; Ordóñez, J.; Martínez, G. Energy efficient design of building: A review. Renew. Sustain. Energy Rev. 2012, 16, 3559–3573. [Google Scholar] [CrossRef]
  19. Hemsath, T.L.; Alagheband Bandhosseini, K. Sensitivity analysis evaluating basic building geometry’s effect on energy use. Renew. Energy 2015, 76, 526–538. [Google Scholar] [CrossRef]
  20. Olgyay, V. Design with Climate: Bioclimatic Approach to Architectural Regionalism: New and Expanded Edition; Princeton University Press: New Jersey, NJ, USA, 2015; ISBN 9781400873685. [Google Scholar]
  21. Horvat, I.; Dovic, D. Dynamic modeling approach for determining buildings technical system energy performance. Energy Convers. Manag. J. 2016, 125, 154–165. [Google Scholar] [CrossRef]
  22. Peng, C.; Huang, L.; Liu, J.; Huang, Y. Design and practical application of an innovative net-zero energy house with integrated photovoltaics: A case study from Solar Decathlon China 2013. Archit. Sci. Rev. 2015, 58, 144–161. [Google Scholar] [CrossRef]
  23. Evangelisti, L.; Guattari, C.; Asdrubali, F.; de Lieto Vollaro, R. An experimental investigation of the thermal performance of a building solar shading device. J. Build. Eng. 2020, 28, 101089. [Google Scholar] [CrossRef]
  24. Hernández, F.F.; Cejudo López, J.M.; Peña Suárez, J.M.; González Muriano, M.C.; Rueda, S.C. Effects of louvers shading devices on visual comfort and energy demand of an office building. A case of study. Energy Procedia 2017, 140, 207–216. [Google Scholar] [CrossRef]
  25. Evola, G.; Gullo, F.; Marletta, L. The role of shading devices to improve thermal and visual comfort in existing glazed buildings. Energy Procedia 2017, 134, 346–355. [Google Scholar] [CrossRef]
  26. Palmero-Marrero, A.I.; Oliveira, A.C. Effect of louver shading devices on building energy requirements. Appl. Energy 2010, 87, 2040–2049. [Google Scholar] [CrossRef]
  27. Florides, G.A.; Tassou, S.A.; Kalogirou, S.A.; Wrobel, L.C. Measures used to lower building energy consumption and their cost effectiveness. Appl. Energy 2002, 73, 299–328. [Google Scholar] [CrossRef]
  28. ASHRAE. Advanced Energy Design Guide for Small to Medium Office Buildings—Achieving 50% Energy Savings; American Society of Heating, Refrigerating and Air-Conditioning Engineers, Inc.: Atlanta, GA, USA, 2011. [Google Scholar]
  29. Yang, Z.; Li, X.H.; Hu, Y.F. Study on solar radiation and energy efficiency of building glass system. Appl. Therm. Eng. 2006, 26, 956–961. [Google Scholar] [CrossRef]
  30. Pereira, F.O.R.; Sharples, S. The development of a device for measuring solar heat gain and shading coefficients of windows in scale models. Energy Build. 1991, 17, 271–281. [Google Scholar] [CrossRef]
  31. Bouchlaghem, N. Optimizing the design of building envelopes for thermal performance. Autom. Constr. 2000, 10, 101–112. [Google Scholar] [CrossRef]
  32. Craven, C.; Graber-Slaght, R. Evaluating Window Insulation: Curtains, Blinds, Shutters and More; Alaska. 2011. Available online: http://www.cchrc.org/docs/reports/window_insulation_final.pdf (accessed on 13 March 2022).
  33. Tzempelikos, A.; Athienitis, A.K. The Impact of Shading Design and Control on Building Cooling and Lighting Demand. Solar Energy 2007, 81, 369–382. [Google Scholar] [CrossRef]
  34. Lampert, C.M. Smart switchable glazing for solar energy and daylight control. Sol. Energy Mater. Sol. Cells 1998, 52, 207–221. [Google Scholar] [CrossRef]
  35. Baetens, R.; Petter, B.; Gustavsen, A. Solar Energy Materials & Solar Cells Properties, requirements and possibilities of smart windows for dynamic daylight and solar energy control in buildings: A state-of-the-art review. Sol. Energy Mater. Sol. Cells 2010, 94, 87–105. [Google Scholar] [CrossRef]
  36. Tracy, C.E.; Zhang, J.G.; Benson, D.K.; Czanderna, A.W.; Deb, S.K. Accelerated durability testing of electrochromic windows. Electrochim. Acta 1999, 44, 3195–3202. [Google Scholar] [CrossRef]
  37. Korgel, B.A. Composite for smarter windows. Nature 2013, 500, 278–279. [Google Scholar] [CrossRef]
  38. Alawadhi, E.M. Using phase change materials in window shutter to reduce the solar heat gain. Energy Build. 2012, 47, 421–429. [Google Scholar] [CrossRef]
  39. Silva, T.; Vicente, R.; Rodrigues, F.; Cardoso, C. Performance of a window shutter with phase change material under summer Mediterranean climate conditions. Appl. Therm. Eng. 2015, 84, 246–256. [Google Scholar] [CrossRef]
  40. Crawley, D.B.; Lawrie, L.K.; Pedersen, C.O.; Winkelmann, F.C.; Witte, M.J.; Strand, R.K.; Liesen, R.J.; Buhl, W.F.; Huang, Y.J.; Henninger, R.H.; et al. EnergyPlus: An Update. In Proceedings of the SimBuild 2004, IBPSA-USA National Conference, Boulder, CO, USA, 4–6 August 2004. [Google Scholar]
  41. Hasan, S.; Aqeel, T.A.; Bhatt, Y. Abu Dhabi Electricity Sector: Features, Challenges and Opportunities for Market Integration; The King Abdullah Petroleum Studies and Research Center (KAPSARC): Riyadh, Saudi Arabia, 2019; pp. 1–24. [Google Scholar]
  42. Kinninmont, J. The GCC in 2020: Resources for the Future. 2010. Available online: http://graphics.eiu.com/upload/eb/GCC_in_2020_Resources_WEB.pdf (accessed on 14 March 2022).
  43. Al-Badi, A.H.; Malik, A.; Gastli, A. Sustainable energy usage in Oman—Opportunities and barriers. Renew. Sustain. Energy Rev. 2011, 15, 3780–3788. [Google Scholar] [CrossRef]
  44. Hashim, A.R.B. Planning Abu Dhabi: An Urban History; Routledge: London, UK, 2018. [Google Scholar]
  45. Salama, A.M.; Wiedmann, F.; Ibrahim, H.G. Lifestyle trends and housing typologies in emerging multicultural cities. J. Archit. Urban 2017, 41, 316–327. [Google Scholar] [CrossRef]
  46. Remali, A.M.; Salama, A.M.; Wiedmann, F.; Ibrahim, H.G. A chronological exploration of the evolution of housing typologies in Gulf cities. City Territ. Archit. 2016, 3, 1–15. [Google Scholar] [CrossRef]
  47. Sweetnam, T.; Al-Ghaithi, H.; Almaskari, B.; Calder, C.; Patterson, J.G.M.; Mohaghegh, S.M.; Oreszczyn, T.; Rasla, R. Residential Energy Use In Oman: A Scoping Study. Project Report. 2014. Available online: https://discovery.ucl.ac.uk/1425280/1/Oman%20Final%20Report%20v0%208_revised.pdf (accessed on 13 March 2022).
  48. Statistics Centre. Energy and Water Statistics. 2020. Available online: https://www.scad.gov.ae/Release%20Documents/Energy%20and%20Water%20Statistics_2019_Annual_Yearly_en.pdf (accessed on 27 April 2022).
  49. Carbon Footprint. Carbon Footprint, Country Specific Electricity Factors. 2019, pp. 1–10. Available online: https://www.carbonfootprint.com/docs/2019_06_emissions_factors_sources_for_2019_electricity.pdf (accessed on 10 February 2020).
  50. Wankanapon, P.; Mistrick, R.G. Roller Shades and Automatic Lighting Control with Solar Radiation Control Strategies. Built 2011, 1, 35–42. [Google Scholar] [CrossRef]
  51. Böer, B. An introduction to the climate of the United Arab Emirates. J. Arid Environ. 1997, 35, 3–16. [Google Scholar] [CrossRef]
  52. Hashemi, A.; Alam, M.; Ip, K. Comparative performance analysis of vacuum insulation panels in thermal window shutters. Energy Procedia 2019, 157, 837–843. [Google Scholar] [CrossRef]
Figure 1. The 3D external model of UAE residential villa.
Energies 15 05858 g001
Figure 2. The positioning of windows shading devices (From DesignBuilder).
Energies 15 05858 g002
Figure 3. Configurations of external windows shading devices applied in the study (From DesignBuilder).
Energies 15 05858 g003
Figure 4. Effect of window shutters for different glass type on heat gain (a) and the correlated yearly heat reduction (b).
Energies 15 05858 g004
Figure 5. Effect of window shutters for different glass type on the total energy consumption of the building (a) and the correlated yearly total energy saving (b).
Energies 15 05858 g005aEnergies 15 05858 g005b
Figure 6. Yearly reduction in the total heat gain through different types of window glass applying three types of window shutters’ insulations.
Energies 15 05858 g006
Figure 7. Yearly reduction in the total energy consumption of the building applying different types of window glass integrating three types of window shutters’ insulations.
Energies 15 05858 g007
Figure 8. Yearly reduction in the heat gain of the building applying different types of window glass integrating three types of window shutters’ insulations for different solar intensities.
Energies 15 05858 g008
Figure 9. Yearly reduction in the total energy consumption of the building applying different types of window glass integrating three types of window shutters’ insulations for different solar intensities.
Energies 15 05858 g009
Figure 10. Total energy saving for different types of window glass with the three types of window shutters’ insulations applying the glare with index 18.
Energies 15 05858 g010
Figure 11. The total energy consumption (a) and heat addition (b) for the first case scenario: all windows have shutters and second case scenario: south and east windows have shutters with seven different windows shutter mechanism.
Energies 15 05858 g011
Figure 12. The reduction in dollars (a) and payback period (b) for the first case scenario: all windows have shutters and second case scenario: south and east windows have shutters with seven different windows shutter mechanism.
Energies 15 05858 g012aEnergies 15 05858 g012b
Table 1. Energy consumption per capital per country in the Middle East (Source: reproduced from the data presented by [11]).
LevelWorld RankingCountryEnergy Consumption per Capita
per Year
(Kgoe/a)
Total Energy Consumption in GJ per Capita per
year
Total Energy Consumption in KWh Per Capita per year
3Qatar12,799.4537.5817,041.2
High4Kuwait12,204.3512.5816,248.8
7United Arab Emirates8271.5347.411,012.6
8Bahrain7753.7325.6510,323.2
10Oman7187.7301.889569.7
15Saudi Arabia6167.9259.058212
41Iran2816.8118.33750.2
Medium67Lebanon1526.164.12031.8
76Jordan1191.450.041586.2
78Iraq1180.349.571571.4
83Syria106344.641415.2
87Egypt903.137.931202.4
Low131Yemen297.912.51396.6
Table 2. Base case building descriptions.
Building CharacteristicsValue
Built Area164 m2
Type of BuildingResidential, villa
Windows to wall ratio20%
Total Windows area 47 (m2)
North façade’s Window area 8 (m2)
South façade’s Window area 24 (m2)
East façade’s Window area 7 (m2)
West façade’s Window area 8 (m2)
Glazing envelopeDbl LoE (e2 = 0.2) Clr 6 mm/13 mm
Arg
LocationAl-Ain, Abu Dhabi
Number of Floors2
Weather dataAbu Dhabi weather data
Table 3. Rolling window shutters description (DesignBuilder).
Shade Properties
Thickness 0.046 (m)
Conductivity 0.040 (W/m-K)
Solar transmittance 0.050
Solar reflectance 0.732
Visible transmittance0.050
Visible reflectance0.350
Long-wave emissivity 0.900
Long-wave transmittance0
Openings
Shade to glass distance 0.050 (m)
Shade top opening multiplier 1.000
Shade bottom opening multiplier1.000
Shade left-side opening multiplier0.000
Shade right-side opening multiplier0.000
Shade airflow permeability0.000
Table 4. The base case material selection as per Estidama standards.
Building
Construction
Element
Minimum
U = Value(W/m2K)
as per Estidama
Base Case Material SelectionAchieved U-Value (W/m2K)
Roof Layers0.14Concrete tiles (20 mm) - Concrete screed (20 mm) - Polyisocyanate Insulating
board (150 mm) - Concrete screed
(50 mm) - Cast Concrete (150 mm)
0.14
External Wall Layers0.32Cement/sand Plaster (20 mm) -
Solid Block (250 mm)-
rigid thermoset phenolic insulation (50 mm) - plaster/paint (20 mm)
0.24
Glazing envelope
1.9Dbl LoE (e2 = 0.2) Clr 6 mm/13 mm
Arg
1.6
Internal Floor0.15Cast concrete (150 mm)
– Rigid Phenolic insulation
(135 mm)
0.14
Ground Floor0.15Cast concrete (150 mm)
Rigid Phenolic insulation
(135 mm)
0.13
Table 5. Estidama standards and the software achievements of base case.
Case ScenarioTotal Energy Consumption (kWh/Year)Yearly Total Energy Saving %Yearly Heat Gain (kWh/Year)Yearly Heat Gain Reduction %
Single glass Clear 6 mm33,036NA26,468NA
Single Ref A-H Tint 6 mm24,5412613,26950
Double clear 6 mm/6 mm air31,411522,49615
Double glass ref a–h tint 6 mm22,7473110,39361
Double glass low e clear spec 6 mm/6 mm air26,1072114,69544
Table 6. Windows shutter control mechanism.
NumberWindows Shutter Mechanism
1Double glass ref a–h tint 6 mm/Solar 400
2Double glass ref a–h tint 6 mm/Solar 189
3Double glass ref a–h tint 6 mm/glare 18
4Double glass ref a–h tint 6 mm air Day cooling and solar (189 W/m2)
5Double glass ref a–h tint 6 mm air Day cooling and solar (400 W/m2)
6Double glass ref a–h tint 6 mm air outside air and solar (38c/189 W/m2)
7Double glass ref a–h tint 6 mm air outside air and solar (45c/400 W/m2)
Table 7. Window glass types cost.
Window Glass TypesEnergy Consumption (Whx1000)All Windows Cost
(AED Area (m2)
Total Cost
(AED)
Double Glass Clear151.2065026,130
Double Glass Low E150.8580032,160
Single Glass Reflective147.6440016,080
Double Glass Reflective147.1170028,140
Table 8. Windows shutters insulations type cost.
ItemRockwoolVacuum Insulation
Price (Dollars)/Square meter330
Window shutter (Without Insulation) Price (Dollars)/Square meter220220
Total Initial price (Dollars)10,594.7311,877.5
Total Initial price (Dollars) For only South and East facade6955.377797.5
Initial Cost savings between the two insulations with shutters (Dollars): 1282.77
Insulation Price difference between the two insulation types (%): 90
Table 9. Prediction of equivalent CO2 annual emissions.
Case ScenarioBuilding Total Consumption (kWh)Primary Source Consumption (kWh)KgCO2eqSavings (%)
Baseline
(No shutters)
22,74724,65810,684
120,17921,874947811.29
219,16220,772900015.76
321,28023,06899956.45
421,71223,53610,1984.55
522,02623,87610,3463.17
622,23124,09810,4422.27
722,74124,65110,6810.03
Publisher’s Note: MDPI stays neutral with regard to jurisdictional claims in published maps and institutional affiliations.

