Article

Evolving Gamified Smart Communities in Mexico to Save Energy in Communities through Intelligent Interfaces

1
Institute of Advanced Materials for Sustainable Manufacturing, Tecnologico de Monterrey, Monterrey 64849, Mexico
2
Institute for Energy and Environment, University of California, Berkeley, CA 94720, USA
3
Energy and Efficiency Institute, University of California, Davis, CA 95616, USA
*
Author to whom correspondence should be addressed.
Energies 2022, 15(15), 5553; https://doi.org/10.3390/en15155553
Submission received: 15 July 2022 / Revised: 26 July 2022 / Accepted: 27 July 2022 / Published: 30 July 2022
(This article belongs to the Special Issue Optimal Planning, Integration, and Control of Energy in Smart Cities)

Abstract

:
In 2021, the residential sector had an electricity consumption of around 39% in México. Householders influence the quantity of energy they manage in a home due to their preferences, culture, and economy. Hence, profiling the householders’ behavior in communities allows designers or engineers to build strategies that promote energy reductions. The household socially connected products ease routine tasks and help profile the householder. Furthermore, gamification strategies model householders’ habits by enhancing services through ludic experiences. Therefore, a gamified smart community concept emerged during this research as an understanding that this type of community does not need a physical location but has similar characteristics. Thus, this paper proposes a three-step framework to tailor interfaces. During the first step, the householder type and consumption level were analyzed using available online databases for Mexico. Then, two artificial neural networks were built, trained, and deployed during the second step to tailor an interactive interface. Thus, the third step deploys an interactive and tailored dashboard. Moreover, the research analysis reflected the predominant personality traits. Besides, some locations have more electricity consumption than others associated with the relative humidity, the outdoor temperature, or the poverty level. The interactive dashboard provides insights about the game elements needed depending on the personality traits, location, and electricity bill. Therefore, this proposal considers all householders (typical and non-typical users) to deploy tailored interfaces designed for smart communities. Currently, the game elements proposed during this research are reported by the literature, so their adoption is assured.

1. Introduction

In 2021, the residential and commercial sectors had an electricity consumption of 39% and 35%, respectively [1]. About 60% of the energy consumption in a home belongs to the Heating, Ventilation, and Air-Conditioning (HVAC) systems [2,3,4]. Thermostats control these HVAC systems in about 86% of households [5]. Connected thermostat usage reported a reduction from 10 to 35% of the peak load [6,7]. In Ref. [8], they indicated that behavioral factors explain up to 50% of the variance in HVAC consumption. Moreover, research suggests that gamification strategies can reduce energy by 22% [9]. Messages or feedback approaches, including energy consumption and comparison with the last period, can reduce energy by between 5% and 12% [10].
End-users influence the quantity of energy they manage in a home due to their thermal preferences, habits, culture, and economy [2,11,12,13,14,15,16]. Thus, they represent a crucial element in reducing electricity consumption; hence, their attitudes need to be oriented into a pro-environmental one [17,18,19]. Regrettably, trying to shape users’ habits is challenging, as it is in human nature to return to old habits [13,20,21,22]. Thus, Ponce et al. [19] proposed using gamification or game elements within products to motivate and engage householders in adopting new attitudes toward saving energy [2,19]. Besides, as the Internet of Things has increased, the appliances have become more available at home, and the householders are therefore interacting with the household appliances by monitoring their products through their phones. Hence, these household products facilitate routine tasks, provide security and safety, or even adjust visual and thermal comfort [2,19,23].
Nevertheless, the householders did not adopt these devices correctly due to usability and behavioral problems [2,19,24] and due to the lack of personalization and interaction with the product and the Human–Machine Interface (HMI) [19,25]. Usability provides effortless interaction with customers through user-friendly products, services, or software [26,27,28,29]. For instance, Nielsen [24,30,31] evaluates software interfaces using usability heuristics, successfully identifying usability problems in a fast, low-cost, and successful way [27,32]. In that sense, Ponce et al. [19] emerged with the social product concept to explain that the communication between the householder and the product and between products needs to provide a tailored service, for instance, in an intelligent home.
Smart homes were initially known as wired homes due to their technological features and usage [33]. On the other hand, the building sector defined the smart home as a dwelling equipped with information and computing technology that foresees and answers the requirements of the dwellers. Marikyan et al. [34] classified smart homes into four categories: surveillance home, assistive home, detection and multimedia home, and ecological awareness home. Furthermore, Méndez et al. [35] defined a gamified smart home as a home that uses socially connected products to profile dwellers depending on their personality traits, type of gamified user, and energy consumer sector. This home provides tailored interfaces that help the dwellers to understand the benefits of becoming energy aware.
Thus, a smart home is a dwelling supplied with software and hardware technology throughout household appliances or social products that serve and fulfill the occupants’ comfort, demands [33], recreation, safety, and well-being [35,36]. Therefore, the social products (or household appliances) track and profile the individual [2,12,37]. In Ref. [19], they proposed customized interfaces with gamification elements within the product to engage, motivate, and teach users how to lower electrical energy consumption. Hence, social interaction allows for a better understanding of the householders’ patterns to profile them [2,19]. Moreover, gamification strategies can influence dwellers’ habits [2,19,35,37]. Gamification enhances a service through ludic experiences to support the customers’ general value creation [38].
Ponce et al. [19] defined the social product as a product that observes, registers, analyzes, and changes the householder’s behavior or adapts its features online/offline to improve its performance and acceptability in the market.
The S4 product development framework produces social products by implementing sensing, smart, sustainable, social features within the social features [39]:
  • Sensing features detect events, get information, and measure changes through sensors that observe physical or environmental conditions;
  • Smart features consolidate the physical parts, smart components, and connectivity to enable the intelligence of the product by providing accessible interfaces;
  • Sustainable features produce balanced and optimized performance by incorporating social, environmental, and economic aspects;
  • The social features use communication between consumers and products and between products.
Identifying the behavior and usability problems in using connected devices and involving residential energy users in the planning, implementation, and monitoring process can help lower energy consumption. This set of homes can build a community and the set of communities can build a city.
Adopting socially connected products requires that users know that they are acquiring connected products so they can exploit their advantages. Besides, these products interpret individuals’ lifestyles and requirements. These devices are cheap and quick to obtain. Furthermore, they reduce physical demands for their operation that do not require high user knowledge levels. Moreover, these household appliances have privacy and security features and consider end-user skills not to fail or act unpredictably [40].
Moreover, understanding the householders’ behavior in communities allows designers or engineers to build strategies that promote energy reductions [41]. Consequently, a smart community has a set of smart dwellings, commodities, and green areas where its neighborhoods socially interact and relate with their peers [41]. These homes virtually interact in a specific location, surrounded by phone line communication, wireless communication technology, power line communication technology, and technology that involves dedicated wiring, such as Ethernet [42]. The smart community’s concept is relatively new [42,43,44,45,46,47,48]; it is in the infancy stage and is a smart city component [48]. Besides, a smart community can be, for instance, a university campus [49,50,51,52,53], a residential complex, or an industrial park. For this research, the smart community is conceptualized by using two available datasets that have in common the location to build this community and show the householder if their consumption is the habitual consumption for their site or if it is above or below the regular consumption.
Besides, the concept of a smart and sustainable city is based on promoting citizens’ quality of life using technology and data. Hence, this type of city must have the following characteristics [54]:
  • Citizen Centered Design;
  • Optimal technology deployment;
  • Transparency and efficiency;
  • Residents involved, informed and connected.
Furthermore, KPMG indicates that a smart and sustainable city must consider at least eight essential cores focused on the citizen [54].
  • Telecommunications: Connectivity is a fundamental foundation.
    Key elements: Broadband access, open standards (interoperability), and privacy and security)
  • Healthcare services: New technologies have the potential to change healthcare services.
    Key elements: Electronic medical records, telemedicine, and data and analysis applied to health services
  • Transportation: Transport and mobility are key challenges.
    Key elements: Smart traffic routing, smart parking, and infrastructure planning
  • Security: Changes and trends require informed decisions.
    Key elements: Access and integration of multiple data, scalability and compatibility, and information shared between various entities
  • Buildings: They generate one of the most important energy consumption.
    Key elements: Sensors and devices, smart design systems, and smart energy management systems.
  • Education: Technology will allow the adoption of new tools and techniques.
    Key elements: Accessibility, collaboration and motivation, and efficiency
  • Tourism: Better understanding of interests.
    Key elements: Incorporation of advanced technologies, optimized access to destinations and activities, and smart destinations.
  • Other services: Resource consumption optimization.
    Key elements: Water management consumption, use of Smart Grid for energy, and waste management system.
Currently, in Mexico, there are three recognized smart cities [54]:
  • 2015: The Inter-American Development Bank (BID) recognized Guadalajara as the first smart city in Mexico [55]. Guadalajara was the first metropolis recognized for its digital and intelligent transformation initiatives after the implementation of the Digital Creative City (CCD) project;
  • 2016: BID recognized Chihuahua as the second smart city for its wireless internet coverage;
  • 2019: Mexico City received the Gobernante award for its innovative use of data in the public policy cycle.
In 2021, the Smart Cities Commission of the Confederation of Industrial Chambers Mexico (CONCAMIN) presented the first version of the Strategic Agenda for the Development of Mexican Smart Cities, starting with the first group of 13 cities [56]. Their objective is to help Mexico’s cities and municipalities develop good planning that includes the city’s infrastructure and services. The evaluation of the performance of the city’s management is through the quality of life indicators having sustainability as a general principle. The 13 cities are: Aguascalientes, Chetumal (Quintana Roo), Coatzacoalcos (Veracruz), Cuernavaca (Morelos), Leon (Guanajuato), Merida (Yucatan), Mexicali (Baja California), Morelia (Michoacan), Oaxaca de Juarez, Pachuca (Hidalgo), Salina Cruz (Oaxaca), Tuxtla Gutierrez (Chiapas), and Xalapa (Veracruz).
Moreover, the smart city (smart community, smart home, and social products) involves human decisions and reasonings that positively or negatively affect electrical consumption [41]. In that sense, Artificial Intelligence (AI) mimics the solution process of the brain. Artificial Neural Networks (ANN) extract information from experimental data or databases determined by human experts. One of the most used topologies is the feed-forward propagation network and the recurrent network. In the first type, the information flows from inputs to outputs, is entirely forward with no feedback connection, and uses supervised learning methods.
Hence, this paper proposes categorizing the householder type and consumption level by analyzing databases available about the electricity consumption in Mexican households and the user type based on Mexico’s personality traits. Thus, once the type of householder around Mexico is understood, interactive and tailored interfaces for communities are deployed. The interface is based on an interactive dashboard built using LabVIEWTM V.20.0.1. This interactive dashboard collects information about the user’s personality traits and the level of home consumption for a specific location to retrieve these interfaces.
This paper is organized as follows. Section 2 describes the materials and methods used for the proposal. Section 3 shows the results of the proposal. Section 4 discusses and presents the gamified structure’s scope, advantages, and disadvantages. Finally, Section 5 presents the conclusion and future work.

2. Material and Methods

Figure 1 depicts how a connected thermostat behaves to be considered a socially connected thermostat. The user is the primary linkage between the device and the interface. The socially connected thermostat has four modes: (a) heating or cooling mode, (b) fan mode, (c) automatic mode, and (d) tailored mode. The last mode is proposed based on the householder profile and household consumption.
The energy consumption control considers four features: (a) energy saving, (b) thermal comfort, (c) forecast of energy consumption, and (d) gamified interface. The gamified interface aims to teach, engage, and motivate the householder to reduce energy consumption without affecting their thermal comfort and shows predictions of consumption based on the thermostat set point. This thermostat interface considers game elements that teach the householder the differences in energy consumption depending on the set point, location, and date so that they can visualize the possible energy consumption impact based on their actions. An example of this consumption prediction is proposed in Ref. [2]. In Ref. [57], they used image classification to predict thermal comfort and energy consumption based on clothing insulation.
The communication with other products provides information about the performance of the other household appliances and the energy consumption to create a consumption profile. Besides, it provides a social connector within the thermostat interface to promote energy savings and social interaction. In Ref. [36], they proposed a voice assistant to track seniors’ moods to promote social interaction, avoid social isolation, and link seniors with their peers. Moreover, in Refs. [35,58], they proposed a voice assistant to interact with the householders and survey them to work as a depression pre-diagnosis. All of these proposals are managed at a residential level. Furthermore, in Ref. [41], they proposed a gamified community based on the ranks of household energy consumption to provide game elements. Nevertheless, this proposal only focused on the type of home, not on the individual.
Thus, connected thermostats can be considered a social product representing an opportunity to optimize and save energy. Besides, an additional element requires the profiling of the householder to promote this interaction through gamification elements [2,19] to provide the possible reductions that research suggests [9].
  • Knowledge base step: this step gathers the data from two datasets: the 2018 National Survey on Energy Consumption in Private Homes (ENCEVI) [59] and Big Five Personality Test [60]. Then, two new datasets were created. The first dataset considered the location and personality traits from Mexico and related them with the game elements associated with each personality trait and gamified user. This association was based on what Marczewski proposed for the game elements in Ref. [61]. The second dataset included the ENCEVI dataset that deployed information about household electrical consumption in Mexico and was filtered to consider a single household member with an air conditioning system and whose home had no retailing services;
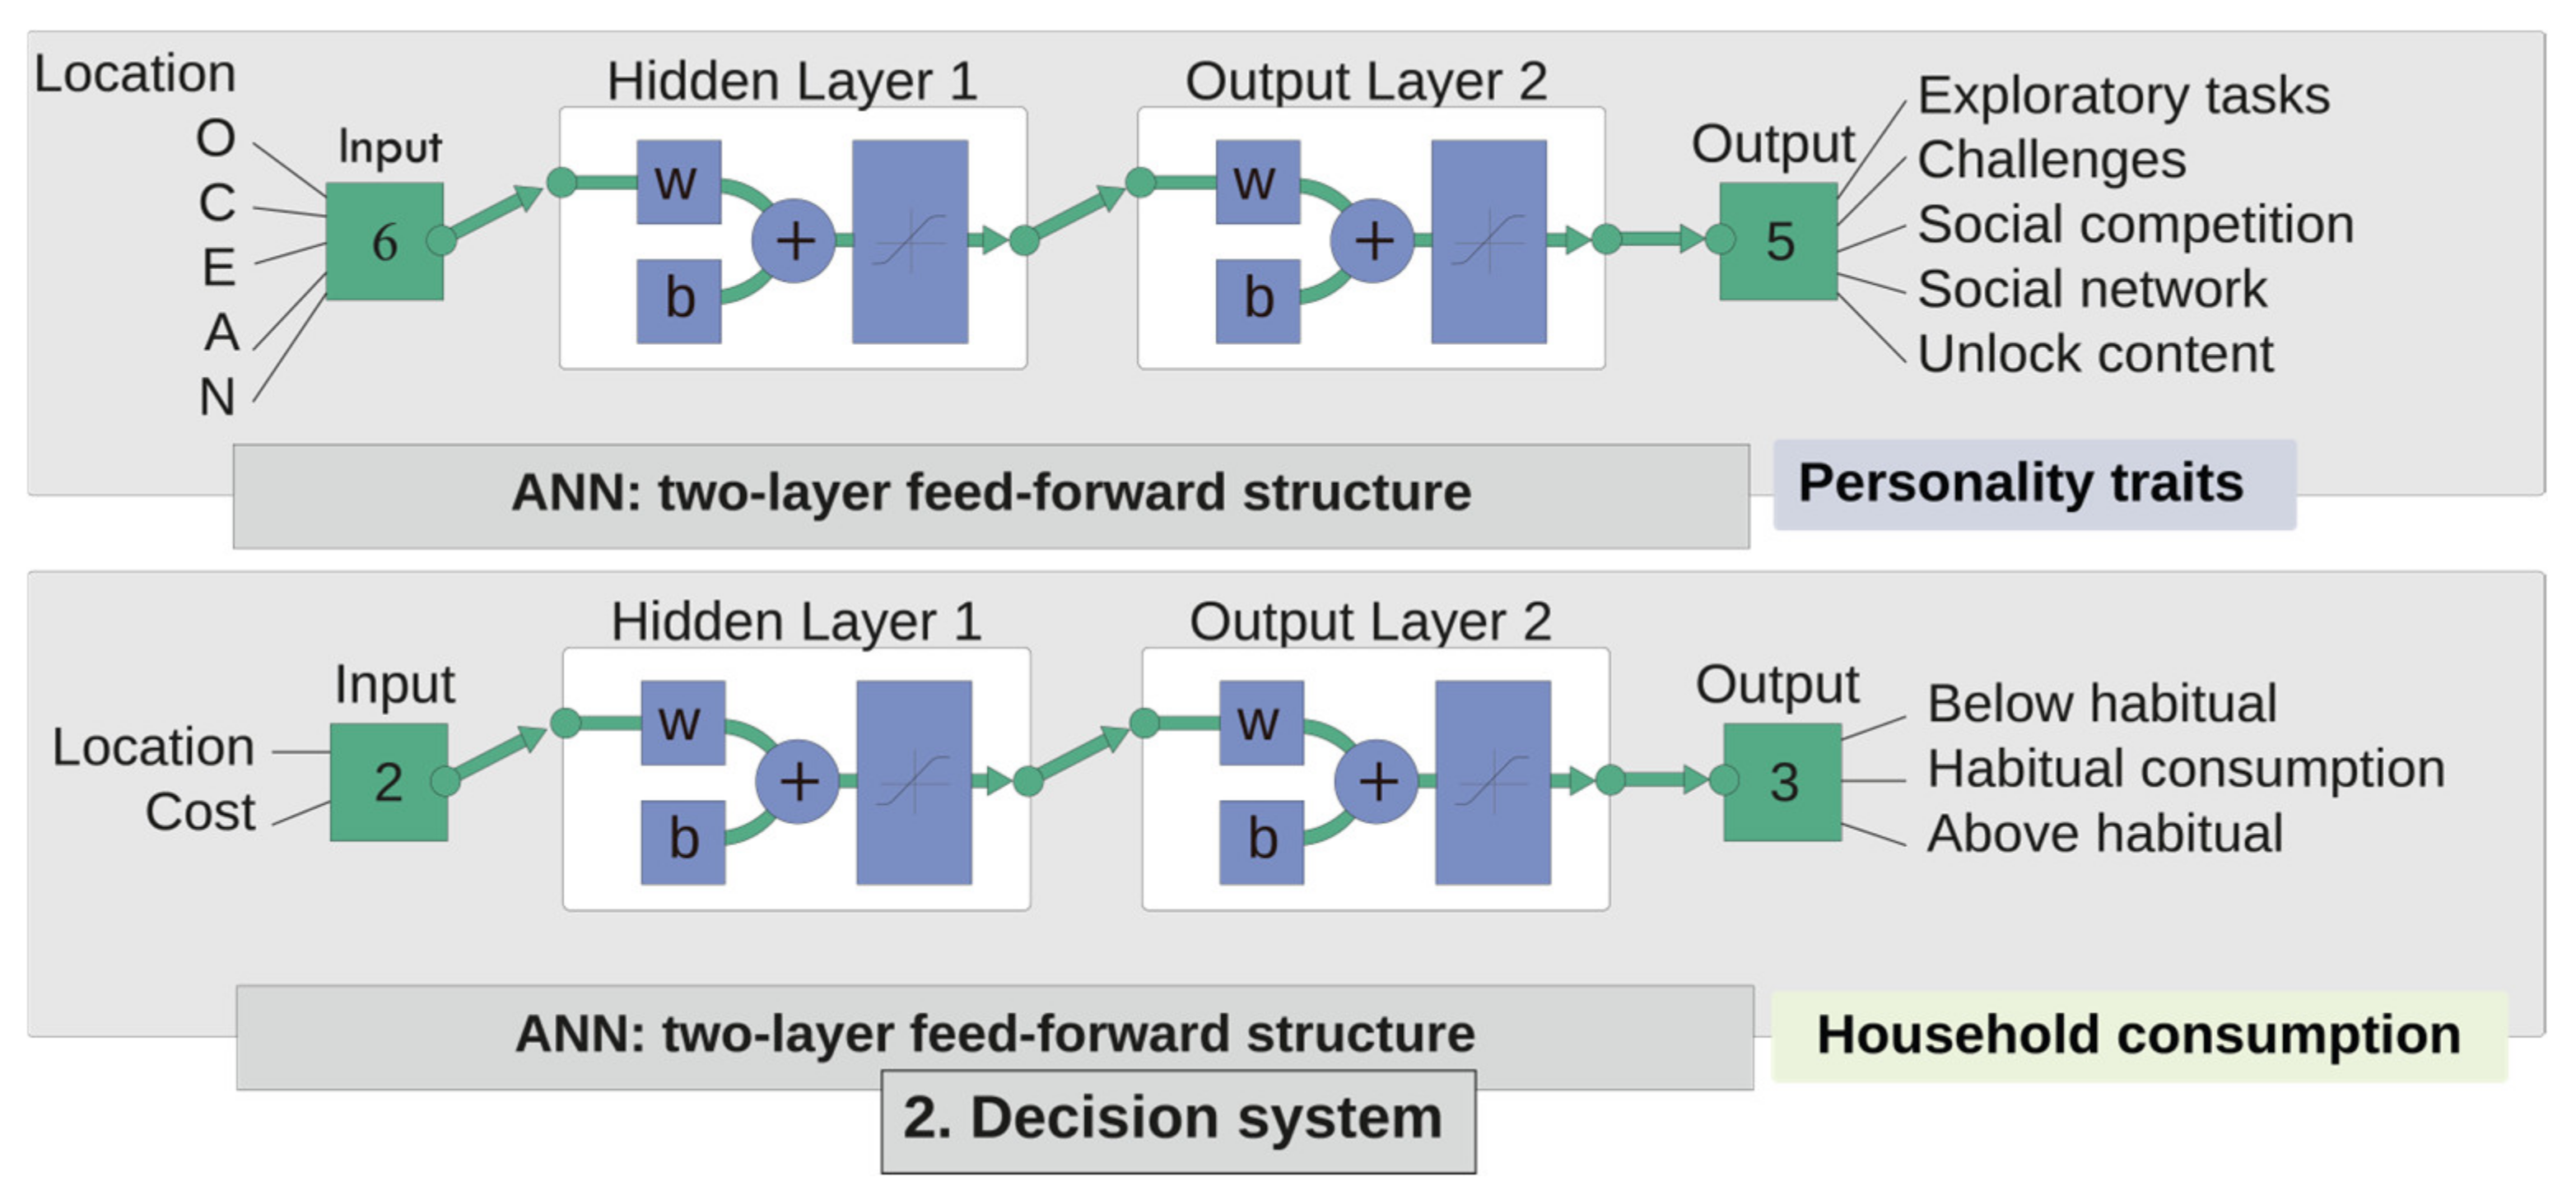
  • AI decision system step: Two two-layer feed-forward ANN were modeled in MATLAB R2021a. One was for the personality trait, and the second was for household consumption. Thus, one of the ANNs classified the gamified element based on personality traits and location. The other ANN classified the three types of consumption based on the home cost consumption; in this case, it did not use information about the kWh because the ENCEVI dataset only included information about the previous billing. Once created MATLAB’s ANNs, they were built into the LabVIEWTM environment to create the interactive dashboard;
  • Evaluation step: This step evaluates the AI algorithm through an interactive dashboard created at LabVIEWTM to propose tailored interfaces for each household type and home electricity bill. Regarding the smart community, during this step, the householder can select the location to learn how the consumption is different among other locations and in their same location how it changes depending on whether it is a habitual consumption or whether it is below or above this consumption. This phase provides continuous feedback to the user and the knowledge base to determine whether the user is engaged or if some adjustments are required.
This proposal comprises three steps to deploy a tailored interface based on the type of home and the type of householder. Figure 2 depicts the proposed diagram flow to this interactive interface based on the interactive dashboard results. Therefore, the methodology used is the framework proposed by the authors [19]:

2.1. Knowledge Base

In Refs. [62,63], the OCEAN model, or the “Big Five” personality traits, describe five personality traits depending on the perception and attitudes of the individual. The openness (O) personality trait has a positive attitude toward learning new things and an appreciation of divergent thinking where new ideas are explored. The conscientiousness (C) trait is responsible for a rational and clear purpose in life. The extraversion (E) personality is optimistic, assertive, and loves social interactions that allow diverse activities. The agreeableness (A) individual cooperates with sympathy and empathy for others. Higher levels of E and A are inclined to save energy. The neuroticism (N) trait is bad-tempered, impulsive, and experiences negative emotions. The O, C, and higher levels of E, A, and N have a positive attitude toward energy conservation and are strongly associated with their attitudes and actions in different domains [2,11,64,65,66,67]. Moreover, each personality learns things and adopts technology differently [64,68,69,70,71,72].
Goldberg deployed the Big-Five Factor Markers, which is a 50-question survey. Furthermore, in Ref. [60], they deployed a dataset with 1,015,341 responses from 223 countries worldwide and collected from 2016 to 2018 in an interactive online Goldberg’s 50-question survey. Rammstedt and John [73] deployed the short version of the Big Five Inventory (BFI-44) from 44 questions into 10. Thus, the BFI-10 is a 10-question survey that measures personality traits in a minute using a Likert response scale: (1) Very inaccurate; (2) Moderately inaccurate; (3) Neither accurate nor accurate; (4) Moderately accurate; (5) Very accurate. Goldberg’s 50-question survey is available in Ref. [74] and Big Five Inventory-10 (BFI-10) test is available in Ref. [73].
Frankel et al. [75] surveyed 2500 Americans to measure their behavioral tendencies in the United States. They aimed to detect practical tools to focus on buyers and their needs and recognize what it would need to scale up enhanced energy-efficiency-performance implementation. Besides, they identified five types of energy consumers. The green-advocate (G-A) sector has energy-saving behavior attitudes with interest in new technologies. This sector is driven by perceived environmental benefits from more efficient energy usage. The segment’s profile is not just green; it also includes an interest in using new technologies. The traditionalist cost-focused energy saver (TC-F) segment has broad energy-saving behavior motivated by cost savings. The TC-F has limited interest in new technologies. The home-focused selective energy saver (H-F) group pursues home improvement through technological and cost-saving dimensions. The H-F has an interest in saving energy.
The nongreen selective energy saver (N-G) users save energy as long as they do not have to think about it (“set and forget” interventions). Hence this type does not concern with environmental considerations. Opposite to G-A, the disengaged energy waster (D.E.W.) sector worries neither about saving energy nor money. The D.E.W. does not interest in new technologies or the environment. Ponce et al. [76] suggested classifying the O trait with the G-A, the C with the TC-F, the E with the H-F, the A with the N-G, and the N with the D.E.W.
Peham et al. [77] proposed three energy target groups regarding household appliances, user availability, characteristics, and energy awareness. Early adopters buy household appliances with cutting-edge technology, available anywhere through their modern technology gadgets. The early adopter is not energy-aware and is part of the social media communities. Besides, the early adopter relates to the N-G and D.E.W. [19]. The cost-oriented users orient their life through cost savings and select their household appliances based on the cost-savings of the devices. They are social media users and are mostly connected through their mobiles. The cost-oriented individuals look for a sustainable lifestyle depending on their capabilities because energy savings are essential. Hence, this group relates to TC-F and H-F [19]. The energy-conscious group has a sustainable lifestyle. This group is energy-aware and acquires household electrical devices with low energy consumption and a long lifetime. This group is not active on social media. Furthermore, in Ref. [19], they related the energy-conscious sector with the G-A.
Marczewski [61] proposed six types of gamified users and the game design elements associated with each user type. Purpose motivates the philanthropist (Ph) user, who is altruistic and willing to give without expecting anything in return. The suggested design elements for the Phs are collection and trading, gifting, knowledge sharing, and administrative roles. Relatedness motivates the socializer (S) type. This user type interacts with others to create social connections; thus, the suggested design elements include teams, social networks, comparison, competition, and discovery.
Autonomy motivates the free spirits (F) users, who want the freedom to express themselves and act without external control. The suggested design elements include exploratory tasks, easter eggs, unlockable content, creativity tools, and customization [62]. Competence motivates the achiever (Ach) because these individuals seek to progress within the system by completing tasks. Hence, the suggested design elements consider challenges, certificates, learning new skills, quests, levels, and epic challenges. Extrinsic rewards motivate the players (Pl) type [61]. They do whatever activity is required to gain a bonus. Thus, the suggested design elements are points, rewards, leaderboards, badges, and a virtual economy. Opposite to the Ph, change motivates the disruptor (D) type. The D users disrupt the system directly or through others to force positive or negative changes. Often the Ds are seen as cheaters or griefers; there are Ds that work to improve the system. Therefore, the suggested design elements are voting mechanisms, development tools, anonymity, innovation platforms, or anarchic gameplay [61].
Tondello et al. [78] conducted a survey and associated the six gamification user types with personality traits. The philanthropist positively correlates with O, C, E, and A personality traits. The socializer positively correlates with E and A traits. The free spirit positively correlates with O and E personality traits and negatively correlates with N. The achiever positively correlates with the C trait. The disruptor negatively correlates with the N trait, and the player type positively correlates with the C personality trait.
Thus, Figure 3 presents the personality traits as the central axis and their relationship with the gamified user to the left and the game elements associated with each one [61,78], and to the right with the energy segment [75]. Besides, each energy segment shows its belonging to one of the three energy targets [77].
Shen et al. [79] suggest considering eco-feedback interventions to influence personality traits in energy-saving attitudes. Eco-feedback aims to inform householders about their energy consumption and help them become aware through informed decisions. Besides, in Ref. [80], they performed a study of 394 households in 8 communities in Singapore, and the communities had a similar type of construction. They found that C traits are strongly associated with personal energy-conservation attitudes and efforts to influence peers toward pro-environmental behavior because this trait is associated with responsibility and thoroughness [62,63]. Furthermore, higher-income individuals are inclined to influence others in acquiring energy-saving behaviors as their basic needs are fulfilled, and they have the money to buy and understand the benefits of energy-saving attitudes.
In Ref. [10], they studied 179 households and found that E traits driven by curiosity have positive attitudes toward saving energy if they receive feedback. They found that if N traits receive feedback and ranking information, they will not save energy. Thus, N traits prefer tips over feedback. Besides, N traits prefer to have detailed electricity billings to engage in energy attitudes. On the other hand, they found that high levels of O traits prefer face-to-face feedback rather than mobile feedback. Moreover, they found that A traits need an energy-efficient role model to have positive energy attitudes [11].
Income and education impact the electricity of householders’ energy expenditure. Highly educated householders have stronger energy attitudes than lower educated individuals because their knowledge about energy-saving benefits is poor. Thus, personality traits are often considered control variables [80].
House type, orientation, location, temperature, and building materials impact residential energy consumption [2]. Surveys available at local governments provide information regarding household energy consumption. However, Shen et al. [71] found that the number of household members, cooking frequency, floor area, average area, gender, and the number of rooms had no significant correlation with efforts to influence peers to participate in pro-environmental comportment.
For instance, the Residential Energy Consumption Survey from the U.S. Energy Information Administration collects energy characteristics of the household, usage patterns, and demographics from 18,500 statistically selected homes that represent the total housing units [1]. In Mexico, the National Institute of Statistics and Geography (INEGI) deployed the 2018 National Survey on Energy Consumption in Private Homes (ENCEVI) [59]. Thus, the database collected 28,953 individuals surveyed regarding the patterns of energy consumption of homes in Mexico, the billing cost, the hours of use per domestic appliance, the type of fuel used, and the air conditioning use, among others.
When dealing with energy consumption, it is relevant to perform descriptive statistics to obtain three types of consumption: habitual consumption, above this consumption, and below this consumption. Thus, if the data is very scattered, the median, first, and third quartile frame out this habitual consumption; on the contrary, if the information is not so scattered, the mean and standard deviation should be considered.
A gamified community does not need to stay in the same physical location but has similar characteristics to build one. The set of gamified homes belongs to specific attributes of square meters of construction, the number of household members, region, or climate zone (dry, temperate, humid). Thus, a community between homes can be established, as they have similar household characteristics. However, the concept of a smart city changes because this type of city needs to be attached to a specific location. Therefore, the gamified communities, for this case, need to be in the same place to consider that set part of a smart city.
Figure 4 displays an example of this gamified community. This picture shows two interfaces for the same community of a single householder in Mexico City with an electricity bill of 110 MXN. Besides, an example of the first home is given to show a comparison with Chiapas, depicted as another community. The differences between locations relied on the “potential waste” and “potential consumption” because although there is the same electricity bill, the difference is that the consumption in Chiapas is below the habitual consumption rather than in Mexico City, where this consumption is habitual. Besides, different buttons are related to the type of personality trait. Hence, the difference between a gamified community and the standard community definition is that the gamified community does not require to be bounded in the same residential complex.

2.2. Decision System

In 1943, McCulloch and Pitts [81] introduced the first simple artificial neuron. A Neural Network is characterized by a set of processing units or neurons, an activation state for each unit equivalent to the unit’s output, and connections between units. These neurons are usually defined by a weight that determines the effect of an input signal on the unit; a propagation rule that determines the effective input of a unit from external inputs; a trigger function that updates the new trigger level based on input effect, and previous action; an external input that is the bias for each unit; a method of gathering information corresponding to the learning rule; and an environment where the system will operate, with input signals and error signals.
The most used topologies are the feed-forward or forward propagation network and the recurrent network [82]. The feed-forward network’s information flows from inputs to outputs and is exclusively forward. Therefore, it continues through multiple layers of units with no feedback connection. Opposite, the recurrent network has feedback connections derived from a process of evolution towards a stable state with no changes in the activation state of neurons.
Remaida et al. [83] performed an exploratory data analysis from a literature review of 125 research papers that published information related to ANN with personality traits analysis. The three most common topics were the cultural and socio-cognitive effect on personality traits, the correlation between brain structure and traits, and the human decisions and judgments interactions depending on the personality trait.
Méndez et al. [2] used ANN to predict energy consumption and thermal comfort depending on the location and, thus, deployed a generic gamified prototype based on a persona that was not initially profiled. Therefore, the generic persona includes all the personality traits, the gamified user type, and the give energy end-user segment type. In other words, those interfaces were generic, and they lacked personalization.
In Ref. [84], they launched a survey to request the respondents to select one of three possible connected thermostat interfaces. Therefore, they proposed a rapid prototype that predicted the gamified interface based on personality traits.
In Ref. [49], they used the Automoto database [85], filtered the data by country to select Mexico, and proposed a dashboard prototype that predicted the gamified user type depending on the personality traits.
Medina et al. [57] proposed a dynamic interface based on an energy model simulation to predict energy savings and thermal comfort depending on clothing insulation.
Thus, the proposed interactive interface must consider the personality traits, the location, and the consumption in that location. Figure 5 displays the neural networks considered during this research.
This ANN topology had been used in Refs. [2,49,84]. In Ref. [2], this type of ANN was used to predict the electricity consumption, thermal sensation, and indoor temperature depending on the month, day, hour, setpoint, outdoor temperature, and if the householder uses HVAC or opens the window when required. In Ref. [84], an ANN was used to deploy three types of interfaces due to a Mexican survey launched at Tecnologico de Monterrey, Mexico City Campus, depending on the personality traits. In Ref. [49], an ANN was used to deploy the game elements depending on the personality traits using the Automoto dataset.

2.3. Evaluation

Table 1 depicts the elements considered for the interactive dashboard, and the input values require location, personality traits, and consumption. The location is the main element that links the user and home types. Figure 6 depicts the gamified elements selected for the dashboard. The dashboard displays game elements for the energy target related to the potential of saving or spending either money or electricity. In the case of the energy conscious, the button is oriented to the potential electricity consumption; for the cost-oriented, the potential money waste, and for the early adopter, the potential money savings. In both the cost-oriented and the early adopter, money is the key element due to their motives of saving electricity, and for the energy-conscious is the electricity, as this user type is aware of the consequences of wasting energy.

3. Results

This section presents the results of each step of the diagram flow depicted in Figure 2. First, the knowledge bases’ results are described and how the two datasets were created to build the ANNs’ decision system. During the evaluation step, four interfaces are depicted, and each interface’s characteristics are explained.

3.1. Knowledge Base

The Goldberg 50-question survey was analyzed [60]. A total of 1,015,342 respondents in 223 answered this online test, which was filtered by selecting the Mexico variable (MX); thus, the total data had 11,152 observations with 111 variables, including the 50 questions described in Table 1. The data was cleaned, and the NULL values and the unanswered questions were removed, resulting in 8835 observations from the country. Then the personality trait by observation was obtained and normalized. Figure 7a shows the boxplot by location and personality trait. This map brings insights into how there are different personality traits by location, as an example is Chiapas versus Puebla. Chiapas had higher levels of O trait and lower levels of N trait than Puebla. Puebla had more individuals with N trait than O trait and had higher levels of A trait. Thus, these boxplots exemplified the importance of deploying tailored gamified interfaces.
The ENCEVI database [59] was converted into one dataset by combining the following: encevi, home, person, building, and A.C. This dataset had 28,953 variables. The cleaned dataset had 20,347 observations. Figure 7b depicts each State’s boxplots based on the rate type and the total electricity bill. The figure reflects that the unknown rate type was available in all the states, followed by the rate type 1. Therefore, Figure 7c shows the boxplots for the filtered data considering a single household member living in the home and using an air conditioning system. These boxplots show that in Aguascalientes and Estado de Mexico, the rate type 1 considered more observations than another rate. The total observations were 2041. Thus, the cleaned dataset had 984 variables.
Therefore, two datasets were created, one considering the personality traits and the other dataset considering the bill cost. Figure 8 depicts an online map created with these two datasets [86]. For example, the ID 3797 shows that in this location, the higher levels of traits O and C must consider the exploratory tasks and challenges gamified elements. Besides, it shows that it is common to have an electricity bill ranging from MXN 67.5 to MXN 223.5.
The files used to build Figure 5, Figure 7 and Figure 8 were uploaded into a GitHub repository [87]. The files titled “ElectricityBill_and_gamification-Mexico.csv” and “PersonalityTraits_and_gamification-Mexico.csv” (Personality csv file) were used to build the ANN models. The files named “OCEAN_ggplot.csv” and “ENCEVI-ggplot.csv” were used to build the boxplots for Figure 7. Besides, the Personality csv file was used to build the map for Figure 8.
Figure 8. Map of Mexican personality traits and the electricity bill by state [87].
Energies 15 05553 g008

3.2. Decision System

The electricity bill dataset considered the median and the first to third quartile to assume that this was the habitual electricity bill at home or the cost-oriented house type. Above the third quartile, it was considered that the consumption was above the regular electricity bill; thus, it was an early-adopter house type. On the contrary, the energy-conscious house type was below the first quartile and was considered below the regular electricity bill. See Appendix A for more information about the statistics used to build the dataset. Moreover, the associated game elements for each type of house are as follows:
  • Energy conscious-potential consumption game element;
  • Cost-oriented-potential waste game element;
  • Early adopter-potential savings game element.
Besides, an additional analysis was performed by location, and six variables were analyzed: region, percentage of poverty, median, relative humidity (RH), minimum outdoor temperature, and maximum outdoor temperature. However, the RH varies depending on the location and the individual. It is considered that 30% to 50% or 30% to 60% range is the comfort range [88,89]. Due to the datasets of ENCEVI and personality traits ending in 2018, the percentage of poverty was obtained from that year [90].
See Appendix B for more information about the statistics obtained for each state and the percentage of poverty, median electricity bill, relative humidity, minimum outdoor temperature, and maximum outdoor temperature. For the median electricity bill column, the states considered habitual consumption range from 143.4 to 220, with a median of 176.5. The minimum median belongs to Michoacan and the Maximum to Nuevo Leon.
Michoacan had a 46.2% of poverty and was in the average maximum temperature; it had a 58% of RH. The predominant interface was the O trait with a range of 0.7 to 0.86 (first to the third quartile). Nuevo Leon had a 19.4% of poverty and 65% of RH, and the temperature ranged from 5 °C to 32 °C. The predominant personality was the A trait with a range of 0.68 to 0.8. Queretaro had a median bill consumption of 180, 26.4% of poverty, 54% of RH, and a temperature from 6 °C to 28 °C.; the predominant personality trait was the O. These ranges of RH fell between the comfort zone of RH, except for Nuevo Leon that was 5% above the comfort zone.
In the case of poverty, Baja California Sur was the less poor state, and Chiapas was the most impoverished state with more than ¾ of a poor population. Guanajuato was near the average poverty percentage, below the mean median, and had a higher % of RH. It was expected that above 60% of RH would be uncomfortable, so the use of HVAC was required; however, the costs did not reflect that. Veracruz had the highest percentage of RH, with 85%; the electricity bill was in the limit of the third quartile, and the predominant personality was O, with a range from 0.72 to 0.88. This electricity bill reflected higher consumption due to the RH, which was outside the comfort zone by 25 to 35%. The opposite was Sonora, which had a lower RH of 38% and poverty of 26.7%. It reflected higher electricity bills due to the temperature, which ranged from 5.5 to 38; the predominant personality was the O trait. However, Chihuahua had the most extreme temperatures, ranging from −5 °C to 40 °C, and it was within the limit of the third quartile consumption; it had 26.6% of poverty.
The personality traits dataset considered that personality traits above 0.7 had a strong personality, and the associated gamified elements were as follows:
  • Openness—exploring tasks, game element;
  • Conscientiousness—challenges game element;
  • Extraversion—social competition;
  • Agreeableness—social network game element.;
  • Neuroticism—unlockable content game element.
In addition, as a generic interface, the rewards and PBL (points, badges, and leaderboard) elements were considered.
Thus, two datasets were created to feed two neural networks. Table 2 exemplifies the data used to build the first ANN, the location and personality traits were the input values, and the output values were the gamified elements. In contrast, Table 3 exemplifies the data used to build the second ANN, the input values were the location and electricity bill, and the output values were the gamified elements considered.
Thus, two neural networks were created using the nntool from MATLAB R2021a. Figure 9a displays the first neural network with 10 neurons in its hidden layer, and it is a two-later feed-forward ANN with an R equal to one. Figure 9b shows the second ANN with an R of 0.88 and 30 neurons in its hidden layer. Once the ANNs were obtained, the weights and biases were exported into LabVIEW V.20.0.1 to create the interactive dashboard and tailored interface. Figure 10a depicts the block panel, and Figure 10b shows the two ANN systems. In Figure 10c, the individual can select the location and the levels of personality traits on the front panel’s left side. Hence, on the right side, the tailored gamified interface is displayed.

3.3. Evaluation

Figure 11 displays different scenarios running the interactive dashboard considering the data from Table 2 and Table 3 to exemplify how the interactive dashboard works. Hence, four locations were selected: Campeche, Queretaro, Estado de Mexico, and Coahuila. Campeche, Queretaro, and Estado de Mexico had a predominant personality trait of O. In the dataset, only three individuals answered the survey from Campeche; thus, there was not enough information to determine the principal personality. Figure 11a shows the dashboard and interface for an individual with high levels of O and N traits, an electricity bill of USD 120 located at Campeche, and the interface showed the “potential consumption”, “unlockable content”, and “explore tasks” gamified elements. On the other hand, Figure 11b displays the same electricity bill for the Queretaro location and an individual with a high E trait; hence, the interface showed the “potential waste” and “challenge your friends”; the PBL element was the same as the generic interface. Figure 11c shows the dashboard for an electricity bill of USD 270 at Estado de Mexico for a householder with high levels of C and A traits; thus, the interface depicted the “potential savings”, “challenges”, and “social network” game elements. Opposite to this interface, it was the case for Coahuila with a householder with higher levels of C and E traits; thus, the interface showed the “potential waste”, “challenge”, and “challenge your friends” buttons.

4. Discussion

This paper addresses how a tailored dynamic interface can be designed and deployed into thermostats. On the other hand, the main issue of providing a tailored interface by learning about the context of the householder and the household is shown. Thus, this research studies the databases’ behavioral consumption and personality traits to get specific information to design the interface. The main advantage of this proposal is that it is a guide, step-by-step, that shows the researcher how to develop tailored interfaces that could be implemented not only in thermostats but also, they can be implemented in any household device for saving energy. This paper showed how to do it in the case of only having information about the total bill consumption. However, the interface can be modified by considering another household appliance, for instance, the lighting or the washing machine. This paper proposes a platform that could be extended to electrical devices in households or buildings. As the metaverse rises, future work could define the concept of a gamified smart city in terms of energy that does not need to be in a specific location, but the dynamic interface could be implemented in digital environments. Further research is required to determine if this is achievable.
The main drawback Is the limited information in the database. That means a huge database that covers all the possible locations in the world is required to implement this strategy in each location. Hence, the suggestion is to build a local database before using the proposed structure by surveying the individuals in that region and asking for their electricity bills. By analyzing Goldberg’s database, we compare the results for the personality traits of individuals with similar behavior [60]. Therefore, this proposal aims to help the researcher with the minimum characteristics required to deploy a tailored interface that promotes energy reductions.
This proposal was built with databases; hence, in the future, these databases need to be updated with newer information. Thus, this proposal can be strengthened by adding a feature that links real-time information and running again—for instance—the electricity consumption ANN model to obtain new metrics about the behavioral consumption of the households. Furthermore, this proposal lacks a faster response for obtaining the personality traits of the household. Currently, it requires surveying the householder to detect their personality traits. Thus, an opportunity area for this proposal is to deploy a system that detects the traits faster and links them with behavioral consumption.
Therefore, this article analyzes two datasets to understand the type of householder and household in Mexico. Descriptive statistics were performed to determine the range of conventional electricity bills above and below this electricity bill and the predominant personality traits for each location. This paper considers two of eight cores of the smart and sustainable city cores that KPMG indicated [54]. The other core is the Other Services using a smart grid for energy. This proposal aims to help this key element to reduce energy consumption in households that impact the grids. This paper considers that the energy management systems can provide information, for instance, about the electrical or energy consumption; thus, profiling with this methodology can be performed.
Furthermore, two datasets were created from the original datasets to narrow it to Mexico; thus, the level of bill consumption and the personality traits were considered to deploy the interactive interfaces. Besides, these datasets can be updated depending on what variable is analyzed. For example, the dataset can consider the setpoint or the electricity consumption; thus, additional variables can be added.
Consequently, this paper proposes a novel approach for tailored gamified HMI in gamified smart communities. To deploy an accurate interface is essential to break down the intelligent community structure in two steps: get the personality traits using datasets or by surveying the householder and obtain the consumption; for this research, it was the bill consumption available at the ENCEVI database; however, the personality traits can be obtained by surveying the householder and the consumption by simulation different scenarios as done in Ref. [2]. If there is enough information about a single socially connected product, as in the case of the connected thermostat, the interface can provide tailored interfaces about the thermostat. The starting point of these personalized interfaces depends on the available information. For instance, in this case, the information available was only the bill cost; thus, the starting point in this research was the home. Then, building gamified communities requires having information about the location so similar scenarios and analyses can be performed. For instance, Figure 11 displays interfaces depending on the bill cost; however, other interfaces can be displayed for the same location as suggested in Figure 4.
Regarding the interactive design, this proposal enhances tailored interfaces by bringing solutions that best suit the users’ characteristics, having as an axis the personality traits; the gamified elements were reduced into five gamified elements so as not to overwhelm the dashboard and based on Figure 3. This proposal suggests that the game elements must change to engage the householder continuously [2,19]. A tailored gamified interface engages the householder by providing them user control and real-time interaction through the dashboard, responsiveness, and personalization through the AI decision system. Thus, the dashboard deploys tailored interfaces based on the type of user and household consumption.
This framework suggests continuous feedback from the householder and tailored interaction. Nevertheless, although theory suggests changes by providing customized interfaces, these interfaces require testing in physical environments to determine if reductions can be achieved by proposing tailored interfaces. Another limitation is that this proposal uses datasets, in the case of electricity bills requiring a constant update because the cost changes depending on the season. Therefore, the dataset requires regular updates for the bill cost ANN.
This paper presents a guideline for the designer or engineer who wants to propose a tailored interface; it describes the AI decision systems used and what data must be considered to build the ANNs and deploy interactive and tailored gamified applications. Hence, this typology allows its broadening into implementation in smart cities by combining several gamified communities. Besides, the complexity increases as communities consume more energy than others and the community’s cultural characteristics. For instance, the Sonora community does not have the same bill cost range as Mexico City because it is unusual to have air conditioning systems in Mexico City. In contrast, in Sonora, it is common to have these systems due to the climate.

5. Conclusions and Directions for Future Work

Connected smart cities in developed countries are fundamental for improving citizens’ quality of life. Moreover, there are specific governmental and private programs that promote societies to be more connected. Thus, this research aims to use the information available on the internet through databases or datasets to learn about the type of household and suggest tailored interfaces that citizens can adopt. Thus, this paper completely describes how to achieve these tailored interfaces systematically. This structure considers a knowledge base, AI decision system, and evaluation stage. The knowledge base step provides information about the personality traits and consumption in specific locations to have understanding of the game elements. Hence, a tailored interface can be deployed to promote saving energy attitudes and provide AI decision systems to tailor interfaces and engage householders to become energy aware.
On the other hand, this research provided insights into energy consumption and personality traits in Mexico by understanding the available personality traits. The database presented allows us to understand the behavioral community in that region. Since the personality that dominates a region usually does not dominate the others, a specific study must be conducted for getting the data from the individuals. For instance, there are locations whose predominance is the openness personality traits, and the gamified interaction must focus on activities that bring them new ideas that they will be willing to learn as well as information about recent trends. On the contrary, if the community has predominant neuroticism personality traits, the activities must be oriented to provide a faster response but with the benefit of energy saving because this personality is impulsive. In the case of a community that predominates in extraversion, the activities must promote social interaction and foment social groups oriented to helping each other to save energy. An agreeableness community has an altruistic attitude with empathy for others. The conscientiousness community has a rational and clear purpose in targeting goals.
An additional feature is that aside from considering the community, the individual characteristics are considered. Although some communities predominate a particular personality trait, some individuals may have a different trait. For instance, the community is extraverted, but the individual has a neuroticism personality. Thus, specific activities are suggested to this individual.
For example, Nuevo Leon is 5% above the comfort zone; however, their electricity bill is higher than Veracruz. This difference may be affected by the lower temperatures registered in Nuevo Leon or by the differences between RH. Still, their electricity bill is not as high as Nuevo Leon’s. Besides, Nuevo Leon predominates as an agreeableness location, whereas Veracruz has an openness personality trait. In other words, the population in Veracruz has a positive attitude toward learning new things, and Nuevo Leon has a cooperative attitude with sympathy and empathy for others.
On the contrary, Chiapas is the poorest location with 78% and a high level of RH (78%), but their electricity costs are not as high as expected due to the RH. This can happen because the temperature ranges from 17.5 °C to 30 °C. Michoacan is the State with the lowest median electricity bill, with an RH of 58% and temperatures that range from 8 to 31%, with 46.2% of poor people. Although the temperature ranges are lower than in Chiapas, due to the RH, the individuals feel comfortable, and it can be inferred that the usage of air conditioning systems is lower than in Chiapas. Chiapas and Michoacan—the same as Veracruz—have a predominance of the openness trait. Thus, two southeastern locations have openness personality traits (Chiapas and Veracruz).
Therefore, this paper proposes a gamified smart community based on location and personality traits in Mexico. This proposal considers the householder vital in promoting energy reductions in communities by showing how consumption changes depending on the location. This concept is supported by what KPMG indicates. A smart city must be a citizen-centered design. Hence, this framework is ideal for the designer of gamified communities, gamified smart homes, or even a gamified socially connected product to implement decision systems that tailor interfaces. However, further research must determine which characteristics define gamified smart cities.
This proposal is designed to be implemented in smart communities by considering all types of end-users (non-typical and typical users). Currently, the game elements proposed in this research are reported by the literature, so their adoption is guaranteed.

Author Contributions

Conceptualization, J.I.M., A.M. (Adan Medina) and P.P.; methodology, J.I.M.; software, J.I.M.; validation, P.P., T.P., A.M. (Alan Meier) and A.M. (Arturo Molina); formal analysis, J.I.M.; investigation, J.I.M.; resources, P.P. and A.M. (Arturo Molina); data curation, J.I.M.; writing—original draft preparation, J.I.M., A.M. (Adan Medina) and P.P.; writing—review and editing, J.I.M., A.M. (Adan Medina) and P.P.; visualization, J.I.M.; supervision, P.P., T.P., A.M. (Alan Meier) and A.M. (Arturo Molina); project administration, P.P. and A.M. (Arturo Molina); funding acquisition, P.P. and A.M. (Arturo Molina). All authors have read and agreed to the published version of the manuscript.

Funding

This research project is supported by Tecnologico de Monterrey and CITRIS under the collaboration ITESM-CITRIS Smart thermostat, deep learning, and gamification project (https://citris-uc.org/2019-itesm-seed-funding/ (accessed on 25 October 2021)). Agreement: TECNOLÓGICO DE MONTERREY–CITRIS 2019.

Institutional Review Board Statement

Not applicable.

Informed Consent Statement

Not applicable.

Data Availability Statement

Data available in a publicly accessible repository. The datasets to build the ANNs models, boxplots, and the interactive map presented in this study are openly available on GitHub at https://github.com/IsabelMendezG/MexicanGamifiedTailoredInterfaces (accessed on 13 April 2022).

Acknowledgments

The authors would like to acknowledge the financial and the technical support of Tecnologico de Monterrey in the production of this work.

Conflicts of Interest

The authors declare no conflict of interest.

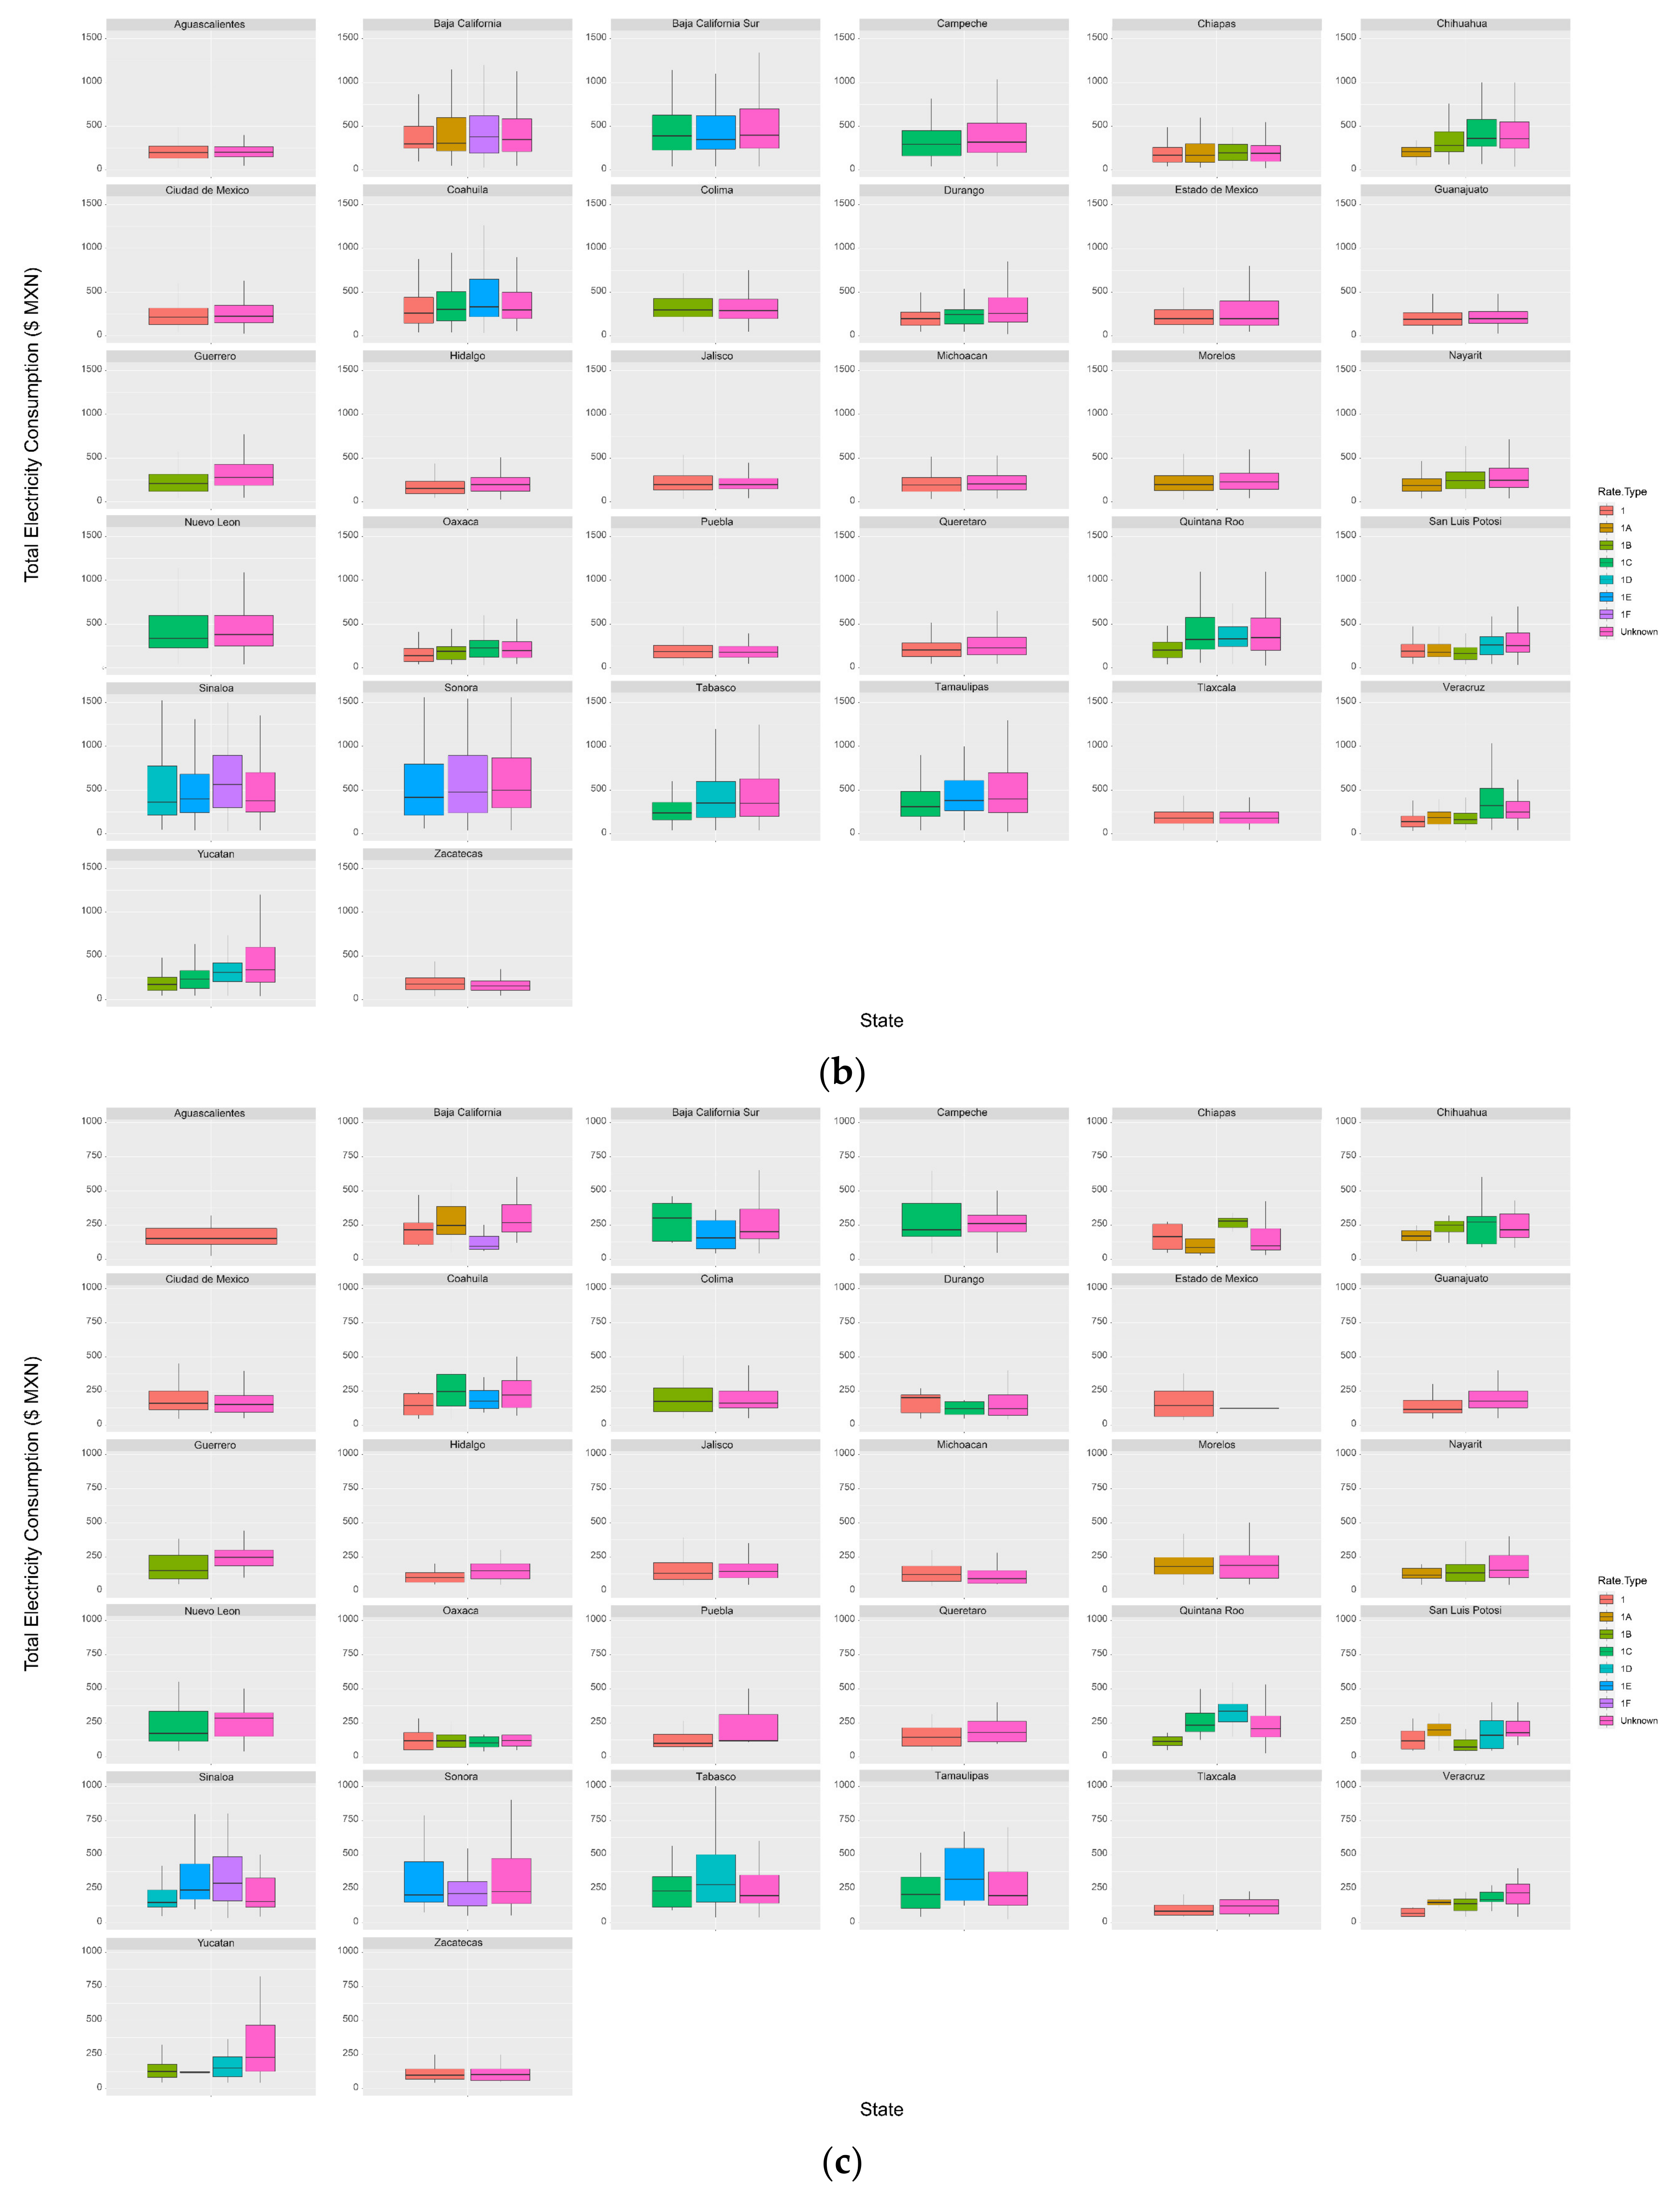
Appendix A. Electricity Bill Dataset Statistics

Table A1. Statistics used to build the electricity bill dataset.
StateQ1 (25%)MedianQ3 (75%)
1Aguascalientes108151.5224.5
2Baja California197.5267400
3Baja California Sur150200380
4Campeche200265327.5
5Coahuila127.5220325
6Colima125.75161250
7Chiapas67.597.5223.5
8Chihuahua159215331.5
9Mexico City (CDMX)92.5150215
10Durango70120221.5
11Guanajuato126.25175250
12Guerrero184247300
13Hidalgo90148200
14Jalisco96143.5200
15Estado de Mexico63.5143249.5
16Michoacan5590150
17Morelos92.5188259.75
18Nayarit98152260
19Nuevo Leon150284323
20Oaxaca80120160
21Puebla115120310
22Queretaro110180260
23Quintana Roo146210300
24San Luis Potosi150178261.5
25Sinaloa115157328
26Sonora147240488.75
27Tabasco148.75250420.5
28Tamaulipas130200400
29Tlaxcala65124170
30Veracruz139220285
31Yucatan129.5233491.25
32Zacatecas59.25103.5145

Appendix B. Mexico’s Climate Characteristics

Table A2. Statistics considered to analyze the additional variables for Mexico.
No.StateClimate RegionPoverty (%)Median ($)RH (%)Min °CMax °C
1AguascalientesTemperate26.3151.558%430
2Baja CaliforniaVery Hot23.626775%530
3Baja California SurVery Hot18.620060%935
4CampecheHumid Tropic4926572%1830
5CoahuilaVery Hot25.597.565%430
6ColimaTemperate30.421578%1830
7ChiapasHumid Tropic7815078%17.530
8ChihuahuaVery Hot26.622047%−540
9Mexico City (CDMX)Temperate3016156%525
10DurangoVery Hot38.812062%1.731
11GuanajuatoTemperate41.514371%5.230
12GuerreroHumid Tropic67.917575%1832
13HidalgoTemperate49.924762%427
14JaliscoTemperate27.814862%723
15Estado de MexicoTemperate41.8143.568%325
16MichoacanTemperate46.29058%831
17MorelosTemperate48.518856%1032
18NayaritTemperate35.715268%1235
19Nuevo LeonVery Hot19.428465%532
20OaxacaHumid Tropic64.312063%12.531
21PueblaTemperate5812072%6.528.5
22QueretaroTemperate26.418054%628
23Quintana RooHumid Tropic30.221078%1733
24San Luis PotosiTemperate42.117858%8.432
25SinaloaVery Hot3115765%10.536
26SonoraVery Hot26.724038%5.538
27TabascoHumid Tropic56.425075%18.536
28TamaulipasVery Hot34.520079%1022
29TlaxcalaTemperate5112472%1.525
30VeracruzHumid Tropic60.222085%1332
31YucatanHumid Tropic4423371%1636
32ZacatecasTemperate49.2103.573%330
Overall StatisticsMin-18.69038−522
First Quartile-27.5143.459.54.829.6
Median-40.2176.566.57.530.5
Mean-40.6179.866.28.730.8
Third Quartile-49.422073.512.632.3
Max-782848518.540
Standard Deviation-1553.710.164.2

References

  1. EIA U.S. Energy Information Administration—EIA—Table 7.6 Electricity End Use 2021. Available online: https://www.eia.gov/totalenergy/data/browser/index.php?tbl=T07.06#/?f=A&start=2020&end=2021&charted=5-6-7 (accessed on 9 May 2022).
  2. Méndez, J.I.; Peffer, T.; Ponce, P.; Meier, A.; Molina, A. Empowering Saving Energy at Home through Serious Games on Thermostat Interfaces. Energy Build. 2022, 263, 112026. [Google Scholar] [CrossRef]
  3. Tomat, V.; Ramallo-González, A.P.; Skarmeta Gómez, A.F. A Comprehensive Survey about Thermal Comfort under the IoT Paradigm: Is Crowdsensing the New Horizon? Sensors 2020, 20, 4647. [Google Scholar] [CrossRef] [PubMed]
  4. Chaudhuri, T.; Soh, Y.C.; Li, H.; Xie, L. A Feedforward Neural Network Based Indoor-Climate Control Framework for Thermal Comfort and Energy Saving in Buildings. Appl. Energy 2019, 248, 44–53. [Google Scholar] [CrossRef]
  5. Bienvenido-Huertas, D.; Sánchez-García, D.; Rubio-Bellido, C.; Pulido-Arcas, J.A. Influence of the Improvement in Thermal Expectation Levels with Adaptive Setpoint Temperatures on Energy Consumption. Appl. Sci. 2020, 10, 5282. [Google Scholar] [CrossRef]
  6. Huchuk, B.; O’Brien, W.; Sanner, S. A Longitudinal Study of Thermostat Behaviors Based on Climate, Seasonal, and Energy Price Considerations Using Connected Thermostat Data. Build. Environ. 2018, 139, 199–210. [Google Scholar] [CrossRef]
  7. Cetin, K.S.; O’Neill, Z. Smart Meters and Smart Devices in Buildings: A Review of Recent Progress and Influence on Electricity Use and Peak Demand. Curr. Sustain. Renew. Energy Rep. 2017, 4, 1–7. [Google Scholar] [CrossRef]
  8. Fanghella, V.; Della Valle, N. A Behavioral Model for In-Home Displays Usage in Social Housing Districts. In Smart and Sustainable Planning for Cities and Regions: Results of SSPCR 2019; Bisello, A., Vettorato, D., Haarstad, H., Borsboom-van Beurden, J., Eds.; Springer International Publishing: Cham, Switzerland, 2021; pp. 511–524. ISBN 978-3-030-57332-4. [Google Scholar]
  9. Chatzigeorgiou, I.M.; Andreou, G.T. A Systematic Review on Feedback Research for Residential Energy Behavior Change through Mobile and Web Interfaces. Renew. Sustain. Energy Rev. 2021, 135, 110187. [Google Scholar] [CrossRef]
  10. Shen, M.; Lu, Y.; Wei, K.H.; Cui, Q. Prediction of Household Electricity Consumption and Effectiveness of Concerted Intervention Strategies Based on Occupant Behaviour and Personality Traits. Renew. Sustain. Energy Rev. 2020, 127, 109839. [Google Scholar] [CrossRef]
  11. Shen, M.; Lu, Y.; Tan, K.Y. Big Five Personality Traits, Demographics and Energy Conservation Behaviour: A Preliminary Study of Their Associations in Singapore. Energy Procedia 2019, 158, 3458–3463. [Google Scholar] [CrossRef]
  12. Csoknyai, T.; Legardeur, J.; Akle, A.A.; Horváth, M. Analysis of Energy Consumption Profiles in Residential Buildings and Impact Assessment of a Serious Game on Occupants’ Behavior. Energy Build. 2019, 196, 1–20. [Google Scholar] [CrossRef]
  13. Iweka, O.; Liu, S.; Shukla, A.; Yan, D. Energy and Behaviour at Home: A Review of Intervention Methods and Practices. Energy Res. Soc. Sci. 2019, 57, 101238. [Google Scholar] [CrossRef]
  14. Paone, A.; Bacher, J.-P. The Impact of Building Occupant Behavior on Energy Efficiency and Methods to Influence It: A Review of the State of the Art. Energies 2018, 11, 953. [Google Scholar] [CrossRef] [Green Version]
  15. Peffer, T.; Perry, D.; Pritoni, M.; Aragon, C.; Meier, A. Facilitating Energy Savings with Programmable Thermostats: Evaluation and Guidelines for the Thermostat User Interface. Ergonomics 2013, 56, 463–479. [Google Scholar] [CrossRef] [Green Version]
  16. Bednar, D.J.; Reames, T.G. Recognition of and Response to Energy Poverty in the United States. Nat. Energy 2020, 5, 432–439. [Google Scholar] [CrossRef]
  17. Morganti, L.; Pallavicini, F.; Cadel, E.; Candelieri, A.; Archetti, F.; Mantovani, F. Gaming for Earth: Serious Games and Gamification to Engage Consumers in pro-Environmental Behaviours for Energy Efficiency. Energy Res. Soc. Sci. 2017, 29, 95–102. [Google Scholar] [CrossRef]
  18. De Leeuw, A.; Valois, P.; Ajzen, I.; Schmidt, P. Using the Theory of Planned Behavior to Identify Key Beliefs Underlying Pro-Environmental Behavior in High-School Students: Implications for Educational Interventions. J. Environ. Psychol. 2015, 42, 128–138. [Google Scholar] [CrossRef]
  19. Ponce, P.; Meier, A.; Mendez, J.; Peffer, T.; Molina, A.; Mata, O. Tailored Gamification and Serious Game Framework Based on Fuzzy Logic for Saving Energy in Smart Thermostats. J. Clean. Prod. 2020, 262, 121167. [Google Scholar] [CrossRef]
  20. Prochaska, J.O.; Velicer, W.F. The Transtheoretical Model of Health Behavior Change. Am. J. Health Promot. 1997, 12, 38–48. [Google Scholar] [CrossRef]
  21. Ajzen, I. From Intentions to Actions: A Theory of Planned Behavior. In Action Control: From Cognition to Behavior; Kuhl, J., Beckmann, J., Eds.; Springer: Berlin/Heidelberg, Germany, 1985; pp. 11–39. ISBN 978-3-642-69746-3. [Google Scholar]
  22. Ryan, R.; Deci, E. Self-Determination Theory and the Facilitation of Intrinsic Motivation, Social Development, and Well-Being. Am. Psychol. 2000, 55, 68–78. [Google Scholar] [CrossRef]
  23. Lu, Q.; Zhang, Z.; Lü, S. Home Energy Management in Smart Households: Optimal Appliance Scheduling Model with Photovoltaic Energy Storage System. Energy Rep. 2020, 6, 2450–2462. [Google Scholar] [CrossRef]
  24. Nielsen, J. 10 Heuristics for User Interface Design: Article by Jakob Nielsen. Available online: https://www.nngroup.com/articles/ten-usability-heuristics/ (accessed on 7 April 2020).
  25. AlSkaif, T.; Lampropoulos, I.; van den Broek, M.; van Sark, W. Gamification-Based Framework for Engagement of Residential Customers in Energy Applications. Energy Res. Soc. Sci. 2018, 44, 187–195. [Google Scholar] [CrossRef]
  26. Lacey, M. Usability Matters: Mobile-First UX for Developers and Other Accidental Designers, 1st ed.; Manning Publications Co.: Shelter Island, NY, USA, 2018; ISBN 978-1-61729-393-1. [Google Scholar]
  27. Chen, S.Y.; Macredie, R.D. The Assessment of Usability of Electronic Shopping: A Heuristic Evaluation. Int. J. Inf. Manag. 2005, 25, 516–532. [Google Scholar] [CrossRef] [Green Version]
  28. Quiñones, D.; Rusu, C. Applying a Methodology to Develop User EXperience Heuristics. Comput. Stand. Interfaces 2019, 66, 103345. [Google Scholar] [CrossRef]
  29. Muller, M.J.; Matheson, L.; Page, C.; Gallup, R. Methods & Tools: Participatory Heuristic Evaluation. Interactions 1998, 5, 13–18. [Google Scholar] [CrossRef]
  30. Nielsen, J.; Molich, R. Heuristic Evaluation of User Interfaces. In Proceedings of the SIGCHI Conference on Human Factors in Computing Systems Empowering People—CHI ’90, Seattle, WA, USA, 1–5 April 1990; ACM Press: Seattle, WA, USA, 1990; pp. 249–256. [Google Scholar]
  31. Nielsen, J. Enhancing the Explanatory Power of Usability Heuristics. In Proceedings of the SIGCHI Conference on Human Factors in Computing Systems, Boston, MA, USA, 24–28 April 1994; Association for Computing Machinery: New York, NY, USA, 1994; pp. 152–158. [Google Scholar]
  32. Greenberg, S.; Fitzpatrick, G.; Gutwin, C.; Kaplan, S. Adapting the Locales Framework for Heuristic Evaluation of Groupware. AJIS 2000, 7, 102–108. [Google Scholar] [CrossRef] [Green Version]
  33. Harper, R. (Ed.) Inside the Smart Home; Springer: London, UK; New York, NY, USA, 2003; ISBN 978-1-85233-688-2. [Google Scholar]
  34. Marikyan, D.; Papagiannidis, S.; Alamanos, E. A Systematic Review of the Smart Home Literature: A User Perspective. Technol. Forecast. Soc. Chang. 2019, 138, 139–154. [Google Scholar] [CrossRef]
  35. Méndez, J.I.; Meza-Sánchez, A.V.; Ponce, P.; McDaniel, T.; Peffer, T.; Meier, A.; Molina, A. Smart Homes as Enablers for Depression Pre-Diagnosis Using PHQ-9 on HMI through Fuzzy Logic Decision System. Sensors 2021, 21, 7864. [Google Scholar] [CrossRef]
  36. Méndez, J.I.; Mata, O.; Ponce, P.; Meier, A.; Peffer, T.; Molina, A. Multi-Sensor System, Gamification, and Artificial Intelligence for Benefit Elderly People. In Challenges and Trends in Multimodal Fall Detection for Healthcare; Ponce, H., Martínez-Villaseñor, L., Brieva, J., Moya-Albor, E., Eds.; Springer International Publishing: Cham, Switzerland, 2020; Volume 273, pp. 207–235. ISBN 978-3-030-38747-1. [Google Scholar]
  37. Avila, M.; Méndez, J.I.; Ponce, P.; Peffer, T.; Meier, A.; Molina, A. Energy Management System Based on a Gamified Application for Households. Energies 2021, 14, 3445. [Google Scholar] [CrossRef]
  38. Huotari, K.; Hamari, J. Defining Gamification: A Service Marketing Perspective. In Proceedings of the 16th International Academic MindTrek Conference on—MindTrek ’12, Tampere, Finland, 3–5 October 2012; ACM Press: Tampere, Finland, 2012; p. 17. [Google Scholar]
  39. Méndez, J.I.; Ponce, P.; Meier, A.; Peffer, T.; Mata, O.; Molina, A. S4 Product Design Framework: A Gamification Strategy Based on Type 1 and 2 Fuzzy Logic. In Proceedings of the Smart Multimedia: Methodologies and Algorithms, San Diego, CA, USA, 16 December 2019; p. 15. [Google Scholar]
  40. Hargreaves, T.; Wilson, C. Smart Homes and Their Users; Human–Computer Interaction Series; Springer International Publishing: Cham, Switzerland, 2017; ISBN 978-3-319-68017-0. [Google Scholar]
  41. Méndez, J.I.; Ponce, P.; Medina, A.; Meier, A.; Peffer, T.; McDaniel, T.; Molina, A. Human-Machine Interfaces for Socially Connected Devices: From Smart Households to Smart Cities. In Multimedia for Accessible Human Computer Interfaces; McDaniel, T., Liu, X., Eds.; Springer International Publishing: Cham, Switzerland, 2021; pp. 253–289. ISBN 978-3-030-70715-6. [Google Scholar]
  42. Li, X.; Lu, R.; Liang, X.; Shen, X.; Chen, J.; Lin, X. Smart Community: An Internet of Things Application. IEEE Commun. Mag. 2011, 49, 68–75. [Google Scholar] [CrossRef]
  43. Blog Geographica. Azahara. Smart Cities vs. Smart Communities. Available online: https://geographica.com/en/blog/smart-community (accessed on 5 July 2022).
  44. Ceglia, F.; Esposito, P.; Marrasso, E.; Sasso, M. From Smart Energy Community to Smart Energy Municipalities: Literature Review, Agendas and Pathways. J. Clean. Prod. 2020, 254, 120118. [Google Scholar] [CrossRef]
  45. Fingerman, A. Smart Homes Need Smart Communities. Available online: https://social.techcrunch.com/2015/09/28/smart-homes-need-smart-communities (accessed on 8 April 2022).
  46. Urbytus. Smart Communities, Somewhere between Smart Homes and Smart Cities. Available online: https://www.urbytus.com/smart-communities-somewhere-between-smart-homes-and-smart-cities (accessed on 18 May 2022).
  47. Nishi, H.; Nakamura, Y. IoT-Based Monitoring for Smart Community. In Urban Systems Design; Elsevier: Amsterdam, The Netherlands, 2020; pp. 335–344. ISBN 978-0-12-816055-8. [Google Scholar]
  48. Qi, L.; Guo, J. Development of Smart City Community Service Integrated Management Platform. Int. J. Distrib. Sens. Netw. 2019, 15, 155014771985197. [Google Scholar] [CrossRef]
  49. Méndez, J.I.; Ponce, P.; Peffer, T.; Meier, A.; Molina, A. A Gamified HMI as a Response for Implementing a Smart-Sustainable University Campus. In Proceedings of the Smart and Sustainable Collaborative Networks 4.0, Saint-Étienne, France, 22–24 November 2021; Camarinha-Matos, L.M., Boucher, X., Afsarmanesh, H., Eds.; Springer International Publishing: Cham, Switzerland, 2021; pp. 683–691. [Google Scholar]
  50. Mendez, J.I.; Ponce, P.; Medina, A.; Peffer, T.; Meier, A.; Molina, A. A Smooth and Accepted Transition to the Future of Cities Based on the Standard ISO 37120, Artificial Intelligence, and Gamification Constructors. In Proceedings of the 2021 IEEE European Technology and Engineering Management Summit (E-TEMS), Dortmund, Germany, 18–20 March 2021; IEEE: Dortmund, Germany, 2021; pp. 65–71. [Google Scholar]
  51. Verstaevel, N.; Boes, J.; Gleizes, M.-P. From Smart Campus to Smart Cities Issues of the Smart Revolution. In Proceedings of the 2017 IEEE SmartWorld, Ubiquitous Intelligence & Computing, Advanced & Trusted Computed, Scalable Computing & Communications, Cloud & Big Data Computing, Internet of People and Smart City Innovation (SmartWorld/SCALCOM/UIC/ATC/CBDCom/IOP/SCI), San Francisco, CA, USA, 4–8 August 2017; IEEE: San Francisco, CA, USA, 2017; pp. 1–6. [Google Scholar]
  52. Da Silva, L.C.P.; Villalva, M.G.; de Almeida, M.C.; Brittes, J.L.P.; Yasuoka, J.; Cypriano, J.G.I.; Dotta, D.; Pereira, J.T.V.; Salles, M.B.C.; Archilli, G.B.; et al. Sustainable Campus Model at the University of Campinas—Brazil: An Integrated Living Lab for Renewable Generation, Electric Mobility, Energy Efficiency, Monitoring and Energy Demand Management. In Towards Green Campus Operations: Energy, Climate and Sustainable Development Initiatives at Universities; Leal Filho, W., Frankenberger, F., Iglecias, P., Mülfarth, R.C.K., Eds.; World Sustainability Series; Springer International Publishing: Cham, Switzerland, 2018; pp. 457–472. ISBN 978-3-319-76885-4. [Google Scholar]
  53. Bi, T. The Design and Implementation of Smart Campus System. JCP 2017, 12, 527–533. [Google Scholar] [CrossRef]
  54. KPMG Smart Cities en México: Factores de éxito—KPMG México. Available online: https://home.kpmg/mx/es/home/tendencias/2021/10/ao-smart-cities-en-mexico-factores-de-exito.html (accessed on 14 July 2022).
  55. Flores, L. Ciudad de México, Puebla, Guadalajara y Monterrey, Con Mayor Necesidad de Crear Soluciones Inteligentes: KPMG. Available online: https://www.eleconomista.com.mx/empresas/Ciudad-de-Mexico-Puebla-Guadalajara-y-Monterrey-con-mayor-necesidad-de-crear-soluciones-inteligentes-KPMG-en-Mexico-20211025-0074.html (accessed on 14 July 2022).
  56. Concamin Emite Concamin Lista de 13 Ciudades Que Serán Promovidas Como “Smart Cities”. Available online: https://www.concamin.org.mx/prensa/sala/concamin/noticias/60d5f9647c9e64003b83726e (accessed on 14 July 2022).
  57. Medina, A.; Méndez, J.I.; Ponce, P.; Peffer, T.; Meier, A.; Molina, A. Using Deep Learning in Real-Time for Clothing Classification with Connected Thermostats. Energies 2022, 15, 1811. [Google Scholar] [CrossRef]
  58. Quiroz, J.C.; Bongolan, T.; Ijaz, K. Alexa Depression and Anxiety Self-Tests: A Preliminary Analysis of User Experience and Trust. In Proceedings of the Adjunct Proceedings of the 2020 ACM International Joint Conference on Pervasive and Ubiquitous Computing and Proceedings of the 2020 ACM International Symposium on Wearable Computers, Virtual Event, Mexico, 12–17 September 2020; pp. 494–496. [Google Scholar]
  59. INEGI. Encuesta Nacional Sobre Consumo de Energéticos En Viviendas Particulares (ENCEVI). 2018. Available online: https://www.inegi.org.mx/programas/encevi/2018/#Microdatos (accessed on 16 May 2022).
  60. Tunguz, B. Big Five Personality Test. Available online: https://www.kaggle.com/tunguz/big-five-personality-test (accessed on 15 June 2022).
  61. Marczewski, A. Even Ninja Monkeys Like to Play: Gamification, Game Thinking and Motivational Design; CreateSpace Independent Publishing Platform: Scotts Valley, CA, USA, 2015; ISBN 978-1-5147-4566-3. [Google Scholar]
  62. McCrae, R.R.; Costa, P.T. Personality Trait Structure as a Human Universal. Am. Psychol. 1997, 52, 509–516. [Google Scholar] [CrossRef]
  63. John, O.P.; Srivastava, S. The Big Five Trait Taxonomy: History, Measurement, and Theoretical Perspectives. In Handbook of Personality: Theory and Research, 2nd ed.; Guilford Press: New York, NY, USA, 1999; pp. 102–138. ISBN 1-57230-483-9. [Google Scholar]
  64. Paunonen, S.V. Big Five Factors of Personality and Replicated Predictions of Behavior. J. Personal. Soc. Psychol. 2003, 84, 411–424. [Google Scholar] [CrossRef]
  65. Brick, C.; Lewis, G.J. Unearthing the “Green” Personality: Core Traits Predict Environmentally Friendly Behavior. Environ. Behav. 2016, 48, 635–658. [Google Scholar] [CrossRef] [Green Version]
  66. Hirsh, J.B. Personality and Environmental Concern. J. Environ. Psychol. 2010, 30, 245–248. [Google Scholar] [CrossRef]
  67. Milfont, T.L.; Sibley, C.G. The Big Five Personality Traits and Environmental Engagement: Associations at the Individual and Societal Level. J. Environ. Psychol. 2012, 32, 187–195. [Google Scholar] [CrossRef]
  68. Komarraju, M.; Karau, S.J.; Schmeck, R.R.; Avdic, A. The Big Five Personality Traits, Learning Styles, and Academic Achievement. Personal. Individ. Differ. 2011, 51, 472–477. [Google Scholar] [CrossRef]
  69. Paunonen, S.V.; Ashton, M.C. Big Five Predictors of Academic Achievement. J. Res. Personal. 2001, 35, 78–90. [Google Scholar] [CrossRef] [Green Version]
  70. Judge, T.A.; Higgins, C.A.; Thoresen, C.J.; Barrick, M.R. The Big Five Personality Traits, General Mental Ability, and Career Success across the Life Span. Pers. Psychol. 1999, 52, 621–652. [Google Scholar] [CrossRef]
  71. Tomšik, R. Impact of Big Five Personality Traits on Academic Performance of University Students. Nekonečno v Psychologii 2018, 8, 53–61. Available online: https://psych.upol.cz/fileadmin/userdata/FF/katedry/pch/verejnosti/sbornik_020818.pdf#page=34 (accessed on 25 July 2022).
  72. Roos, J.M.; Kazemi, A. Personality Traits and Internet Usage across Generation Cohorts: Insights from a Nationally Representative Study. Curr. Psychol. 2018, 40, 1287–1297. [Google Scholar] [CrossRef] [Green Version]
  73. Rammstedt, B.; John, O.P. Measuring Personality in One Minute or Less: A 10-Item Short Version of the Big Five Inventory in English and German. J. Res. Personal. 2007, 41, 203–212. [Google Scholar] [CrossRef]
  74. IPIP Administering IPIP Measures, with a 50-Item Sample Questionnaire. Available online: https://ipip.ori.org/new_ipip-50-item-scale.htm (accessed on 25 July 2022).
  75. Frankel, D.; Heck, S.; Tai, H. Using a Consumer-Segmentation Approach to Make Energy-Efficiency Gains in the Residential Market; McKinsey and Company: Chicago, IL, USA, 2013; pp. 1–9. [Google Scholar]
  76. Ponce, P.; Peffer, T.; Molina, A.; Barcena, S. Social Creation Networks for Designing Low Income Interfaces in Programmable Thermostats. Technol. Soc. 2020, 62, 101299. [Google Scholar] [CrossRef]
  77. Peham, M.; Breitfuss, G.; Michalczuk, R. The “EcoGator” App: Gamification for Enhanced Energy Efficiency in Europe. In Proceedings of the Second International Conference on Technological Ecosystems for Enhancing Multiculturality—TEEM ’14, Salamanca, Spain, 1–3 October 2014; ACM Press: Salamanca, Spain, 2014; pp. 179–183. [Google Scholar]
  78. Tondello, G.F.; Wehbe, R.R.; Diamond, L.; Busch, M.; Marczewski, A.; Nacke, L.E. The Gamification User Types Hexad Scale. In Proceedings of the 2016 Annual Symposium on Computer-Human Interaction in Play–CHI PLAY ’16, Austin, TX, USA, 16–19 October 2016; ACM Press: Austin, TX, USA, 2016; pp. 229–243. [Google Scholar]
  79. Shen, M.; Li, X.; Song, X.; Lu, Y. Linking Personality Traits to Behavior-Based Intervention: Empirical Evidence from Hangzhou, China. Environ. Impact Assess. Rev. 2022, 95, 106796. [Google Scholar] [CrossRef]
  80. Liu, X.; Wang, Q.-C.; Jian, I.Y.; Chi, H.-L.; Yang, D.; Chan, E.H.-W. Are You an Energy Saver at Home? The Personality Insights of Household Energy Conservation Behaviors Based on Theory of Planned Behavior. Resour. Conserv. Recycl. 2021, 174, 105823. [Google Scholar] [CrossRef]
  81. McCulloch, W.S.; Pitts, W. A Logical Calculus of the Ideas Immanent in Nervous Activity. Bull. Math. Biophys. 1943, 5, 115–133. [Google Scholar] [CrossRef]
  82. Ponce, P. Inteligencia Artificial con Aplicaciones a la Ingeniería, 1st ed.; Alfaomega: Morelos, Mexico, 2011; ISBN 978-607-7854-83-8. [Google Scholar]
  83. Remaida, A.; Abdellaoui, B.; Moumen, A.; Idrissi, Y.E.B.E. Personality Traits Analysis Using Artificial Neural Networks: A Literature Survey. In Proceedings of the 2020 1st International Conference on Innovative Research in Applied Science, Engineering and Technology (IRASET), Meknes, Morocco, 19–20 March 2020; IEEE: Meknes, Morocco, April 2020; pp. 1–6. [Google Scholar]
  84. Méndez, J.I.; Ponce, P.; Pecina, M.; Schroeder, G.; Castellanos, S.; Peffer, T.; Meier, A.; Molina, A. A Rapid HMI Prototyping Based on Personality Traits and AI for Social Connected Thermostats. In Advances in Soft Computing; Batyrshin, I., Gelbukh, A., Sidorov, G., Eds.; Springer International Publishing: Cham, Switzerland, 2021; pp. 216–227. [Google Scholar]
  85. Automoto. Automoto/Big-Five-Data 2021. Available online: https://github.com/automoto/big-five-data (accessed on 15 June 2022).
  86. Méndez, J.I. RPubs—Mexico Personality Traits Mexican Map. Available online: https://rpubs.com/IsabelMendezG/917072 (accessed on 21 June 2022).
  87. Méndez, J.I. Datasets Built for the ANN Models, Boxplots, and Interactive Map. Available online: https://github.com/IsabelMendezG/MexicanGamifiedTailoredInterfaces (accessed on 25 July 2022).
  88. George What Is a Comfortable Humidity Level Outside? 2019. Available online: HumidityCheck.Com (accessed on 14 July 2022).
  89. Sensitive Choice. Indoor Humidity Levels. Available online: https://www.sensitivechoice.com/resource/indoor-humidity-levels (accessed on 14 July 2022).
  90. CONEVAL. Pobreza 2018. Available online: https://www.coneval.org.mx/Medicion/MP/Paginas/Pobreza-2018.aspx (accessed on 14 July 2022).
Figure 1. Socially connected products: Connected thermostats are used as an example of this communication.
Energies 15 05553 g001
Figure 2. Diagram flow for the socially connected interface proposal.
Energies 15 05553 g002
Figure 3. Personality traits as the central axis and their relationship with gamification and energy consumer type.
Energies 15 05553 g003
Figure 4. Conceptualization of a gamified community.
Energies 15 05553 g004
Figure 5. Decision system proposed in this research.
Energies 15 05553 g005
Figure 6. These gamified elements change depending on the decision system.
Energies 15 05553 g006
Figure 7. Boxplots by location: (a) personality traits, (b) electricity bill by rate type, and (c) electricity bill by rate type considering a single householder using air conditioning systems.
Energies 15 05553 g007aEnergies 15 05553 g007b
Figure 9. ANNs: (a) First ANN for the personality traits and (b) second ANN for the electricity bill.
Energies 15 05553 g009aEnergies 15 05553 g009b
Figure 10. Proposed interactive dashboard: (a) block diagram, (b) subsystems that contain the two ANNs, and (c) left side: input values; right side: interactive interface.
Energies 15 05553 g010aEnergies 15 05553 g010b
Figure 11. Tailored gamified interfaces for different locations and personalities: (a) Campeche interface, (b) Queretaro interface, (c) Estado de Mexico interface, and (d) Coahuila interface.
Energies 15 05553 g011aEnergies 15 05553 g011b
Table 1. Elements considered for the gamified HMI.
Energy TargetEnergy SegmentPersonalityGamified UserPriority
Early adopterN-G and DEWA and NPh, S, F.S., D: Social competition, social network, exploratory tasks, unlock contentNone, but propose potential savings
Cost-orientedTC-F and H-FC and EPh, Ach, Pl, S, F.S.: Challenges, levels, points, rewards, leaderboard, social competition, social network, exploratory tasks, unlock the content.Cost consumption
Energy-consciousG-AOPh, F.S.: Exploratory tasks and unlock contentElectricity consumption
Table 2. Variables considered to build the personality traits’ ANN.
I.D.LocationOCEANExploratory TasksChallengesSocial CompetitionSocial NetworkUnlock Content
Input dataOutput data
4173Campeche0.720.620.540.620.76YesNoNoNoYes
6956Queretaro0.680.460.720.60.58NoNoYesNoNo
629Estado de Mexico0.660.80.440.90.66NoYesNoYesNo
2201Coahuila0.660.740.80.340.4NoYesYesNoNo
Table 3. Variables considered to build the electricity bill’s ANN.
LocationElectricity BillPotential ConsumptionPotential WastePotential Savings
Input dataOutput data
Campeche120100
Queretaro120010
Estado de Mexico270001
Coahuila270010
Publisher’s Note: MDPI stays neutral with regard to jurisdictional claims in published maps and institutional affiliations.

