Article

Modeling and Analysis of Load Growth Expected for Electric Vehicles in Pakistan (2021–2030)

1
Energy Systems Management, College of Arts and Sciences, University of San Francisco, San Francisco, CA 94117, USA
2
Department of Electrical Engineering, Mehran University of Engineering and Technology, Jamshoro 76062, Sindh, Pakistan
3
National Transmission and Dispatch Company (NTDC), Lahore 54000, Punjab, Pakistan
*
Author to whom correspondence should be addressed.
Energies 2022, 15(15), 5426; https://doi.org/10.3390/en15155426
Submission received: 20 June 2022 / Revised: 14 July 2022 / Accepted: 19 July 2022 / Published: 27 July 2022

Abstract

:
The world is facing severe environmental challenges as it heavily relies on a USD 100 trillion fossil-fuel-based economy. Its transition from a fuel-intensive to a material-intensive economy is not well understood. The conventional energy resources are responsible for the excessive generation of Green House Gas (GHG) emissions resulting in increased environmental degradation owing to climate change. The human impact has been cited as highly indisputable in this respect. Pakistan is one of the most climate-vulnerable countries highly suffering from such increased impact of climate change and, thus, has been warned against the excessive use of conventional resources. As such, in the premises of Pakistan, conventional products are being excessively utilized in both power generation and transport sectors. Apart from the electrical power sector, the transport sector is also one of the main contributors to GHG emissions. In this context, the automobile industry has emerged as an environmentally friendly solution, which presents Electric Vehicles (EVs) as an efficient and feasible alternative to mitigate the GHG footprint. The transition from fossil-fuel-based vehicles (FFVs) to EVs is, therefore, considered as a potential way to decarbonize the transport sector, where the socio-economic conditions may be improved to a significant extent. A major prerequisite under planning and implementation in Pakistan is forecasting of load growth of EVs in Pakistan. Therefore, this paper proposes a load growth model (load forecast), used to forecast the load growth expected for electric vehicles in Pakistan from 2021 to 2030. This paper discusses in detail the original and revised models. According to the revised model, total EV energy demand stood at 24.61 GWh in 2020 and increased up to 2862.54 GWh in 2030.

1. Introduction

Pakistan is among the vulnerable nations to climate change, as it is for the most part energized with contamination [1]. Because of huge Green House Gas (GHG) emissions, it is positioned as the world’s second worst country in the World Air Quality Index Report 2020 [
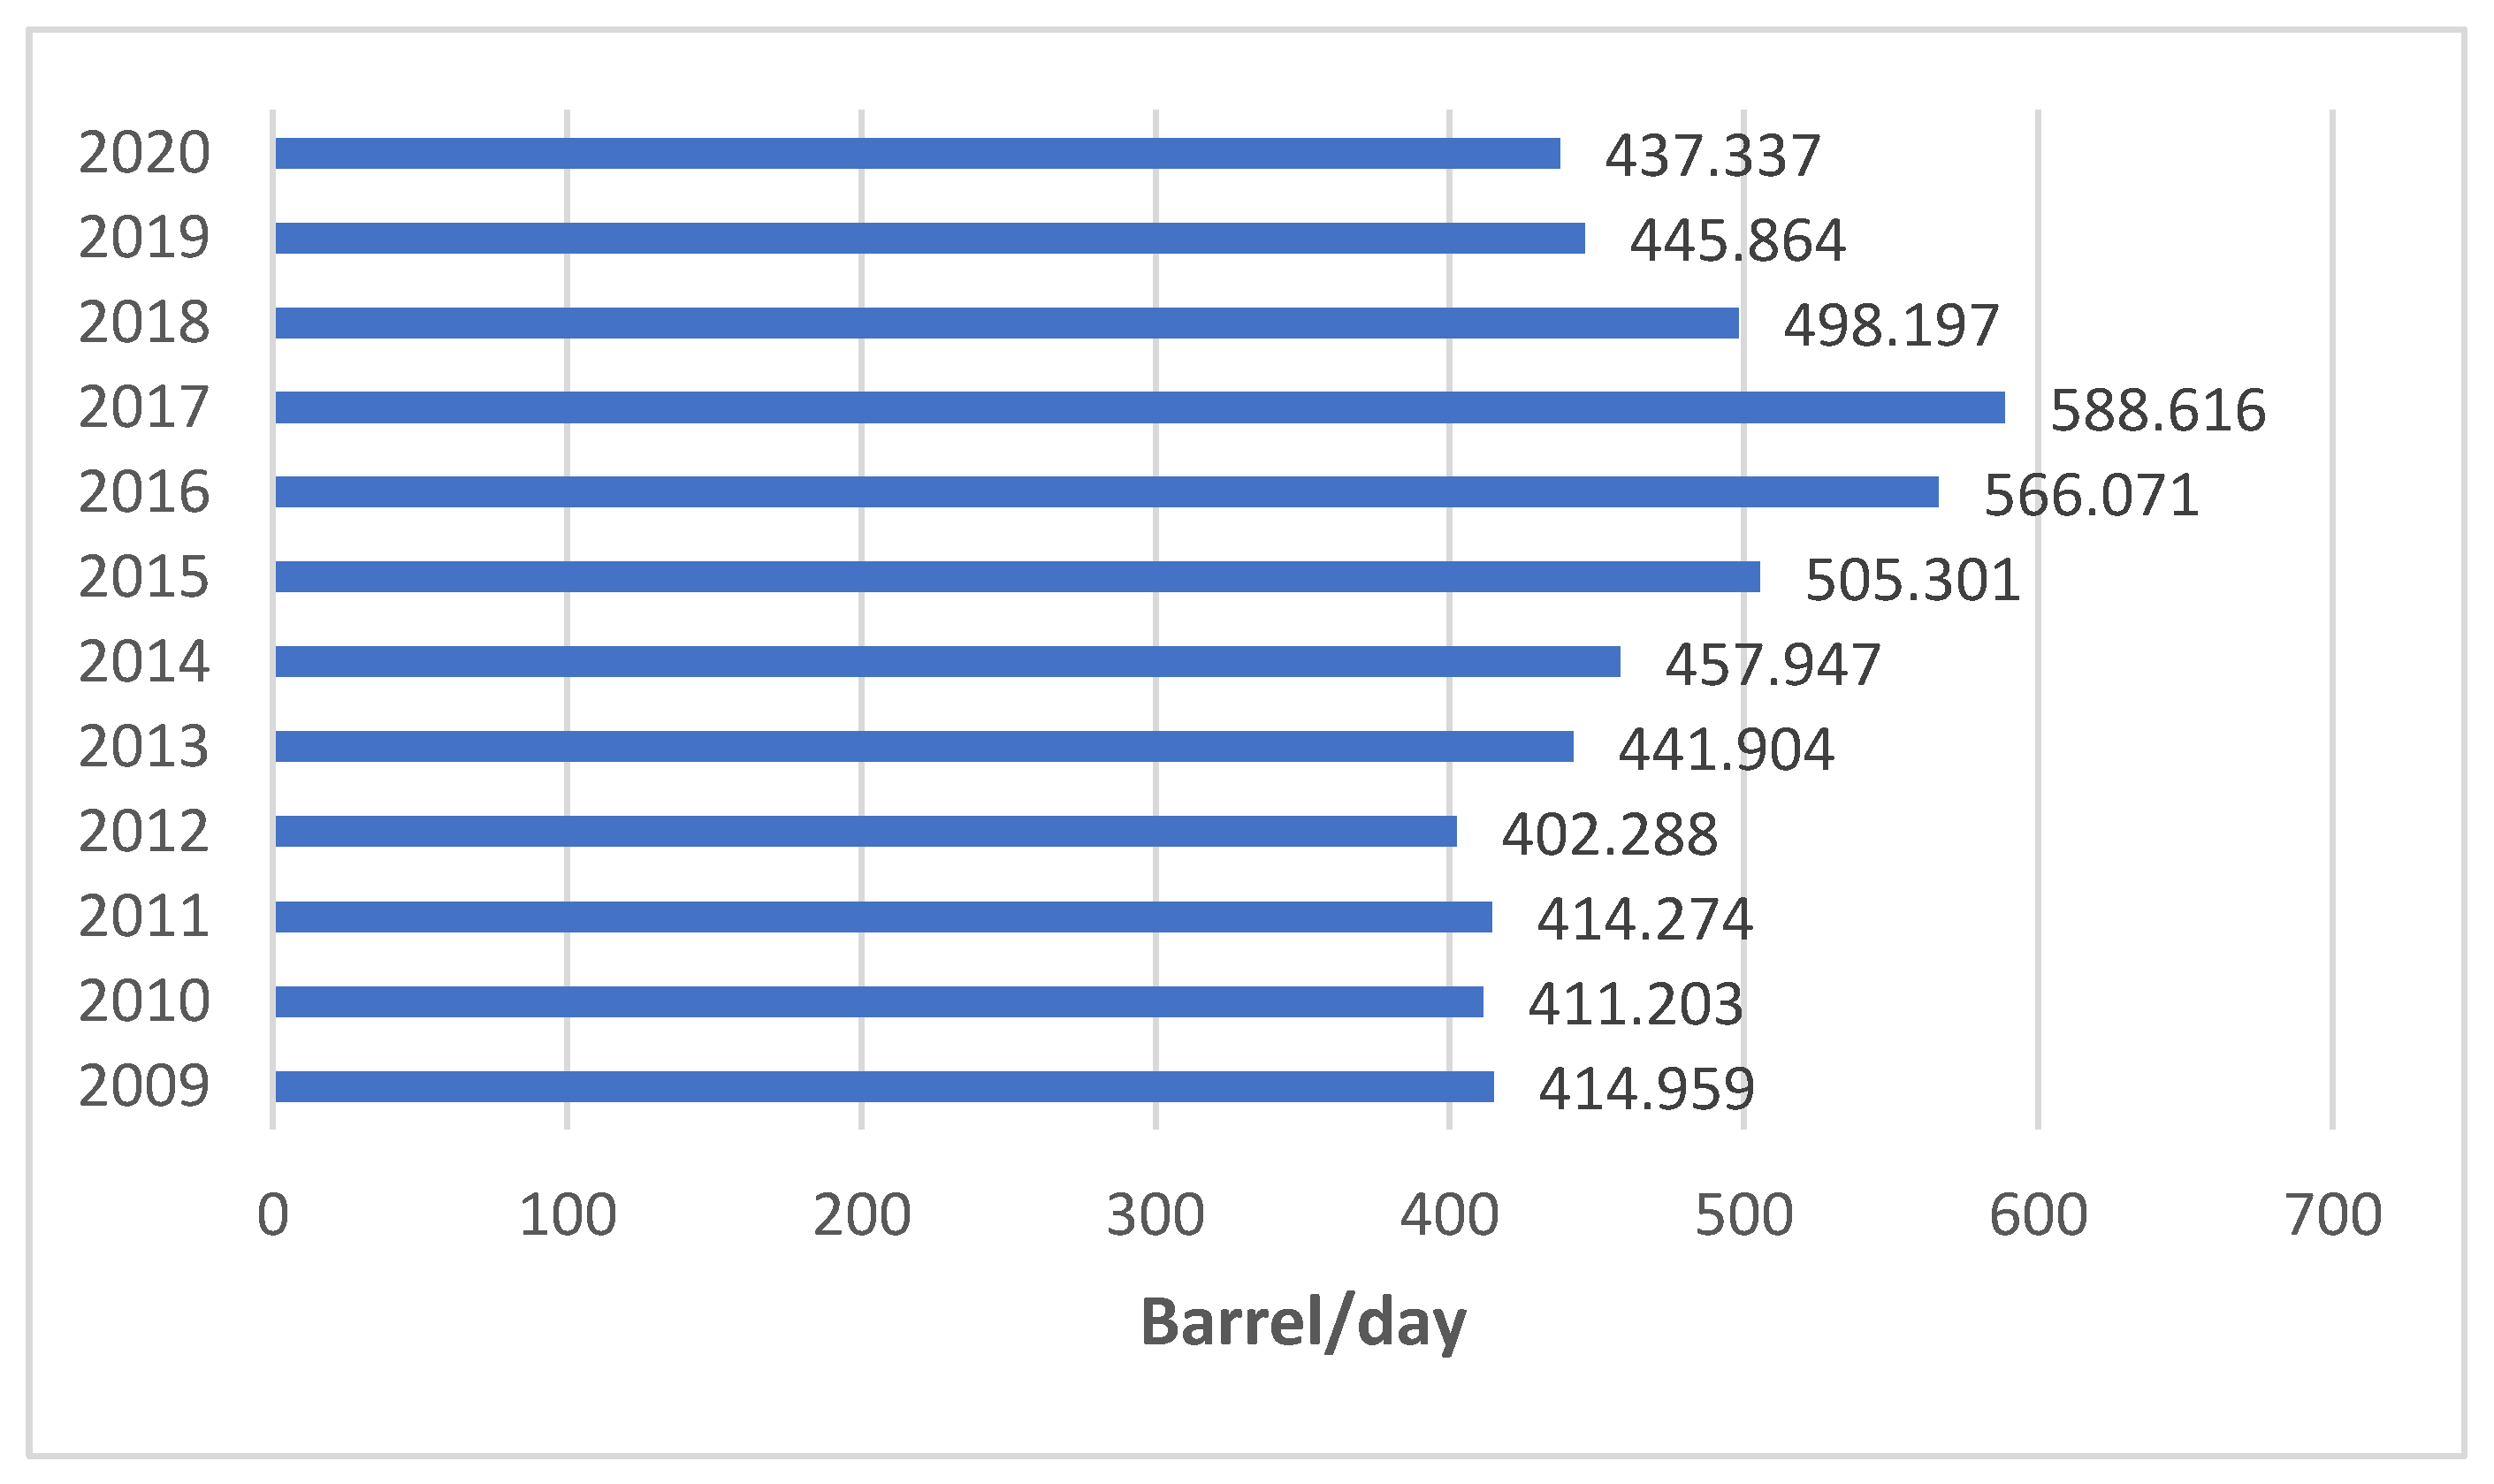
2]. Every year, tons of oil are imported with high obligation charges as shown in Figure 1. As indicated in the most recent information from the Pakistan Bureau of Statistics (PBS), oil imports for July–October of 2020–2021 added up to USD 3.15 billion, showing that petroleum product utilization is not simply deteriorating the climate impact but also additionally impacting the economy. In any case, because of COVID-19, a reduction of 24.56% in oil imports was accounted for, facilitating the weight on the country’s unfamiliar trade savings. Simultaneously, an overall downfall of 7% in CO2 outflows from petroleum products was noticed, as distributed in Nature Climate Change [3].
A detailed literature review is provided in Table 1 below.
The change in outlook from FFVs to EVs is a countermeasure to these issues of the overabundance of electrical power in MWs, decreasing the oil import bills, and assisting Pakistan with having a green revolution. To advance nearby utilization of EVs, efficient charging is required, and an essential half-and-half charging office that utilizes sustainable power and is grid-connected.
These examinations make sense of the significance of electric vehicles; however, give no conjecture about its development. This paper rather centers around the demonstrating and stacking of EVs in this decade’s thought of the excess energy generation.
This research work would be instrumental in providing a direction for the future integrated energy policies and planning in Pakistan with a special focus on national electricity and transportation policies and planning, providing a road map with solutions to resolve Pakistan’s chronic energy challenges pertaining to excess power generation and mitigation of the carbon footprint apart from resolving associated economic challenges such as circular debt. On the academic front, the work provides a new scope of research cluster for the faculty and students to join and conduct their research work accordingly as per the emerging needs of the society.
This paper is divided into the following sections: Section 2, Section 3 and Section 4 discuss the transport sector, electricity situation, and national electric vehicle policy of Pakistan, respectively. Section 5 confers modeling of load growth, and Section 6 provides the result-based discussion. Section 7 provides a brief conclusion and recommendations.

2. Transport Sector of Pakistan and Associated Issues

The transport sector of Pakistan can be divided into three categories that are commercial, private, and public transport:
i.
Commercial Transport:
Vehicles that move commodities or resources from one location to another are referred to as commercial transport. Heavy-duty vehicles such as box trucks, cargo vans, cargo trains, and cement mixers utilize diesel as their primary fuel, because diesel provides the higher torque, which is a critical need for bulky vehicles, as well as cost, compression rate, and combustion [10].
ii.
Private Transport:
Individually owned vehicles, such as a car, bike, or bicycle, fall under the category of private transportation. Petrol and compressed natural gas (CNG) are the two major fuel types used in this form of transportation.
iii.
Public Transport:
Travelers share a form of transportation to travel along the characterized routes for which a charge should be paid in this mode. Trains, airplanes, buses, and taxis are examples of public travel vehicles. With Pakistan’s rising populace, the proportion of creation to deals of this kind of vehicle is expanding. Taxis, for instance, work on petrol or CNG, trains run on coal, oil, or diesel, buses and vans commonly run on diesel or petroleum, and nearby rickshaws run on petrol or CNG [10].
Public expressways and common roadways represent 13,000 and 93,000 km, separately, with lengths of the different areas, commonplaces, and city roads filling the gaps [10]. This transport network is expanding because of the implementation of the ambitious China Pakistan Economic Corridor (CPEC), with the construction of 3070 km of new road and railway routes under construction. While this will improve the current shipping lane, it will likewise overburden the current street network [9].
In contrast with the past financial year, the populace moved from 208.57 to 212.48 million individuals in 2020–21, and the proportion of the street transport area expanded also. As per [9], the typical thickness of vehicles per 1000 individuals is 16 which is probably going to increment as Pakistan is heavily pushing towards urbanization. As per the 2018 review, around 17 million vehicles were enrolled, with that number anticipated to increase by 30 million by 2025, and the transportation sector’s oil utilization was almost 302,000 barrels each day, with that number expected to increase by 2025 according to the transportation expansions plan, displayed in Figure 2 [11].
Pakistan’s massive dependence on oil imports has occurred for decades, but as the usage of gas increased in the 1990s, oil imports were substantially lowered until 2016. Our country returned to oil in 2017 due to a lack of natural gas supplies and a drop in worldwide oil prices. Pakistan’s road transport is currently mostly dependent on oil and gas.
The transport sector is intertwined with many other industries, and this tremendous expansion of the transportation system will have a significant influence on them. It will harm the already polluted environment and increase imports, resulting in a trade imbalance that the government will have to overcome. The country may experience socio-economic depravity if appropriate actions are not adopted.
Pakistan is one of the key nations affected by environmental change, according to the LUMS EV Report [12], with liquefying icy masses, floods, heat waves, dry seasons, and heavy smog clouding most parts of Sindh and Punjab during winters. Figure 2 shows the high development in the vehicle area from 2018 to 2025.

3. Electricity Situation in Pakistan

After decades of energy shortages and interruptions, Pakistan finally reached a point in the fiscal year 2017–2018 where its generating capacity was adequate to fulfill the load requirements [13], thanks to the addition of new power plants to the system. As per the State of Industry Report NEPRA 2020 [14], between 2016 and 2020, 13,298 MW of electric power was added to Pakistan’s power network, carrying the complete ability to 35,735 MW, with an option of 2294 MW from K-Electric (KE) possessed power plants and 690 MW from some IPPs and CPPS associated with the KE network, making the overall generation potential equal to 38,719 MW. However, there is a mismatch between electric power generation capacity and the country’s load requirements creating a generation trap (surplus) causing massive cash flows to the independent power producers.

Issues with Excess Electricity

Even though the country’s power generating capacity was increased, the ability of the current system to produce more energy than needed came at a huge cost in terms of fiscal expenditures. The government will levy large electricity capacity taxes on power producers. By 2025, payments for capacity charges are estimated to total PKR 1500 billion [12]. Thermal power plants are now the primary source of energy in Pakistan, as well as the primary source of CO2 emissions throughout the country [12,15].
The federal government has set a goal for renewable-energy-based power generating capacity integrated with the national grid to attain 20% renewable electricity by 2025 and 30% by 2030, recognizing the necessity for RE-based power plants to minimize CO2 emissions and satisfy Pakistan’s Climate Change Agreement criteria, according to [14]. The shift from traditional power plants and the associated electricity dispatch system is a slow and gradual process, and Pakistan’s current pollution situation is concerning, prompting the need to minimize air pollution from other sources of industrial pollution. Transportation is one of the top three contributors to GHG emissions in Pakistan as illustrated below.
The country’s overall GHG emissions are roughly 167.2 tera grams of CO2 or 167 mega tons, with the transportation sector accounting for 22.54% of GHG emissions, or 37.7 tera grams or 37 mega tons of CO2, as shown in Figure 3.
As a result, at this time, a move from combustion engines to greener transportation might be a viable solution to Pakistan’s surplus electricity problem and the issue of climate change in both the power and transportation sectors. As a result, the usage of EVs can reduce capacity payments while also generating money, resulting in a net benefit for the economy (Figure 4).

4. National Electric Vehicle Policy of Pakistan 2020–2030

The EV policy 2020–2030 covers different categories of electric vehicles that are cars, 2/3 wheelers, and heavy-duty vehicles such as trucks and buses [16]. This policy provides a transition from FFVs to EVs without adversely affecting the existing transport industry which is a source of direct and indirect income of three million people and generates an approximate total of Rs. 100 billion in revenues to the government [16].

4.1. Main Objectives of the Electric Vehicle Policy

The policy objectives are enumerated as follows:
  • Encourage Pakistan’s auto and associated industries to adopt electric vehicle manufacturing as a pivot to country’s industrial progress [16].
  • Curtail the current negative climate impact on Pakistan by introducing and incorporating green energy technologies in the transport sector to reduce the carbon footprint [16].
  • Generate employment opportunities as new companies would invest in the transition [16].
  • To ensure reduction of external deficit by decreasing oil import through clean transportation [16].

4.2. Summarized Recommendations of the Policy

The EV policy can be summarized for the different categories as follows:

4.2.1. Two/Three Wheelers

  • For five years, the EV policy period, the general sales tax (GST) for the 2/3 wheelers is to be fixed at the 1% at sales stage. Whereas at the importing stage, the sales tax is to be renounced off (0%) to avoid refunds.
  • The specific parts of electric 2/3 wheelers to be imported would have custom duty (CD) standing at 1% for the EV policy period.
  • Registration and annual token tax exemption for 2/3 wheelers. Tolls for electric vehicles will be reduced by 50%.
  • The existing manufacturing industry for traditional 2/3 wheelers in terms of non-electric parts should be preserved to maintain the previously obtained localization until a strategy on conventional vehicle retirement is developed and implemented.
  • The new and existing manufacturers should both benefit from the EV policy.
  • Import of new electric 2/3 wheelers in CBU condition at the concessionary pace of obligation (50% of the common pace of custom obligation) to be connected with foundation of assembling offices, i.e., 10 units for every variation with a limit of 200 units permitted to be imported under a concessionary system in an auto area neighborhood. In any case, advancement of cross breed innovation is not tended to in this strategy.

4.2.2. Heavy Commercial Vehicles

  • The complete build up (CBUs) of EV buses, trucks, and prime movers would have 1% CD on import. Import of entire Completely Knocked Downs (CKD) allowed to have a CD of 1% to the local manufacturers.
  • General sales tax of 1% at the point of sale and 0% at the point of import.
  • Registration, yearly renewal, and permit fees are waived, and toll taxes are reduced by half for HCVs.

4.3. Generalized Recommendations

  • Review of localization of parts and machineries should be done periodically after 2 years of the announcement of policy.
  • Both current and new entrants in both 2/3 wheelers and HCVs would be granted duty and tax-free import of equipment and machinery.
  • Manufacturing of car components and building of manufacturing facilities for EV-related equipment will be eligible for a five-year income tax exemption.
  • Tax and duty exemptions to be sanctioned for EV vendors for 5 years (applies to in-house manufacturing by OEMs also).
  • The States Bank of Pakistan’s funding facility program for encouraging green infrastructure investments will incorporate EV manufacturing, i.e., EV parts, components, and module manufacturing, EV infrastructure development including charging stations, etc.
  • Chargers imported with the CKD will be subject to a 1% customs duty and 1% sales tax, while charging stations for electric vehicles imported under HS Code 8504.4030 will continue to be subject to a 0% customs duty.

4.4. Limitation of EV Policy

As Pakistan is a developing country, with average road infrastructure, implementation of the national EV policy contains definite limitations and bottlenecks especially in terms of incentivizing the EV industry and market. These limitations are discussed as follows:
  • The policy targets mitigation of carbon footprint with green infrastructure. However, a subsequent vehicle retirement policy analogous to the power plant retirement policy has not been formulated yet and conventional vehicles in the form of a car, bus, and truck are a great source of GHG emissions. Therefore, organized efforts by the concerned stakeholders will be required for achieving the targets effectively.
  • EVs reflect the most recent technical trend and are costly, particularly in terms of battery costs, which are a significant component of the technology under consideration. Because its lifespan is typically five years, clients in Pakistan may be hesitant to pay the upfront amount in advance. However, batteries for motorcycles and rickshaws are either inexpensive or may be utilized in these 2/3 wheelers with regular batteries.
  • Hybrid automobiles are also more expensive, and buyers may be enticed to spend more because they are regarded like regular gasoline vehicles.
  • The EVs offer basically robust and lightweight conveyance which may not be suitable to operate on the roads of Pakistan, especially the ones in the less developed areas owing to poor road network infrastructure.
  • The Govt. of Pakistan through its planning division must ensure finance to establish localized industry manufacturing for gradual import substitution. This will pay the path for cost reduction and bright prospects for future investment.
  • Due to Pakistan’s underdeveloped conformity assessment framework, standardization, quality, and equipment safety would be a challenge.
  • There is no availability of charging infrastructure which poses a major challenge and hence invites attention to future investment in this area.
To realize the potential of clean transport transition in Pakistan and understand the future of EV transportation in Pakistan, opportunities, challenges, and way forward, modeling and analysis of the load growth to be incurred by EV induction were carried out.

5. Modeling of Load Growth of EVs in Pakistan in 2021–2030

This paper proposes a load growth model which emphasizes the impact of increase in electric power demand due to load growth of EVs on the national grid. The forecasting time horizon is for the period from 2021 to 2030. The data of fiscal year 2017–2018 was used in the model.

5.1. Methodology

As shown in Figure 5 below, a bottom-up approach was adopted for the calculation of EV power consumption. Then, each EV category was modeled in accordance with the EV policy, i.e., two wheelers and three wheelers, etc. The fourth step was to determine the expected number of EVs on the road in reference to the draft EV policy. For the determination of EV mileages, international sources were considered. Lastly, EV consumption in GWh for each EV category was calculated on an annual basis.

5.2. Demand Forecast of Vehicles

5.2.1. Demand Forecast Model (Cars)

The demand forecast of cars is modeled using the following set of equations:
EC Cars   = t = 1 n ( EV t ) ×   EVC Car EC Cars   =   Consumption   of   EV   cars   in   GWh   EV t   =   Expected   number   of   EV   cars   on   roads   per   year     EVC Car =   Annual   Consumption   of   an   EV   car   per   year   EVC Car = EVM car 100 ×   d Car EVM Car =   Average   mileage   of   EVcar   in   KWh / 100   km   d Car =   Annual   average   distance   travelled   by   a   FFV   car   in   km

5.2.2. Demand Forecast Model (2/3 Wheeler)

The demand forecast of 2/3 wheelers is modeled using the following equations:
EC 2 / 3   wheelers   = t = 1 n ( EV t ) ×   EVC 2 / 3   wheelers EC 2 / 3   wheelers   =   Consumption   of   EV   cars   in   GWh   EV t   =   Expected   number   of   EV   2 / 3   wheelers   on   roads   per   year EVC 2 / 3   wheeler   =   Annual   Consumption   of   an   electric   2 / 3   wheelers   per   year EVC 2 / 3 wheelers = EVM 2 / 3 wheelers 100 ×   d 2 / 3 wheelers EVM 2 / 3   wheeler   =   Average   mileage   of   EV   2 / 3   wheelers   in   KWh / 100   km d 2 / 3   wheeler   =   Annual   average   distance   travelled   by   a   FFV   2 / 3   wheelers   in   km

5.2.3. Demand Forecast Model (Trucks)

The demand forecast of electric trucks is modeled using the following equations:
EC trucks   = t = 1 n ( EV t ) ×   EVC truck EC trucks   =   Consumption   of   EV   trucks   in   GWh EV t =   Expected   number   of   EV   trucks   on   roads   per   year   EVC truck =   Annual   Consumption   of   an   EV   truck   per   year EVC truck = EVM truck 100   ×   d truck   EVM truck =   Average   mileage   of   EVtruck   in   KWh / 100   km d truck = Annual   average   distance   travelled   by   a   FFV   truck   in   km

5.2.4. Demand Forecast Model (Buses)

The demand forecast of electric buses is modeled using the following equations:
EC buses   = t = 1 n ( EV t ) ×   EVC bus EC buses   =   Consumption   of   EV   buses   in   GWh EV t =   Expected   number   of   EV   buses   on   roads   per   year EVC bus   =   Annual   Consumption   of   an   EV   bus   per   year EVC bus   = EVM bus   × s bus × t bus × 365 EVM bus   =   Average   mileage   of   EV   bus   in   KWh / 100   km s bus =   Average   speed   of   Bus   Rapid   Transport   ( BRT ) ,   Lahore   in   km / h t bus =   Average   daily   operational   hourse   of   Bus   Rapid   Transport   ( BRT ) ,   Lahore   in   hours

5.3. Set of Qualitative Assumptions

Few assumptions are considered while modeling the EV forecast, that are:
  • The most probable major urban cities to employ EVs are Lahore, Quetta, Islamabad, Karachi, and Peshawar.
  • This model is based on data set for the city of Lahore.
  • Losses incurred with respect to EV charging stations are not considered.

5.4. Set of Quantitative Assumptions

Following are some quantitative assumptions considered in this research:
  • Load factor is 60%.
  • Transmission losses at 500 and 220 kV voltage levels are 2.71%.
  • Distribution losses at 132 kV voltage level and below are 15%.
Table 2 titled: “NTDC Plant Capacity” represents the summary of power balances in terms of MWs based on the Indicative Generation Capacity Expansion Plan 2021–2030 as approved by the National Electric Power Regulatory Authority (NEPRA) in September 2021.

6. Results

6.1. EV Demand Forecast on the Base Model

The results obtained from the model for EV electricity consumption for different categories of EV loads, i.e., cars, 2/3 wheelers, trucks, and buses, as mentioned in EV policy are shown in Table 3.

6.2. EV Demand Forecast on Revised Model

The model was revised to give improved results; the following changes were employed:
  • Linear curve of expected EVs on the road was converted to an exponential curve but the value at year 2030 remained the same.
  • T&D losses increased from 17.71% to 20%.
  • Load data from EV and housing forecast simulated in the WASP model with impact of EV charging at peak load duration.
The percentage increase in demand forecast of EVs is shown in Figure 6.
The energy consumption of each EV category is shown in Figure 7.
The revised electricity generation required to supply the additional EV load is provided in Table 4. The revised EV electricity consumption for the total load, i.e., combination of all EV types as per the revised model for the period of 2021–2030 is shown in Figure 8 below.
The revised model based on exponential trend analysis yielded the following results for Revised electricity generation for EVs and revised EV electricity consumption for the year 2021–2030, as shown in Table 5 and Table 6 respectively.

7. Conclusions and Future Recommendations

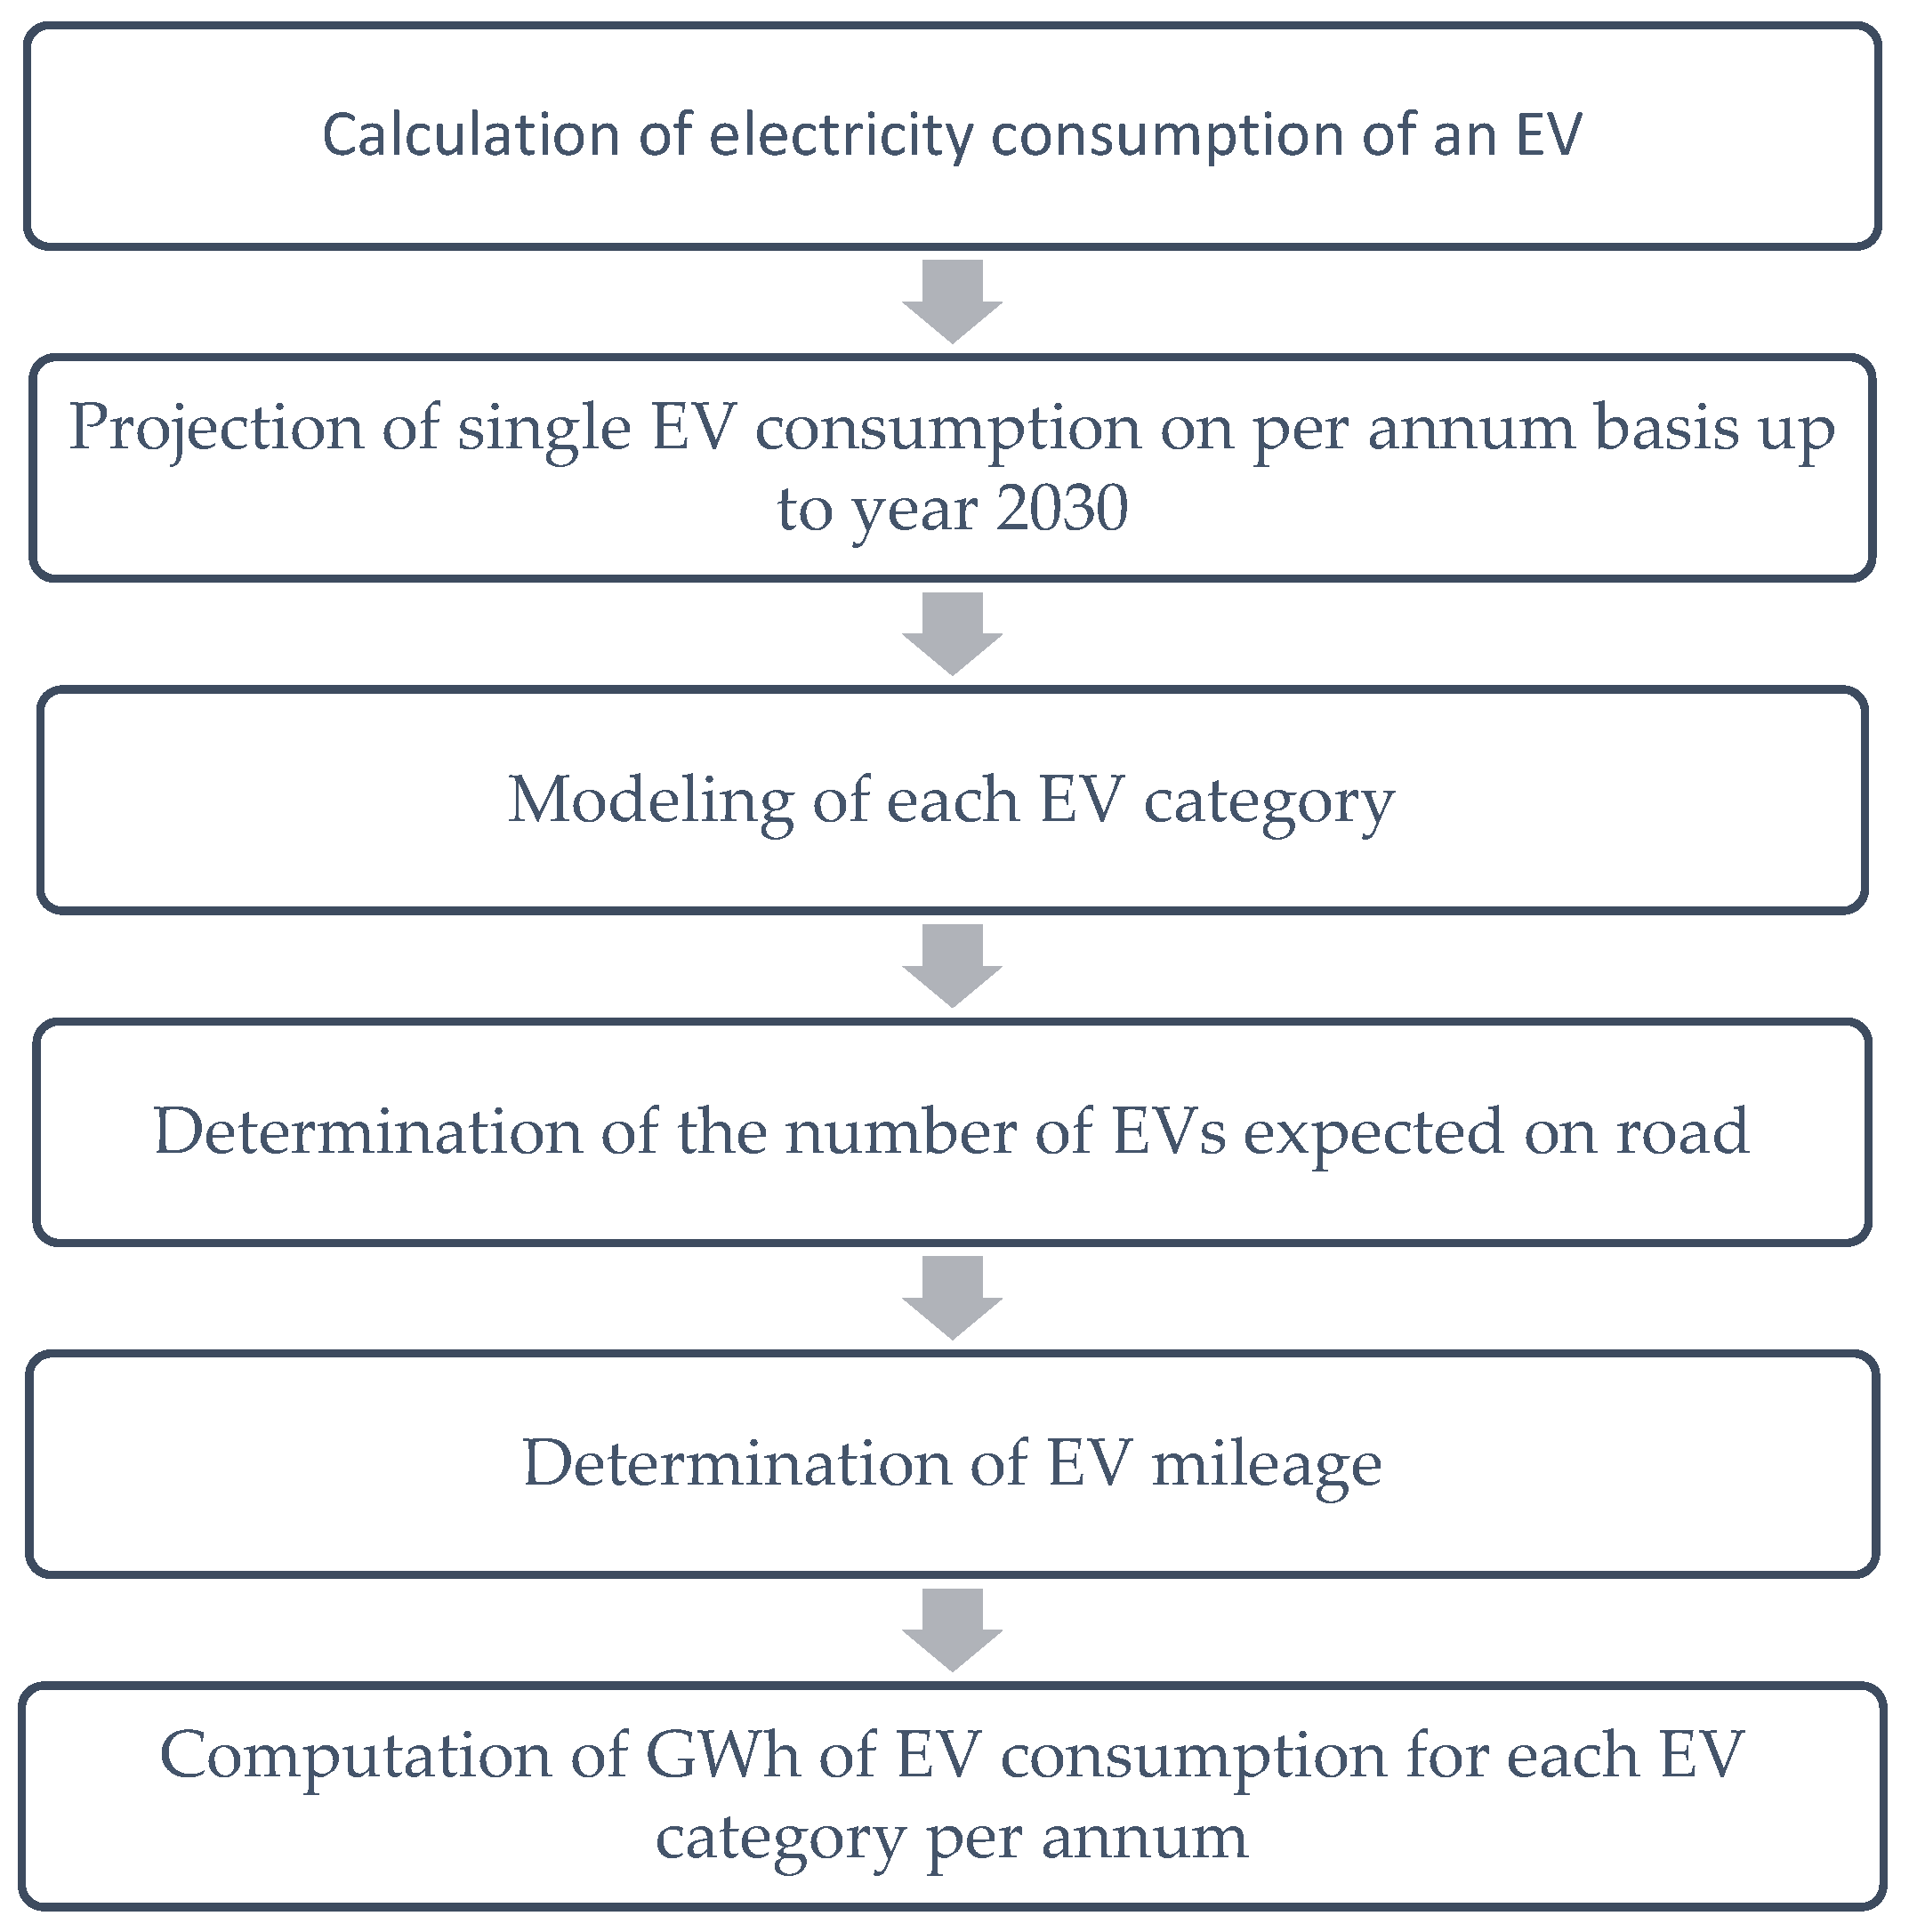
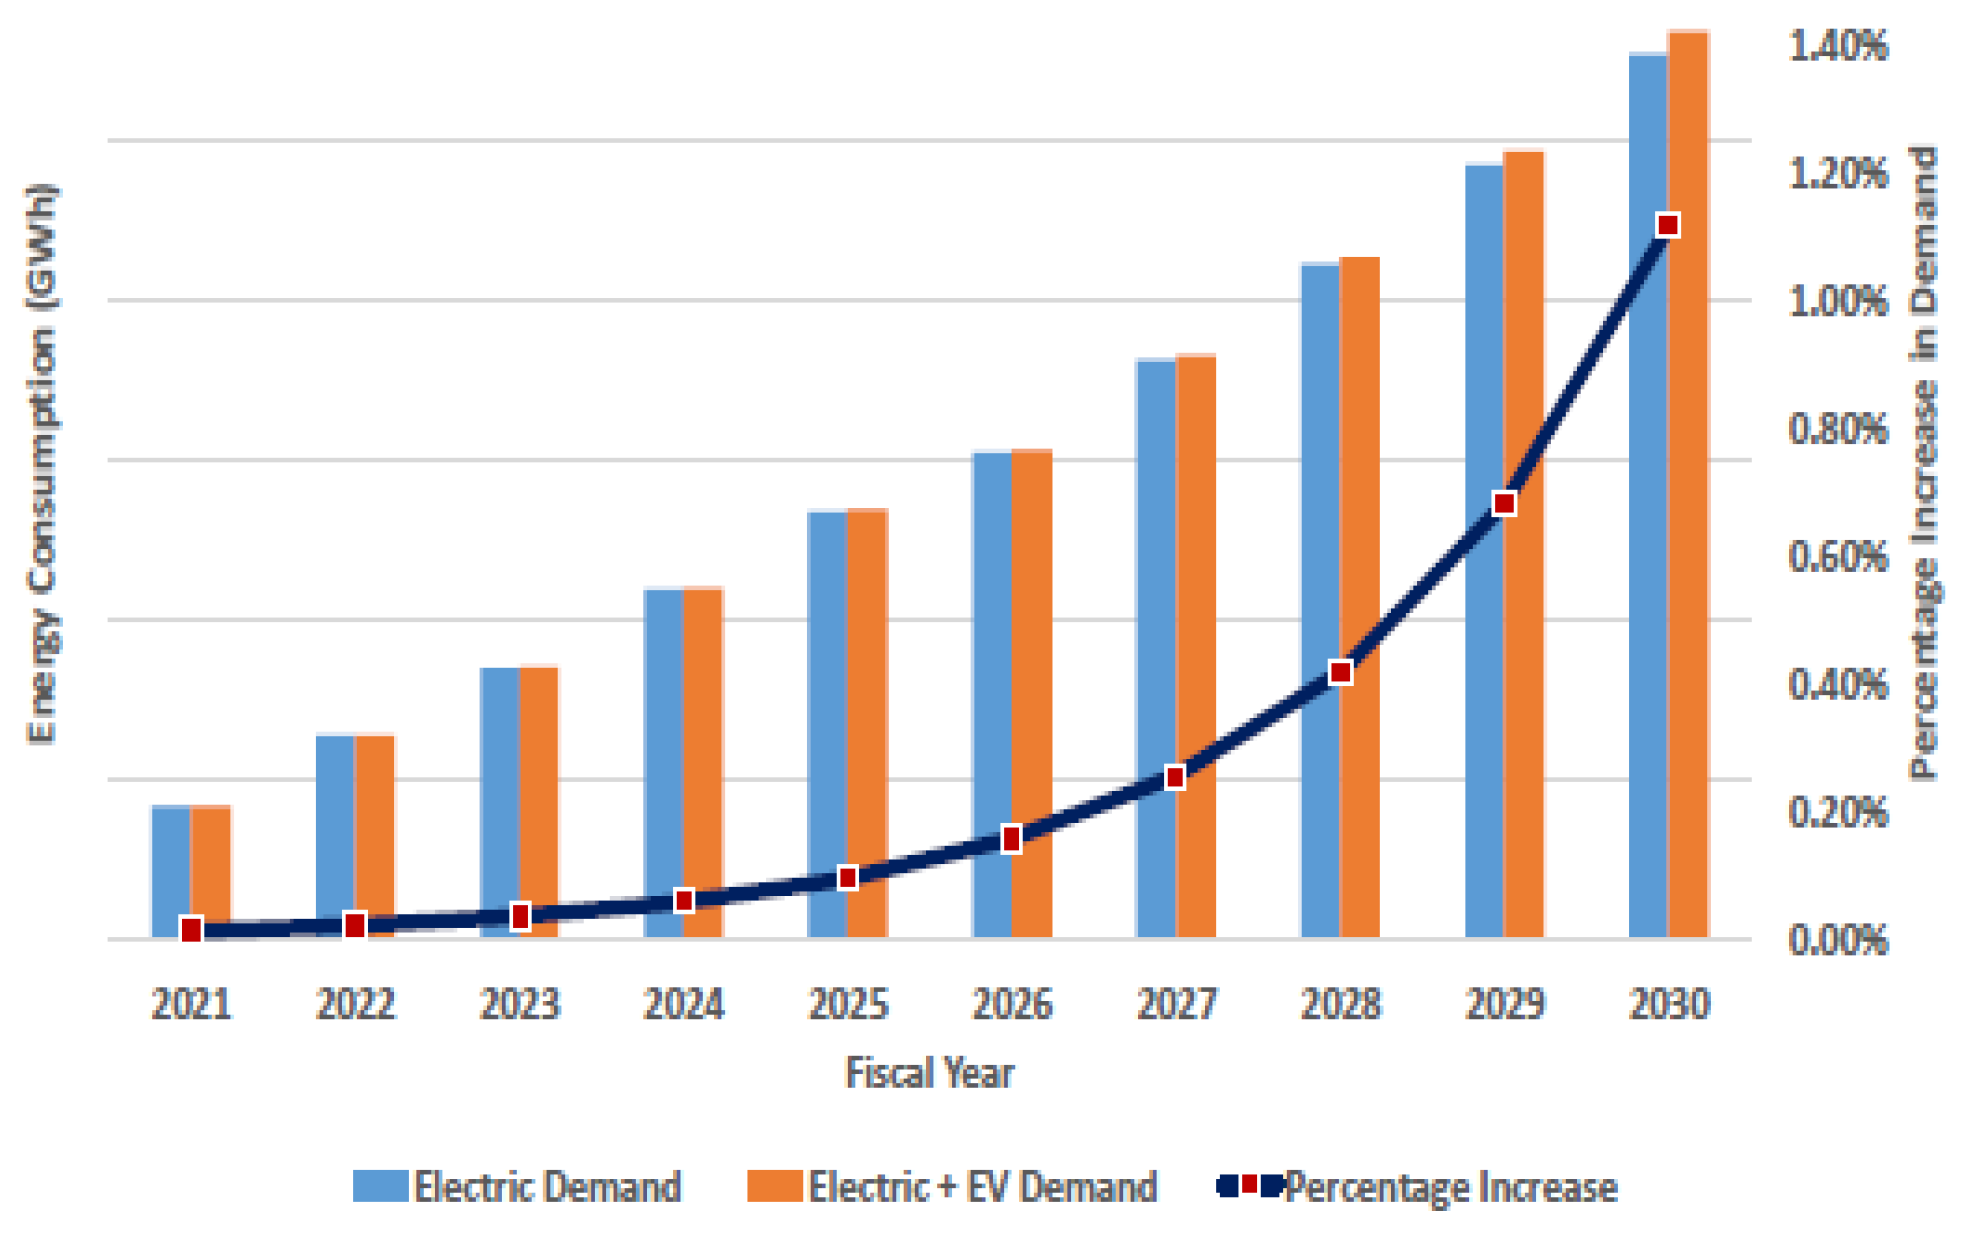
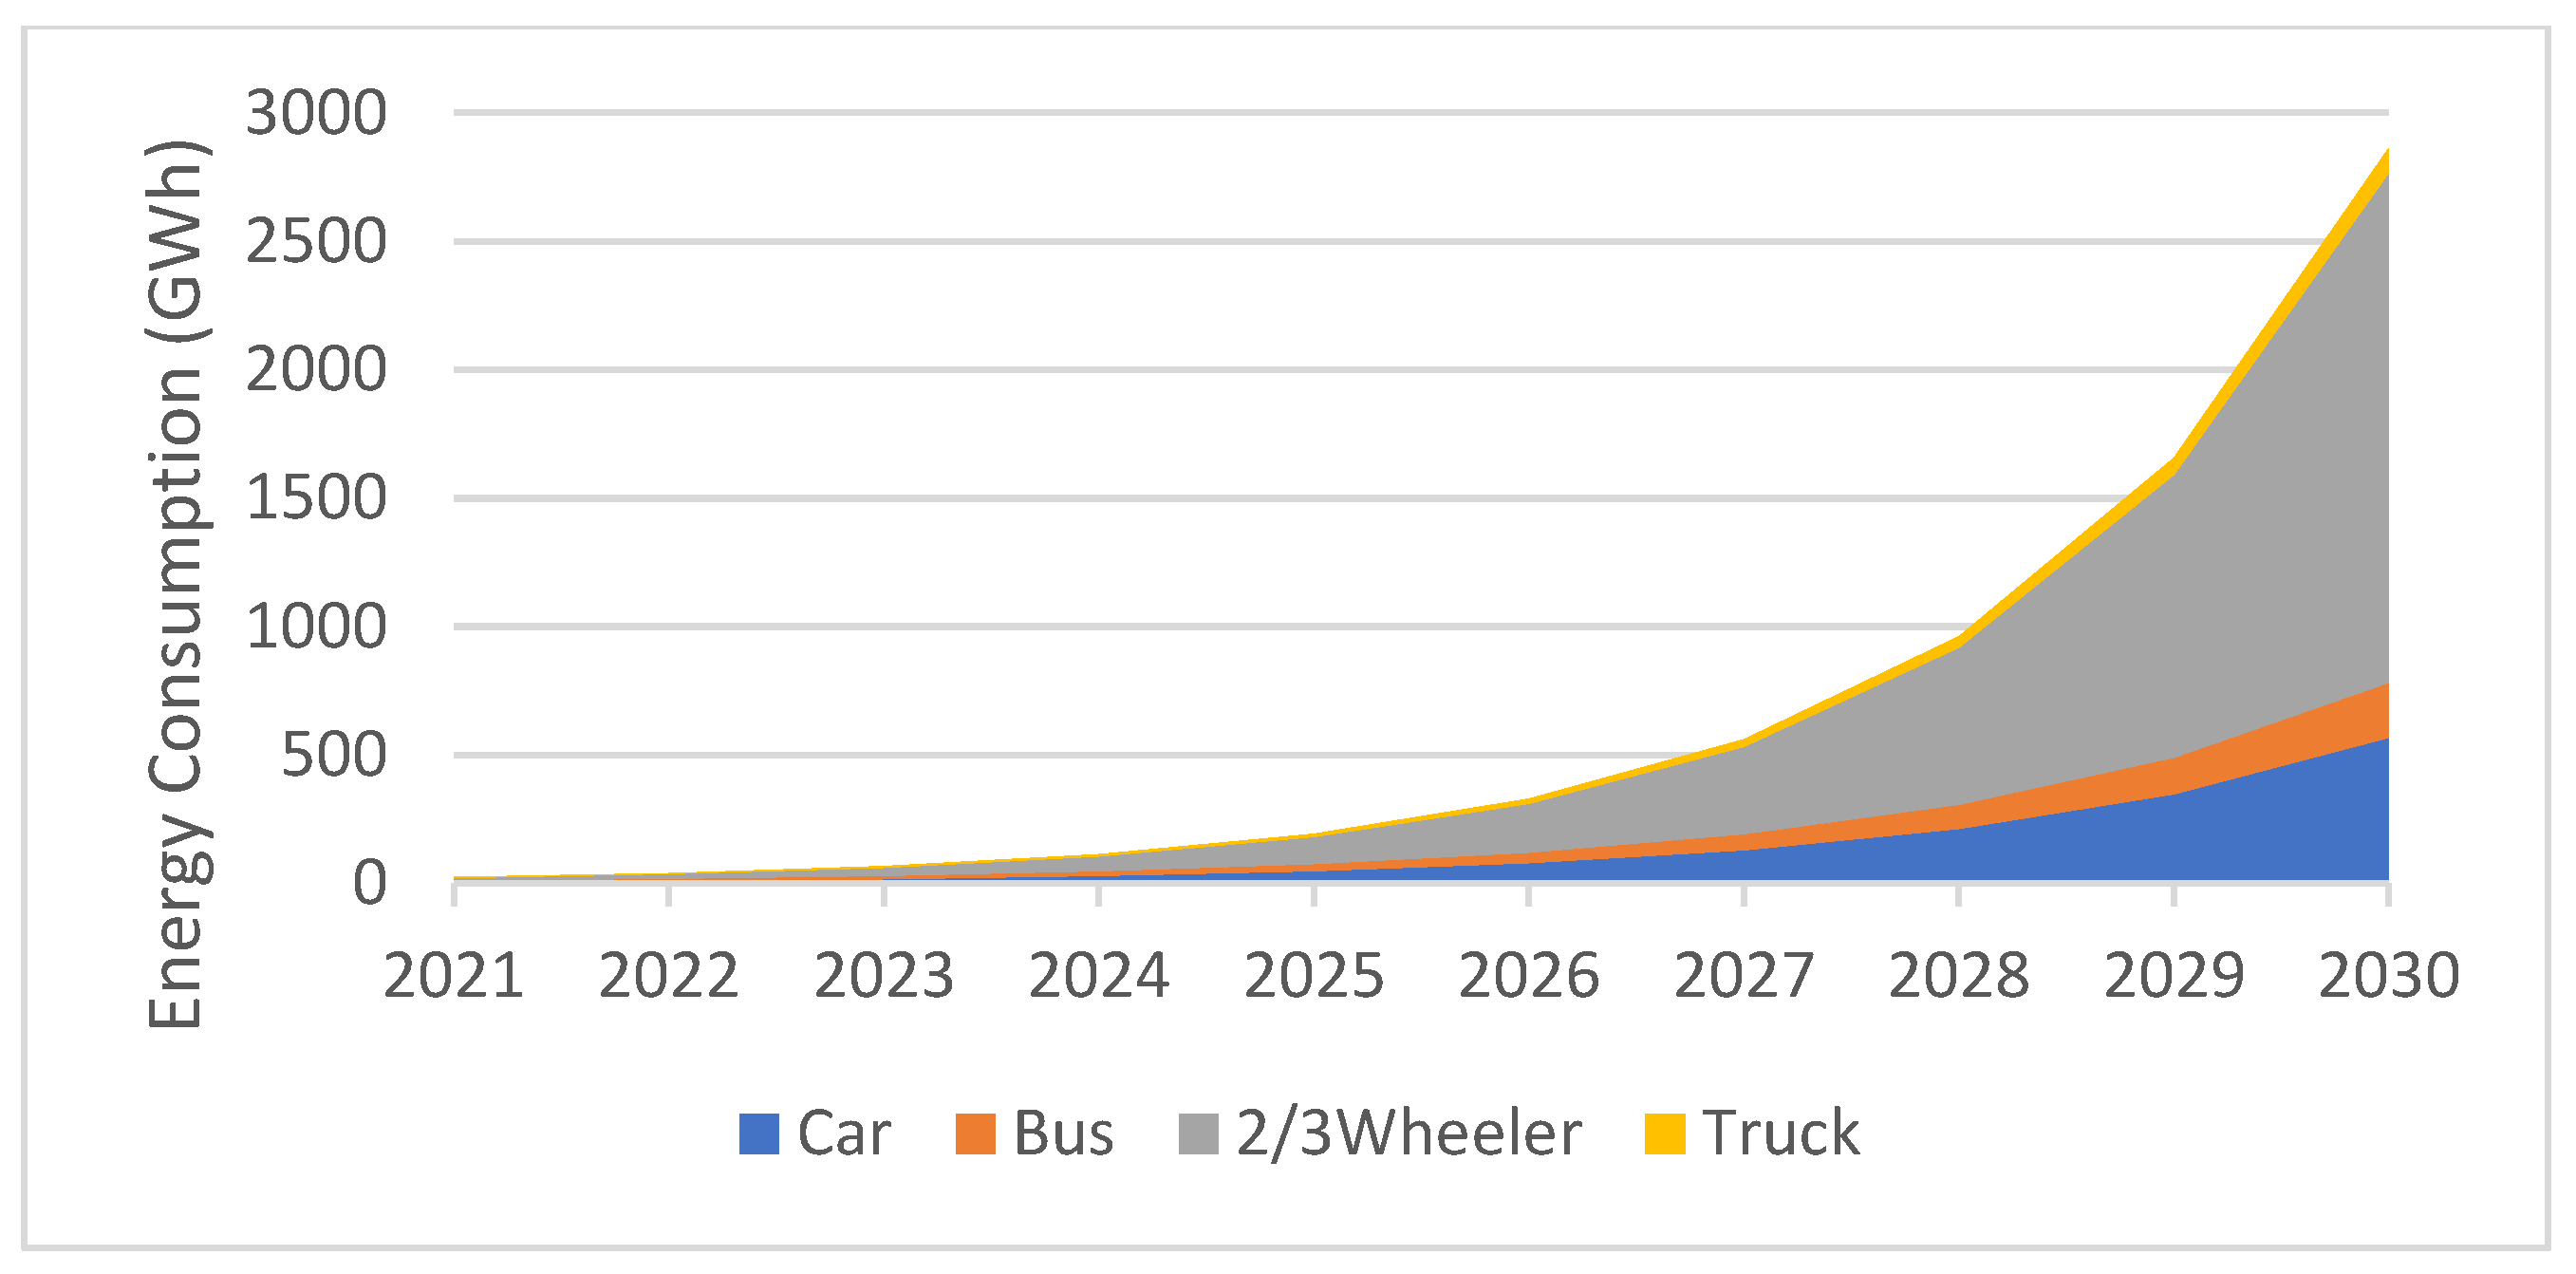
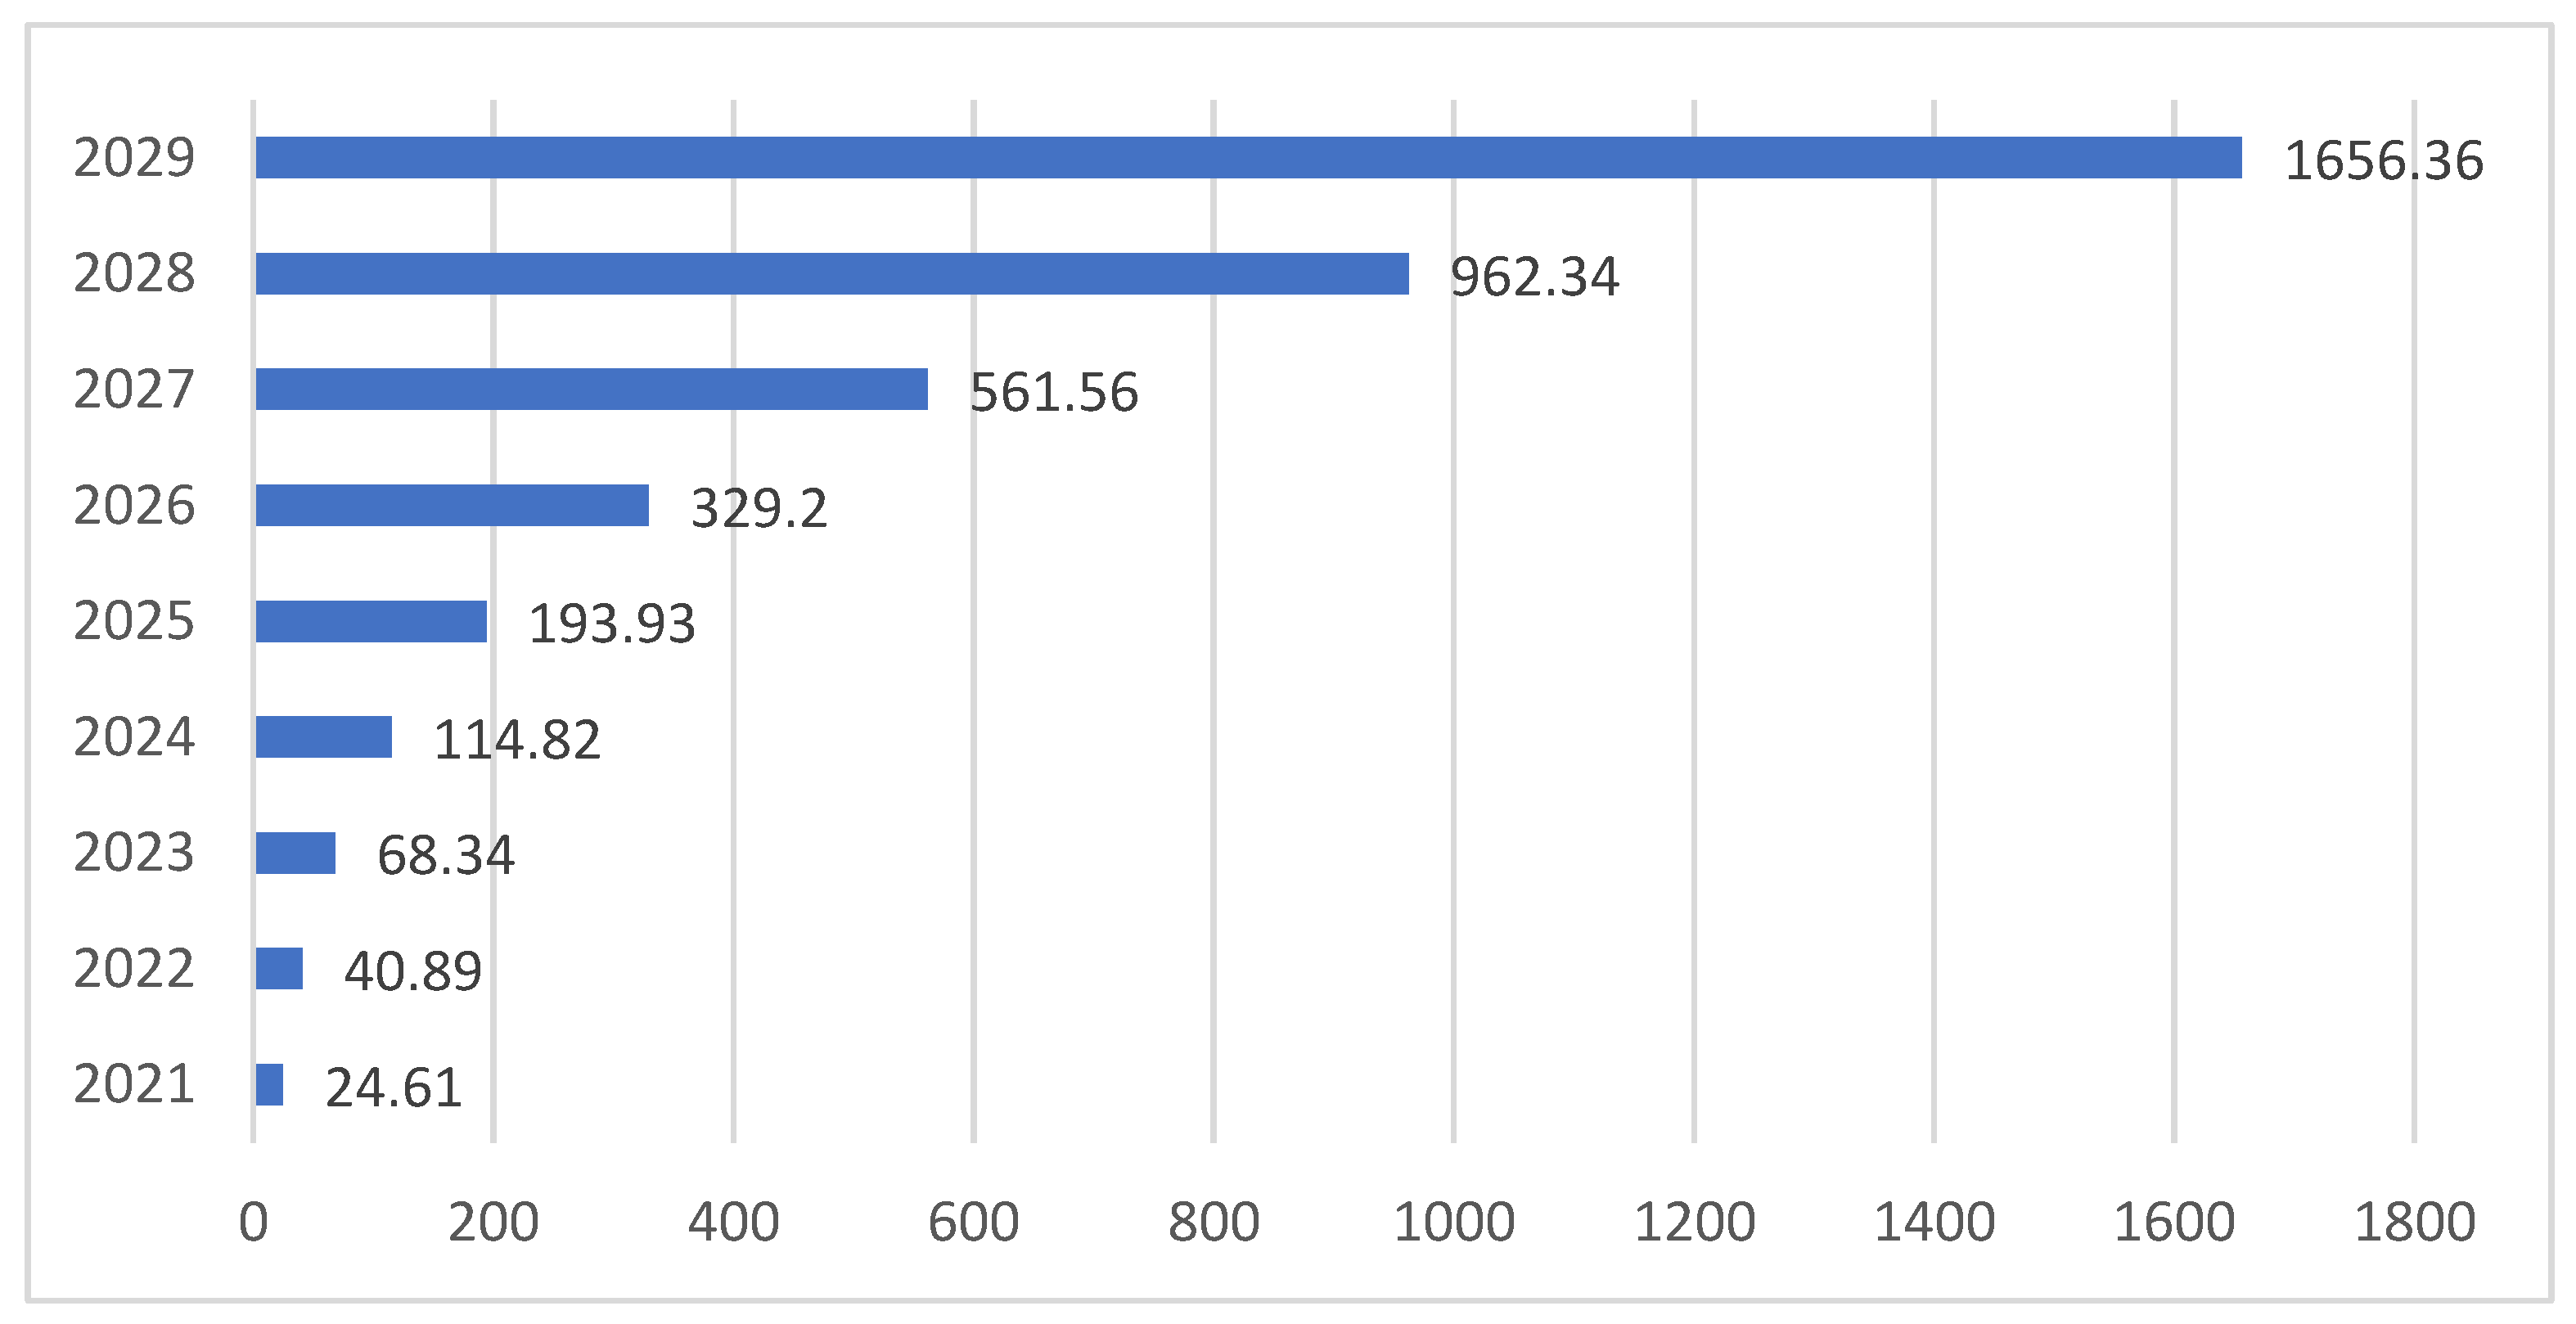
This paper proposed an electricity load growth model used to forecast the load growth expected for electric vehicles in Pakistan for the period from 2021 to 2030. A bottom-up approach was adopted for the calculation of EV electric power consumption. In this paper, each type of EV category, i.e., car, 2/3 wheeler, truck, and bus was modeled separately. EV consumption in GWh for each EV category was calculated on a per annum basis. The updated results of the model used an exponential trend curve of EVs on the road instead of a linear trend curve. The load data was simulated in the WASP model with the impact of EV charging at peak load duration. According to the revised model, total EV power stood at 24.61 GWh in 2021 and increased up to 2862.54 GWh in 2030.
Modeling and analysis of load growth for electric vehicle deployment in Pakistan can be extended to 2050 based on similar quantitative and qualitative assumptions with certain improvements and revisions to achieve greater accuracy and reliability in line with Pakistan’s 2047 Vision for clean energy transition when the country will observe its centennial independence celebrations. The energy modeling then can be carried out with advanced computer aided applications such as Plexos (energy market simulation software) to improve the model. The study can be further optimized by considering the number of vehicles to be retired in the future in line with vehicle retirement policy (under inception).

Author Contributions

Conceptualization, N.A.U.; methodology, N.A.U.; software, B.A.; validation, N.H.M.; formal analysis, N.A.U.; investigation, N.H.M.; resources, B.A. and M.A.Q.; data curation, K.L. and M.A.; writing—original draft preparation, K.L. and M.A.; writing—review and editing, N.A.U., B.A. and M.A.Q.; visualization, B.A. and M.A.Q.; supervision, N.H.M.; project administration, N.A.U.; funding acquisition, B.A. and M.A.Q. All authors have read and agreed to the published version of the manuscript.

Funding

This research received no external funding.

Institutional Review Board Statement

Not applicable.

Informed Consent Statement

Not applicable.

Data Availability Statement

Data is available in a publicly accessible repository that does not issue DOIs. Publicly available datasets were analyzed in this study. This data can be extracted from the Indicative Generation Capacity Expansion Plan (IGCEP 2021–2030) prepared by the National Transmission and Dispatch Company (NTDC), Ministry of Energy, Govt. of Pakistan. Available online: https://nepra.org.pk/Admission%20Notices/2021/06%20June/IGCEP%202021.pdf.

Conflicts of Interest

The authors declare no conflict of interest.

References

  1. Hutfilter, U.F.; Parra, P.Y.; Zimmer, A.; Ancygier, A.; Saeed, F.; Brecha, R.; Hare, B.; Granadillos, J.; Aboumahboub, T.; Ganti, G.; et al. Country Profile Pakistan: Decarbonizing South and South-East Asia Report; Climate Analytics: Berlin, Germany, 2019. [Google Scholar]
  2. World’s Most Polluted Countries in 2020 (PM2.5) Ranking, World Air Quality Report, AirVisual. 2020. Available online: www.iqair.com/world-most-polluted-countries (accessed on 25 February 2022).
  3. Global CO2 Emissions to Drop 4-7pc in 2020, but Will It Matter? May 2020. Available online: www.dawn.com/news/1558475 (accessed on 25 February 2022).
  4. Pakistan Oil Consumption, 1965–2021 | CEIC Data. Available online: https://www.ceicdata.com/en/indicator/pakistan/oil-consumption (accessed on 3 March 2022).
  5. Le Quéré, C.; Jackson, R.B.; Jones, M.W.; Smith, A.; Abernethy, S.; Andrew, R.M.; De-Gol, A.J.; Willis, D.R.; Shan, Y.; Canadell, J.G.; et al. Temporary reduction in daily global CO2 emissions during the COVID-19 forced confinement. Nat. Clim. Change 2020, 10, 647–653. [Google Scholar] [CrossRef]
  6. Bhutto, D.K.; Shah, M.A.; Chachar, F.A. Electric mobility and Energy security in Pakistan: A review. In Proceedings of the Third International Conference on Computing, Mathematics and Engineering Technologies, IEEE Xplore, Sukkur, Pakistan, 29–30 January 2020; pp. 1–6. [Google Scholar]
  7. Pareek, S.; Sujil, A.; Ratra, S.; Kumar, R. Electric vehicle charging station challenges and opportunities: A future perspective. In Proceedings of the International Conference on Emerging Trends in Communication, Control and Computing, IEEE Xplore, Lakshmangarh, India, 21–22 February 2020; pp. 1–6. [Google Scholar]
  8. Asghar, R.; Rehman, F.; Ullah, Z.; Qamar, A.; Ullah, K.; Iqbal, K.; Aman, A.; Nawaz, A.A. Electric vehicles and key adaptation challenges and prospects in Pakistan: A comprehensive review. J. Clean. Prod. 2021, 278, 123375, ISSN 0959-6526. [Google Scholar] [CrossRef]
  9. Ansari, M.; Talpur, A.; Siyal, A.; Unar, N.A.; Aslam, B.; Khatri, S.A. An Overview and Prospects of EVs in Pakistan: A Proposal of RE Based EV Charging Station at Jamshoro. In Proceedings of the 2021 IEEE PES Innovative Smart Grid Technologies Asia (ISGT Asia), Brisbane, Australia, 5–8 December 2021. [Google Scholar]
  10. Malik, A. Fuel Demand in Pakistan’s Transport Sector; MPRA Paper 103455; Munich Personal RePEc Archive: Munich, Germany, 2020. [Google Scholar]
  11. Eco-Friendly Transportation in Pakistan, a Dream Yet to Come. Available online: http://www.lead.org.pk/lead/postDetail.aspx?postid=10395 (accessed on 16 January 2022).
  12. Arshad, N.; Ullah, N.; Khan, B.T.; Javed, M.A.; Arslan, M.M.; Qureshi, M.H. Electric Vehicles in Pakistan: Policy Recommendations; LUMS Energy Institute and US-Pakistan Center for Advanced Studies in Energy (USPCAS-E): Peshawar, Pakistan, 2019; Available online: https://web.lums.edu.pk/~eig/pdf/evReport.pdf (accessed on 6 January 2022).
  13. Analysis: Pakistan Pays Heavy Price for Excess Power Generation Capacity. TheThirdPole. 2021. Available online: https://www.thethirdpole.net/en/energy/pakistan-excess-power-generation/ (accessed on 17 February 2022).
  14. NEPRA. State of Industry Report 2021; National Electric Power Regulatory Authority, Govt. of Pakistan: Islamabad, Pakistan, 2021. [Google Scholar]
  15. Pakistan Economic Survey 2018–2019; Ministry of Finance, Government of Pakistan. 2019. Available online: https://www.finance.gov.pk/survey_1819.html (accessed on 3 March 2022).
  16. Electric Vehicle Policy 2020–2025 (Draft) 2-3 Wheelers & Heavy Commercial Vehicles; Engineering Development Board, Ministry of Industries and Production, Government of Pakistan, June 2020. Available online: https://invest.gov.pk/sites/default/files/2020-07/EV%2023HCV%20130620%20PDF.pdf.pdf (accessed on 12 December 2021).
  17. Indicative Generation Capacity Expansion Plan (IGCEP 2021–2030). National Transmission and Dispatch Company (NTDC), Ministry of Energy, Govt. of Pakistan. 2021. Available online: https://nepra.org.pk/Admission%20Notices/2021/06%20June/IGCEP%202021.pdf (accessed on 3 November 2021).
Figure 1. Oil consumption in Pakistan [4].
Energies 15 05426 g001
Figure 2. High growth in the transport sector, 2018–25 [11].
Energies 15 05426 g002
Figure 3. GHG emissions of various sectors [14].
Energies 15 05426 g003
Figure 4. Revenue generation from EV deployment [12].
Energies 15 05426 g004
Figure 5. Methodology of the EV load growth model.
Energies 15 05426 g005
Figure 6. Percentage increase in demand forecast by EVs.
Energies 15 05426 g006
Figure 7. Energy consumption by each EV category.
Energies 15 05426 g007
Figure 8. Revised EV electricity consumption 2021–2030.
Energies 15 05426 g008
Table 1. Literature review.
ReferenceContribution
“Temporary reduction in daily global CO2 emissions during the COVID-19 forced confinement”, Nature Climate Change [5]Day-to-day overall CO2 discharges were brought down by 17% toward the beginning of April 2020 contrasted with the similar period in 2019, somewhat under half because of changes in street ventures attributable to lockdowns; however, these uncommon decreases were not at all permanent since lockdowns in many districts of the world were lifted. This shows that the vehicle area has a huge part in the planet’s climate emergency. Moreover, as per the NEPRA State of Industry Report 2020, Pakistan faces another test in the financial year (FY) 2019–2020, following many years of electric power deficiencies.
Electric mobility and Energy security in Pakistan: A review [6]As the idea of taking on EVs in Pakistan is still new, there are restricted writing surveys that make sense of the offices of EV charging stations (EVCS) and key areas in Pakistan for their establishment, yet there is an unbalanced enormous number of papers that stress the capability of EVs. For example, in the paper the creators investigate the rising issue of GHG emissions in Pakistan, with a specific spotlight on the transportation sector. For the choice of a satisfactory class of EVs for the future market of Pakistan, a fluffy SWOT method is applied, and fuzzy straight writing computer programs are utilized to break down the feasibility of EVs in Pakistan’s developing business sector climate.
Electric vehicle charging station challenges and opportunities: A future perspective [7]In this paper, a correlation between burning motors and electric vehicles is made in various fundamental regions to advance electric portability in Pakistan. The review underscores the requirement for an energy security strategy, covers a few types of EVs, and suggests plug-in hybrid and battery electric vehicles as the most encouraging advances.The paper also talks about the potential risks of fostering the EVCS as far as matrix over-burdening, battery charging and discharging, and T&D interconnections are concerned.
Country Profile Pakistan: Decarbonizing South and South-east Asia Report [1]This paper depicts the rapidly increasing effects of expanding worry of GHG emissions in Pakistan, putting more accentuation on the transportation sector, and utilizes a fluffy SWOT technique for choosing a sensible class of EVs for Pakistan’s future market, while fuzzy direct writing computer programs are utilized to look at the plausibility of EVs in Pakistan creating market circumstances. The review finishes up by recommending guidelines for the specialists to consider EVs in Pakistan.
Electric vehicles and key adaptation challenges and prospects in Pakistan: A comprehensive review [8]A concise rundown of the proceeding with the change in the EV business, as well as its adaption boundaries in Pakistan, is introduced in the paper [8], and possibilities that show up for EVs following dispersion in the ongoing business sector are analyzed.
An Overview and Prospects of EVs in Pakistan: A Proposal of RE Based EV Charging Station at Jamshoro [9]This paper highlights study centers around Pakistan’s abundance of power, ecological difficulties, transportation areas, and EVs as the conceivable arrangement, featuring Jamshoro, Sindh, as perhaps the most appropriate site, principally concerning renewable energy potential.
Table 2. NTDC plant capacity [17].
Summary of Power Balances (MW) Based on IGCEP 2021–2030
Fiscal Year JulyAugustSeptemberOctoberNovemberDecemberJanuaryFebruaryMarchAprilMay June
2021–2022Total Installed Capacity -------35,84436,02138,78339,44340,119
Firm Gen. Capability-------22,22920,66127,48431,87032,327
Peak Demand-------13,81213,95217,60221,81124,574
Net Surplus/Deficit-------84176708988210,0597753
2022–2023Total Installed Capacity 40,44940,47140,47139,11137,51137,51137,51137,51137,78137,78137,78139,385
Firm Gen. Capability34,72931,77730,42229,47525,98024,48824,35624,46921,42526,34231,13732,304
Peak Demand24,78824,58523,54320,33115,15614,90814,40114,47314,62018,42222,82725,779
Net Surplus/Deficit994171926879914410,8239580995599976806792083106525
2023–2024Total Installed Capacity 42,10642,10642,16642,16642,21642,75442,75442,75442,76442,83344,36344,363
Firm Gen. Capability36,09935,20931,82431,68926,47625,43124,44727,63124,83630,74037,22635,087
Peak Demand27,40727,18226,71422,47917,19816,91616,34116,42216,58920,36825,23828,027
Net Surplus/Deficit869280275109921092788515810611,209824710,37311,9887059
2024–2025Total Installed Capacity 46,36347,43347,43347,43347,43347,44147,44147,44147,44148,52148,52148,521
Firm Gen. Capability39,78539,21134,75933,82628,90328,17925,43929,03226,69132,97140,21337,618
Peak Demand28,65128,41627,92723,49917,97817,68417,08217,16817,34221,29226,38429,389
Net Surplus/Deficit11,13510,795683310,32710,92410,495835711,864934811,67913,8298229
2025–2026Total Installed Capacity 50,72150,72150,72150,99151,87151,87152,07152,07152,27152,47152,47152,471
Firm Gen. Capability43,38041,60836,45137,64932,23130,98627,05628,66526,53132,74542,44540,620
Peak Demand29,95029,70429,19324,56418,79418,48617,85717,94618,12922,25727,58030,814
Net Surplus/Deficit13,43011,904725813,08513,43812,501919910,719840210,48714,8659807
2026–2027Total Installed Capacity 53,53353,53353,30853,30853,30853,60253,60253,60253,68352,40952,40952,409
Firm Gen. Capability44,95043,68838,73238,16231,70130,43526,73929,74429,26133,29343,43439,776
Peak Demand31,28031,02330,48925,65519,62819,30718,65018,74318,93423,24628,80532,276
Net Surplus/Deficit13,67012,665824312,50612,07311,128808911,00110,32810,04814,6297500
2027–2028Total Installed Capacity 53,27853,27853,97854,22354,52354,52354,52354,52354,52354,52354,52354,523
Firm Gen. Capability44,81643,69038,69138,30629,55629,64629,16632,60428,21135,05144,61942,073
Peak Demand32,69132,42331,86526,81320,51420,17819,49119,58919,78824,29430,10433,829
Net Surplus/Deficit12,12511,268682611,49390429468967513,016842310,75614,5158244
2028–2029Total Installed Capacity 55,52355,52355,52355,52355,15855,92055,92055,92060,42060,42060,42060,420
Firm Gen. Capability46,40542,68240,43039,52929,29931,58529,90730,25729,26937,75547,84245,440
Peak Demand34,16833,88833,30428,02421,44021,08920,37220,47320,68225,39231,46435,457
Net Surplus/Deficit12,2388795712611,505785810,49695359783858712,36316,3789983
2029–2030Total Installed Capacity 61,42061,42061,42061,42061,24861,24861,11261,11261,11261,11261,11261,112
Firm Gen. Capability52,10450,15045,58741,53534,23734,80034,07233,85329,23836,44547,34045,928
Peak Demand35,68135,38834,77929,26522,39022,02321,27421,38021,59826,51632,85837,129
Net Surplus/Deficit16,42314,76210,80812,27011,84712,77712,79812,4737641992914,4828799
Table 3. EV electricity consumption: 2021–2030.
YearCar2/3 WheelerBusTruckTotal
Nos.GWhNos.GWhNos.GWhNos.GWhGWh
202120,00028100,0004020021.022009.498.42
202240,00056200,0008040042.0440018.8196.84
202360,00084300,00012060063.0660028.2295.26
202480,000112400,00016080084.0880037.6393.68
2025100,000140500,0002001000105.1100047492.1
2026160,0002241,400,0005601200126.12120056.4966.52
2027220,0003082,300,0009201400147.14140065.81440.94
2028280,0003923,200,00012801600168.16160075.21915.36
2029340,0004764,100,00016401800189.18180084.62389.78
2030400,0005605,000,00020002000210.22000942864.20
Table 4. Electricity generation for EVs: 2021–2030.
YearElectric Generation Required for EVs in GWhElectric Generation Required for EVs in MW
202111622
202223244
202334866
202446388
2025579110
20261138216
20271696323
20282255429
20292813535
20303371641
Table 5. Revised electricity generation for EVs: 2021–2030.
YearElectric Generation Required for EVs in GWhElectric Generation Required for EVs in MW
2021306
2022499
20238216
202413826
202523344
202639575
2027674128
20281155220
20291988378
20303435654
Table 6. Revised EV electricity consumption: 2021–2030.
YearCar2/3 WheelerBusTruckTotal
Nos.GWhNos.GWhNos.GWhNos.GWhGWh
20215000725,00010505.26502.3224.61
2022815011.4145,00018767.94763.5540.89
202313,28518.681,00032.411411.981145.3668.34
202421,65430.32145,80058.3217218.091728.09114.82
202535,29649.41262,440104.9826027.3226012.22193.93
202657,53280.54472,392188.9639341.2539318.45329.2
202793,777131.29850,306340.1259362.2959327.86561.56
2028152,8562141,530,550612.2289594.0689542.06962.34
2029249,156348.822,754,9901102.001351142.03135163.521656.36
2030406,124568.574,958,9821983.592041214.47204195.912862.54
Publisher’s Note: MDPI stays neutral with regard to jurisdictional claims in published maps and institutional affiliations.

