Article

Real-Time Locational Detection of Stealthy False Data Injection Attack in Smart Grid: Using Multivariate-Based Multi-Label Classification Approach

by
Hanem I. Hegazy
1,
Adly S. Tag Eldien
1,
Mohsen M. Tantawy
2,
Mostafa M. Fouda
3,4,* and
Heba A. TagElDien
1
1
Department of Electrical Engineering, Faculty of Engineering at Shoubra, Benha University, Cairo 11672, Egypt
2
Network Planning Department, National Telecommunication Institute (NTI), Cairo 11768, Egypt
3
Department of Electrical and Computer Engineering, Idaho State University, Pocatello, ID 83209, USA
4
Center for Advanced Energy Studies (CAES), Idaho Falls, ID 83401, USA
*
Author to whom correspondence should be addressed.
Energies 2022, 15(14), 5312; https://doi.org/10.3390/en15145312
Submission received: 24 June 2022 / Revised: 16 July 2022 / Accepted: 18 July 2022 / Published: 21 July 2022
(This article belongs to the Special Issue Secure and Efficient Communication in Smart Grids)

Abstract

:
Recently, false data injection attacks (FDIAs) have been identified as a significant category of cyber-attacks targeting smart grids’ state estimation and monitoring systems. These cyber-attacks aim to mislead control system operations by compromising the readings of various smart grid meters. The real-time and precise locational identification of FDIAs is crucial for smart grid security and reliability. This paper proposes a multivariate-based multi-label locational detection (MMLD) mechanism to detect the presence and locations of FDIAs in real-time measurements with precise locational detection accuracy. The proposed architecture is a parallel structure that concatenates Long Short-Term Memory (LSTM) with Temporal Convolutional Neural Network (TCN). The proposed architecture is trained using Keras with Tensorflow libraries, and its performance is verified using an IEEE standard bus system in the MATPOWER package. Extensive testing has shown that the proposed approach effectively improves the presence-detection accuracy for locating stealthy FDIAs in small and large systems under various attack conditions. In addition, this work provides a customized loss function for handling the class imbalance problem. Simulation results reveal that our MMLD technique has a modest advantage in some aspects. First, our mechanism outperforms benchmark models because the problem is formulated as a multivariate-based multi-label classification problem. Second, it needs fewer iterations for training and reaching the optimal model. More specifically, our approach is less complex and more scalable than benchmark algorithms.

1. Introduction

Traditional power systems have evolved into the next generation of the power grid, known as Smart Grid (SG) [1]. The SG integrates modern information and communication technologies (ICTs) and intelligent information processing into traditional power systems, allowing energy operators to monitor and control power generation, transmission, distribution, and consumption processes in a more efficient, dependable, and secure manner [2]. Due to the bidirectional information exchange between consumers and operators, the amount of data produced by a smart grid is far greater than that produced by a standard power system. Industrial IoT technology allows the transfer of such large amounts of data. This vital cyber infrastructure makes the smart grid more vulnerable to harmful cyber-attacks [3,4,5,6,7,8,9].
Supervisory Control and Data Acquisition (SCADA) systems continually monitor and control SG systems to preserve the normal operation of the smart grid [9]. The SCADA systems obtain real-time measurements from remote meters. The state estimator then uses these measurements to estimate system states and develop real-time power network models [10]. These state estimates are critical for Energy Management System (EMS) application functions, such as optimal power flow and economic dispatch, etc., and heavily depend on them.
The main goal of cyber-attacks is to harm or intentionally mislead a smart grid’s state estimation mechanism, causing regional blackouts or attempting to manipulate energy market prices and cause severe economic consequences [11]. There are various types of cyber-attacks, one of them is false data injection attacks (FDIAs) [12,13]. FDIAs attempt to manipulate the state estimation of the power grid by injecting harmful data into meter measurements [14,15]. Furthermore, communication networks are subject to data injection attacks, which can modify measurements during transmission [16].
A stealthy FDIA can evade the typical bad data detection (BDD) unit in the SCADA system and thus is regarded as one of the most severe threats to state estimation. Various studies have been conducted to develop different methods of constructing FDIAs [17]. In [18], a Stealthy FDIA can be carried out even if the attacker only has limited knowledge about power grid configuration information and can only change a small set of system measurements.
To boost smart grid security, several approaches have been adopted to detect FDIAs in smart grids, which can be divided into two categories: model-based and data-driven detection algorithms [19]. In recent studies, data-driven detection approaches based on deep learning have become widely attractive. Deep learning models do not require any statistical assumption about the system model or a predefined attack. These techniques allow the system to learn the models during the training process.
In this paper, an online FDIA locational detection approach is proposed using Long Short-Term Memory and Temporal Convolutional Networks (LSTM-TCN). This model structure is considered a parallel structure of multivariate input fed into TCN and LSTM RNN blocks. In order to study the multi-label classification task, a fully connected layer is used with a sigmoid activation function and the number of meter measurements. To the best of our knowledge, this work is the first study to investigate the locational detection of a stealthy FDIA in smart grid as a multivariate-based multi-label classification problem. The input measurements are applied as multivariate time series data to LSTM and TCN blocks, they will process each time step with N variables (meter measurements). The MMLD approach outperforms both LSTM and CCN with univariate input, as shown in Section 5. The following are our main contributions:
  • Using the multivariate-based LSTM-TCN increased the performance of the architecture and can better distinguish the FDIA multi-label classes. Furthermore, the proposed model is very fast, stable, and efficient in terms of training and testing time.
  • The suggested approach is universal, i.e., it is not dependent on the statistical assumption of the attack model.
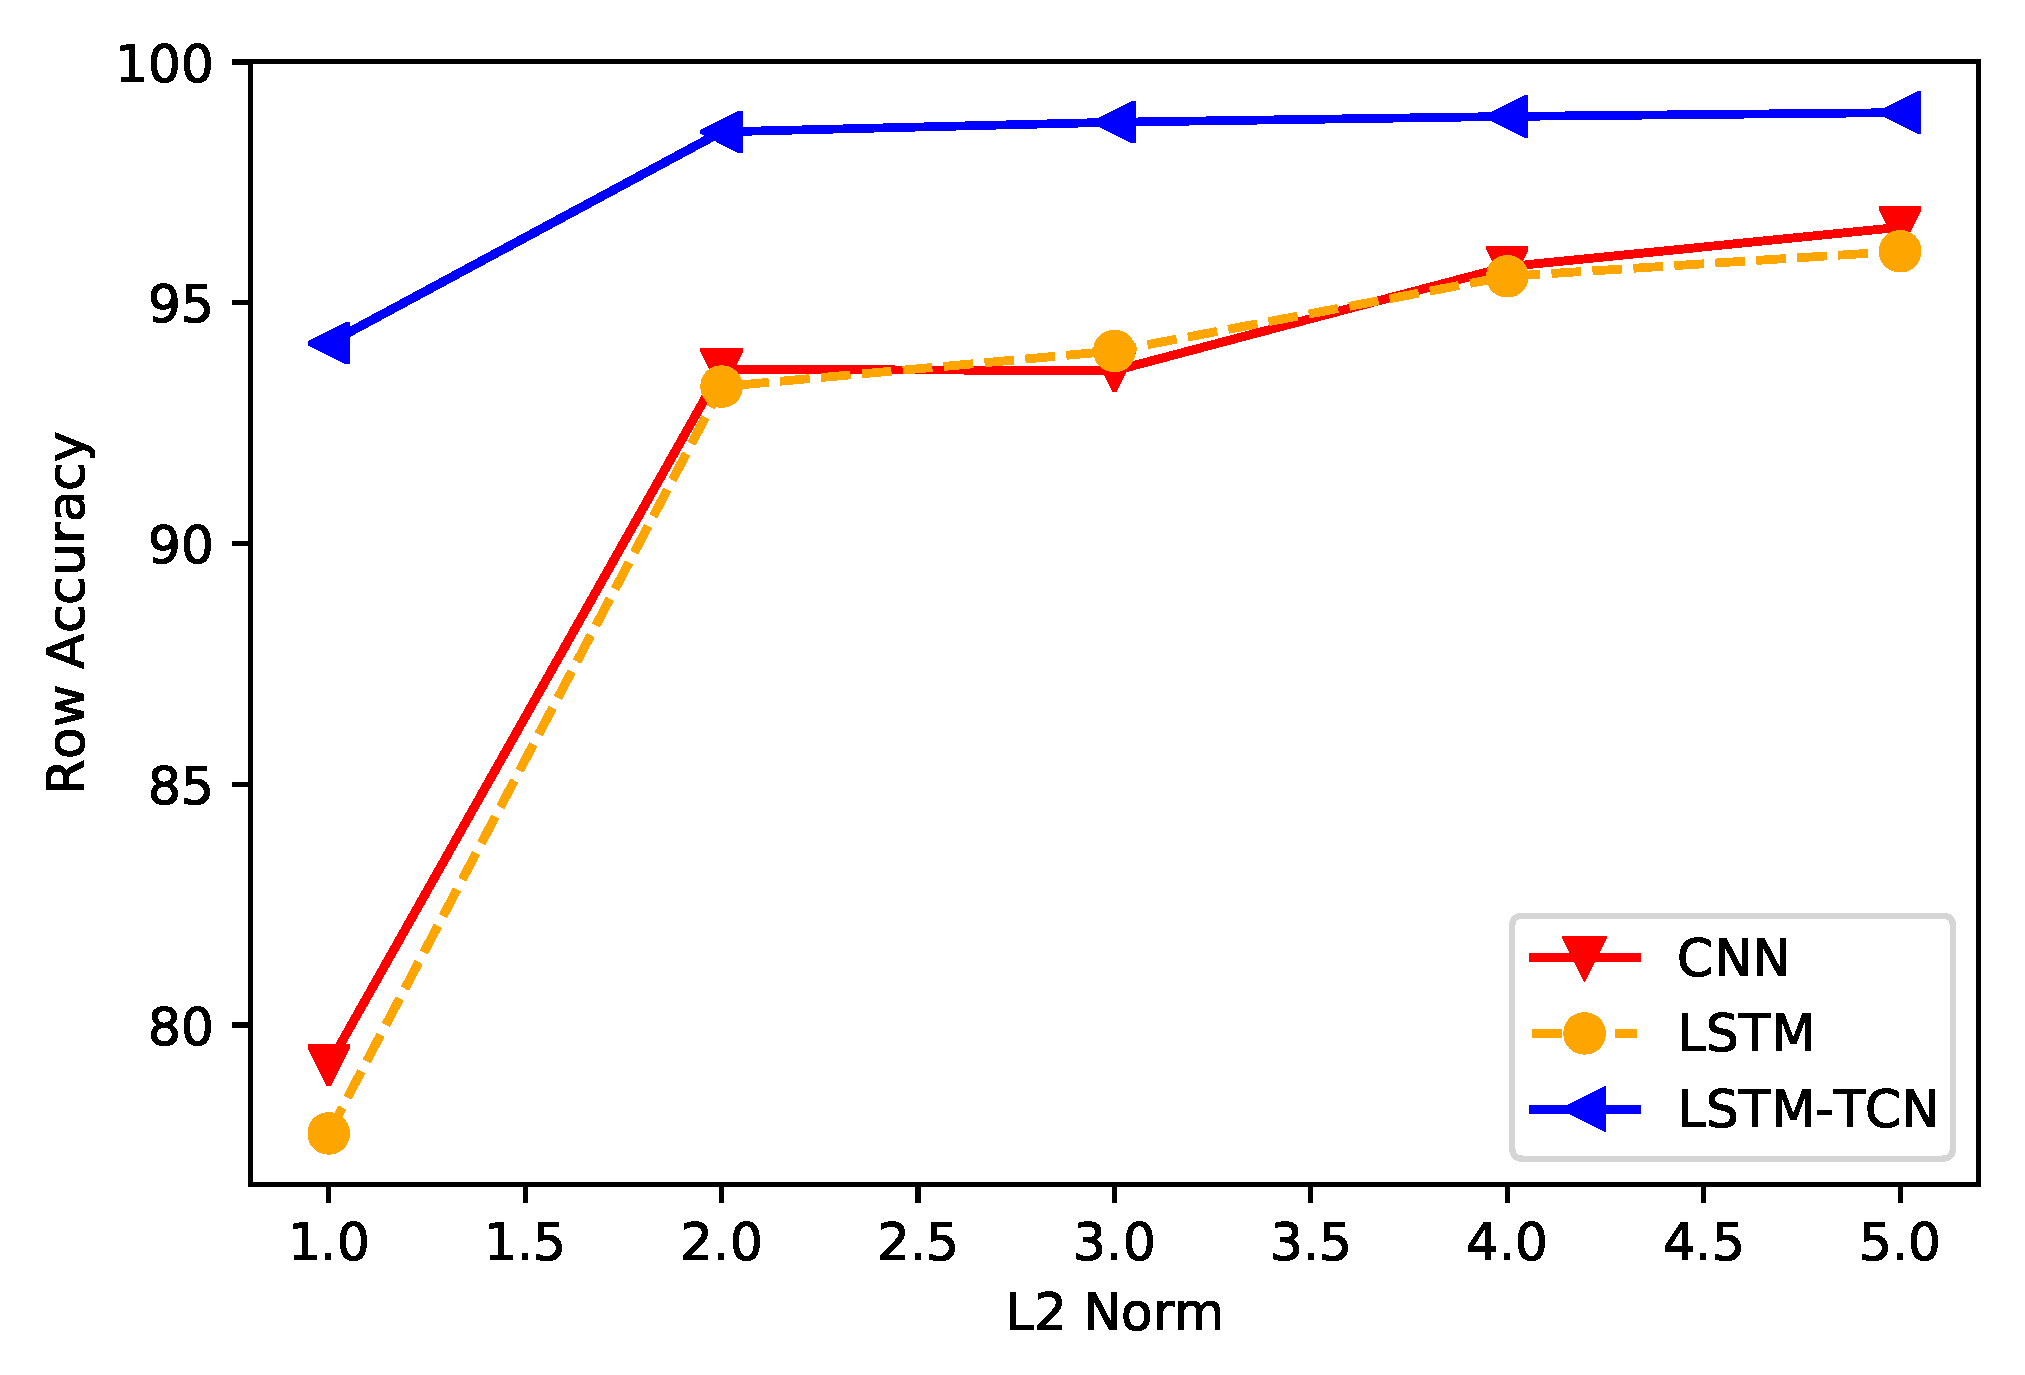
  • Our design is robust and scalable since it can adapt to detect slight and high L 2 -norms of FDIAs and varying topology models.
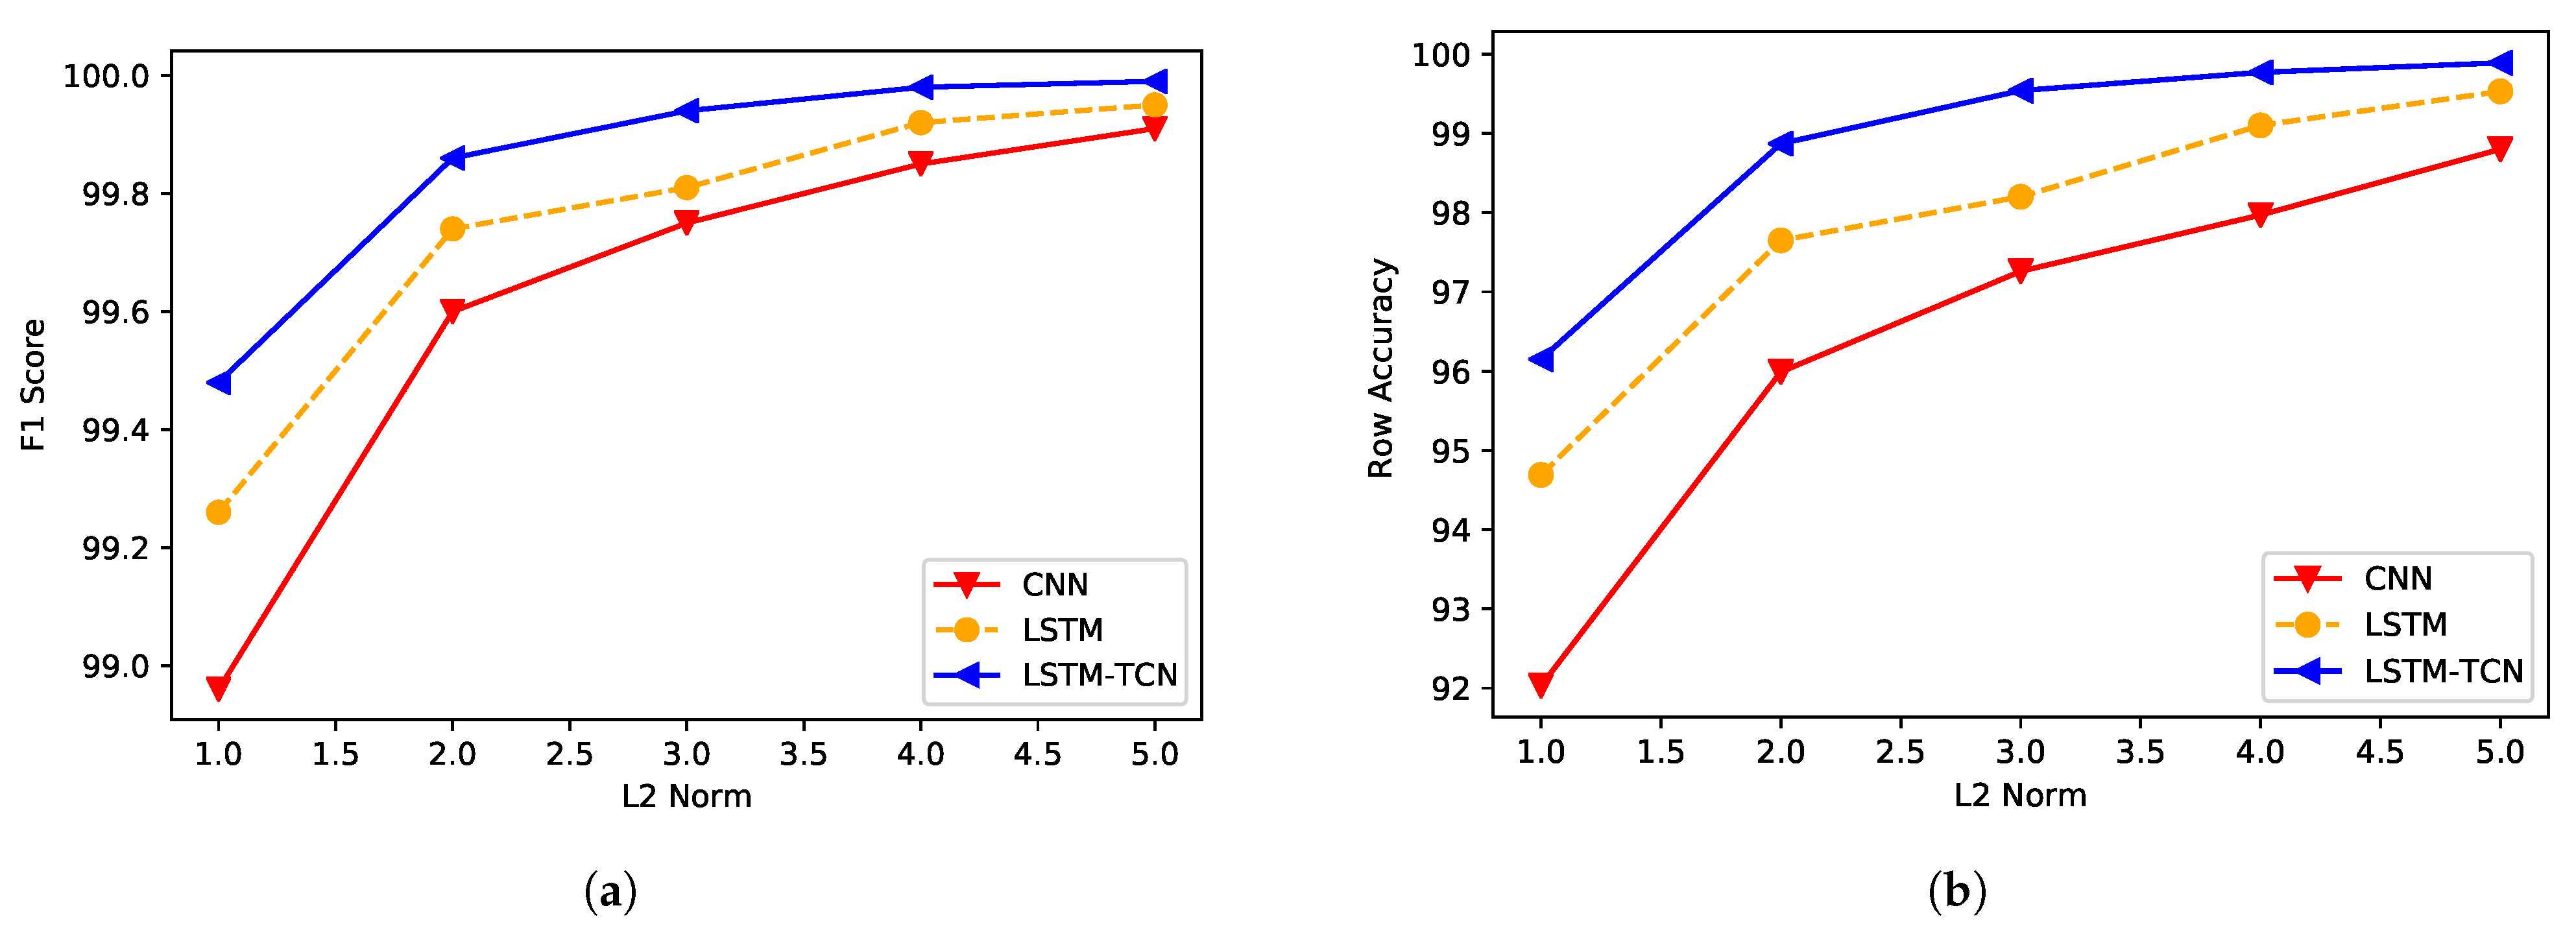
  • Extensive investigations are conducted to evaluate and verify the proposed architecture. A parameter sensitivity test is also carried out to assess the suggested frameworks’ performance and applicability capabilities. Extensive results in the IEEE 118-bus system reveal that the proposed architecture achieves a locational detection accuracy of 98.6% and a presence detection accuracy of 99.8%, on average using only two layers of the FCN and one layer of LSTM. We can conclude that the proposed framework is a scalable, robust, accurate technique and outperforms the state-of-the-art benchmarks [20,21].
The remainder of this paper is structured as follows: The related work is discussed in Section 2. The power system model for state estimation is introduced in Section 3. The problem formulation and proposed architectures are presented in Section 4. Then, Section 5 illustrates the performance of the proposed FDIA locational detection approaches via extensive simulations. Finally, Section 6 concludes the paper.

2. Related Work

SGs rely heavily on time series data. Developing prediction models with high locational detection accuracy is difficult due to the extra factors in these kinds of data, such as temporal aspects and uncertainty. In particular, when sensors are of poor quality, it might be tough to predict whether an anomaly happened as a consequence of noisy data collected by the meters/sensors or as a result of cyber integrity attacks.
Several FDIAs and anomaly detection algorithms have been developed using machine learning technologies. This section contains a summary of recent studies. For example, Ref. [20] proposed a multi-label classification approach for FDIA locational detection using convolutional neural network (CNN) architecture. The work in [21] introduced a traditional BDD with a CNN architecture, a convolutional neural network with long-short memory (CNN-LSTM), a convolutional neural network with a gated recurrent unit (CNN-GRU), and K-nearest neighbors (KNN) schemes for FDIA locational detection. An online and semi-supervised learning technique was suggested in [22] that can be used in topological and hierarchical networks for various attack scenarios. In [23], the authors proposed a reinforcement learning (RL) framework for online cyber-attack detection problems targeting the smart grid. The authors in [22] proposed supervised and semi-supervised machine learning approaches to detect unobservable attacks. A Conditional Deep Belief Network (CDBN) is proposed in [24] to reveal temporal behavior features of the structured false data injection attacks. For identifying anomalies in smart grid streaming measurement data, due to the temporal aspects involved in these data, time series analysis and the adaptation of state-of-the-art abnormality detection algorithms are extremely common in research. The author in [25] presents an anomaly detector using an LSTM-based encoder–decoder, and this approach achieved an F1-score of above 0.84. A convolutional neural network for anomaly detection in video sequences of crowded scenes was proposed in [26]. According to the authors, a mixture of spatial and temporal features is the optimal fit for this application field. The author in [27] proposed an anomaly detector called Omni Anomaly for multivariate time series data based on a stochastic recurrent neural network with an F1-score of about 0.89. There are also more studies that address anomaly detection methods, such as graph-based modeling [28] and the mechanism of the self-attention network [29]. For example, Ref. [30] employed a TCN approach to discover anomalies in time series data, in which a multivariate Gaussian distribution (MGD) was used to estimate abnormality scores as well as match the prediction errors. In [31], the authors proposed LSTM-FCNs and ALSTM-FCN for the classification of time-series signals.
Most of the previous research centered on identifying the presence of FDIAs. In contrast, the locational detection of stealthy FDIAs addressed in this research shares some similarities with multivariate time series tasks and multi-label classification problems in speech recognition and image processing [32,33]. The results of this paper show that when FDIA detection has been formulated as a multivariate-based multi-label classification problem, this increased the performance of our detector in identifying the locations of stealthy FDIAs.

3. Preliminaries

3.1. Power System Model

At the control center, state estimation provides an efficient process for assessing current system operating conditions from a set of real-time meter measurements. State estimation is a necessary step in acquiring the voltage magnitudes and phase angles of all grid buses in a power system. The power flow equations form the foundation of state estimation, relating state variables and the measurements vector. In this paper, a DC linearized state estimation problem in a steady-state power system with n + 1 buses and t transmission lines is used. Using this linearized power flow model, the state estimation problem is therefore to estimate the n phase angle state variables based on m measurements. The relationship between received measurements and state variables can be expressed in a vector-matrix form as in [15,18]:
z = H x + e ,
where n is the number of state system variables, m is the number of meter measurements, and m n , z R m is the measurement vector, which includes power flow measurements on transmission lines as well as power injection measurements at buses. The vector x R n represents phase angle system state vector, the vector e represents Gaussian noise, whereas H R m × n denotes the Jacobian matrix.
The majority of traditional methods for detecting bad data injection rely on residual tests. The residual is the difference between the computed value from the estimated state and the observed measurement vector z, i.e., z H x . The associated measurement will be considered poor data if the L 2 -norm value of the elements in a normalized residual exceeds the pre-defined threshold, and these bad measurements and an attack are announced by the BDD detector as long as the following holds:
R = z H x 2 2 τ

3.2. False Data Injection Attack (FDIA)

FDIAs are classified into two types of attacks depending on if the false data attacks are detected or not by BDD approaches:
  • Non-stealthy FDIAs: These unstructured attacks can be detected using traditional residual-test methods in Equation (2) [10]. The attackers are unaware of the measurement matrix H ; the attackers simply generate arbitrary attack vectors and modify meter measurements.
  • Stealthy FDIAs: They are structured attacks that are not detected by typical methods of bad data detection.
In the case of stealthy FDIAs, it is assumed that the attackers only require partial knowledge of the power grid’s topology or the measuring matrix to compromise a small set of meters [17,34]. For example, the authors in [17] proved that an optimally structured FDIA attack can be formed when the attacker only has minimal knowledge of the measuring matrix H by using the min-cut method. They carefully design the false data and let a = Hc, where c 0 and c R n are any arbitrary vector [35]. The measuring vector can then be described as:
z ^ = H x + e + a
Such attacks can evade detection by traditional residual test methods in Equation (2), leading the control unit to believe that the compromised state x ^ = ( x + c ) is the true state, and in such cases, the L 2 -norm of the residual remains unchanged:
z ^ H x ^ | | = z + a H ( x + c ) = z H x
This paper presents a new data-driven FDIA detection strategy that can detect the locations of compromised meters in the control center. Such an approach is formulated as a multivariate input-based multi-label classification approach.

4. FDIA Location-Based Detection Scheme as a Multivariate Multi-Label Classification Approach

This section provides the proposed mechanism and how it will be implemented. In addition, it proposes the structures of the proposed MMLD architecture.

4.1. Detection of FDIA Location

Mathematically, detecting the presence of FDIA is equivalent to categorizing the entire measurement vector into two labels: compromised or not. This type of classification results in a single-label classification task, whereas identifying the location of the FDI attack vector is accomplished by categorizing each reading of the measurement set into two labels: abnormal/compromised and normal/uncompromised. As a result, FDIA’s location detection can be considered a multi-label classification problem.
The meters that contained the locations for false data were labeled as compromised locations, while the meters that were not subjected to an FDIA were labeled as uncompromised locations. Frequently, multi-label classification problems are imbalanced, and downsampling methods are ineffective. To tackle this problem, this work carefully developed the MMLD structure to extract and represent the associated data information, resulting in good multi-label classification performance.

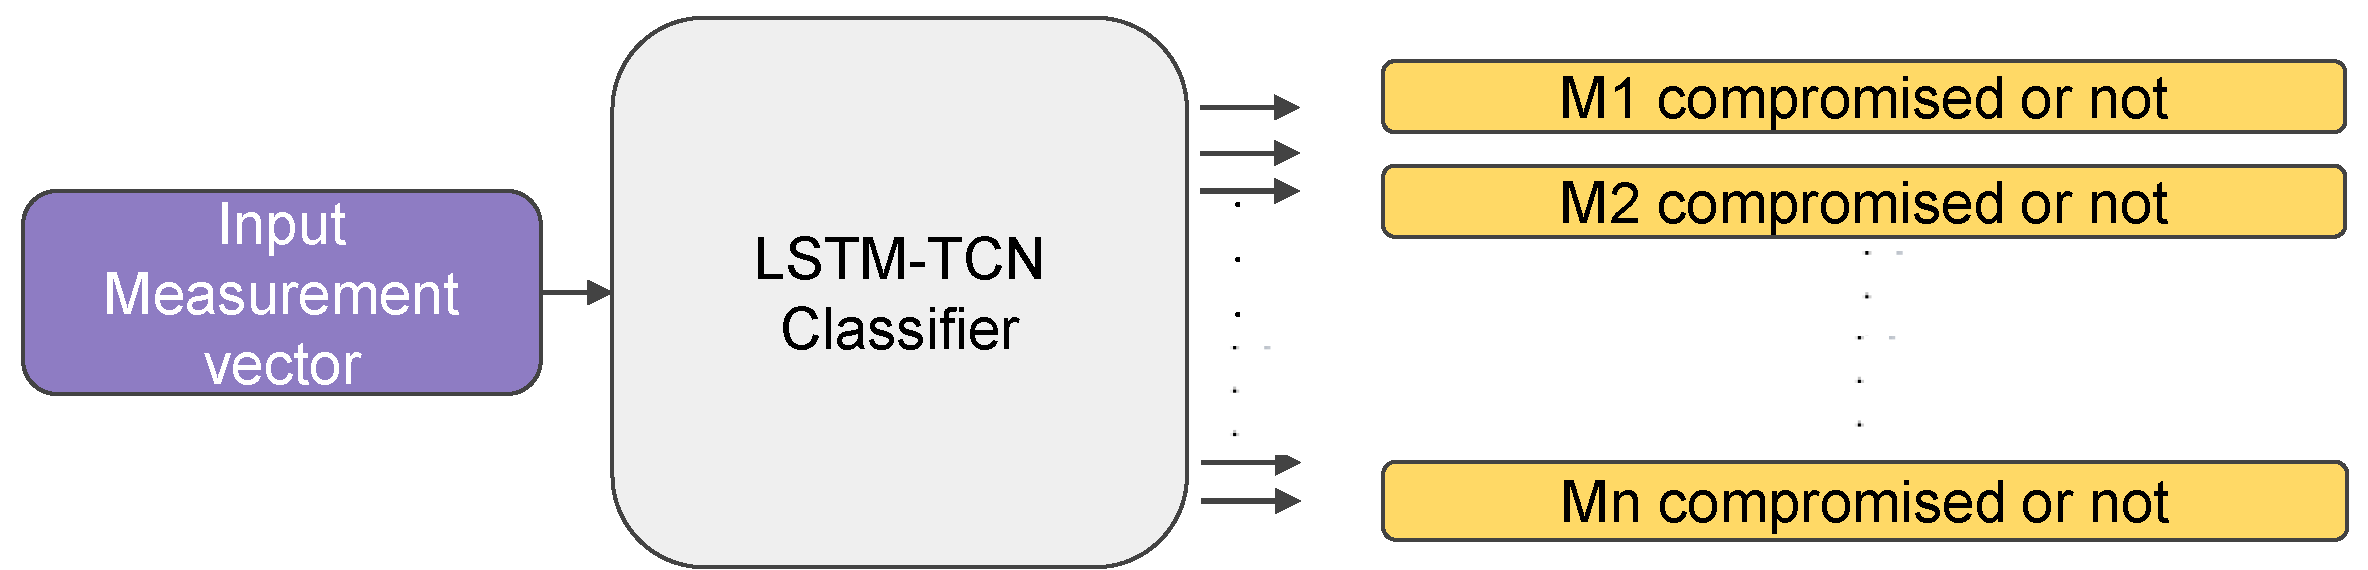
4.2. FDIA Proposed Detection Mechanism

This paper defines the LSTM-TCN architecture used as a multivariate multi-label classifier. These classifiers’ inputs are the time series meters’ measurement vectors. During the training process, they only require these corresponding measurement vectors alongside their truth labels. This type of approach is model-free, which means it does not require any prior statistical knowledge about the power grid topology or Jacobian matrix H.
The proposed methodology for detecting the location of an FDIA is shown in Figure 1. In the SCADA system, the measurements are first sent to the conventional BDD detector. Such detectors can be used to detect compromised or noisy readings by measuring the L 2 -norm according to Equation (2) and comparing it to a predefined threshold. The BDD detector triggers an alarm for these compromised meter readings. This detector is capable of dealing with meter measurements that include meter failures, malfunctions, communication issues, and non-stealthy FDIAs. Structured FDIAs can bypass the traditional BDD detector. These compromised measurements are provided to our proposed classifier. It is capable of detecting the presence of FDIAs as well as the positions of these compromised meters.

4.2.1. Input

In the proposed detector, the LSTM-TCN blocks receive multivariate data obtained through dimension shuffling after input measurements. An example of such data is 14-bus system data, which includes 19 measurements with a single time step associated with each set of features. Because the input is now seen as multivariate readings, a tensor of shape (B, N, M) can be used to construct these data, where B is the number of samples in the dataset, N is the total number of time steps, and M represents the number of measurements processed every time step.
The measurement vector z t = z 1 t , , z n t is the input vector for time step t for 0 < t T . The TCN and LSTM blocks both perceive the same multivariate measurements. This is achieved by the dimension permutation layer, which transposes the time series’ temporal dimension. After transformation, a univariate time series of length N is transformed into a multivariate time series (with N variables) at each time step. The results are verified in IEEE 14 and IEEE 118-bus systems.

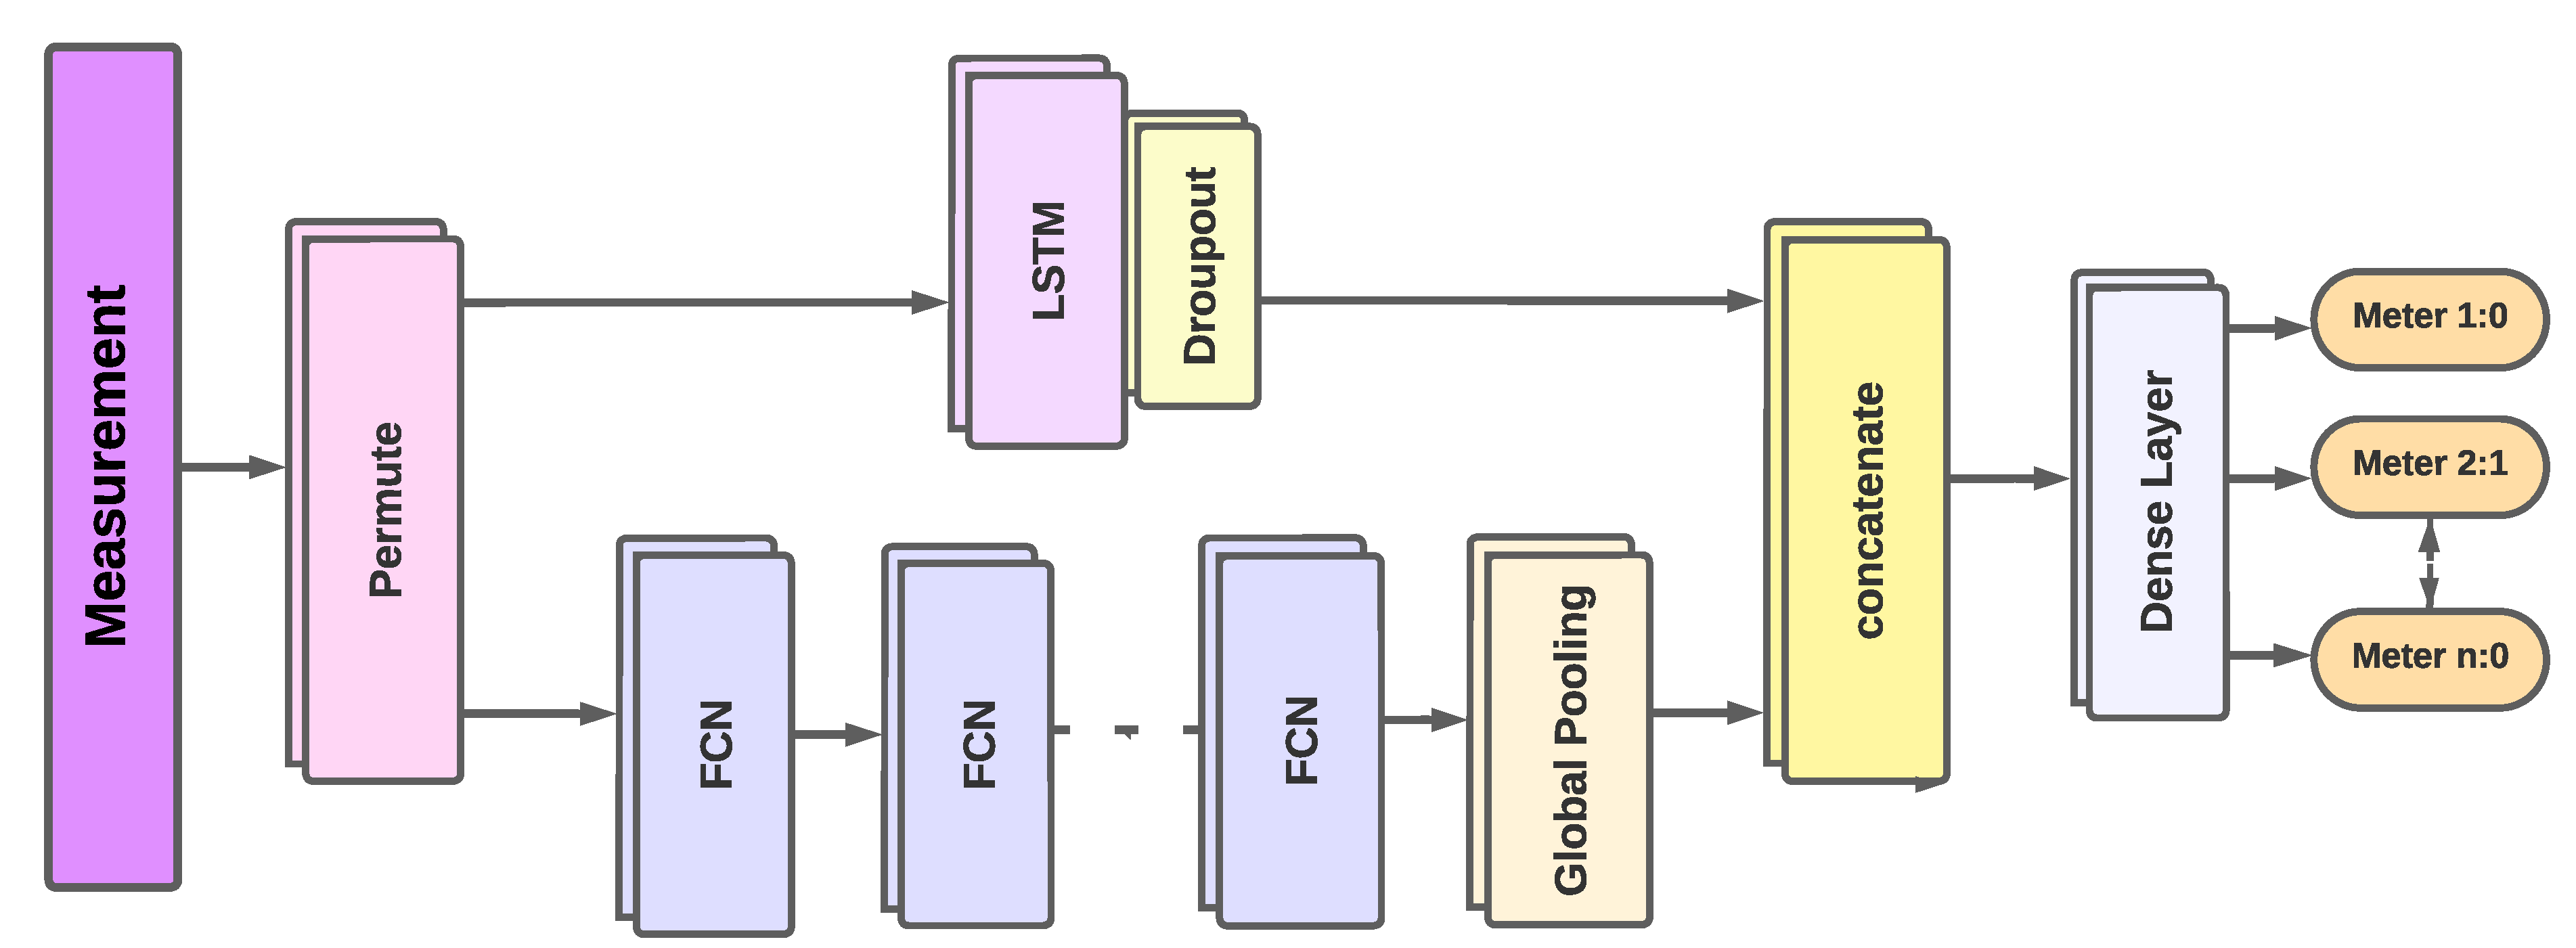
4.2.2. Proposed Architecture

Temporal Convolutional Neural Networks have been shown to be a powerful learning method for time series classification tasks [36]. The TCN is founded on two basic principles: (1) causal convolutions, i.e., no information leaking from the future to the past; (2) the architecture, similar to an RNN, can receive any length sequence and map it to the same length output sequence. The TCN is composed of a 1D fully convolutional network (FCN) structure with each hidden layer having the same length as the input layer and succeeding layers keeping the same length as prior ones using causal padding parameters. The proposed LSTM-TCN architecture for detecting FDIA locations is shown in Figure 2.
The proposed architecture is composed of 2 stacked 1dimensional fully convolutional networks (1D FCN), which are typically used as feature extractors, and 1 layer of LSTM followed by a dropout of 0.2 to help to control over-fitting and to speed up convergence. Each FCN block is accompanied by batch normalization. Batch normalization is applied to avoid vanishing or exploding gradients. After that, there is a ReLU activation function.
Following the last convolution block, a global average pooling is utilized to decrease the number of parameters in the model before classification [37]. The time series meter measurements are conveyed into a dimension shuffle layer and then applied to the LSTM-TCN blocks. For multi-label classifications of meter readings, the output of the global pooling layer and the LSTM block are combined and sent onto a fully connected layer.

Fully Convolutions Blocks

Consider L convolutional layers. On each of these layers, a set of 1 D filters h : { 1 , , k } R is applied. The feature maps c 1 , j of the first fully convolutional layer are formed from the multivariate input measurements z and can be represented as:
c 1 , j t = ReLU z t h 1 , j + b 1 , j
where h 1 , j is the jth kernel, and b 1 , j is the corresponding bias. b 1 , j is added to all the convolution output, and the convolution operation is denoted by *. The inputs for Ith convolutional layer are feature maps produced at ( I 1 ) th convolutional layer. The output of the Ith layer is as follows:
c I , j t = ReLU c I 1 , j h 1 , j + b 1 , j
where c 1 , j t represents the jth feature map at the Ith convolutional layer for time step t , 0 < t T . The depth of the convolutional layer and the number of filters at each layer are the key parameters for that architecture. A batch normalization layer receives the feature mappings learned from the Ith convolutional layer, and then a global average pooling is used.

LSTM RNNs Block

A long short-term memory network is a specialized Recurrent Neural Network (RNN) structure. As stated in ref. [38], by including gating functions into LSTM’s state dynamics, it avoids the vanishing gradient issue that affects standard recurrent neural networks. At each time step, the LSTM has a multivariate input z t . h t 1 and c t 1 are the inputs from the previous time step. Each LSTM cell contains three gates: the input gate i, forget gate f, and output gate o. The following is the information flow of an LSTM cell:
f t = σ g w f z t + u f h t 1 + b f
i t = σ g w i z t + u i h t 1 + i
o t = σ g w o z t + u o h t 1 + b o
c t = f t c t 1 + i t tanh w c z t + u c h t 1 + b c
h t = o t tanh c t
where σ g and tanh denote the sigmoid and tangent functions, respectively, and ∘ represents element-wise multiplication. Here, c and h represent the cell state vector and hidden state vector, respectively.

LSTM Concatenated with FCNs Block

When the LSTM block’s features are combined with the FCN features, we obtain a more robust collection of features that can better distinguish the dataset’s classes. As detailed in Section 4, Results, our findings demonstrate that using both the LSTM block’s attributes and the FCN block’s features enhanced model performance over simply using basic CNN [20] and LSTM architectures.

Fully Connected Layer

Finally, a fully-connected layer with sigmoid activation is used to generate the class probabilities of meter measurements at each time step. Then, a multi-label classification output for any meter j at time series t can be represented as:
y ^ t = sigmoid w d × c i + b d
where c i is the concatenated features ( c I and h t ), and w d and b d are the weights and biases of the dense layer, respectively.

Dimension Shuffle

When dimension shuffling is performed on the input before the LSTM-TCN blocks, only one time step with N variables will be processed. Due to using dimension shuffling, the training time is reduced, and model performance is enhanced.
For the IEEE 14-bus power system, Table 1 presents an example of the MMLD network. In comparison to the benchmark [20], our proposed detector requires fewer parameters for training.

4.3. Training Procedure

Before applying the proposed FDIA locational detector to classify the meter readings, the hyperparameters, which include number of filters, number of neurons, activation function, optimizer, learning rate, batch size, epochs, and number of layers, must be tuned first. The locational detection accuracy can be affected by the number of layers used: fewer layers may result in underfitting, while too many layers may result in overfitting. The goal of the parameter-tuning process is to find the optimal parameters for the proposed approach during the training phase.

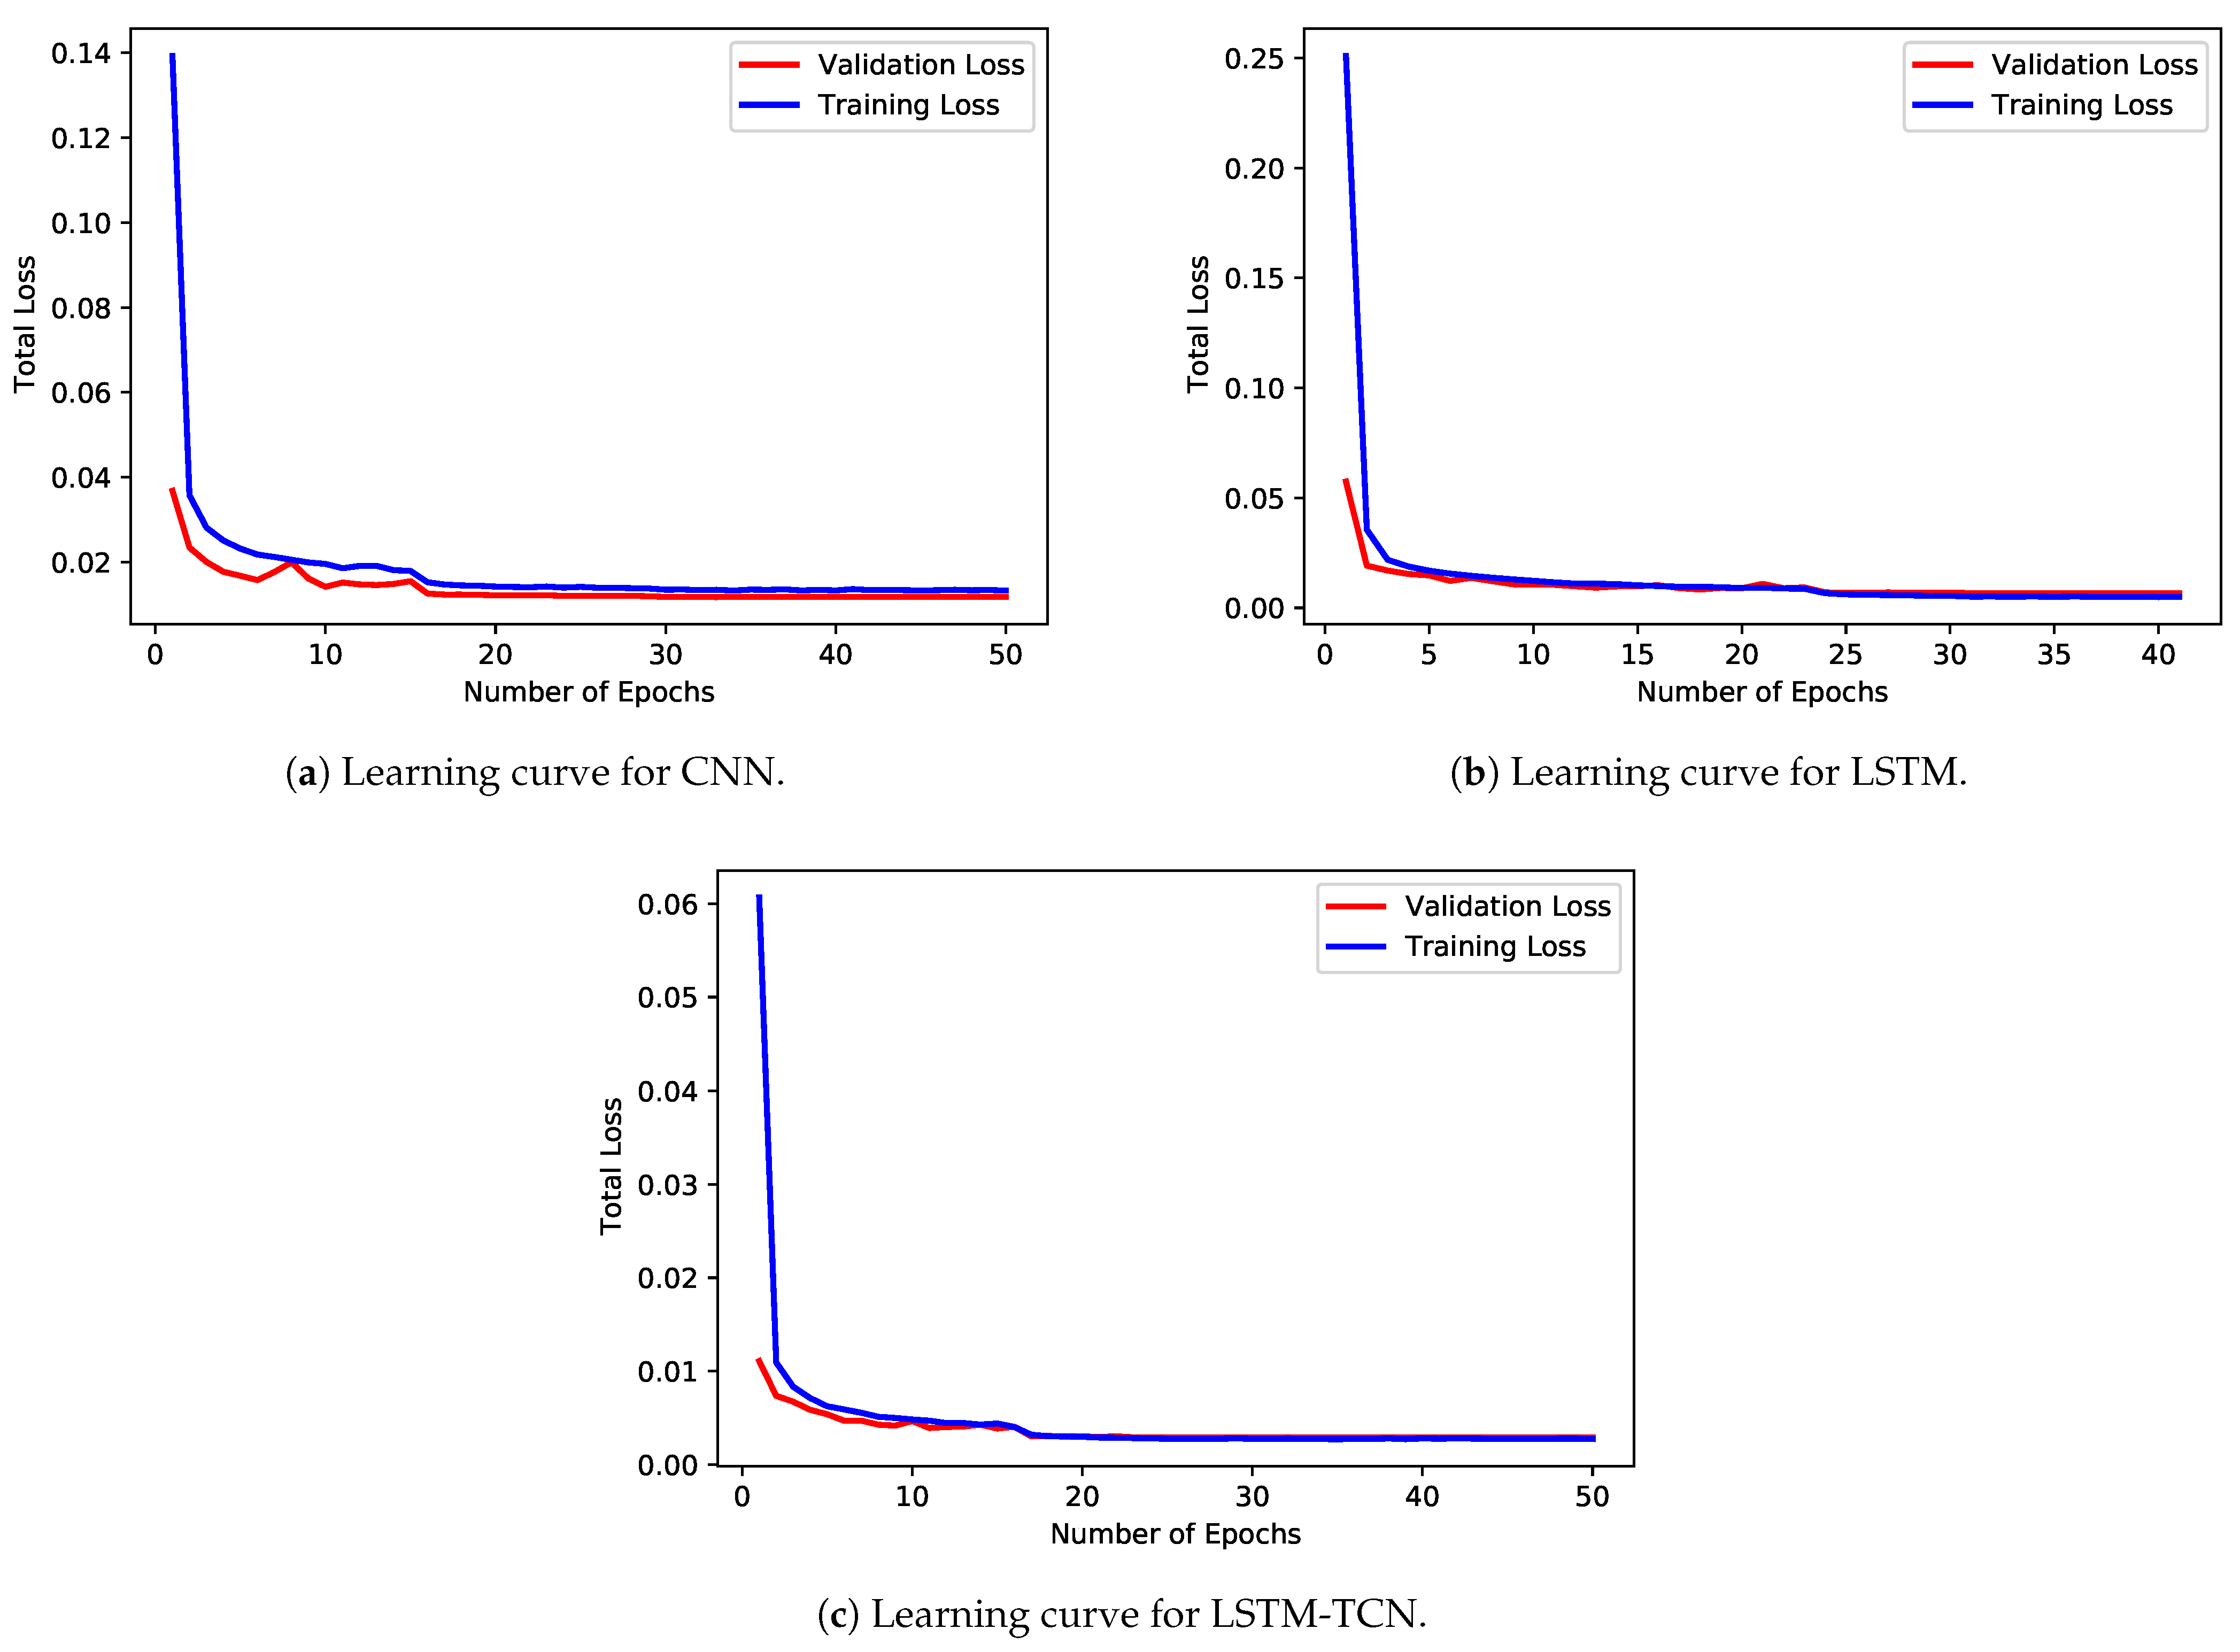
4.3.1. Mini-Batch, Cross-Validation, and Early Stopping Technique

To minimize over-fitting and increase the convergence rate of the LSTM-TCN architecture, the mini-batch gradient descent technique, cross-validation, and early stopping technique are used. In each mini-batch, randomly selected data of 100 instances from the training dataset are used to calculate the gradient descent. The training dataset is divided into 0.7 for training, 0.2 for validation, and 0.1 for testing for each batch.

4.3.2. Loss Function

Cross entropy is mainly used for multi-label classification which shows the error between actual meter labels y t with respect to the predicted meter labels of the model y t for each mini-batch. The loss function is used for optimizing the hyperparameter during the training and can be shown as:
d L i = t θ 1 m i = 1 m y i t log y ^ i t + 1 y i t log 1 y ^ i t
We have five variants of datasets. The L 2 norm of FDIA has been varied in each dataset variant. L 2 -norm is varied from 1 to 5. Our datasets contain unbalanced labels. Figure 3 is an example of variant 1 dataset in which L 2 -norm = 1 . Due to the unbalanced issue, a customized loss function is applied. The class-weights information should be calculated. So, the above equation is updated to:
d L i = t θ 1 m i = 1 m w p y i t log y ^ i t + w n 1 y i t log 1 y ^ i t
where w p and w n are positive and negative class weights, respectively. Using this custom loss function, the network will estimate the logit value y ^ i t for each label. These logit values will be checked with the true value y i t , and the difference between them will result in cross-entropy loss. This loss will be weighted according to the class weight of the true value. The total loss will be a summation of all the weighted-cross entropy, which can be backpropagated to optimize the network’s parameters.

5. Experimental Results

This section first emphasizes the training and testing dataset generation followed by their creation using stealthy FDIAs. Then, evaluation metrics for FDIA detection are mentioned. In addition, this section investigates the efficiency and robustness of five proposed models trained on five dataset variants for identifying the presence of FDIAs and the falsified meters’ location.

5.1. Dataset Generation
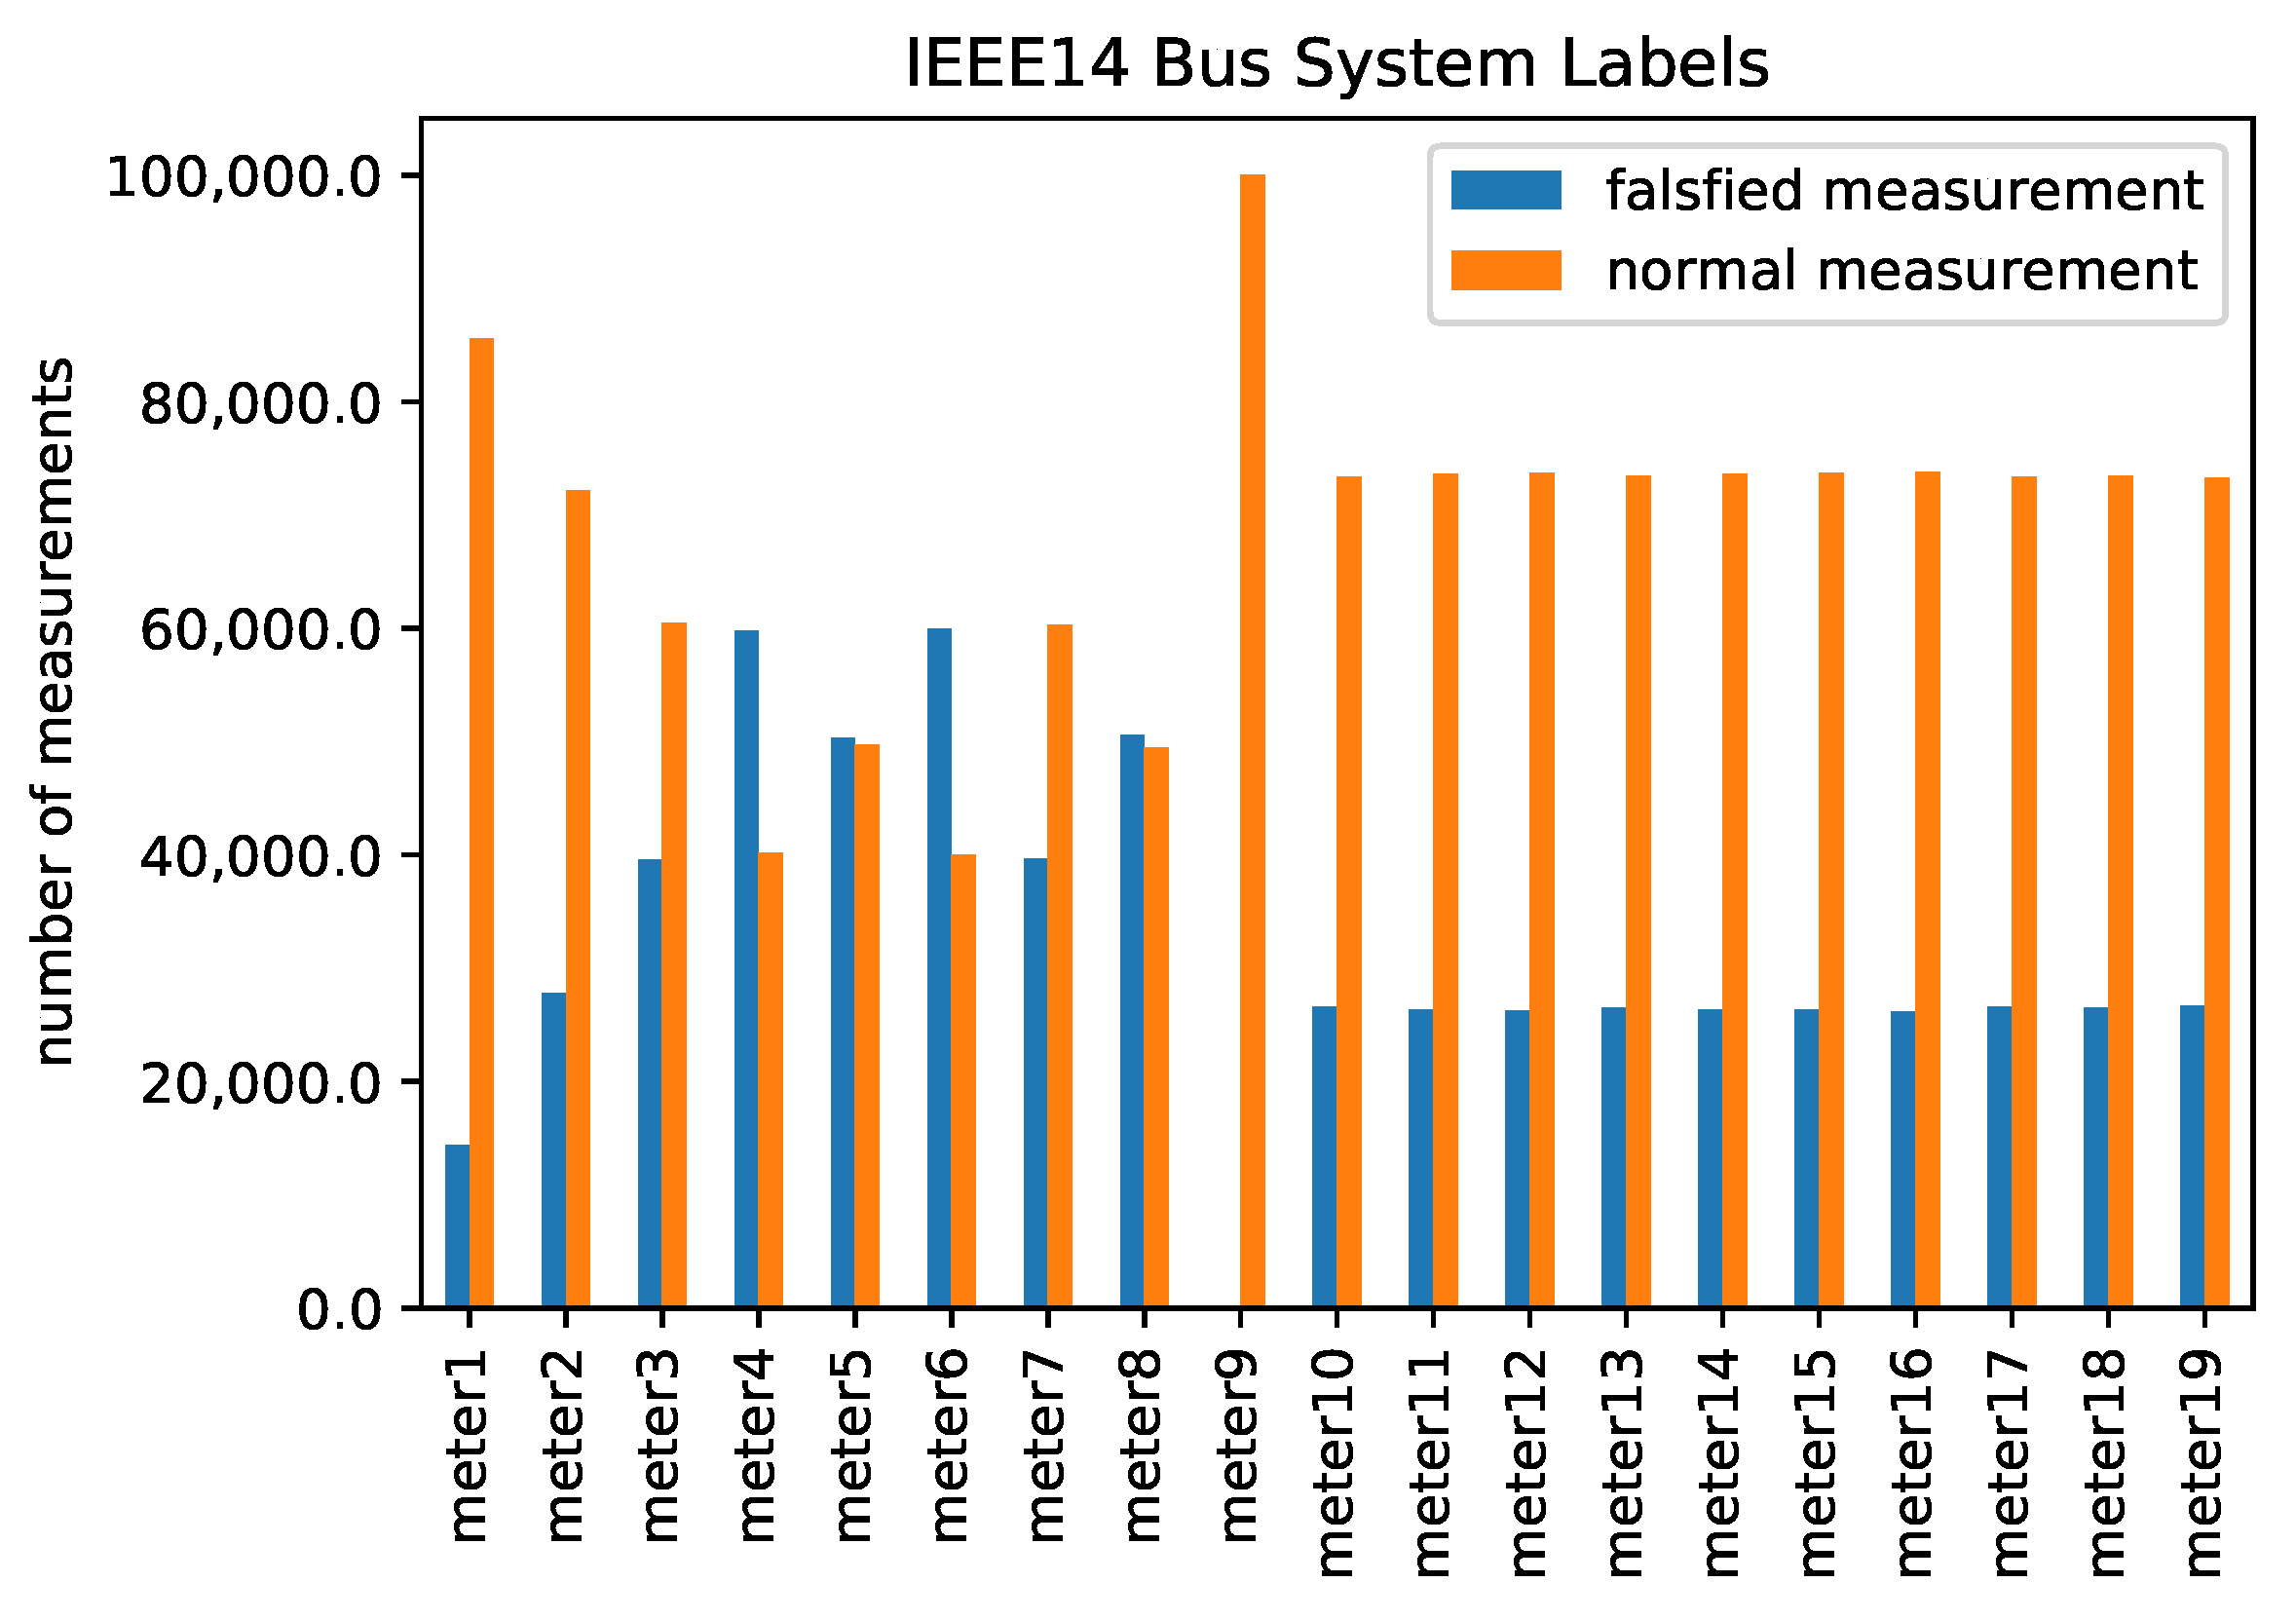
This section assesses the proposed FDIA locational detector in IEEE 14- and 118-bus power grids. The grid topologies are available from MATPOWER [39]. The power topologies can be summarized as follows:
  • IEEE14-bus system:
    Number of transmission lines and buses are 20 lines and 14 buses, respectively.
    Number of total meter measurements are 19, of which 11 are flow measurements and 9 are injected measurements.
  • IEEE118-bus system:
    Number of transmission lines and buses are 186 lines and 118 buses, respectively.
    Number of total meter measurements are 180, of which 110 are flow measurements and 70 are injected measurements.
The training and testing datasets are adopted from [20] and can be summarized as follows:
  • Meter measurements are indexed based on the network topology. first, the line flow meters are indexed from k = 1 as follows:
    • The unindexed meters connecting bus k are indexed and set as k = k + 1 ;
    • If k > 14 (118), the indexing process is terminated; otherwise, the policy returns back to first step. Then, the index is continued from line meters, and the injection meters are labeled based on ascending order of the bus index. An indexed measurement placement of the IEEE 14-bus system is depicted in [20];
  • By artificially generating the loads on each bus, 110,000 sets of uncompromised data are obtained by extending the real-world data. The generated loads are distributed normally, with a mean equal to the base load and a standard deviation equal to one-sixth of the base load’s value [40,41];
  • Ten thousand sets of loads are randomly chosen to implement the FDIA:
    • For each attack, a set of target state variables to compromise is randomly selected. In the 14-bus power system, the target state variables have a discrete uniform (2, 5) distribution, whereas the 118-bus power system has a discrete uniform (2, 10) distribution.
    • Transmission line impedance is set according to [18], and the L 2 -norm of the injected data (expected value of the Euclidean norm of the attack vector) varies from 1 to 5. A noise standard deviation of 0.2 was added in both compromised and uncompromised data.
  • For each set of load and its particular target state variables, a stealthy FDIA is generated according to the min-cut algorithm in [18].
  • Finally, to take into consideration the noise in measurement, a random Gaussian noise with a standard deviation of 0.2 was added in both compromised and uncompromised data.
  • After the training data are generated, the above process is repeated 10 times to generate 10 independent sets of testing data, which naturally introduces validation variations.
The readings of the meters on neighboring buses or lines that are highly correlated. The LSTM-TCN also extracts features by observing the meter’s measurements of adjacent indices.

Training and Testing Datasets

Under each level of attack, the dataset is prepared as follows [20]:
  • For training, input measurements and training labels are generated with a dimension of 110,000 × B. The training data are composed of 100 , 000 samples with no attack vector and 10,000 instances under attack.
  • For testing, a testing set is generated with a dimension of 10,000 × B for measurements and labels. Input measurements are composed of 5000 uncompromised samples and 5000 compromised samples [18]. Over all of the test datasets, the results of all trials have been averaged.
Here, B represents the number of meter measurements of IEEE-test case, i.e., 19 for the IEEE 14-bus System and 180 for the IEEE 118-bus System. The measurement vector and the meter labels y t = y 1 t , , y n t { 1 , , C } , where c represents the number of classes are used for training. These labels are used to train the classifier and can be shown as:
y t = 1 , meter i at instance t is compromised ; 0 , not compromised .
The outputs of the classifier (prediction labels) y ^ t are continuous numbers between 0 and 1. Thus, the classifier establishes a distinction threshold to categorize the output as 0 or 1. The sensitivity to application parameters can be increased or decreased by adjusting the discrimination threshold. In this paper, the discrimination threshold is set to 0.5 .

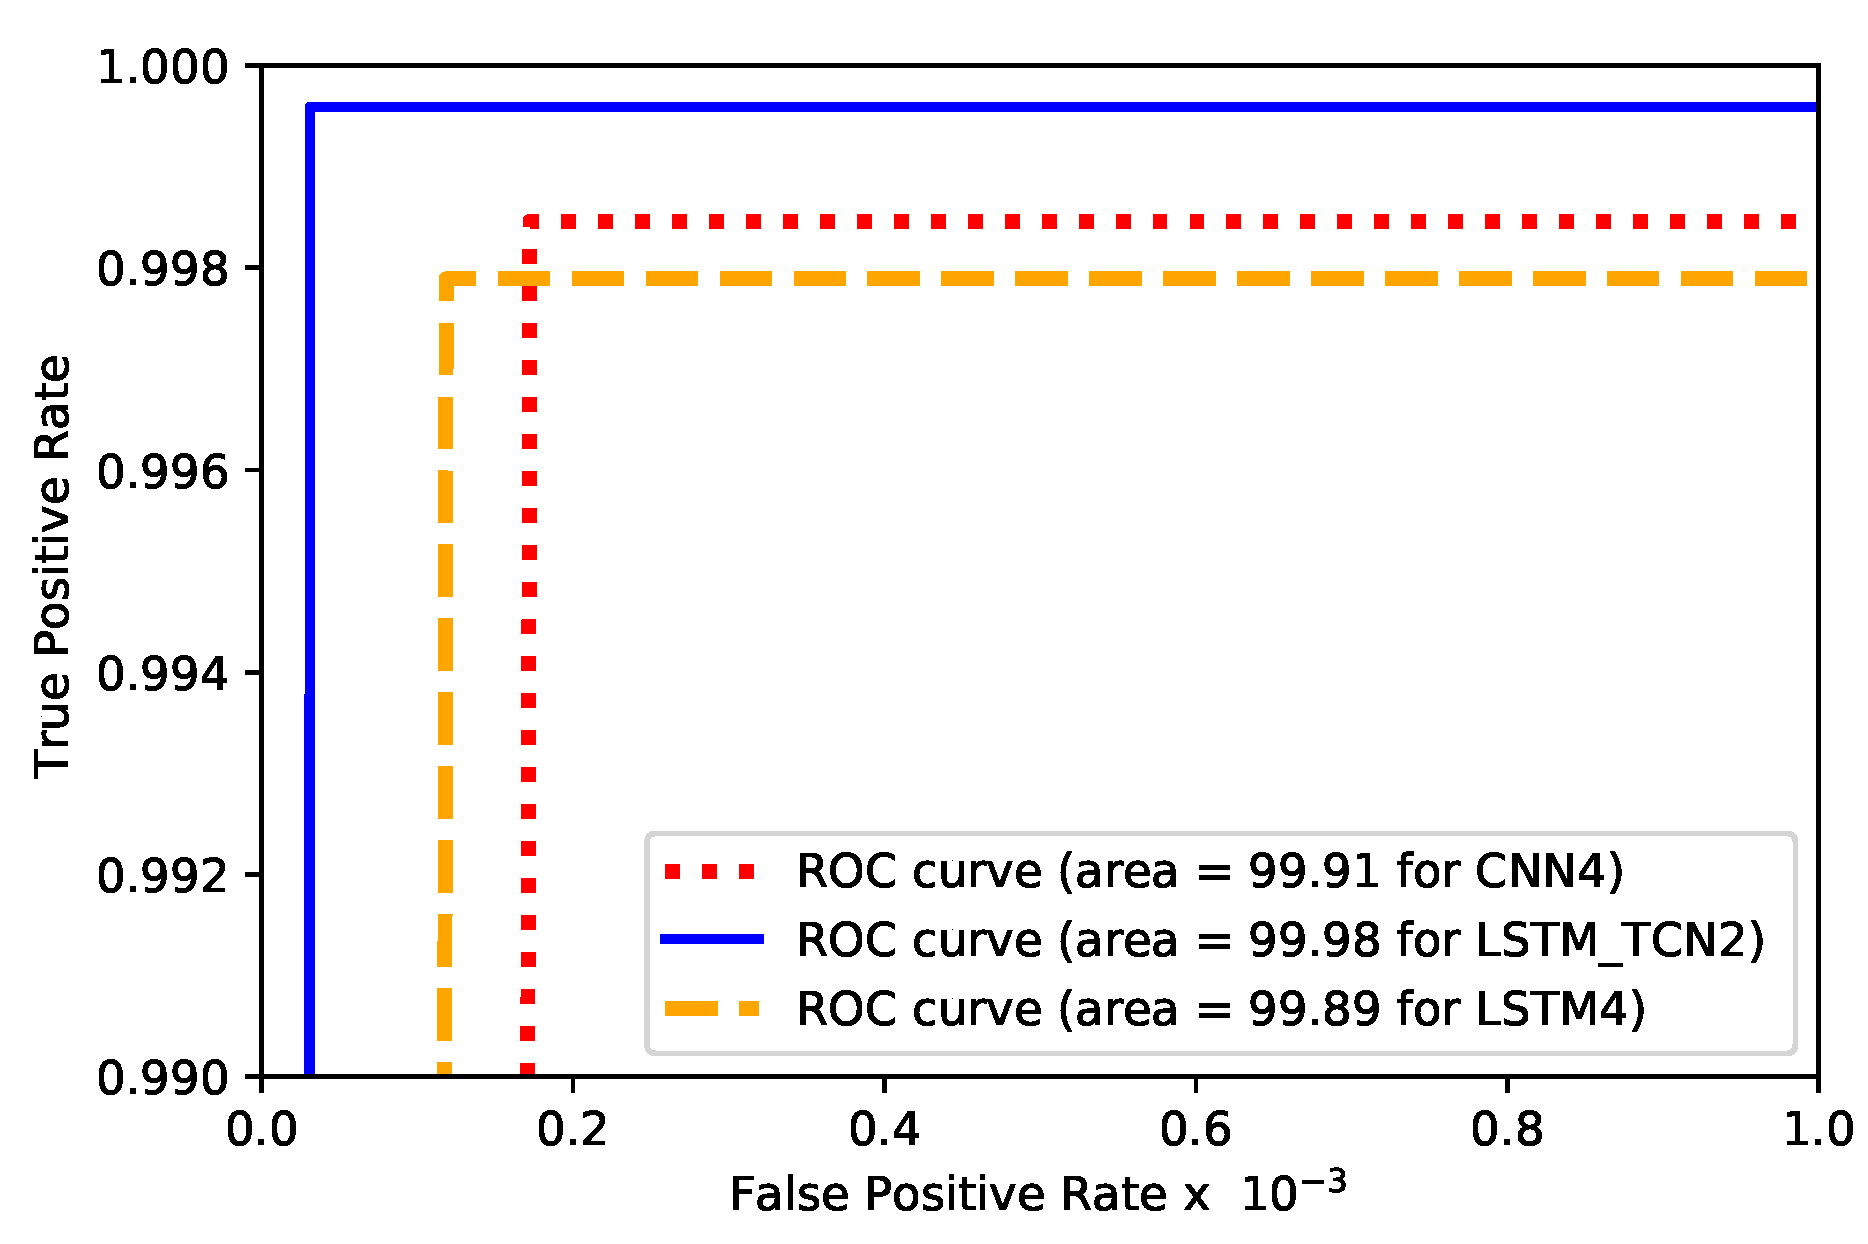
5.2. Evaluation Metrics

The Proposed Approach LSTM-TCN, is trained using the Keras package [42] with Tensorflow as the backend [43] using two filters each with 5 × 1 and 3 × 1 kernel sizes, causal padding, and a RELU activation function followed by a multi-label classification layer. Furthermore, with an epoch of 100, validation occurs every 100 steps. A batch size of 100 has been set. The loss function for prediction is the custom cross-entropy, and the Adam optimizer is used to fit the data, with an initial learning rate of 0.001 and patience of 5. The proposed scheme is compared with the state-of-the-art models, including the CNN [20] and LSTM architectures. In our simulation, the Precision, Recall of the predicted labels, and F1-score are employed as performance metrics. The precision and recall are described as follows:
Precision = True Positive ( TP ) True Positive ( TP ) + False Positive ( FP ) ,
Recall = True Positive ( TP ) True Positive ( TP ) + False Negative ( FN ) ,
where, in this paper TP, FP, and FN are defined as the probability that the detector classifies a location with compromised meters as compromised, a location with uncompromised meters as compromised, and a location with uncompromised meters as uncompromised [20], respectively:
F 1 - score = 2 × Precision × Recall Precision + Recall .
The F1-score is defined as the geometric mean of precision and recall, and it is used to compare suggested models more effectively. The Locational/Row accuracy (RACC) is another key evaluation criterion for detecting compromised meters’ locations. The RACC is defined as the probability that the classifier can classify all the locations of true meters’ measurements as uncompromised, and falsified meters’ measurements as compromised.
First, the proposed approach is assessed when the injection data’s L 2 -norm is 2 and the standard deviation of the measurement noise is 0.2. The number of hidden layers ranges between 2 and 6, and the number of units is determined by the greatest F1-score. To ensure a fair comparison, the same datasets are used for both training and testing.

5.2.1. IEEE 14-Bus System

Table 2 compares the four metrics in the IEEE 14-bus system between the proposed architecture, the CNN [20], and LSTM with varying numbers of hidden layers. Overall, our proposed architecture outperforms the benchmark algorithms in F1-score and RACC, proving its locational detection efficiency in detecting the location of compromised meters. The CNN and LSTM approaches provide row accuracies of 97% and 97.72% at layer 6 and 94.24% and 97.72% at layer 2, respectively, but our proposed scheme reaches 98.9% utilizing only two FCN layers. Table 2 indicates that as the number of hidden layers grows from 2 to 6, the metrics improve. In addition, as the number of hidden layers of the LSTM-TCN increases from 2 to 6, the metrics increase and remain nearly constant. Overall, the proposed architecture is carefully tuned and achieves a high F1-score and row accuracy. As the number of hidden layers increases, the computational complexity also increases. We designed our architecture with two FCN hidden layers and one LSTM layer to achieve a reasonable balance of computational complexity and locational detection accuracy. We would like to emphasize that the proposed LSTM-TCN structure has high detection accuracy due to the fact that our proposed structure uses the LSTM and TCN blocks in parallel to receive measurements as a multivariate time series; then, the blocks augment and force each other to capture FDIA-caused inconsistencies and co-occurrence dependent on nearby meters’ measurements, which, when combined, yields an overall better performance. As shown in Table 3, the proposed architecture outperforms the CNN and LSTM models in detecting the locations of compromised meters. In the following scenarios, we demonstrate the locational detection accuracy for eight attack cases using the IEEE 118-bus test system:
  • The first measurement is compromised and the third is not;
  • The third measurement is compromised and the first is not;
  • Both the first and third measurements are compromised;
  • Neither the first nor third measurements are compromised;
  • The first measurement is compromised and the fifteenth is not;
  • The fifteenth measurement is compromised and the first is not;
  • Both the first and fifteenth measurements are compromised;
  • Neither the first nor the fifteenth measurements are compromised.
We observe that the co-occurrence of FDIA on the first and third measurements is larger than the one on the first and fifteenth measurements, and the RACC accuracy is likewise greater than the one on the first and fifteenth. measurements. This is because the first and third measurements are substantially linked as a result of their direct connection, and thus the measurements are highly coupled. As the system grows larger under a low L 2 -norm of FDIA, the CNN and LSTM are no longer able to identify the co-occurrence dependency of nearby measurements. Meanwhile, the suggested MMLD can locate compromised measurements in huge systems under modest attack conditions.

5.2.2. IEEE 118-Bus System

Table 4 shows the performance evaluation in the IEEE 118-bus power system. This comparison shows that precision and recall are around 100%, and the RACCs (means detecting compromised meters’ locations) of the CNN and LSTM are always around 93% and 94%, respectively. LSTM suffers from the degradation problem. As the number of hidden layers increases from layer 3 to layer 6, RACC decreases. Meanwhile, our proposed architecture’s RACC reaches 98.9%. This demonstrates that the LSTM-TCN detector can detect the presence of an FDIA as well as its location when the bus system is large. In conclusion, the proposed MMLD is scalable as the size of the system grows.
The outputs of the LSTM-TCN’s y ^ n t are continuous within [0, 1], as stated in Section 3.2, and they are quantified to zero or one by a distinction threshold. The threshold value, in general, dictates the tradeoff between the True Positive Rate (TPR) and the False Positive Rate (FPR). A lower threshold, in particular, leads to a higher TPR and a lower FPR. The area under the ROC/AUC is commonly used as a performance indicator of the discriminatory capability to depict relative trade-offs between TPR and FPR [44]. This tradeoff is examined by plotting FPR versus TPR as the threshold varies from 0 to 1, as shown in Figure 4. As shown, we can observe that the suggested mechanism with only two FCN layers has a higher true positive rate together with a lower false-positive rate than the CNN and LSTM, both of which have four FCN layers. In addition, it has an AUC close to 1, indicating that it has a superior discriminatory ability.
In the proposed mechanism, the True Positive Rate rises to 0.999 extremely quickly as the False Positive Rate rises from 0 to 0.00005. Thus, the True Positive Rate against the False Positive Rate is only depicted from 0 to 0.001.

5.2.3. Robustness

As shown in Figure 5, the LSTM-TCN has the highest F1-Score and row accuracy when compared to the benchmarks of the CNN and LSTM. The F1-Score of the schemes grows as the L 2 -norm of the attack injection increases, as seen in Figure 5a. This is because as the attack becomes more intense, the patterns of normal and infected data become more recognized. Similarly, as seen in Figure 5b, the proposed mechanism outperforms the benchmark scheme in row accuracy. In the proposed mechanism, with only two layers of the FCN, reach a RACC of 96.15% and 99.89%, while the CNN and LSTM with four layers each achieve 92.03% and 98.8% and 94.69% and 99.53% at variant 1 and variant 5 of the L 2 -norm, respectively. Overall, when the L 2 -norm of the injection data varies from 1 to 5, the proposed detection approach can always obtain an F1-Score near 100. The MMLD approach is sensitive to slight and high L 2 -norms of injected data, as it achieves high presence location accuracy at low values of the L 2 -norm.

5.2.4. Scalability

The scalability of the proposed architecture is investigated in the IEEE 118-bus system to test its scalability in large systems. As depicted in Figure 6, the detection accuracy attained by benchmark models and LSTM-TCN is evaluated. As shown, the proposed detection scheme is more sensitive to lower values of the L 2 -norm of the injected attack than the CNN and LSTM. At variant 1 and variant 5 of the L 2 -norm, the LSTM-TCN reaches 93.69% and 98.95%, while the CNN and LSTM achieve only 79.17% and 77.75% and 96.57% and 96.07%, respectively. Overall, the proposed detection scheme can always achieve very high locational detection accuracy when the L 2 -norm of the FDIA varies from 1 to 5. This means that the suggested LSTM-TCN mechanism’s detection accuracy is unaffected by the size of the attack. As the F1-score for the benchmark models, and the proposed model is almost around 100%. The F1-score (presence accuracy) versus the L 2 -norm of the injection data in IEEE 118-bus system is not plotted. All these models can efficiently detect the presence of the FDIA.

5.2.5. Model Complexity

When the number of trainable parameters grows, so does the number of calculations, implying a rise in inference resource requirements, both in terms of RAM and processing power. Overfitting and other optimization issues arise as a result of this. Reducing the number of trainable parameters has various advantages. The first is that the gradient is a smaller object, which can make training goes faster. The second advantage is that overfitting is less likely, lowering the need for a dropout layer. A small number of the trainable parameter is helpful in lowering the model’s complexity and can lead to speedier implementations.
From Table 2 at layer 3, we observe that CNN and LSTM models need total parameters of 243,987 and 377,491 for achieving RACCs of 95.49% and 97.71%, respectively. Meanwhile, the proposed technique needs 195,475 parameters to reach a detection accuracy of 98.99%. In addition, for the 118-bus system, as depicted in Table 4, the CNN and LSTM models need total parameters of 4,347,188 and 4,478,644 for achieving RACCs of 89.58% and 94.74%, respectively. Meanwhile, the proposed technique needs 442932 parameters to reach a detection accuracy of 98.39%. In conclusion, the LSTM-TCN outperforms the CNN and LSTM in terms of locational detection accuracy while requiring fewer trainable parameters. Overall, the LSTM-TCN has lower complexity than the CNN and LSTM models.
Training loss is generally lower than the validation loss because the validation dataset is used to validate the model with data that the model has never seen. For this reason, the validation loss generally is higher compared with the training loss. Figure 7 shows that LSTM-TCN has a training and validation loss that almost stabilized at 0.002724 and 0.002897, while the CNN and LSTM have losses of 0.013281 and 0.011759 and 0.004960 and 0.006681, respectively. For LSTM-TCN, due to splitting training and validation datasets with the same distribution, using early stopping and dropout mechanism during training, the training and validation losses are nearly the same, which means the proposed model is a good fit for data. A small difference between the losses values might mean a good fit. As a result, it can be concluded that the proposed mechanism has the lowest losses and hence is a good fit for FDIA detection.

6. Conclusions

Many application domains, including smart grids, rely heavily on time series data. Time series analysis and the use of state-of-the-art anomaly detection algorithms in such data are particularly popular in practice and research due to the temporal features involved. In this work, a multivariate-based multi-label locational detection (MMLD) mechanism is proposed to detect the presence and identify the locations of compromised meters in a smart grid. The MMLD architecture concatenates Long Short-Term Memory (LSTM) with a Temporal Convolutional Neural Network (TCN). The mechanism is universal in the sense that it is built without relying on any statistical assumptions of the attack model. Furthermore, the robustness, scalability, and practicability of the proposed model have been investigated by intensive simulations in IEEE 14- and 118-bus systems. In particular, it has been demonstrated that MMLD can identify the presence as well as the locations of FDIAs for the entire bus system under different attack situations. In addition, it has been shown that the locational detection accuracy may be increased even further through formulating the problem as a multivariate and multi-label classification problem, and hence, the MMLD outperforms the-state-of the-art benchmark techniques.

Author Contributions

Conceptualization, H.I.H., A.S.T.E., M.M.F. and H.A.T.; Methodology, H.I.H., A.S.T.E., M.M.T., M.M.F. and H.A.T.; Software, H.I.H., A.S.T.E., M.M.T., M.M.F. and H.A.T.; Supervision, A.S.T.E., M.M.T., M.M.F. and H.A.T.; Writing original draft, H.I.H., A.S.T.E., M.M.T., M.M.F. and H.A.T. All authors have read and agreed to the published version of the manuscript.

Funding

This research received no external funding.

Institutional Review Board Statement

Not applicable.

Informed Consent Statement

Not applicable.

Data Availability Statement

“Datasets of the IEEE 14-bus system” at https://github.com/wsyCUHK/WSYCUHK_FDIA/tree/master/Data. “Datasets of the IEEE 118-bus system” at https://drive.google.com/drive/folders/17Y_greDnRVUfbYQ1jz6EEAYZwKzaxwnE.

Conflicts of Interest

The authors declare no conflict of interest.

References

  1. Fadlullah, Z.M.; Fouda, M.M.; Kato, N.; Takeuchi, A.; Iwasaki, N.; Nozaki, Y. Toward intelligent machine-to-machine communications in smart grid. IEEE Commun. Mag. 2011, 49, 60–65. [Google Scholar] [CrossRef]
  2. Fouda, M.M.; Fadlullah, Z.M.; Kato, N.; Lu, R.; Shen, X.S. A Lightweight Message Authentication Scheme for Smart Grid Communications. IEEE Trans. Smart Grid 2011, 2, 675–685. [Google Scholar] [CrossRef] [Green Version]
  3. Fadlullah, Z.M.; Fouda, M.M.; Kato, N.; Shen, X.; Nozaki, Y. An early warning system against malicious activities for smart grid communications. IEEE Netw. 2011, 25, 50–55. [Google Scholar] [CrossRef] [Green Version]
  4. Fouda, M.M.; Fadlullah, Z.M.; Kato, N. Assessing attack threat against ZigBee-based home area network for Smart Grid communications. In Proceedings of the 2010 International Conference on Computer Engineering & Systems, Cairo, Egypt, 30 November–2 December 2010; pp. 245–250. [Google Scholar] [CrossRef]
  5. Fouda, M.M.; Fadlullah, Z.M.; Kato, N.; Lu, R.; Shen, X. Towards a light-weight message authentication mechanism tailored for Smart Grid communications. In Proceedings of the 2011 IEEE Conference on Computer Communications Workshops (INFOCOM WKSHPS), Shanghai, China, 10–15 April 2011; pp. 1018–1023. [Google Scholar] [CrossRef]
  6. Liang, G.; Zhao, J.; Luo, F.; Weller, S.R.; Dong, Z.Y. A Review of False Data Injection Attacks Against Modern Power Systems. IEEE Trans. Smart Grid 2017, 8, 1630–1638. [Google Scholar] [CrossRef]
  7. Faheem, M.; Shah, S.; Butt, R.; Raza, B.; Anwar, M.; Ashraf, M.; Ngadi, M.; Gungor, V. Smart grid communication and information technologies in the perspective of Industry 4.0: Opportunities and challenges. Comput. Sci. Rev. 2018, 30, 1–30. [Google Scholar] [CrossRef]
  8. Wang, W.; Lu, Z. Cyber security in the Smart Grid: Survey and challenges. Comput. Netw. 2013, 57, 1344–1371. [Google Scholar] [CrossRef]
  9. Yan, Y.; Qian, Y.; Sharif, H.; Tipper, D. A Survey on Cyber Security for Smart Grid Communications. IEEE Commun. Surv. Tutor. 2012, 14, 998–1010. [Google Scholar] [CrossRef] [Green Version]
  10. Huang, Y.; Tang, J.; Cheng, Y.; Li, H.; Campbell, K.A.; Han, Z. Real-Time Detection of False Data Injection in Smart Grid Networks: An Adaptive CUSUM Method and Analysis. IEEE Syst. J. 2016, 10, 532–543. [Google Scholar] [CrossRef] [Green Version]
  11. Liu, Y.; Ning, P.; Reiter, M.K. False Data Injection Attacks against State Estimation in Electric Power Grids. In Proceedings of the 16th ACM Conference on Computer and Communications Security, CCS ’09, Chicago, IL USA, 9–13 November 2009; pp. 21–32. [Google Scholar] [CrossRef]
  12. Ibrahem, M.I.; Nabil, M.; Fouda, M.M.; Mahmoud, M.M.E.A.; Alasmary, W.; Alsolami, F. Efficient Privacy-Preserving Electricity Theft Detection with Dynamic Billing and Load Monitoring for AMI Networks. IEEE Internet Things J. 2021, 8, 1243–1258. [Google Scholar] [CrossRef]
  13. Badr, M.M.; Ibrahem, M.I.; Mahmoud, M.; Fouda, M.M.; Alsolami, F.; Alasmary, W. Detection of False-Reading Attacks in Smart Grid Net-Metering System. IEEE Internet Things J. 2022, 9, 1386–1401. [Google Scholar] [CrossRef]
  14. Kurt, M.N.; Yılmaz, Y.; Wang, X. Distributed Quickest Detection of Cyber-Attacks in Smart Grid. IEEE Trans. Inf. Forensics Secur. 2018, 13, 2015–2030. [Google Scholar] [CrossRef]
  15. Liu, Y.; Ning, P.; Reiter, M.K. False Data Injection Attacks against State Estimation in Electric Power Grids. ACM Trans. Inf. Syst. Secur. 2011, 14, 1–33. [Google Scholar] [CrossRef]
  16. Hao, J.; Piechocki, R.J.; Kaleshi, D.; Chin, W.H.; Fan, Z. Sparse Malicious False Data Injection Attacks and Defense Mechanisms in Smart Grids. IEEE Trans. Ind. Inform. 2015, 11, 1198–1209. [Google Scholar] [CrossRef] [Green Version]
  17. Deng, R.; Xiao, G.; Lu, R.; Liang, H.; Vasilakos, A.V. False Data Injection on State Estimation in Power Systems—Attacks, Impacts, and Defense: A Survey. IEEE Trans. Ind. Inform. 2017, 13, 411–423. [Google Scholar] [CrossRef]
  18. Bi, S.; Zhang, Y.J. Using Covert Topological Information for Defense Against Malicious Attacks on DC State Estimation. IEEE J. Sel. Areas Commun. 2014, 32, 1471–1485. [Google Scholar] [CrossRef] [Green Version]
  19. Musleh, A.S.; Chen, G.; Dong, Z.Y. A Survey on the Detection Algorithms for False Data Injection Attacks in Smart Grids. IEEE Trans. Smart Grid 2020, 11, 2218–2234. [Google Scholar] [CrossRef]
  20. Wang, S.; Bi, S.; Zhang, Y.J.A. Locational Detection of the False Data Injection Attack in a Smart Grid: A Multilabel Classification Approach. IEEE Internet Things J. 2020, 7, 8218–8227. [Google Scholar] [CrossRef]
  21. Mukherjee, D.; Chakraborty, S.; Ghosh, S. Deep learning-based multilabel classification for locational detection of false data injection attack in smart grids. Electr. Eng. 2022, 104, 259–282. [Google Scholar] [CrossRef]
  22. Ozay, M.; Esnaola, I.; Yarman Vural, F.T.; Kulkarni, S.R.; Poor, H.V. Machine Learning Methods for Attack Detection in the Smart Grid. IEEE Trans. Neural Netw. Learn. Syst. 2016, 27, 1773–1786. [Google Scholar] [CrossRef] [Green Version]
  23. Kurt, M.N.; Ogundijo, O.; Li, C.; Wang, X. Online Cyber-Attack Detection in Smart Grid: A Reinforcement Learning Approach. IEEE Trans. Smart Grid 2019, 10, 5174–5185. [Google Scholar] [CrossRef] [Green Version]
  24. Hu, J.; Shen, L.; Sun, G. Squeeze-and-Excitation Networks. In Proceedings of the 2018 IEEE/CVF Conference on Computer Vision and Pattern Recognition, Salt Lake City, UT, USA, 18–23 June 2018; pp. 7132–7141. [Google Scholar] [CrossRef] [Green Version]
  25. Malhotra, P.; Ramakrishnan, A.; Anand, G.; Vig, L.; Agarwal, P.; Shroff, G. LSTM-based Encoder-Decoder for Multi-sensor Anomaly Detection. arXiv 2016, arXiv:1607.00148. [Google Scholar]
  26. Zhou, S.; Shen, W.; Zeng, D.; Fang, M.; Wei, Y.; Zhang, Z. Spatial–temporal convolutional neural networks for anomaly detection and localization in crowded scenes. Signal Process. Image Commun. 2016, 47, 358–368. [Google Scholar] [CrossRef]
  27. Su, Y.; Zhao, Y.; Niu, C.; Liu, R.; Sun, W.; Pei, D. Robust Anomaly Detection for Multivariate Time Series through Stochastic Recurrent Neural Network. In Proceedings of the 25th ACM SIGKDD International Conference on Knowledge Discovery & Data Mining, KDD ’19, Anchorage, AK, USA, 4–8 August 2019; pp. 2828–2837. [Google Scholar] [CrossRef]
  28. Chen, Z.; Chen, D.; Zhang, X.; Yuan, Z.; Cheng, X. Learning Graph Structures With Transformer for Multivariate Time-Series Anomaly Detection in IoT. IEEE Internet Things J. 2022, 9, 9179–9189. [Google Scholar] [CrossRef]
  29. Zhao, H.; Wang, Y.; Duan, J.; Huang, C.; Cao, D.; Tong, Y.; Xu, B.; Bai, J.; Tong, J.; Zhang, Q. Multivariate Time-Series Anomaly Detection via Graph Attention Network. In Proceedings of the 2020 IEEE International Conference on Data Mining (ICDM), Sorrento, Italy, 17–20 November 2020; pp. 841–850. [Google Scholar] [CrossRef]
  30. He, Y.; Zhao, J. Temporal Convolutional Networks for Anomaly Detection in Time Series. J. Phys. Conf. Ser. 2019, 1213, 042050. [Google Scholar] [CrossRef] [Green Version]
  31. Karim, F.; Majumdar, S.; Darabi, H. Insights Into LSTM Fully Convolutional Networks for Time Series Classification. IEEE Access 2019, 7, 67718–67725. [Google Scholar] [CrossRef]
  32. Zhao, F.; Huang, Y.; Wang, L.; Tan, T. Deep semantic ranking based hashing for multi-label image retrieval. In Proceedings of the IEEE Conference on Computer Vision and Pattern Recognition, Boston, MA, USA, 7–12 June 2015; pp. 1556–1564. [Google Scholar] [CrossRef]
  33. Sainath, T.N.; Vinyals, O.; Senior, A.; Sak, H. Convolutional, Long Short-Term Memory, fully connected Deep Neural Networks. In Proceedings of the 2015 IEEE International Conference on Acoustics, Speech and Signal Processing (ICASSP), South Brisbane, Australia, 19–24 April 2015; pp. 4580–4584. [Google Scholar] [CrossRef]
  34. Anwar, A.; Mahmood, A.N.; Tari, Z. Identification of vulnerable node clusters against false data injection attack in an AMI based Smart Grid. Inf. Syst. 2015, 53, 201–212. [Google Scholar] [CrossRef]
  35. Esmalifalak, M.; Liu, L.; Nguyen, N.; Zheng, R.; Han, Z. Detecting Stealthy False Data Injection Using Machine Learning in Smart Grid. IEEE Syst. J. 2017, 11, 1644–1652. [Google Scholar] [CrossRef]
  36. Wang, Z.; Yan, W.; Oates, T. Time series classification from scratch with deep neural networks: A strong baseline. In Proceedings of the 2017 International Joint Conference on Neural Networks (IJCNN), Anchorage, AK, USA, 14–19 May 2017; pp. 1578–1585. [Google Scholar] [CrossRef] [Green Version]
  37. Lin, M.; Chen, Q.; Yan, S. Network In Network. arXiv 2013, arXiv:1312.4400. [Google Scholar]
  38. Hochreiter, S.; Schmidhuber, J. Long Short-Term Memory. Neural Comput. 1997, 9, 1735–1780. [Google Scholar] [CrossRef]
  39. Zimmerman, R.D.; Murillo-Sanchez, C.E.; Gan, D. Matpower. PSERC. 1997. Available online: http://www.pserc.cornell.edu/matpower (accessed on 11 March 2020).
  40. Moslemi, R.; Mesbahi, A.; Velni, J.M. A fast, decentralized covariance selection-based approach to detect cyber attacks in smart grids. IEEE Trans. Smart Grid 2017, 9, 4930–4941. [Google Scholar] [CrossRef]
  41. Sedghi, H.; Jonckheere, E. Statistical structure learning to ensure data integrity in smart grid. IEEE Trans. Smart Grid 2015, 6, 1924–1933. [Google Scholar] [CrossRef]
  42. Chollet, F. Keras: The Python Deep Learning Library. Astrophysics Source Code Library. 2018; Record ascl:1806.022. Available online: https://github.com/fchollet/keras (accessed on 14 December 2021).
  43. Abadi, M.; Agarwal, A.; Barham, P.; Brevdo, E.; Chen, Z.; Citro, C.; Corrado, G.S.; Davis, A.; Dean, J.; Devin, M.; et al. TensorFlow: Large-Scale Machine Learning on Heterogeneous Distributed Systems. arXiv 2016, arXiv:1603.04467. [Google Scholar]
  44. Fawcett, T. An introduction to ROC analysis. Pattern Recognit. Lett. 2006, 27, 861–874. [Google Scholar] [CrossRef]
Figure 1. FDIA’s proposed location-based detection scheme.
Energies 15 05312 g001
Figure 2. The architecture of LSTM-TCN. 1: compromised meter; 0: uncompromised meter.
Energies 15 05312 g002
Figure 3. Unbalanced labels for normal and falsified meters under L 2 -norm of 1.
Energies 15 05312 g003
Figure 4. ROC curves for the proposed mechanism, CNN, and LSTM in IEEE 118-bus system under L 2 -norm = 2.
Energies 15 05312 g004
Figure 5. F1-score and RACC comparison in the IEEE 14-bus system: (a) F1-score comparison versus the L 2 -norm of the injection attack; (b) RACC comparison versus L 2 -norm of the injection attack.
Energies 15 05312 g005
Figure 6. Presence detection accuracy versus L 2 -norm of the injection data in IEEE 118-bus system.
Energies 15 05312 g006
Figure 7. Learning curves in the IEEE 14-bus system under L 2 -norm = 2.
Energies 15 05312 g007
Table 1. Multivariate-based multi-label locational detection (MMLD) network for the IEEE 14-bus power system.
StageLayer (Type)KernalOutput ShapeNo. of Parameters
0input_1 19 × 1 0
1permute 1 × 19 0
2Conv1D 5 × 1 1 × 128 12,288
3batch_normalization 1 × 128 512
4RELU 1 × 128 0
5Conv1D 3 × 1 1 × 256 98,560
6batch_normalization 1 × 256 1024
7RELU 1 × 256 0
8global_average_pooling1d 256 × 1 0
9LSTM 128 × 1 98,432
10dropout 128 × 1 75,776
11concatenate 384 × 1 0
12dense 19 × 1 7315
Total no. of parameters: 195,475
No. of trainable parameters: 194,707
No. of non-trainable parameters: 768
Table 2. Performance evaluation of the IEEE 14-bus power system under L 2 -norm = 2.
ModelLayersPrecision %Recall %F1-Score %RACC %Number of Parameters
CNN2 97.52 98.78 98.09 94.24 109 , 587
3 99.47 99.66 99.57 95.49 243 , 987
4 99.51 99.75 99.63 96.42 293 , 267
5 99.65 99.78 99.71 97.45 3 , 425 , 471
6 99.67 99.69 99.68 97.02 372 , 371
LSTM2 99.63 99.83 99.73 97.72 245 , 395
3 99.63 99.82 99.72 97.71 377 , 491
4 99.61 99.81 99.71 97.63 509 , 587
5 99.63 99.82 99.73 97.87 641 , 683
6 99.58 99.84 99.71 97.78 773 , 779
LSTM-TCN2 99.81 99.89 99.85 98.65 93 , 459
3 99.82 99.91 99.87 98.9 195 , 475
4 99.83 99.91 99.87 98.88 291 , 987
5 99.85 99.91 99.88 98.99 341 , 779
6 99.83 99.92 99.87 98.93 391 , 571
Table 3. Location-based Results on the first, third, and fifteenth measurements under L 2 -norm = 1.
Compromised LocationCNNLSTMLSTM-TCN
1st80.4482.0093.78
3rd80.7780.5094.57
1st & 3rd45.4571.2195.45
Neither81.3581.1494.51
1st76.1881.1293.93
15th80.4479.7594.46
1st & 15th74.6577.4694.37
Neither81.4181.2894.53
Table 4. Performance evaluation of the IEEE 118-bus power system under L 2 -norm = 2.
ModelLayersPrecision %Recall %F1-Score %RACC %Number of Parameters
CNN2 98.37 99.18 99.62 87.38 4 , 248 , 244
3 98.64 99.55 99.1 89.58 4 , 347 , 188
4 99.36 99.66 99.51 93.29 4394 , 420
5 98.96 99.56 99.26 93.33 4 , 396 , 980
6 99.24 99.45 99.38 92.38 4 , 397 , 492
LSTM2 99.94 99.97 99.95 94.7 4 , 346 , 548
3 99.95 99.97 99.96 94.74 4 , 478 , 644
4 99.94 99.96 99.95 93.99 4 , 610 , 740
5 99.92 99.93 99.93 91.87 4 , 742 , 836
6 99.91 99.92 99.91 90.89 4 , 874 , 932
LSTM-TCN2 99.98 99.98 99.98 98.39 320 , 308
3 99.98 99.99 99.99 98.39 442 , 932
4 99.99 99.99 99.99 98.95 518 , 836
5 99.98 99.99 99.99 98.68 568 , 628
6 99.98 99.99 99.98 98.08 618 , 420
Publisher’s Note: MDPI stays neutral with regard to jurisdictional claims in published maps and institutional affiliations.

