Article

Sizing Assessment of Islanded Microgrids Considering Total Investment Cost and Tax Benefits in Colombia

by
Wilmer Ropero-Castaño
1,
Nicolás Muñoz-Galeano
1,
Eduardo F. Caicedo-Bravo
2,
Pablo Maya-Duque
3 and
Jesús M. López-Lezama
1,*
1
Research Group on Efficient Energy Management (GIMEL), Departamento de Ingeniería Eléctrica, Universidad de Antioquia (UdeA), Calle 70 No. 52-21, Medellin 050010, Colombia
2
Grupo de Investigación en Percepción y Sistemas Inteligentes (PSI), Escuela de Ingeniería Eléctrica y Electrónica, Universidad del Valle (Univalle), Calle 13 No 100-00, Cali 760001, Colombia
3
Grupo de Investigación ALIADO, Departamento de Ingeniería Industrial, Universidad de Antioquia (UdeA), Calle 70 No. 52-21, Medellin 050010, Colombia
*
Author to whom correspondence should be addressed.
Energies 2022, 15(14), 5161; https://doi.org/10.3390/en15145161
Submission received: 13 June 2022 / Revised: 8 July 2022 / Accepted: 12 July 2022 / Published: 16 July 2022

Abstract

:
This paper deals with the optimal sizing of islanded microgrids (MGs), which use diesel generators to supply energy in off-grid areas. The MG under study integrates photovoltaic (PV) and diesel generation, a battery energy storage System (BESS), and an inverter for the connection between AC and DC voltage buses. Levelised cost of energy (LCOE) and annual system cost (ASC) are considered economic indicators, while the loss of power supply probability (LPSP) is used as a reliability indicator. Fiscal incentives such as the tax benefits and accelerated depreciation applied in Colombia are considered for the optimally sizing of each MG element. Solar measurements were taken at a weather station located in the main campus of Universidad de Antioquia in Medellin, Colombia at a latitude of 6.10 and longitude of −75.38. The objective function is the minimization of the total energy delivered from the power sources that successfully meets the load. The model was implemented in Python programming language considering several scenarios. Two cases were evaluated: the first one considered PV panels, a BESS and a diesel generator, while the second one only considered PV panels and a BESS. The option that does not include the diesel generator turned out to be the most expensive, since additional PV and BESS resources are required to meet the load profile. Furthermore, it was found that the LCOE was lower when tax benefits were taken into account.

1. Introduction

A microgrid (MG) can be defined as a group of distributed generators (DGs), storage devices and loads, which are connected to a main grid through a controllable switchgear, providing reliable and safe electrical power to a local community [1]. MGs allow for the massive incorporation of renewable DGs, representing a new and powerful alternative to meet the needs of a growing energy demand. In general terms, they have a positive impact on the integration of renewable energy sources and can be used to improve the overall performance of electricity grids. Nonetheless, there are several challenges associated with the incorporation of MGs in modern electrical systems. These include reliability issues [2], protection coordination [3,4] and optimal sizing [5,6]. This paper deals with the last issue, providing a sizing assessment of islanded MGs that considers investment costs and tax benefits.
Islanded MGs are one of the most promissory proposals for supplying electricity in off-grid areas when the cost of energy production is high or when power-supply problems occur [7]. Usually, off-grid areas use diesel generators for electricity supply; however, the use of diesel generators has negative environmental impacts, while their supply and maintenance are costly [8]. To overcome the dependence on this technology, hybrid systems that involve distributed energy resources (DERs) such as battery energy storage systems (BESS) and photovoltaic (PV) and wind generators have become a convenient option. Nonetheless, DERs working alone can not continuously supply power to the loads; in consequence, diesel generators and BESS must meet the load demands when DERs present intermittence.
Several researchers have reported the use of hybrid systems in islanded MGs. In [5,6,9], the authors propose configurations of PV generators, wind turbines, fuel cells and backup battery systems. In [10,11,12,13,14,15], only a wind turbine and a battery-backed PV generator were considered, while in [16,17,18,19,20,21,22,23,24,25,26] a diesel generator was added as backup. Other generation sources, such as biomass, thermal systems, flywheel and the utility grid, are considered in [27,28,29,30,31,32]. However, the optimal sizing of generators in islanded MGs is still being researched.
MGs planning must guarantee the reliability of the system at a minimum cost, satisfying the needs of users. MGs planning is usually divided into sizing and operation. This is because of the multi-level nature of the problem. Additionally, optimization problems regarding MG planning are often non-convex and NP-hard [25]. Single- and multi-objective optimization methodologies have been proposed in the technical literature for successful MG planning.
Researchers have used different optimization techniques to size MGs. These techniques can be classified into exact and approximate methods. For example, in [24], an iterative method and dynamic programming (DP) approach are used to size BEES, considering the energy management system of an MG. In [26], the authors propose an optimal scheduling approach for a hybrid MG using dynamic programming, which considers BESS, conventional generation (e.g., diesel generator), and PV solar generators. The main objective is to ensure the maximum utilization of the renewable energy resources and minimum operational cost of the conventional resources. In [29], a methodology based on PV power forecasting and the evolution of load curve is proposed for the optimization of an isolated MG. The proposed method aims to determine the size of PV panels and batteries at minimal cost, maintaining the system’s reliability. In [16], the authors present a multi-objective optimization method to jointly optimize the planning and operation of a grid-tied MG with various DG sources, such as wind turbine and PV arrays with the assistance of demand-side management. To solve the multi-objective optimization problem, a fuzzy method is adopted to convert the original problem into a single objective optimization problem and a mixed-integer linear programming algorithm is then used to solve this. In [33], the authors propose a mixed-integer linear programming (MILP) problem that allows for the optimal DER size in a DC MG to be determined. In [28], an MILP algorithm is used for the optimal sizing of a grid-connected MG, minimizing the total cost. In [30], dynamic programming and an MILP algorithm was implemented for sizing a small MG with storage. In [15,19,34], the authors use the HOMER tool, which is a widely used software for sizing MGs.
Several metaheuristic techniques were implemented for MG planning in recent years. In [9], a multi-objective particle swarm optimization (MOPSO) algorithm was carried out to minimize the loss of load expected (LOLE) and loss of energy expected (LOEE) costs of hybrid wind–solar-generating MG systems. In [6], a gray wolf optimization (GWO) algorithm was used for the optimal sizing of BESS to minimize the operation cost of MGs. In [10], an improved fruit fly optimization algorithm (IFOA) was used to size islanded MGs with real data collected from Dongao Island. In [11], an ant colony optimization (ACO) approach was employed to minimize the total capital cost and total maintenance cost in a hybrid PV–wind energy system. In [35], an artificial bee colony (ABC) algorithm was implemented to size a grid-connected MG with solar PV plants, wind turbines and energy storage systems. The goal is the maximization of energy-saving benefits for the community being served. In [12], a genetic algorithm (GA) is used for the multi-objective design of hybrid energy systems. The authors aim to minimize the life-cycle cost and greenhouse gas emissions, and dump energy in remote residential buildings. In [13], the authors tested four different algorithms, namely, ABC, PSO, GA and the gravitational search algorithm (GSA), to solve the optimal sizing of grid-connected MG components. In [14], a PSO algorithm is developed to determine the optimal configuration of an MG with minimal costs, satisfying the desired loss of power supply probability. In [18], the whale optimization algorithm (WOA), water cycle algorithm (WCA), moth–flame optimizer (MFO), and hybrid particle swarm-gravitational search algorithm (PSOGSA) were applied for the optimal sizing of PV/wind/diesel hybrid MG systems with BESS, while minimizing the cost of energy (COE) supplied by the system and increasing the reliability and efficiency of the system. In [20], the ABC optimization algorithm was used the for sizing and performance analysis of a standalone hybrid energy system. In [22], the authors compare the performance of PSO and invasive weed optimization (IWO) algorithms for the optimal sizing of hybrid microgrids based on PV, wind, diesel and BESS. In this case, the BESS is considered in summer and winter to determine daily storage. In [21], a GA approach minimizes the total annual cost of the number of solar panels and micro-turbines, battery capacity, and diesel generator size, with a constraint on renewable energy penetration. In [23], a double-layer optimization strategy is implemented to determine the optimal BESS size, considering the energy management system of an MG. The authors in [25] propose a bi-level optimization model to solve the problem of planning and operating MG projects, inspired by the system of systems (SoS) concept. In [27], an optimization technique based on a multi-objective genetic algorithm (MOGA), which uses a high temporal resolution, is implemented to size an MG. The proposed MOGA employs a techno-economic approach to determine the microgrid system design, optimized by considering multiple criteria, including size, cost, and availability. In [31], the optimal sizing of a standalone PV/wind/biomass hybrid energy system is carried out using GA and PSO optimization techniques.
In the technical literature, some researchers have also analyzed fiscal incentives for implementing MGs. In [36], the authors conducted a feasibility analysis of solar generation in local communities in Libya. The study was carried out using the Net Present Value (NPV) and payback time indicators to determine the impacts of feed-in tariff (FiT) rates, financial incentives, electricity tariff, and the inflation rate on the economic viability of the PV grid system. In [37], the authors provide a comprehensive evaluation of the technical and financial feasibility of a campus MG based on a techno-economic analysis. This analysis captures all the benefits of financial incentives for MG projects in California, U.S. The authors in [38] investigate the effect and cost-efficiency of different renewable energy incentives and the potential for hydrogen energy storage, as well as the perceived viability of an MG project, from the perspective of different stakeholders, i.e., government, energy hub operators and consumers, in Ontario province, Canada. The aforementioned research papers focuses on an analysis of the financial incentives that each government provides to projects that include renewable energy sources; however, the research does not provide a sizing methodology for the MG. Additionally, the analysis is always focused on each studied area and the tax benefits vary with respect to the respective country. The main contribution of this paper is to provide a methodology for the sizing assessment of islanded MGs that minimizes the total cost of supplying the load through a combination of several power sources. Furthermore, tax benefits are included to facilitate the task of decision-makers. Although tax incentives were specifically applied in Colombia, this methodology can be used in other markets adopting different tax benefit rules.
The Colombian government aims to promote the development and implementation of non-conventional energy sources (NCES), primarily those of a renewable nature. These energy sources are meant to be integrated into the electricity market, allowing for the reduction in greenhouse gas emissions and providing a more varied energy basket. Projects that implement NCES could save 50% of the total investment made from their annual income tax over a period no longer than 15 years. They also may apply an accelerated depreciation of up to 20%, an exclusion of value-added tax (VAT) goods and services, and an exemption from customs duties. The 50% income deduction tax and the accelerated depreciation were included in the methodology.
This paper is organized as follows: Section 2 presents the proposed methodology, which includes the mathematical representation of different elements of the MG. This section also describes the economic and reliability indicators implemented in the proposed methodology. Section 3 details the proposed optimization model. Section 4 corresponds to tests and results considering real data. Section 5 presents a discussion of the results of the paper. Finally, Section 6 presents the conclusions and future work.

2. Proposed Methodology

The configuration of the MG to be optimized is shown in Figure 1. This is composed of a DC bus and an AC bus connected through an inverter. The PV array, load controller and BESS are connected to the DC bus, while the load and the diesel generator are connected to the AC bus. The main goal of the energy sources is to supply power to the load.
The schematic diagram of the proposed methodology is illustrated in Figure 2.
The sizing assessment methodology starts by reading the meteorological information, load profile, reliability constraints and economic information of the system. Once the previous step is defined, the technical information for each of the technologies considered in the analysis is incorporated in the model; for this, information must be available from the data sheet of each component of the system. After the initial information is configured, the evaluation methodology runs an optimization model that simulates an economic dispatch for one year with the objective of minimizing the cost of successfully meeting the load. If the constraints are not satisfied and it is not possible to meet the expected demand with the current energy resources, the methodology returns to the previous step to modify the initial parameters of the system. When an optimal solution is reached, the economic calculations and reliability of the system are computed. Finally, it is up to the decision-maker to accept the solution that was achieved by the proposed methodology or to evaluate other alternatives.

2.1. PV Array Model

An hourly power model was adopted for the PV array ( E p v t ) , which is calculated using Equation (1). A more in-depth description of this model is presented in [39].
E p v t = N p v · P p v s t c · G ( β , α ) G s t c · T p v · f p v
where N p v is the number of P V modules, P p v s t c is the rated power of the solar panel in standard test condition, G ( β , α ) is the global irradiance on the plane of the PV array, T p v is the cell temperature in Celsius, calculated by Equation (2), f p v is a derating factor that includes the losses due to dust, shading and wiring; this factor also considers the mismatching and natural degradation of solar modules. G s t c is the global irradiance in standard test conditions for the PV cell.
T p v = 1 + α p 100 · ( T c e l l t T s t c )
In Equation (2), α p is the temperature coefficient of maximum power % / C , T s t c is the temperature in standard test conditions and T c e l l is calculated by Equation (3) [39].
T c e l l t = T a m b + G ( β , α ) t · N O C T 20 800
where N O C T is the rated operation cell temperature thath can be consulted in the module datasheet, while T a m b corresponds to the average ambient temperature measured each month.

2.2. BESS Model

The BESS model is based on the time estimation of State of Charge ( S o C t ) that is defined in Equation (4)
S o C t = ( 1 σ ) · S o C t 1 + E b a t t + · η c E b a t t / η i n v
where σ is the self-discharge rate per hour, E b a t t + is the power delivered to the BESS, η c is the BESS load efficiency, E b a t t is the power of BESS delivered to the load, and η i n v is the inverter efficiency. E b a t n is the rated capacity of BESS given by Equation (5).
E b a t n = N b a t · E b a t c e l l
where E b a t c e l l is the rated power of the battery cell and N b a t is the number of batteries and can be calculated by Equation (6).
N b a t = N b p · N b s
where N b p is the number of batteries cell in parallel and N b s is the number of batteries in series and can be calculated by Equation (7), where, V d c s i s t is the DC system voltage and V d c b c is the battery voltage.
N b s = V d c s i s t V d c b c
In this case, S o C max is the maximum SoC of the BESS considering the maximum capacity defined by Equation (8); on the other hand, S o C min is the minimum SoC of the BESS according to the maximum depth of discharge, defined by Equation (9), where D O D max is the maximum depth of discharge that determines the fraction of power that can be withdrawn from the BESS expressed as a percentage of maximum capacity.
S o C max = E b a t n
S o C min = E b a t n · ( 1 D O D max )
The maximum flow of energy to avoid overheating when charging or discharging the BESS, labeled as E max , is defined by Equation (10), where C r a t e is the capacity rate in hours [39].
E max = E b a t n C r a t e
The number of charging/discharging cycles of the battery can be calculated using Equation (11):
B c y c l e s = t T E b a t t E b a t n

2.3. Diesel Generator

The power model of the diesel generators ( P d g ) is calculated using Equation (12).
P d g = η d g · P d g r a t e · N d g
where η d g is the efficiency of the generator, P d g r a t e is the rated power and N d g is the number of diesel generator units. The total fuel consumption for a diesel generator, measured in litres per hour ( L / h ) , is calculated using Equation (13):
F d g i = i = 1 N a i + b i · P d g i + c i · P d g i 2
where N is the number of diesel generators, a i , b i y c i are coefficients of the fuel consumption of the generator, while P d g i with i = 1 , 2 , , N show the power output, measured in kWh, from diesel generators.

2.4. Economic Indicators

Several economic indicators can be implemented when sizing MGs [7,39]. These include: net present cost (NPC), life-cycle cost (LCC), annual system costs (ASC) and levelised cost of energy (LCOE). In this paper, LCOE and ASC are selected.
The LCOE can be expressed as the ratio between the total cost and total energy consumed by the load in the project lifetime. The economic model assumes that the yearly load served is constant during the lifetime of the project, as in [39]. This can be calculated by Equation (14), where T is the horizon time that needs to be evaluated, E l o a d t is the energy required by the load at time t and P E N S t indicates the energy that is not supplied to the load at time t. In this case, ASC is the summation of capital, replacement, operation and maintenance costs, as indicated by Equation (15).
L C O E = A S C t T ( E l o a d t P E N S t )
A S C = i N c ( C C i + R C i ) · C R F ( i r , R ) + O & M i
where, C C i and R C i are the capital and replacement costs, respectively; i r is the annual interest rate, R is the lifetime of the project and C R F is the capital recovery factor. N c is the set of system components and O & M i is the operation and maintenance cost given by Equations (16)–(18).
O & M p v = C C p v · ρ p v
O & M b a t = C C b a t · ρ b a t
O & M d g = c f + c l + a c
In this case, O & M p v , O & M b a t and O & M d g are the operation and maintenance costs for PV array, BESS and diesel generator, respectively. C C p v and C C b a t are the investment costs of the PV array and BESS, respectively. ρ p v and ρ b a t are a percentage of the investment costs of the PV array and BESS, respectively. c f is the average cost of fuel, as given by Equation (19), c l is the average cost of lubricant, given by Equation (20), and a c is the average administrative costs, given by Equation (21).
c f = C E C · E · ( P A + T r + C a l )
c l = C E L · ( T r + P lim ) · E
a c = 0.1 · ( c f + c l )
where C E C is the specific consumption of fuel per kWh for a diesel generator, E is the energy delivered to the load and BESS. In this case, P A is the average fuel price of a gallon from the nearest supplier plant, T r is the cost of the transportation of fuel, and C a l is the fuel storage cost. C E L is the specific consumption of lubricant per kWh for a diesel generator, and P lim is the average lubricant price of gallon. Administrative costs are considered as 10 % of the total cost of fuel and lubricant consumption.
The capital recovery factor ( C R F ( i r , R ) ) is given by Equation (22), where R is the project lifetime in years and i r is the annual interest rate.
C R F ( i r , R ) = i r ( 1 + i r ) R ( 1 + i r ) R 1
The investment cost for each system component considered in this work is given by Equation (23).
C C i = c k i i · N i · P i
where c k i i is the cost per kWh installed for each system component. This cost is associated with electronic power equipment, battery cells, PV panels and diesel generation units. N i is the number of units for each system component, and P i is the rated power of each unit for each considered system component.
The replacement cost is only considered for the BESS and diesel generator, since the life-cycle of the PV panels is greater than the project’s lifetime. This is given by Equation (24).
R C i = λ i · C C i · K i ( i r , L i , y i )
In this case, λ i is a factor used to consider a percentage of the initial investment cost for each system component, and k i is the single-payment present worth, given by Equation (25) [40].
K i ( i r , L i , y i ) = n = 1 y i 1 ( 1 + i r ) n · L i
where y i is the number of replacements during the useful lifetime of the project given by Equation (26). In this case, L i is the useful lifetime of each component and R is the lifetime of the project.
y i = R L i

2.5. Reliability Indicator

The loss of power supply probability ( L P S P ) is given by Equation (27). This parameter is used to estimate the reliability of the MG, which is the ratio between the total energy not supplied to the load ( P E N S t ) and the total energy required by the load ( P L o a d , t ).
L P S P = t T P E N S , t t T P l o a d , t

2.6. Fiscal Incentives

In 2021, the Colombian government issued Law 2099, which aims to modernize the existing legislation. This law made amendments and additions to Law 1715 of 2014, where the Colombian government provided tax benefits to promote the development and use of non-conventional energy sources, particularly those of a renewable nature. The projects can be deducted from their annual income tax, in a period not exceeding 15 years, for up to 50% of the total investment made. The annual income tax can be calculated using Equation (28).
i = 0.5 / T 1
where T 1 corresponds to the years in which the tax benefit is applied, which cannot exceed 15. The accelerated depreciation is equally distributed according the project requirements, as shown in Equation (29).
d = 1 / T 2
where T 2 corresponds to the years in which the accelerated depreciation is applied. The tax deduction factor ( ω ) applied in the project can be calculated by Equation (30), where τ is the effective corporate tax income rate of the project.
ω = 1 ( 1 τ ) · 1 τ · j = 1 T 1 i ( 1 + i r ) j + j = 1 T 2 d ( 1 + i r ) j

3. Proposed Optimization Model

In this work, a deterministic cost model is proposed. The main goal is to minimize the total cost of dispatching energy from energy resources that successfully meet the load. The objective function, given by Equation (31), minimizes the cost of energy dispatched for the time horizon T. c p v , c d g , c b a t and c e n s are the cost per kilowatt ( $ / k W h ) of the PV array, diesel generator, BESS and energy not served, respectively. E p v is the delivered energy of the PV array, E b a t t p v is the load power to the BESS from the PV array, E d g is the power delivered by the diesel generator, E b a t t d g is the load power to the BESS from the diesel generator, E b a t t is the energy delivered from the BESS to the load and P E N S is the energy not served to the load.
M i n t T c p v · ( E p v t + E b a t t p v ) + c d g · ( E d g t + E b a t t d g ) + c b a t · E b a t t + c e n s · P E N S t

3.1. Energy Balance Constraint

The constraint given by Equation (32) represents the energy supplied to the load.
E p v t + E d g t + E b a t t + P E N S t = E l o a d t T

3.2. Reliability Constraint

The constraint given by Equation (33) ensures that the loss of power supply probability ( L P S P ) does not exceed its maximum limit.
L P S P L P S P max

3.3. PV Constraints

Expression (34) ensures that the energy delivered from the PV array to the load ( E p v t ) and the energy delivered from the PV array to charge the BESS ( E b a t t p v ) does not exceed the maximum PV energy available ( E p v t max ), at time t. Equation (35) ensures that there are positive values in the delivered energy. The constraint given by Equation (36) ensures that the energy delivered from the PV array to charge the BESS is only available after supplying the load.
E p v t + E b a t t p v E p v t max
E p v t + E b a t t p v E p v t min
E b a t t p v E p v t max E p v t

3.4. Diesel Generator Constraint

Equation (37) ensures that the power delivered from the diesel generator to the load ( E d g t ) and the power delivered to charge the BESS from the diesel generator ( E b a t t d g ) does not exceed the maximum capacity of the generator ( P d g r a t e ); otherwise, the binary variable B d g t will be zero. The constraint given by Equation (38) ensures that the diesel generator does not supply power below its technical ( P d g m i n ); otherwise, the binary variable B d g t will be zero. Equation (39) ensures that the energy delivered from the diesel generator to charge the BESS is only available after supplying the load.
E d g t + E b a t t d g P d g r a t e · B d g t
E d g t + E b a t t d g P d g min · B d g t
E b a t t d g P d g r a t e E d g t

3.5. BESS Charge and Discharge Constraints

Equation (40) ensures that the BESS State of Charge S o C t is within its minimum and maximum values, labeled as S o C m i n and S o C m a x , respectively.
S o C min S o C t S o C max
Equation (41) ensures that the power to charge the battery is delivered from the PV array ( E b a t t p v ) and the diesel generator ( E b a t t d g ). The energy delivered from the diesel generator to the BESS is multiplied by the efficiency of the inverter ( η i n v ). Equations (42) and (43) prevent the BESS from overheating in the charging and discharging process, respectively. In this case, E m a x is the maximum energy used for loading and unloading. B c and B d are binary variables that determine if the BEES is charging and discharging, respectively. M b is a positive battery constant to ensure the constraint. Equations (44) and (45) ensure that the charge ( E b a t t + ) and discharge ( E b a t t ) energies do not violate the maximum and minimum state of BESS charge limits. The constraint given by (46) ensures that the maximum BESS charge and discharge cycles ( c y c l e s m a x ) are not exceeded by the total cycle results of the BESS ( B c y c l e s ).
E b a t t + = E b a t t p v + E b a t t d g · η i n v
M b · B c t E b a t t + E max · B c t
M b · B d t E b a t t E max · B d t
E b a t t S o C t S o C min
E b a t t + S o C max S o C t
B c y c l e s c y c l e s max

4. Tests and Results

The tests of the proposed methodology were carried out at the east headquarters of Universidad de Antioquía, in Colombia, at a latitude of 6.10 and longitude of −75.38. The experimental data were collected in 2019 at the university building and weather station. All data, as well as the complete methodology, are available in an open-source repository in [41].

4.1. Load Profile

The electrical demand to be met at the building is shown in Figure 3 and Figure 4. Note that Figure 3 corresponds to the daily average load profile for one year, while Figure 4 is the monthly load profile for one year. In this case, there is a consumption peak at around office hours at the University. The months with the highest energy consumption are October, November and December.

4.2. Solar Radiation and Temperature

Figure 5 shows the daily average solar radiation for one year by month. The solar radiation is around 700 Wh/m 2 , on average, daily, while the radiation is more than 770 Wh/m 2 in June, July and August.
Figure 6 corresponds to the montly solar radiation for one year. As shown, the total summation of solar radiation by month is also the highest in in June, July and August.
Figure 7 is the daily average temperature for one year for a month. The average temperature at noon is around 23 °C. The month with the highest temperature is August.

4.3. Input Parameters

The systems input parameters and benefits are shown in Table 1, which were selected according to the Colombian Law. The real interest rate was taken from [42] while the tax reduction factor was calculated in Section 2.6. The costs of energy not supplied in Colombia ( c e n s ) and L P S P were taken from [43]. The variable labeled as c e n s in Colombia corresponds to the marginal economic cost of rationing the energy demand in off-grid areas; this value is defined by the Colombian regulation and updated by the mining and energy planning unit (UPME, Spanish acronyms) according to the percentage of demand to be rationed [44].
Table 2 presents the technical and economic parameters of the PV module. The data were selected from a commercial mono crystalline PV module of 300 w p from the company JINKO SOLAR (Shanghai, China).
Table 3 presents the technical and economic parameters of the BESS. The data were selected from commercial Vented lead-acid batteries with reference to the sun power V LSeries OPzS/OPzS bloc special to cyclic applications from HOPPECKE company (Brilon, Germany). The data sheet recommended a maximum depth of discharge of 50 % to obtain 3000 life-cycles.
Table 4 summarizes the technical and economic parameters of the diesel generator. The average fuel and lubricant prices were selected from the companies in the region.
The cost per kW installed in each technology, the factor of the initial capital invested cost and life-cycle of each technology considered in this work were taken from [39].

5. Discussion

This section shows the results of 159 tests that were carried out on the case study with a personal computer equipped with an Intel Core i7-8550U 1.8 GHz processor with 8 CPUs and 8 GB of RAM memory. The proposed optimization model was implemented in the Pyomo Python-based open-source package. The solver used in Pyomo was a Gurobi Optimizer version 9.0.3 with an academic license.
Since the formulated model is linear, it is possible to use an open-source solver. However, due to the size of the problem, this is not recommended, because the performance is lower than a solver such as GUROBI, as can be seen in Figure 8. Note that GUROBI achieves a solution between 0 and 5% of GAP, around 20 min, while CBC achieves the same solution in about 70 min with a higher GAP.
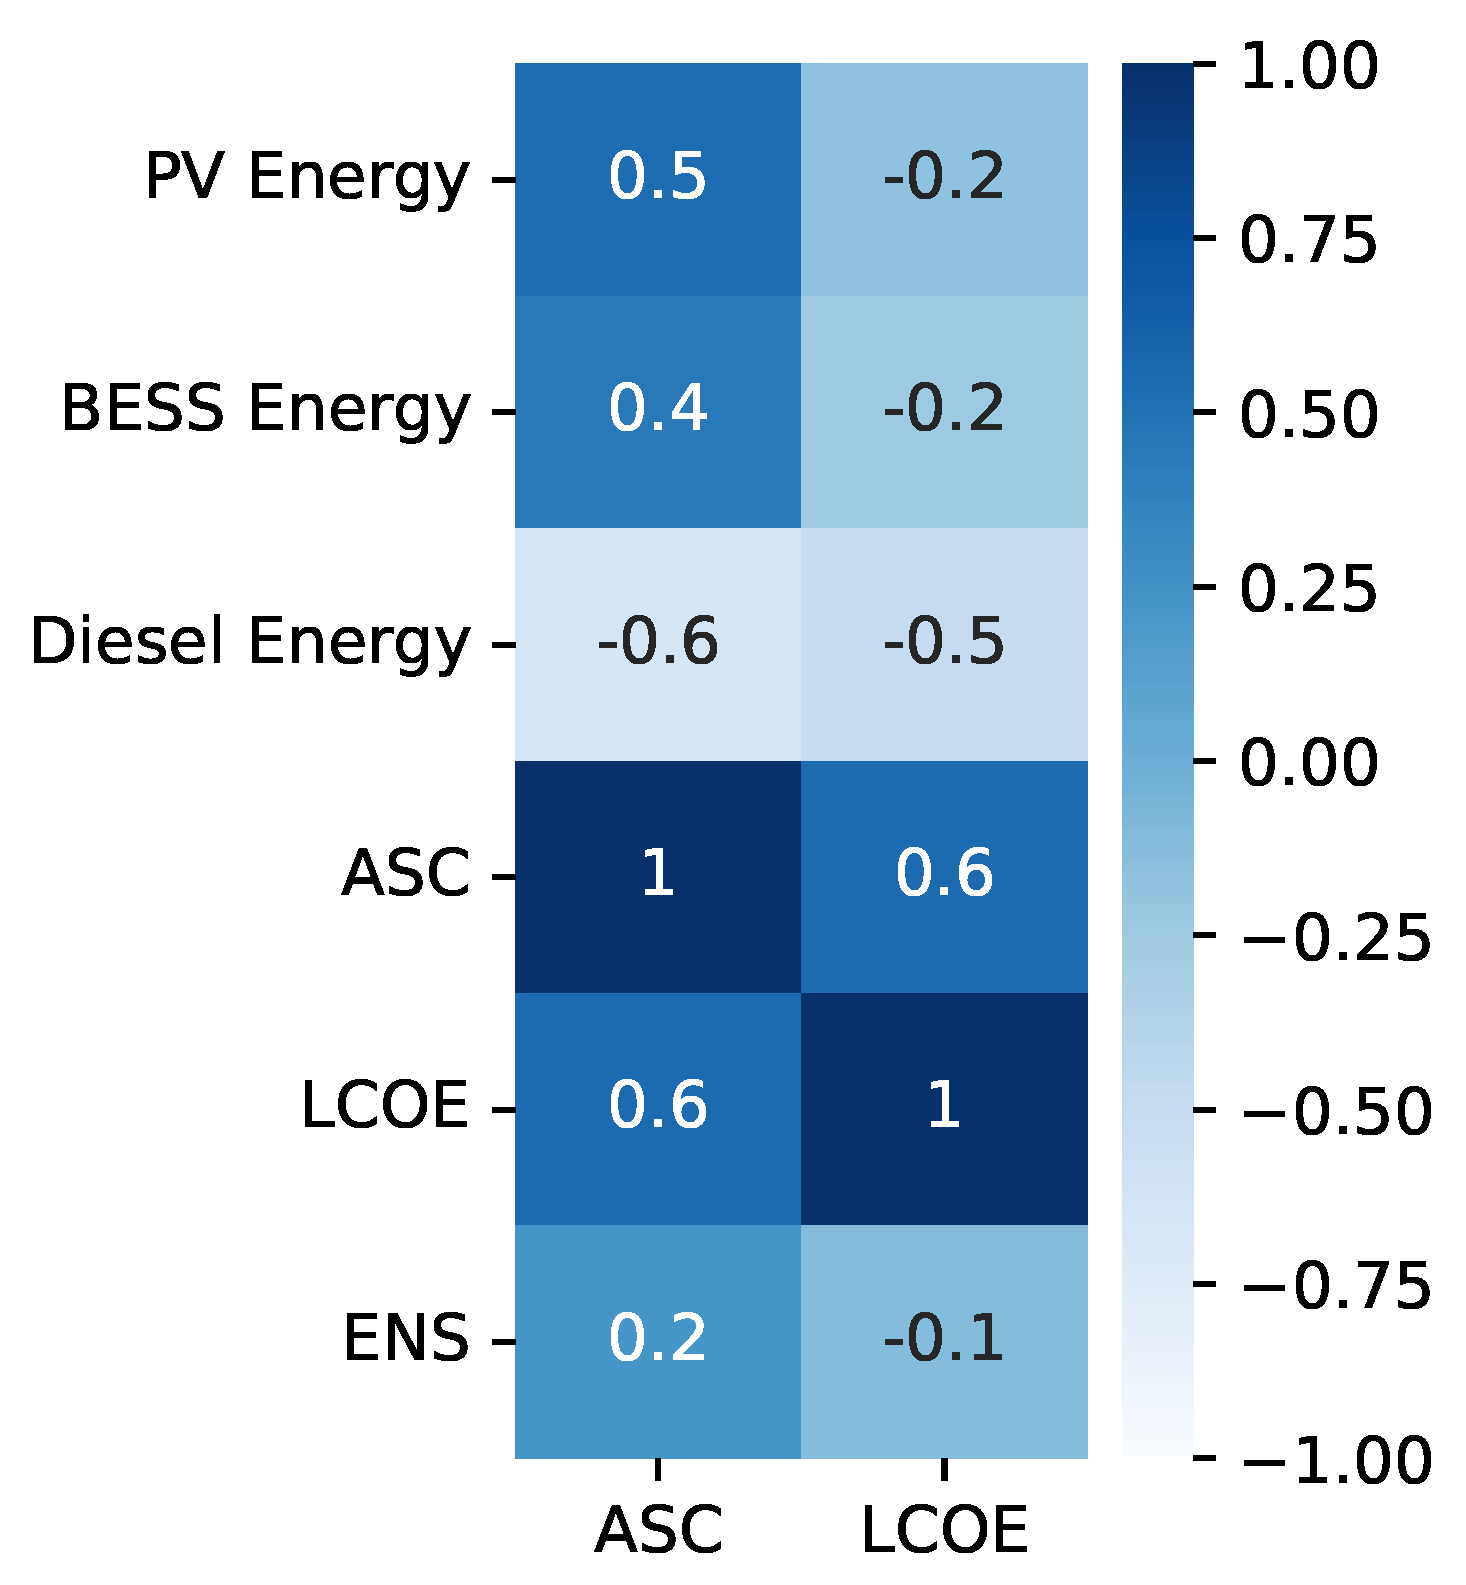
A matrix that correlates the energy supplied with the load and the ASC and LCOE indicators is shown in Figure 9. Note that diesel energy and ASC have a negative and strong correlation. This means that if the diesel energy increases, the ASC decreases. This behavior is due to the load profile; if the model uses more PV modules and batteries to satisfy the load, then the capital, replacement, operation, and maintenance cost increase. On the other hand, the LCOE has a negative and medium correlation with the PV energy and BESS. This is because of the energy that is supplied to the load; in other words, if the PV modules and BESS increase, the load can be fully covered. In this case, the energy supplied by the diesel generator is not decisive in the LCOE due to operational constraints; if the load is lower than the minimum capacity that is able to dispatch the diesel generator, the load cannot be met.
Figure 10a,b show the relationship between the energy delivered to the load by the MG and the A S C and L C O E indicators, respectively. The size of the circles indicates the amount of energy delivered to the load by the technoology over a year. The bigger the circle, the more energy is delivered by the corresponding resource. Figure 10a shows that when ASC is greater than 15k, the energy delivered by the PV array is higher. This indicates that the increase in the installed capacity of the PV array also increases the O & M p v costs. Additionally, in Figure 10b, it is shown that the LCOE is lower in cases where the energy delivered by the PV array is higher with respect to the other resources. Therefore, the simulations that obtained an LCOE of below 0.3 were the ones with the highest installed capacity of the PV array and BESS.
The diesel generator is not decisive in the LCOE because it is a backup resource. In addition, it has technical restrictions regarding the minimum dispatch of its capacity. In other words, in the simulations, the constraint is that the diesel generator is only dispatched if the energy to be covered is at least 90% of its capacity.
Figure 11 shows the fulfillment of the allowed L P S P m a x , which was considered as the objective. It is observed that the resulting L P S P is always lower than the maximum value and varies according to the input parameters. In general terms, if more power generation is available, the resulting L P S P is lower.
Table 5 presents the results of the planning problem for two MG configurations. The first case considers PV panels, BESS, and a diesel generator, while the second case only considers PV panels and BESS.
According to the Institute for Planning and Promotion of Energy Solutions for Non-Interconnected Zones (IPSE), there are 106,566 users in-off grid areas in Colombia, which typically have between 5 and 10 hours of daily electrical service [45]. If this type of MG were installed in a non-interconnected area with similar characteristics, the two solutions found in this paper would improve electricity supply in these off grid areas, with 19 and 21 h, respectively. In these hours, the load was fully supplied ( P E N S = 0 ). This may vary according to the L P S P selected at the beginning of the projects and the user criteria when selecting the sizing methodology. Furthermore, the results show that the best cost is obtained in the first option, with an L C O E of 0.51$/kWh, which is 0.27$/kWh lower than the second option, with 0.78$/kWh. This result is due to the load profile, in which, during the hours of lower solar radiation, there is a high energy demand; therefore, for the second option, more PV and BESS units are required to satisfy the energy demand.
Figure 12 corresponds to the energy supplied to the load in a year. Figure 12a,b shows that, for the first and second cases, the energy provided from renewable resources is prioritized over the energy provided by the diesel generator, in accordance with the proposed optimization model. Then, in the PV-BESS-DG solution, the energy delivered by the PV array to the load corresponds to 48.3 % , the energy delivered by the BESS to the load corresponds to 25.3 % , and the energy delivered by the diesel generator to the load was 21.3 % . Finally, the non-served energy was 5 % . For the PV-BAT solution, the energy delivered by the PV array to the load corresponds to 62.9 % , while the energy delivered by the BESS was 32.1 % . Finally, the non-served energy was 4.99 % .
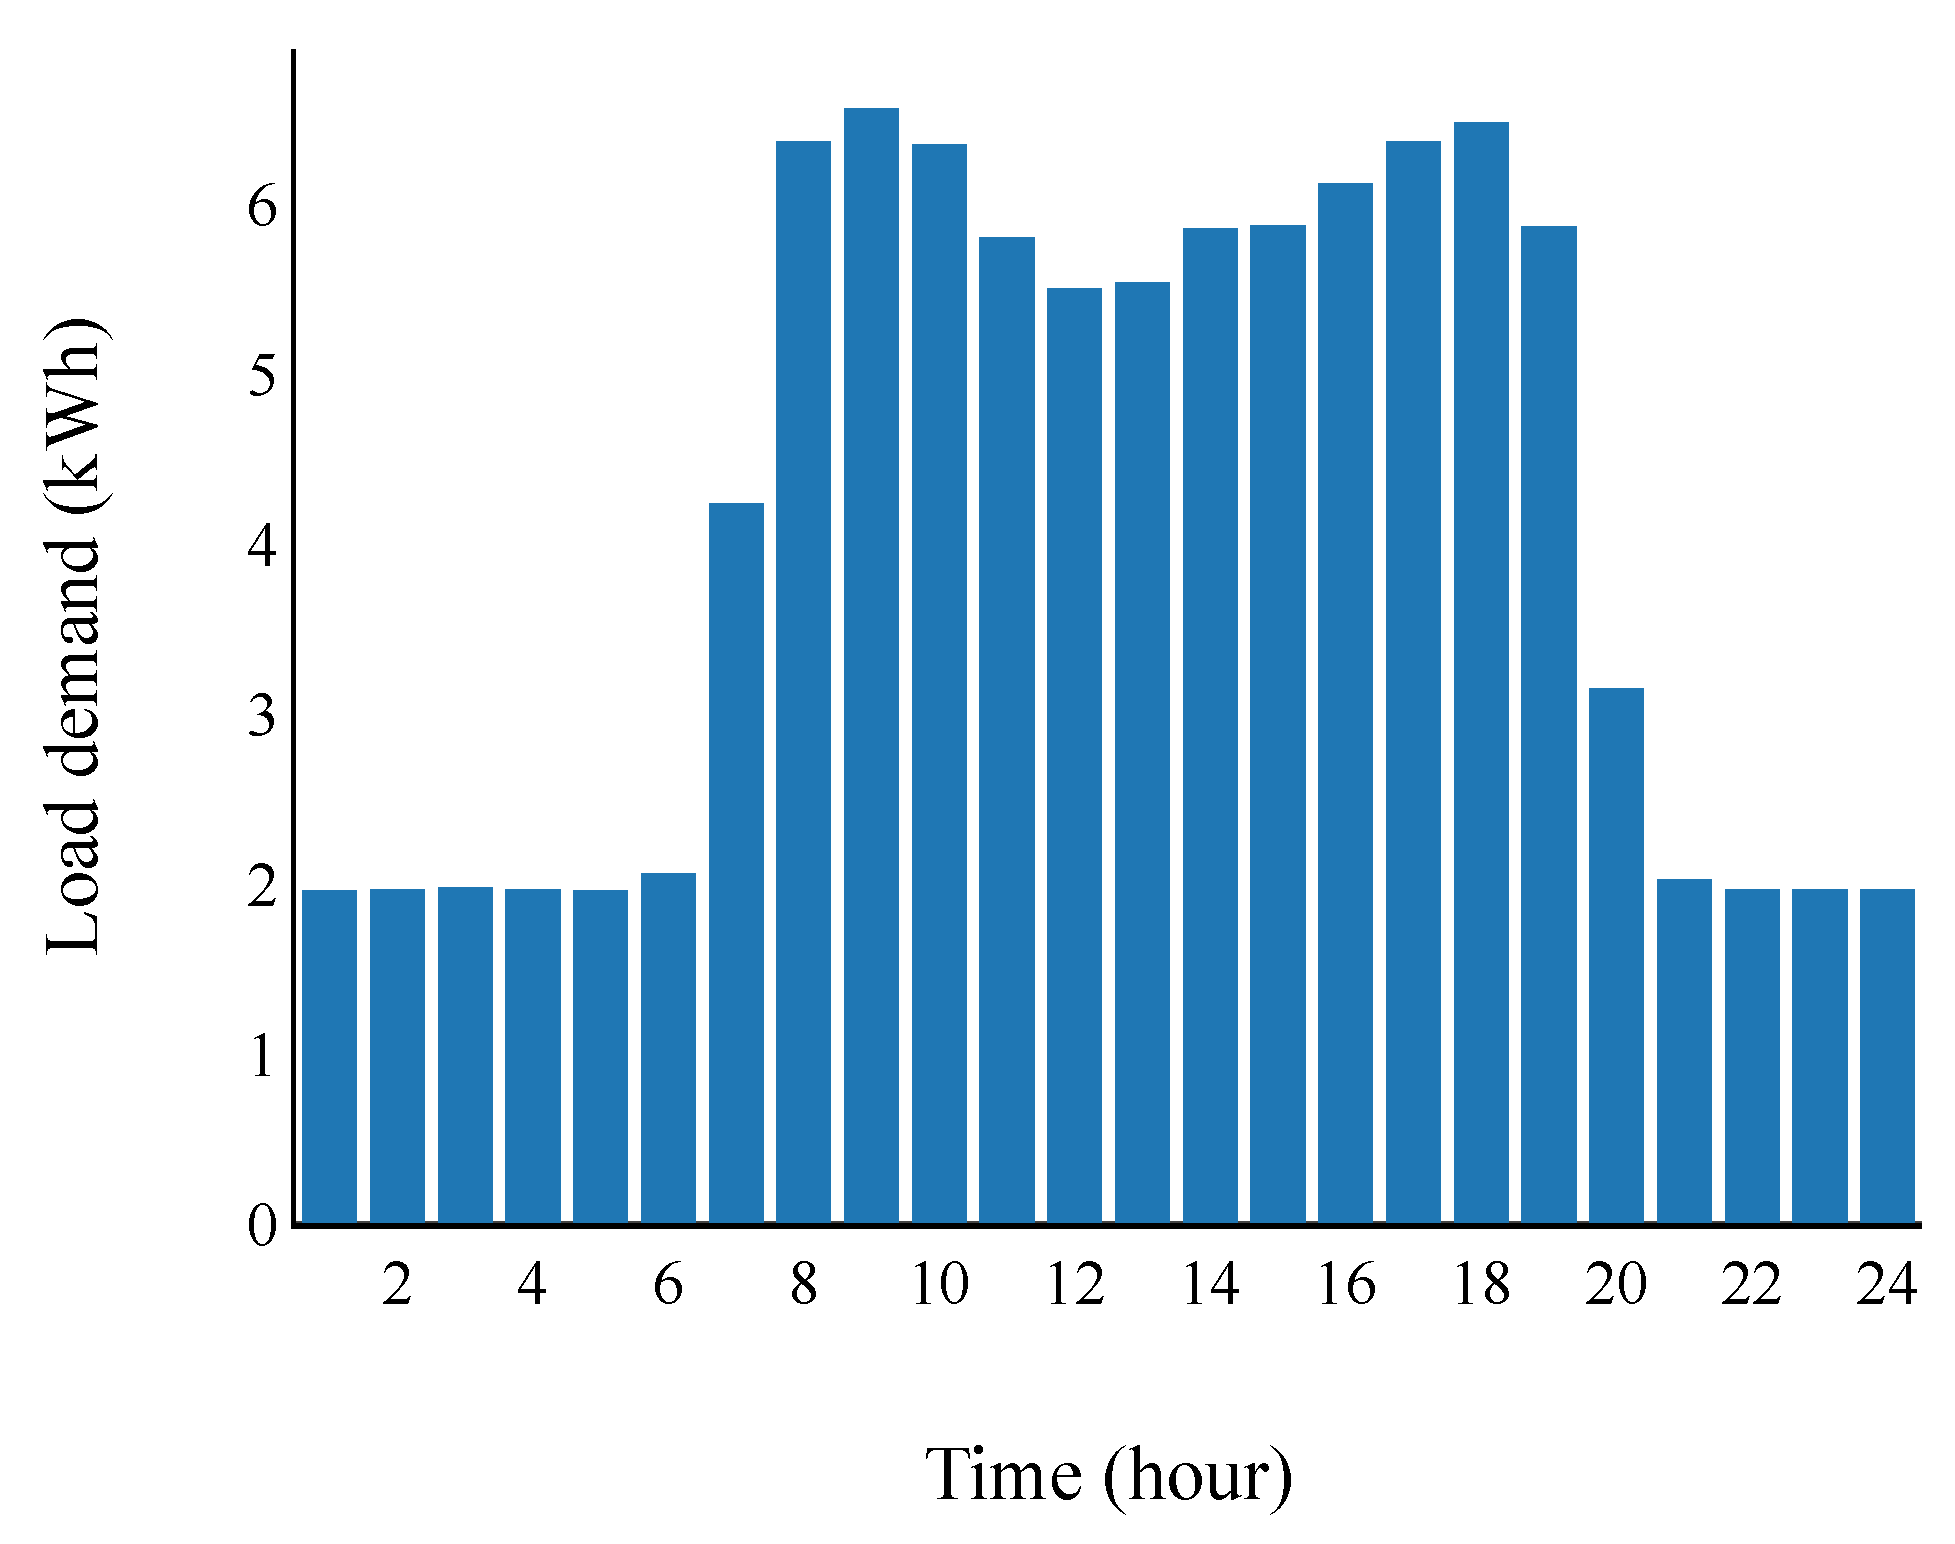
Figure 13 corresponds to the energy supplied to the load in a day from PV-BESS-DG and PV-BESS. Samples were randomly taken from one day that illustrates the hourly load curve. These figures show that the diesel generator and BESS are only used when the PV energy is not available or is insufficient, with the diesel generator providing the last option to supply the load and charge the BESS. Figure 13a shows that energy is not supplied for some hours. This is because the S o C ( t ) of the BESS is below the allowable limits or, due to technical restrictions, the diesel generator is at its minimum operative power. For the PV-BESS-DG solution in the early morning hours of 0, 2, 3, 4 and 5, the use of BESS was required. Nonetheless, at hours 0, 4 and 5, there was PENS. At hour 1, all the energy was supplied by diesel energy. In hours 6, 7, 8, 9, PENS was present even though PV energy was available. This is due to the fact that the irradiance in those hours is low and does not cover the demand. Likewise, the BESS did not have stored energy and the diesel generator could not be dispatched due to technical restrictions. In hours 10, 11, 12, 13 and 14, the demand was supplied only by PV energy due to the high availability of the solar resource. Hours 15 and 16 were supplied by the BESS and PV energy. Hours 17 and 18 were supplied solely by the diesel generator. This is due to the fact that the minimum capacity restrictions for the diesel generator were met while there is no solar resource or sufficient energy in the BESS. Finally, in hours 19, 20, 21, 22 and 23, the demand was supplied by the BESS. For the PV-BAT-DG solution, it is shown that, in hours 17 and 18, the diesel generator was used as a backup due to the shortage of energy from the PV array and BESS. In hours 5, 6, 7, 8, and 9, there was no power supplied for the day under analysis. In the evening hours, power was mainly supplied from the BESS. In the PV-BAT solution, between 6 and 17 hours, energy was mainly used from the PV array, while in the evening hours, the BESS was used to supply the energy.
Figure 14 shows the hourly average for the whole year of the energy used to charge the BESS. The blue line is the energy used to charge the BESS, while the orange and green lines indicate the energy used from PV and diesel to charge the BESS, respectively. Figure 14 illustrates that the optimization model proposed prioritizes PV energy when charging the BESS and only uses the energy from the diesel generator when PV energy is not available. The model prioritizes the BESS load according to the cheapest resource: in this case, PV energy. Then, between 6 a.m. and 5 p.m., the BESS is charged with the energy left over from the PV array after supplying the load. Between 2 and 4 p.m., the highest use of the diesel generator is presented to charge the battery, this is because, in these hours, the S o C of the BESS is at its lowest levels.
Figure 15 shows the average SoC of the BESS. For the two given solutions, it is shown that the battery charging process mainly occurs between 7 a.m. and 5 p.m. This is due to the solar resource’s availability for charging. The green and orange lines show that the charging and discharging processes do not occur simultaneously. Figure 15a indicates the hourly average for the whole year. The blue line is the behavior of the SoC during the 24 h. The green line shows the energy used (PV energy + diesel energy) to charge the BESS. The orange line indicates the energy used from the BESS to supply the load. The charging and discharging process meets the maximum energy per hour (Emax). The dashed region denotes the range (in kWh) of the BESS capacity with its maximum and minimum SoC(t), considering the DODmax parameter of the BESS. The process starts when energy is available from the diesel generator and PV Array. Meanwhile, Figure 15b shows that the BESS is only charged when energy is available from the PV array. In Figure 15a, the maximum size of the BESS is 40 kWh, while in Figure 15b, it is 100 kWh. This is because Figure 15a illustrates a solution that uses a backup diesel generator. This means that the solar and BESS system is smaller and not oversized. In Figure 15b, the size of the BESS significantly increases due to the need to meet the load supply. Likewise, the size of the PV system also increases. Therefore, when diesel generation is not used as a backup, the BESS and solar systems are oversized.
Figure 16 corresponds to the charging and discharging Process of the BESS in a day for PV-BESS-DG and PV-BESS configurations. At hour 8, the BESS is loaded by the PV system and the diesel generator. At hour 10, there is no charging or discharging process. This is because the diesel generator and the PV system supply the load. At hours 11, 12 and 13, the highest energy supplied by the system to charge the BESS is observed. At hours 14 and 15, it is necessary to use the BESS to feed the load because the production of the PV system is reduced. At hours 16, 17, 18 and 19, the BESS is in the process of charging, taking advantage of the energy remaining in the diesel generator after feeding the load.
In Figure 16b, between 7 and 13 h, there is excess solar energy production; therefore, the BESS is charged. When the solar energy production is low, the BESS feeds the load in all hours, from 14 to 6. Figure 16a,b show that, in both options, the optimization model ensures that the process of charging and discharging the BESS does not occur at the same time. For the PV-BAT-DG solution, it is observed that, at hours 11, 12, and 13, a charging process was initiated; therefore, the battery did not supply energy to the user (discharge process). At hours 14 and 15, the opposite occurred when the discharge process was initiated. The same behavior is observed in the PV-BESS solution. In solution 1, a system with a backup diesel generator decreases the need for PV systems; therefore, BESS and the PV system have lower capacity. This lowers the cost of the system. In the absence of a diesel generator, the PV system and BESS need to be significantly increased in size. This means that, during hours with high solar radiation, there is excess generation. When there is excess solar energy, it is not necessary to use the BESS; thus, the BESS is charged during the hours with solar production.

6. Conclusions

This paper presented a methodology that can be used by decision-makers for the optimal sizing of islanded MGs. This methodology considers a deterministic optimization model and the tax benefits that the Colombian government offers to new projects that include renewable energy. The optimization model considers the technical constraints of BESS, such as the maximum cycles allowed for charging and discharging. The reliability of the system was included as a constraint on the optimization model and the energy supplied to the load was considered as a variable with a high cost in the objective function (penalization).
Two cases were selected from the simulations in the Python programming language: The first one considered PV panels, a BESS and a diesel generator, while the second one considered PV panels and a BESS without a diesel generator. The second case presented the highest cost since it requires more PV and BESS, with the latter being the most expensive devices of the MG. The results showed that the service of the user can be improved using the proposed methodology.
The total energy, by source, was related to ASC and LCOE. It was observed that the energy delivered by the PV array is higher with respect to other resources. In fact, the selected solutions provide 19 and 21 hours, respectively, without having energy that is not served to the load.
It was found that the LCOE was lower when considering the tax benefits. The meteorological data and the load profile are decisive in the sizing process of each case. This methodology can be used for sizing an islanded microgrid. Nonetheless, certain information must be available, such as the hourly load profile of the users, meteorological data, technical data of the system assets and the tax-benefits rules.
The main limitation of the proposed approach lies on the fact that it is restricted to a specific topology of the MG. Future work will include more versatile MG topologies, as well as other features, such as the effect of demand response.

Author Contributions

Conceptualization, W.R.-C., N.M.-G., E.F.C.-B., P.M.-D. and J.M.L.-L.; Data curation, W.R.-C.; Formal analysis, W.R.-C., N.M.-G., E.F.C.-B., P.M.-D. and J.M.L.-L.; Funding acquisition, E.F.C.-B., P.M.-D., J.M.L.-L. and N.M.-G.; Investigation, W.R.-C., N.M.-G., E.F.C.-B., P.M.-D. and J.M.L.-L.; Methodology, W.R.-C., N.M.-G., E.F.C.-B. and P.M.-D.; Project administration, N.M.-G., E.F.C.-B., P.M.-D. and J.M.L.-L.; Resources, W.R.-C., N.M.-G., E.F.C.-B., P.M.-D. and J.M.L.-L.; Software, W.R.-C.; Supervision, N.M.-G. and J.M.L.-L.; Validation, W.R.-C., N.M.-G., J.M.L.-L., E.F.C.-B. and P.M.-D.; Visualization, W.R.-C.; Writing—original draft, W.R.-C. and N.M.-G.; Writing—review and editing, W.R.-C., N.M.-G., E.F.C.-B., P.M.-D. and J.M.L.-L. All authors have read and agreed to the published version of the manuscript.

Funding

This research was funded by the Colombia Scientific Program within the framework of the so-called Ecosistema Científico (Contract No. FP44842-218-2018).

Institutional Review Board Statement

Not applicable.

Informed Consent Statement

Not applicable.

Data Availability Statement

Not applicable.

Acknowledgments

The authors gratefully acknowledge the support from the Colombia Scientific Program within the framework of the call Ecosistema Científico (Contract No. FP44842- 218-2018). The authors also want to acknowledge Universidad de Antioquia for its support through the project “estrategia de sostenibilidad”.

Conflicts of Interest

The authors declare that they have no conflict of interest.

Nomenclature

This section presents the nomenclature used in the paper, for quick reference.
GSets of systems components
TTime horizon to evaluate the study case
c p v Price per kW of PV energy installed in (USD/kW)
c d g Price per kW of Diesel energy installed in (USD/kW)
c b a t Price per kW of BESS energy installed in (USD/kW)
c e n s Cost of energy not supplied in (USD/kWh)
L P S P max Maximum loss of power supply probability allowed in (%)
E l o a d Load to meet at time t in kWh
E p v max Maximum energy available from PV array at time t in kWh
E p v min Minimum energy available from PV array at time t in kWh
P d g min Minimum energy available from diesel generator in kWh
P d g r a t e Is the rated power of diesel generator in kWh
M b Positive BESS constant
S o C max Maximum state of BESS charge in kW
S o C min Minimum state of BESS charge in kW
c y c l e s max Maximum number of allowed charging/discharging cycles for the BESS
E max Maximum flow of energy to avoid overheating the BESS
E p v Energy supplied to load from PV array in kWh
P d g Energy supplied to load from diesel generator in kWh
E b a t Energy supplied to load from BESS in kWh
E b a t + Energy supplied to BESS from PV array and diesel generator in kWh
E b a t p v Energy supplied to BESS from PV array in kWh
E b a t d g Energy supplied to BESS from diesel generator in kWh
P E N S Energy not supplied to load in kWh
S o C State of BESS charge at time in t in kWh
B d g Binary variable that determines if the diesel generator is Used
B c Binary variable that determines if the BESS is charging
B d Binary variable that determines if the BESS is discharging
B c y c l e s Number of charging/discharging cycles in the BESS

References

  1. Saldarriaga-Zuluaga, S.D.; Lopez-Lezama, J.M.; Muñoz-Galeano, N. Protection Coordination in Microgrids: Current Weaknesses, Available Solutions and Future Challenges. IEEE Lat. Am. Trans. 2020, 18, 1715–1723. [Google Scholar] [CrossRef]
  2. Bani-Ahmed, A.; Rashidi, M.; Nasiri, A.; Hosseini, H. Reliability Analysis of a Decentralized Microgrid Control Architecture. IEEE Trans. Smart Grid 2019, 10, 3910–3918. [Google Scholar] [CrossRef]
  3. Saldarriaga-Zuluaga, S.D.; López-Lezama, J.M.; Muñoz-Galeano, N. Optimal coordination of over-current relays in microgrids considering multiple characteristic curves. Alex. Eng. J. 2021, 60, 2093–2113. [Google Scholar] [CrossRef]
  4. Saldarriaga-Zuluaga, S.D.; López-Lezama, J.M.; Muñoz-Galeano, N. An Approach for Optimal Coordination of Over-Current Relays in Microgrids with Distributed Generation. Electronics 2020, 9, 1740. [Google Scholar] [CrossRef]
  5. Feroldi, D.; Zumoffen, D. Sizing methodology for hybrid systems based on multiple renewable power sources integrated to the energy management strategy. Int. J. Hydrogen Energy 2014, 39, 8609–8620. [Google Scholar] [CrossRef]
  6. Sharma, S.; Bhattacharjee, S.; Bhattacharya, A. Grey wolf optimisation for optimal sizing of battery energy storage device to minimise operation cost of microgrid. IET Gener. Transm. Distrib. 2016, 10, 625–637. [Google Scholar] [CrossRef]
  7. Emad, D.; El-Hameed, M.A.; Yousef, M.T.; El-Fergany, A.A. Computational Methods for Optimal Planning of Hybrid Renewable Microgrids: A Comprehensive Review and Challenges. Arch. Comput. Methods Eng. 2019, 27, 1297–1319. [Google Scholar] [CrossRef]
  8. López-Santiago, D.; Caicedo, E. Optimal management of electric power in microgrids under a strategic multi-objective decision-making approach and operational proportional adjustment. IET Gener. Transm. Distrib. 2019, 13, 4473–4481. [Google Scholar] [CrossRef]
  9. Baghaee, H.; Mirsalim, M.; Gharehpetian, G.; Talebi, H. Reliability/cost-based multi-objective Pareto optimal design of stand-alone wind/PV/FC generation microgrid system. Energy 2016, 115, 1022–1041. [Google Scholar] [CrossRef]
  10. Zhao, J.; Yuan, X. Multi-objective optimization of stand-alone hybrid PV-wind-diesel-battery system using improved fruit fly optimization algorithm. Soft Comput. 2015, 20, 2841–2853. [Google Scholar] [CrossRef]
  11. Fetanat, A.; Khorasaninejad, E. Size optimization for hybrid photovoltaic–wind energy system using ant colony optimization for continuous domains based integer programming. Appl. Soft Comput. 2015, 31, 196–209. [Google Scholar] [CrossRef]
  12. Ogunjuyigbe, A.; Ayodele, T.; Akinola, O. Optimal allocation and sizing of PV/Wind/Split-diesel/Battery hybrid energy system for minimizing life cycle cost, carbon emission and dump energy of remote residential building. Appl. Energy 2016, 171, 153–171. [Google Scholar] [CrossRef]
  13. Cavanini, L.; Ciabattoni, L.; Ferracuti, F.; Ippoliti, G.; Longhi, S. Microgrid sizing via profit maximization: A population based optimization approach. In Proceedings of the 2016 IEEE 14th International Conference on Industrial Informatics (INDIN), Poitiers, France, 19–21 July 2016; pp. 663–668. [Google Scholar] [CrossRef]
  14. Dali, A.; Abdelmalek, S.; Nekkache, A.; Bouharchouche, A. Development of a Sizing Interface for Photovoltaic-Wind Microgrid Based on PSO-LPSP Optimization Strategy. In Proceedings of the 2018 International Conference on Wind Energy and Applications in Algeria (ICWEAA), Algiers, Algeria, 6–7 November 2018; pp. 1–5. [Google Scholar] [CrossRef]
  15. Ahamad, N.B.; Othman, M.; Vasquez, J.C.; Guerrero, J.M.; Su, C.L. Optimal sizing and performance evaluation of a renewable energy based microgrid in future seaports. In Proceedings of the 2018 IEEE International Conference on Industrial Technology (ICIT), Lyon, France, 20–22 February 2018; pp. 1043–1048. [Google Scholar] [CrossRef]
  16. Chen, J.; Zhang, W.; Li, J.; Zhang, W.; Liu, Y.; Zhao, B.; Zhang, Y. Optimal Sizing for Grid-Tied Microgrids With Consideration of Joint Optimization of Planning and Operation. IEEE Trans. Sustain. Energy 2018, 9, 237–248. [Google Scholar] [CrossRef]
  17. Oviedo, J.; Duarte, C.; Solano, J. Sizing of Hybrid Islanded Microgrids using a Heuristic approximation of the Gradient Descent Method for discrete functions. Int. J. Renew. Energy Res. 2020, 10, 13–22. [Google Scholar]
  18. Diab, A.A.Z.; Sultan, H.M.; Mohamed, I.S.; Kuznetsov, O.N.; Do, T.D. Application of Different Optimization Algorithms for Optimal Sizing of PV/Wind/Diesel/Battery Storage Stand-Alone Hybrid Microgrid. IEEE Access 2019, 7, 119223–119245. [Google Scholar] [CrossRef]
  19. Ghiani, E.; Vertuccio, C.; Pilo, F. Optimal sizing and management of a smart Microgrid for prevailing self-consumption. In Proceedings of the 2015 IEEE Eindhoven PowerTech, Eindhoven, The Netherlands, 29 June–2 July 2015; pp. 1–6. [Google Scholar] [CrossRef]
  20. Suhane, P.; Rangnekar, S.; Mittal, A.; Khare, A. Sizing and performance analysis of standalone wind-photovoltaic based hybrid energy system using ant colony optimisation. IET Renew. Power Gener. 2016, 10, 964–972. [Google Scholar] [CrossRef]
  21. Aldaouab, I.; Daniels, M.; Hallinan, K. Microgrid cost optimization for a mixed-use building. In Proceedings of the 2017 IEEE Texas Power and Energy Conference (TPEC), College Station, TX, USA, 9–10 February 2017; pp. 1–5. [Google Scholar] [CrossRef]
  22. Kharrich, M.; Sayouti, Y.; Akherraz, M. Optimal microgrid sizing and daily capacity stored analysis in summer and winter season. In Proceedings of the 2018 4th International Conference on Optimization and Applications (ICOA), Mohammedia, Morocco, 26–27 April 2018; pp. 1–6. [Google Scholar] [CrossRef]
  23. Li, P.; Li, R.X.; Cao, Y.; Li, D.Y.; Xie, G. Multiobjective Sizing Optimization for Island Microgrids Using a Triangular Aggregation Model and the Levy-Harmony Algorithm. IEEE Trans. Ind. Informa. 2018, 14, 3495–3505. [Google Scholar] [CrossRef]
  24. Pham, M.; Tran, T.; Bacha, S.; Hably, A.; An, L.N. Optimal Sizing of Battery Energy Storage System for an Islaned Microgrid. In Proceedings of the IECON 2018—44th Annual Conference of the IEEE Industrial Electronics Society, Washington, DC, USA, 21–23 October 2018; pp. 1899–1903. [Google Scholar] [CrossRef] [Green Version]
  25. Martínez, R.E.; Bravo, E.C.; Morales, W.A.; Garcia-Racines, J.D. A bi-level multi-objective optimization model for the planning, design and operation of smart grid projects. Case study: An islanded microgrid. Int. J. Energy Econ. Policy 2020, 10, 325–341. [Google Scholar] [CrossRef]
  26. Hijjo, M.; Frey, G. Multi-objective optimization for scheduling isolated microgrids. In Proceedings of the 2018 IEEE International Conference on Industrial Technology (ICIT), Lyon, France, 20–22 February 2018; pp. 1037–1042. [Google Scholar] [CrossRef]
  27. Shadmand, M.B.; Balog, R.S. Multi-Objective Optimization and Design of Photovoltaic-Wind Hybrid System for Community Smart DC Microgrid. IEEE Trans. Smart Grid 2014, 5, 2635–2643. [Google Scholar] [CrossRef]
  28. Alabert, A.; Somoza, A.; de la Hoz, J.; Graells, M. A general MILP model for the sizing of islanded/grid-connected microgrids. In Proceedings of the 2016 IEEE International Energy Conference (ENERGYCON), Leuven, Belgium, 4–8 April 2016; pp. 1–6. [Google Scholar] [CrossRef]
  29. Sansa, I.; Villafafilla, R.; Belaaj, N.M. Optimal sizing design of an isolated microgrid based on the compromise between the reliability system and the minimal cost. In Proceedings of the 2015 16th International Conference on Sciences and Techniques of Automatic Control and Computer Engineering (STA), Monastir, Tunisia, 21–23 December 2015; pp. 715–721. [Google Scholar] [CrossRef]
  30. Rigo-Mariani, R.; Sareni, B.; Roboam, X. Integrated Optimal Design of a Smart Microgrid With Storage. IEEE Trans. Smart Grid 2017, 8, 1762–1770. [Google Scholar] [CrossRef] [Green Version]
  31. Sawle, Y.; Gupta, S.; Bohre, A.K. Optimal sizing of standalone PV/Wind/Biomass hybrid energy system using GA and PSO optimization technique. Energy Procedia 2017, 117, 690–698. [Google Scholar] [CrossRef]
  32. Zhao, J.; Nian, H.; Kong, L. Multiobjective Sizing Optimization for Combined Heat and Power Microgrids Using a Triangular Evaluation Model and the Self-Adaptive Genetic Algorithm. In Proceedings of the 2019 IEEE Innovative Smart Grid Technologies—Asia (ISGT Asia), Chengdu, China, 21–24 May 2019; pp. 1840–1845. [Google Scholar] [CrossRef]
  33. Scalfati, A.; Iannuzzi, D.; Fantauzzi, M.; Roscia, M. Optimal sizing of distributed energy resources in smart microgrids: A mixed integer linear programming formulation. In Proceedings of the 2017 IEEE 6th International Conference on Renewable Energy Research and Applications (ICRERA), San Diego, CA, USA, 5–8 November 2017; pp. 568–573. [Google Scholar] [CrossRef]
  34. Rajan, G.; Kavakuntala, M.; Rajkumar, V.S.; Gnanavel, S.; Vijayaraghavan, V. Rural Indian microgrid design optimization—Intelligent battery sizing. In Proceedings of the 2017 IEEE Global Humanitarian Technology Conference (GHTC), San Jose, CA, USA, 19–22 October 2017; pp. 1–5. [Google Scholar] [CrossRef]
  35. Ciabattoni, L.; Ferracuti, F.; Ippoliti, G.; Longhi, S. Artificial bee colonies based optimal sizing of microgrid components: A profit maximization approach. In Proceedings of the 2016 IEEE Congress on Evolutionary Computation (CEC), Vancouver, BC, Canada, 24–29 July 2016; pp. 2036–2042. [Google Scholar] [CrossRef]
  36. Almaktar, M.; Elbreki, A.M.; Shaaban, M. Revitalizing operational reliability of the electrical energy system in Libya: Feasibility analysis of solar generation in local communities. J. Clean. Prod. 2021, 279, 123647. [Google Scholar] [CrossRef] [PubMed]
  37. Hau, V.B.; Husein, M.; Chung, I.Y.; Won, D.J.; Torre, W.; Nguyen, T. Analyzing the impact of renewable energy incentives and parameter uncertainties on financial feasibility of a campus microgrid. Energies 2021, 2446, 2446. [Google Scholar] [CrossRef] [Green Version]
  38. Haghi, E.; Raahemifar, K.; Fowler, M. Investigaing the effect of renewable energy incentives and hydrogen storage on advantages of stakeholders in a microgrid. Energy Policy 2018, 113, 206–222. [Google Scholar] [CrossRef]
  39. Arraez-Cancelliere, O.; Muñoz-Galeano, N.; López-Lezama, J.M. Methodology for Sizing Hybrid Battery-Backed Power Generation Systems in Off-Grid Areas. In Wind Solar Hybrid Renewable Energy System; IntechOpen: London, UK, 2019; pp. 1–22. [Google Scholar] [CrossRef] [Green Version]
  40. Kashefi Kaviani, A.; Riahy, G.; Kouhsari, S. Optimal design of a reliable hydrogen-based stand-alone wind/PV generating system, considering component outages. Renew. Energy 2009, 34, 2380–2390. [Google Scholar] [CrossRef]
  41. Osim Islanded Microgrids Sizing. Available online: https://github.com/osim-microgrid-tool (accessed on 10 June 2022).
  42. Castillo-Ramírez, A.; Mejía-Giraldo, D.; Molina-Castro, J.D. Fiscal incentives impact for RETs investments in Colombia. Energy Sources Part B Econ. Plan. Policy 2017, 12, 759–764. [Google Scholar] [CrossRef]
  43. Costo Incremental Operativo de Racionamiento de Energía, CREG. Available online: https://www.creg.gov.co/taxonomy/term/166 (accessed on 10 June 2022).
  44. Costo Incremental Operativo de Racionamiento de Energía, UPME. Available online: http://www.upme.gov.co/CostosEnergia.asp (accessed on 10 June 2022).
  45. Caracterización Energética de las ZNI. Available online: https://ipse.gov.co/cnm/caracterizacion-de-las-zni/ (accessed on 10 June 2022).
Figure 1. Islanded microgrid.
Energies 15 05161 g001
Figure 2. Schematic diagram of the proposed methodology.
Energies 15 05161 g002
Figure 3. Daily average load profile for one year.
Energies 15 05161 g003
Figure 4. Monthly load profile for one year.
Energies 15 05161 g004
Figure 5. Daily average solar radiation for one year by month.
Energies 15 05161 g005
Figure 6. Monthly solar radiation for one year.
Energies 15 05161 g006
Figure 7. Daily average temperature for one year by month.
Energies 15 05161 g007
Figure 8. Time solution with different GAP in CBC and GUROBI solvers.
Energies 15 05161 g008
Figure 9. Energy correlating with ASC and LCOE.
Energies 15 05161 g009
Figure 10. Energy vc ASC and LCOE. (a) Energy vs. ASC; (b) Energy vs. LCOE.
Energies 15 05161 g010
Figure 11. LPSP objetive vs. LPSP result for some simulations.
Energies 15 05161 g011
Figure 12. Energy supplied to the load in a year. (a) PV-BESS-DG configuration; (b) PV-BESS configuration.
Energies 15 05161 g012
Figure 13. Energy supplied to the load in a day. (a) PV-BESS-DG configuration; (b) PV-BESS configuration.
Energies 15 05161 g013
Figure 14. Average energy to charge the BESS for PV-BESS-DG.
Energies 15 05161 g014
Figure 15. Average SoC of the BESS. (a) PV-BESS-DG configuration; (b) PV-BESS configuration.
Energies 15 05161 g015
Figure 16. Charging and discharging process of the BESS over a day. (a) PV-BESS-DG configuration; (b) PV-BESS configuration.
Energies 15 05161 g016
Table 1. Input parameters of the project.
InputSymbolValue
Lifetime of the project (years)R20
Loss of power supply probability (%) L P S P max 5
Real interest rate (%) i r 8.08
Cost of energy not supplied (USD/kWh) c e n s 0.7434
Tax reduction factor (%) ω 91.47
Years income tax (years) T 1 15
Years accelerated depreciation (years) T 2 10
Corporate tax income rate (%) τ 33
Table 2. Input parameters of the PV module.
InputSymbolValue
Maximum Power W p E p v s t c 300
Module Efficiency (%) η p v 18.33
N O C T ( ° C) N O C T 45
Price per kWh generated (USD/kWh) c p v 0.003
PV derating factor (%) f p v 85
O & M factor initial investment (%) ρ p v 1
Price per kW installed (USD/kW) c k i p v 1.5
Power Temperature Coefficient (%/ ° C) α p −0.39
Table 3. Input parameters of the BESS.
InputSymbolValue
Positive battery constant M b 0.01
Self-Discharge rate σ 0.2
Capacity Rate (h) C r a t e 5
Maximum depth of Discharge (%) D O D max 50
Maximum number of cycles c y c l e s max 3000
Price per kWh generated (USD/kWh) c b a t 0.12
Battery cell capacity (kW) E b a t c e l l 0.84
DC system voltage (V) V d c s i s t 48
Battery Voltage (V) V d c b c 2
Inverter efficiency (%) η i n v 95
O & M factor initial investment (%) ρ b a t 2
Factor initial capital cost invested (%) λ b a t 70
Lifecycle (years) L c b a t 10
Price per kWh installed (USD/kW) c k i b a t 144.5
Discharge efficiency (%) η d 100
load efficiency (%) η c 90
Number of batteries in parallel N b p 2
Table 4. Input parameters of the Diesel generator.
InputSymbolValue
DG Power (kW) P d g r a t e 10
Price per installed kWh (USD/kW) c k i d g 2041
Minimum ratio allowed P d g min 0.9
Diesel efficiency (%) η d g 100
Price per generated kWh (USD/kWh) c d g 0.22
Factor of the initial invested capital cost (%) λ d g 70
Specific consumption of fuel (gal/kWh) C E C 0.0974
Specific consumption of oil (gal/kWh) C E L 0.0005
Life-cycle (years) L c d g 10
Average price of oil (USD/gal) a l c 21.4
Average price of fuel (USD/gal) a f c 2.4
Table 5. Result of the study case.
ParameterUnitPV-BAT-DGPV-BAT
N p v Units190.00405.00
N b a t Units48.00120.00
N b a t p Units2.005.00
E b a t n kW40.32100.80
L C Number229.00116.30
P d g kW10.00-
C C p v USD85,500.00182,250.00
C C b a t USD5826.2414,565.60
C C d g USD20,411.00-
O & M p v USD/year855.001822.50
O & M b a t USD/year116.52291.31
O & M d g USD/year4002.99-
R C b a t USD2737.406843.50
R C d g USD9589.90-
L P S P %5.004.99
C R F %10.0010.00
P E N S kWh/year1823.301821.20
C o s t E N S USD/year1355.441353.93
A S C USD/year17,016.7422,479.72
L C O E USD/kWh0.540.84
δ A S C USD/year16,237.7320,800.89
δ L C O E USD/kWh0.510.78
A v g T i m e W P E N S Hours1921
Publisher’s Note: MDPI stays neutral with regard to jurisdictional claims in published maps and institutional affiliations.

