
Natural Ventilation and Aerosol Particles Dispersion Indoors


1
IMT Nord Europe, Institut Mines-Télécom, University of Lille, Centre for Energy and Environment, F-59000 Lille, France
2
Medical School, University of Nicosia, Nicosia CY-2417, Cyprus
*
Authors to whom correspondence should be addressed.
Energies 2022, 15(14), 5101; https://doi.org/10.3390/en15145101
Submission received: 27 May 2022
/
Revised: 3 July 2022
/
Accepted: 11 July 2022
/
Published: 13 July 2022
(This article belongs to the Special Issue Computational Fluid Dynamics (CFD) 2021)
Abstract
:Aerosol pollutant particles indoors significantly affect public health. The conventional wisdom is that natural ventilation will alleviate the dispersion of airborne or aerosol particles. However, we show that the problem is far more complex and that natural ventilation should be applied under specific conditions to be effective. We performed several simulations of a simplified (and easily reproducible) room with a window opening and aerosol particles stratified layers. Opening a window can scatter particles present in stratified layers indoors and potentially contribute to the degradation of indoor air quality for a significant period of time. Moreover, we show that thermal instabilities arising from the temperature gradients due to temperature differences between the indoor and outdoor environment spread the particles randomly indoors, adversely affecting air quality and architectural design. Recommendations for more efficient natural ventilation minimizing aerosol pollutant particles dispersed indoors are provided.
1. Introduction
Computational fluid dynamics (CFD) has become a standard method in aerosol transport and deposition simulation. Indicative examples from the recent literature include Francesco et al.’s [1] investigation of multispecies aerosol using sectional and moment methods through CFD and Janoszek et al.’s [2] simulations of aerosol flow in ventilation underground to quantify its effect on COVID-19 transmission. New assessment methods for the impact of outdoor particulate matter on indoor air quality have also been developed [3]. Past studies used CFD to simulate the turbulent flow behaviour of aerosol media [3,4,5], including simulations to understand better aerosols transport and deposition from both an environmental and medical point of view, e.g., deposits in an anatomically based human large-medium airway model [6,7]. Scientists also found that there is a correlation between mortality in humans, the incidence of disease and the mass concentration of hazard particulate matter such as suspended , and particles [3].
The COVID-19 pandemic led many researchers to investigate research on airborne particle transmission, such as their spreading and control by ventilation techniques in indoor-built environments. For example, Dbouk and Drikakis [8,9,10,11] applied CFD in conjunction with new theoretical models for the unsteady heat and mass transfer evaporation to investigate the transport of COVID particles, indoors and outdoors; environmental factors affecting the particles evaporation and transmission; and the incorporation of CFD in epidemiological models. Other studies focused on the control methods against the spreading of the coronavirus [12,13,14]; the impact of different parameters on the virus transmission and infection rate (such as the ventilation design and ventilation type) [15,16,17,18]; and the prediction of indoor air pollutants [19,20].
Concerning ventilation, Motamedi et al. [21] investigated numerically airborne particle transmission of COVID-19 in confined spaces under different ventilation scenarios: cross-, single- (SV), mechanical- and no-ventilation (NV). Their results suggested that SV has the highest infection probability, while both SV and NV result in higher dispersions of airborne pathogens inside a room. Chen et al. [22] put forward recommendations for ventilation of indoor spaces to reduce COVID-19 transmission. Che et al. [23] proposed airflow deflectors of external windows to induce ventilation, thus providing some means of COVID-19 prevention and control. Ding et al. [12] studied the contagion events in enclosed spaces and the engineering control of contaminant aerosol particles spread using ventilation systems in health care facilities and public vehicles. Finally, Gil-Baez et al. 2021 [24] investigated the natural ventilation in classrooms to achieve healthy schools in the Mediterranean region under mild climate conditions. To identify adequate natural ventilation strategies, they evaluated indoor CO2, TVOCs, PM 2.5 and PM 10, concentration profiles as a function of indoor temperature, relative humidity, and the human occupation rates. They showed that the indoor local concentrations are usually related to the ventilation actions, the occupation rates, and the metabolism of the indoor occupants.
In other relevant studies, Janoszek et al. [2] applied CFD to the ventilation of a selected section of an underground excavation (the ventilation network of the Experimental Mine Barbara of the Central Mining Institute). Monge-Barrio et al. [25] studied natural ventilation to enhance indoor environmental conditions at schools in the north of Spain before and during COVID-19. They did surveys in nine schools, including detailed monitoring of one building during both ’heating seasons’ regarding the COVID transmission (March 2020, January 2021). They proposed using mechanical ventilation with heating recovery to complement natural ventilation techniques during the year’s coldest months. Pourfattah et al. [26] conducted a state-of-the-art review on the challenges in modelling and simulation of minimal particle dispersion such as airborne viruses or aerosols. Furthermore, researchers investigated the effect of natural ventilation and air circulation on various different scenarios of indoor airborne virus transmission [10,27,28,29,30], including the effect of air purifiers [10]. Park et al. 2021 [31] proposed natural ventilation strategies to prevent coronavirus transmission inside a school building.
Despite all the above research, the information is still sparse and incomplete regarding the quantitative effects of natural ventilation on indoor aerosol particle dispersion. Ventilation is used to refresh air indoors and reduce the indoor aerosol pollutant particle concentration through fresh air circulation between indoors and outdoors. Therefore, airing is vital to lessen the hazard of aerosol pollutant particles and thus enhancement of indoor air quality. Natural ventilation or airing could be achieved by opening windows or outside entryways, permitting fast refreshment. WHO [11], and other national agencies like the United States Environmental Protection Agency (US-EPA) [32], provided recommendations on improving and ensuring good indoor ventilation to enhance the air quality.
Current practice in residential and non-residential places ignores some simple fluid dynamic effects of natural ventilation, such as local flow recirculation, adversely affecting indoor aerosol particles. This study focuses on the aerosol particle circulation behaviour in an indoor space induced by natural ventilation from an opened window. We present simulation results showing how a stratified layer of aerosol pollutant particles in a room disperses indoors due to natural ventilation from an opened window. Moreover, we offer interesting fluid dynamic effects of flow bifurcation due to heat convection leading to asymmetric flow despite perfectly symmetric conditions. Architects, engineers, and environmental agencies must consider these flow phenomena when designing residential and non-residential buildings and health facilities to enhance fresh air circulation and indoor air quality.
2. Computational Methodology and Problem Setup
We have used the multiphase computational fluid dynamics (CFD) platform developed under OpenFOAM® by Dbouk and Drikakis 2020, 2021 [8,9,10]. This platform is employed to investigate natural ventilation and its effect on aerosol pollutant particles transported indoors. Figure 1 shows the computational domain, including the initial and boundary conditions.
Indoor ventilation depends on many architectural design parameters and the ventilation system used. Therefore, we aim to focus on a generic, simplified and easily reproducible space that other researchers and engineers can use to investigate indoor aerosol particle transport. In this investigation, we assume a stratified layer of 3108 aerosol particles (each about 0.15 μm in diameter) between m and m as a worst-case scenario of the presence of indoor pollutant particulate matter. Aerosol particulate matter, less than 1 μm in diameter, are considered dangerous to the human respiratory system. Therefore, as a challenging scenario, a stratified layer of particles is initially placed as a rectangular layer of aerosol particles uniformly distributed in the indoor space or the room (room dimensions: Height m, Length m and Width m). We investigate the case of an opened window (see Figure 1), where the indoor temperature is °C, and the outdoor temperature is °C. A mean temperature value °C is assumed and imposed as a boundary condition, a mutual indoor-outdoor thermal equilibrium at the interface. Outside the room, we consider two scenarios for comparison purposes:
- i.
- Natural ventilation due to thermal convection at negligible outdoor wind speed ( km/h), and
- ii.
- Natural ventilation due to thermal convection at a low wind speed of km/h.
Both wind speeds outdoors are imposed as a freestream boundary condition parallel to the window’s surface which has a m2 opening area (see Figure 1). The window’s minimum height is placed at a vertical distance of m above the ground (). The indoor air circulation is assumed to be negligible (). Therefore, indoor and outdoor spaces are at an atmospheric pressure condition. Even when inside the room, natural ventilation will occur due to thermal convection induced by thermal gradients between the outdoor and the indoor spaces.
We employed a hexahedral uniform mesh and conducted a mesh sensitivity analysis. We examined the velocity field, U, temperature, T, and pressure, P, using the mesh convergence criterion by Celik et al. 2008 [33], and found that a mesh of one million cells comprising 20 cells per meter provides a reasonable approach between accuracy and computational cost within an error threshold of about 6%.
Transient simulations were conducted over a physical time of 75 s. Turbulence effects were considered in the framework of the -SST model. The Reynolds number is defined as and is estimated and found to be around for km/h and m (the hydraulic diameter of the opened window). is the kinematic viscosity of the indoor air at °C.
Each CFD simulation required about five days using a machine with eight intel CPUs in parallel (8 GB of DDRAM) and employing a dynamic time step with a CFL condition (Courant–Friedrichs–Lewy) limited to 0.1.
3. Flow Behaviour and Aerosol Particle Transport
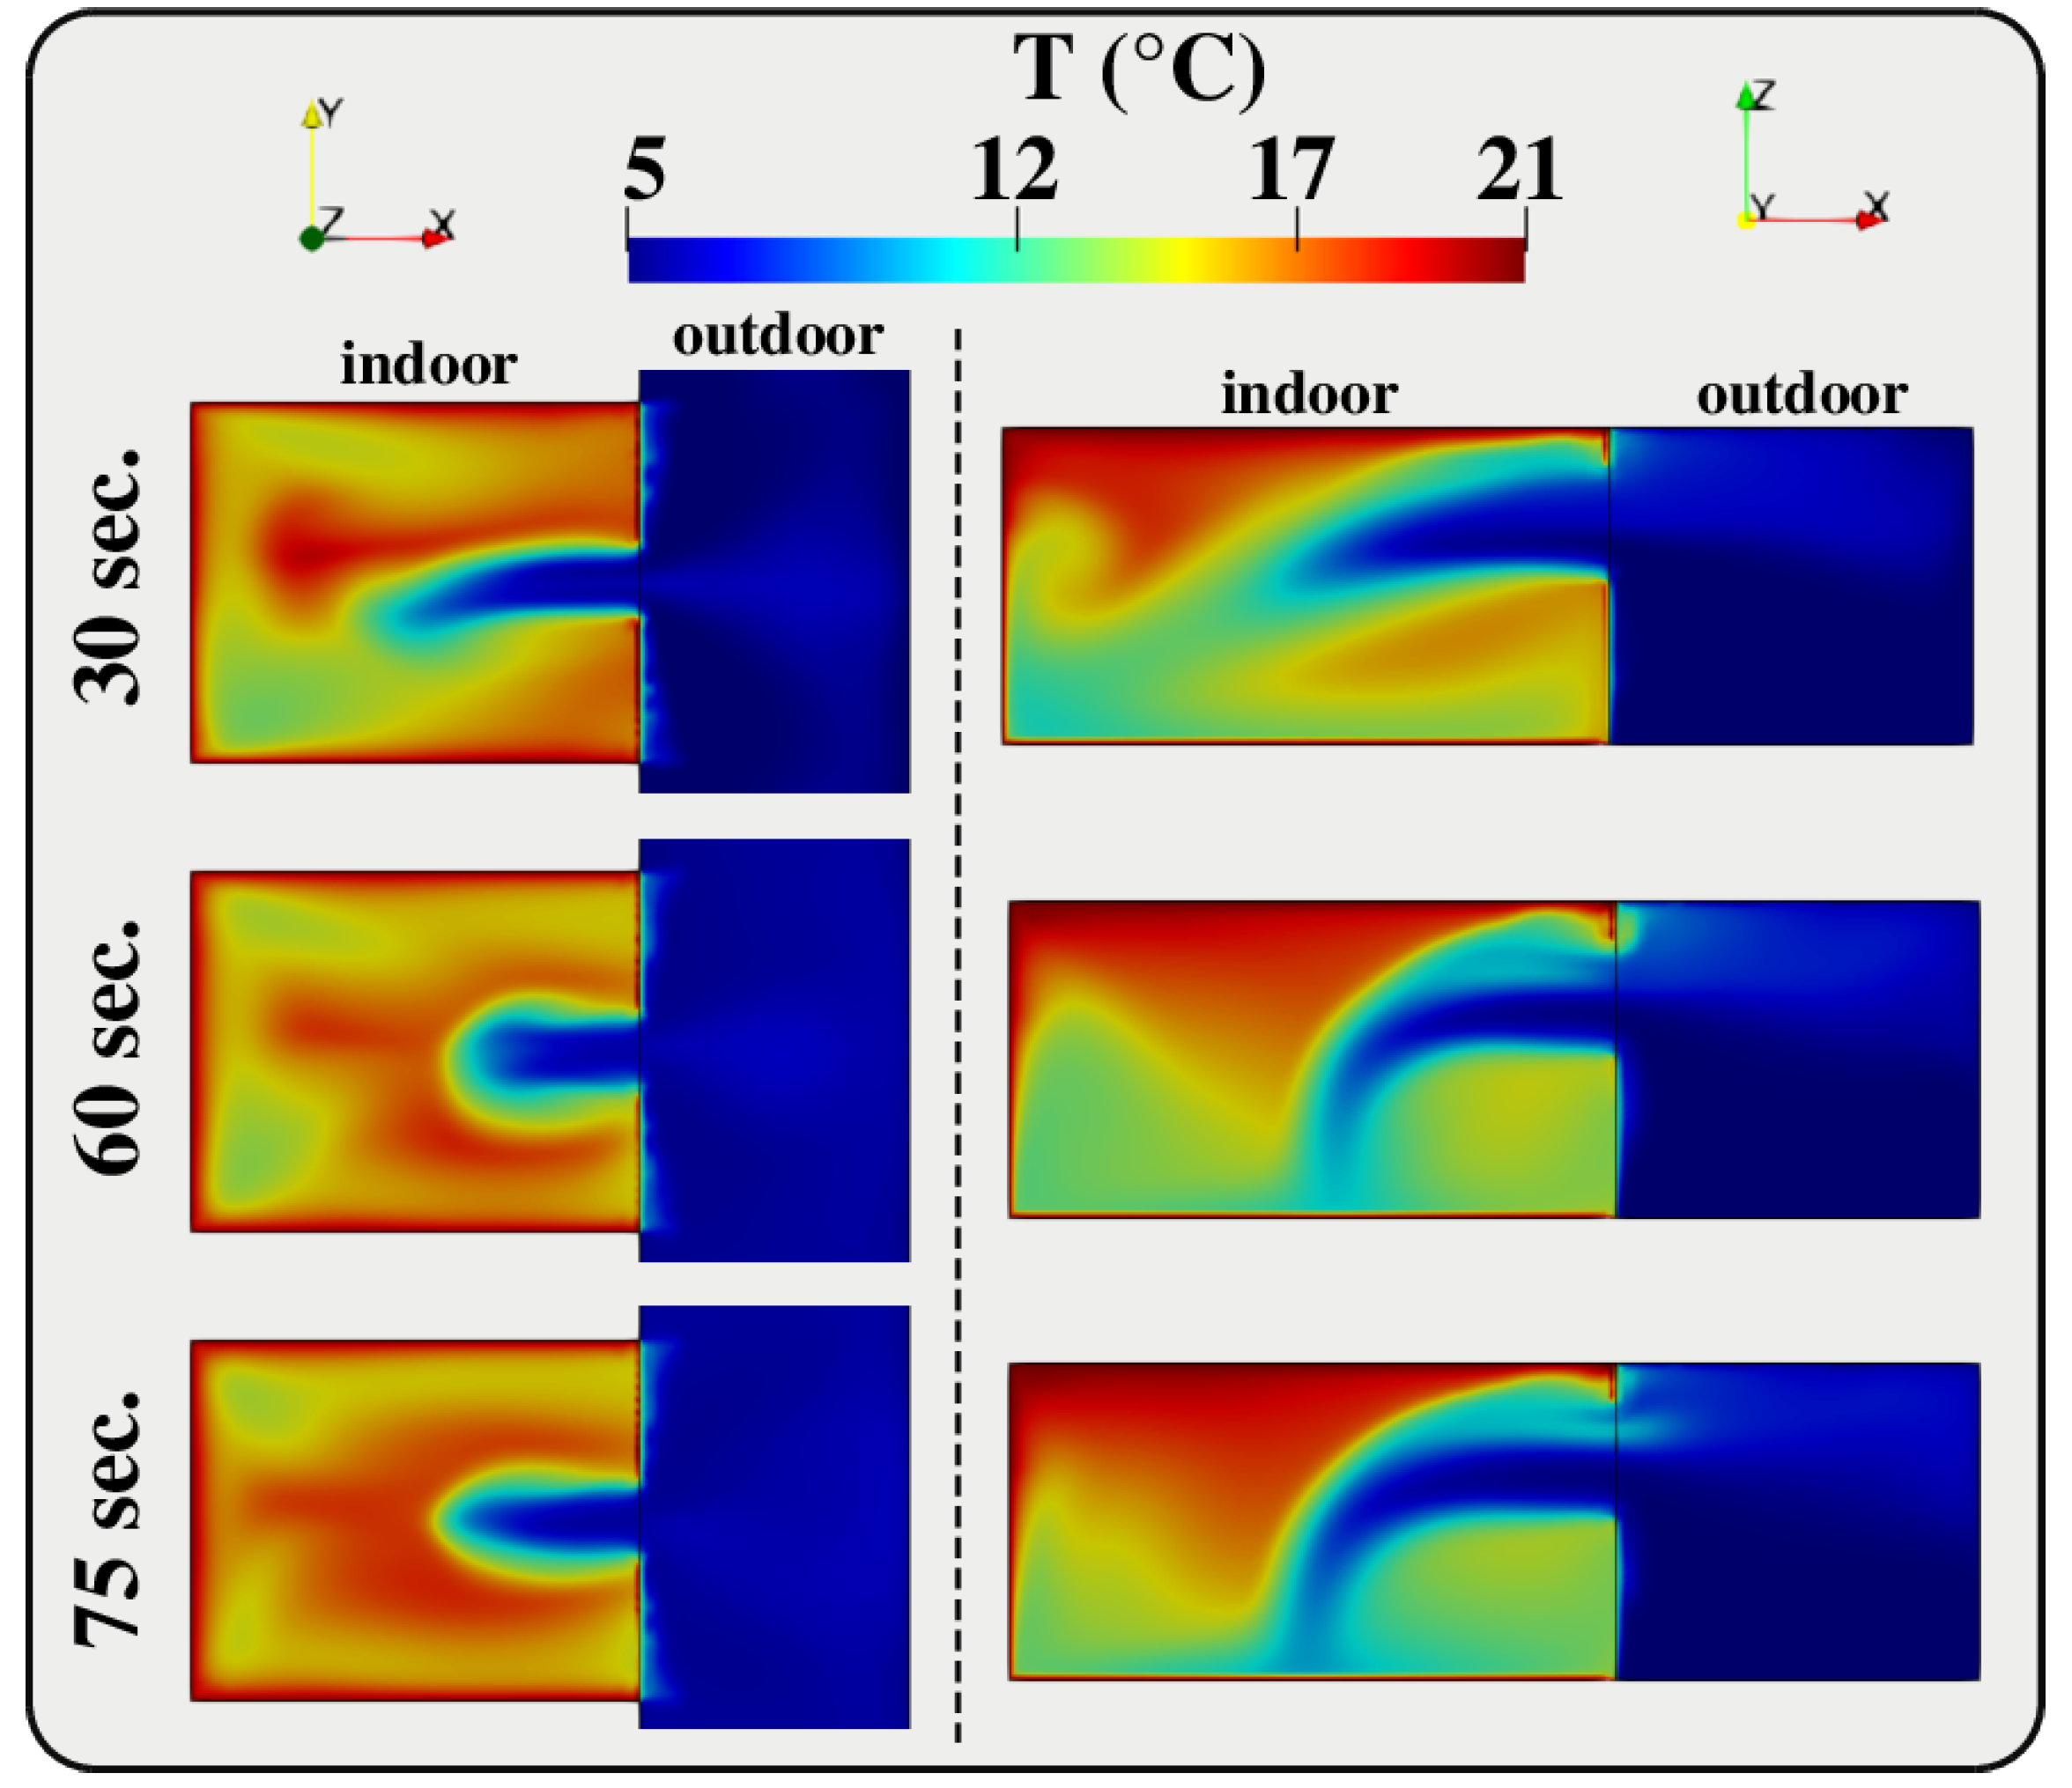
The flow physics is illustrated in Figure 2 for the case of natural ventilation with a negligible wind speed outdoors . A lower outdoor temperature, assuming a walls-particles-interaction of type (henceforth labelled) unstick, i.e., a very slight rebound effect when an aerosol particle impacts the surface of a wall. We consider this the worst-case scenario (winter season) of suspended pollutant aerosol particles in the air in the presence of physical boundaries (e.g., walls). At s (Figure 2), the colder fluid enters the room throughout the opened window; see the streaklines close and perpendicular to the window at about 4 km/h. Despite the symmetry of the problem, we observe an airflow instability around the opened vertical window. The air accelerates from the outdoor to the indoor space. The colder air ends at the ground at s and s; see the right-hand side column of Figure 2, where one can observe the increasing bending behaviour of the streamlines from the window towards the ground. The flow instability around the opened window is also seen in Figure 3 in terms of the indoor-outdoor temperature field distribution at s, s and s.
The indoor air circulation is shown in Figure 4 for the case of outdoor wind speed km/h and a lower outdoor temperature (see Figure 1). We assume a walls-particles-interaction of type (henceforth labelled) stick, i.e., this could potentially be the ‘best-case’ scenario, where some aerosol particles attach to the physical boundaries (e.g., walls) at first contact. When an outdoor freestream is imposed parallel to the opened window’s surface, an internal airflow occurs at an angle of about 45° to an axis perpendicular to the window; see the streaklines on the left-hand side column of Figure 4 and the local temperature field of Figure 5.
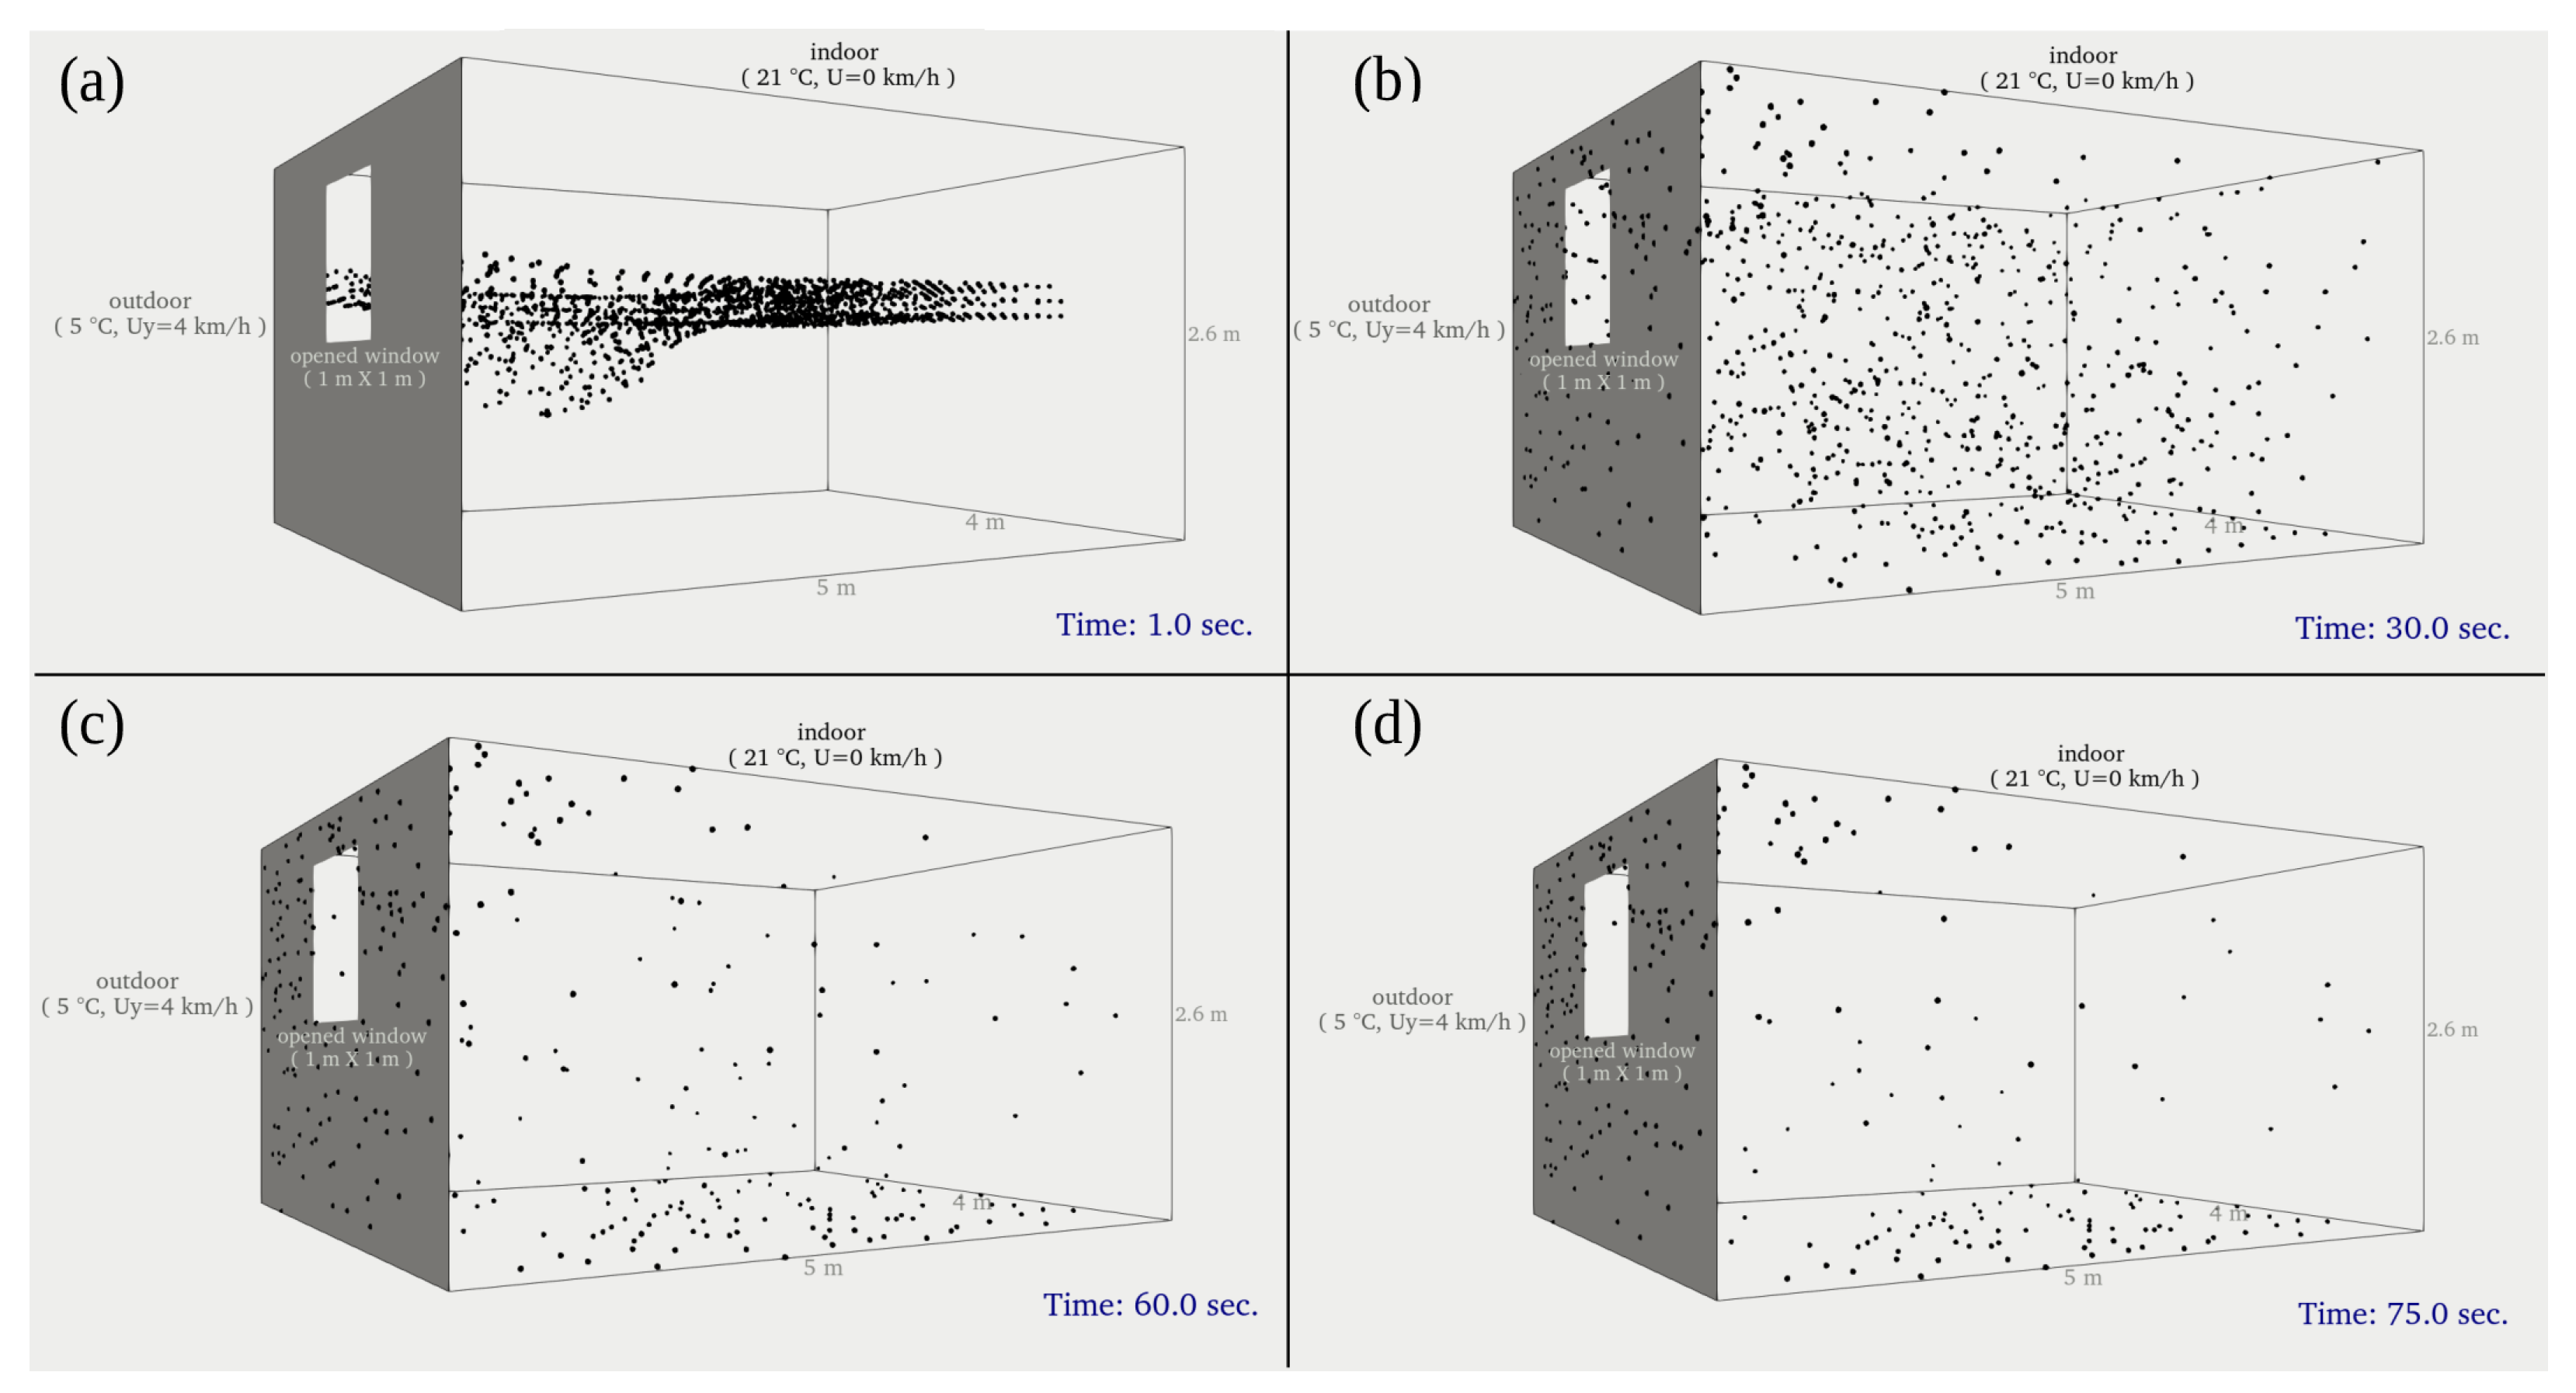
We also investigated the dispersion of aerosol particles indoor-outdoor due to natural ventilation. Figure 6 (see also the Supplementary Materials Video S1) shows the local dispersion of the initially stratified layer of 3108 aerosol particles due to natural ventilation as a function of time. The results of Figure 6 correspond to the case of negligible wind speed outdoors and a walls-particles-interaction of type unstick. Opening a window induces natural ventilation or natural convection, leading to local dispersion of the aerosol particles inside the room (Figure 6). The above could increase airborne aerosol transmission indoors. Figure 6 also shows that a few number of aerosol particles escape the window e.g., see Figure 6c,d.
For natural ventilation due to a low outdoor wind speed at km/h and a low outdoor temperature, we present the local dispersion of aerosol particles in Figure 7 (see the Supplementary Materials Video S2) at different time instants. Opening a window in the presence of human activity, such as new individuals entering a room that other infected individuals have occupied, may increase the risk of airborne aerosol transmission in the indoor space.
We also investigated the ‘best-case’ scenario of reducing indoor airborne aerosol transmission. Figure 8 (see the Supplementary Materials Video S3) shows the results of natural ventilation due to a low wind speed outdoors km/h and a wall-particles-interaction of type stick. The stick condition allows the removal of aerosol particles from the indoor space at the first particles-to-wall contact [34]. The indoor aerosol particles suspended in the room (see Figure 8 and Supplementary Materials) are very well reduced at s with the majority stuck to the surrounding walls without any re-suspension or rebounding back into the indoor space.
We computed the reduction of the total number of aerosol particles suspended inside the room, i.e., a percentage value reduction of the initial number of aerosol particles of the initially stratified layer.
In the case of natural ventilation at an outdoor wind speed of km/h, Figure 9 shows that more than 95% of the initial aerosol particles are still suspended in the indoor space after 75 s, with a slow rate of decrease (a slope of −0.03). In this case (dashed line in Figure 9), assuming linear reduction with time, 3108 aerosol particles would require about one hour to be removed entirely by natural ventilation induced by a low wind speed outdoors. This means that indoor natural ventilation, e.g., opening a window, should not be applied in inhabited indoor spaces, considering that the average time of viral infection is of the order of 15 min, i.e., being within 6 feet of infectious persons for consecutive minutes [35]. Therefore, indoor natural ventilation can be helpful if applied appropriately under specific conditions, such as in an uninhabited indoor space for a longer time without individuals indoors.
Removing the indoor suspended aerosol particles is more difficult in the case of natural ventilation at a zero wind speed outdoors (); see square symbols in Figure 9. The reduction slope is about −0.0068. The above implies that we need about 4 h to remove the initial 3108 aerosol particles suspended in the room.
Without ventilation (solid line with triangle symbols in Figure 9), the aerosol particles will suspend for about 2.8 days before settling to the ground (from m to ). The slope of particle reduction is −0.00041. Note that this slope also depends on the walls-particles type of interaction that, in turn, depends on the particles’ properties and the wall-surface microstructures left for further investigations. The present simulations (Figure 9) provide a quantitative measure for indoor aerosol particle transport under different scenarios of natural ventilation, such as opening a window.
4. Conclusions
Public authorities recommend people open their windows to reduce the number of aerosol pollutant particles indoors through natural ventilation. However, the present research showed that opening a window can disperse stratified layers of aerosol pollutants indoors for significant periods. This sudden local dispersion of aerosol particles or contaminants can, thus, contribute to inhaling dangerous aerosol pollutant particulate matter under indoor human activity in a built environment. Therefore, we provide the following recommendations:
Natural ventilation can be helpful when we open a window and leave the indoor space uninhabited for a period that allows the complete evacuation of residual aerosol dangerous particles suspended in the indoor air. Applying natural ventilation should consider the following findings:
- For a modest wind speed of airing, 95% of the aerosol particles remain suspended indoors after 75 s, decreasing slowly (slope of −0.03). Removing the particles would need about one hour (for an initial allocation of 3108 aerosol particles).
- Using natural ventilation, we need about 4 h to remove the initial aerosol particles suspended in the room.
- Additionally, considering the average time of viral infection (about 15 min), we should focus on better controlling the spread of hazardous aerosol particulate matter in indoor spaces.
Future research will consider applications in different built-in environments to specialise the above conclusions and provide tailored recommendations for more effective control of virus (and particulates in general) transmission.
Supplementary Materials
The following supporting information can be downloaded at: https://www.mdpi.com/article/10.3390/en15145101/s1, Supplementary Videos S1–S3.
Author Contributions
Conceptualization, T.D. and D.D.; methodology, T.D. and D.D.; software, T.D.; computations, T.D.; formal analysis, T.D. and D.D.; investigation, T.D. and D.D.; resources, T.D. and D.D.; writing—original draft preparation, T.D.; writing—review and editing, T.D. and D.D.; visualization, T.D.; supervision, D.D.; project administration, D.D. and T.D. All authors have read and agreed to the published version of the manuscript.
Funding
This research received no external funding.
Institutional Review Board Statement
Not applicable.
Informed Consent Statement
Not applicable.
Data Availability Statement
Data is available upon request from the authors.
Conflicts of Interest
The authors declare no conflict of interest.
References
- Lucci, F.; Frederix, E.; Kuczaj, A.K. AeroSolved: Computational fluid dynamics modeling of multispecies aerosol flows with sectional and moment methods. J. Aerosol Sci. 2022, 159, 105854. [Google Scholar] [CrossRef]
- Janoszek, T.; Lubosik, Z.; Świerczek, L.; Walentek, A.; Jaroszewicz, J. Experimental and CFD Simulations of the Aerosol Flow in the Air Ventilating the Underground Excavation in Terms of SARS-CoV-2 Transmission. Energies 2021, 14, 4743. [Google Scholar] [CrossRef]
- Bekierski, D.; Kostyrko, K.B. The Influence of Outdoor Particulate Matter PM2.5 on Indoor Air Quality: The Implementation of a New Assessment Method. Energies 2021, 14, 6230. [Google Scholar] [CrossRef]
- Sal, R.; Cole, M.; Bobbi, M. Lagrangian 3D CFD Simulation of Turbulent Aerosol Experiments. Trans. Am. Nucl. Soc. 2016, 115, 755–758. [Google Scholar]
- Mead-Hunter, R.; King, A.J.; Kasper, G.; Mullins, B.J. Computational fluid dynamics (CFD) simulation of liquid aerosol coalescing filters. J. Aerosol Sci. 2013, 61, 36–49. [Google Scholar] [CrossRef]
- Yingjie TANG, B.G. Computational fluid dynamics simulation of aerosol transport and deposition. Front. Environ. Sci. Eng. 2011, 5, 362. [Google Scholar] [CrossRef]
- Baoshun Ma, K.R.L. CFD simulation of aerosol deposition in an anatomically based human large-medium airway model. Ann. Biomed. Eng. 2009, 37, 271–285. [Google Scholar] [CrossRef]
- Dbouk, T.; Drikakis, D. Weather impact on airborne coronavirus survival. Phys. Fluids 2020, 32, 093312. [Google Scholar] [CrossRef]
- Dbouk, T.; Drikakis, D. On pollen and airborne virus transmission. Phys. Fluids 2021, 33, 063313. [Google Scholar] [CrossRef]
- Dbouk, T.; Roger, F.; Drikakis, D. Reducing indoor virus transmission using air purifiers. Phys. Fluids 2021, 33, 103301. [Google Scholar] [CrossRef]
- WHO. World Health Organization. Coronavirus Disease (COVID-19): Ventilation and Air Conditioning. Available online: https://www.who.int/news-room/questions-and-answers/item/coronavirus-disease-COVID-19-ventilation-and-air-conditioning (accessed on 24 December 2021).
- Ding, J.; Yu, C.W.; Cao, S.J. HVAC systems for environmental control to minimize the COVID-19 infection. Indoor Built Environ. 2020, 29, 1195–1201. [Google Scholar] [CrossRef]
- Xu, C.; Luo, X.; Yu, C.; Cao, S.J. The 2019-nCoV epidemic control strategies and future challenges of building healthy smart cities. Indoor Built Environ. 2020, 29, 639–644. [Google Scholar] [CrossRef] [Green Version]
- Chow, W.K.; Chow, C.L. A proposed two-stage quarantine containment scheme against spreading of novel coronavirus (SARS-CoV-2). Indoor Built Environ. 2020, 31, 1202–1209. [Google Scholar] [CrossRef]
- Van-Dijken, F.; Boerstra, A. Implications of COVID-19 pandemic for application of natural ventilation. REHVA J. 2021, 3, 58–63. [Google Scholar]
- Singh, R. Architect’s Role in Airborne Infection Control Through Ventilation Design. IndiaRxiv 2020. [Google Scholar] [CrossRef]
- Foster, A.; Kinzel, M. SARS-CoV-2 transmission in classroom settings: Effects of mitigation, age, and Delta variant. Phys. Fluids 2021, 33, 113311. [Google Scholar] [CrossRef] [PubMed]
- Foster, A.; Kinzel, M. Estimating COVID-19 exposure in a classroom setting: A comparison between mathematical and numerical models. Phys. Fluids 2021, 33, 021904. [Google Scholar] [CrossRef]
- Kim, J.; Hong, Y.; Seong, N.; Kim, D.D. Assessment of ANN Algorithms for the Concentration Prediction of Indoor Air Pollutants in Child Daycare Centers. Energies 2022, 15, 2654. [Google Scholar] [CrossRef]
- Borowski, M.; Zwolińska, K.; Czerwiński, M. An Experimental Study of Thermal Comfort and Indoor Air Quality- A Case Study of a Hotel Building. Energies 2022, 15, 2026. [Google Scholar] [CrossRef]
- Motamedi, H.; Shirzadi, M.; Tominaga, Y.; Mirzaei, P.A. CFD modeling of airborne pathogen transmission of COVID-19 in confined spaces under different ventilation strategies. Sustain. Cities Soc. 2022, 76, 103397. [Google Scholar] [CrossRef]
- Chen, C.Y.; Chen, P.H.; Chen, J.K.; Su, T.C. Recommendations for ventilation of indoor spaces to reduce COVID-19 transmission. J. Formos. Med. Assoc. 2021, 120, 2055–2060. [Google Scholar] [CrossRef] [PubMed]
- Che, W.; Ding, J.; Li, L. Airflow deflectors of external windows to induce ventilation: Towards COVID-19 prevention and control. Sustain. Cities Soc. 2021, 77, 103548. [Google Scholar] [CrossRef] [PubMed]
- Gil-Baez, M.; Lizana, J.; Becerra Villanueva, J.; Molina-Huelva, M.; Serrano-Jimenez, A.; Chacartegui, R. Natural ventilation in classrooms for healthy schools in the COVID era in Mediterranean climate. Build. Environ. 2021, 206, 108345. [Google Scholar] [CrossRef]
- Monge-Barrio, A.; Bes-Rastrollo, M.; Dorregaray-Oyaregui, S.; González-Martínez, P.; Martin-Calvo, N.; López-Hernández, D.; Arriazu-Ramos, A.; Sánchez-Ostiz, A. Encouraging natural ventilation to improve indoor environmental conditions at schools. Case studies in the north of Spain before and during COVID. Energy Build. 2022, 254, 111567. [Google Scholar] [CrossRef]
- Pourfattah, F.; Wang, L.P.; Deng, W.; Ma, Y.F.; Hu, L.; Yang, B. Challenges in simulating and modeling the airborne virus transmission: A state-of-the-art review. Phys. Fluids 2021, 33, 101302. [Google Scholar] [CrossRef]
- Atkinson, J.; Chartier, Y.; Pessoa-Silva, C.; Jensen, P.; Li, Y.; Seto, W. Natural Ventilation for Infection Control in Health-Care Settings; World Health Organization: Geneva, Switzerland, 2009. [Google Scholar]
- Peng, N.N.; Chow, K.W.; Liu, C.H. Computational study on the transmission of the SARS-CoV-2 virus through aerosol in an elevator cabin: Effect of the ventilation system. Phys. Fluids 2021, 33, 103325. [Google Scholar] [CrossRef]
- Narayanan, S.R.; Yang, S. Airborne transmission of virus-laden aerosols inside a music classroom: Effects of portable purifiers and aerosol injection rates. Phys. Fluids 2021, 33, 033307. [Google Scholar] [CrossRef]
- Sinha, K.; Yadav, M.S.; Verma, U.; Murallidharan, J.S.; Kumar, V. Effect of recirculation zones on the ventilation of a public washroom. Phys. Fluids 2021, 33, 117101. [Google Scholar] [CrossRef]
- Park, S.; Choi, Y.; Song, D.; Kim, E.K. Natural ventilation strategy and related issues to prevent coronavirus disease 2019 (COVID-19) airborne transmission in a school building. Sci. Total Environ. 2021, 789, 147764. [Google Scholar] [CrossRef]
- United States Environmental Protection Agency (US-EPA). Indoor Air in Homes and Coronavirus (COVID-19). Available online: https://www.epa.gov/coronavirus/indoor-air-homes-and-coronavirus-COVID-19 (accessed on 24 December 2021).
- Celik, I.B.; Ghia, U.; Roache, P.J.; Freitas, C.J. Procedure for Estimation and Reporting of Uncertainty Due to Discretization in CFD Applications. J. Fluids Eng. 2008, 130, 078001. [Google Scholar] [CrossRef] [Green Version]
- Chatterjee, S.; Murallidharan, J.S.; Agrawal, A.; Bhardwaj, R. Why coronavirus survives longer on impermeable than porous surfaces. Phys. Fluids 2021, 33, 021701. [Google Scholar] [CrossRef] [PubMed]
- Julia, P.; Jillian, L.; Sue, R.K.; Benjamin, W.; Samuel, S.; Heidi, F.; Shannon, M.; Patsy, K.; Natalie, K. COVID-19 in a Correctional Facility Employee Following Multiple Brief Exposures to Persons with COVID-19. MMWR Morb. Mortal. Wkly. Rep. 2020, 69, 1569–1570. [Google Scholar] [CrossRef]
Figure 1.
Natural ventilation between an indoor (room) and outdoor space. The boundary and initial conditions show a room of height m, length m and width m. Outside the room the freestream velocity (low wind speed km/h) is parallel to the window’s surface m2. The window’s minimum height is placed at a vertical distance of m above the ground (). The air circulation indoors is assumed to be negligible () initially. At the temperature indoors is °C and outdoors is °C. Both the indoor and outdoor spaces are at atmospheric pressure .

Figure 2.
Streaklines indoors at different times coloured by the velocity magnitudes. Case: Natural ventilation due to a negligible wind speed outdoors and a lower outdoor temperature, walls-particles-interaction: unstick. Left hand side Column: XY-plane perspective view; Right hand side Column: XZ-plane perspective view.

Figure 3.
Indoor-outdoor temperature field. Case: Natural ventilation due to a negligible wind speed outdoors and a lower outdoor temperature, walls-particles-interaction: unstick. Left hand side Column: XY-plane perspective view; Right hand side Column: XZ-plane perspective view.
Figure 3.
Indoor-outdoor temperature field. Case: Natural ventilation due to a negligible wind speed outdoors and a lower outdoor temperature, walls-particles-interaction: unstick. Left hand side Column: XY-plane perspective view; Right hand side Column: XZ-plane perspective view.

Figure 4.
Indoor streaklines at different times coloured by the velocity magnitudes, and showing the window and the velocity vectors directions. Case: Natural ventilation due to a low wind speed outdoors km/h and a lower outdoor temperature, walls-particles-interaction: stick. Left hand side Column: XY-plane perspective view; Right-hand side Column: XZ-plane perspective view.

Figure 5.
Indoor-outdoor temperature field. Case: Natural ventilation due to a low wind speed outdoors km/h and a lower outdoor temperature, walls-particles-interaction: stick. Left hand side Column: XY-plane perspective view; Right-hand side Column: XZ-plane perspective view.
Figure 5.
Indoor-outdoor temperature field. Case: Natural ventilation due to a low wind speed outdoors km/h and a lower outdoor temperature, walls-particles-interaction: stick. Left hand side Column: XY-plane perspective view; Right-hand side Column: XZ-plane perspective view.

Figure 6.
Local dispersion of aerosol particles indoor-outdoor. Case: Natural ventilation due to a negligible wind speed outdoors and a lower outdoor temperature, walls-particles-interaction: unstick. (a) s shows the initially stratified layer of 3108 aerosol particles (0.15 μm in diameter) placed between m and m; (b) s; (c) s; (d) s. See the Supplementary Materials Video S1.

Figure 7.
Local dispersion of aerosol particles indoor-outdoor. Case: Natural ventilation due to a low wind speed outdoors km/h and a lower outdoor temperature, walls-particles-interaction: unstick. (a) s showing the initially stratified layer of 3108 aerosol particles (0.15 μm in diameter) placed between m and m; (b) s; (c) s; (d) s. See the Supplementary Materials Video S2.

Figure 8.
Local dispersion of aerosol particles indoor-outdoor. Case: Natural ventilation due to a low wind speed outdoors km/h and a lower outdoor temperature, walls-particles-interaction: stick. (a) s showing the initially stratified layer of 3108 aerosol particles (0.15 μm in diameter) placed between m and m; (b) s; (c) s; (d) s. See the Supplementary Materials Video S3.

Figure 9.
The percentage of aerosol pollutant particles remaining in the room as a function of time. A dashed line with diamond symbols: Case of natural ventilation due to thermal convection at low outdoor wind speed km/h (slope = −0.03). The dotted line with square symbols: Case of natural ventilation due to thermal convection at negligible outdoor wind speed (slope = −0.0068). Solid line with triangle symbols: Without natural ventilation, particles settle due to gravitational forces (slope = −0.00041). Walls-particles-interaction: unstick (worst case scenario of aerosol particles transport).

Publisher’s Note: MDPI stays neutral with regard to jurisdictional claims in published maps and institutional affiliations. |
© 2022 by the authors. Licensee MDPI, Basel, Switzerland. This article is an open access article distributed under the terms and conditions of the Creative Commons Attribution (CC BY) license (https://creativecommons.org/licenses/by/4.0/).
Share and Cite
MDPI and ACS Style
Dbouk, T.; Drikakis, D. Natural Ventilation and Aerosol Particles Dispersion Indoors. Energies 2022, 15, 5101. https://doi.org/10.3390/en15145101
AMA Style
Dbouk T, Drikakis D. Natural Ventilation and Aerosol Particles Dispersion Indoors. Energies. 2022; 15(14):5101. https://doi.org/10.3390/en15145101
Chicago/Turabian StyleDbouk, Talib, and Dimitris Drikakis. 2022. "Natural Ventilation and Aerosol Particles Dispersion Indoors" Energies 15, no. 14: 5101. https://doi.org/10.3390/en15145101
Note that from the first issue of 2016, this journal uses article numbers instead of page numbers. See further details here.