1. Introduction
As the impact of climate change on our environment is getting worse day by day, regulations to achieve a reduction in greenhouse gas emissions are strengthened continuously. The Cogeneration System (CGS) has been applied in various fields, including the building sector, due to the advantage of relative primary energy savings (RPES) against separate heat and power (SHP), regarded as an effective measure to cope with climate change [
1,
2,
3,
4]. However, there is also a skeptical view on the role of the CGS in the coming era of climate change. Compared to SHP, the CGS has a superior position in terms of primary energy savings. However, it cannot be denied that no matter how efficient it is, it inevitably emits significant amounts of greenhouse gases in proportion to the amount of fuel consumed. In other words, the CGS is a well-proven technology that is superior to SHP in terms of primary energy savings, and is relatively eco-friendly. However, compared to renewable energy technologies, this is absolutely not the case. Nevertheless, CGS is expected to serve as a bridge technology to fill the gap until renewable energy technology can secure economic competitiveness in the market.
As in the case of the CGS, many studies have been conducted on the evaluation of the RPES performance of the TGS model [
5,
6,
7], and practical guides for evaluating RPES for the CGS or TGS can be found without difficulty in the literature [
8,
9]. However, unlike the CGS, the TGS model requires more attention to RPES evaluation in that, from the perspective of the first law of thermodynamics, the thermal efficiency of the TGS model cannot be lower than that of the CGS model in proportion to the amount of surplus heat used for the operation of the heat-driven cooler [
10]. This is absolutely true in terms of system efficiency at rated conditions, but it could be a completely different story in terms of operational efficiency. For example, G. Ciampi et al. [
11] investigated the energy performance of a micro-cogeneration device integrated with a multifamily, and it was demonstrated that the operational performance of PES under electrical load tracing operation always ends up negative. Additional considerations for heat-driven cooling in the cogeneration mode complicate the RPES evaluation of TGS models compared to the CGS [
12,
13]. For instance, A. M. Pantaleo et al. [
12] performed an energy performance and thermo-economic assessment of a small-scale (100 kWe) combined cooling, heat, and power (CCHP) plant in the residential sector. It was shown that the PES for the various scenarios corresponding to simulation cases was negative in all studied solutions due to the low conversion efficiency in comparison to reference values of energy conversion efficiency. Furthermore, G. Chicco et al. [
13] has proposed the TPES (Tri-generation Primary Energy Saving) indicator to evaluate the energy saving characteristics of a CCHP system, and draw functioning maps that provide the TPES values in every possible functioning point of the plant, taking into account of partial load and off-design characteristics of the facilities. It was demonstrated that TPES values behave in a rather dynamic manner according to the operating conditions of SHP reference parameters. The thermal efficiency of the TGS model was clearly improved, due to the fact that more surplus heat could be potentially utilized in the heat-driven cooling system. However, in terms of RPES, attention must be paid to the dynamic operating characteristics of the system, and the operational strategy to respond to annual fluctuations in energy demand. This is because the heat-driven cooling facility of the TGS must be compared to a heat pump, which has inherently high operating performance in the RPES evaluation. The RPES evaluation criteria of the TGS model are the same as in the case of the CGS [
9]. However, in terms of the accuracy of the evaluated results, it can be said that the less theoretical parameters applied, the higher the reliability of the results. Since the RPES evaluation of the TGS model is somewhat more sensitive to the assumptions and parametric values applied in the evaluation process than in the CGS model, a detailed analysis result based on actual operation data reflecting energy consumption behavior on the customer side, i.e., building, is preferable than one based on theoretical assumptions. Unfortunately, such studies are rare in the literature.
In the evaluation of the RPES of the CGS, it is worth noting that the RPES benefit against SHP mainly comes from power production. The contribution of heat production to the RPES is rather limited. In general, the parameters for overall power production efficiency applied in the SHP method are calculated by the weighted average of the annual operating efficiency of non-CHP thermal power plants in the national grid. There may be some differences depending on the state of the national grid power mix by country, but it can be estimated at around 40% at present. This means that more than half of the primary energy consumed by power plants must be wasted. That is, it can be postulated that the good RPES performance of the CGS comes from this aspect, not the benefits obtained from the heat production process. This is because the RPES benefits from the excess heat in cogeneration technology being mostly offset during the heat production process using boilers characterized by high thermal efficiencies of 90% [
14]. Therefore, is confirmed in this study, it should be noted that RPES, as well as the annual operating performance, may produce different results from the existing theoretical evaluation method depending on the annual TGS operation strategy, even if the same TGS configuration is applied.
Considering the rapid expansion of renewable energy in response to attaining a carbon-neutral society, it is interesting to note that the superior performance of TGS against SHP, in general, can be largely offset if the impact of the expansion of the renewable energy supply is taken into account. In other words, the new market environment in which the supply of renewable energy is rapidly expanding in the power sector can pose a great threat to maintaining the technological edge of the current TGS model over SHP. The inclusion of renewable power generation effects in the estimation of the representative power generation efficiency of SHP exert a considerable ripple effect on RPES performance evaluation of the TGS model. From the perspective of the sustainable market competitiveness of the TGS model, the issue of including the impact of renewable power dissemination in the RPES assessment of TGS models can become increasingly controversial. Considering the current situation [
9], where the status of new and renewable power generation in the electric power market is not properly reflected in the RPES evaluation, it is very important to examine the technological competitiveness of the TGS model according to the expansion of the supply of new and renewable energy, which is indispensable in the era of climate change.
The main objective of this study is to examine the market competitiveness of the TGS model in the era of climate change, where sustainable technological characteristics are prioritized over efficiency. For proper evaluation, the operational characteristics of the TGS installation case applied to complex terminal buildings were analyzed based on field operation data. The effect of the annual TGS operation strategy on operational performance was analyzed and presented based on the daily field operation data of TGS, not the theoretical estimation or calculation results. In addition, the market potential and competitiveness of the TGS model in the era of climate change was also examined by analyzing the impact of renewable energy market penetration on RPES, which is not generally considered in existing approaches for RPES evaluation.
2. Analysis Methods and Results
2.1. Operational Status Investigation
In this study, an operation status survey was conducted to secure annual field operation data of major TGS facilities installed in the building.
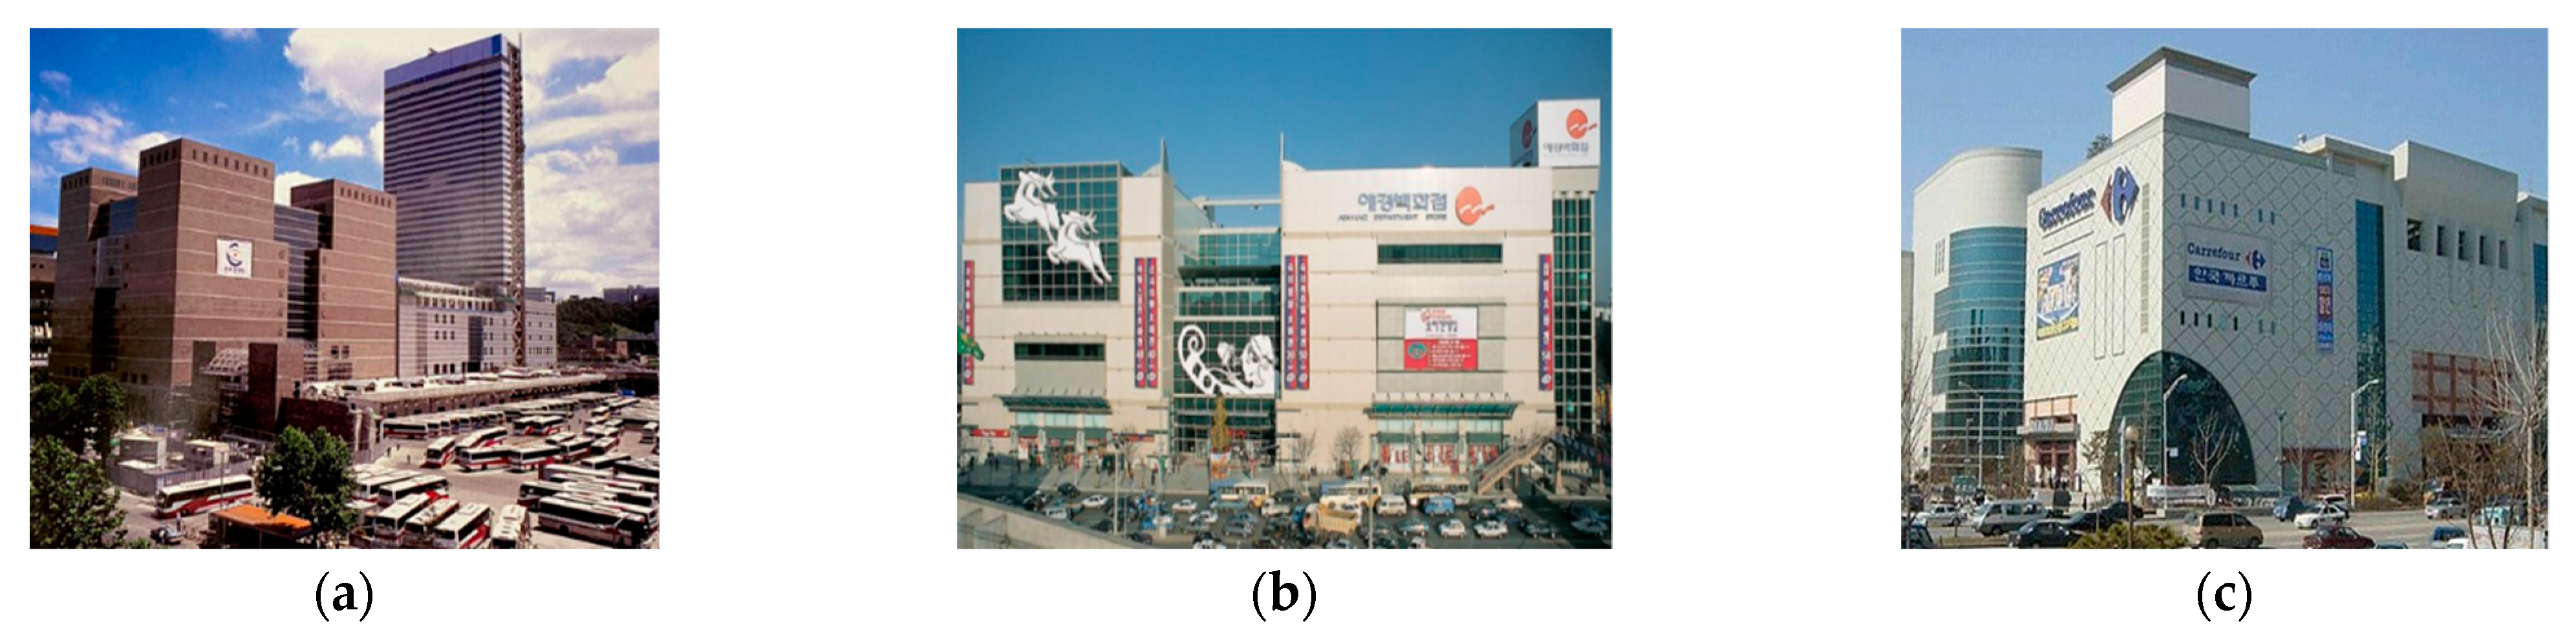
Table 1 shows the basic building and installed facility information for the terminal complex to be analyzed. The gas engine-type prime movers were installed in all cases. However, the system that responds to the cooling demand was configured differently depending on the site. Cases A and B consist of independent heat sources, whereas Case C is operated in conjunction with a nearby district heating system. It should also be noted that Cases A and B use a heat-driven cooling system, whereas Case C meets the cooling demand exclusively with a turbo-cooling system.
For each building, CHP power generation by prime mover, heat recovery rate, and fuel consumption data for each facility were obtained, and annual daily average data were established for the analysis. It needs to be noted that it was difficult to obtain hourly data, as most records in the field consist of daily data. Daily operation data is not sufficient to properly detect the dynamic driving characteristics of system operation; however, it needs to be mentioned that hourly operational data in real applications is rarely available, unless an experiment for the purpose of verification is carried out, which is beyond the scope of this study, i.e., for analyzing the operating performance, under actual operating conditions, of a building unit.
Figure 1 shows the front views of the terminal complex buildings to be analyzed in this study; the current operating conditions for each case are briefly described based on the investigated data, in the following subsection.
2.1.1. Case A
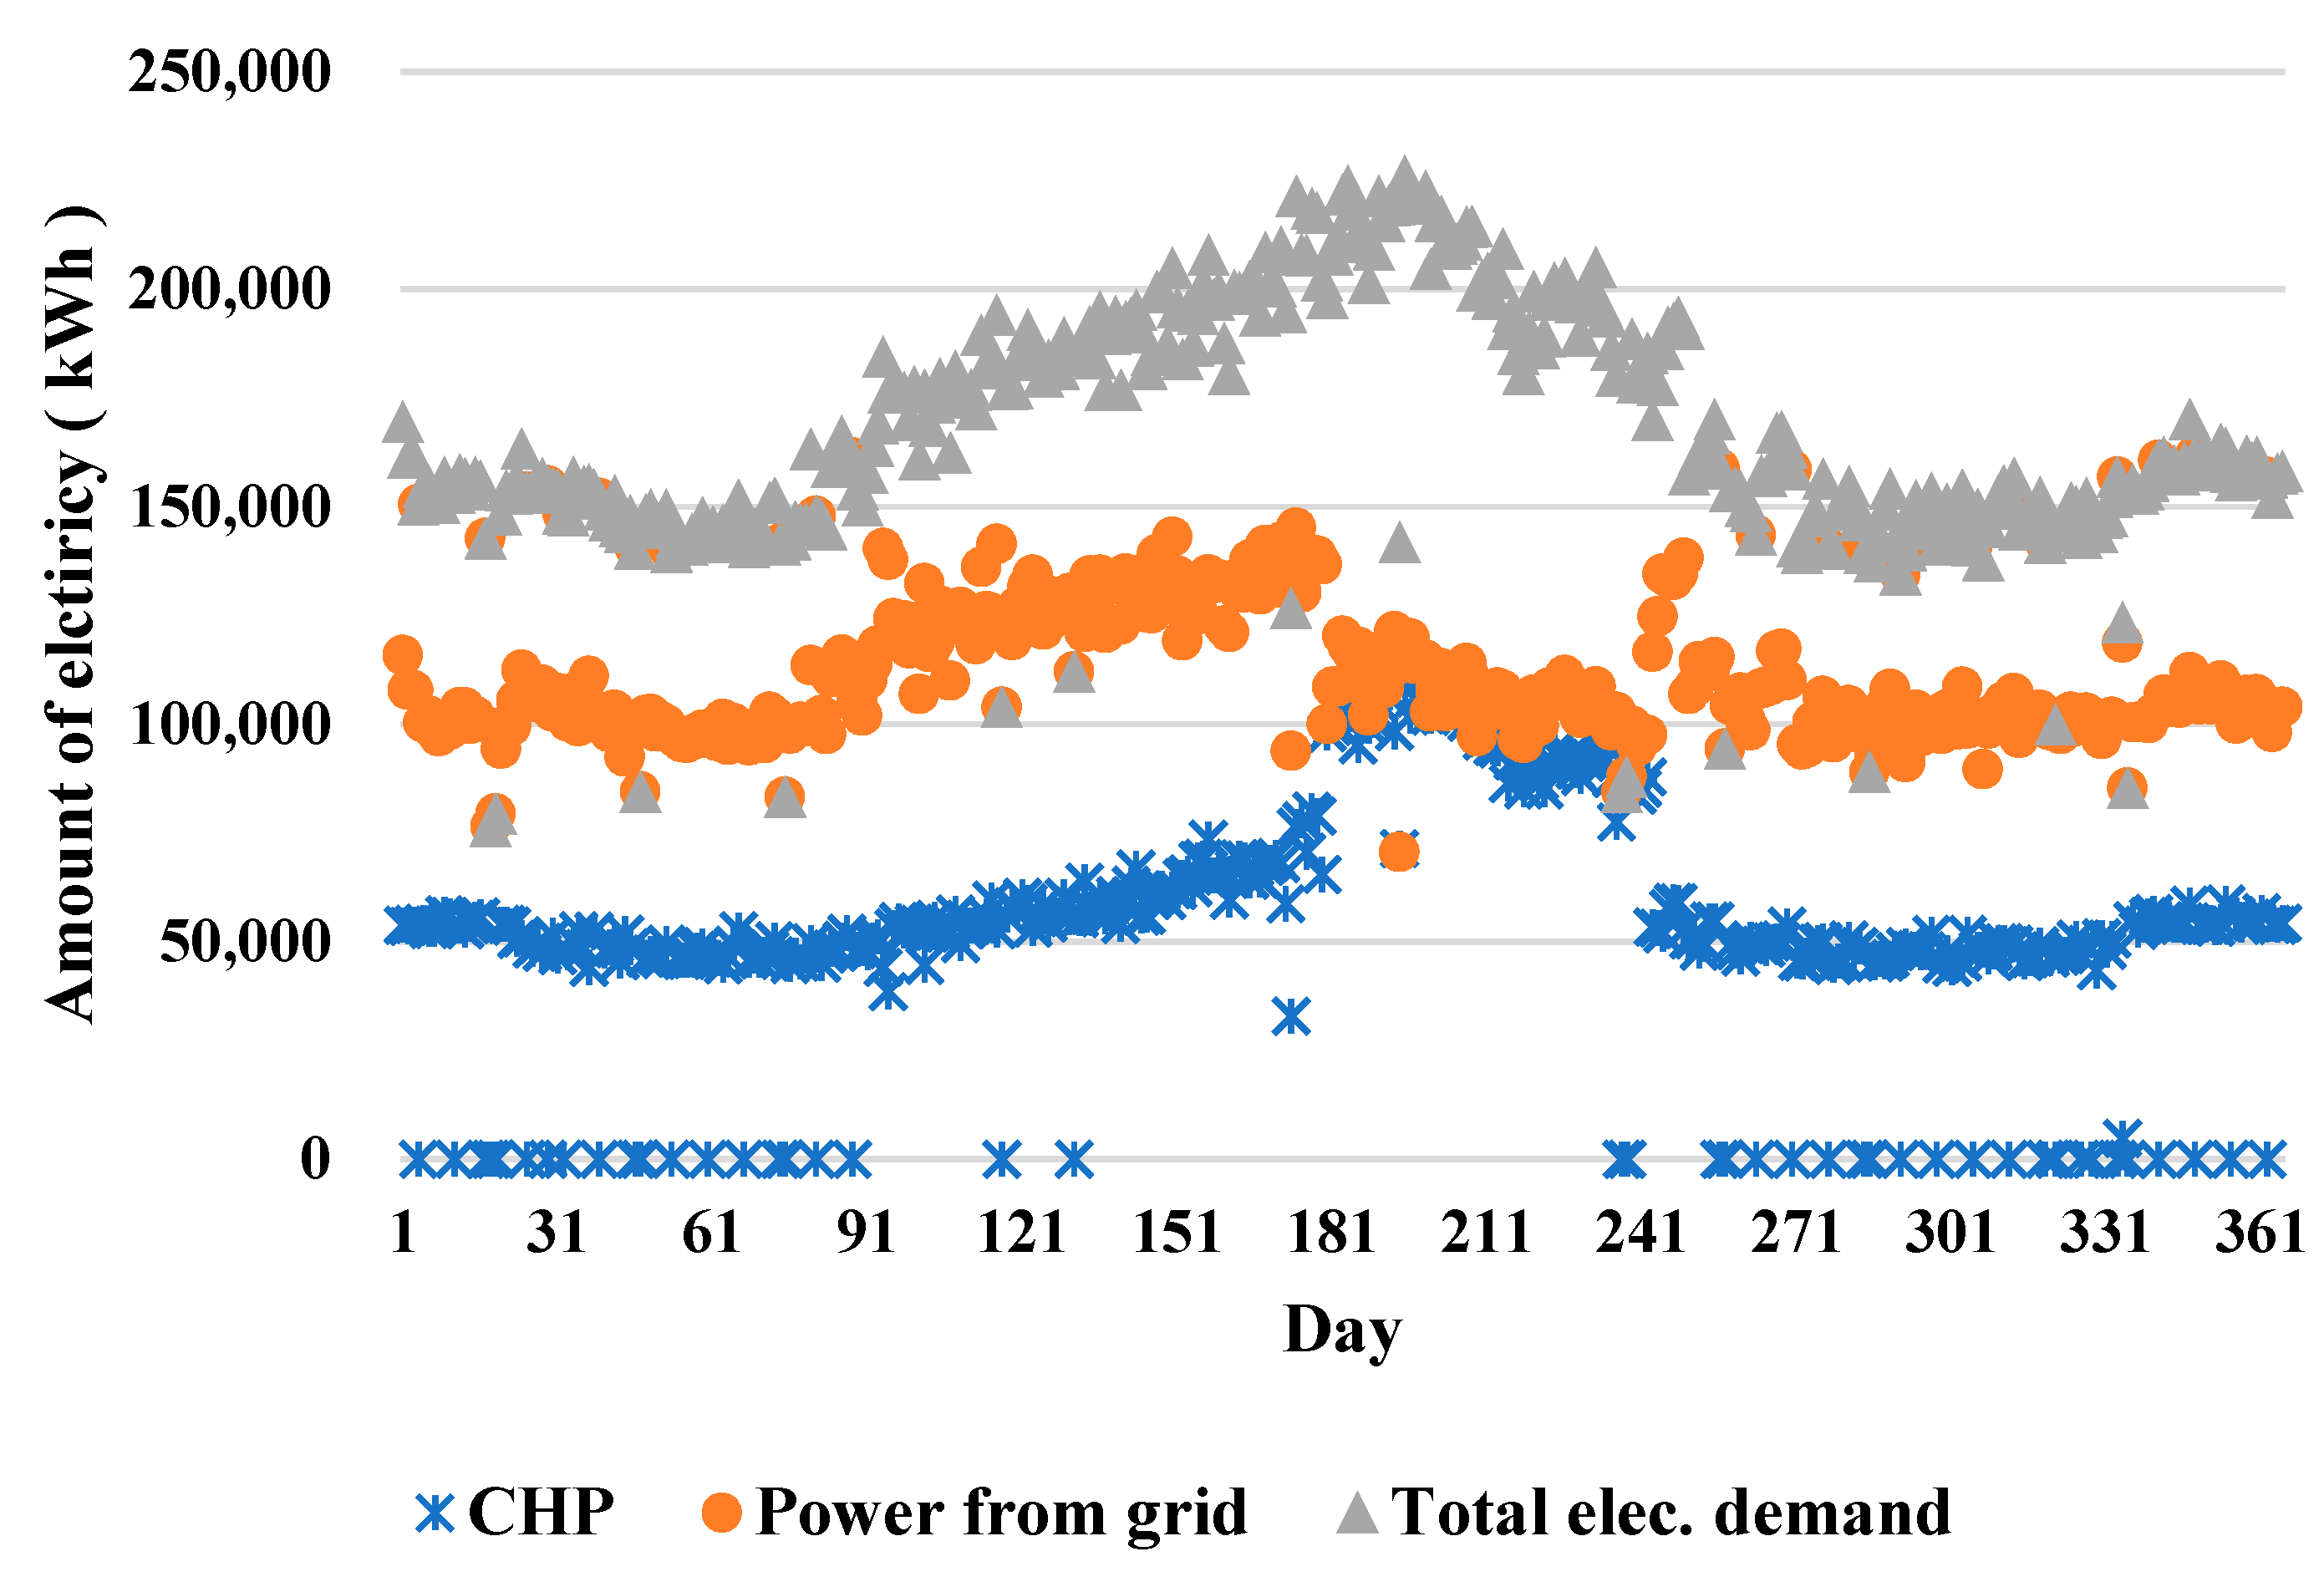
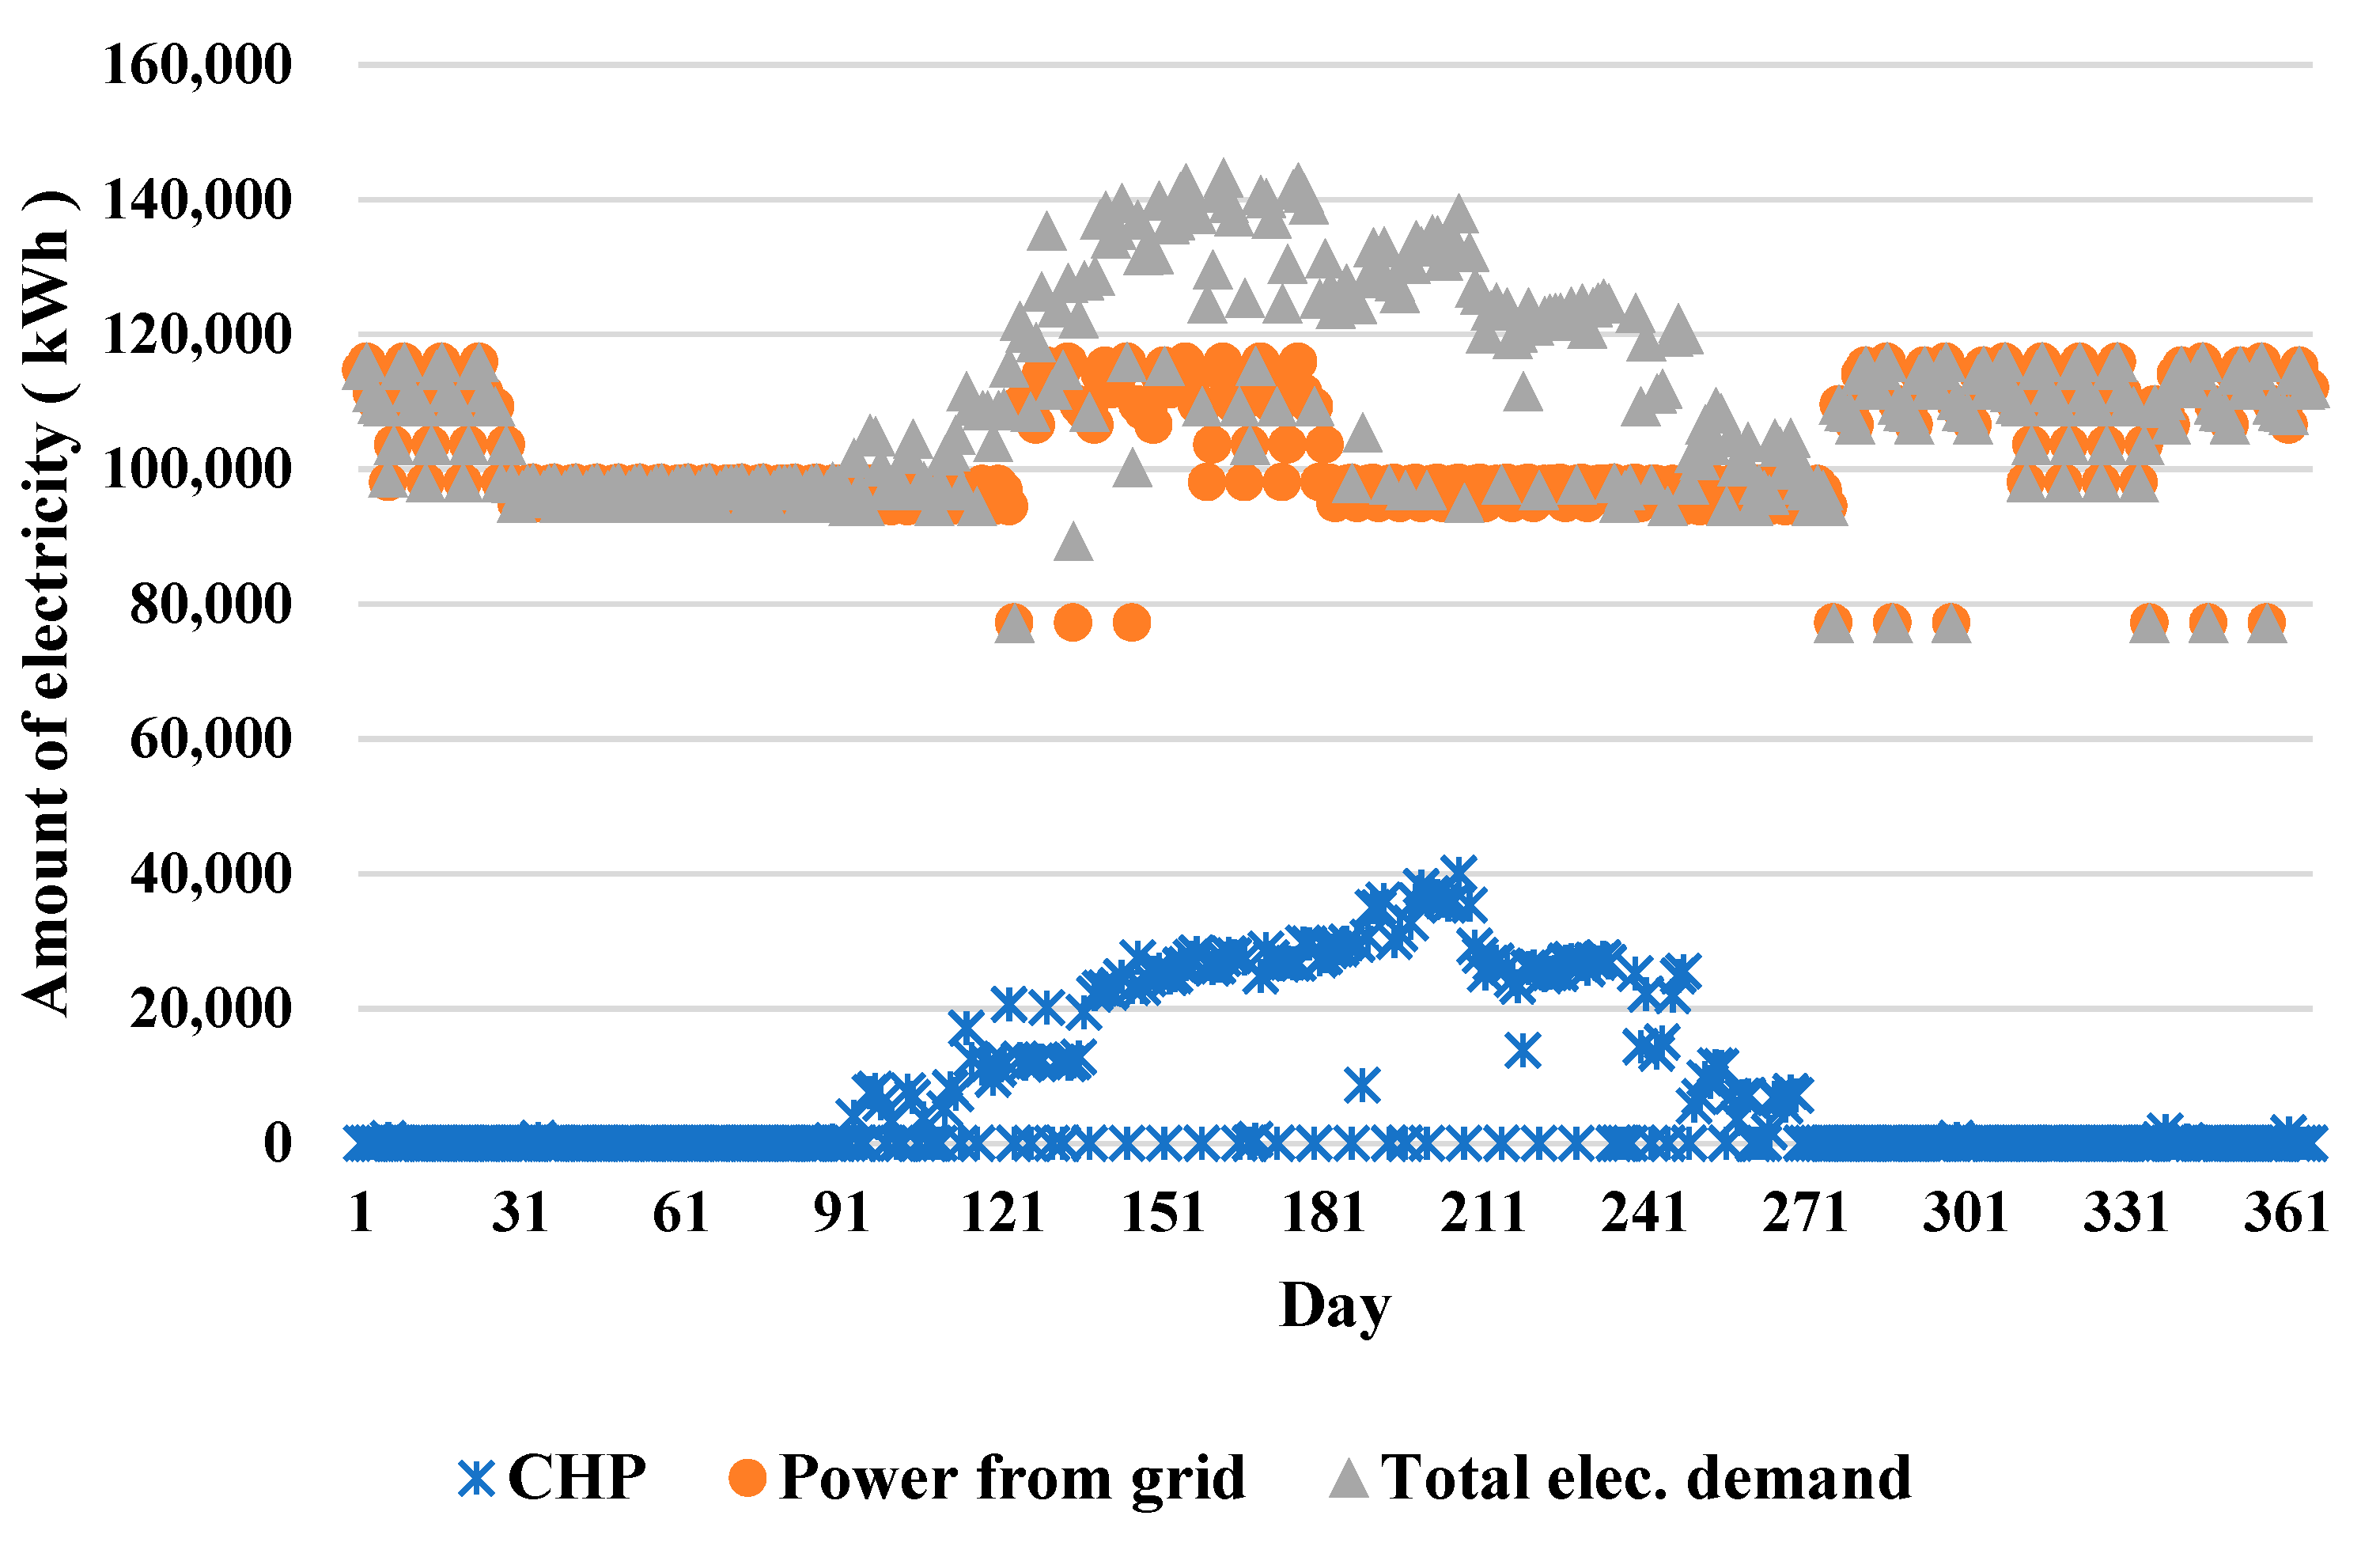
Figure 2 shows the annual daily power demand and supply profile for Case A. Due to the peak power consumption pattern in summer, which is mainly caused by operating turbo chillers, power production by CHP’s prime movers nearly doubled, keeping the grid’s power below a certain level all year round. The surplus heat that would be increased in response to the CHP’s prime mover to meet peak power consumption was consequently used only for the operation of the absorption chiller to achieve further peak power reduction.
In
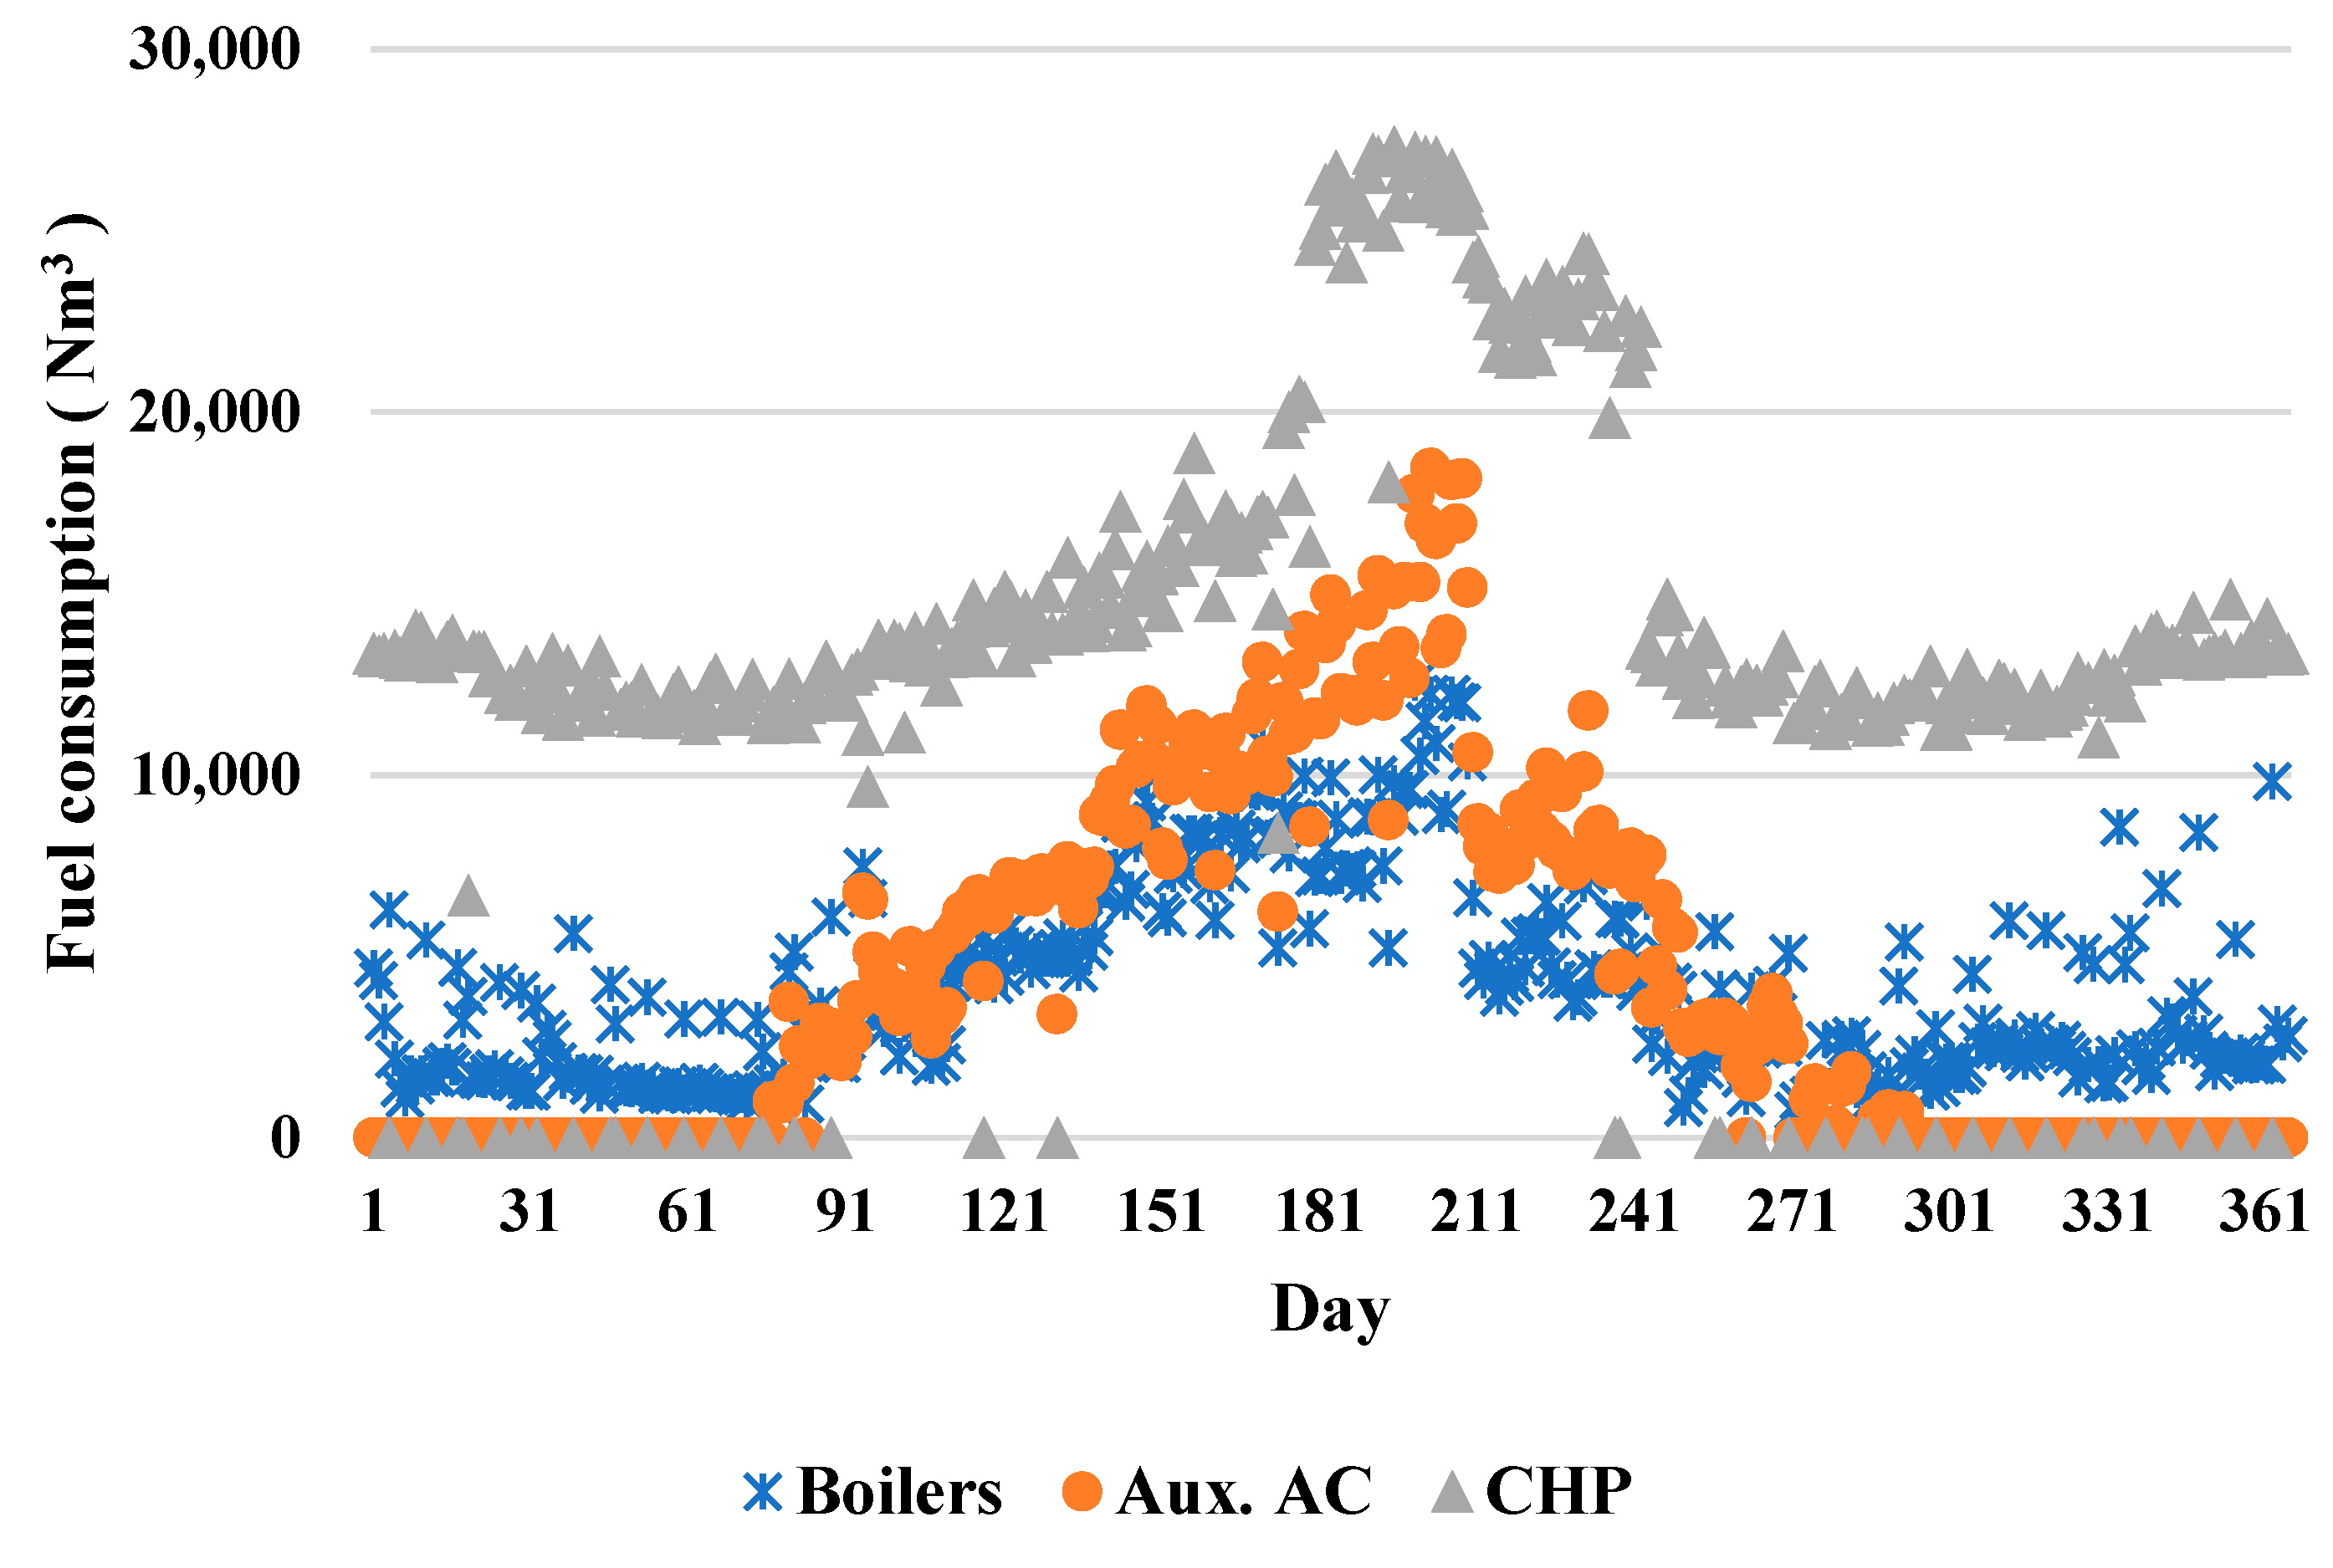
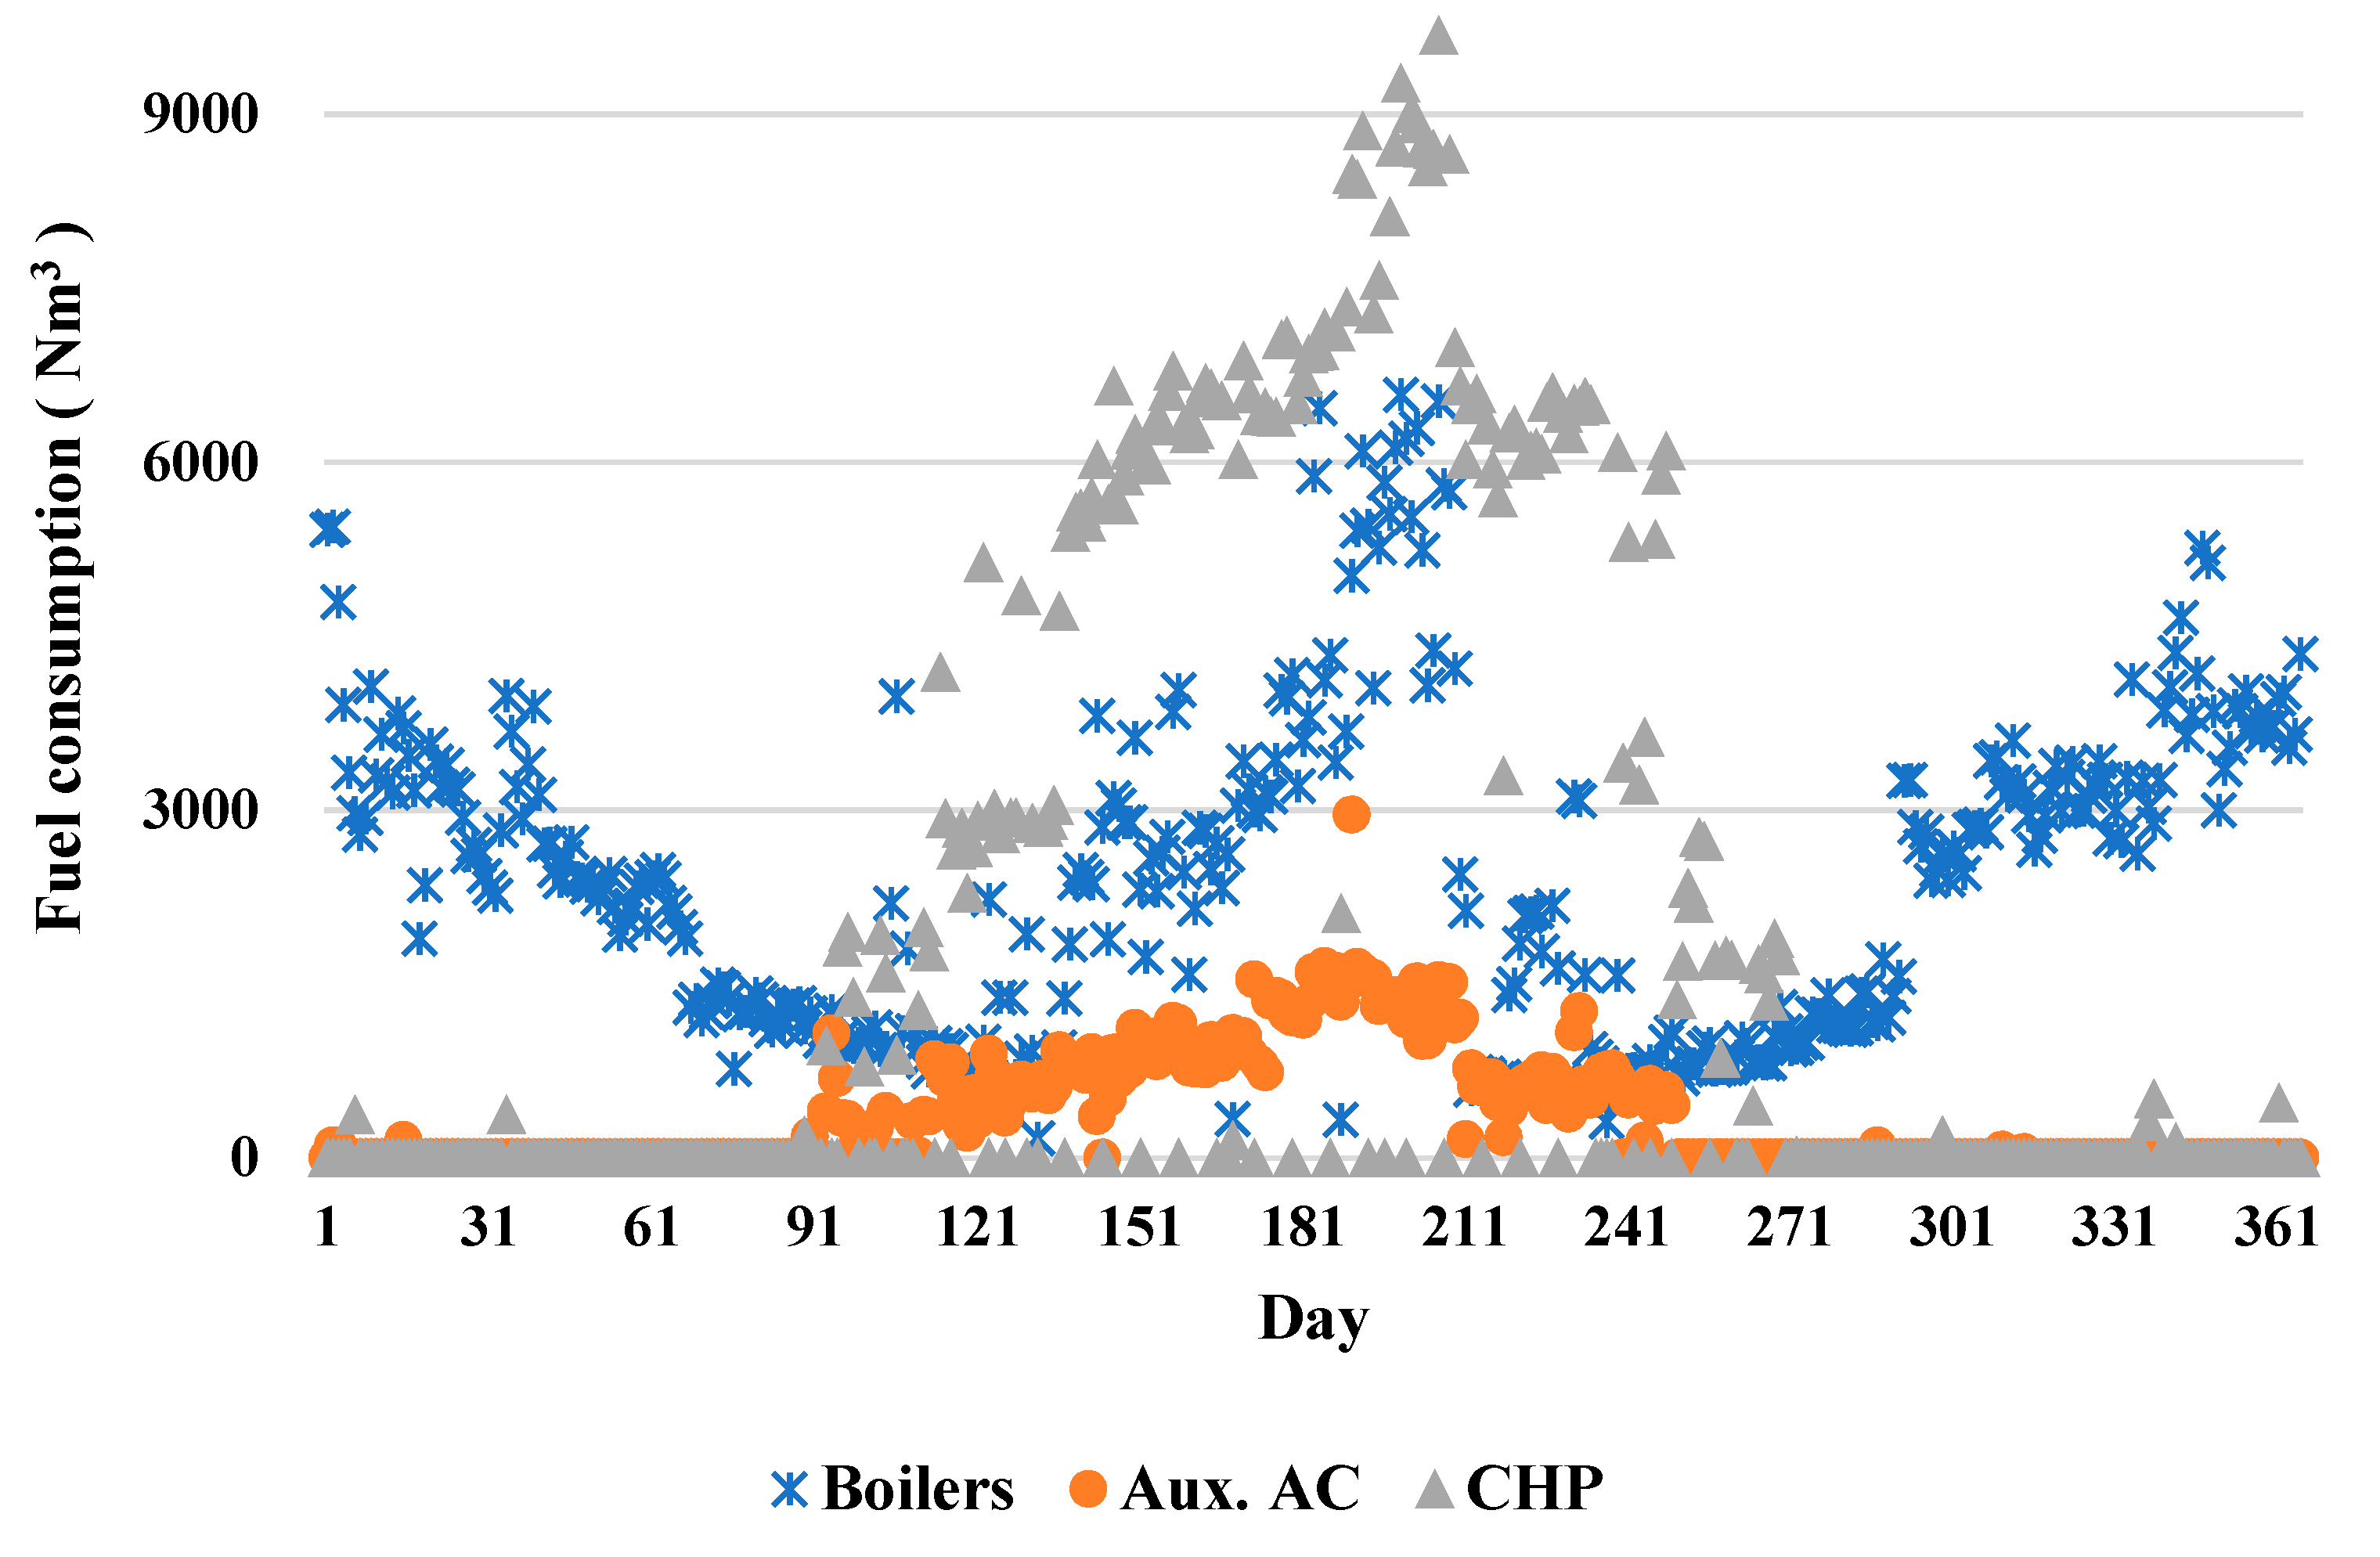
Figure 3, the annual daily fuel consumption profile for each facility of TGS is given. As shown in
Figure 3, the prime mover runs year-round, doubling power output by running multiple prime movers to meet summer’s peak power demand. The additional fuel consumption of the auxiliary absorption chiller is also shown in
Figure 3, which means that the surplus heat of the prime mover is insufficient to satisfy the maximum cooling load in summer, even when the surplus heat is doubled. The fuel consumption of the auxiliary absorption chillers is not favorable in terms of RPES. Therefore, for optimal operation control, a method used to minimize the operation of the auxiliary absorption chiller, is required, which will be discussed later.
The fuel consumption profile for the boilers to support the heat supply of the prime movers is shown in
Figure 3. From the annual profile of the fuel consumption of the boilers, it can be confirmed that all the surplus heat from the prime movers has been consumed to meet the heating demand, including the heat supply for the absorption chiller. This implies that a good RPES performance can be attained in this case, since the system operation is well-managed to minimize heat loss.
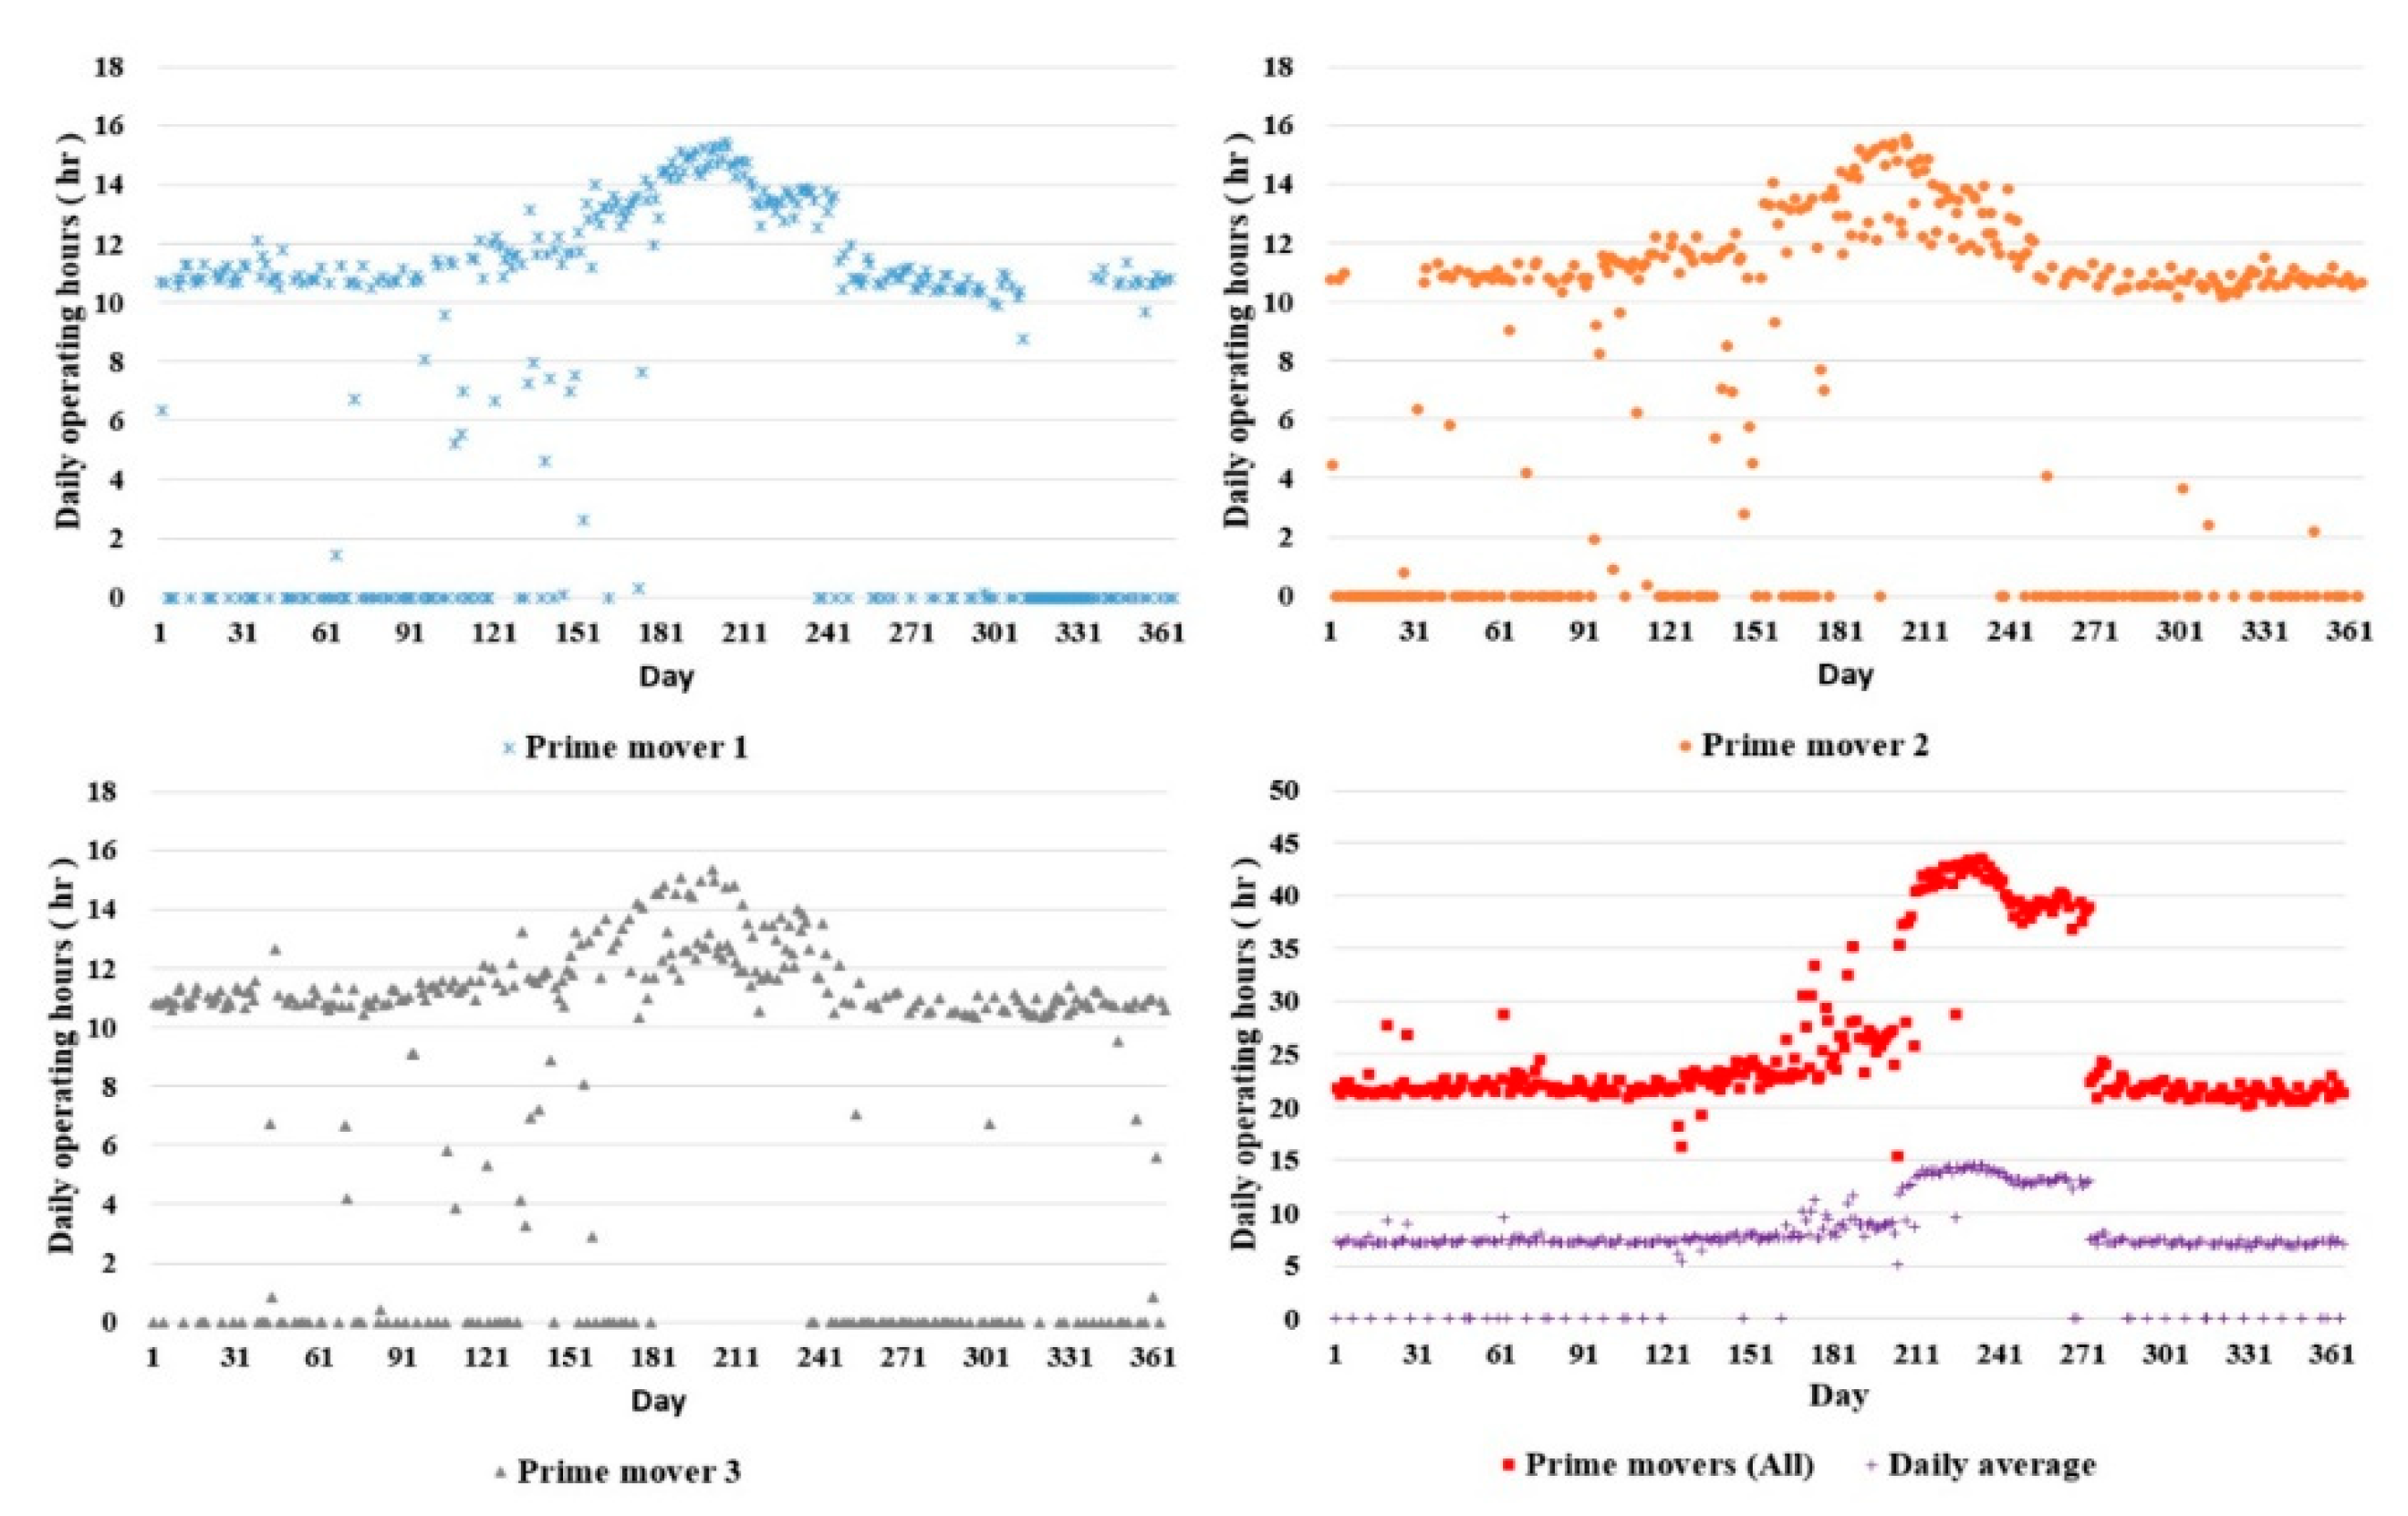
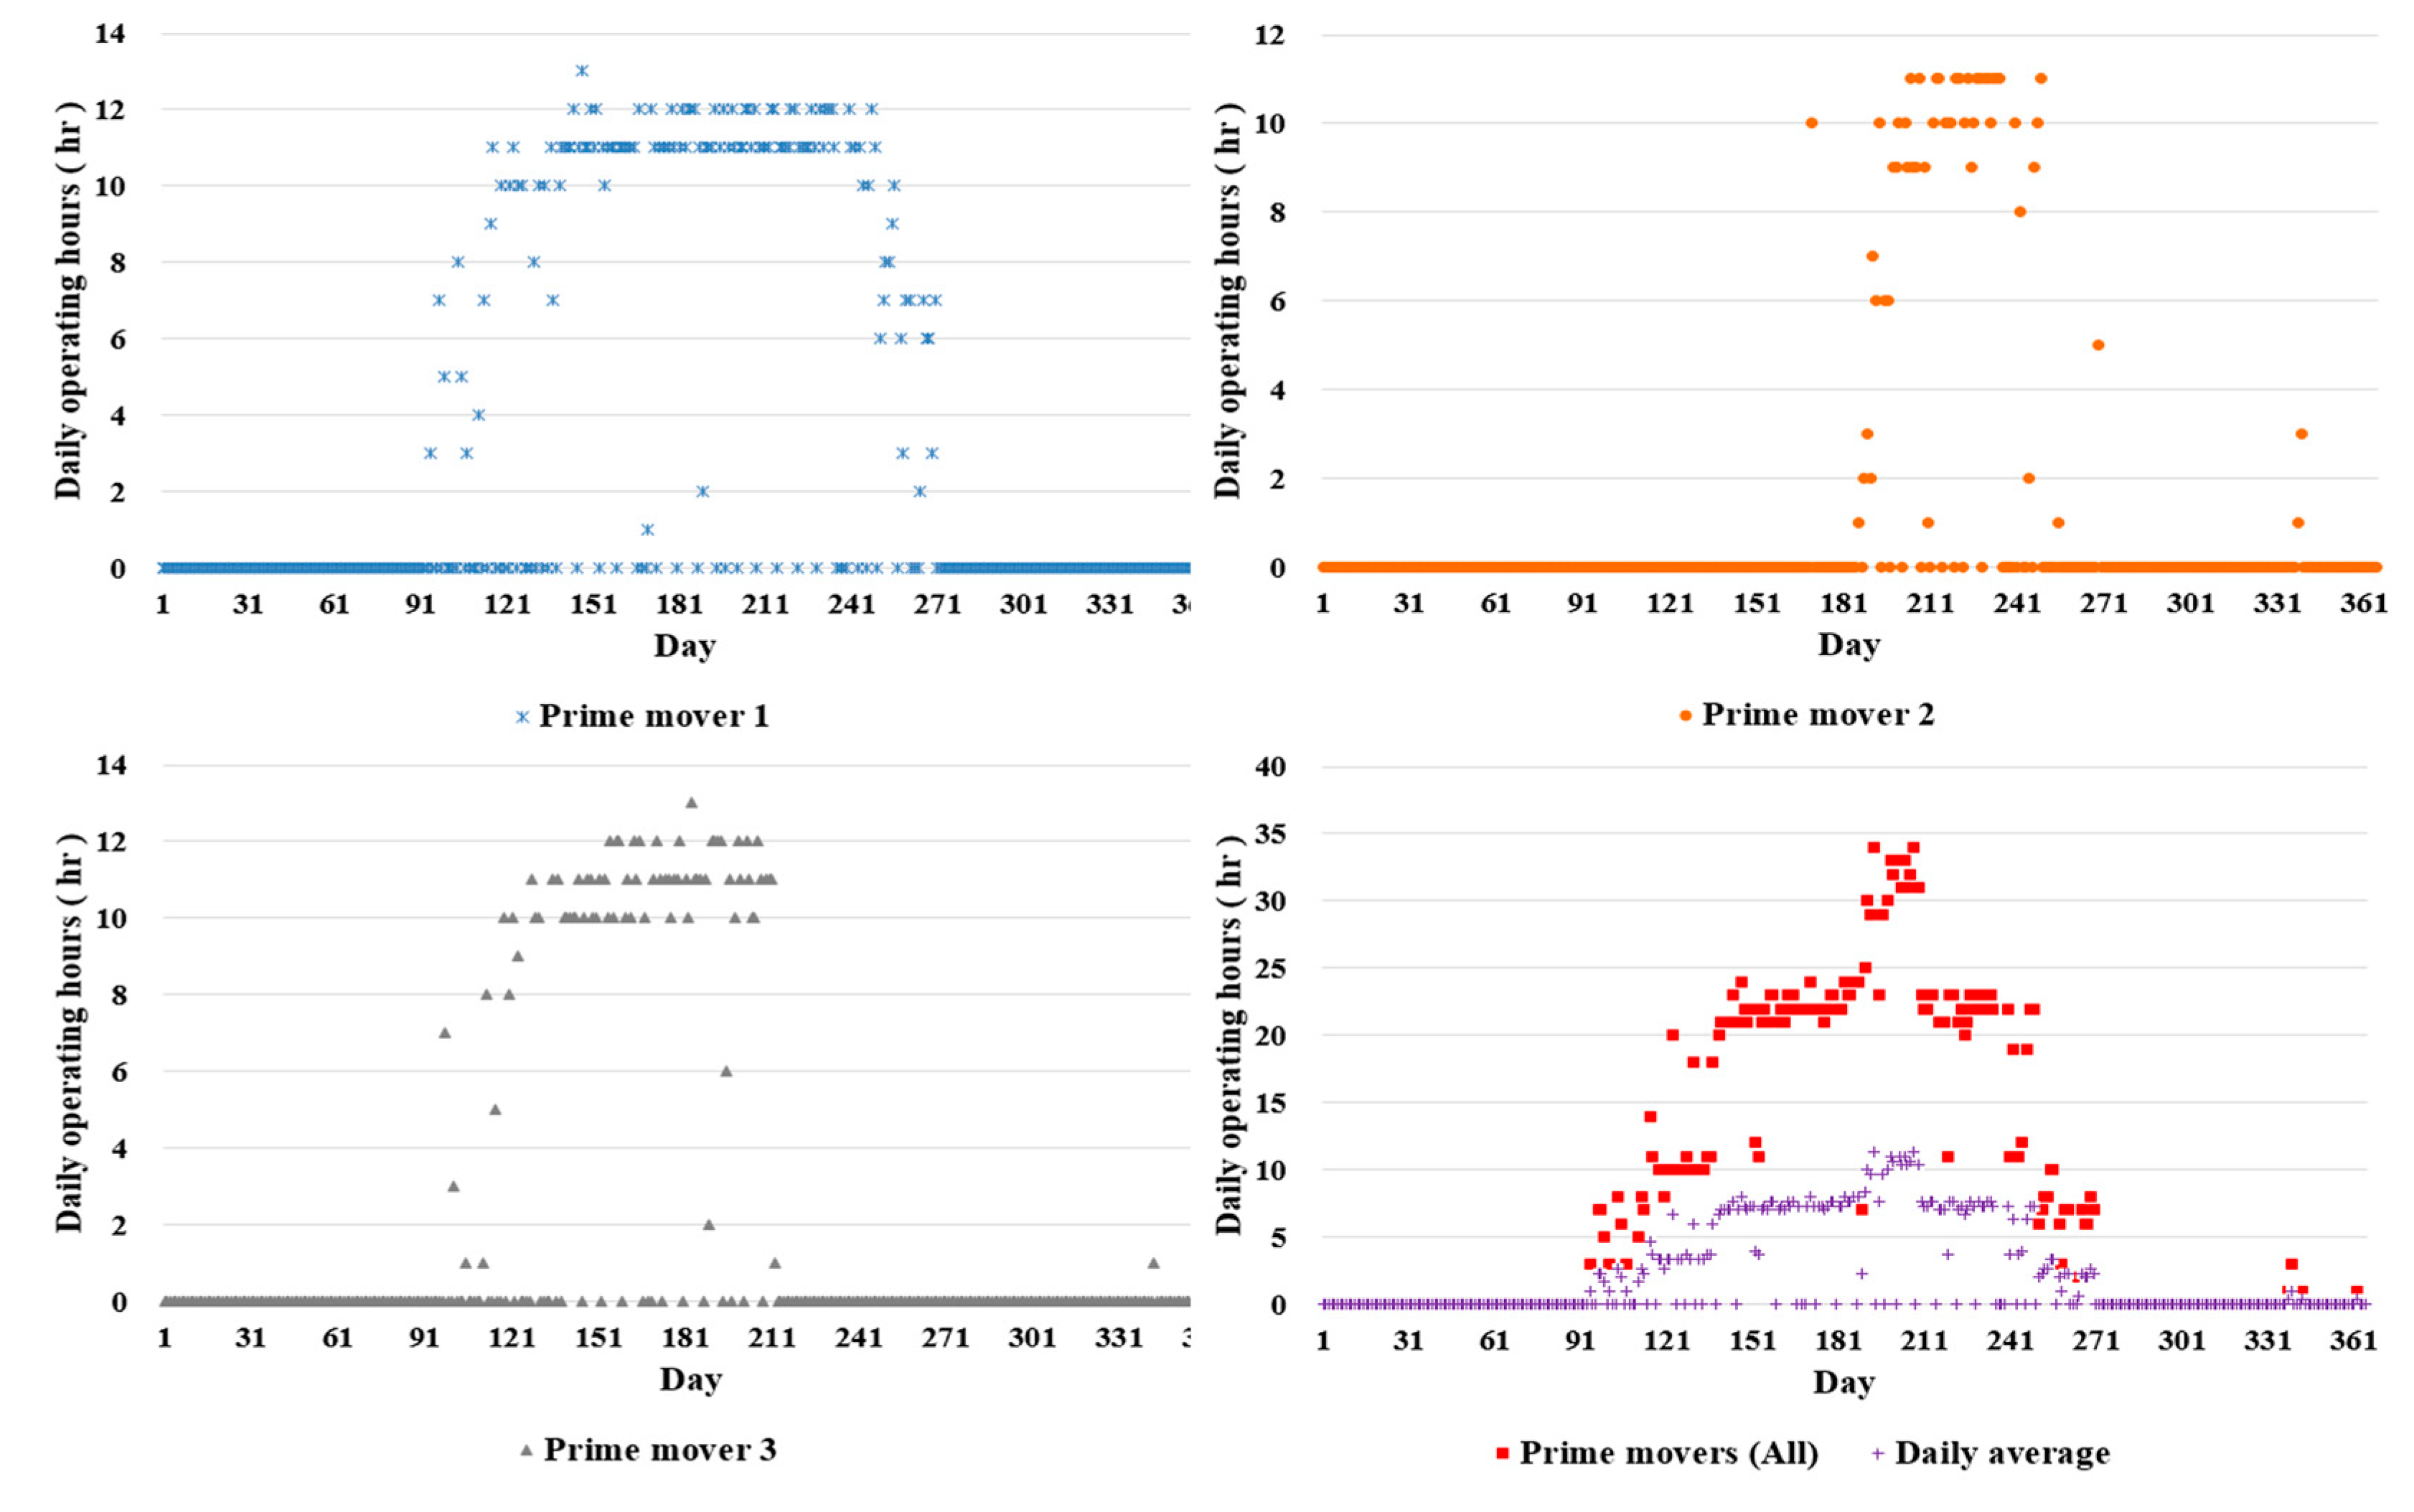
The annual daily operation hours of prime movers are shown in
Figure 4. At first glance, it can be seen that the prime mover has additional running capacity, even in summer. However, it should be noted that one prime mover serves as a spare in case of failure or the overhaul of prime movers during annual operation. In summary, although it can be seen that the prime mover has sufficient scope for additional operation, this does not mean that the installed prime mover capacity is excessive, considering the requirements of the spare prime mover for stable operation.
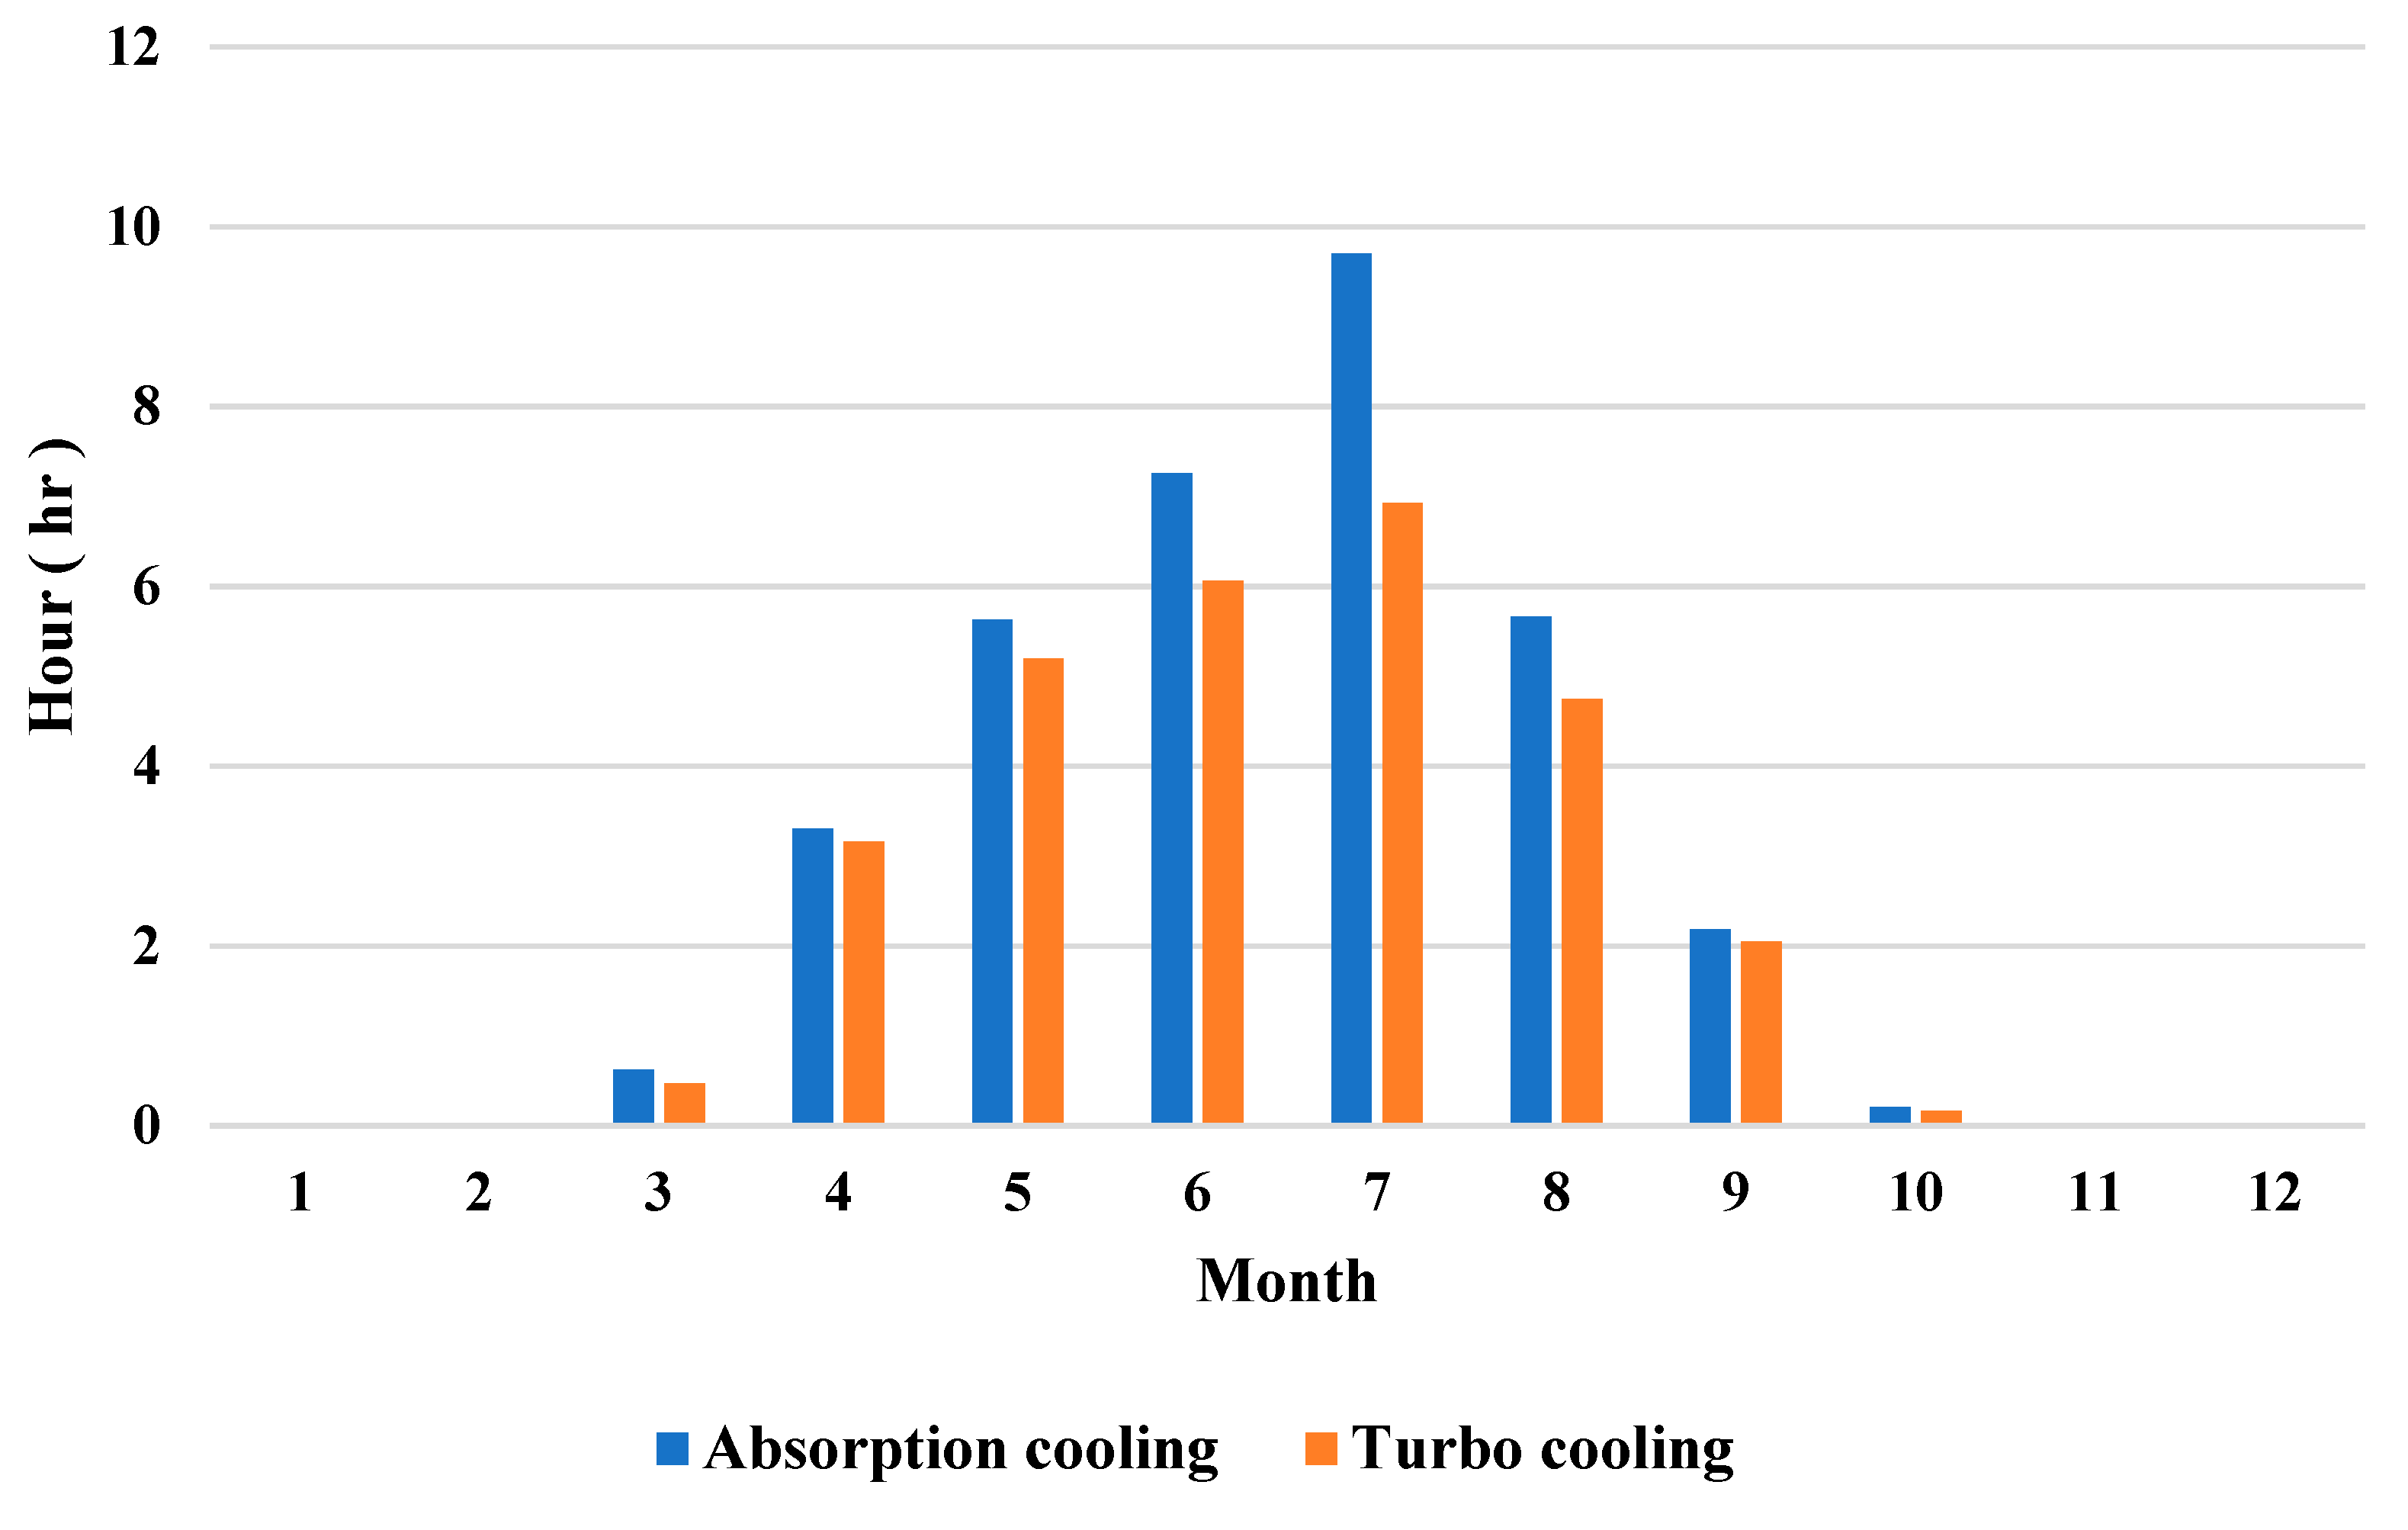
The monthly averaged daily operation hours for turbo and absorption chillers are also shown in
Figure 5. It is clear that the cooling demand is unsubstantial during winter, with chillers mainly being used during summer, and that the cooling system configuration is designed so that absorption cooling takes up a significant portion.
2.1.2. Case B
Figure 6 shows the annual daily profile for the power supply and demand for Case B. The power from the grid was regulated below a certain level, about 120 MWh per day, as the peak power was covered by the operation of prime movers in summer. Unlike Case A, TGS was found to be operated only in summer. However, the fuel consumption profile during winter, as shown in
Figure 7, means that the prime movers had to be operated even in the winter season, instead of operating the boilers to achieve higher RPES. This decision may have been made with economic considerations, but it should be noted that the more you run with CGS, the more RPES benefits you obtain if there are heating demands utilizing the surplus heat.
The overall energy demand patterns for Cases A and B appear to be very similar, but the main difference between them is the operational strategy of the prime movers during the winter season, in that, for Case B, they took a conservative stance on the operation of the prime movers, as shown in
Figure 8. The consequence of this different operational strategy to meet the energy demand during winter is presented in the next section of the RPES evaluation.
The monthly averaged daily operation hours for turbo and absorption chillers for Case B are shown in
Figure 9. As in Case A, a considerably large amount of fuel consumption for operating the boilers and auxiliary absorption chillers is not a favorable operating condition for achieving high RPES performance. Considering the additional operating capability of prime movers in summer, as shown in
Figure 8, it is concluded that there is a lot of room for improvement in terms of the optimal operating strategy, even in summer, to enhance the operation performance. In other words, it is more desirable to have applied an operation strategy that minimizes the operation of the boilers and auxiliary absorption chillers, while suppressing the increase in power peak by simultaneously increasing the operating rates of the prime movers and turbo chillers, i.e., the increase in power due to the operation of the turbo chiller is offset by the additional operation of the prime movers.
2.1.3. Case C
Case C differs from Cases A and B in that a portion of the building’s heat demand can be supplied by DHN (district heating network) instead of via the installation of its own boilers or absorption chillers. A differentiated TGS model connecting a building to an adjacent DHN has several advantages in terms of an optimal operating strategy. Reliable heat supply from DHN can significantly reduce the investment cost for installing boilers or absorption chillers on site. In addition, the DHN can play the role of a heat storage system, with which more flexible, or extra operation of, prime movers is allowed to attain optimal operational management. This can be said to be the main advantage of the so-called bidirectional heat trade model reflecting the energy prosumer concept. In Case C, however, the concept of the bidirectional heat trade model has not been implemented; instead, a reliable heat supply, mainly in the winter season, has been secured from the DHN. It is also noted that the cooling demand was totally covered by the turbo-cooling method, i.e., heat-driven cooling was not involved in the cooling solution for Case C, even though the required heat supply from the DHN for operating the absorption chillers was available. In terms of space utilization, it seems that an ice/heat storage tank that can reduce the capacity of a turbo chiller is selected over absorption chillers.
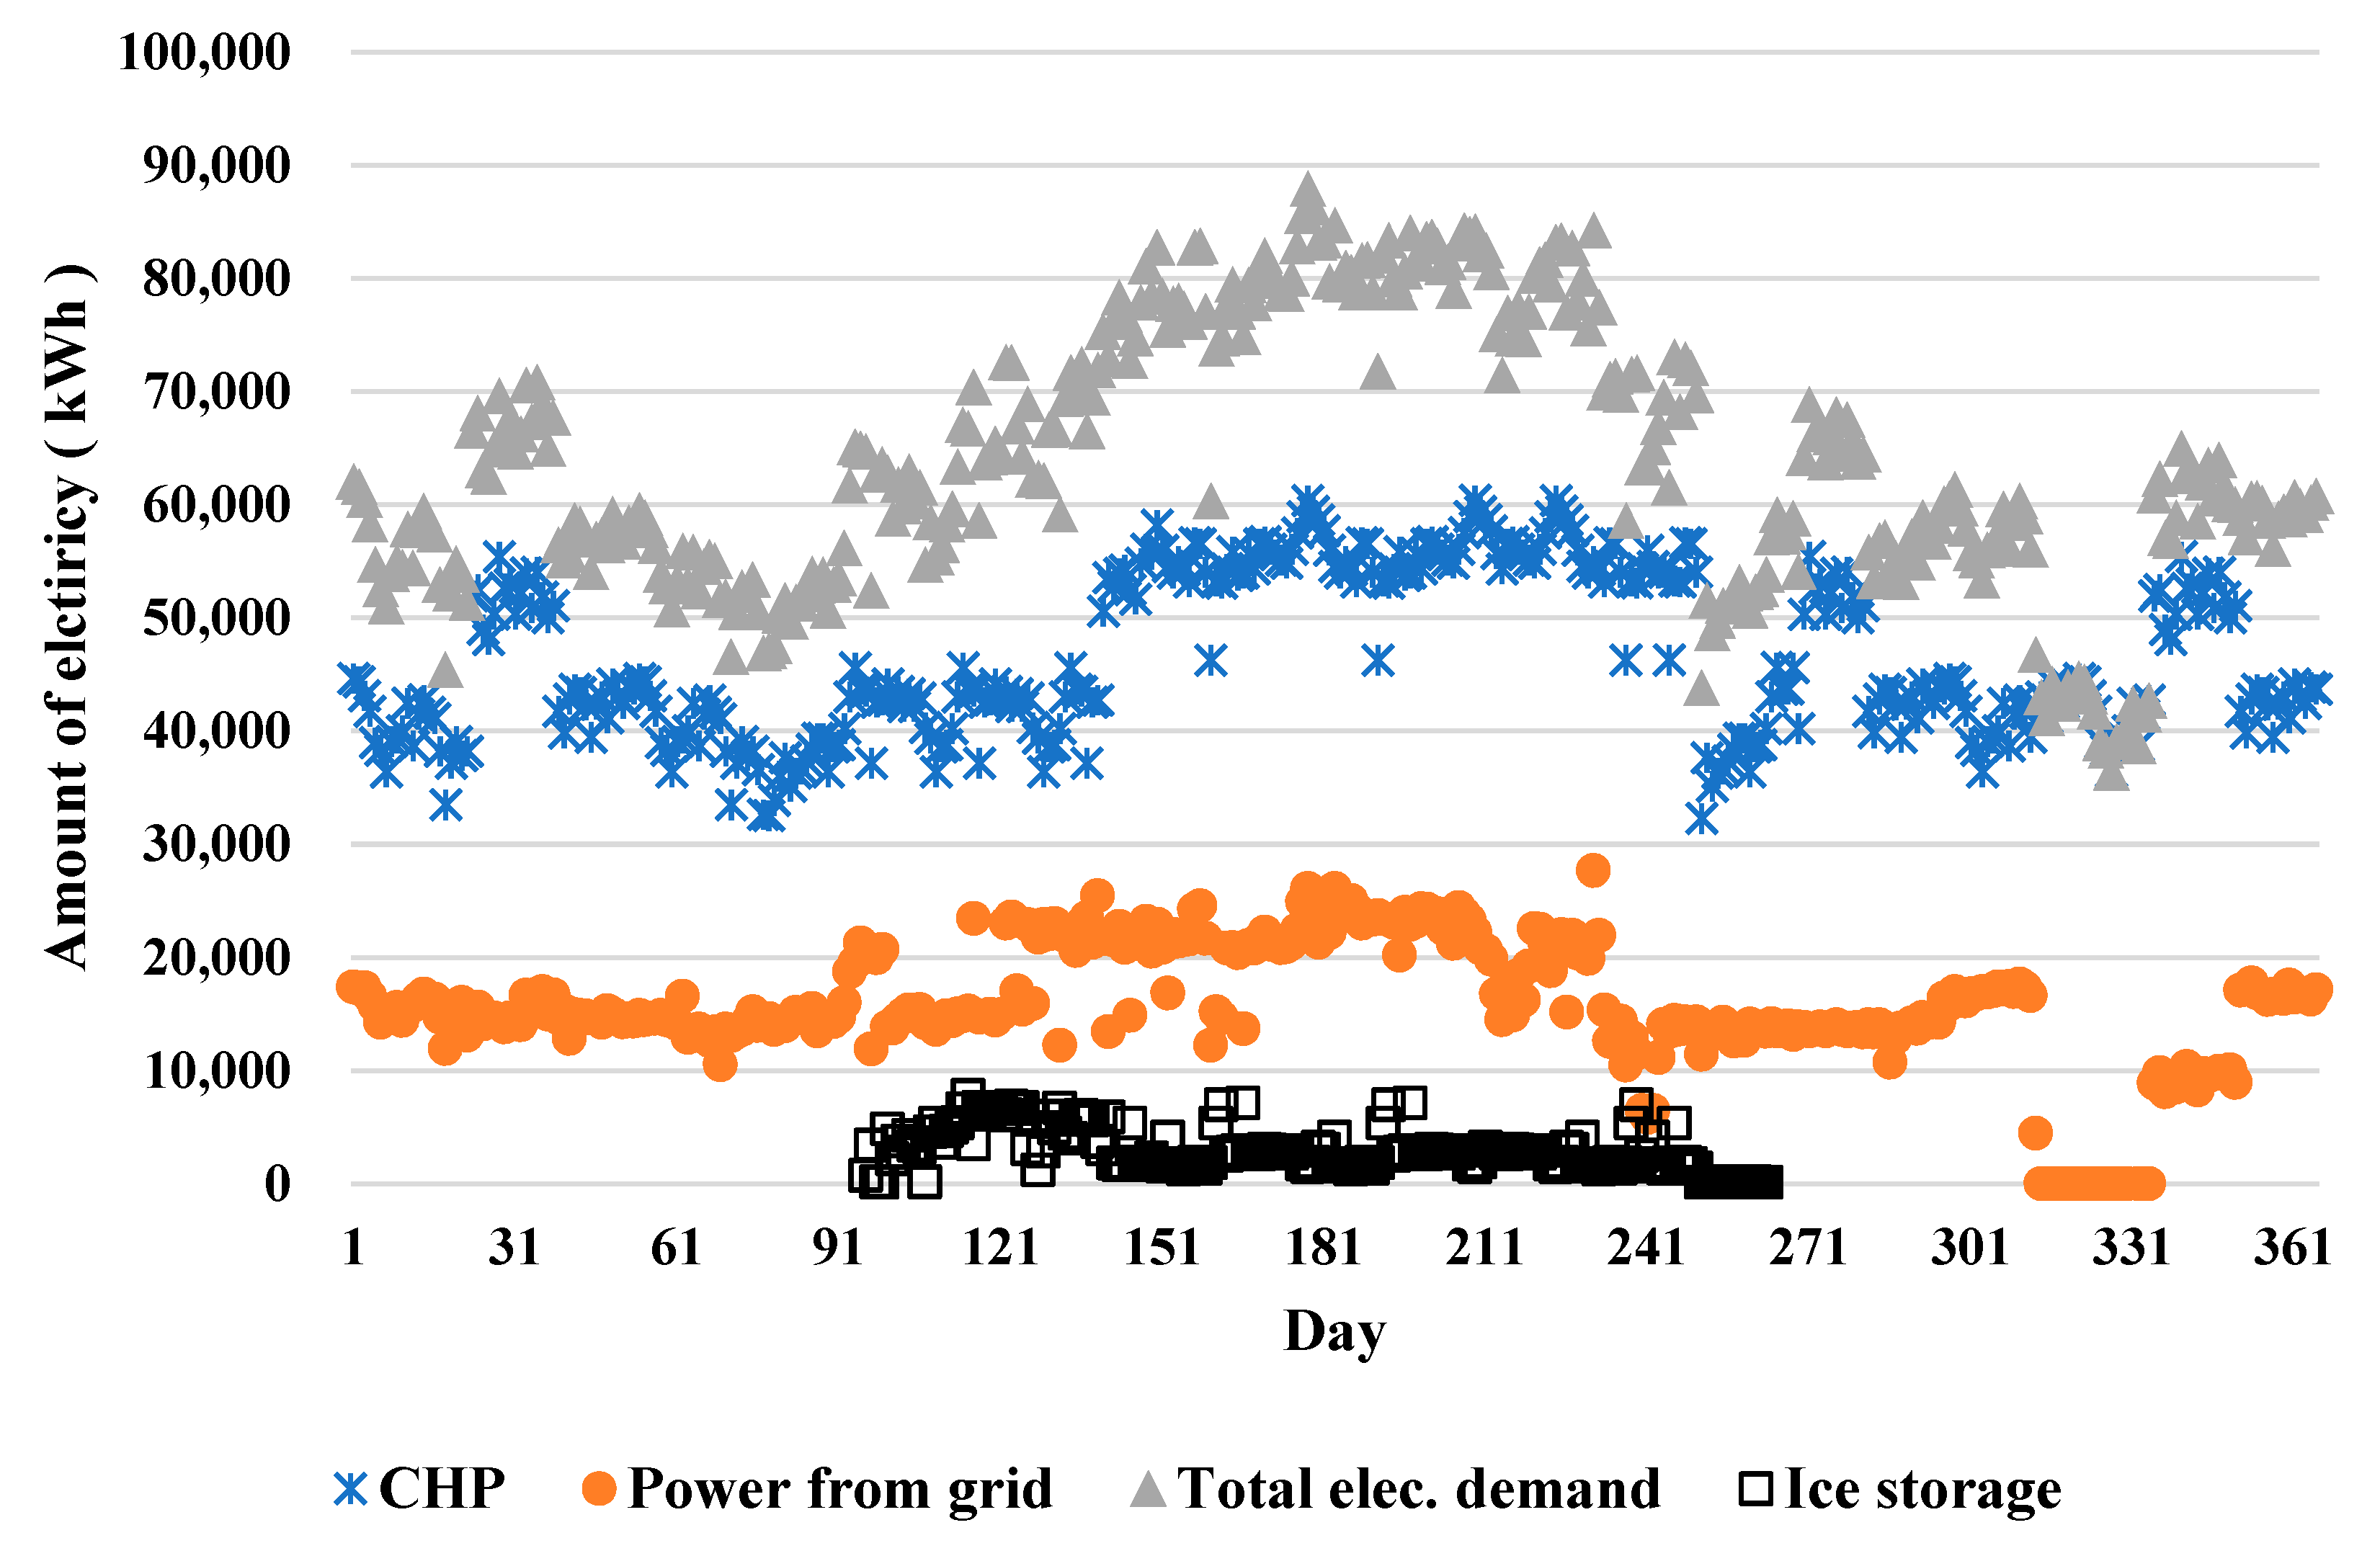
The annual and daily power demand, and the supply profile, for Case C is given in
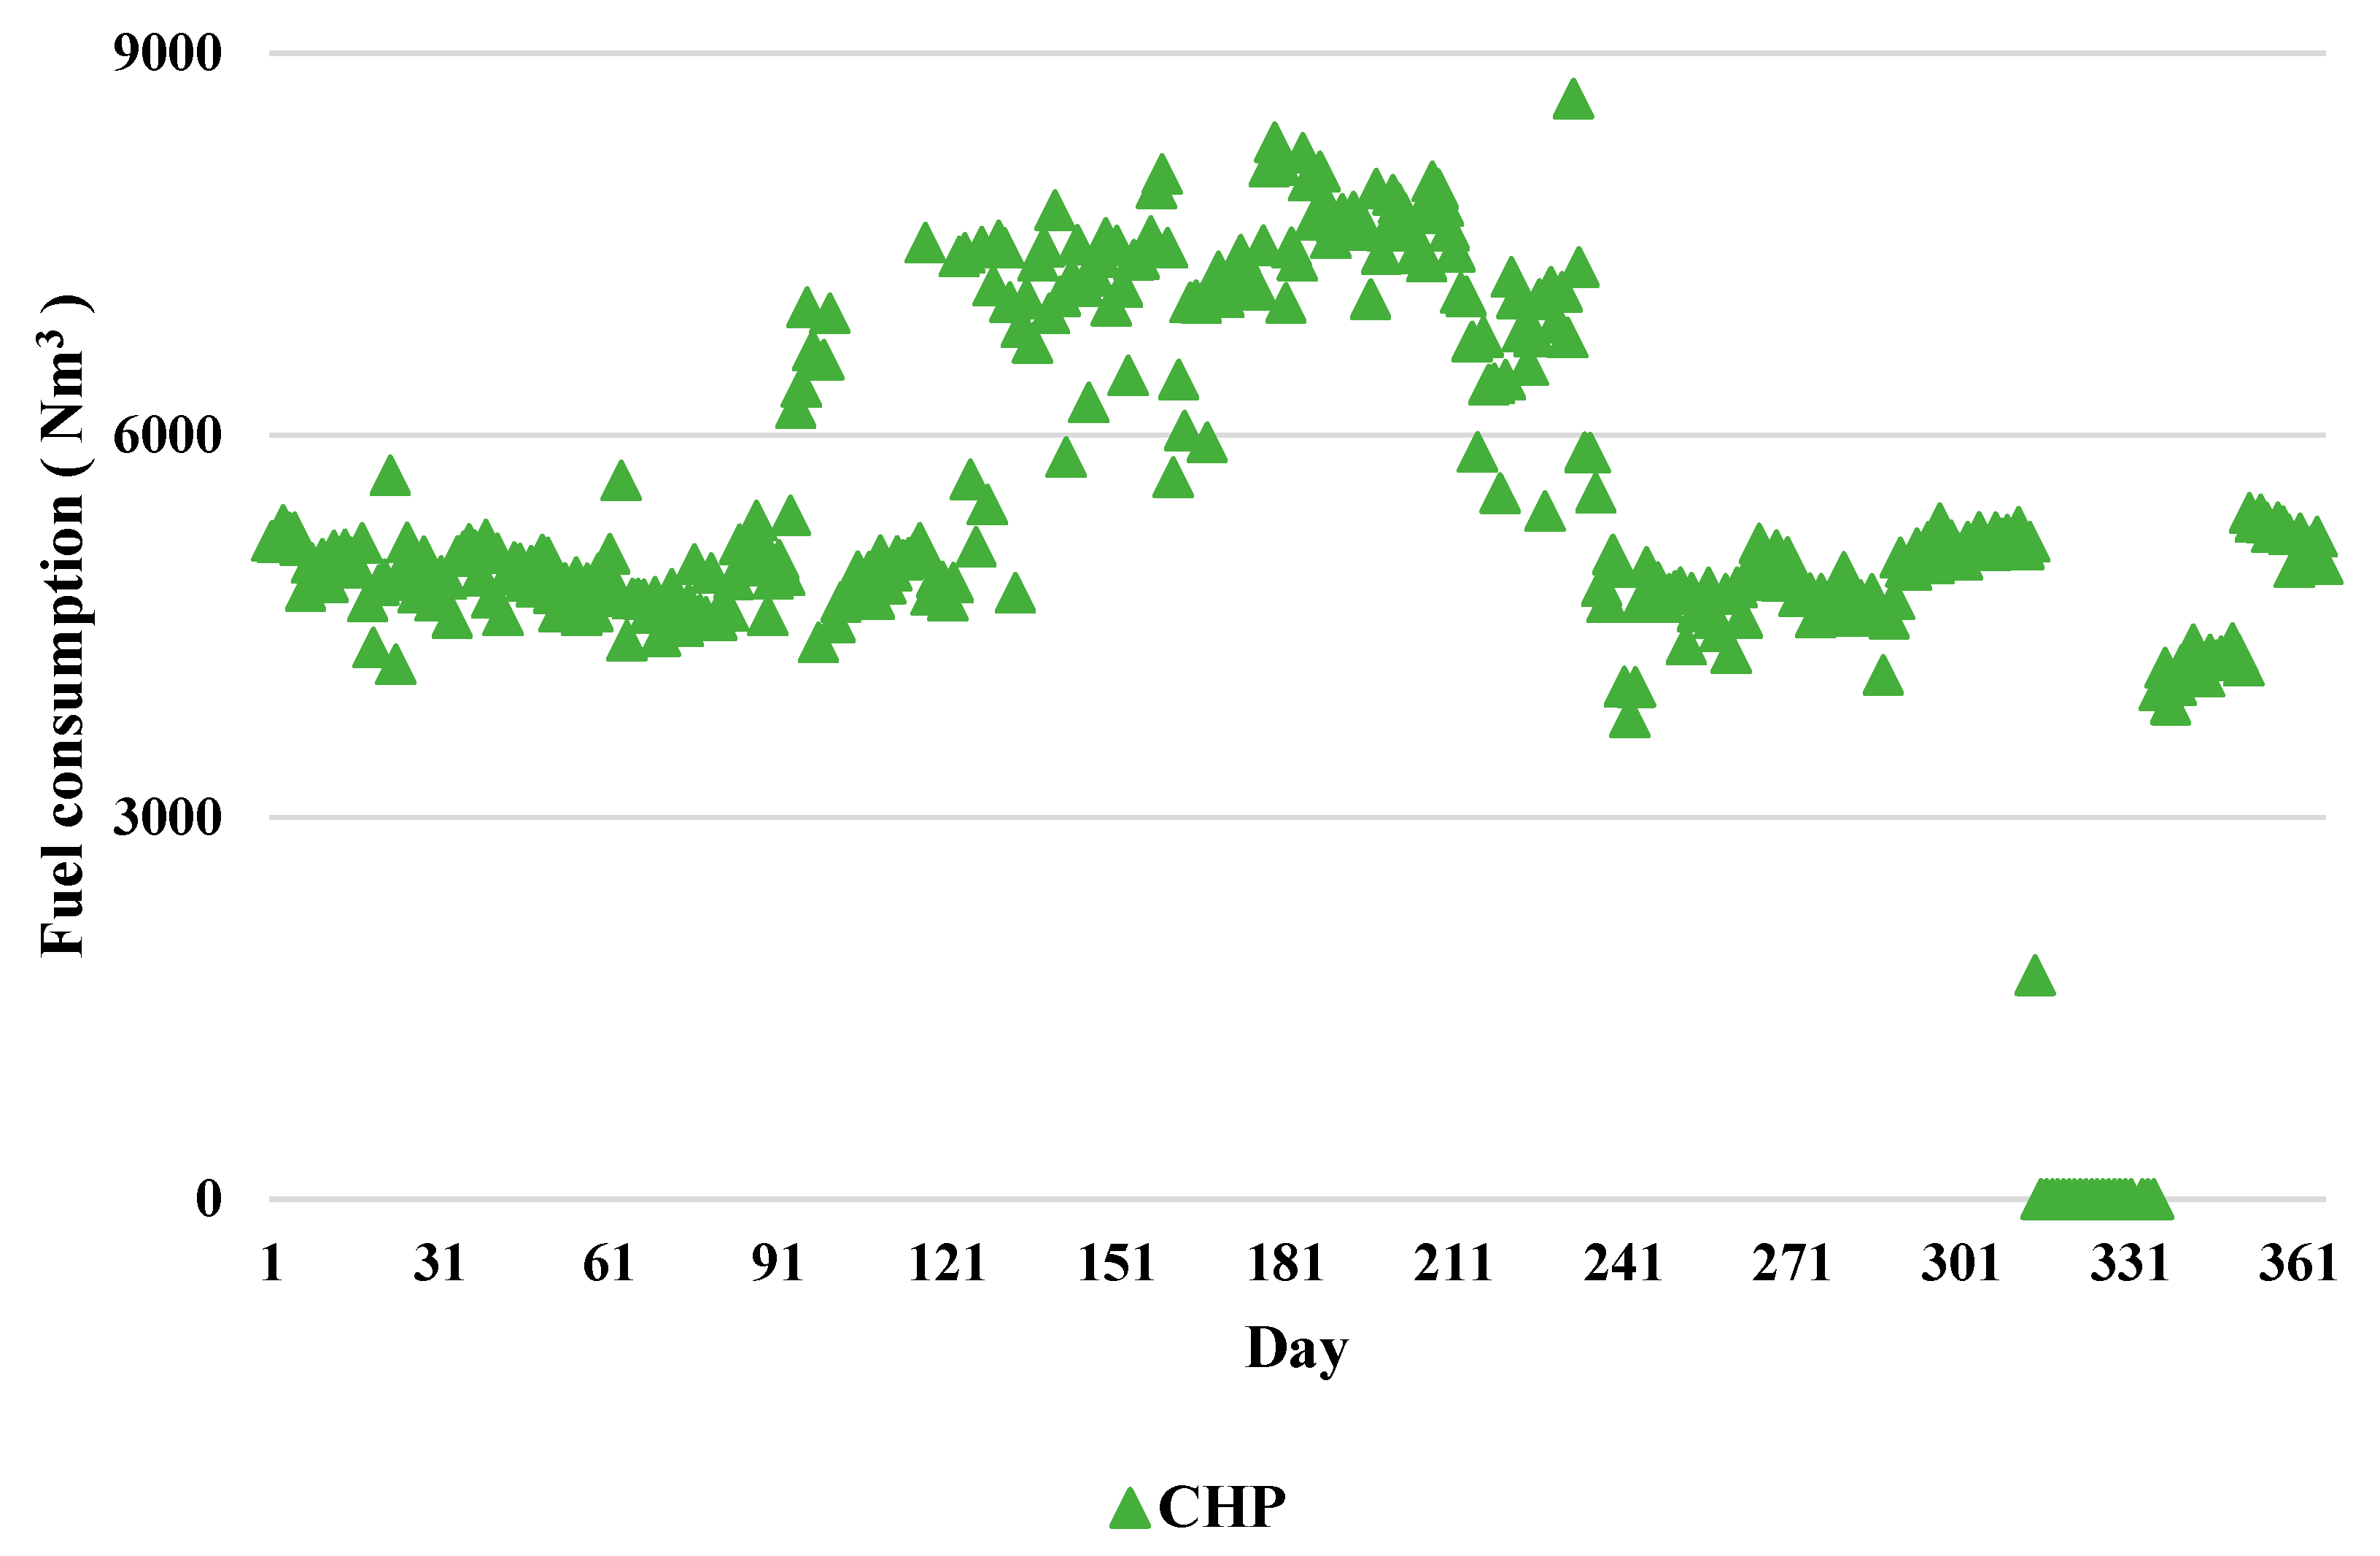
Figure 10. It is shown that the same operation strategy as in Case A was applied to the annual operation of the prime movers, but that the operation was terminated, probably due to system failure or maintenance in December. If there was a cooling load in the building at this time, a major problem would have occurred due to the occurrence of a power peak produced by the operation of the turbo-cooling system. The profile of the fuel consumption of the prime movers is shown in
Figure 11. It shows that the focus is on the operation of the prime movers to manage peak power consumption due to the operation of the turbo chillers. However, the absence of heat-driven cooling measures can cause significant losses in terms of RPES, not to mention operating costs. This difficulty could have been solved if there was a heat trading model using the DHN, but it is worth noting that it was used only for stable heat supply in winter in Case C.
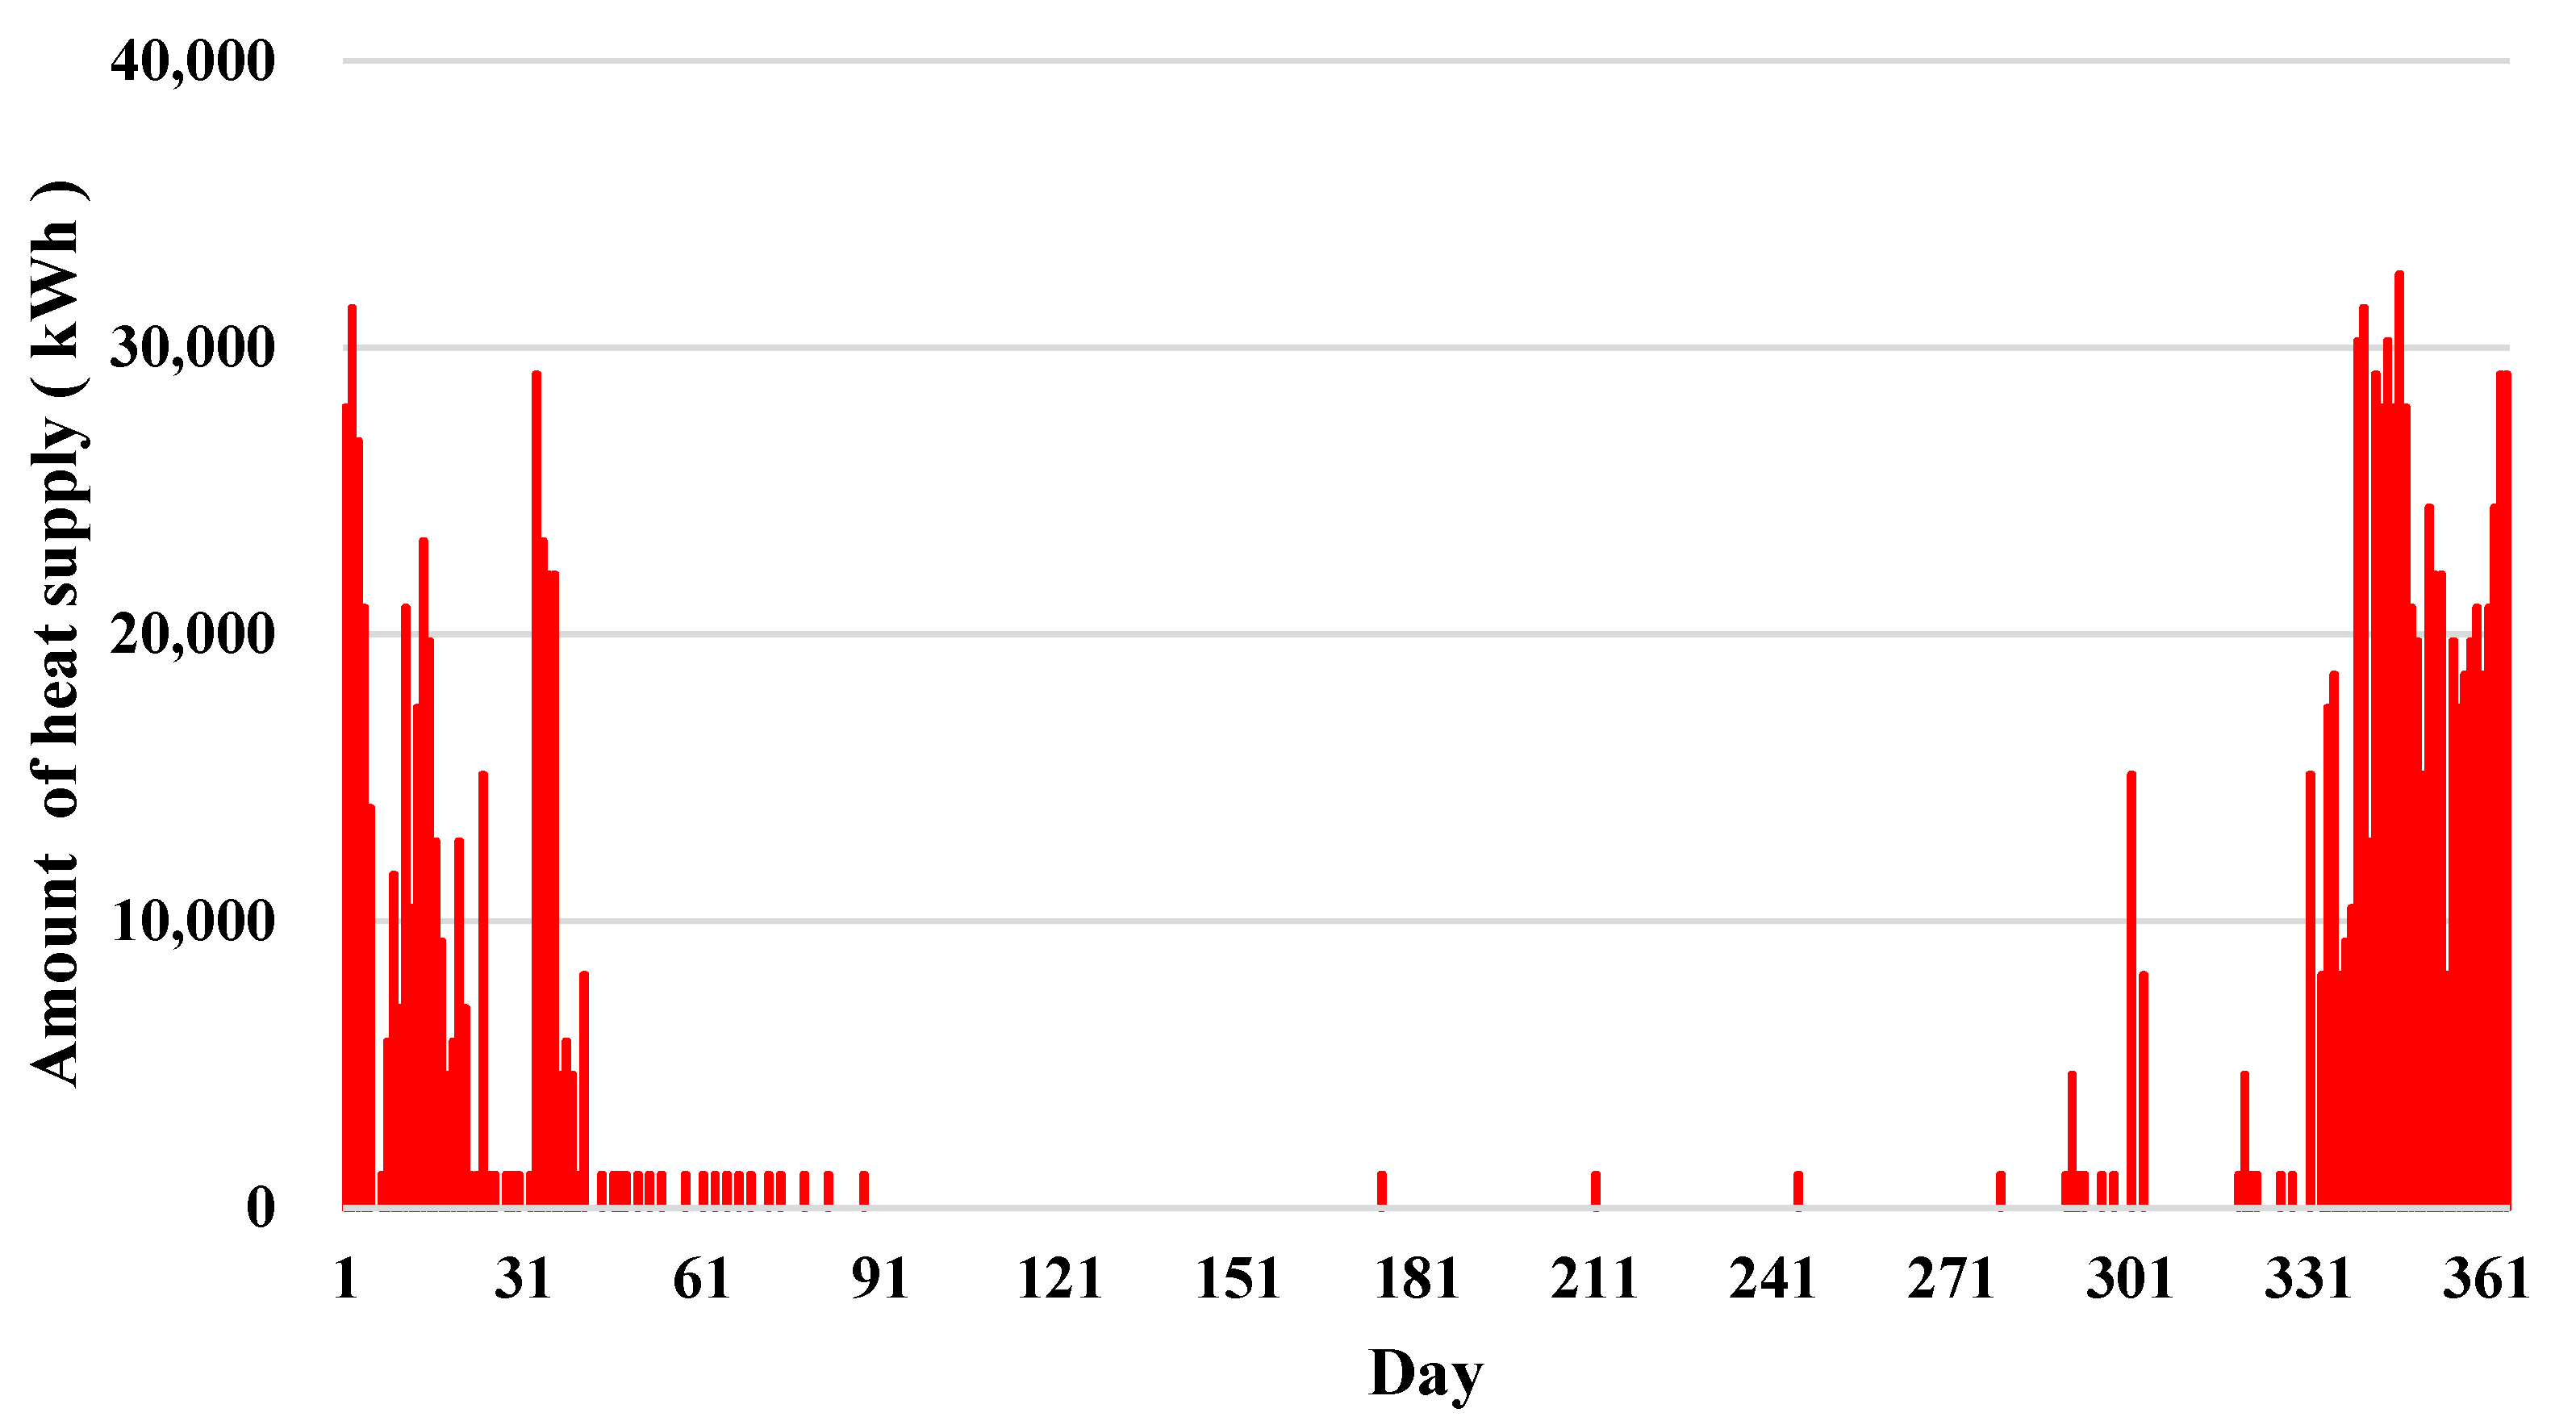
The amount of heat supply from the DHN is shown in
Figure 12. An abrupt increase in heat supply from DHN in December can be attributed to prime mover failure or maintenance. Excluding January and December, the heat supply from DHN sharply decreases. Therefore, in order to further promote heat sales from the DHN, it can be a desirable alternative to introduce an absorption cooling system, as long as the facility space permits. However, this is a matter to be decided in terms of economic rather than technological aspects.
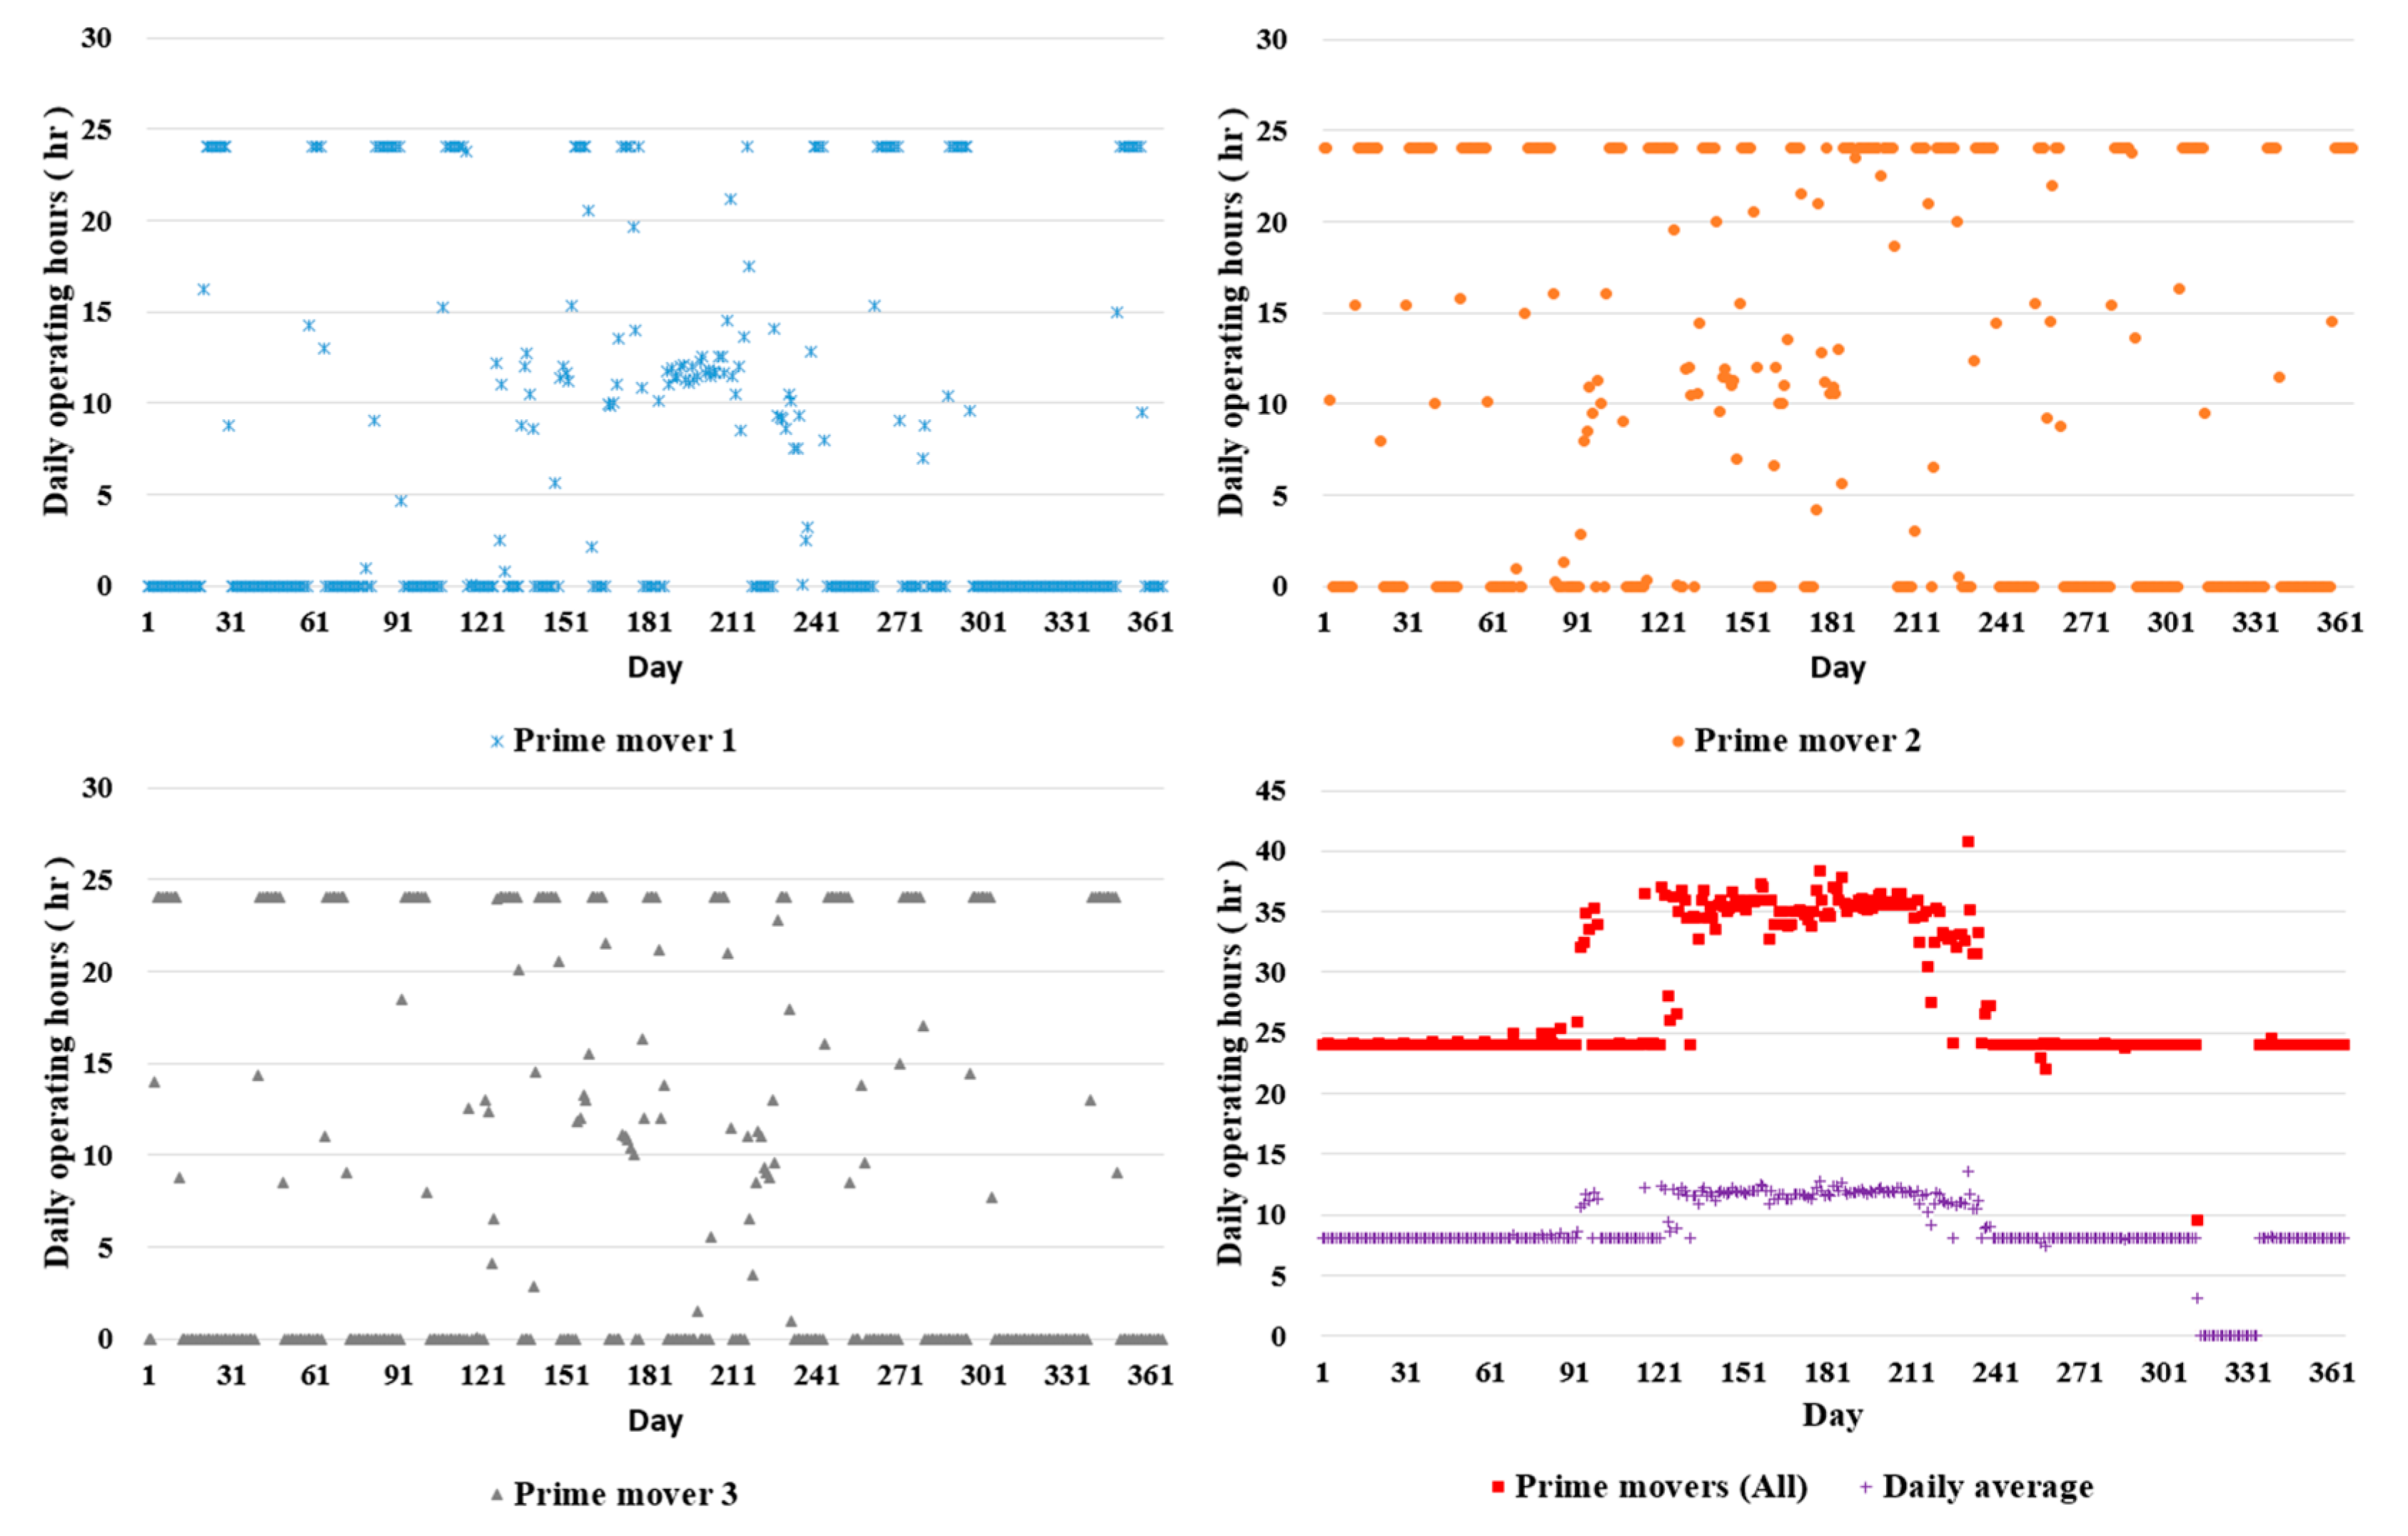
The daily and the monthly averaged daily operation hours for each prime mover are shown in
Figure 13. Unlike the previous two cases, Case A and B, a slightly different operating plan was applied to this prime mover, in that all three units were operated alternately. The situation that all prime movers failed at the same time in December may be attributed to this operating scheme. However, even in that case, the supplying of heat to meet the peak heating demand was not influenced at all, due to the connection with DHN.
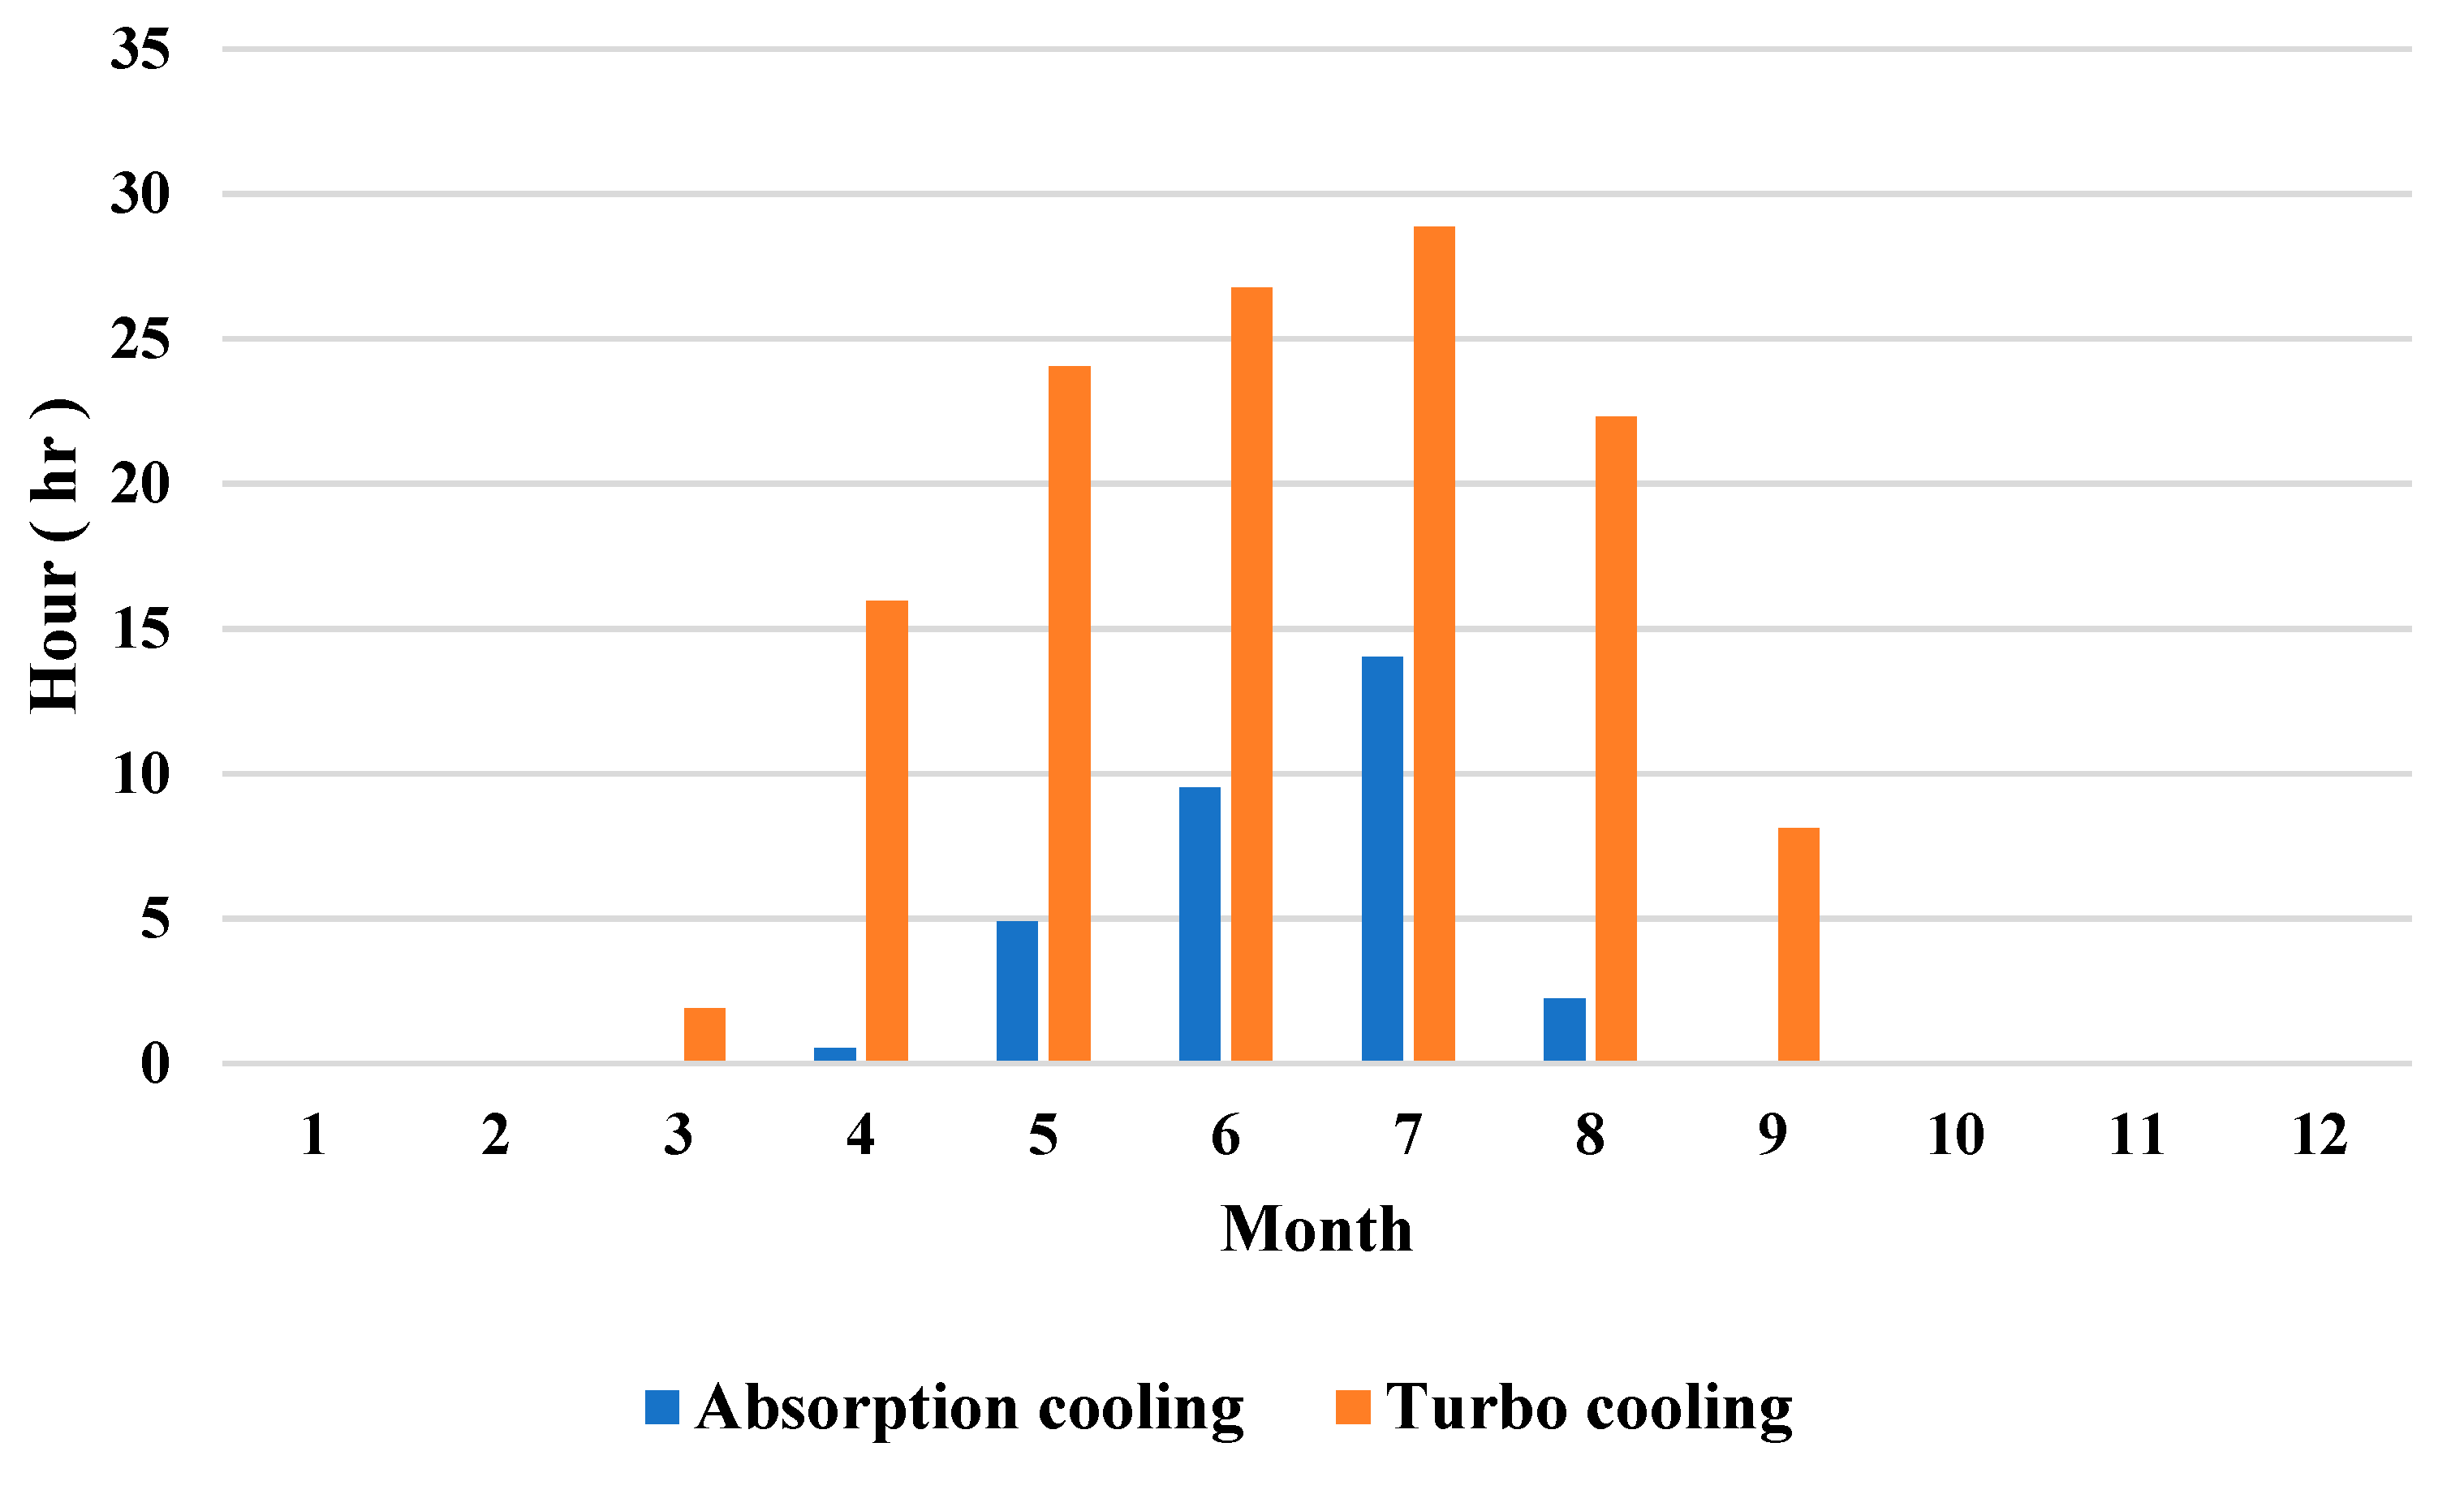
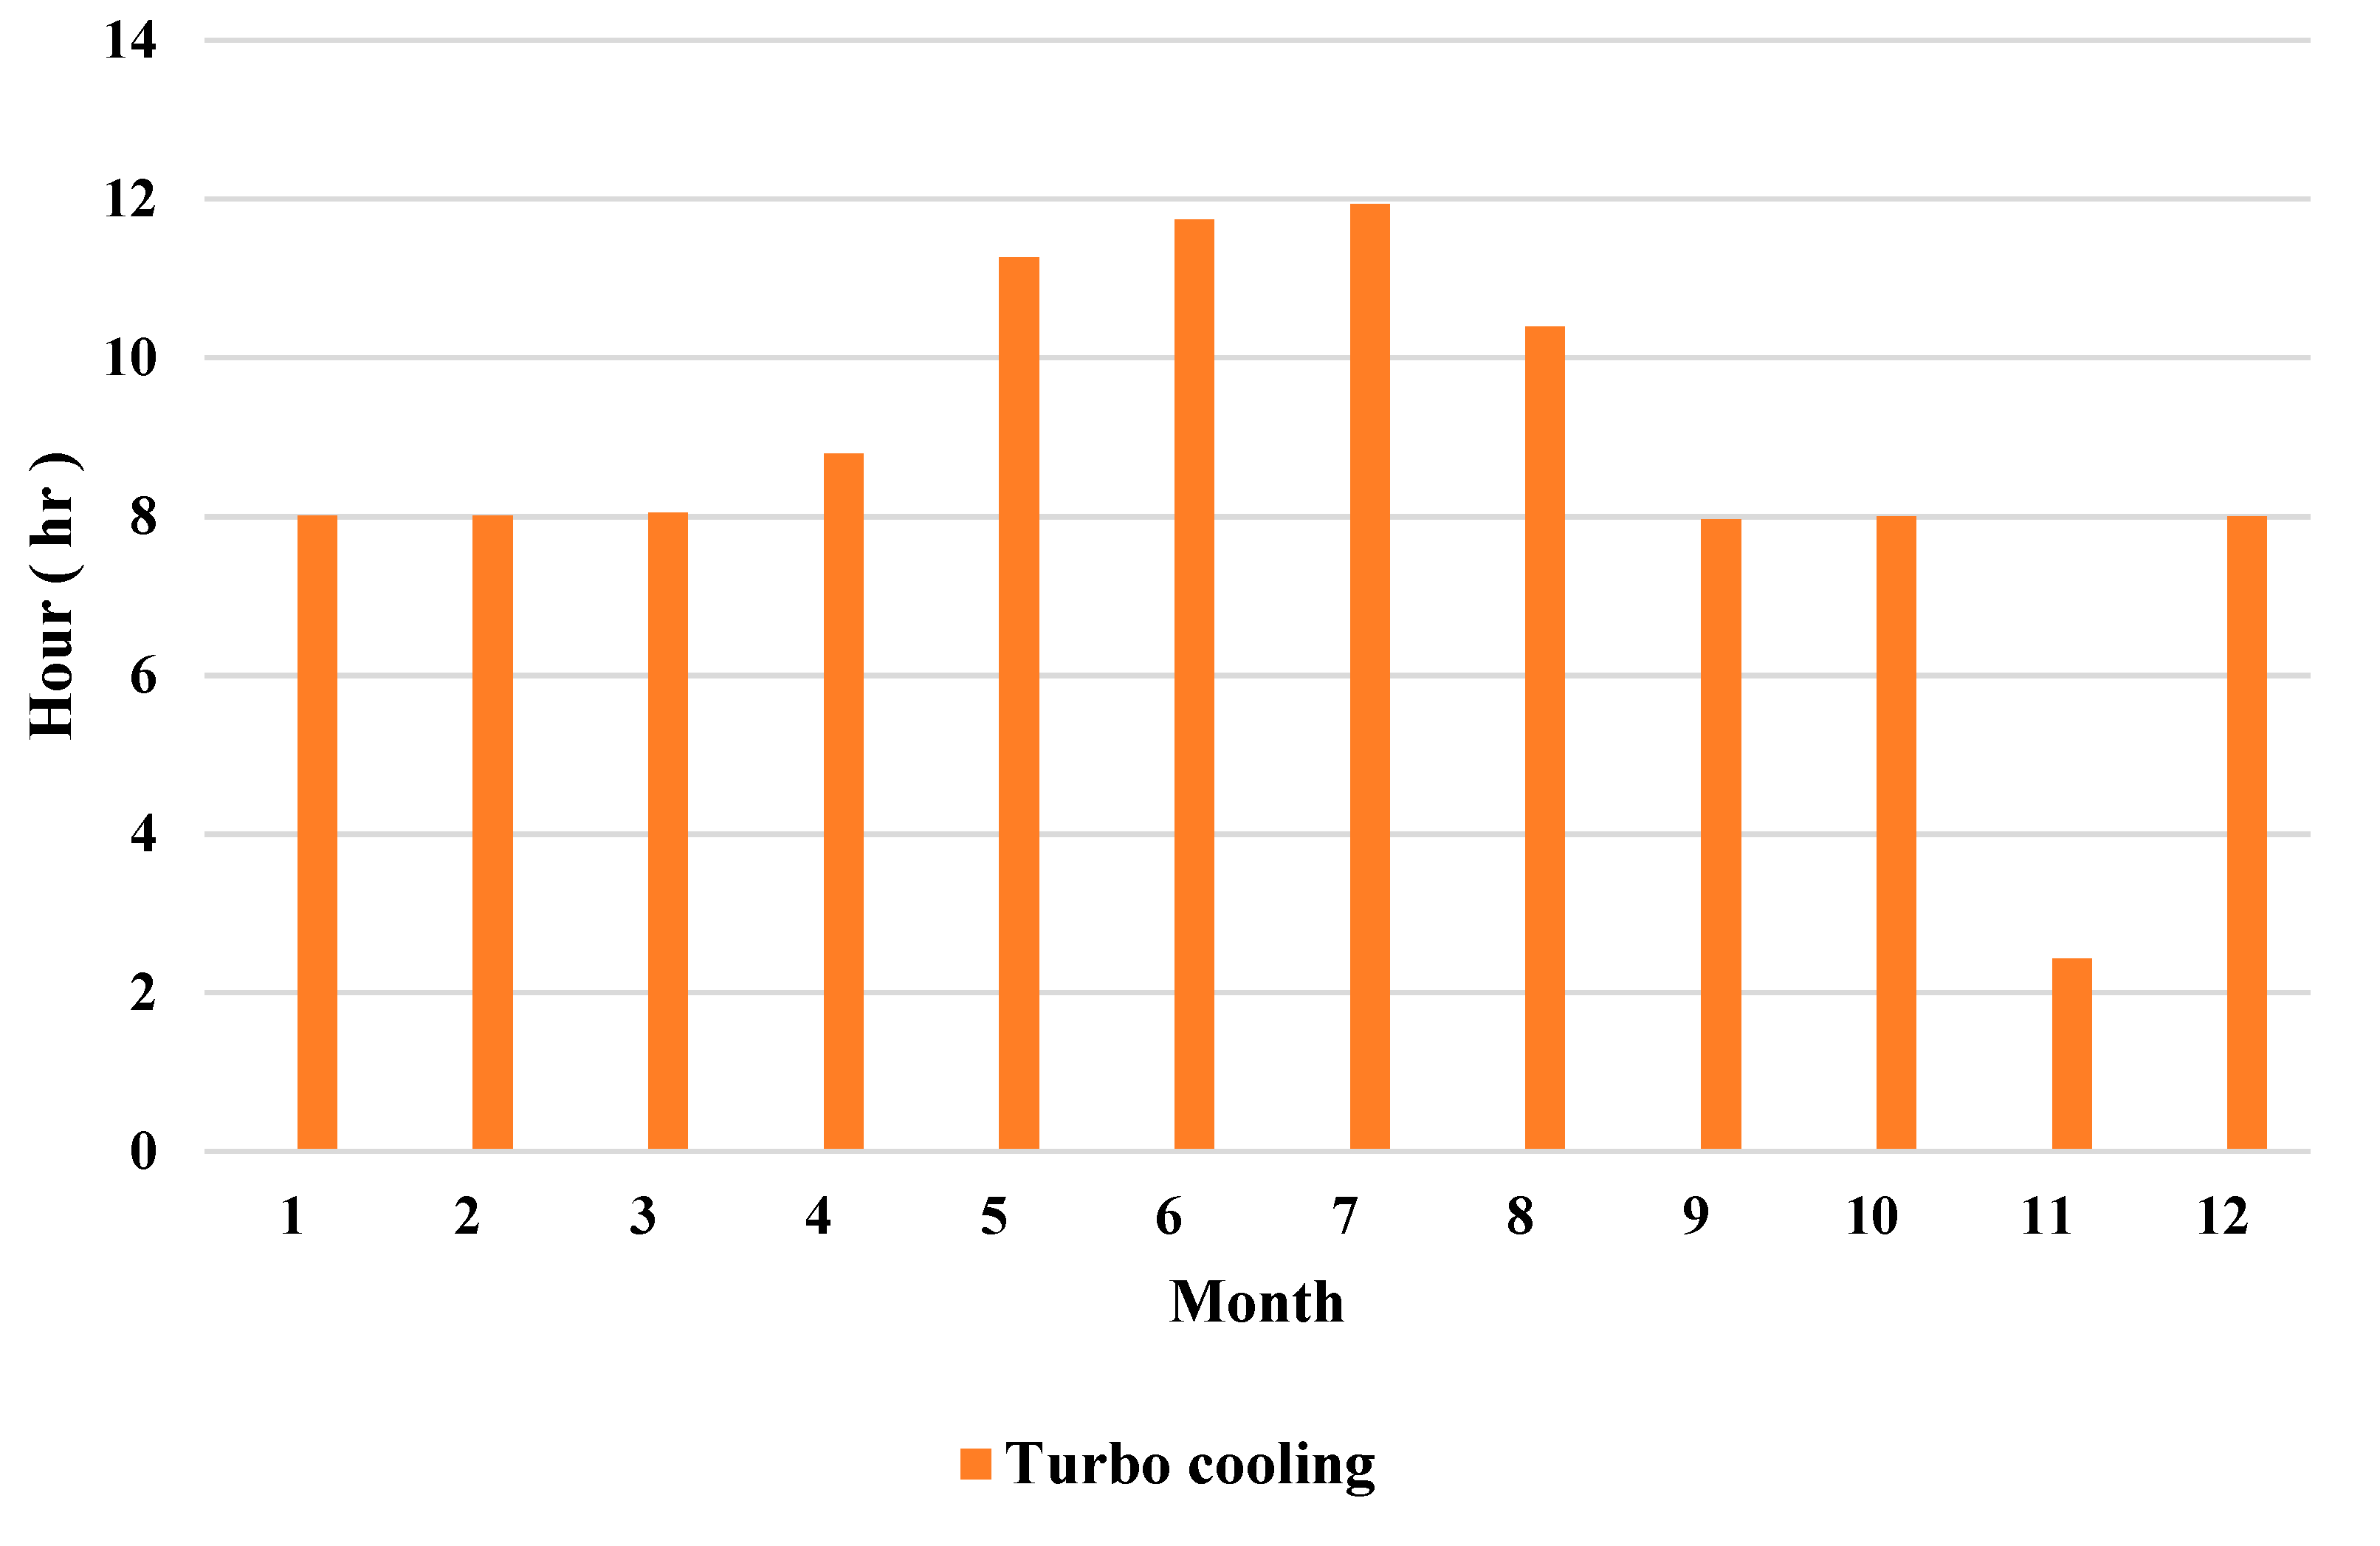
Figure 14 shows the monthly averaged daily operation hours for turbo chillers for Case C. Instead of applying absorption cooling, it is noted that, unlike the previous two cases, turbo-cooling is applied all year round.
2.2. Analysis Methods for RPES Evaluation
The RPES is defined as the ratio of the difference between primary energy consumed by the two comparative energy generation methods. The amount of primary energy savings provided by tri-generation production was calculated on the basis of the following formula [
9]:
where
is the thermal efficiency of the tri-generation production, defined as annual useful heat output divided by the useful input (i.e., the input used to produce the sum of useful heat output and electricity), and
denotes the thermal efficiency reference value for SHP. The subscript of
for
CCHP and
Ref is for the electrical efficiency of the tri-generation and separate electricity production, respectively [
9]. In general, in most of the literature, the overall value of RPES,
, was theoretically evaluated through parametric calculations. However, this simple and theoretical approach has the disadvantage of not being able to obtain detailed information on the dynamic behavior of the system, or on the impact of daily or hourly operational controls for optimal design and management. To compensate for the shortcomings of the existing approach, this study intends to introduce a daily RPES value for the assessment of the effects by annual operational management strategy, which is possible because detailed operational data were secured through a survey, as described above. The overall RPES value for the analysis cases can be easily evaluated from the daily RPES values, as follows:
The daily RPES, , is also evaluated relative to a reference SHP system. The RPES has been widely used for the evaluation of technological performance of the CGS and TGS compared to SHP. In particular, this can be said to be a suitable means of verifying the operational efficiency in a certain period between two comparative energy supply systems.
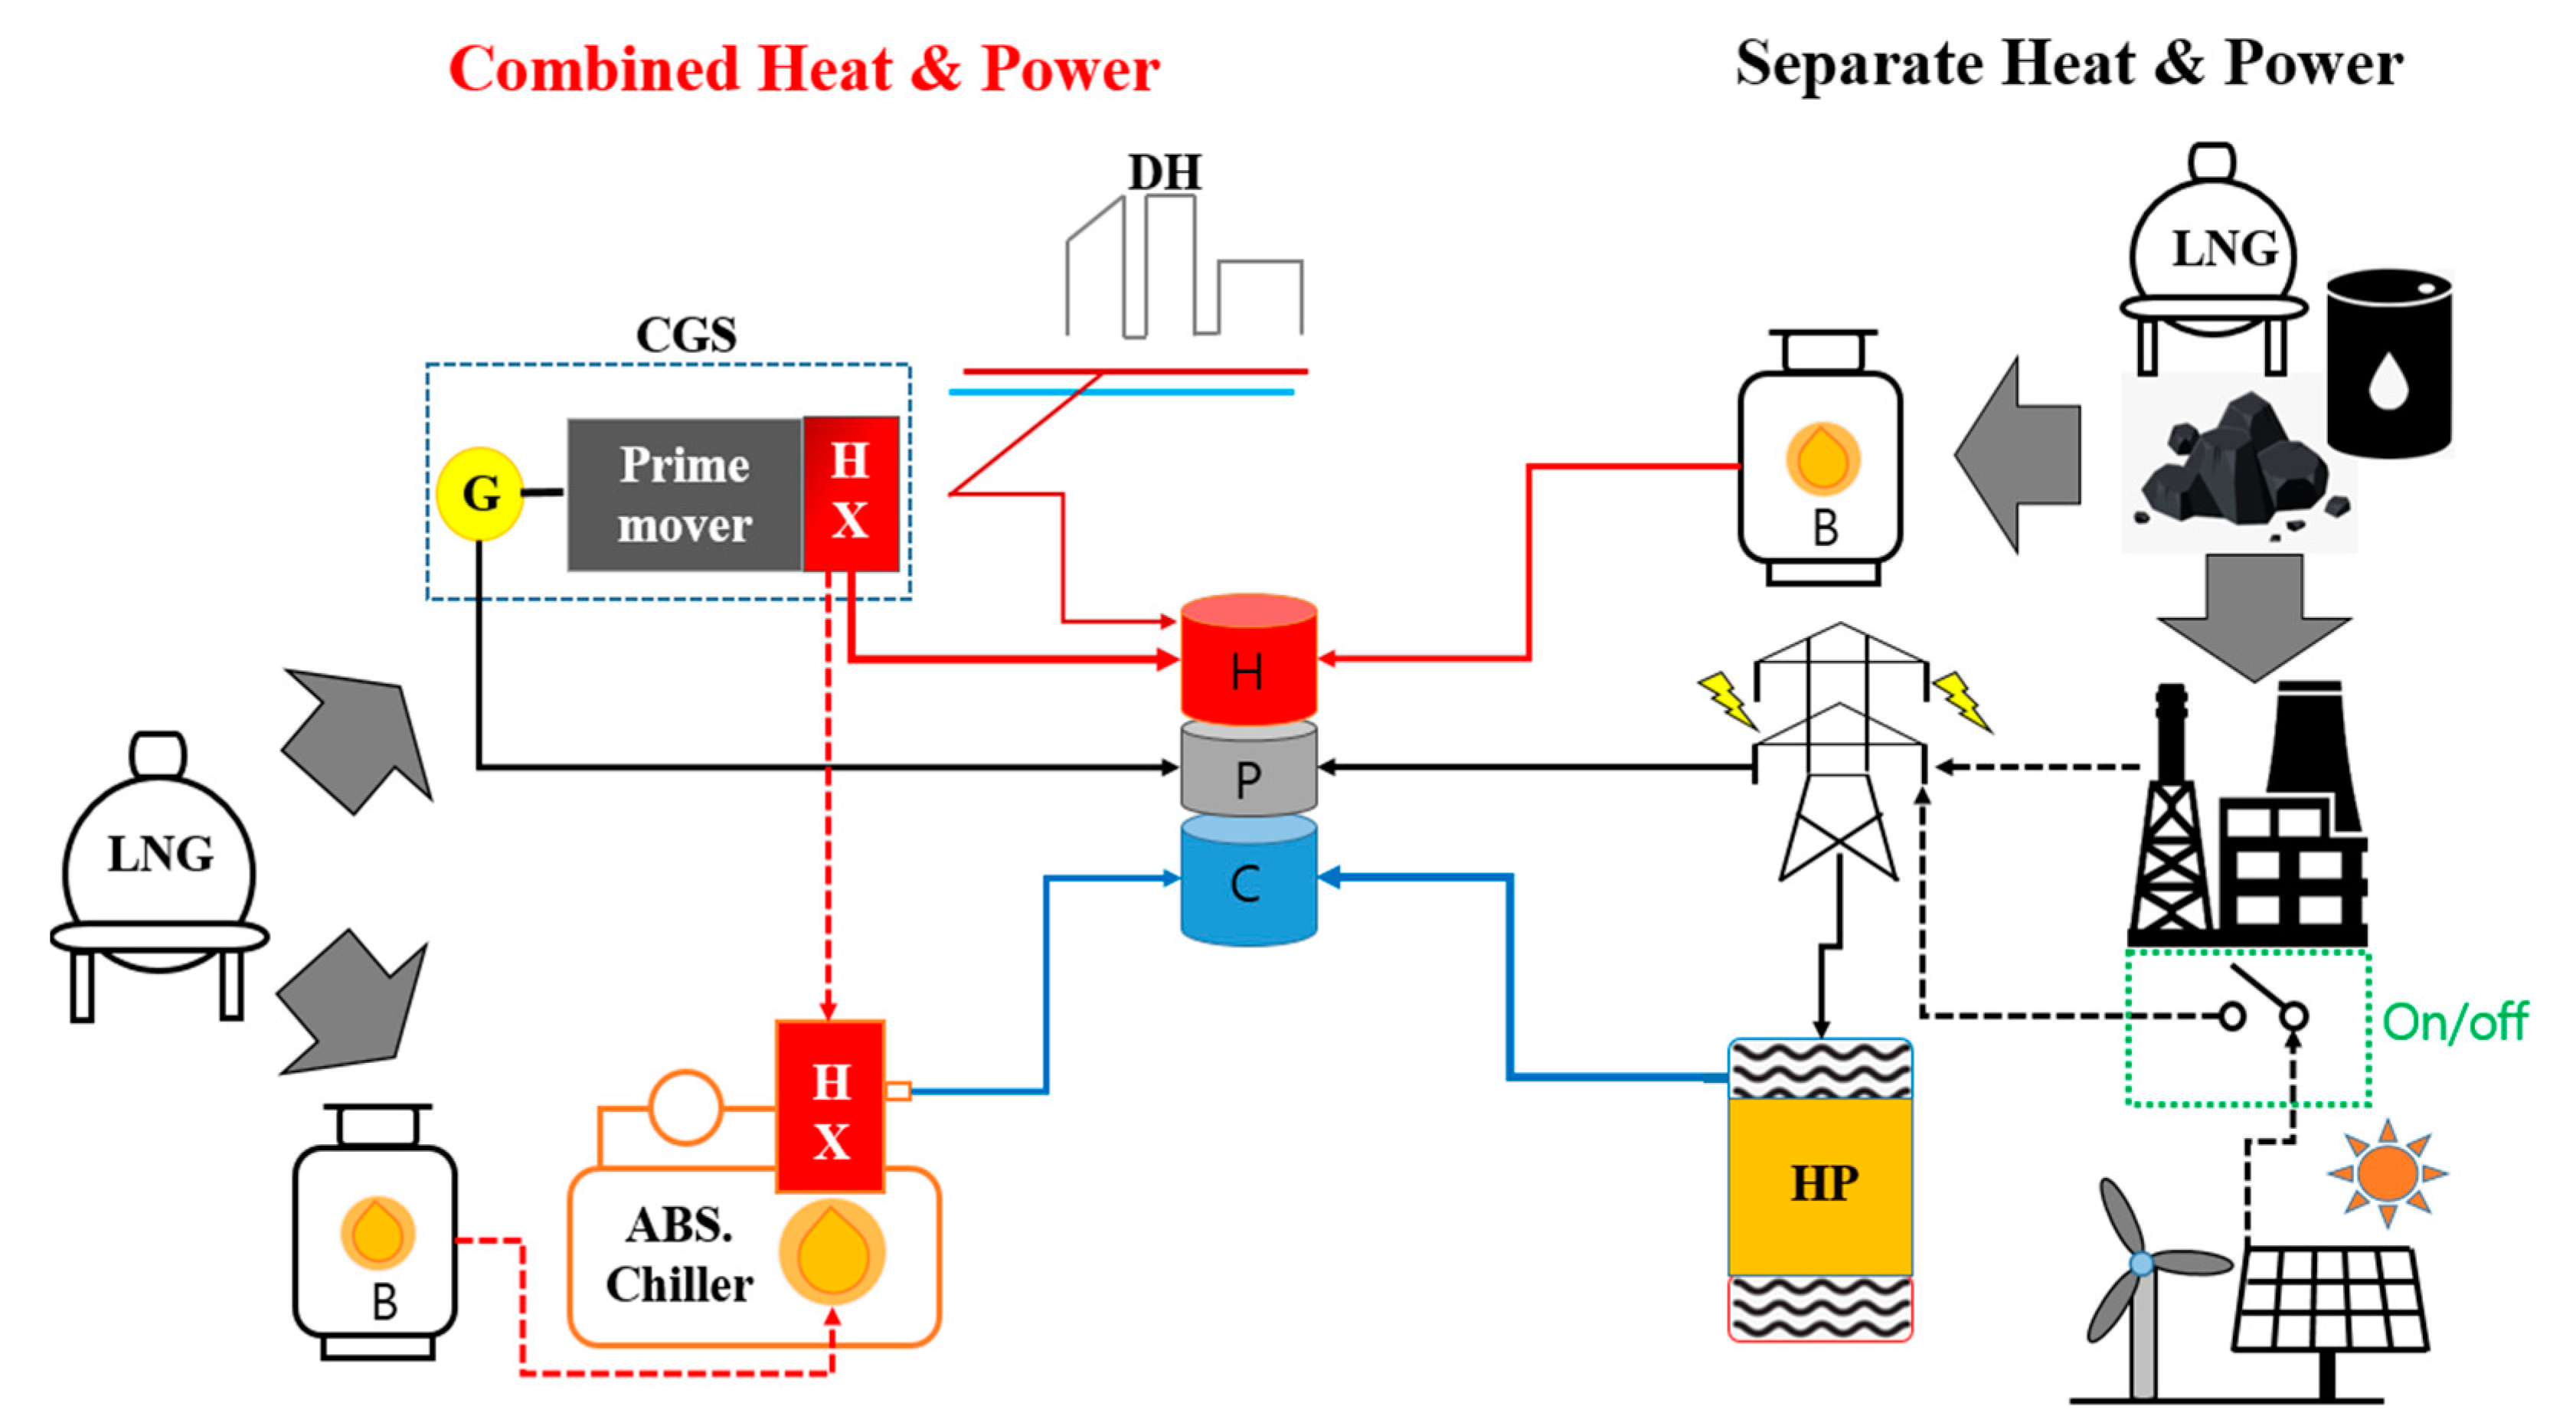
Figure 15 shows an illustrative diagram for the procedure of evaluating RPES. In the evaluation of RPES, it should be noted that the reference amount to be produced by the two comparative energy generation methods should be the consumption amount, not the production amount. For example, in a comparison of cogeneration technology with SHP, unutilized recovered heat from the operation of CHP prime movers should not be included in the reference amount of heat for RPES calculation. This is because RPES can be regarded as the index for measuring operational efficiency, rather system efficiency. Due to the vague guideline for handling the recovered heat from the operation of the CHP prime movers, this often leads to the miscalculation of the quantity included in the evaluation of RPES, thus producing non-objective results. In addition, great care must also be taken in selecting input values for energy loss parameters, such as transmission loss in the power grid, or transportation loss in the thermal grid, etc. RPES values evaluated using actual field operation data, as in this study, can remove a lot of the uncertainty in the analysis stage, so that reliable results can be obtained. In addition, the daily distribution of RPES, or the distribution of RPES as a function of the main operating variable according to the applied operational strategies, which can only be evaluated by detailed operation data, is available, and can be used to formulate proper measures to improve operational performance.
As can be seen in
Figure 15, the heat from DHN can be supplied to the connected building in Case C. In Case C, as described in above, the maximum heating load is partially covered by the heat from the adjacent DHN; however, not only interactive heat exchange between the building and the DHN, but also waste heat utilization for heat-driven cooling, have not been implemented. The contribution to RPES by the heat from the DHN is dependent on the system configuration and operating characteristics of DH system, i.e., CHP-based DH, or PLB- and incinerator-based DH. As for Case C, the annual RPES evaluation value for the connected DHN, consisting of CHP as the prime movers, was estimated to be about 29% [
15], and the amount of primary energy consumed regarding the heat from DHN can be evaluated as follows:
where
denotes the primary energy consumed for producing heat supplied from DHN, and
represents the primary energy consumed for producing heat supplied from DHN by the SHP method.
Moreover, reflecting the impact of renewable power generation in SHP is the main concern of this study. In
Figure 15, if the switch is on, the contribution of renewable power generation to the power sector can exert a significant impact on the RPES value, as will be discussed below. The contribution of renewable power generation, if it is determined to be included in the evaluation process, can be modeled as being reflected in the parameter of overall power conversion efficiency of SHP. The data used for estimating the overall power conversion efficiency of SHP, and the weighted power conversion efficiency for RPES evaluation according to the level of renewable power generation distribution, are presented in
Table 2 and
Table 3, respectively.
Table 4 summarizes the reference values of the operating parameters adopted for the evaluation of RPES in this study, considering conditions in the domestic market of South Korea, where
and
denote the power transmission and distribution loss, and the value of RPES for the heat supplied from CHP-based DHN, respectively.
2.3. Analysis Results
2.3.1. Analysis of Operational Characteristics
The annual average RPES values evaluated for the cases of analyzed in this study are summarized in
Table 5.
Case A was analyzed first among the three cases. It is interesting to note that the RPES values for the other two cases show large differences compared with those for Case A. In particular, for Case C, it did not make any difference to SHP. In order to elucidate the main causes of these uncommon outcomes for Cases B and C, the effects of operational strategy used to meet the dynamic demand variations on the corresponding RPES are to be assessed by inspecting the annual daily distribution, and the distribution as a function of the main operating variable, i.e., prime mover power production, based on the annual operation data of the survey, as follows.
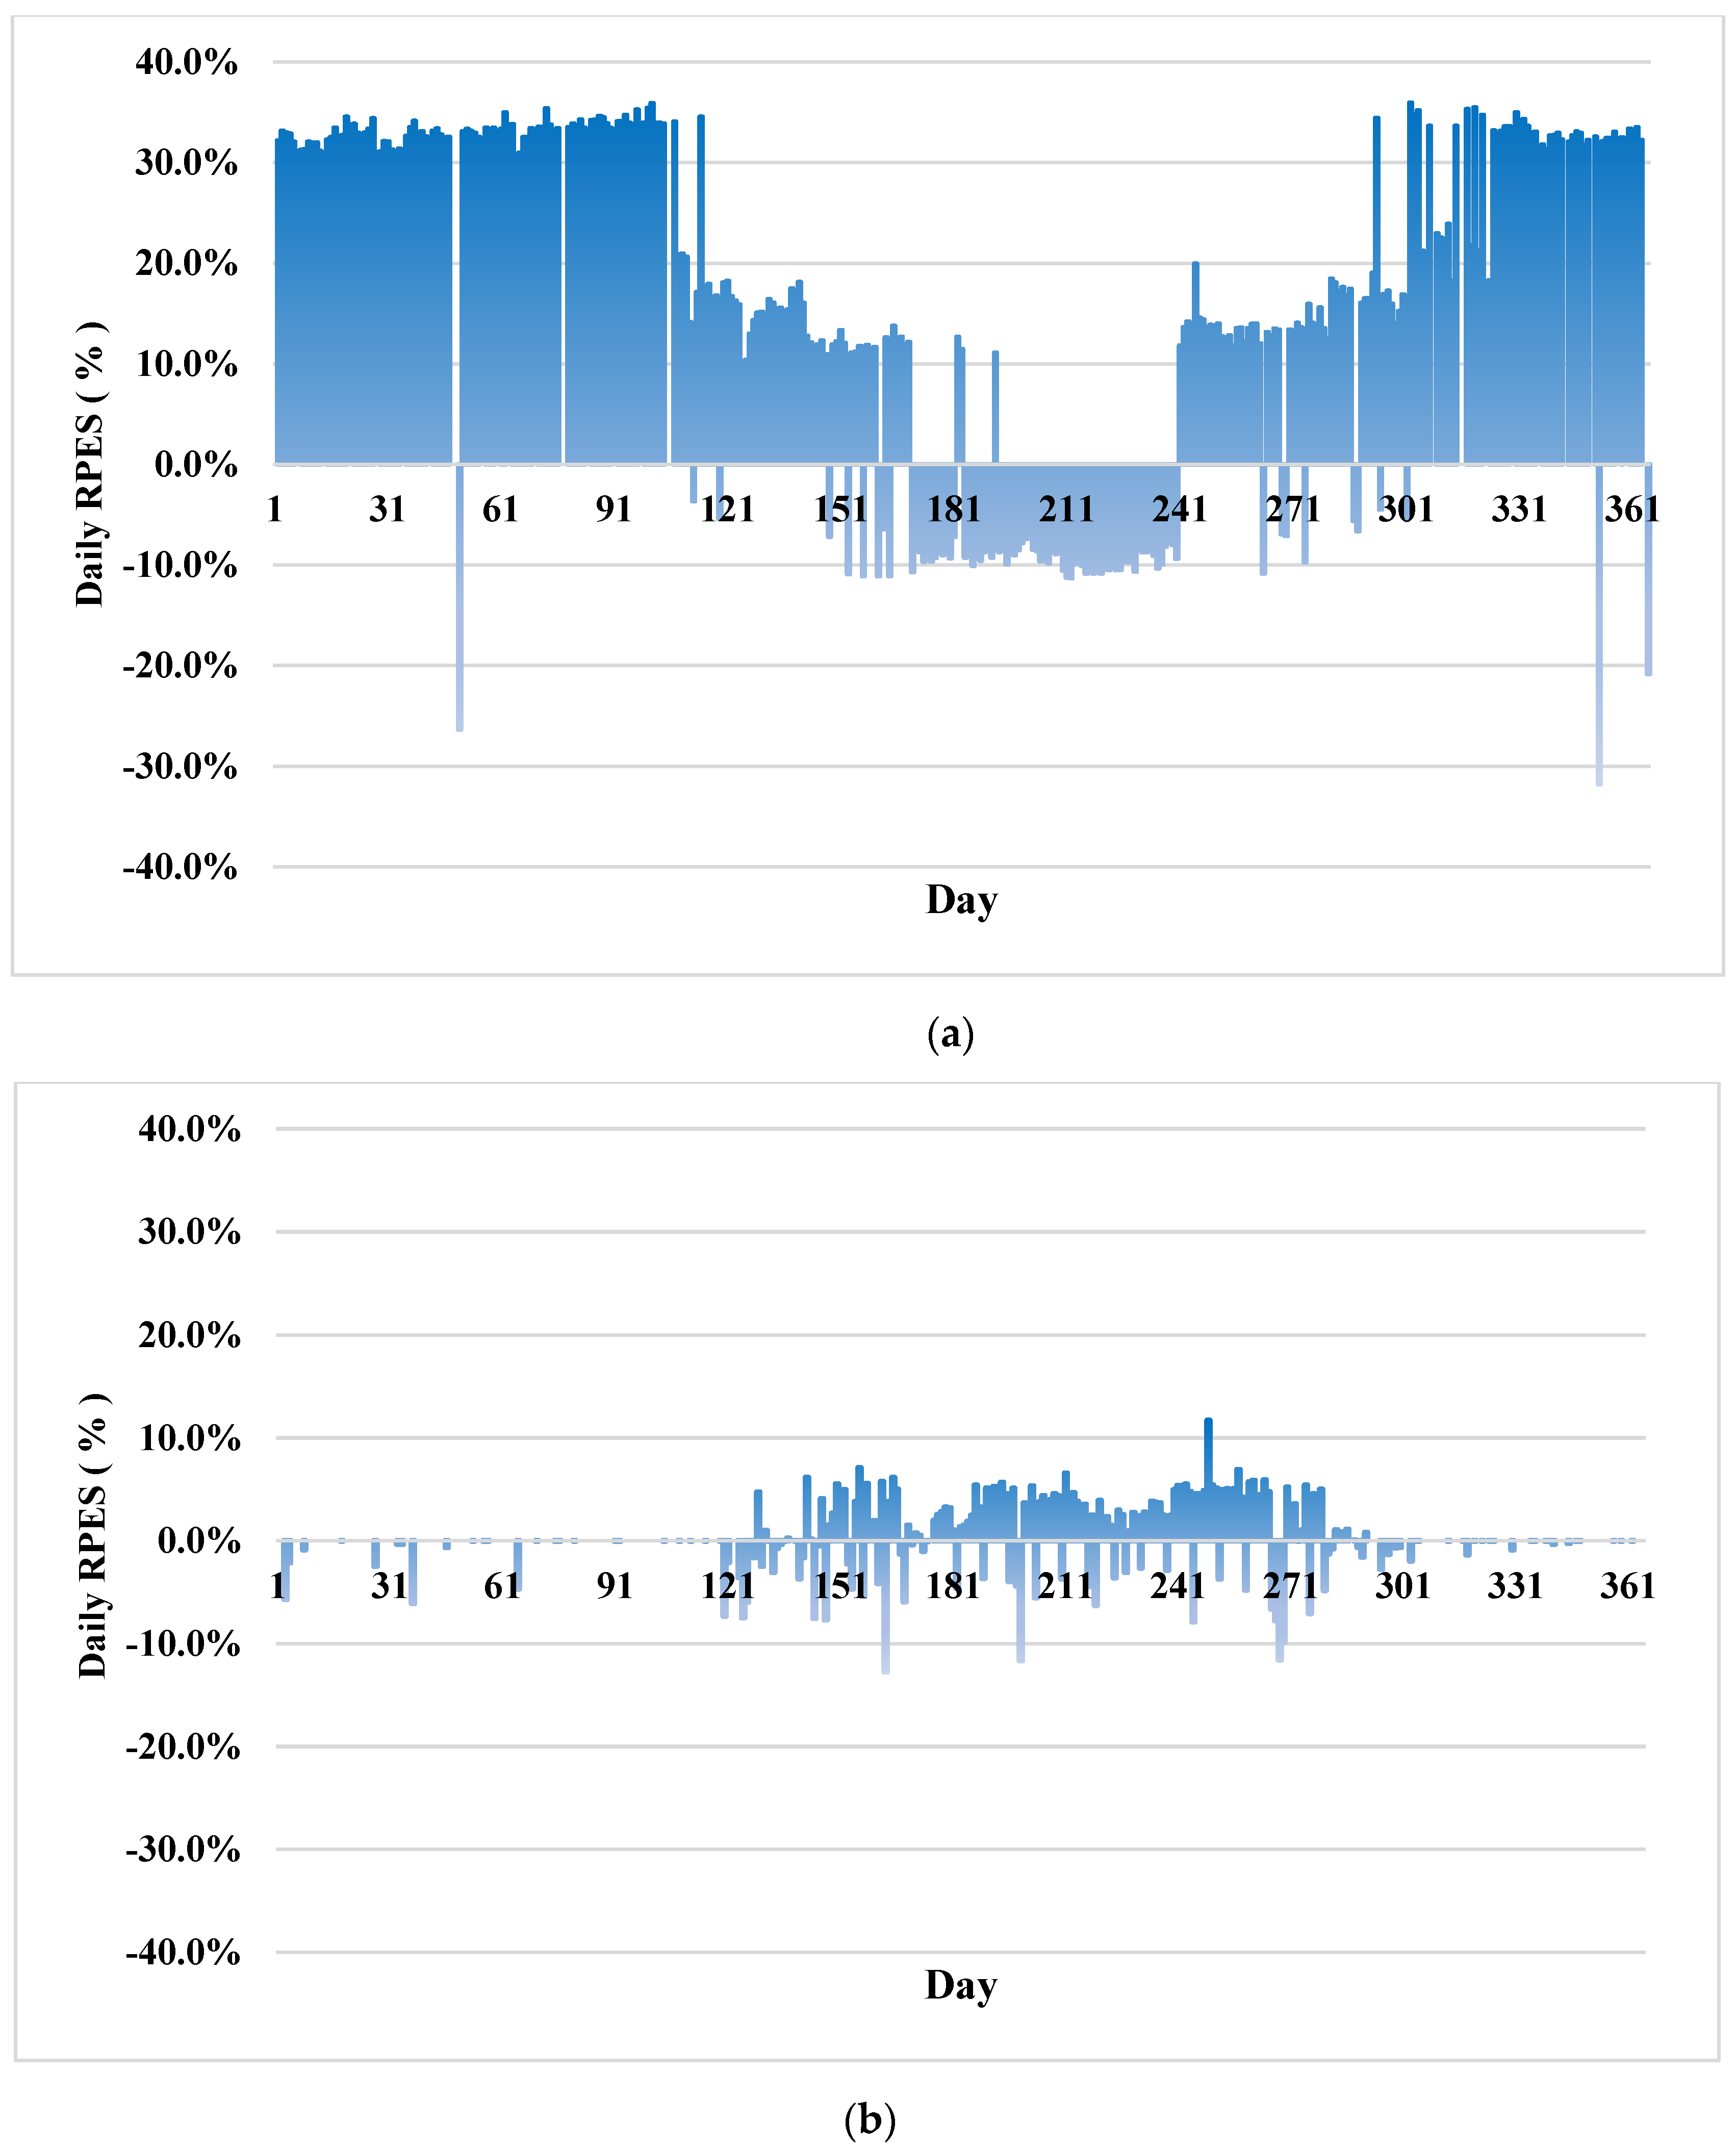
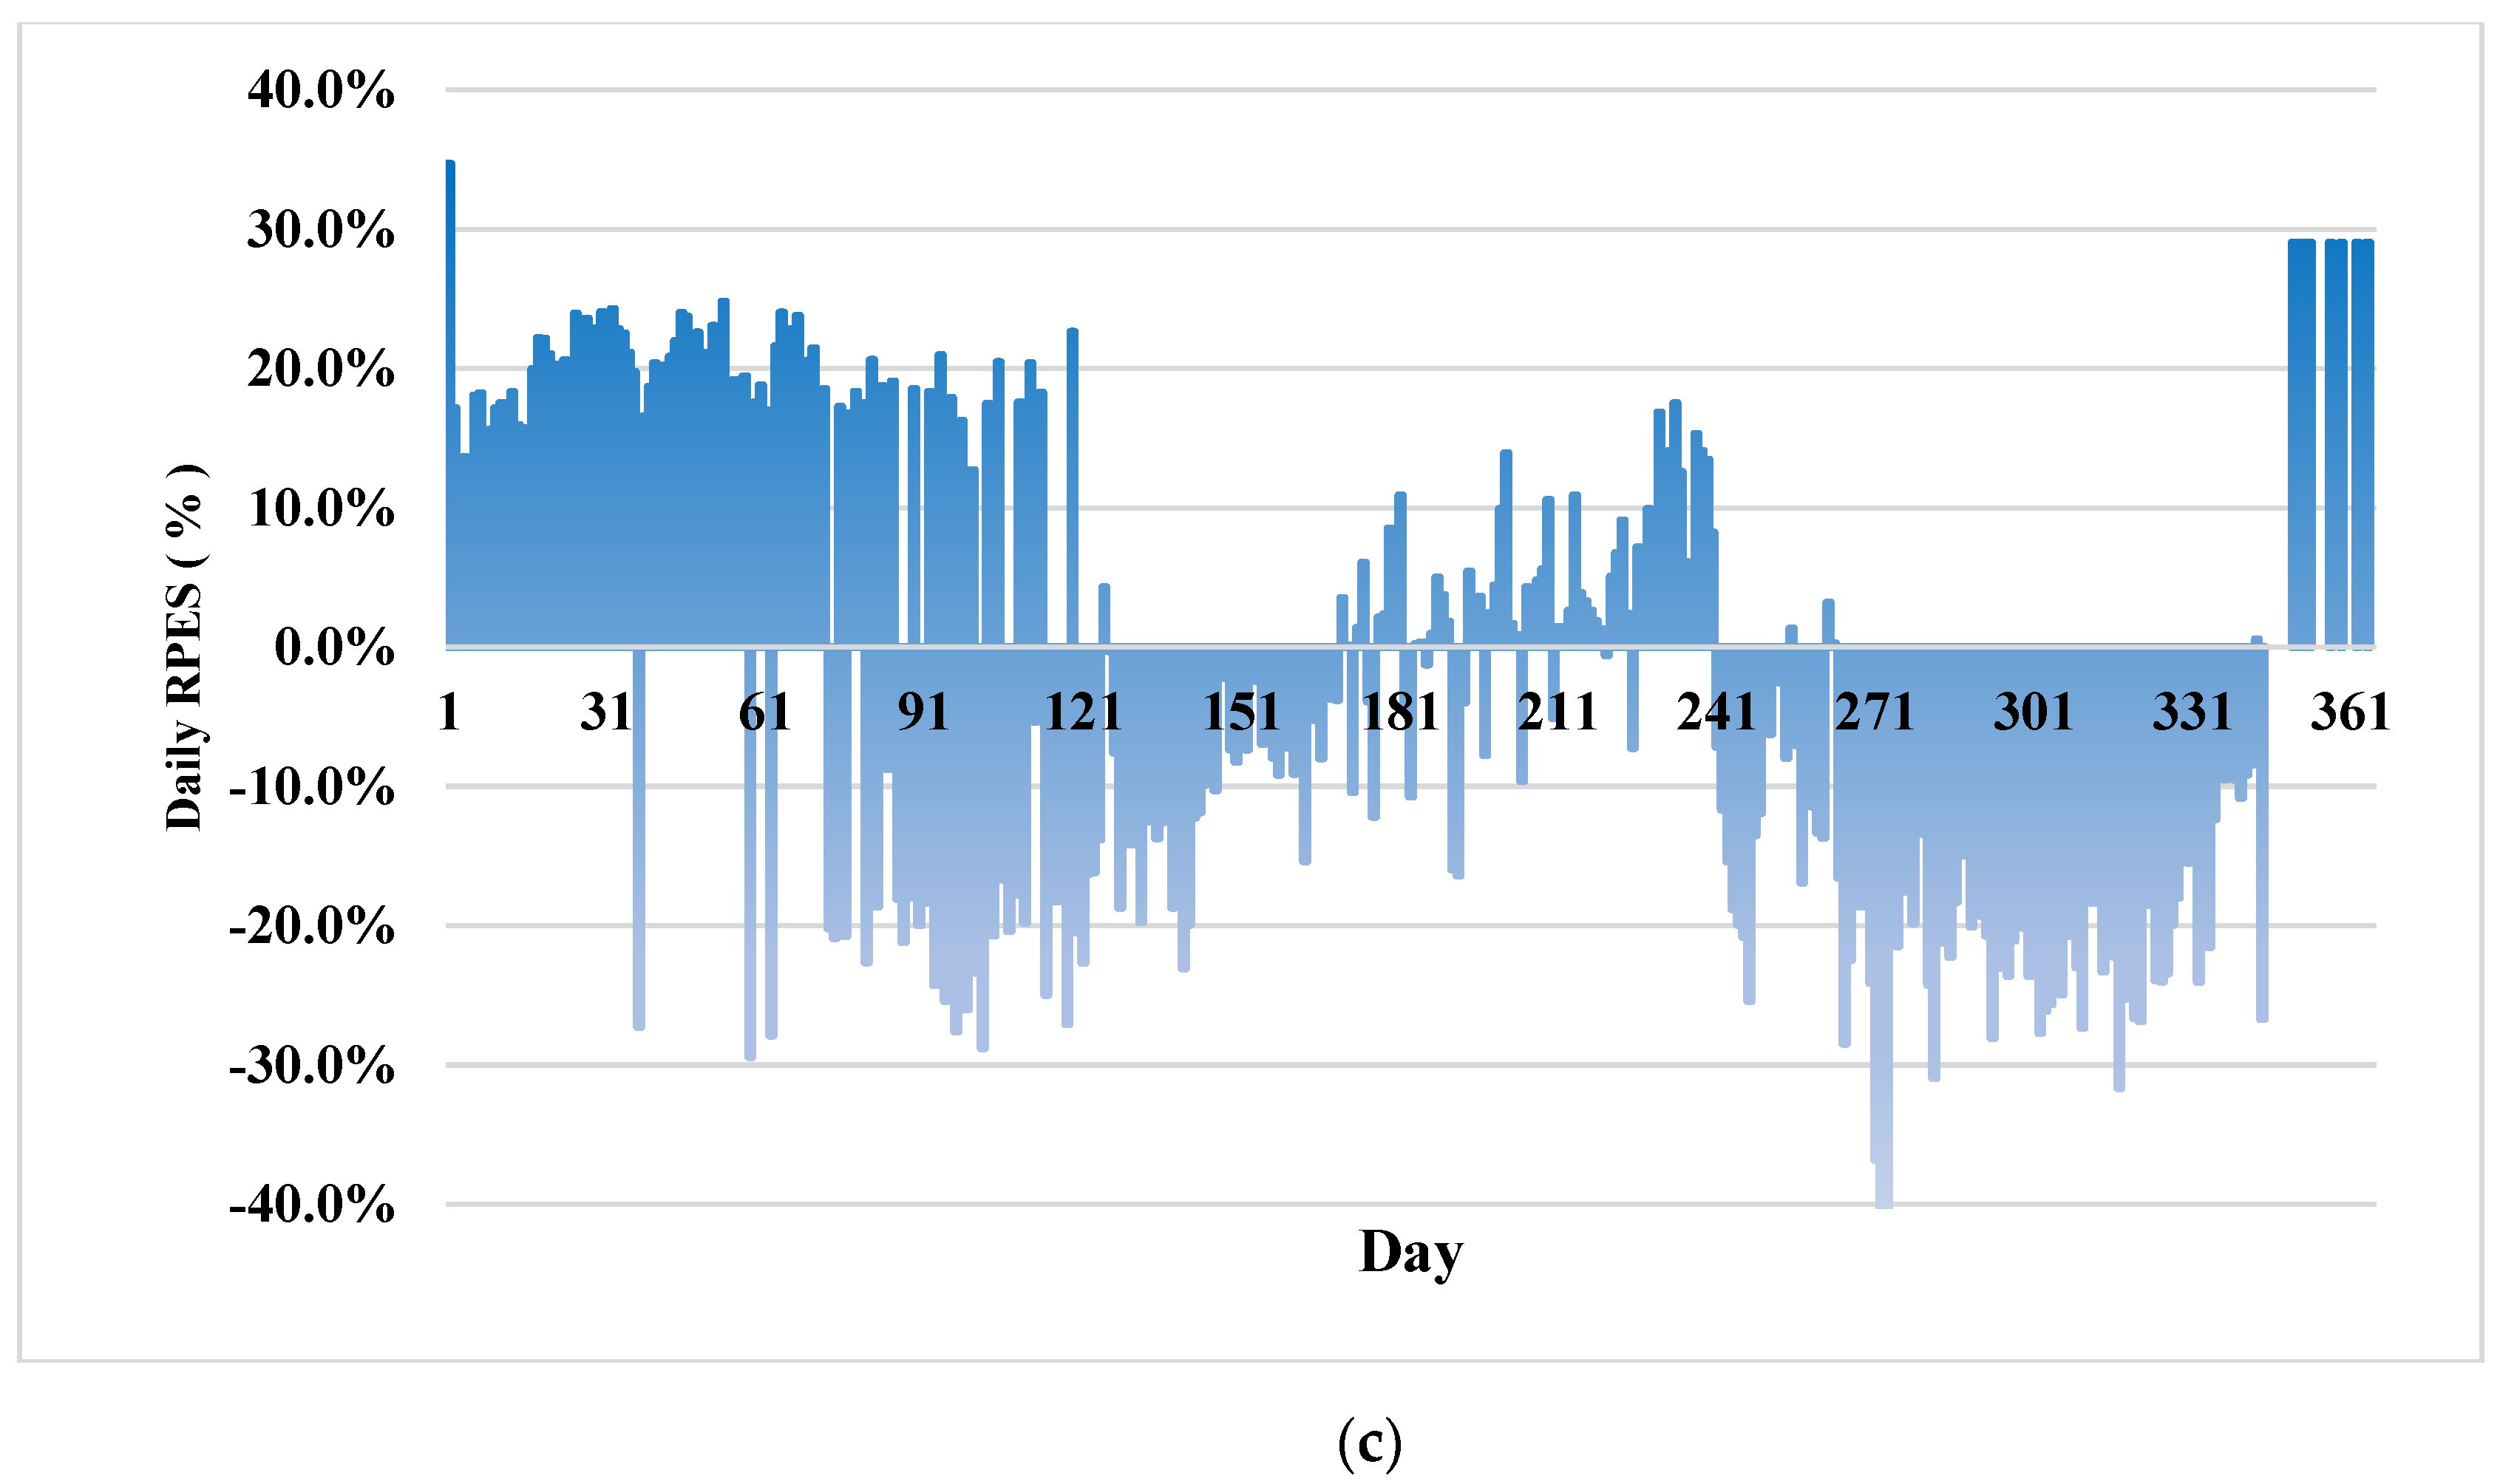
Figure 16 shows the profile of daily RPES during a year for the three cases. From the annual daily distribution of RPES, the dynamic behavior of RPES can be detected in response to the operator’s operational strategy to meet the energy demand. Case A shows a stable operating state compared to the other two cases, and it can be estimated that a systematic operation strategy was established and applied for the annual operation of the TGS system. In contrast to Case A, it is shown that, in Case C, the positive and negative contributions of daily RPES are mixed, and any consistent trends in operational strategy are not noticeable. In Case B, the contribution of daily RPES occurs only for a limited period due to its unique operational strategy of not operating the CHP prime mover except in summer. This aspect of the limited operating period can be attributed to the unusually low RPES level of around 2%. Additionally, the positive contribution level of daily RPES is relatively low, more or less 5%, although it is more dominant in this period.
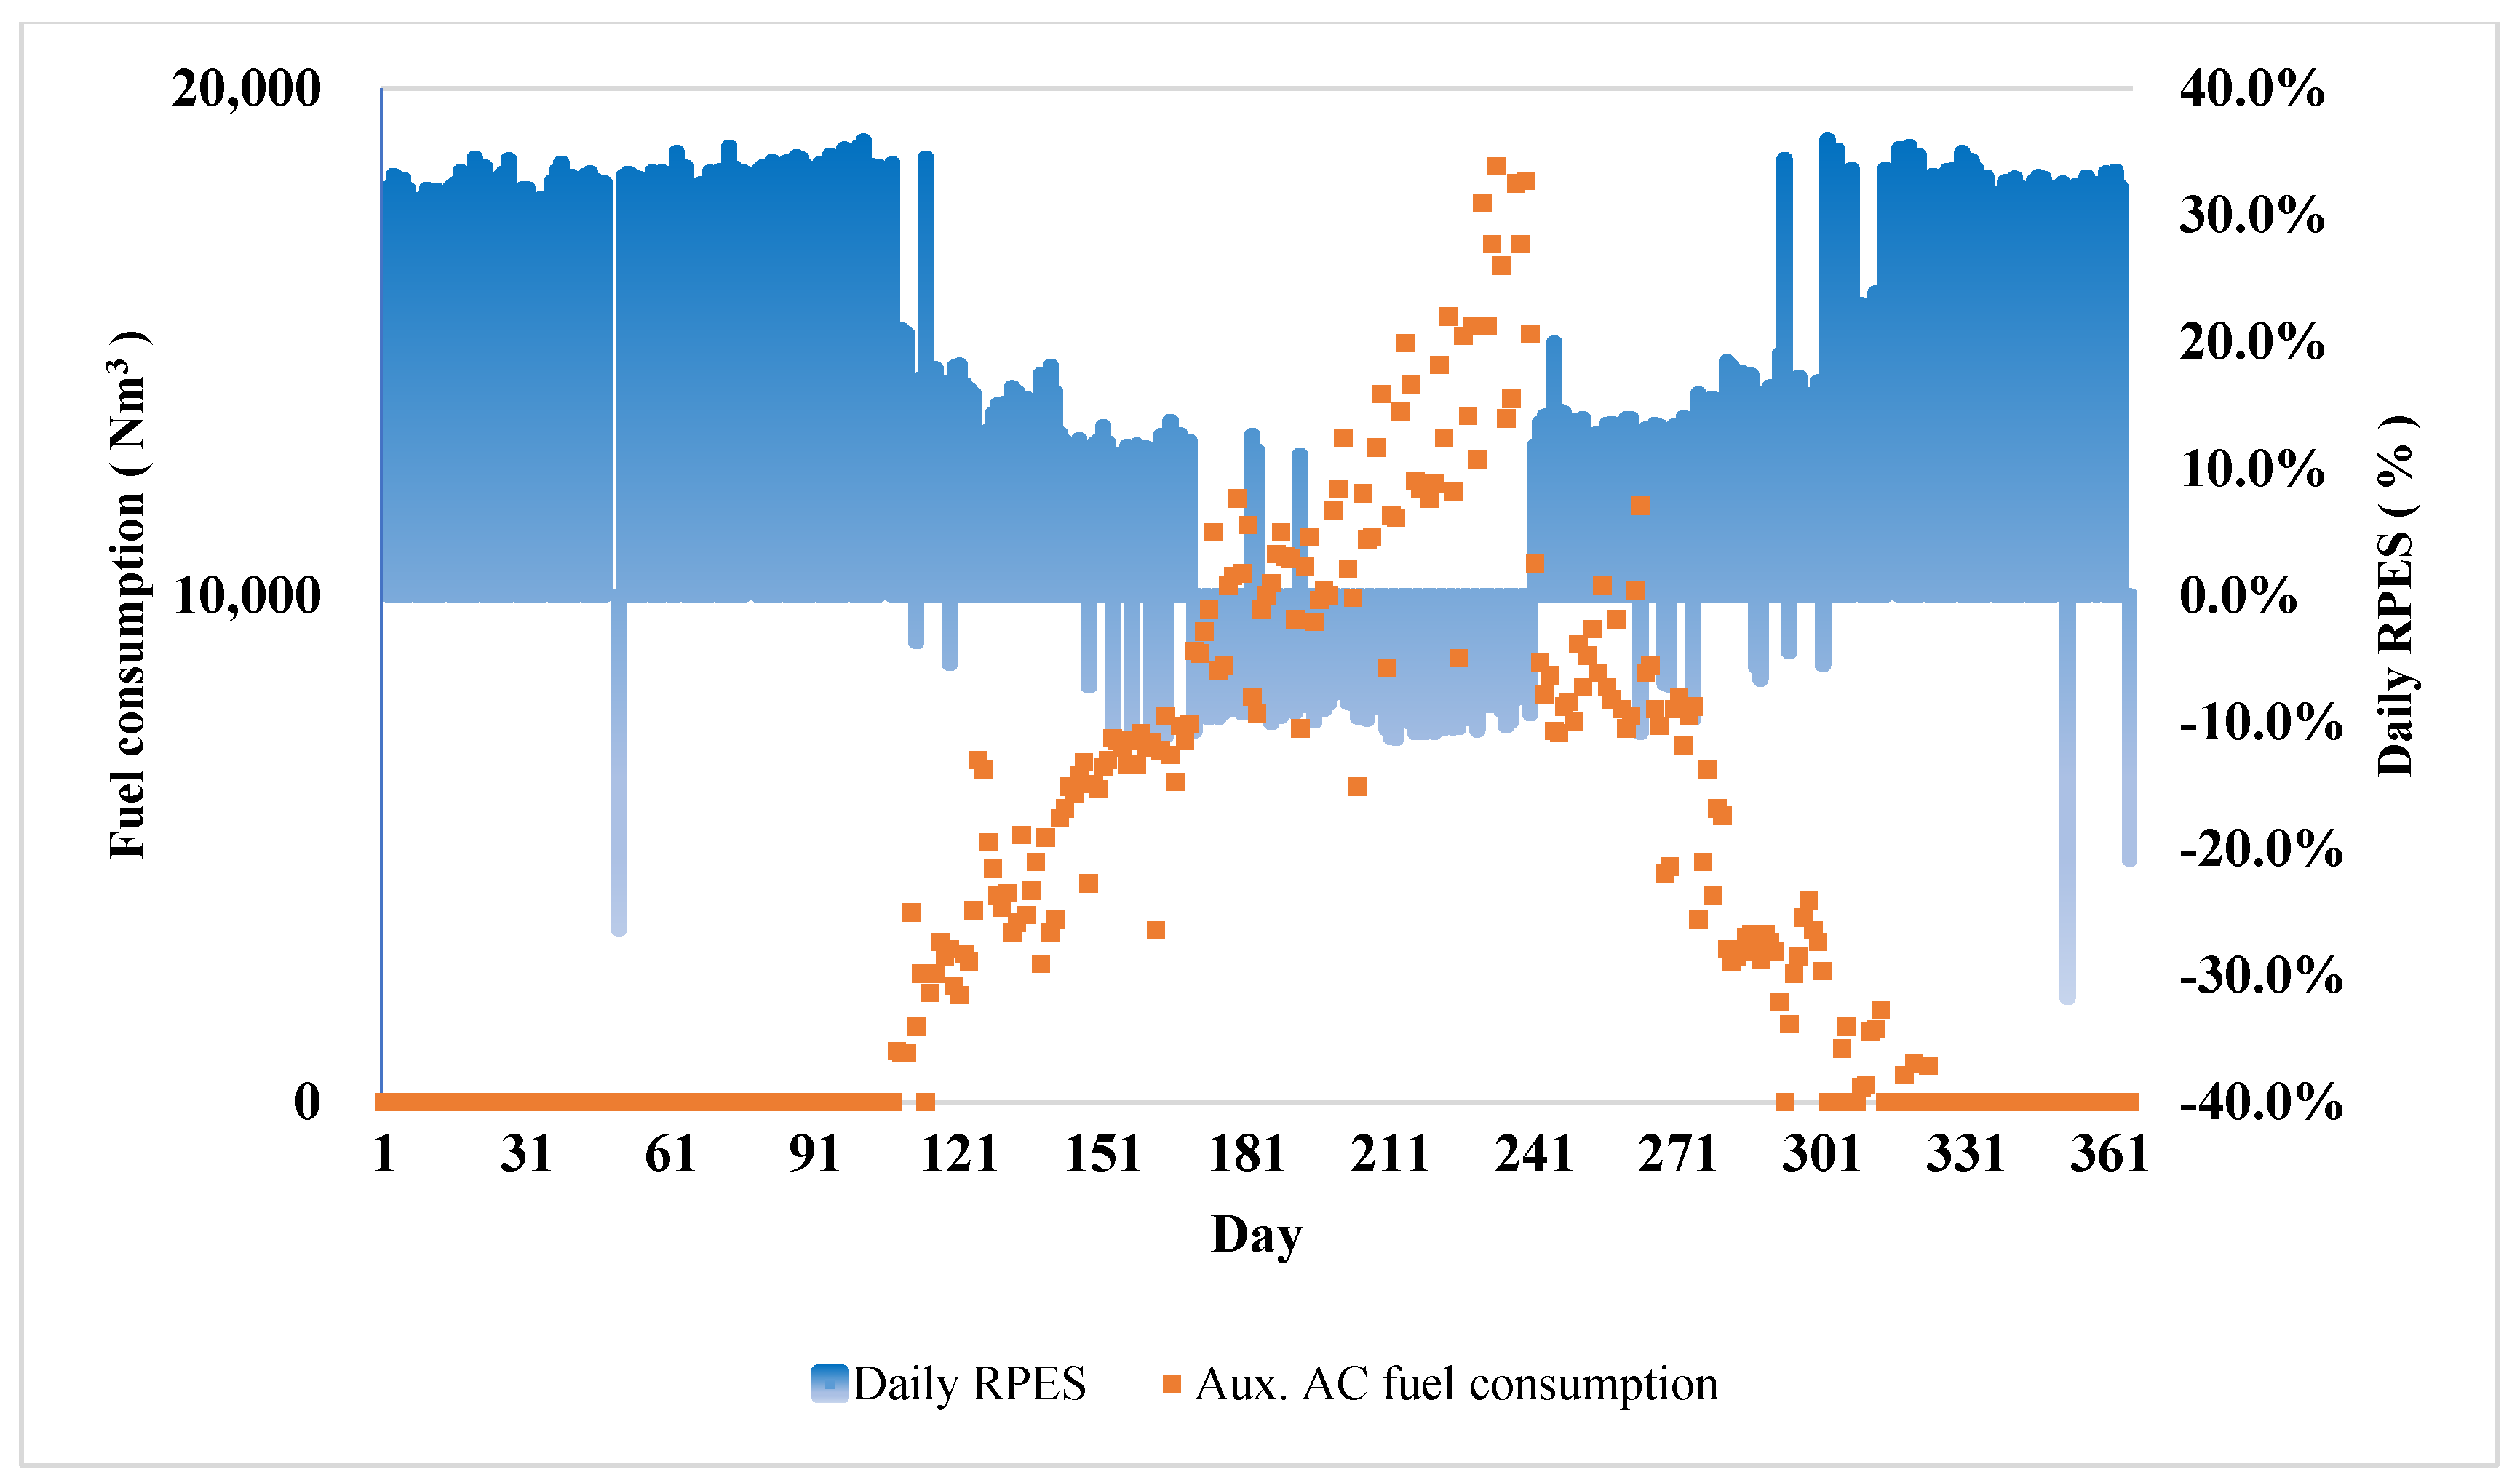
Figure 17 shows the profiles of the daily RPES and the LNG consumption for auxiliary absorption chillers for Case A. It is noteworthy that the positive daily REPS contribution closely coincided with the period during which auxiliary absorption chillers were not operating. The reason that the daily RPES maintained a high level, more than 30%, during this period can be attributed to the fact that the surplus heat from the operation of the CHP prime mover was fully utilized to meet the variations in heating demand. It is also noticed that the daily RPES value decreased as the fuel consumption of auxiliary absorption chillers increased, and turns negative when fuel consumption spikes to meet summer cooling peak demand. From the perspective of optimal operational strategy, auxiliary absorption chillers must be operated in such a way that their operation is minimized without a sharp increase in their fuel consumption. In practice, this alternative strategy involves determining optimal capacity at the system design stage; this is problematic in that the rapid fuel consumption of the auxiliary AC is unavoidable if the additional operation of prime movers is not possible due to the capacity being designed to be smaller than the required capacity during the cooling peak period. The importance of properly designed prime mover capacity cannot be overlooked to achieve the operational benefits of a TGS system.
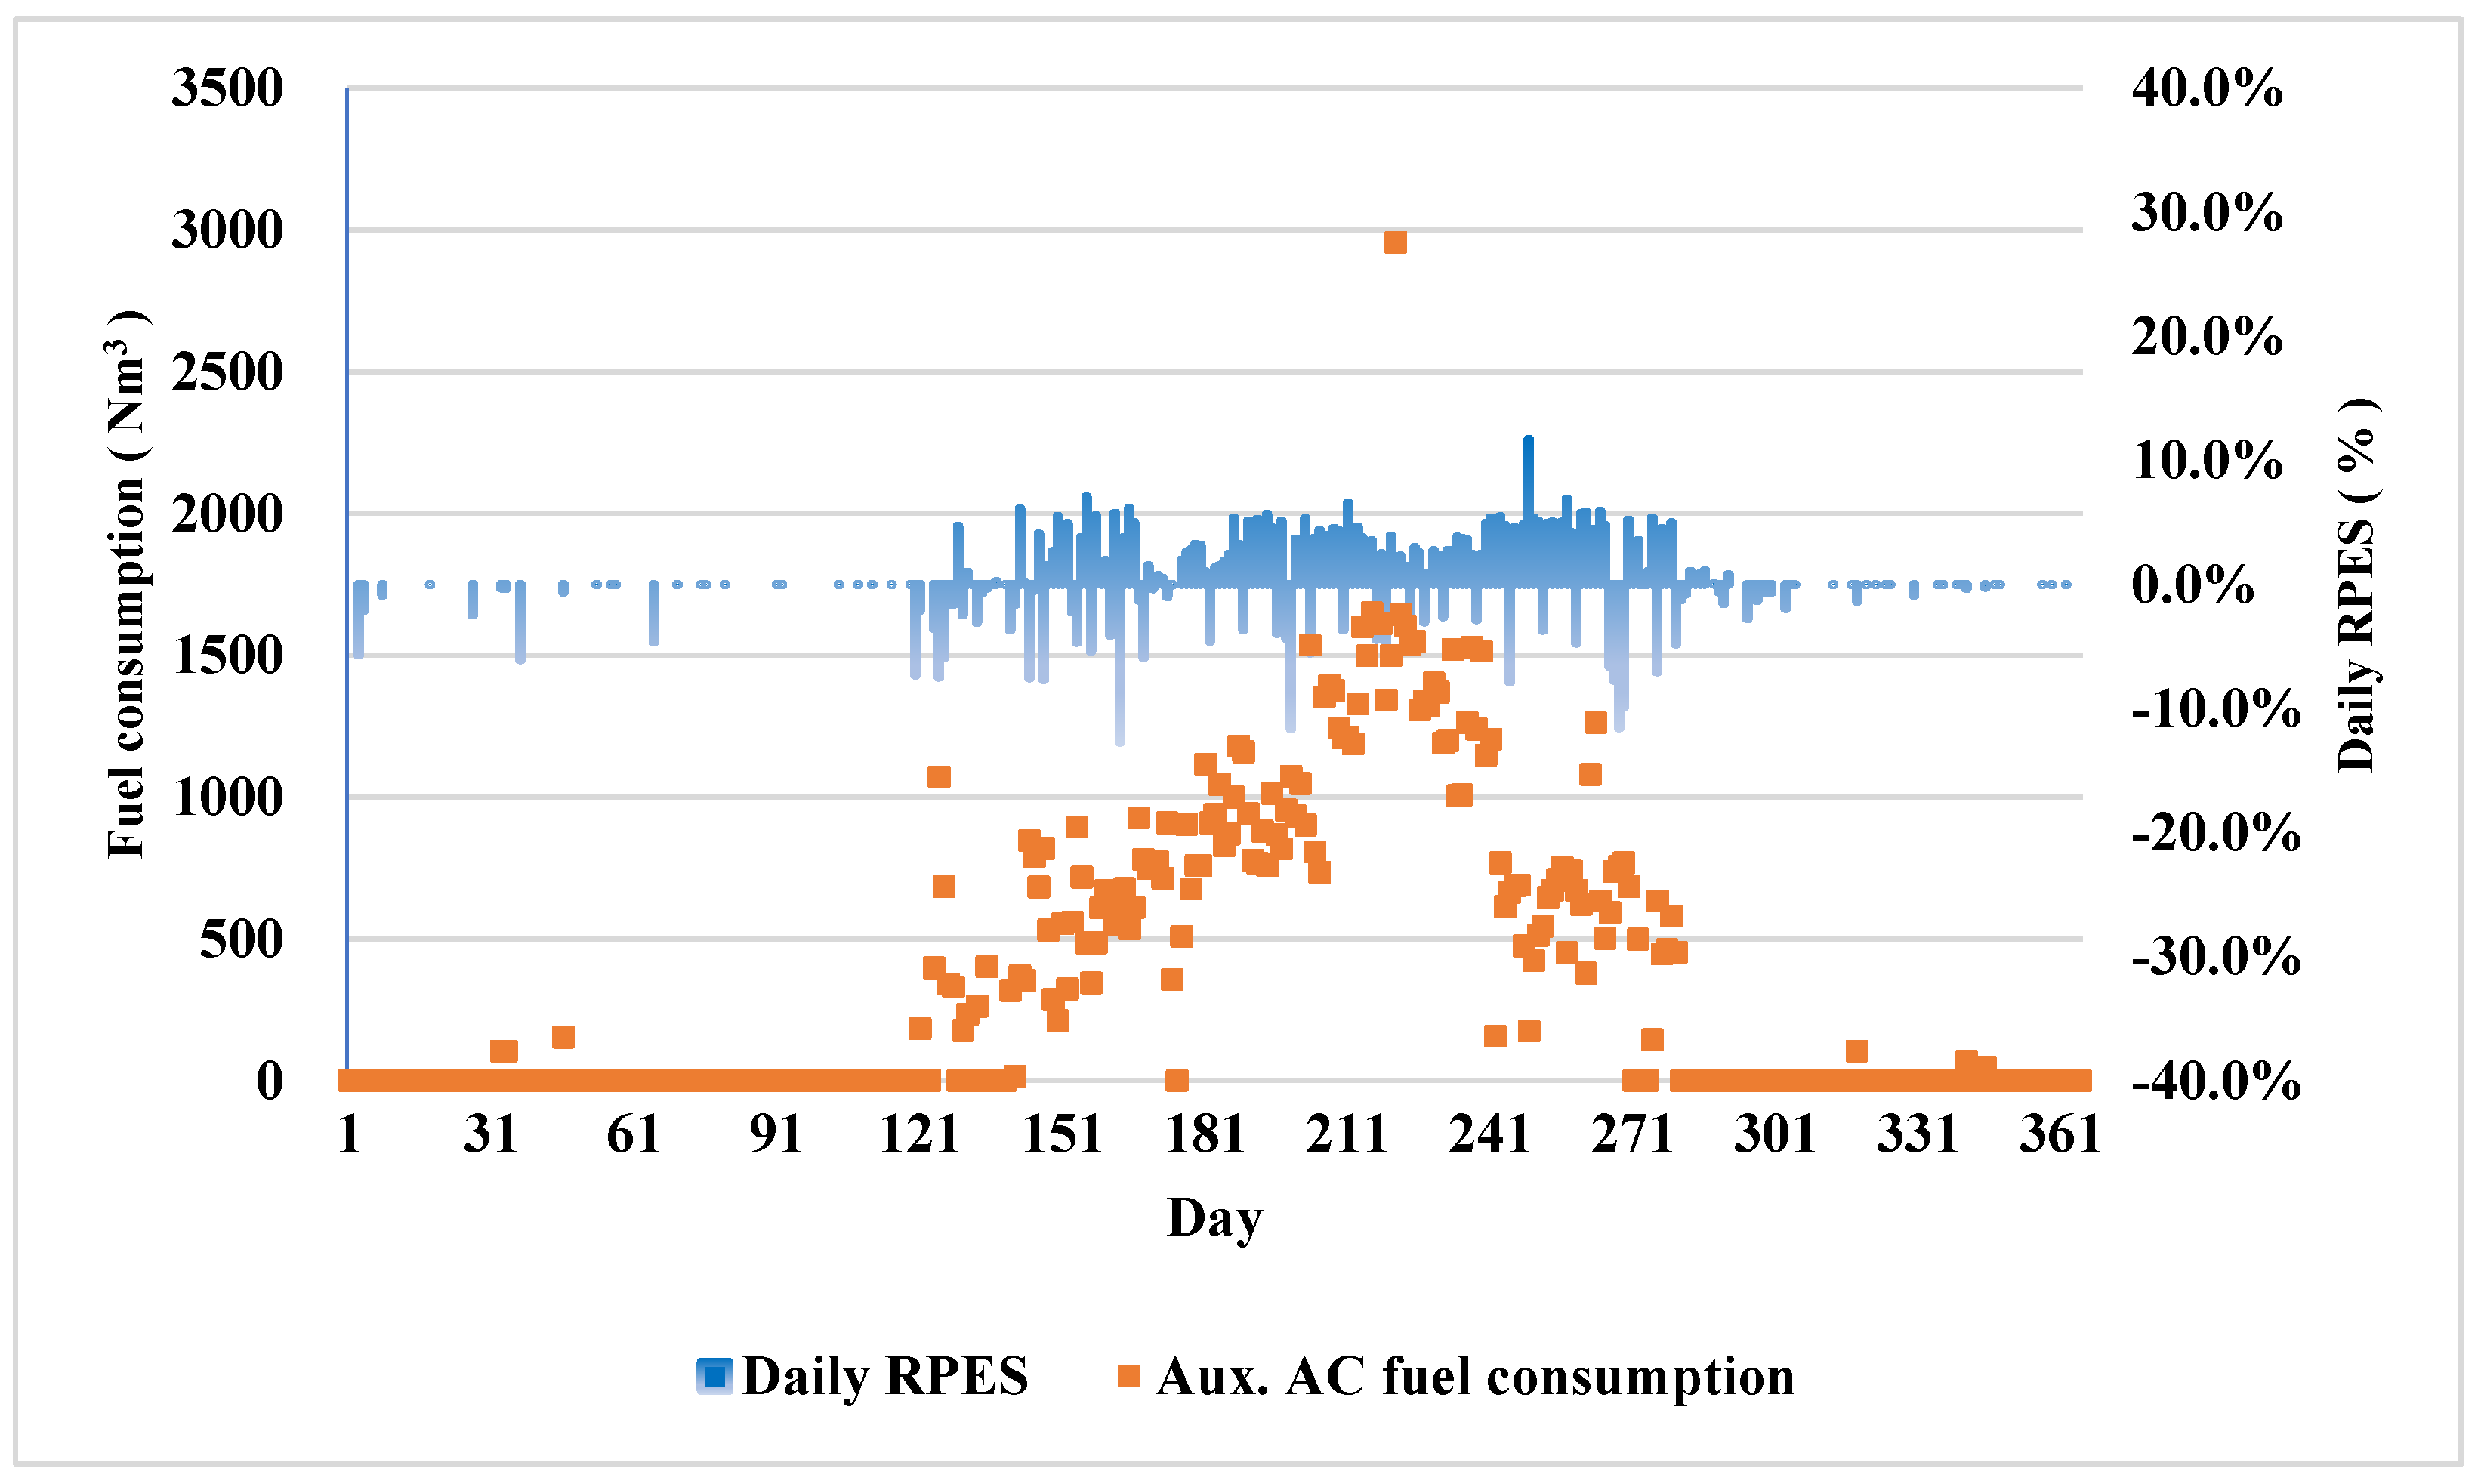
Figure 18 shows the profiles of the daily RPES and the LNG consumption of auxiliary absorption chillers for Case B. Since the basic operational strategy in summer is very similar to Case A, the same reasoning can be applied in interpreting the analysis results. Even though the surplus heat from the operation of CHP prime movers was fully utilized for the absorption chillers, it was insufficient to cover the peak cooling demand in summer. Therefore, it is observed that the daily RPES is highly dependent on the level of fuel consumption for the auxiliary AC, as in Case A. However, in Case B, the degree of correlation between the two variables is rather weak.
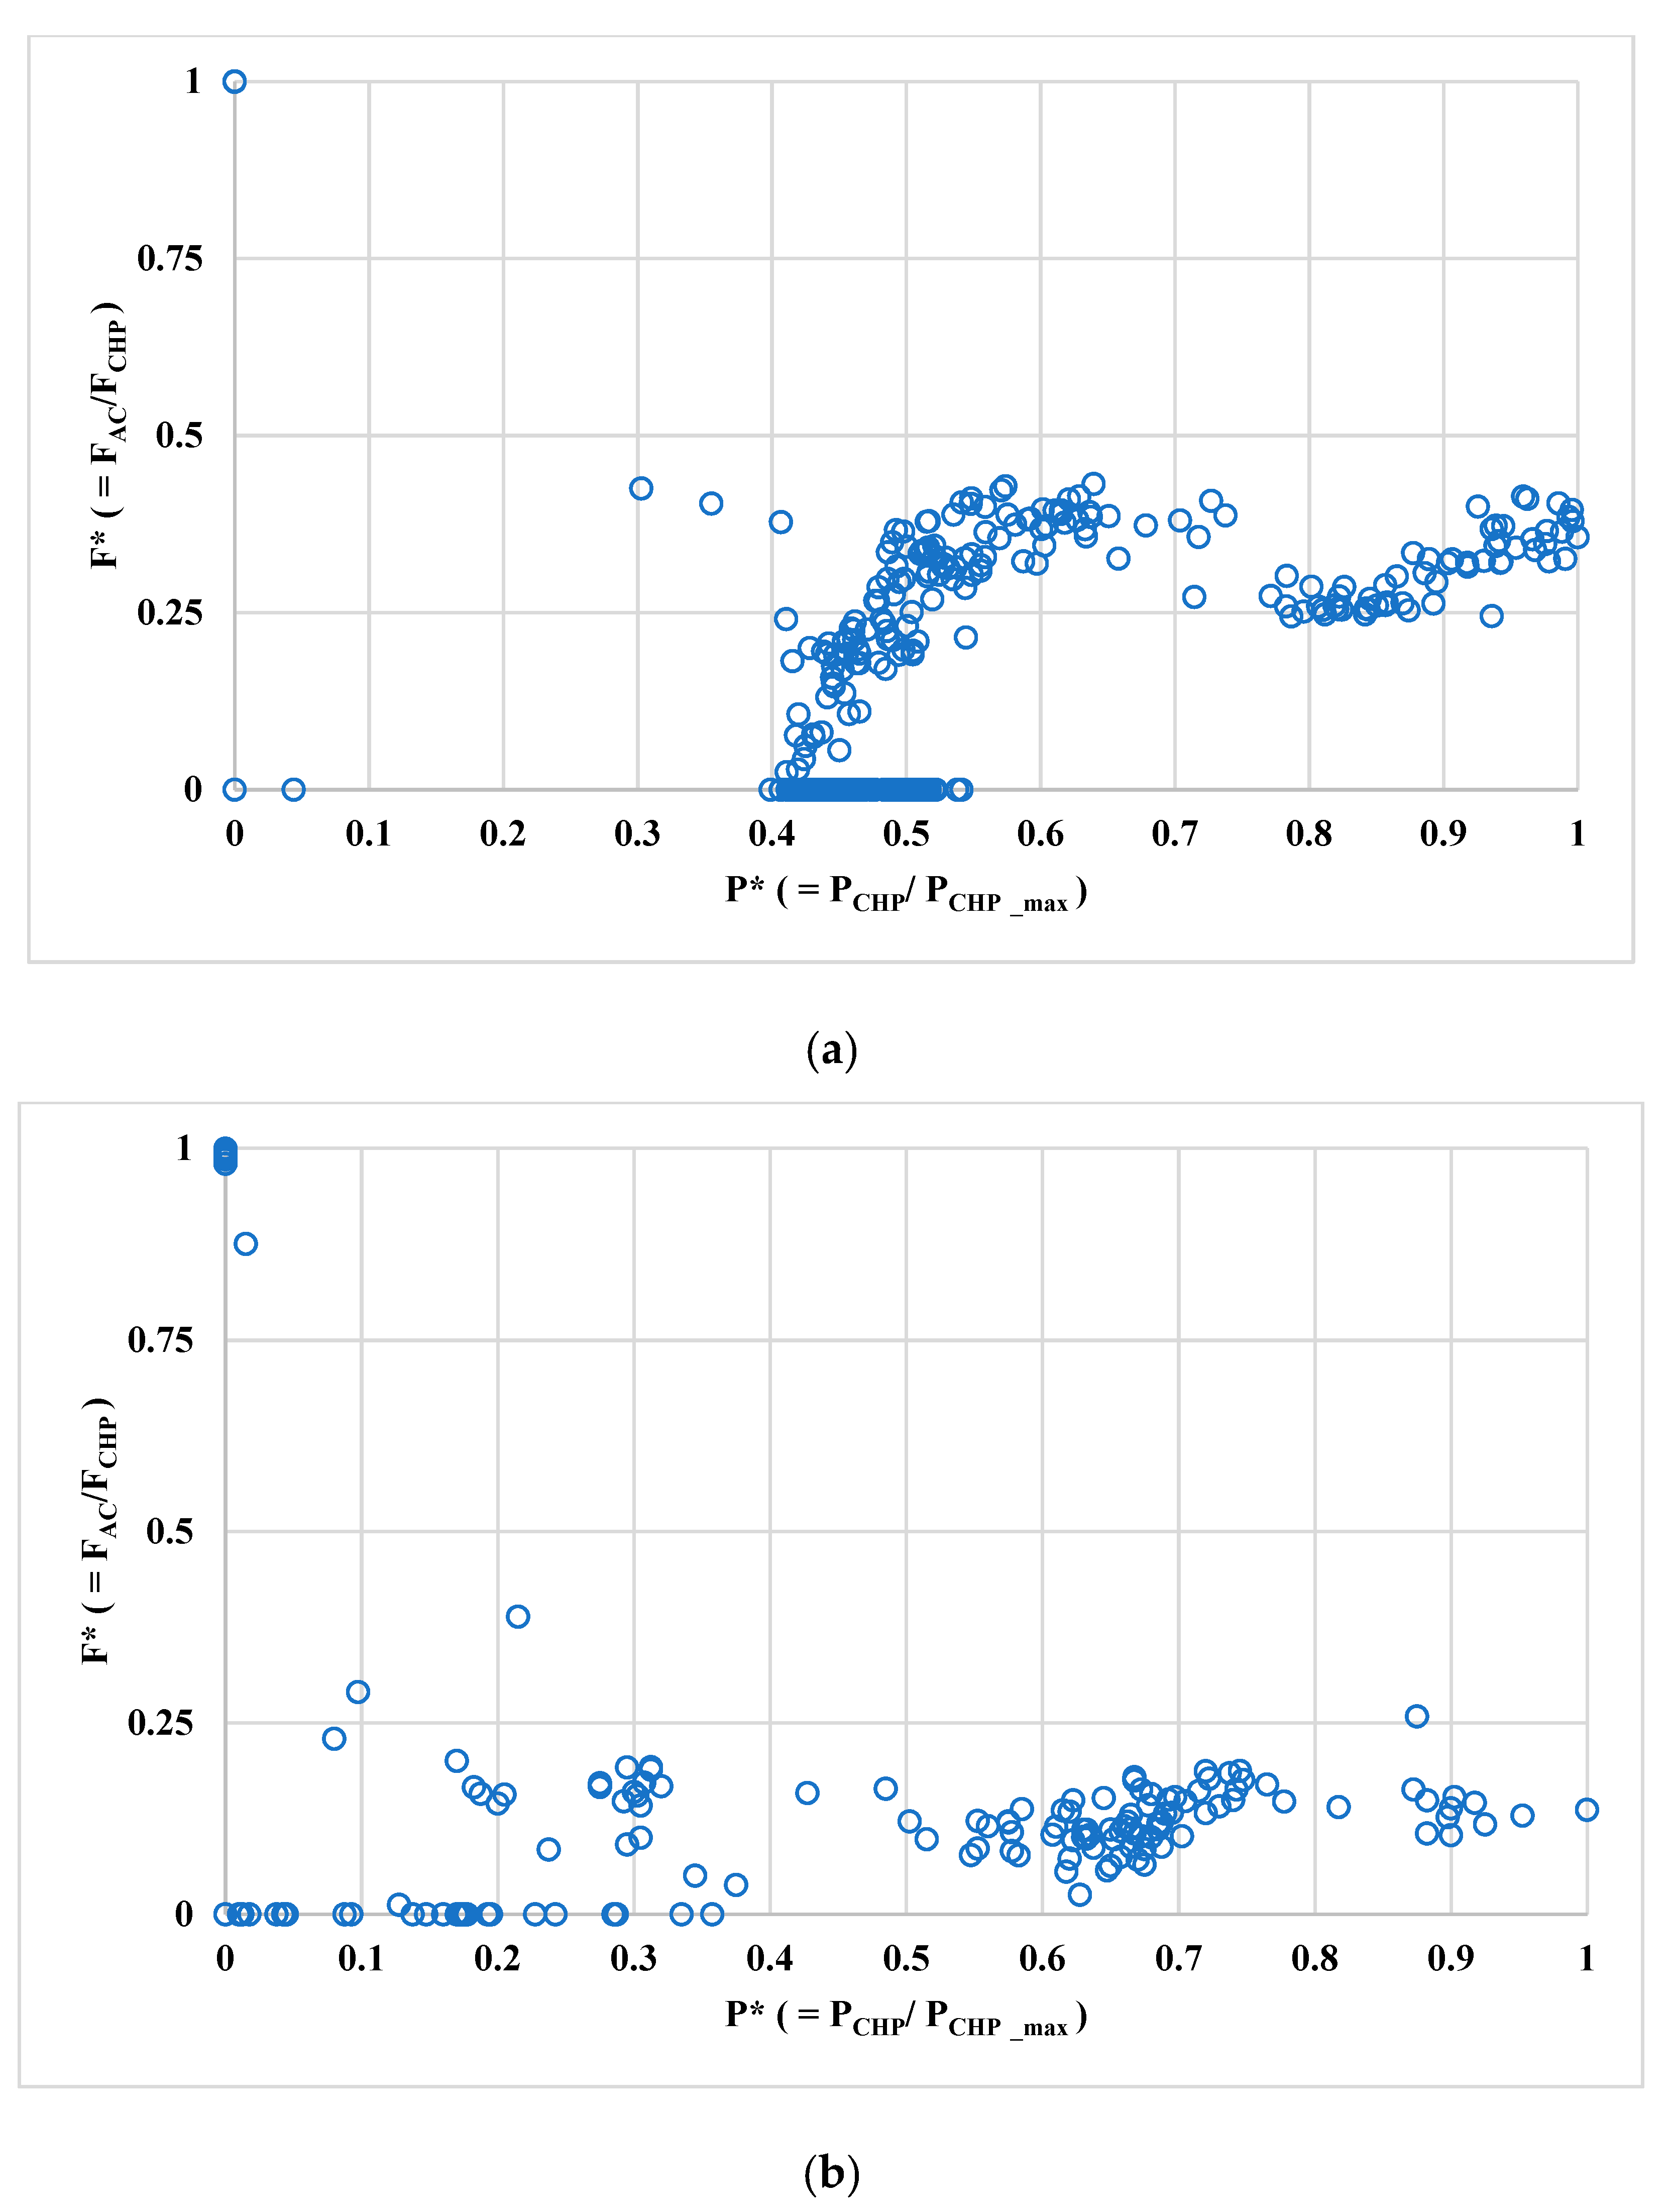
As shown in
Figure 19, which presents the distributions between the fuel consumption ratios, defined as fuel consumption of the auxiliary AC divided by that of the CHP prime movers, and the power production by the CHP prime movers, which is normalized by the maximum power production at full load. It is noticed that the fuel consumption ratio of Case A is almost twice that of Case B. This means that for Case A, the auxiliary AC operation has a much greater impact on daily RPES, because the operations of the CHP prime movers and the auxiliary AC have opposite effects on the daily RPES. The higher the proportion of fuel consumption, the greater the impact of AC operation. As a result of comparing the facility operation patterns for the two cases, it can be estimated that the overall primary energy saving effect for Case A was maintained by offsetting the RPES reduction effect, caused by the auxiliary AC operation, by applying the strategy of more active CHP operation.
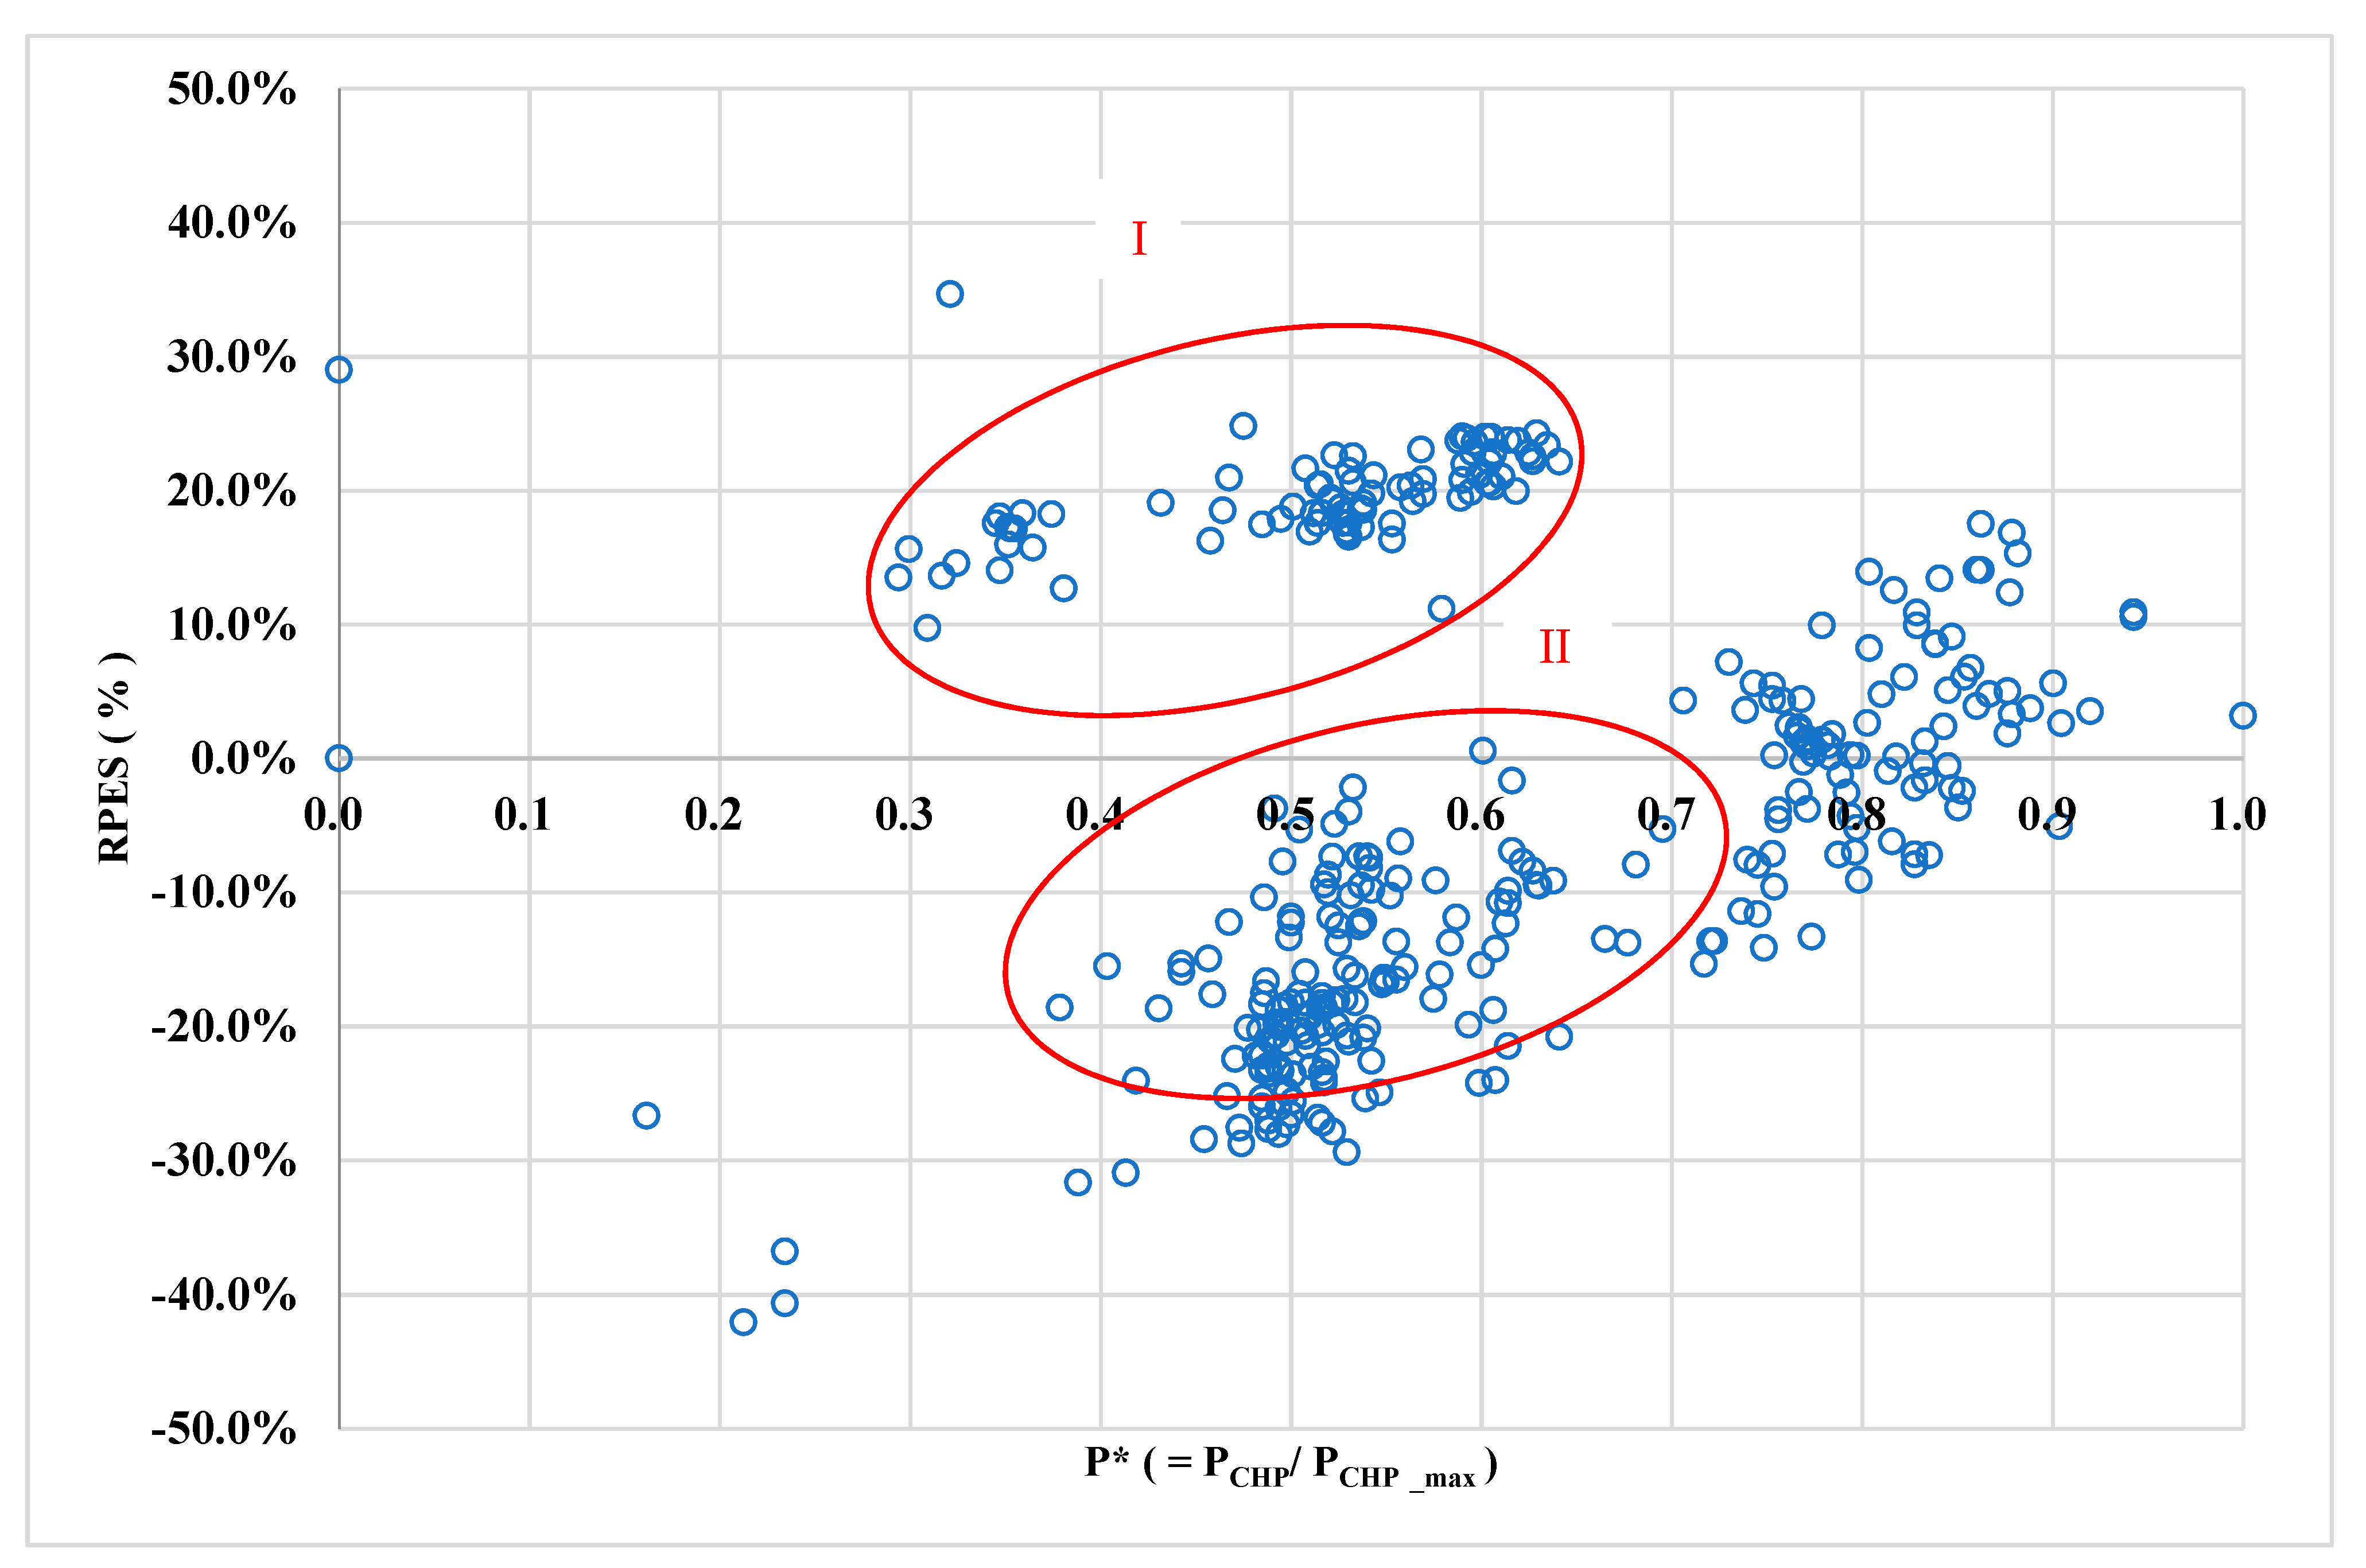
Figure 20 shows the distributions between the daily RPES values and the power production by the CHP prime movers for Case C. Case C differs from the previous two cases in that it can receive heat from the DHN, not bidirectional at present, in winter, primarily to meet the heating demands. Since the CHP-based DH models were fully validated as being superior to SHP in terms of the RPE; receiving heat from the DHN can contribute towards securing a positive RPES proportional to the amount of heat it receives. Regime I in
Figure 20 accounts for this contribution, and occurs mainly in winter. It is also interesting to note that the highest positive daily RPES is observed at the origin of the
x-axis. This accounts for an operational event that happened in December, when all the prime movers failed and all the heating demands of the building were covered by the heat supply from the DHN. Regime II in
Figure 20 describes the operational events that occur mid-season, between summer and winter. In Case C, since there is no heat-driven cooling, i.e., no absorption chiller is installed, a substantial amount of surplus heat from the operation of the CHP prime movers was wasted. The negative value of the daily RPES is due to these operational characteristics.
2.3.2. Sensitivity Analysis Results
From the analysis of the technological performance of THS models for the cases of a terminal complex, it is revealed that the different operational strategies have a significant impact on the degree of achievement in terms of RPES. In the evaluation of RPES described in previous sections, the conventional criteria, which is applied for the calculation of RPES of TGS models against SHP, was also adopted in this study. This means that the contribution of renewable power expansions in the power sector at a national level was not reflected in the estimation of average power production efficiency. Due to the non-negligible impact of the renewable power dissemination in the power sector on RPES assessment, its inclusion in the RPES evaluation process remains controversial. However, as the rapid expansion of the supply of new and renewable energy, and the transition from efficiency-oriented to an eco-friendly energy environment continues, it is quite natural that the impact of renewable energy should be reflected in the RPES evaluation in the coming era of climate change. In this study, the sensitivity of RPES performance according to the level of renewable energy expansion in the power sector was assessed for cases analyzed based on the current status and prospects of domestic renewable energy supply.
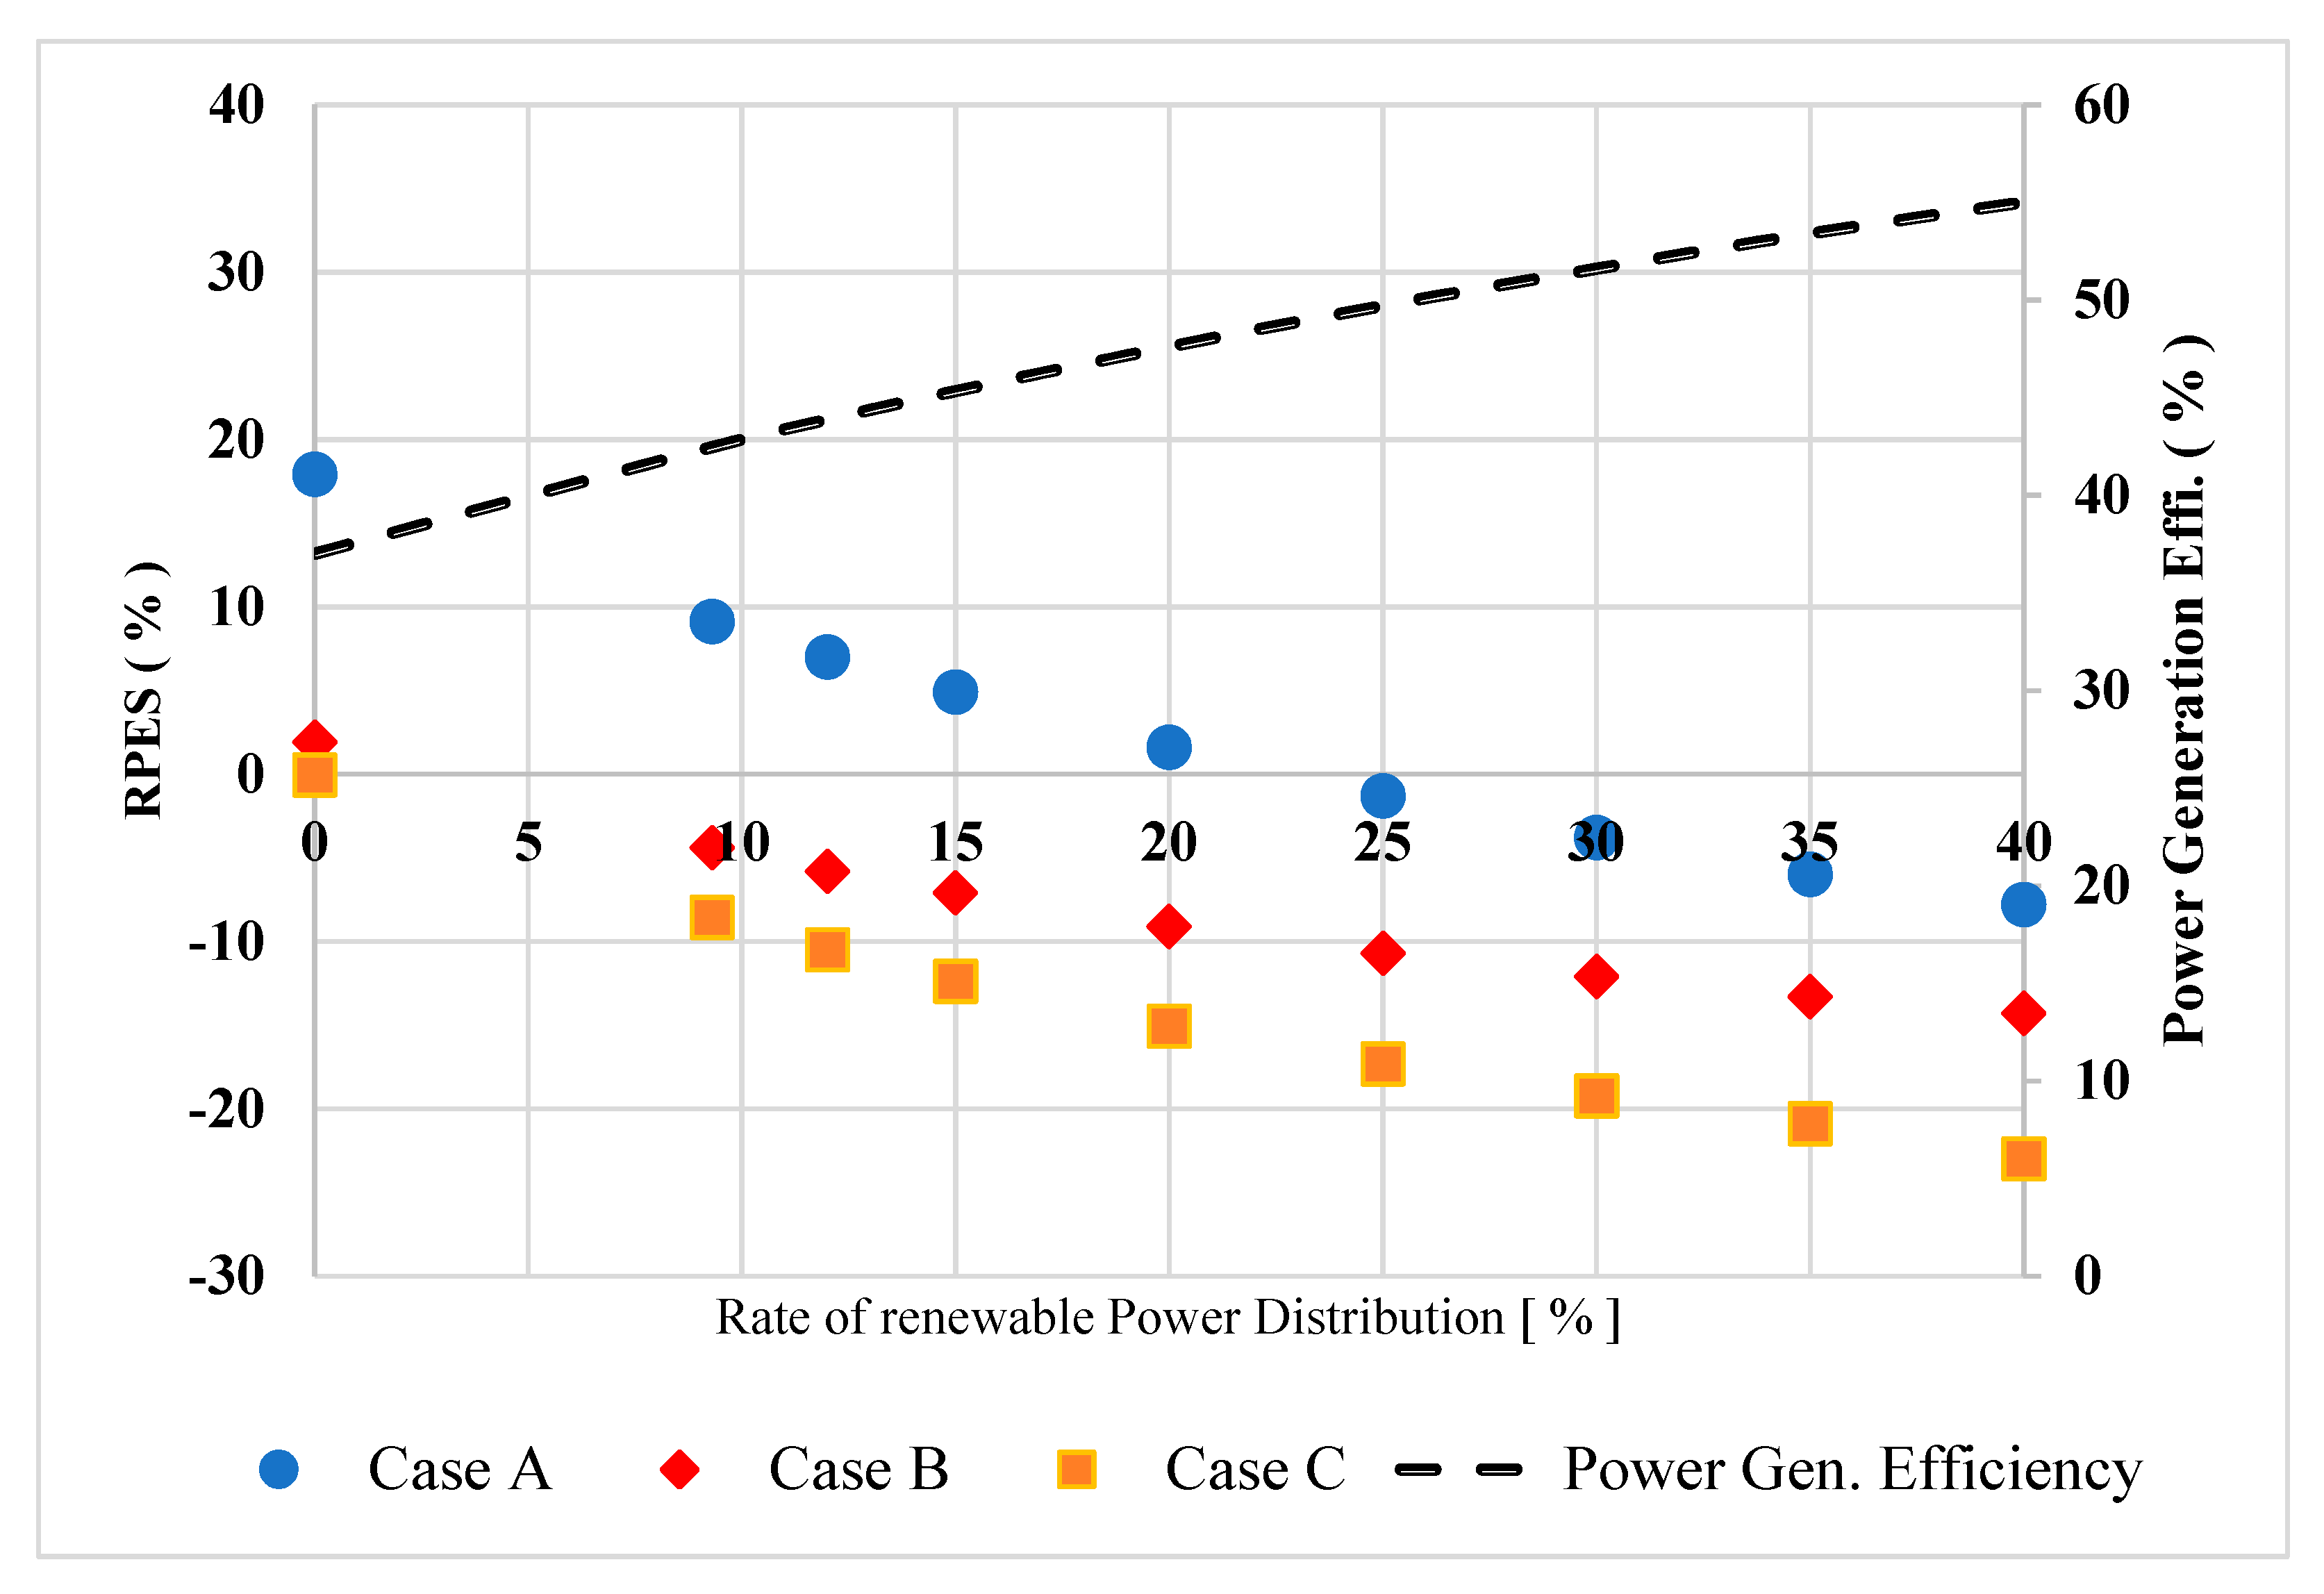
The share of domestic renewable energy generation accounts for about 9.3% as of 2019, and according to the recently announced Carbon-Neutral 2050 plans, the aim is to increase this up to 35% by 2040, and 70% by 2050 [
18]. Based on the current status and future goals, the RPES performance of TSG against SHP was estimated, as shown in
Figure 21, according to the share of renewable generation in the national grid power sector. As the share of renewable generation in the national grid power sector increases, the power generation efficiency index applied to the SHP increases from 37.6% to 55%, which is equivalent to 40% of renewable power penetration. As the penetration rate of renewable energy increases, it is natural for RPES performance to decrease, and, as in Case A, when the share of renewable power generation reaches about 20%, it is expected that the superiority over existing SHP will almost disappear. It should be noted that it is expected to be realized soon, in more or less 5 years, according to the domestic renewable energy supply roadmap. In Cases B and C, the advantage against SHP is lost as soon as the impact of 9.3% renewable power penetration in the current stage is applied to the RPES evaluation. In Case A, it becomes almost half.
From the sensitivity analysis results, according to the share of renewable power in the national grid power sector shown above, the rapidly fading technological edge of the TGS model against SHP could pose significant challenges to the sustainability of existing support policies for CGS or TGS models. Therefore, the market outlook for the TGS model in the coming era of climate change is not very positive unless more innovative alternatives are developed.
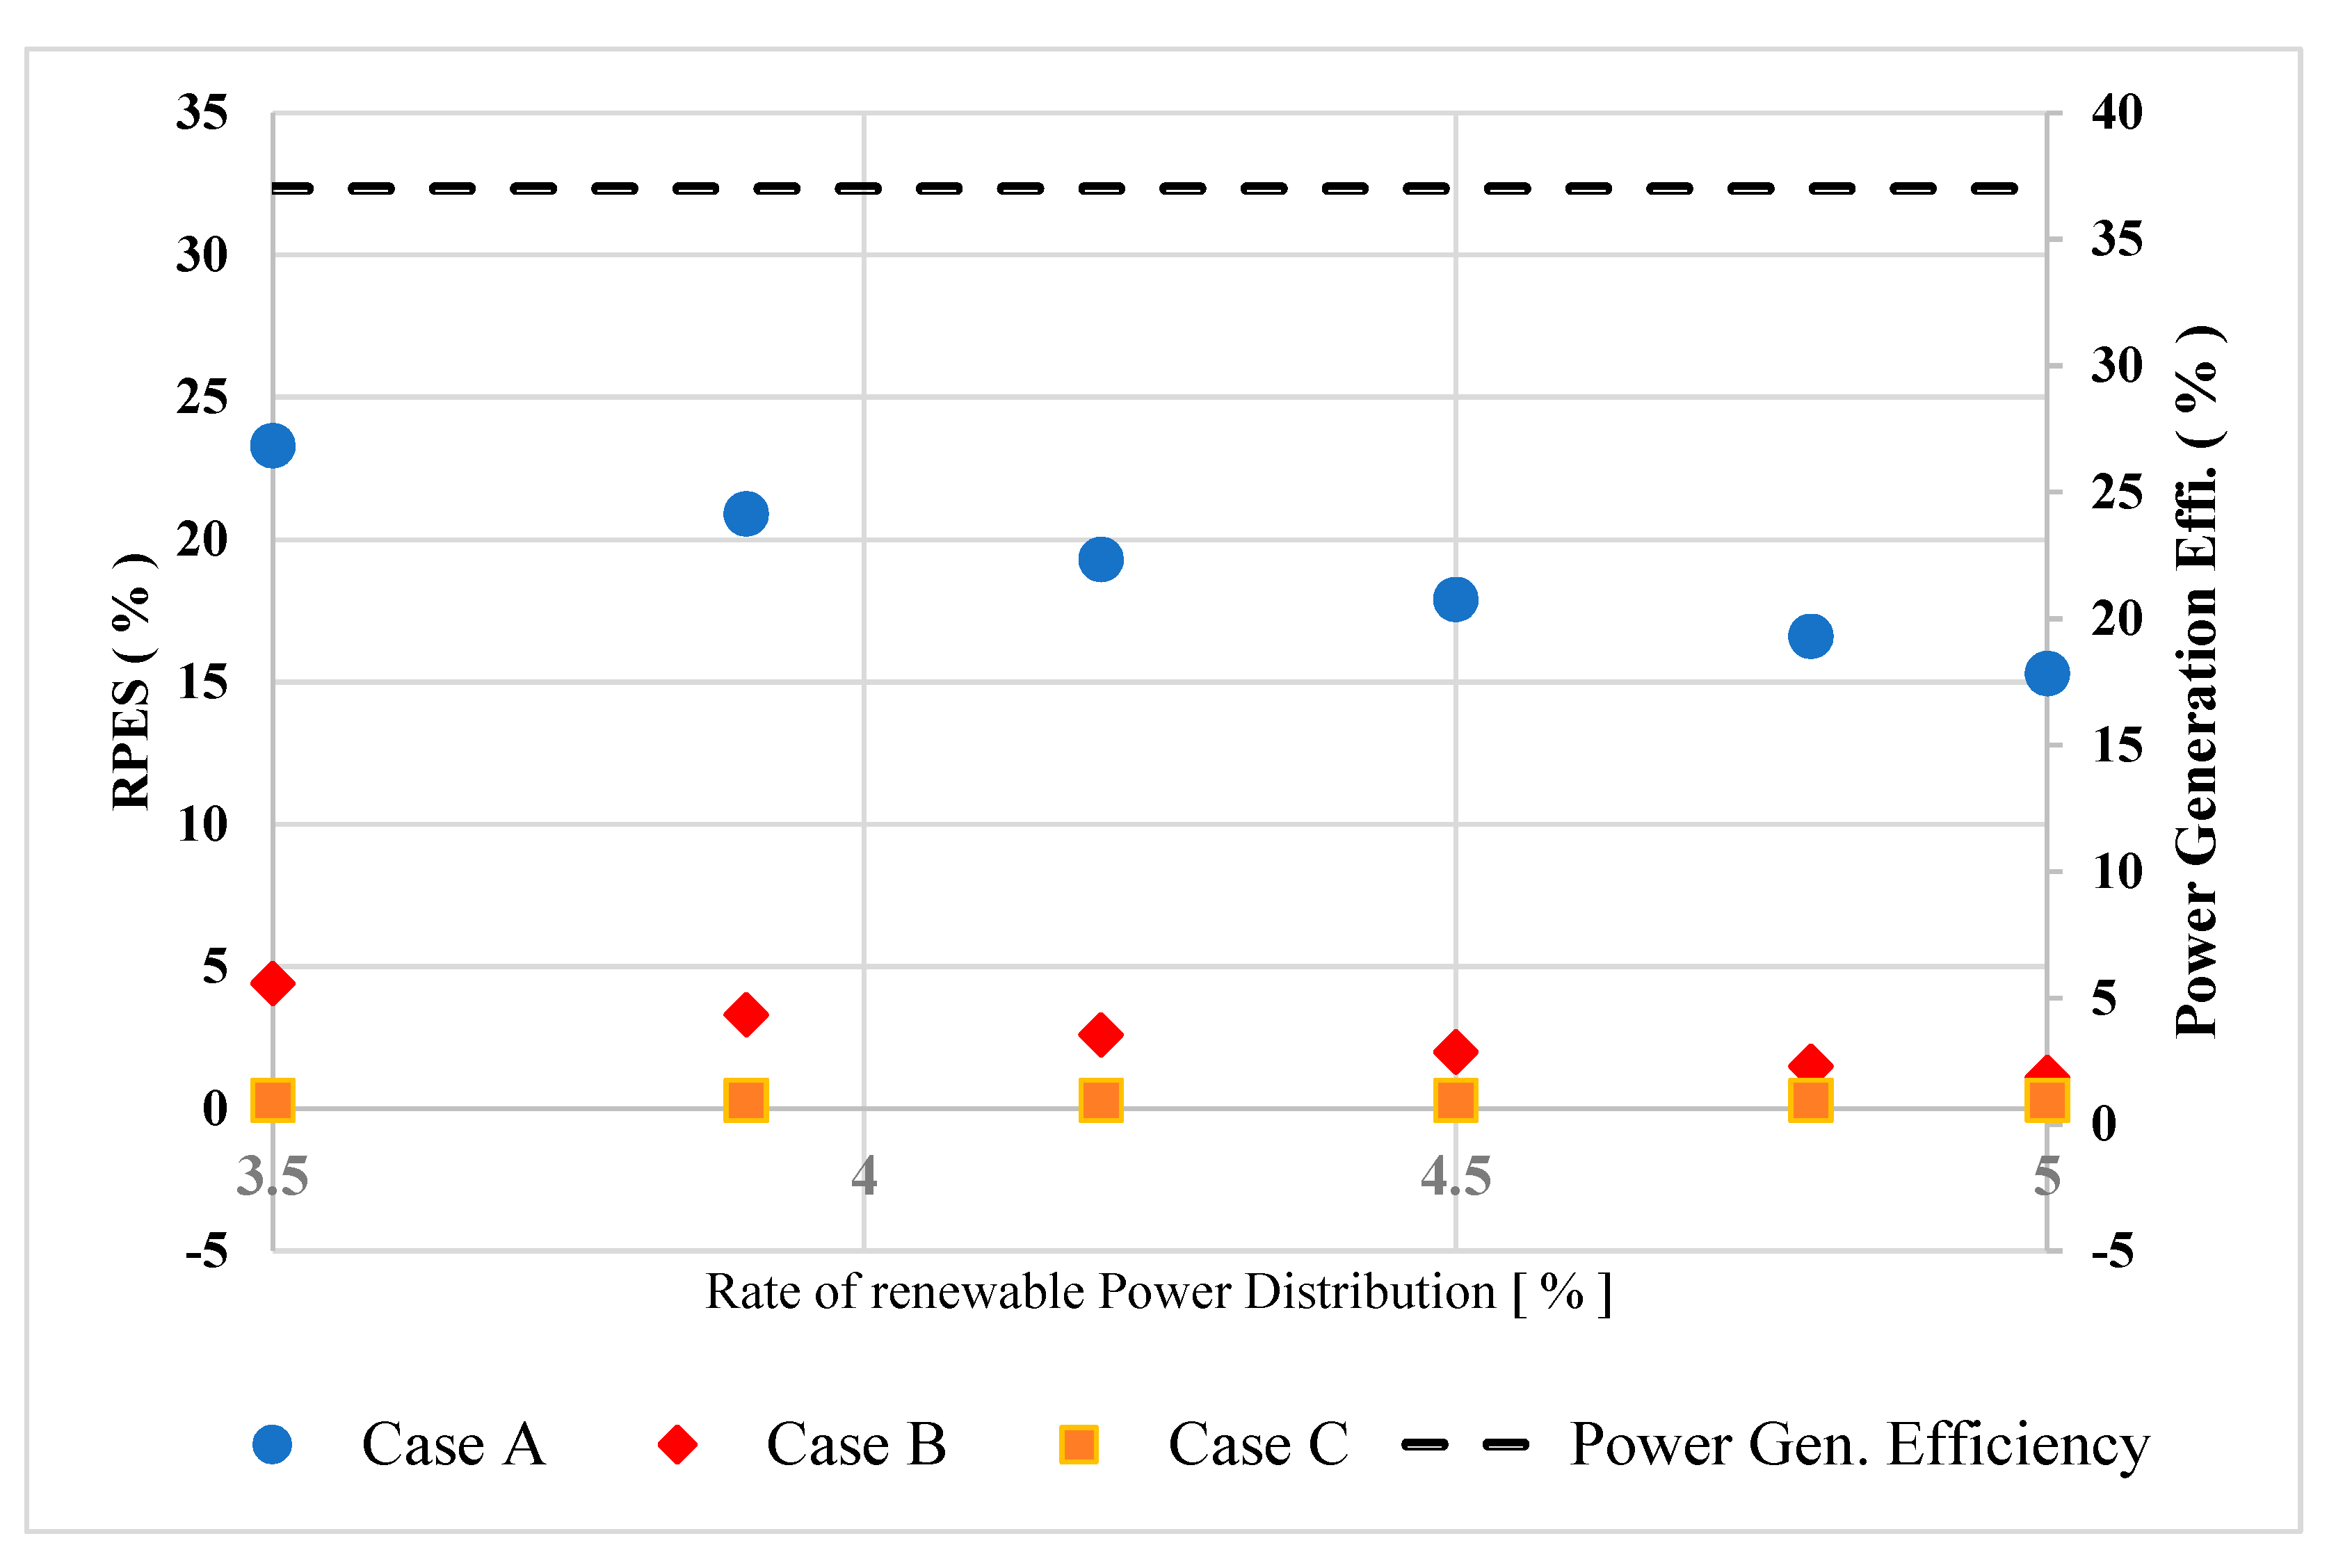
In
Figure 22, the RPES performance of TSG against SHP was estimated according to the development of heat pump operational performance, i.e., COP (Coefficient of Performance). In this sensitivity analysis, the power generation efficiency index applied to the SHP was fixed to be 37.2%. It is shown that the dependence on heat pump operational performance is relatively less sensitive than in the previous case. Although it is not easy to expect significant advances in heat pump performance over current levels in the near future, it is important to keep in mind that the high performance characteristics of heat pumps will serve as a major obstacle to pursuing RPES performance improvement in TGS models with heat-driven cooling.
3. Discussion
In the existing technological framework focused on system efficiency, the TGS model has been attracting a huge amount of attention in terms of its high system efficiency due to heat-driven cooling, which can be effectively utilized so that the surplus heat from the operation of the CHP prime mover is not wasted. However, as verified in this study, the superiority of the TGS models in terms of the operational efficiency of RPES, rather than system efficiency, is expected to disappear soon in the coming era of climate change if no suitable alternative is available. In this discussion, in order to resolve the problems derived from the case study, possible alternatives in terms of operational strategy are first addressed. Second, appropriate technological countermeasures for issues arising from sensitivity analysis are also reviewed.
From the point of view of applying the optimal operation strategy, it was found that the additional operation of the prime mover replacing the additional fuel use of the boiler or auxiliary absorption chiller has room for improvement in operational performance at this stage. In particular, this mode of operation, which uses auxiliary AC and boilers to meet maximum heat demand, has been found in previous analyses to be avoided as much as possible in terms of daily RPES contribution. As a result of investigating the operation time of the prime mover, it was found that the system operation potential of the prime mover was not fully utilized, and a rather conservative operation strategy was applied in all cases. Even if the current facility capacity has been selected in preparation for failure, it is necessary to establish a more active operation strategy that maximizes the operation rate of the prime mover until the failure occurs. However, in order to substantially increase the operation rate of the prime mover in actual operation, it is necessary to additionally consider the introduction of the heat storage system to solve the problem caused by the mismatch between heat demand and supply by an hour. From the viewpoint of hourly operation control, the surplus heat generated by the additional operation of the prime mover leads to loss during the off-peak time for heat demand, unless there is a heat storage system. However, the introduction of bulky thermal storage tanks in commercial buildings, where space utilization may be more important, is another matter to be decided in consideration of economic factors.
It has been verified, in this study, that the inclusion of renewable power dissemination effects in the RPES evaluation of TGS models against SHP resulted in significant changes in the results. It was established that Cases B and C had no greater energy saving effect than the SHP method, unless considering the impact that had not been acknowledged before. In Case A, it was confirmed that the RPES performance was reduced by half. Assuming that the analysis method considering the renewable power dissemination in the market, which is expected to be generally adopted in the RPES evaluation, is applied, it is difficult to make up for the impact only by optimizing the operation strategy for the current application system. In this regard, Case C, in which the building is connected to the adjacent DH grid, can be estimated as an alternative to be considered for solving these problems in the future, even though the current system configuration and applied operation strategy have been proven to be inefficient, due to the high capital cost of renewable energy systems. The most likely alternative is to introduce a new operating platform that can increase the ratio of renewable energy supply to energy load, and minimize wasted surplus energy through the active introduction of a bidirectional energy trading model that reflects the energy prosumer concept. In Case C, it can be assumed that a bidirectional thermal trading model would have achieved great results for RPES if it had been implemented in the model. It was considered that the main reason for RPES results falling short of expectations for Case C was the substantial amount of surplus heat that was wasted due to the lack of appropriate heat demand, as shown in
Figure 16c. If the waste heat was supplied to the DH grid side through the heat trading process between the building and the DH grid, it would have significantly improved the annual average by changing the negative contribution of daily REPS to positive contribution during this period.
In any case, one of the most promising ways to maintain the sustainability of the TGS model on the market in the upcoming era of climate change is to increase the proportion of renewable energy in the construction and operation of the TGS model through the convergence of technologies. To find a solution within a conventional technological frame of TGS model is not a feasible approach. The rapid dissemination of renewable energy in the market due to the climate change crisis may unintentionally provide an opportunity to find other ways to integrate more renewable energy into the TGS model. In relation to the recent issue of power grid instability due to the rapid expansion of renewable energy in the market, DH model integrated with P2H (Power to Heat) technology is being re-evaluated for its capability to mitigate the grid instability arising from the inherent intermittency of renewable energy. Constructing a smart energy network by integrating a high-efficiency TGS model, and a P2H model based on a bidirectional energy trading model, can be a good alternative from the perspective of securing technological competitiveness of the TGS model against SHP, even in the coming era of climate change.
4. Conclusions
In this study, the technological competitiveness of the TGS model is evaluated in terms of sustainability in the era of climate change. It was confirmed that there are two major risk factors for the existing TGS model in maintaining its technological advantage over SHP.
First, it is expected that the primary energy saving contribution of the heat-driven cooling method, which is a key element of the current TGS model, will gradually weaken. This is due to the excellent COP of the heat pump, which is an alternative to the cooling supply in the SHP method. As a result of the sensitivity analysis, even in Case A, which showed the best performance, it was confirmed that the RPES decreased by more than 15%, from 17.9 to 15.3%, when the COP increased by 0.5 from 4.5 to 5.
Second, it was confirmed that if the impact of renewable power generation in the power sector was included in the RPES evaluation process of the SHP method, the comparative advantage of the primary energy saving of the TGS model, not to mention the CGS model, could almost disappear. In Case A, when the proportion of renewable energy generation in the power sector reaches about 20%, the advantage over the existing SHP almost disappears; in contrast, Cases B and C were analyzed to be comparatively inferior to the SHP method.
Constructing a smart energy network by integrating a high-efficiency TGS model and a P2H model based on a bidirectional energy trading model can be a good alternative from the perspective of securing technological competitiveness of the TGS model against SHP, even in coming era of climate change.


