Article

A Novel Prediction Model of the Drag Coefficient of Shale Cuttings in Herschel–Bulkley Fluid

1
Key Laboratory of Enhanced Oil Recovery, Ministry of Education, College of Petroleum Engineering, Northeast Petroleum University, Daqing 163318, China
2
Faculty of Engineering and Applied Science, Memorial University of Newfoundland, St. John’s, NF A1B3X5, Canada
*
Author to whom correspondence should be addressed.
Energies 2022, 15(12), 4496; https://doi.org/10.3390/en15124496
Submission received: 23 May 2022 / Revised: 7 June 2022 / Accepted: 13 June 2022 / Published: 20 June 2022

Abstract

:
In the drilling industry, it is of great significance to accurately predict the drag coefficient and settling velocity of drill cuttings falling in the non-Newtonian drilling fluid. However, the irregular shape of drill cuttings and the non-Newtonian rheological properties of drilling fluid (e.g., shear-thinning and yield stress behavior) make it challenging to predict the settling velocity. In this study, the velocity of particle settlement was studied by a visual device and high-speed camera system. Experimental data of the free settlement of 224 irregular drilling cuttings and 105 spherical particles in the Herschel–Bulkley fluid were obtained. A mechanical model dependent on the force balance of settlement particles was adopted to conduct a detailed statistical analysis of the experimental results, and a prediction model of the drag coefficient of spherical particles in the Herschel–Bulkley fluid was established. A two-dimensional shape description parameter is introduced to establish a model for predicting the drag coefficient of irregular-shaped cuttings in a Herschel–Bulkley fluid. The model has high prediction accuracy for the settling velocity of irregular shale cuttings in Herschel–Bulkley fluid. The average relative error is 7.14%, verifying the model’s accuracy.

1. Introduction

In the process of oil and gas drilling, using mud (non-Newtonian fluid) to remove solids (cuttings) of different shapes in the wellbore is an essential step [1,2,3,4]. However, due to operational limitations (e.g., bit change, single operation) or emergencies, the drilling operation must be stopped briefly, and the circulation of drilling fluid in the annulus will also be interrupted briefly. The cuttings initially transported to the wellhead through drilling fluid circulation begin to settle and deposit at the bottom of the well, causing hole cleaning problems [5,6]. The settling velocity can be used to estimate the formation depth of cuttings. Through cuttings analysis, important formation information such as lithology, porosity, permeability, and pore pressure can be obtained. The settling velocity can also be used as an input parameter for drilling optimization and design. For example, given the condition that the upward velocity of drilling fluid in the annulus needs to be greater than the settling velocity of cuttings, it can guide the mud pump displacement required for the drilling fluid to effectively carry cuttings. The settling velocity of cuttings can usually be calculated according to the prediction model of the particle settling drag coefficient. The in-depth study of the settlement law of cuttings in the mud drilling fluid of horizontal wells and accurate calculation of the settlement drag coefficient is the basic work needed to understand the hole cleaning problem of horizontal wells, which can provide a basis for optimizing the rheological properties and circulation speed of drilling fluid [7,8].
Revealing the law of cuttings settlement can start from the study of spherical particle settlement. Since Stokes (Stokes, 1851, CD = 24/Res), researchers have carried out many studies on using the CD-Res relationship to accurately predict the drag coefficient. The drag coefficient (CD) is defined as the ratio of viscous drag to kinetic energy acting on particles [6,7], and its expression is:
C D = 4 ( ρ p ρ l ) d e g 3 ρ l V t 2
where ρp is the density of particles, kg/m3; ρl is the density of fluid, kg/m3; g is the acceleration of gravity, m/s2; de is particle diameter, m; and Vt is the settling velocity, m/s. If the particle is non-spherical, then de is the equivalent diameter of the particle, and its expression is d e = 6 m p / π ρ p 3 , where mp is the mass of the particle, kg. The particle Reynolds number (Res) is defined as:
R e s = ρ p V t d e μ
where μ is the Newton viscosity of the fluid, Pa·s.
There is much research on particles’ drag coefficient in Newtonian and non-Newtonian fluids [8,9,10,11,12,13,14,15,16,17,18,19,20,21,22,23,24,25,26,27,28,29,30]. For example, Shah [21] proposed a method using a drag coefficient to analyze particle settling velocity in the power-law non-Newtonian fluid. This method takes into account the influence of fluid flow index n and establishes the functional relationship between particle Reynolds number Res and CD2−n. In data processing, Shah fitted CD2−n and Res to a straight line on the coordinate diagram. At a low Reynolds number, the particle settling velocity is greatly affected by the fluid flow index, which decreases with the increase in the Reynolds number. Especially when n = 1, the drag coefficient decreases to the Newton curve of CD and Res. The method has been tested with the data of previous studies, and the results show that the method has high prediction accuracy.
The settling velocity of particles in a liquid is affected by fluid properties. The non-Newtonian characteristics of fluid have a great influence on the settlement rate, especially the non-Newtonian fluid with yield stress (τ0). Dedegil [31] established a prediction model of the sedimentation drag coefficient of particles in Herschel–Bulkley fluid, considering viscous resistance, gravity and buoyancy. The yield stress is included in the influencing conditions of the settling velocity of the model, which is verified by the published clay suspension data.
Certain yield stress is a unique feature of Herschel–Bulkley fluid. When the vertical force acting on it reaches equilibrium, a single particle can be completely suspended. If other parameters remain unchanged, the net downward force increases with the increase in particle size. The fluid used in the petroleum industry not only has yield stress but also has time-dependent and viscoelastic rheological behavior [29]. Through the study of particle settlement in a viscoelastic fluid, it can be found that fluid viscoelasticity will significantly affect the settling velocity in the transient region and has no effect on the settling velocity in the laminar region. The experimental phenomenon reveals that the drag coefficient has also changed substantially due to the changes in particle Reynolds number (Res), particle shape, and viscoelastic fluid parameters. Since the Herschel–Bulkley fluid has certain yield stress, and the settlement law of particles in a non-Newtonian fluid is also different from that in a Newtonian fluid, and to ensure that the settlement results conform to the distribution form of the standard Newton drag coefficient curve, it is necessary to modify the definition of the Reynolds number and apparent viscosity. The modified particle Reynolds number Res in the Herschel–Bulkley fluid is expressed as [32];
R e s = d e n ρ l V t 2 n τ 0 ( d e V t ) n + K
where τ0 is the yield stress, Pa; n is the fluid behavior index, dimensionless; and K is the Herschel–Bulkley fluid consistency index, Pa·sn. The fluid behavior index is the indicator of shear behavior, and the consistency coefficient is the indicator of fluid viscosity, both of which are used to define the rheological parameters of Herschel–Bulkley fluid. The expression is as follows:
τ = τ 0 + K γ ˙ n
where τ is the shear stress, Pa, and γ ˙ is the shear rate, 1/s.
The shape characteristics of the particles are one of the factors affecting the settlement behavior of irregular particles in the fluid. Drill cuttings are irregularly shaped non-spherical particles. It can be seen from the public literature that researchers have established many correlations to predict the drag coefficient of irregular particles, indicating that the shape factor has an impact on the drag coefficient. However, few studies have developed drag coefficient models for irregular particles in Herschel–Bulkley fluids.
Among the parameters describing the shape characteristics of particles in the drag coefficient prediction model, sphericity is a very important one [33,34]. However, it is not easy to measure the surface area of irregular particles, especially for highly irregular particles such as shale cuttings, and it is also difficult to operate in the field. Therefore, other particle shape characteristic parameters, such as circularity c [35,36], can be applied. Circularity c is the ratio of the circumference of the maximum projection surface of a particle to the rim of its equivalent circle. Since it is a two-dimensional shape parameter sensitive to the irregularity of the particle contour, it is relatively easy to measure [37]. Its definition is as follows:
c = π d A P
where dA is the diameter of the equivalent circle of the maximum projection surface of the particle, m; P is the entire projection perimeter of the particle, m.
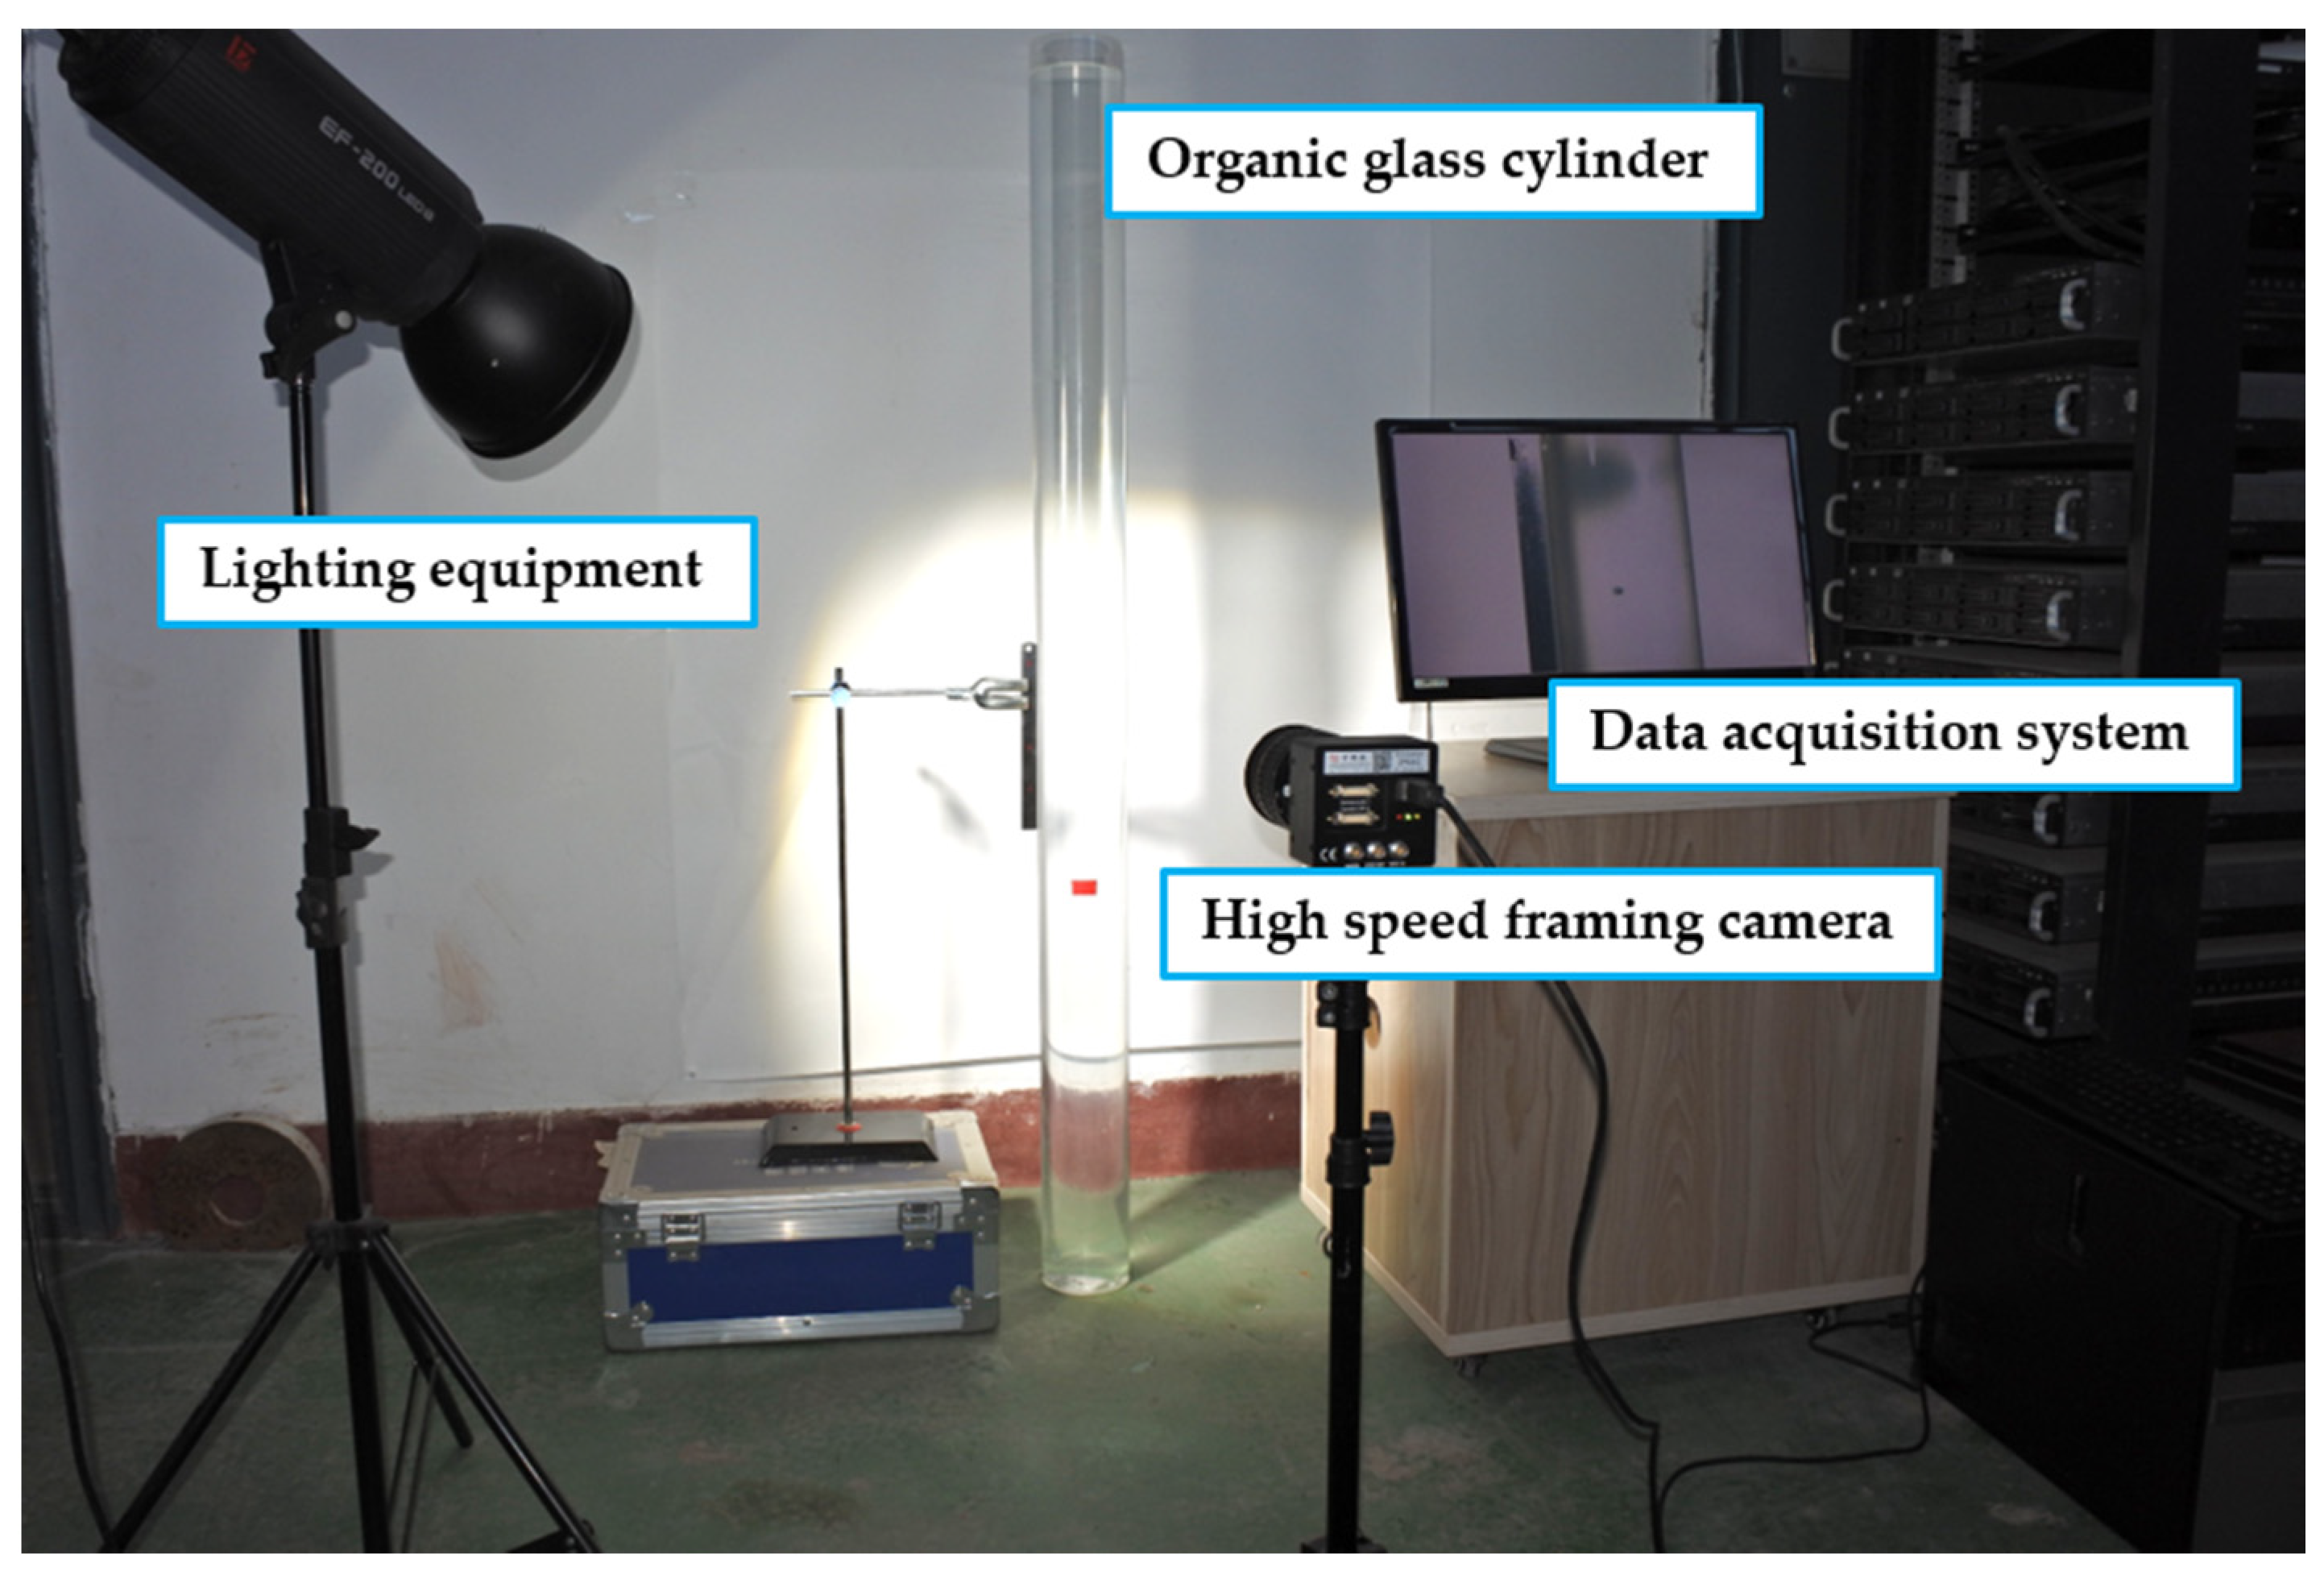
This paper studies the deposition characteristics of shale cuttings in Herschel–Bulkley fluid and verifies the correctness of the experimental process by using particle deposition experiments in Newtonian fluid. By introducing the description parameters representing the cutting morphology, and based on the regression analysis of experimental data, a prediction model for the settlement drag coefficient of spherical particles and shale cuttings in Herschel–Bulkley fluid is proposed. The iterative method was used to calculate the particle settling velocity, which was compared with the particle settling velocity measured in the experiment. The results show that the model has good prediction accuracy for drag coefficient and settling velocity of the Herschel–Bulkley fluid of spherical particles and shale cuttings. These results have important guiding significance for clean hydraulic parameters of shale oil wells in the petroleum industry.

2. Experimental Study

2.1. Experimental Materials

Although high-density materials are not encountered in most practical operations, we hope to broaden the scope and applicability of the experiment by adding some high-density materials to the investigation. In this study, the precise spherical particles of glass, steel, and zirconium and the irregular shape of shale cuttings obtained at the operation site were used. The physical parameters of the particles involved in the experiment are listed in Table 1.

2.2. Experimental Fluid

Carbopol polymer (Lubrizol, Wycliffe, OH, USA) and propylene glycol (Fuchen, Tianjin, China) were used to prepare the test fluids. Carbopol aqueous solution was used as the base fluid of Herschel–Bulkley fluid (Carbopol aqueous solution with yield stress and shear dilution conforms to the rheological model of Herschel–Bulkley fluid), and propylene glycol aqueous solution was used as the base fluid of the Newtonian fluid. The mass concentration range of carbopol aqueous solution is 0.075–0.2 wt%, and the mass concentration range of propylene glycol aqueous solution is 80–100 wt%. In the preparation of Herschel–Bulkley fluid, Carbopol polymer was first mixed with deionized water. Then, the mixture was neutralized with triethanolamine (scientific chemical, Chengdu, China) to form a transparent gel. All pH values were maintained between 6.5 and 7.0, and the viscosity depends on the degree of neutralization. Therefore, two similar polymer concentrations may eventually have different rheological properties. Newtonian fluid is a mixture of propylene glycol and water.
An Anton Paar MCR 92 advanced rheometer (Figure 1) was used to test the rheological properties of the experimental fluid at the experimental temperature. According to the rheological model of Herschel–Bulkley fluid and Newton fluid, the rheological parameters were fitted by data analysis software. The temperature of the experimental liquid was controlled by the temperature control system of the rheometer and was consistent with the temperature in the experiment. The rheological properties of the Carbopol aqueous solution and glycol aqueous solution were tested, and the results are shown in Table 2.

2.3. Characterization of Shale Cuttings Shape

The shale cuttings used in the experiment are shown in Figure 2.
The circularity of the target particle was measured by using the ‘analysis particle’ function of Image J [38]. The circularity in the Image J user guide is defined as:
c = 4 π × A p P 2
where AP is the surface area of the largest projection surface of particles, m2.
For spherical particles, c = 1, and for any other shape particles, c < 1 [39]. We selected some shale cutting image conversion examples, as shown in Figure 3.
The distribution of circularity and equivalent diameter parameters of 224 groups of effective irregular shale cuttings used in the experiment are shown in Figure 4. The equivalent diameter of the shale cuttings used in the experiment is 2.5–5.9 mm, with a median of 4.2 mm, and the circularity is 0.36–0.88, with a median of 0.62. The circularity of most shale cuttings is concentrated between 0.6 and 0.85.

2.4. Experimental Apparatus and Process

As shown in Figure 5, the settlement experimental device is an organic glass tube with 1500 mm height and 100 mm inner diameter, using a Re-vealer 2F04C high-speed camera to shoot the shale cuttings’ deposition trajectory at 100 frames/second. We connected the high-speed camera to the computer for data storage and analysis. After the feasibility calculation at the beginning of the experiment, the liquid level height above 700 mm in the observation area of this experiment can make the particles reach a stable settlement state. The effect of the end effect on settling velocity is also considered. Therefore, the image acquisition area is set below 700 mm from the top of the liquid inside the tube and above 300 mm from the bottom of the liquid inside the tube.
The configured practical solution was poured into the settling device and stood for 12 h until the bubble was discharged. Before each test, the particles were immersed in a small amount of test fluid to ensure that the particles and the test fluid could come fully into contact during the experiment. During the settling experiment, the particles should be put under the main liquid level of the cylinder container. The temperature should be kept constant throughout the investigation. At the same time, to reduce the interference of uncertainty in the experiment, each spherical particle should be repeated at least three times in the same density fluid. In the subsequent data processing, the experimental data with a relative error greater than 5% are eliminated, and the remaining data are used to fit the drag coefficient relationship.
In addition, the settlement direction of particles in the projection area can be determined and calculated by high-speed camera images and image processing software. Detailed processing and examples are shown in Figure 6.

3. Results and Discussion

3.1. Settlement of Spherical Particles in a Fluid

Firstly, the settlement experiment of spherical particles was carried out, and the relationship between CD (Equation (1)) and Res (Equation (3)) was established. The experimental settlement data of 165 groups (105 groups in Herschel–Bulkley fluid and 60 groups in Newtonian fluid) of spherical particles were analyzed, and the relationship between CD and Res was plotted in the form of logarithmic coordinates (Figure 7). It can be seen from the figure that under the condition of a low Reynolds number, the settlement drag coefficient CD distribution of spherical particles in different fluids conforms to the prediction trend of the Stokes equation (CD = 24/Res). The curve of the settling drag coefficient of particles in a Newtonian fluid with a Reynolds number is in good agreement with the Stokes equation, but there is an obvious error in predicting the settling drag coefficient of spherical particles in Herschel–Bulkley fluid by the Stokes equation. For example, when Res is less than 0.1, the average relative error between the test results of spherical particles in the Newtonian fluid and the results calculated by the Stokes equation is only 2.17%. The average relative error in Herschel–Bulkley fluid is as high as 19.96%. The results show that the rheological properties of non-Newtonian fluids have an important influence on the fluid–particle interaction. Therefore, using the correlation of Newtonian fluid to calculate the drag coefficient of spherical settlement in the non-Newtonian fluid will produce many errors.
According to the experimental data of spherical particle settlement, through the parameter fitting of different prediction models of settlement drag coefficient in Table 3, it is found that the five-parameter model (Equation (7)) proposed by Clift (1970) has the best fitting degree, and its expression is:
C D = 24 R e s ( 1 + A R e s B ) + C 1 + D / R e s E
where A, B, C, D, and E are correlation coefficients. Since the total drag FD of particles under any flow state can be regarded as the sum of the components of drag FD in laminar and turbulent flows, the drag coefficient CD can be improved by adding a complex turbulent term to the extended Stokes equation. From Equation (7), it can be seen that the first item on the right side of the equation shows that under laminar flow conditions, the drag coefficient decreases with the increase in particle Reynolds number. The second item on the right side of the formula shows that under turbulent conditions, the drag coefficient decreases gradually with the increase in particle Reynolds number.
The experimental settlement data of 105 groups of spherical particles were fitted and regressed, and the relationship between the settlement drag coefficient of spherical particles in Herschel–Bulkley fluid was obtained.
C D = 24 R e s ( 1 + 1.773 R e s 0.551 ) 61.377 1 + 1.889 R e s 0.484 ( 0.01 < R e s < 96 )
By comparing Equation (15) with the representative relationship of the settlement drag coefficient in the Herschel–Bulkley fluid (Equations (12)–(14)) in the literature, the prediction of the proposed correlation of spherical settlement drag coefficient in Herschel–Bulkley fluid is evaluated by using three statistical parameters: the average relative error MRE, the maximum average relative error Max MRE and the logarithmic root mean square error RMSLE [40,41]. The results are shown in Table 4. The expressions of MRE and RMSLE are:
M R E = ( i = 1 N | C D , c , i C D , m , i | C D , m , i ) / N × 100 %
R M S L E = i = 1 N ( ln C D , c , i ln C D , m , i ) 2 N × 100 %
where N is the total number; CD,c is the predicted drag coefficient, dimensionless; and CD,m is the experimentally measured drag coefficient, dimensionless.
In this study, the sedimentation velocity Vts of the sphere was obtained by the experimental method. According to the data obtained in the experiment, the relationship between the settlement drag coefficient CD and the particle Reynolds number Res was fitted by the fitting software. According to the proposed CD-Res correlation, the iterative trial-and-error method was used to calculate the settling drag coefficient CD and settling velocity Vt of particles in the fluid [35]. The iteration process is shown in Figure 8.
According to the proposed prediction model of spherical particle drag coefficient (15), the drag coefficient CD and settling velocity Vt of settling particles are calculated by the trial-and-error process shown in Figure 8, as shown in Figure 9 and Figure 10. It can be seen from Figure 9 and Table 4 that for the Herschel–Bulkley fluid, the predicted values of Equations (12)–(14) are close to the measured values in the experiment, and the MRE is about 15.62%. The MRE of the model (Equation (15)) is 4.34%. Compared with other models, the three quantitative evaluation parameters are reduced to some extent, and the prediction accuracy of the experimental results is higher. In addition, as shown in Figure 10, the MRE between the predicted and measured sedimentation velocity of spherical particles is only 6.85%. Therefore, the correlation proposed in this paper can better predict the settling drag coefficient CD and settling velocity Vt of spherical particles in the Herschel–Bulkley fluid.

3.2. Establishment and Analysis of Shale Cutting Settling Drag Coefficient Model

Based on the above-proposed prediction model of spherical particle drag coefficient (Equation (15)), the settling drag coefficient CD relationship suitable for shale cuttings is established by introducing particle circularity c. At any given Reynolds number, the drag force on the sphere is less than that on shale cuttings [32,37]. The irregular surface of shale cuttings will increase drag and greater flow separation, resulting in lower settling velocity than spherical particles [42]. Some scholars pointed out that particle property changes lead to two different settling modes [43]: When Res > 100, cutting sedimentation is swinging, while when Res < 100, cutting sedimentation is stable. Circularity c is more suitable for establishing the prediction model without considering the secondary motion in particle falling. Therefore, in the case of a particle with low Reynolds number with Res < 100, it is feasible to select the prediction model of shale cuttings’ settling drag coefficient in Herschel–Bulkley fluid by introducing circularity. Through experimental observation (Figure 11), under the same conditions, the ratio of shale cutting drag coefficient CD to spherical particle drag coefficient CD,sph, is slightly greater than 1. At a high Reynolds number, the percentage will be more significant due to the influence of shape.
By analyzing the difference between the drag coefficient CD obtained by the shale cutting experiment and the predicted drag coefficient CD,sph of spherical particle sedimentation under the same conditions, the exponential function of circularity function f (c) based on natural number e is established, and the functional relationship of CD/CD,sph is also established. The expression is as follows:
C D = C D , s p h exp [ f ( c ) ]
In special cases, such as c = 1, the drag coefficient of shale cuttings is equal to that of spherical particles under the same parameters. Combined with 224 sets of experimental data, f (c) is determined by Equation (19).
f ( c ) = α R e s β ( 1 c ) η
where α, β, and ղ are empirical coefficients, which can be obtained by nonlinear fitting.
The expression of the drag coefficient CD of shale cuttings in Herschel–Bulkley fluid is as follows:
C D = C D , s p h e x p [ 0.45 R e s 0.36 ( 1 c ) 0.95 ] ( 0.08 < R e s < 15 )
Figure 12 shows the relationship between the predicted value of shale cuttings drag coefficient and the measured drag coefficient CD and the measured value calculated by Equation (20). Table 5 lists the evaluation results of the model, and the MRE of the predicted drag coefficient is 6.39%.
According to the proposed model (Equation (20)), the settling velocity of shale cuttings in Herschel–Bulkley fluid is calculated and compared with the experimentally measured value (Figure 13). The comparison shows that the average relative error of the predicted value of settling velocity Vt of shale cuttings in Herschel–Bulkley fluid is 7.14%. Figure 13 shows that although the prediction results of the model have a certain dispersion, the data are uniformly distributed on the coordinate axis line, so the model can better predict the deposition rate of shale cuttings in the Herschel–Bulkley fluid.

4. Discussion on the Limitations of the Model

The limitation of the prediction model of shale cuttings’ drag coefficient proposed in this study is that the range of particle Reynolds number is relatively small (0.08~15). With increasing the Reynolds number of the particles, either by increasing the particle size or density or by reducing the viscosity of the fluid, particles collide frequently with the column wall during its settlement, even if the inner diameter of the resin glass column we studied is 100 mm. Therefore, these experimental data are invalid because the velocity after particle collision is very different from the original velocity.
We plan to conduct further experiments after increasing the wellbore diameter. With the discovery of relevant fields, the model will continue to evolve, and with more additional data, the rationality and application scope of our results will gradually improve.
In summary, for the test of spherical and shale cuttings, the prediction model proposed in this paper is effective in the range of particle Reynolds numbers and roundness. However, the use of these prediction models outside these ranges may lead to inaccurate results. Therefore, the correlation needs to be confirmed by additional experimental data, such as large particle Reynolds numbers, which will be pursued in our future work.

5. Conclusions

In this paper, the effective experimental data of 105 groups of spherical particles and 224 groups of shale cuttings in Herschel–Bulkley fluid are obtained through laboratory experiments. Through the regression analysis of the experimental data, the following conclusions are drawn:
(1)
For spherical particles, a model for predicting the settling drag coefficient of spherical particles in Herschel–Bulkley fluid is established by modifying the correlation proposed by Clift (1970) and considering the rheological properties of the fluid.
(2)
For non-spherical shale cuttings, based on the spherical particle prediction model, using image analysis technology and introducing two-dimensional shape description parameters, a resistance coefficient model for predicting the settlement of shale cuttings in Herschel–Bulkley fluid is established.
(3)
According to the prediction model, the settlement rate is calculated by an iterative method. The average relative errors of spherical particles and shale cuttings are 6.85% and 7.14%, respectively. The results show that the model has good prediction ability. This work can provide a valuable reference for those interested in cuttings’ settling velocity, cuttings’ migration, and hole cleaning in drilling engineering.

Author Contributions

Conceptualization, X.S.; Validation, Z.L.; Writing—original draft, M.S. All authors have read and agreed to the published version of the manuscript.

Funding

This research was funded by National Natural Science Foundation of China (Grant No. 52174002) and (Grant No. 52004064).

Conflicts of Interest

The authors declare no conflict of interest.

Nomenclature

CDdrag coefficient, dimensionless
Resparticle Reynolds number
ρpdensity of particles (kg/m3)
ρldensity of fluid (kg/m3)
gacceleration of gravity (m/s2)
departicle diameter (m)
Vtsettling velocity (m/s)
mpmass of the particle (kg)
μNewton viscosity of the fluid (Pa·s)
τ0yield stress (Pa)
nfluid behavior index, dimensionless
KHerschel–Bulkley fluid consistency index (Pa·sn)
τshear stress (Pa)
γ ˙ shear rate (1/s)
dAdiameter of the equivalent circle of the maximum projection surface of the particle (m)
Pentire projection perimeter of the particle (m)
ccircularity
APThe surface area of the largest projection surface of particles (m2)
A, B, C, D, and Ecorrelation coefficients Equation (7)
Ntotal number
CD, cpredicted drag coefficient, dimensionless
CD, mexperimentally measured drag coefficient, dimensionless
CD,sphpredicted drag coefficient of spherical particle settlings, dimensionless
α, β, and ղempirical coefficient Equation (19)

References

  1. Duan, M.; Miska, S.; Yu, M.; Takach, N.; Ahmed, R.; Zettner, C. Transport of Small Cuttings in Extended-Reach Drilling. SPE Drill. Complet. 2008, 23, 258–265. [Google Scholar] [CrossRef]
  2. Sorgun, M. Simple Correlations and Analysis of Cuttings Transport with Newtonian and Non-Newtonian Fluids in Horizontal and Deviated Wells. J. Energy Resour. Technol. 2013, 135, 032903. [Google Scholar] [CrossRef]
  3. Khormali, A.; Petrakov, D.G.; Farmanzade, A.R. Prediction and Inhibition of Inorganic Salt Formation under Static and Dynamic Conditions-Effect of Pressure, Temperature, and Mixing Ratio. Int. J. Technol. 2016, 7, 943–951. [Google Scholar] [CrossRef]
  4. Wells, H.; Larsen, T.I.; Corp, U.; Pilehvari, A.A.; Texas, A.; Azar, J.J.; Tulsa, U. Development of a new cuttings-transport model for high-angle wellbores including horizontal wells. SPE Drill. Complet. 1997, 12, 129–135. [Google Scholar]
  5. Moreira, B.A.; de Oliveira Arouca, F.; Damasceno, J.J.R. Analysis of Suspension Sedimentation in Fluids with Rheological Shear-Thinning Properties and Thixotropic Effects. Powder Technol. 2017, 308, 290–297. [Google Scholar] [CrossRef]
  6. Khormali, A.; Sharifov, A.R.; Torba, D.I. Experimental and Modeling Analysis of Asphaltene Precipitation in the near Wellbore Region of Oil Wells. Pet. Sci. Technol. 2018, 36, 1030–1036. [Google Scholar] [CrossRef]
  7. Sun, X.; Zhang, K.; Chen, Y.; Li, W.; Qu, J. Study on the Settling Velocity of Drilling Cuttings in the Power Law Fluid. Powder Technol. 2020, 362, 278–287. [Google Scholar] [CrossRef]
  8. Khormali, A.; Moghadasi, R.; Kazemzadeh, Y.; Struchkov, I. Development of a New Chemical Solvent Package for Increasing the Asphaltene Removal Performance under Static and Dynamic Conditions. J. Pet. Sci. Eng. 2021, 206, 109066. [Google Scholar] [CrossRef]
  9. Okesanya, T.; Kuru, E.; Sun, Y. A New Generalized Model for Predicting the Drag Coefficient and the Settling Velocity of Rigid Spheres in Viscoplastic Fluids. SPE J. 2020, 25, 3217–3235. [Google Scholar] [CrossRef]
  10. Rushd, S.; Hassan, I.; Sultan, R.A.; Kelessidis, V.C.; Rahman, A.; Hasan, H.S.; Hasan, A. Terminal Settling Velocity of a Single Sphere in Drilling Fluid. Part. Sci. Technol. 2019, 37, 939–948. [Google Scholar] [CrossRef]
  11. Clift, R.; Gauvin, W.H. Motion of Entrained Particles in Gas Streams. Can. J. Chem. Eng. 1971, 49, 439–448. [Google Scholar] [CrossRef]
  12. Turton, R.; Levenspiel, O. A Short Note on the Drag Correlation for Spheres. Powder Technol. 1986, 47, 83–86. [Google Scholar] [CrossRef]
  13. Haider, A.; Levenspiel, O. Drag Coefficient and Terminal Velocity of Spherical and Nonspherical Particles. Ind. Eng. Chem. 1967, 59, 55–58. [Google Scholar] [CrossRef]
  14. Chhabra, R.P.; Peri, S.S. Simple Method for the Estimation of Free-Fall Velocity of Spherical Particles in Power Law Liquids. Powder Technol. 1991, 67, 287–290. [Google Scholar] [CrossRef]
  15. Saha, G.; Purohit, N.K.; Mitra, A.K. Spherical Particle Terminal Settling Velocity and Drag in Bingham Liquids. Int. J. Miner. Process. 1992, 36, 273–281. [Google Scholar] [CrossRef]
  16. Chien, S.F. Settling Velocity of Irregularly Shaped Particles. Proc.—SPE Annu. Tech. Conf. Exhib. 1994, 4, 281–289. [Google Scholar] [CrossRef]
  17. Hill, K.B.; Shook, C.A. Pipeline Transport of Coarse Particles by Water and by Fluids with Yield Stresses. Part. Sci. Technol. 1998, 16, 163–183. [Google Scholar] [CrossRef]
  18. Brown, P.P.; Lawler, D.F. Sphere Drag and Settling Velocity Revisited. J. Environ. Eng. 2003, 129, 222–231. [Google Scholar] [CrossRef]
  19. Wilson, K.C.; Horsley, R.R.; Kealy, T.; Reizes, J.A.; Horsley, M. Direct Prediction of Fall Velocities in Non-Newtonian Materials. Int. J. Miner. Process. 2003, 71, 17–30. [Google Scholar] [CrossRef]
  20. Kelessidis, V.C.; Mpandelis, G. Measurements and Prediction of Terminal Velocity of Solid Spheres Falling through Stagnant Pseudoplastic Liquids. Powder Technol. 2004, 147, 117–125. [Google Scholar] [CrossRef]
  21. Shah, S.N.; El Fadili, Y.; Chhabra, R.P. New Model for Single Spherical Particle Settling Velocity in Power Law (Visco-Inelastic) Fluids. Int. J. Multiph. Flow 2007, 33, 51–66. [Google Scholar] [CrossRef]
  22. Cheng, N.S. Comparison of Formulas for Drag Coefficient and Settling Velocity of Spherical Particles. Powder Technol. 2009, 189, 395–398. [Google Scholar] [CrossRef]
  23. Vlasak, P.; Chara, Z. Conveying of Solid Particles in Newtonian and Non-Newtonian Carriers. Part. Sci. Technol. 2009, 27, 428–443. [Google Scholar] [CrossRef]
  24. Gumulya, M.M.; Horsley, R.R.; Wilson, K.C.; Pareek, V. A New Fluid Model for Particles Settling in a Viscoplastic Fluid. Chem. Eng. Sci. 2011, 66, 729–739. [Google Scholar] [CrossRef]
  25. Mikhailov, M.D.; Freire, A.P.S. The Drag Coefficient of a Sphere: An Approximation Using Shanks Transform. Powder Technol. 2013, 237, 432–435. [Google Scholar] [CrossRef]
  26. Pani, G.K.; Rath, P.; Barik, R.; Senapati, P.K. The Effect of Selective Additives on the Rheological Behavior of Power Plant Ash Slurry. Part. Sci. Technol. 2015, 33, 418–422. [Google Scholar] [CrossRef]
  27. Arabi, A.S.; Sanders, R.S. Particle Terminal Settling Velocities in Non-Newtonian Viscoplastic Fluids. Can. J. Chem. Eng. 2016, 94, 1092–1101. [Google Scholar] [CrossRef]
  28. Arnipally, S.K.; Kuru, E. Settling Velocity of Particles in Viscoelastic Fluids: A Comparison of the Shear-Viscosity and Elasticity Effects. SPE J. 2018, 23, 1689–1705. [Google Scholar] [CrossRef]
  29. Elgaddafi, R.; Ahmed, R.; Growcock, F. Settling Behavior of Particles in Fiber-Containing Herschel Bulkley Fluid. Powder Technol. 2016, 301, 782–793. [Google Scholar] [CrossRef]
  30. Yang, F.; Zeng, Y.H.; Huai, W.X. A New Model for Settling Velocity of Non-Spherical Particles. Environ. Sci. Pollut. Res. 2021, 28, 61636–61646. [Google Scholar] [CrossRef]
  31. Dedegil, M.Y. Drag Coefficient and Settling Velocity of Particles in Non-Newtonian Suspensions. J. Fluids Eng. Trans. ASME 1987, 109, 319–323. [Google Scholar] [CrossRef]
  32. Machač, I.; Ulbrichová, I.; Elson, T.P.; Cheesman, D.J. Fall of Spherical Particles through Non-Newtonian Suspensions. Chem. Eng. Sci. 1995, 50, 3323–3327. [Google Scholar] [CrossRef]
  33. Khan, A.R.; Richardson, J.F. The Resistance to Motion of a Solid Sphere in a Fluid. Chem. Eng. Commun. 1987, 62, 135–150. [Google Scholar] [CrossRef]
  34. Yan, T.; Qu, J.Y.; Sun, X.F.; Li, W.; Chen, Y.; Hu, Q.B. A Novel Predictive Model of Drag Coefficient and Settling Velocity of Drill Cuttings in Non-Newtonian Drilling Fluids. Pet. Sci. 2021. [CrossRef]
  35. Dioguardi, F.; Mele, D.; Dellino, P. A New One-Equation Model of Fluid Drag for Irregularly Shaped Particles Valid Over a Wide Range of Reynolds Number. J. Geophys. Res. Solid Earth 2018, 123, 144–156. [Google Scholar] [CrossRef] [Green Version]
  36. Tran-Cong, S.; Gay, M.; Michaelides, E.E. Drag Coefficients of Irregularly Shaped Particles. Powder Technol. 2004, 139, 21–32. [Google Scholar] [CrossRef]
  37. Dioguardi, F.; Mele, D. A New Shape Dependent Drag Correlation Formula for Non-Spherical Rough Particles. Experiments and Results. Powder Technol. 2015, 277, 222–230. [Google Scholar] [CrossRef]
  38. Carlier, T.; Ferrer, L.; Berruchon, J.B.; Cuissard, R.; Martineau, A.; Loonis, P.; Couturier, O. Quality Controls for Gamma Cameras and PET Cameras: Development of a Free Open-Source ImageJ Program. Phys. Med. Imaging 2005, 5745, 1237–1246. [Google Scholar] [CrossRef]
  39. Breakey, D.E.S.; Vaezi, G.F.; Masliyah, J.H.; Sanders, R.S. Side-View-Only Determination of Drag Coefficient and Settling Velocity for Non-Spherical Particles. Powder Technol. 2018, 339, 182–191. [Google Scholar] [CrossRef]
  40. Barati, R.; Neyshabouri, S.A.A.S.; Ahmadi, G. Development of Empirical Models with High Accuracy for Estimation of Drag Coefficient of Flow around a Smooth Sphere: An Evolutionary Approach. Powder Technol. 2014, 257, 11–19. [Google Scholar] [CrossRef]
  41. Goossens, W.R.A. A New Explicit Equation for the Terminal Velocity of a Settling Sphere. Powder Technol. 2020, 362, 54–56. [Google Scholar] [CrossRef]
  42. Shahi, S.; Kuru, E. An Experimental Investigation of Settling Velocity of Natural Sands in Water Using Particle Image Shadowgraph. Powder Technol. 2015, 281, 184–192. [Google Scholar] [CrossRef]
  43. Fang, G. An Experimental Study of Free Settling of Cuttings in Newtonian and Non-Newtonian Drillings Fluids: Drag Coefficient and Settling Velocity. SPE J. 1992, 4, 1–13. [Google Scholar]
Figure 1. Advanced rheometer (Anto Paar MCR 92).
Energies 15 04496 g001
Figure 2. Schematic diagram of shale cuttings morphology in different well sections.
Energies 15 04496 g002
Figure 3. Examples of image conversion of shale cuttings: (a) Original RGB image; (b) Gray image; (c) Image threshold; (d) Drawing contour.
Energies 15 04496 g003
Figure 4. Relationship between circularity of shale cuttings and equivalent diameter distribution.
Energies 15 04496 g004
Figure 5. Schematic diagram of particle settlement experimental device.
Energies 15 04496 g005
Figure 6. Four consecutive pictures captured during the settlement of shale cuttings.
Energies 15 04496 g006
Figure 7. Variation in CD-Res relationship of 165 groups of spherical particles obtained from sedimentation experiment.
Energies 15 04496 g007
Figure 8. Iterative trial and error flow chart.
Energies 15 04496 g008
Figure 9. Comparison between the predicted value of this model and the experimentally measured value of the settling drag coefficient of spherical particles.
Energies 15 04496 g009
Figure 10. Comparison between the predicted value and the experimentally measured value of settling velocity of spherical particles.
Energies 15 04496 g010
Figure 11. CD-Res relationship of 224 shale cutting data.
Energies 15 04496 g011
Figure 12. Comparison of prediction results of drag coefficient CD and CD,sph expf(c) measured by shale cutting settling experiment.
Energies 15 04496 g012
Figure 13. Comparison results between experimental measured values and model predicted values of shale cuttings settlement velocity.
Energies 15 04496 g013
Table 1. Main physical parameters of particles involved in experiments.
MaterialParticle Equivalent Diameter ds (mm)Density (kg/m3)
Shale cuttings2.1–5.72073
Glass1, 2, 3, 4, 52510
Zirconium oxide1, 2, 3, 4, 56080
Steel1, 2, 3, 4, 57940
Table 2. Rheological test results of Carbopol aqueous solution and glycol aqueous solution for experiments.
Testing LiquidConcentration (wt%)Temperature (°C)Density (kg /m3)Rheological Parameter
τ0 (Pa)K (Pa·sn)n
Carbopol0.21710005.65753.451890.59372
0.17517.410002.48281.991230.64663
0.1517.410001.27321.007230.70503
0.12516.610000.714740.565330.74698
0.117.610000.303690.244120.8189
0.087517.410000.232240.180420.84364
0.07517.510000.137980.103410.88723
glycerol10018.6126001.43130
9519.0124600.58250
9018.6123100.22650
8019.0120500.06560
Table 3. Representative CD-Res correlation.
AuthorEquationNumber
Clift [11] C D = 24 R e s ( 1 + 0.15 R e s 0.687 ) + 0.42 1 + 42500 R e s 1.16 ( R e s < 10 5 ) (8)
Shah [28] { C D 2 n R e s 2 = A ( R e s ) B A = 6.9148 ( n 2 ) 24.838 ( n ) + 22.642 B = 0.5067 ( n 2 ) + 1.3234 ( n ) 0.1744 (9)
Elgaddafi [29] { C D = 24 / R e s ( R e s < 1 ) C D = 27.41 / R e s 0.85 (10)
Yang and Zeng [30] C D = 24 R e s ( 2 ϕ ) 1.29 + 24 R e s ( 1 + 0.15 R e s 0.687 ) ϕ R e s 0.134 + 0.42 1 + 42500 R e s 1.16 e 1.43 ( 1 ϕ ) (11)
Khan [31] C D = ( 2.25 R e s 0.31 + 0.36 R e s 0.06 ) 3.45 ( 1 < R e s < 1000 ) (12)
Machač [33] { C D = 24 R e s X ( n ) ( R e s < 1 ) C D = 24 R e s X ( n ) + 10.5 n 3.5 R e s 0.32 n + 0.13 ( 1 < R e s < 1000 ) X ( n ) = 3 ( 3 n 3 ) / 2 33 n 5 64 n 4 11 n 3 + 97 n 2 + 16 n 4 n 2 ( n + 1 ) ( n + 2 ) ( 2 n + 1 ) (13)
Okesanya [9] C D = 24 R e s ( 1 + 0.12 R e s ) 0.35 + 0.398 [ 1 exp ( 0.01 R e s 0.9282 ) ] (14)
Table 4. Error Statistics of Drag Coefficient of Spherical Particles Settlement in Herschel–Bulkley Fluid.
ResAuthorError
MRERMSMax MRE
0.01 < Res < 96Khan and Richadson (1987)16.19%0.2145.6%
Machač. (1995)18.42%0.2632.73%
Okesanya (2020)12.25%0.1634.8%
This chapter (Equation (8))6.85%0.0716.5%
Table 5. Error statistics of shale cuttings drag coefficient.
FluidCoefficient CD Relationship Error
MRERMSMax Error
Herschel–Buckley fluid0.08 < coefficient CD relationship < 156.39%0.06916.74%
Publisher’s Note: MDPI stays neutral with regard to jurisdictional claims in published maps and institutional affiliations.

