Article

Influence of Densification on the Pyrolytic Behavior of Agricultural Biomass Waste and the Characteristics of Pyrolysis Products

The Institute of Chemistry, Jan Kochanowski University in Kielce, Uniwersytecka Str. 7, 25-406 Kielce, Poland
*
Author to whom correspondence should be addressed.
Energies 2022, 15(12), 4257; https://doi.org/10.3390/en15124257
Submission received: 23 May 2022 / Revised: 4 June 2022 / Accepted: 6 June 2022 / Published: 9 June 2022
(This article belongs to the Collection Energy-Efficient Chemistry)

Abstract

:
TG/FT-IR techniques, UV-spectroscopy, microwave extraction, XRD and SEM were used to study how densification of the three types of agricultural biomass wastes (wheat straw, soft wood, and sunflower husk) changes the composition and structure of their pyrolysis products. It was determined that densification changes the composition of volatile products of pyrolysis at the temperature of 420 °C: sunflower husk emits 4.9 times less saturated and unsaturated hydrocarbons and 1.9 times less compounds with carbonyl group; soft wood emits 1.8 times more saturated and unsaturated hydrocarbons and compounds with carbonyl groups and 1.3 times more alcohols and phenols; and wheat straw emits 2 times more compounds with carbonyl groups. These changes are probably caused by the differences in interaction of formed volatiles with the surface of chars. These differences can be caused by distinct places of cumulation of inorganic components in the densified samples. In the densified char, the inorganics cumulate on the surface of sunflower husk whereas for wheat straw they cumulate inside the sample. In the case of soft wood, the inorganics cumulate both inside and on the surface. The decreased contribution of hydrocarbons in volatiles can be connected with the morphology of nano-particles formed in inorganics.

1. Introduction

Limitations on the use of fossil fuels to obtain heat and electrical energy resulted in intensification of research on ways of their substitution by renewable sources, including various types of biomass. In order to increase the efficiency of its use, biomass was subjected to densification—pelleting, briquetting, granulation etc. [1]—before combustion. The densification of biomass made its transportation and storage easier and facilitated the work of equipment applied to its thermal conversion [2,3]. The densification is conducted both without binders [4,5] and with application of binders of various types: coal tar, coal tar sludge, paraffin [6], microalgae [7], or carboxymethyl cellulose [8,9], for appropriate biomass species. There is a wide range of works connected with the search for new ways of biomass pre-treatment before briquetting [5,10,11,12] and obtaining of new biomass species [13,14]. The influence of moisture content and pressure on the formation of pellets [15] and biomass/water ratio in hydrothermal carbonization [16] was analyzed. Mainly, the influence of additives of different types on physical-mechanical properties of briquettes [7,17,18,19,20,21] was evaluated along with the optimalization of pelleting conditions by mixing biomass of various types [22] or reheating of obtained pellets [23]. The combustion process of briquetted biomass was studied from the viewpoint of emission of particulate matter [8,24].
Research conducted by a number of authors shows that the obtained volatile products can interact with char [25,26,27,28] and tar [29] formed during biomass pyrolysis and change their composition and yield. According to Hosoya et al. [30], during biomass pyrolysis there can occur some interactions between solid and liquid phases that accelerate the formation of char from cellulose and lignin. Chen et al. suggested [31] that secondary reactions can take place between volatile products of even unmixed biomass components. These findings give good reason to suggest that the biomass densification during briquetting will hinder the removal of volatile products from the inside of briquette and in fact can enhance the aforementioned interactions. However, this suggestion was not studied completely.
During the process of pyrolysis, the basic components of biomass (hemicellulose, cellulose, and lignin) undergo the process of thermal decomposition, when solid (char), liquid (condensate, bio-oil), and gaseous products are formed. Based on mass spectrometric analysis, Penzik et al. [32] stated that, in the composition of pyrolytic gases, H2O and CH4, have a greater contribution and CH4, CH3COOH, furans, phenols, and aromatic compounds are present to a lesser extent. According to Osman [33], nitrous oxide, hydrogen, methyl alcohol, acetaldehyde, acetic acid, and ethane can evaporate from lignocellulose biomass during pyrolysis. Ojha et al. [34] confirmed the results obtained by the previous authors and completed the list with a further group of compounds that are formed during the pyrolysis of bagasse: condensed organics, furans, cyclo-oxygenated compounds, N-containing organics, and aromatics. On the basis of research on thermal behavior of basic biomass components, Chen et al. [35] stated that anhydrosugars and furans were the main components of bio-oil from cellulose whereas the bio-oils from hemicellulose and lignin contained acids, phenols, aldehydes, ketones, and alcohols. Based on kinetic studies on agro-waste, Osman et al. [36] proposed a 10-step pyrolysis mechanism. In their opinion, the pyrolyses of hemicellulose and cellulose can occur in 3 steps whereas that of lignin can occur in 4 steps. The mechanism was proposed on the basis of studies on the decomposition of single components without any interaction between them.
It was established that the presence of inorganic components [37,38,39] affects the course of biomass pyrolysis. The inorganic components can catalyze the conversion of particular biomass components [29,40,41,42,43] and thus change the composition of formed pyrolysis products. According to Fan et al. [44], potassium salts can facilitate an increase in the yield of furans, aldehydes, ketones, and CO2. Zhu et al. [45] suggest that potassium favors the transformation of bio-oils into gas (CO2) and the reaction of demethylation of guaiacyl at low temperature. According to Lu et al. [46], Ca can promote the activity of Fe by the formation of Ca2Fe2O5 wherein Fe/SiO2, Ca/SiO2, and Fe-Ca/SiO2 catalysts influence selective deoxygenation. Shen et al. [47] prove that alkaline-earth-metal additives can decrease the content of acids and increase the content of hydrocarbons in bio-oil whereas additives of Mg compounds can be more favorable for production of hydrocarbons compared with the additives of Ca compounds since during biomass pyrolysis oils are formed and the presence of Mg and Ca compounds in the densified biomass can also intensify the course of such reactions.
The research described in the literature was mainly carried out on the briquettes (pellets) obtained with the use of both various binders [6,7,8,9] or moisture [15]; it thus determined the changes taking place under the influence of the two factors—presence of an additive and densification. However, the influence of one factor (biomass densification without binders) on the composition and structural chemical parameters of formed pyrolysis products has not been well described in the literature. Evaluating the influence of densification in research on switchgrass, Yang et al. [5] determined that densification influences the contents of anhydrous sugars, phenols, and guaiacols in the products of pyrolysis. Investigating switchgrass, Sarkar et al. [48] established that, under the influence of densification, the yield of H2 increases, the yield of CH4 decreases, and both carbon conversion and cold gas efficiencies rise. However, there is still no detailed information and comparison of pyrolytic behavior for different types of loose and densified biomasses.
This research aims to investigate the way that biomass densification without binders influences: (i) the thermal behavior and composition of volatile products of pyrolysis of wheat straw, soft wood, and sunflower husk, (ii) the thermal stability of their basic components, (iii) the structural chemical characteristics of liquid products of thermal conversion of biomass, (iv) the structure and texture of the formed char along with inorganics cumulating in it.

2. Materials and Methods

2.1. Materials

The samples of wheat straw (WS), softwood (SW), and sunflower husk (SH) were dried at room temperature, then ground and sieved through a 0.2 mm sieve, and dried at the temperature of 105 °C. The elemental composition of the samples determined by an Elementar Vario Micro Cube CHNS analyzer is presented in Table 1.
It follows from the data in the table that SH sample has the greatest content of C, H, and N elements and a greater value of the HHV parameter. WS sample has the greatest content of inorganic components—the ash content in this sample is almost twice as highas that in other samples.
Table 2 shows the data on the contents of selected inorganic elements that are present in the studied samples.
The contents of these elements were determined by the ED-XRF technique. A Thermo Scientific Niton Goldd+ analyzer was used for this purpose. The data in Table 2 show that K element is present in the studied WS and SH samples in the amount of 1.3%, and that the greatest amounts of Ca were detected in the SW sample. According to the authors [42,44,49,50] the compounds containing K, Ca, and Mg elements can be catalyzers in the process of biomass pyrolysis. In the studied samples, the following elements were detected in different amounts: Si (WS sample has most of all), P and S (SH sample has most of all), Cl (WS sample has the greatest content), and Fe (SW sample contains the greatest amount of this element).
The bulk densities of the WS, SW, and SH samples were 0.29 ± 0.03, 0.34 ± 0.02, and 0.19 ± 0.03 g·cm−3, respectively. The tablets were formed from loose biomass without binder additives. Pistons of 1.2 cm and 0.7 cm diameter were used to compress the biomass. The tablets’ densities were as follows: 1.02 ± 0.03 g·cm−3 for the tablets from WS sample, 1.15 ± 0.01 g·cm−3 for the tablets from SW sample, and 1.04 ± 0.02 g·cm−3 for the tablets from SH sample. The obtained tablets of about 0.7 mm in thickness were studied by TG-FT-IR.

2.2. A Pyrolytic Test in a TG/FT-IR Analyzer

The ground biomass in loose and densified forms was heated in a Q50 thermobalance under nitrogen atmosphere up to a temperature of 750 °C. The samples of 25 ± 0.05 mg in weight were heated with a heating rate of 4 °C·min−1. The obtained DTG curves were deconvoluted using OMNIC9 software. The deconvolution was conducted by Gaussian/Lorentzian functions, taking into account the constant base line according to the methodology presented in the work [51].
The rate of nitrogen flow through the thermobalance was 10 mL·min−1. The formed products of biomass decomposition were moved by a nitrogen stream of 90 mL·min−1 through a transporting line and interface to a Nicolet iS10 spectrometer in order to register the FT-IR spectra. The obtained spectra were elaborated by OMNIC9 software. The FT-IR spectra of volatile products were normalized with respect to the CO2 band.

2.3. A Test Conducted in a PyrolyticOven

Loose and densified biomass was additionally heated in quartz cuvettes that were placed in a pyrolytic oven PRC 70 × 708/110 M manufactured by Czylok company. The heating to the temperatures of 450 and 750 °C was conducted under the stream of nitrogen of high purity with the flow rate of 330 mL·min−1. The average heating rate was 4 °C·min−1. During the pyrolysis up to 450 °C, the volatile products were passed through a layer of methanol that was cooled by water with ice. The decomposition products condensed in methanol were regained by distillation of solvents under vacuum.

2.4. Microwave-Assisted Extraction

The biomass samples in loose and densified forms with a mass of 2.0 g were extracted by a mixture of 25 mL of methanol with 25 mL of chloroform in an Anton Paar Multiwave 3000 microwave extractor at the temperature of 150 °C under the pressure of 18 bar. After filtration, the solvents were distilled away from the extracts under vacuum.

2.5. Spectroscopic Investigations of Pyrolysis Products

Liquid and solid pyrolysis products were obtained in the pyrolytic oven during heating to the temperature of 450 °C and the extracts were investigated by the Attenuated Total Reflectance (ATR) techniques. The ATR investigations of these samples were performed using a Smart MIRacle module placed in the Nicolet iS10 spectrophotometer. The samples were placed on a ZnSe monocrystal and pressed with a stamp with great force. The ATR spectra in the range of 4000–600 cm−1 were registered by 32 scans. The spectra were elaborated by an automatic correction of the base line (OMNIC9 software) taking into account local optical minima near 2400, 2000, and 900 cm−1. The obtained spectra of chars, condensates, and extracts were normalized with respect to the C=C band near the wavenumber of 1600 cm−1.

2.6. XRD and SEM Investigations

After the addition of 10% of the internal standard (NaF) to the samples of chars pyrolyzed to the temperatures of 450 and 750 °C, they were studied using the technique of X-ray quantitative phase analysis. The diffractograms were obtained with a variable step using Cuk radiation; the X-ray tube voltage was 40 kV, whereas the current—20 mA, the pulse counting time was 20 s. The obtained diffractograms were normalized with regard to the reflex (002) from NaF. The Cord parameter, which characterizes the number of carbon atoms that participate in origination of the reflex of coherent scattering in the range of 2θ angles from 14 to 31 degrees, was determined according to the formula presented in work [51].
The chars obtained at the temperature of 750 °C were studied by a scanning electron microscope Quanta 3D FEG manufactured by FEI Company. An Everhart-Thornley Detector (ETD) was used during the SEM tests. The samples of densified biomass were investigated on the surface and inside of the tablets. The EDX analysis was made for the samples of chars.

3. Results and Discussion

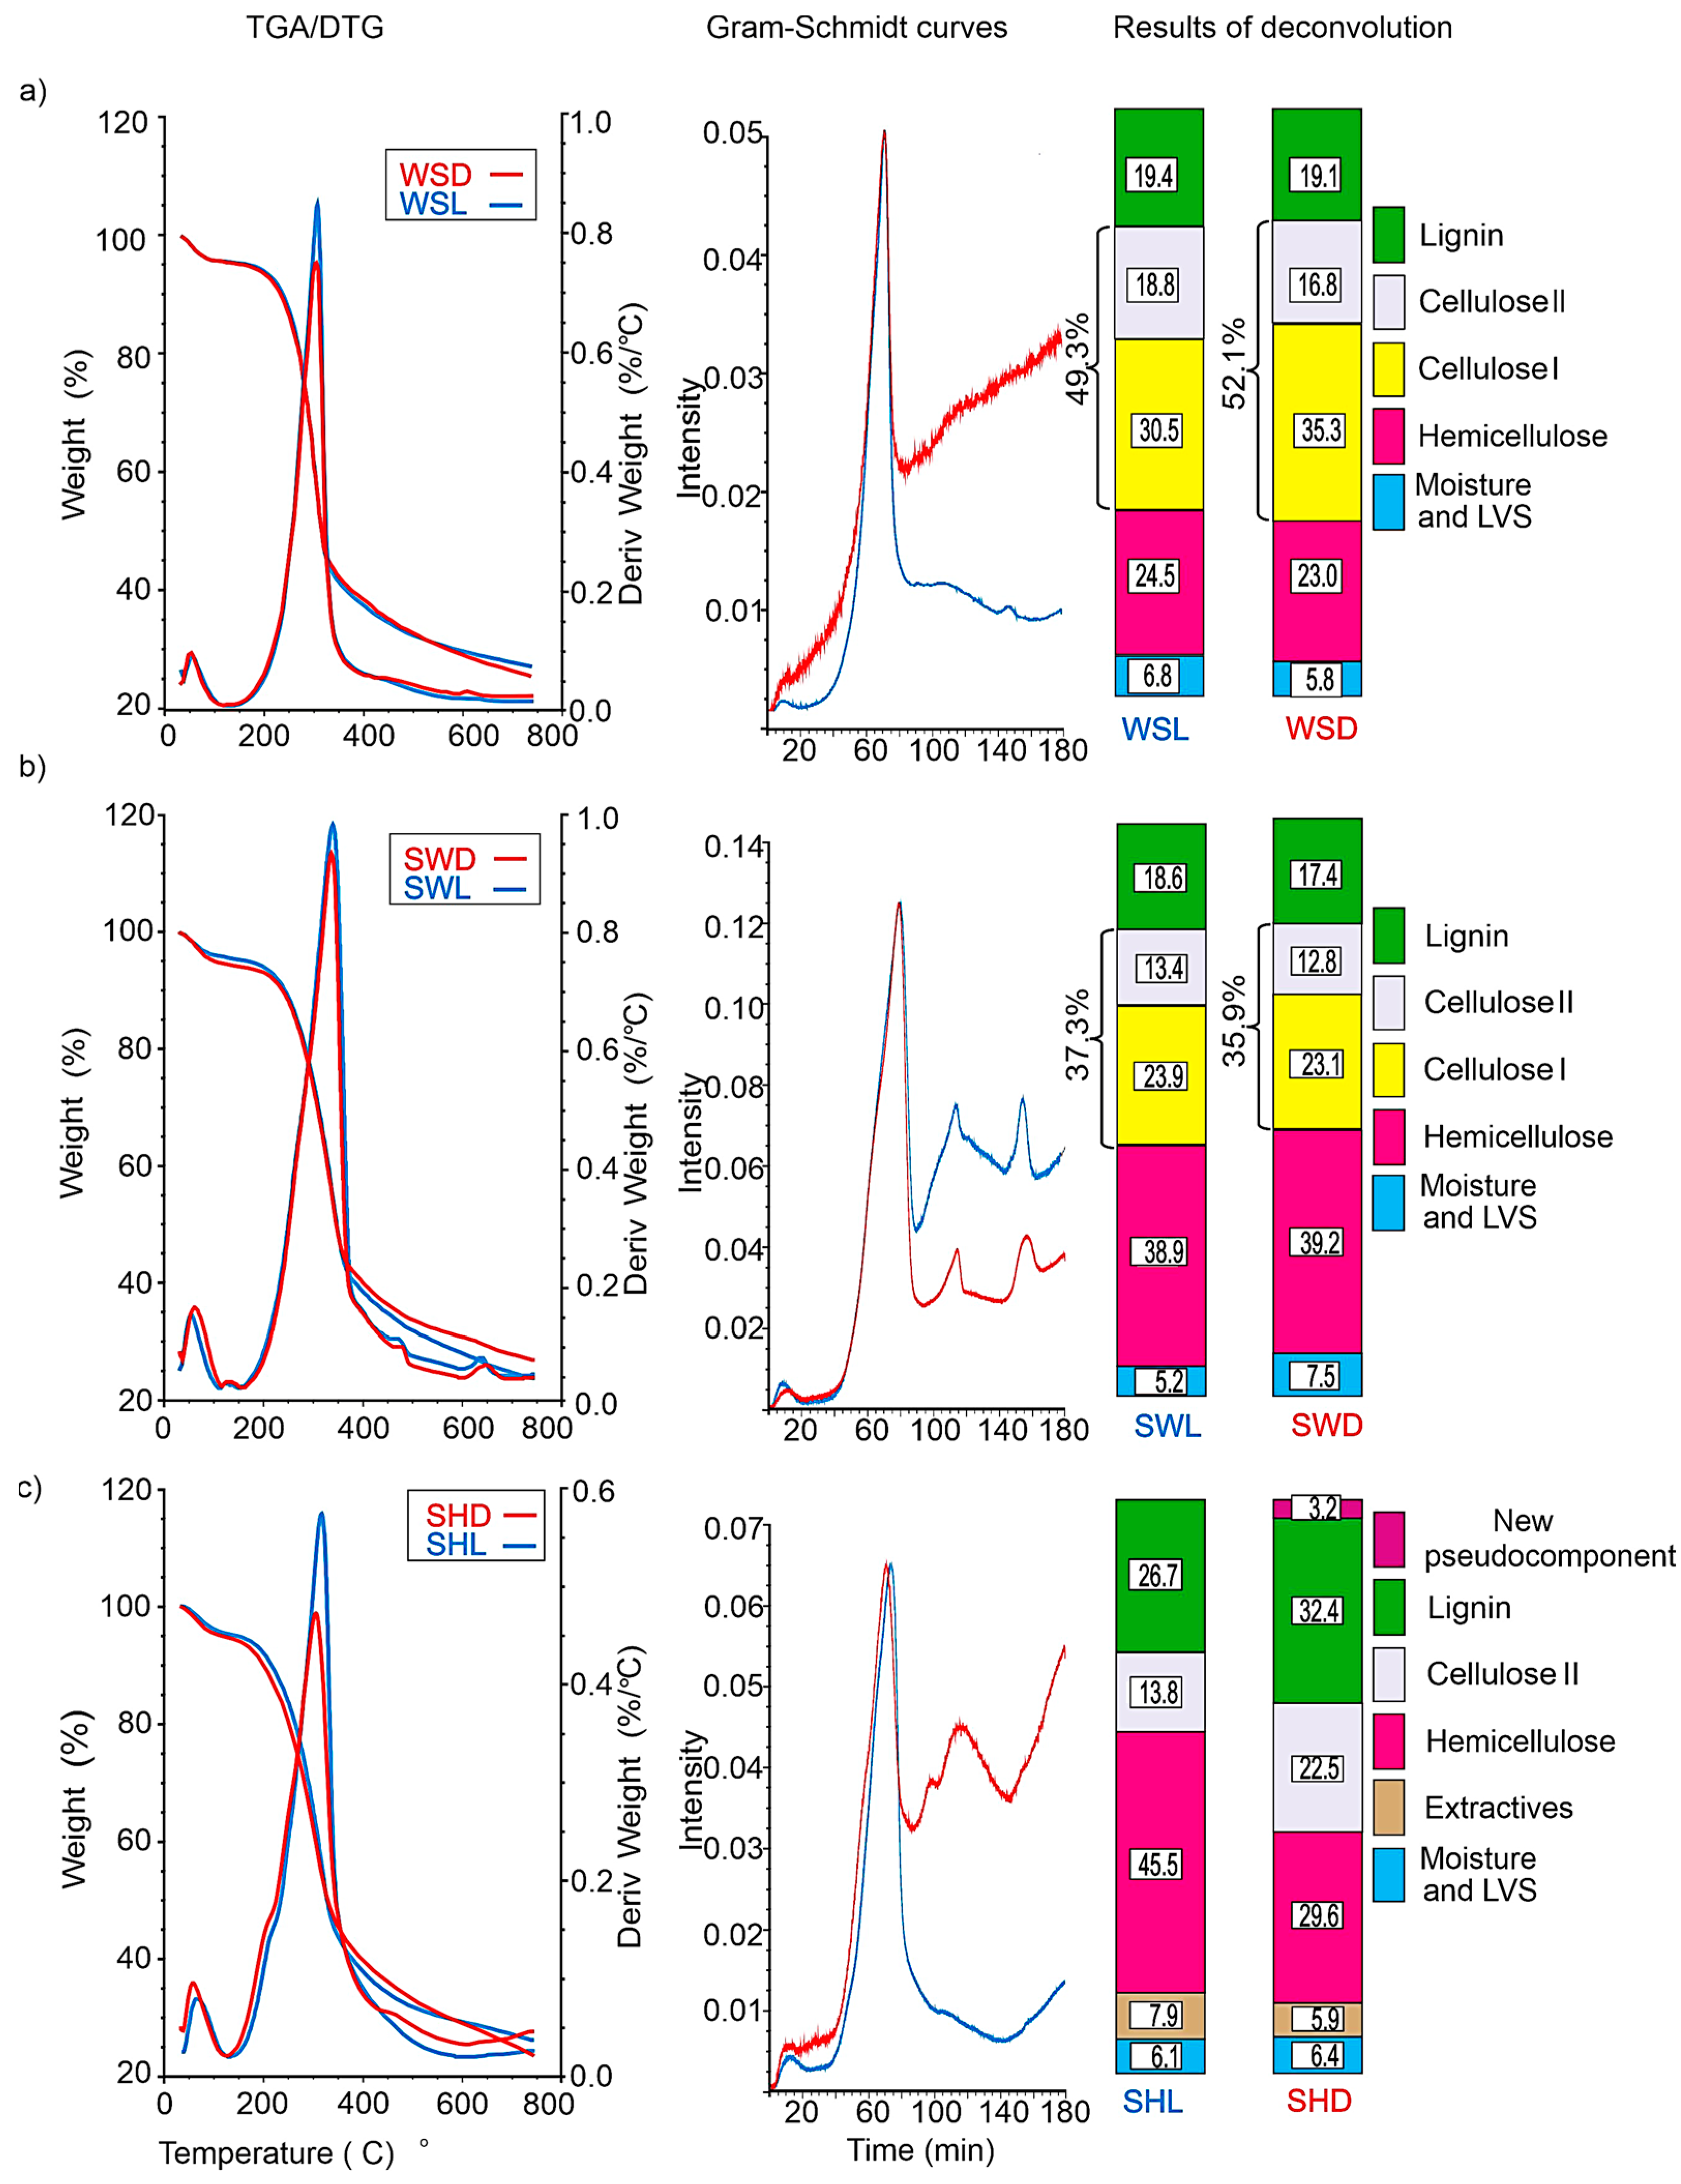
3.1. An Analysis of the TG and DTG Curves of Loose and Densified Samples

Figure 1 presents the curves of mass loss and mass loss rate of the studied WS, SW, and SH samples pyrolyzed in loose (WSL, SWL, SHL, respectively) and densified forms (WSD, SWD, SHD, respectively). Taking into account only the shape of the TG and DTG curves in this figure, it could be suggested that densification does not substantially change their shape. The densification of WS and SH samples lowers the peak value of the mass loss rate and changes the yield of char at the temperature of 750 °C. During the pyrolysis of SWD sample, the mass loss rate does not change but the amount of char shows a tendency to increase. More differences in thermal behavior of loose and densified samples can be observed in the Gram–Schmidt plots (Figure 1a).
The DTG curve characterizes the changes in mass loss rate depending on the temperature of pyrolysis. These changes were caused by the decomposition of pyrolyzed biomass components and show their thermal stability at different temperatures. On the basis of published data on thermal behavior of basic biomass components [52,53], we can estimate in which temperature ranges their decomposition in the studied samples took place.
Taking into account the aforementioned temperature ranges, it is possible to calculate the contribution of distinct biomass components in formation of the DTG curve using the deconvolution method. Hence, it is possible to evaluate the changes in their thermal stability that was caused by densification. The deconvolution carried out for DTG curves shows that the general contribution of decomposition of cellulose pseudocomponents in formation of the DTG curve during pyrolysis of WSD samples tends to increase. This contribution increases from the value of 49.3% for WSL samples to the value of 52.1% in WSD samples. This is connected with a lower thermal stability of the pseudocomponent of cellulose I—the contribution of cellulose I in formation of the DTG curve increases by nearly 5%. Gong et al. [54] also pointed out that granulation can disrupt the structure of biomass cell walls, and Cao et al. [55] suggested that there is a possibility of decomposition of crystalline cellulose in pellets into amorphous carbon.
The shape of the Gram–Schmidt plots in Figure 1b suggests that starting from 80 min there are some deviations in the course of pyrolysis of SWD sample compared to SWL sample. The results of deconvolution of the DTG curves suggest that the densification of SW samples does not facilitate the decomposition of hemicellulose and cellulose pseudocomponents but only tends to increase the contribution of the pseudocomponents of moisture and light volatile components (LVS) in formation of the DTG curve. Hence, it should be presumed that the densification of SW samples does not affect the results of deconvolution of the DTG curve—the contribution of basic pseudocomponents does not substantially change. The lack of interaction between softwood components during pyrolysis was reported by Kawamoto et al. [56].
The Gram–Schmidt curves of SHL and SHD sample presented in Figure 1c differ from each other in shape in the whole time range of pyrolysis. The deconvolution results of the DTG curve presented in Figure 1c clearly show substantial changes in thermal stability of particular pseudocomponents that were caused by the densification of SH samples. Densification does not practically affect the thermal stability of the pseudocomponents of moisture, LVS, and extractives but it reduces the capacity of thermal decomposition of hemicellulose—the contribution of hemicellulose in formation of the DTG curve decreases from 45.5 to 29.6%. Moreover, under the influence of densification, the thermal stability of the pseudocomponents of cellulose II and lignin diminishes. This can be caused by mutual interaction between cellulose and lignin [57,58,59] that was intensified by densification. The deconvolution results of the DTG curve suggest that a new pseudocomponent decomposes during pyrolysis of SHD sample in the temperature range of 450–500 °C. Such a pseudocomponent could have been formed as a result of interaction between the components of hemicellulose material or the course of secondary reactions between volatile products of decomposition of hemicellulose, cellulose, and lignin. Possible courses of such secondary reactions were reported in a number of works [31,39,60].
Therefore, depending on biomass type, the densification influences the interaction between biomass components and changes the thermal stability of hemicellulose, cellulose, and lignin in different ways.

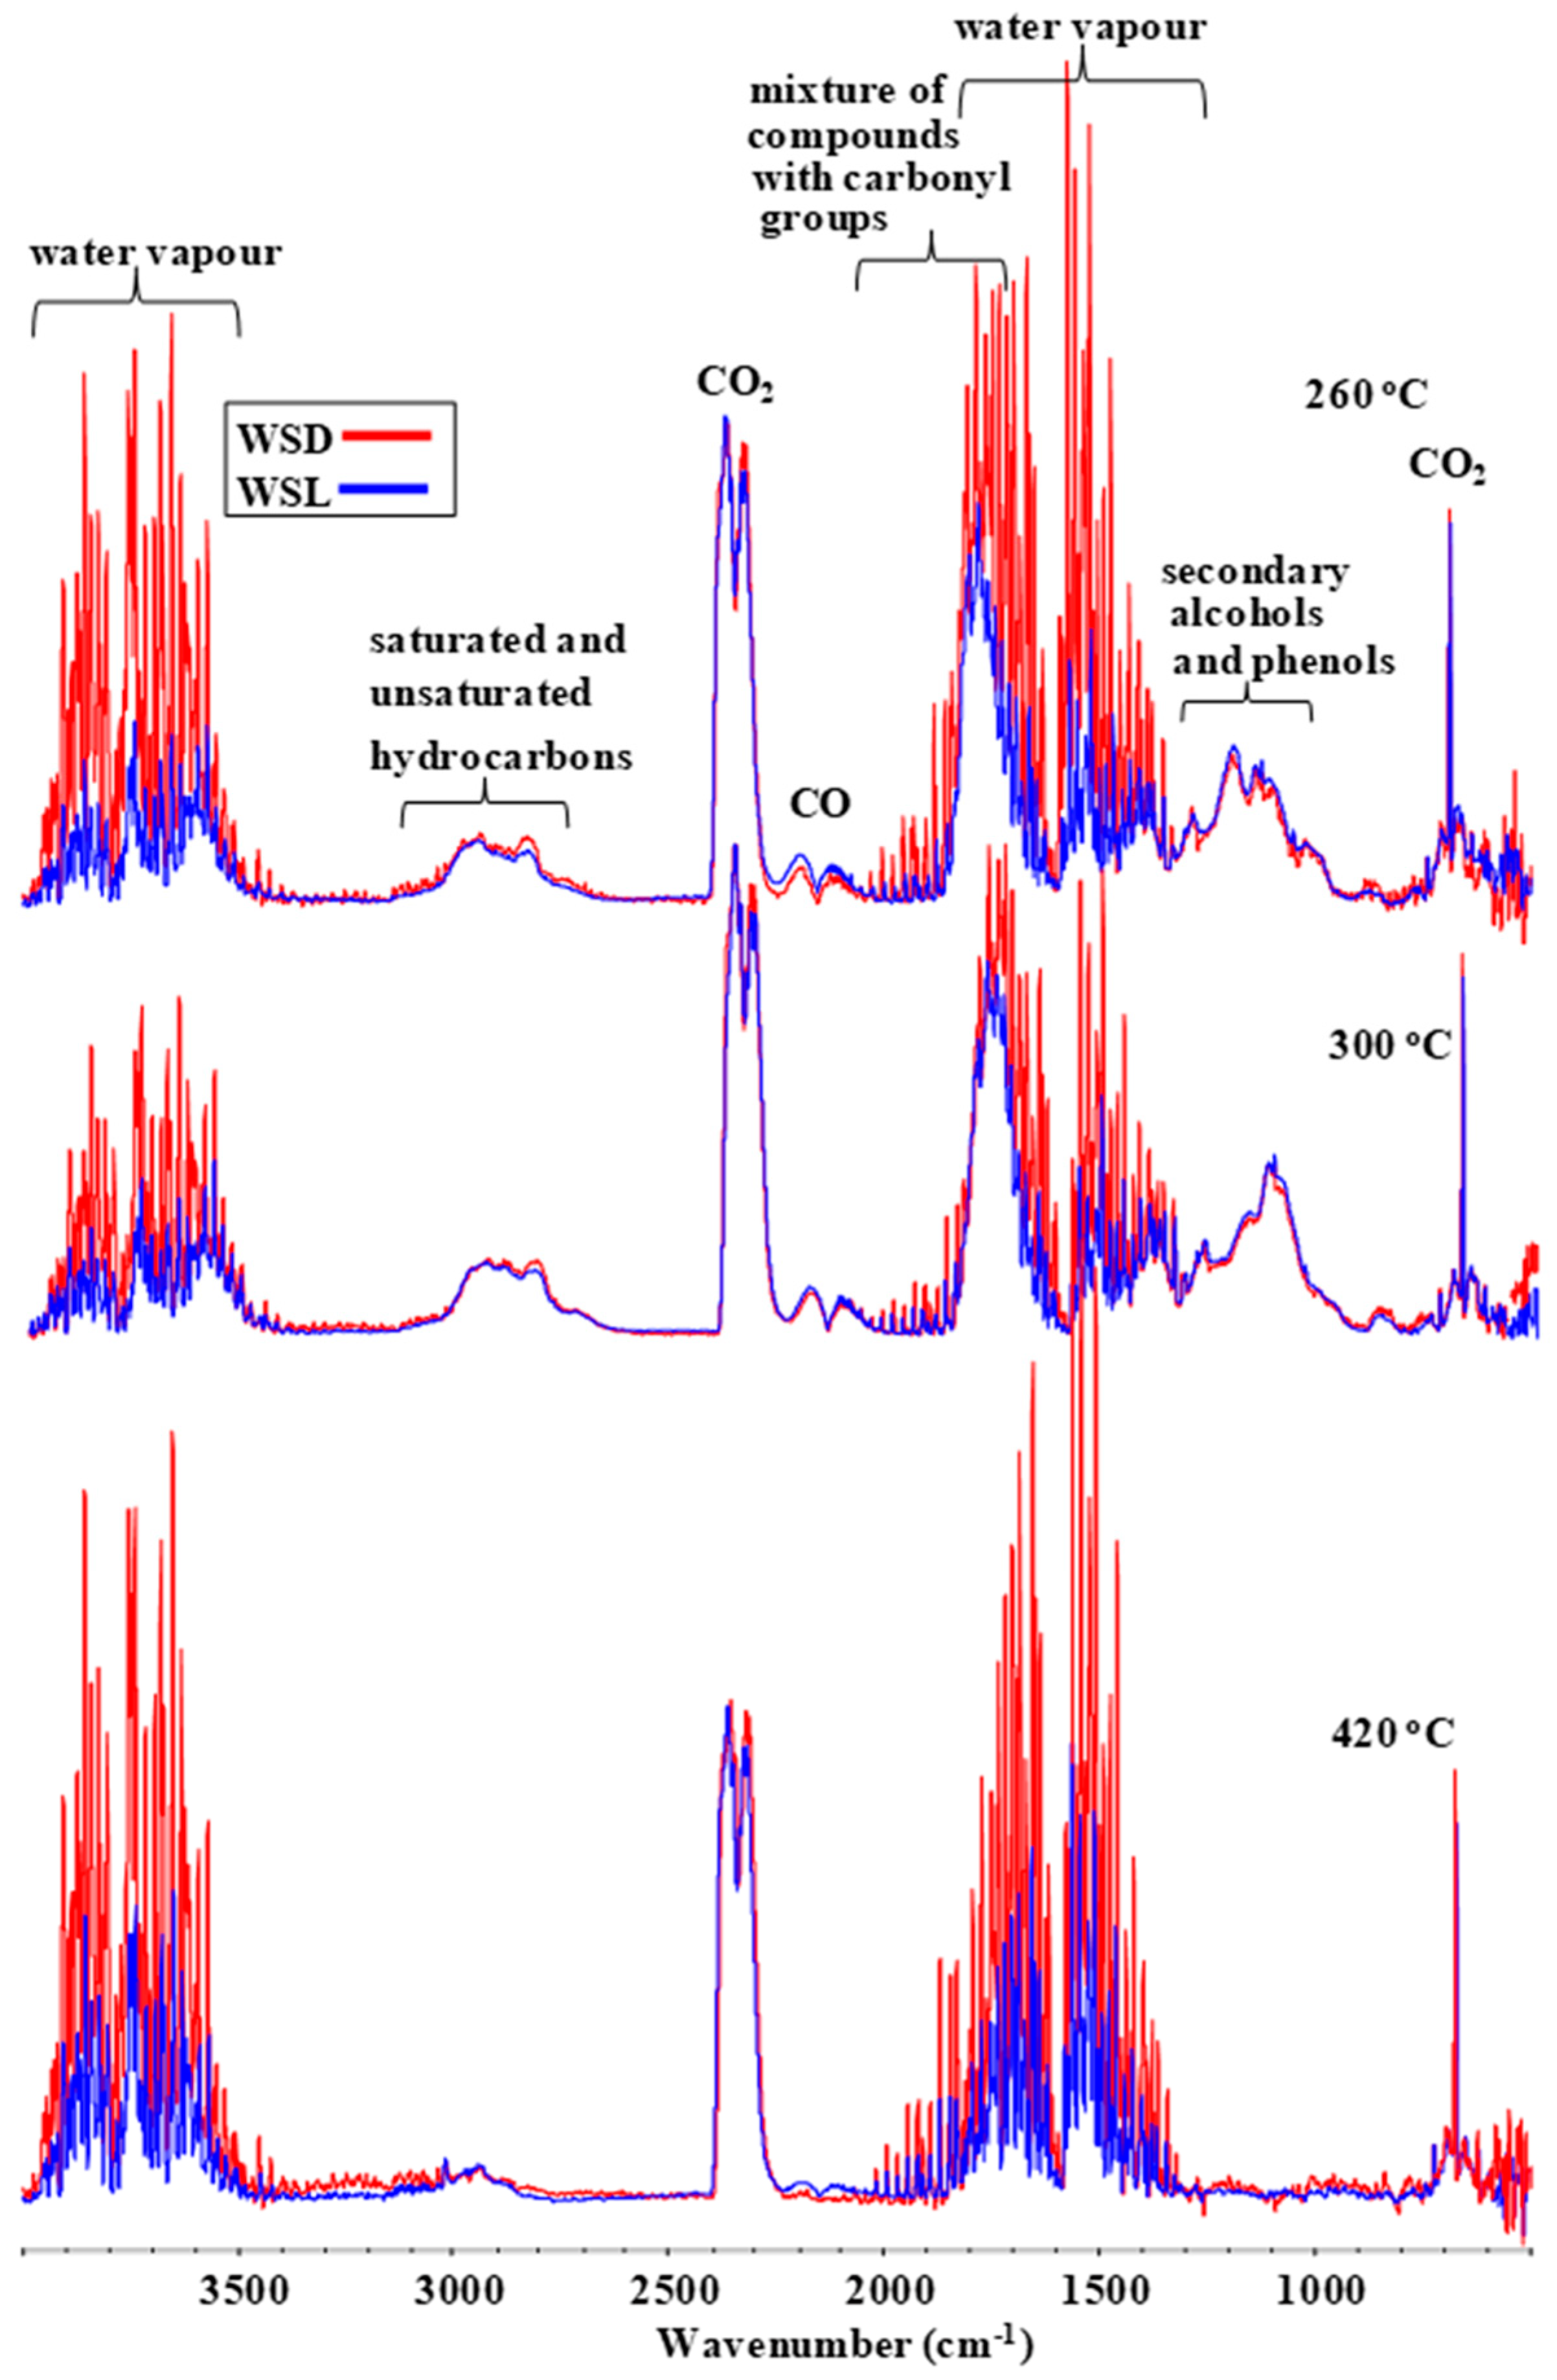
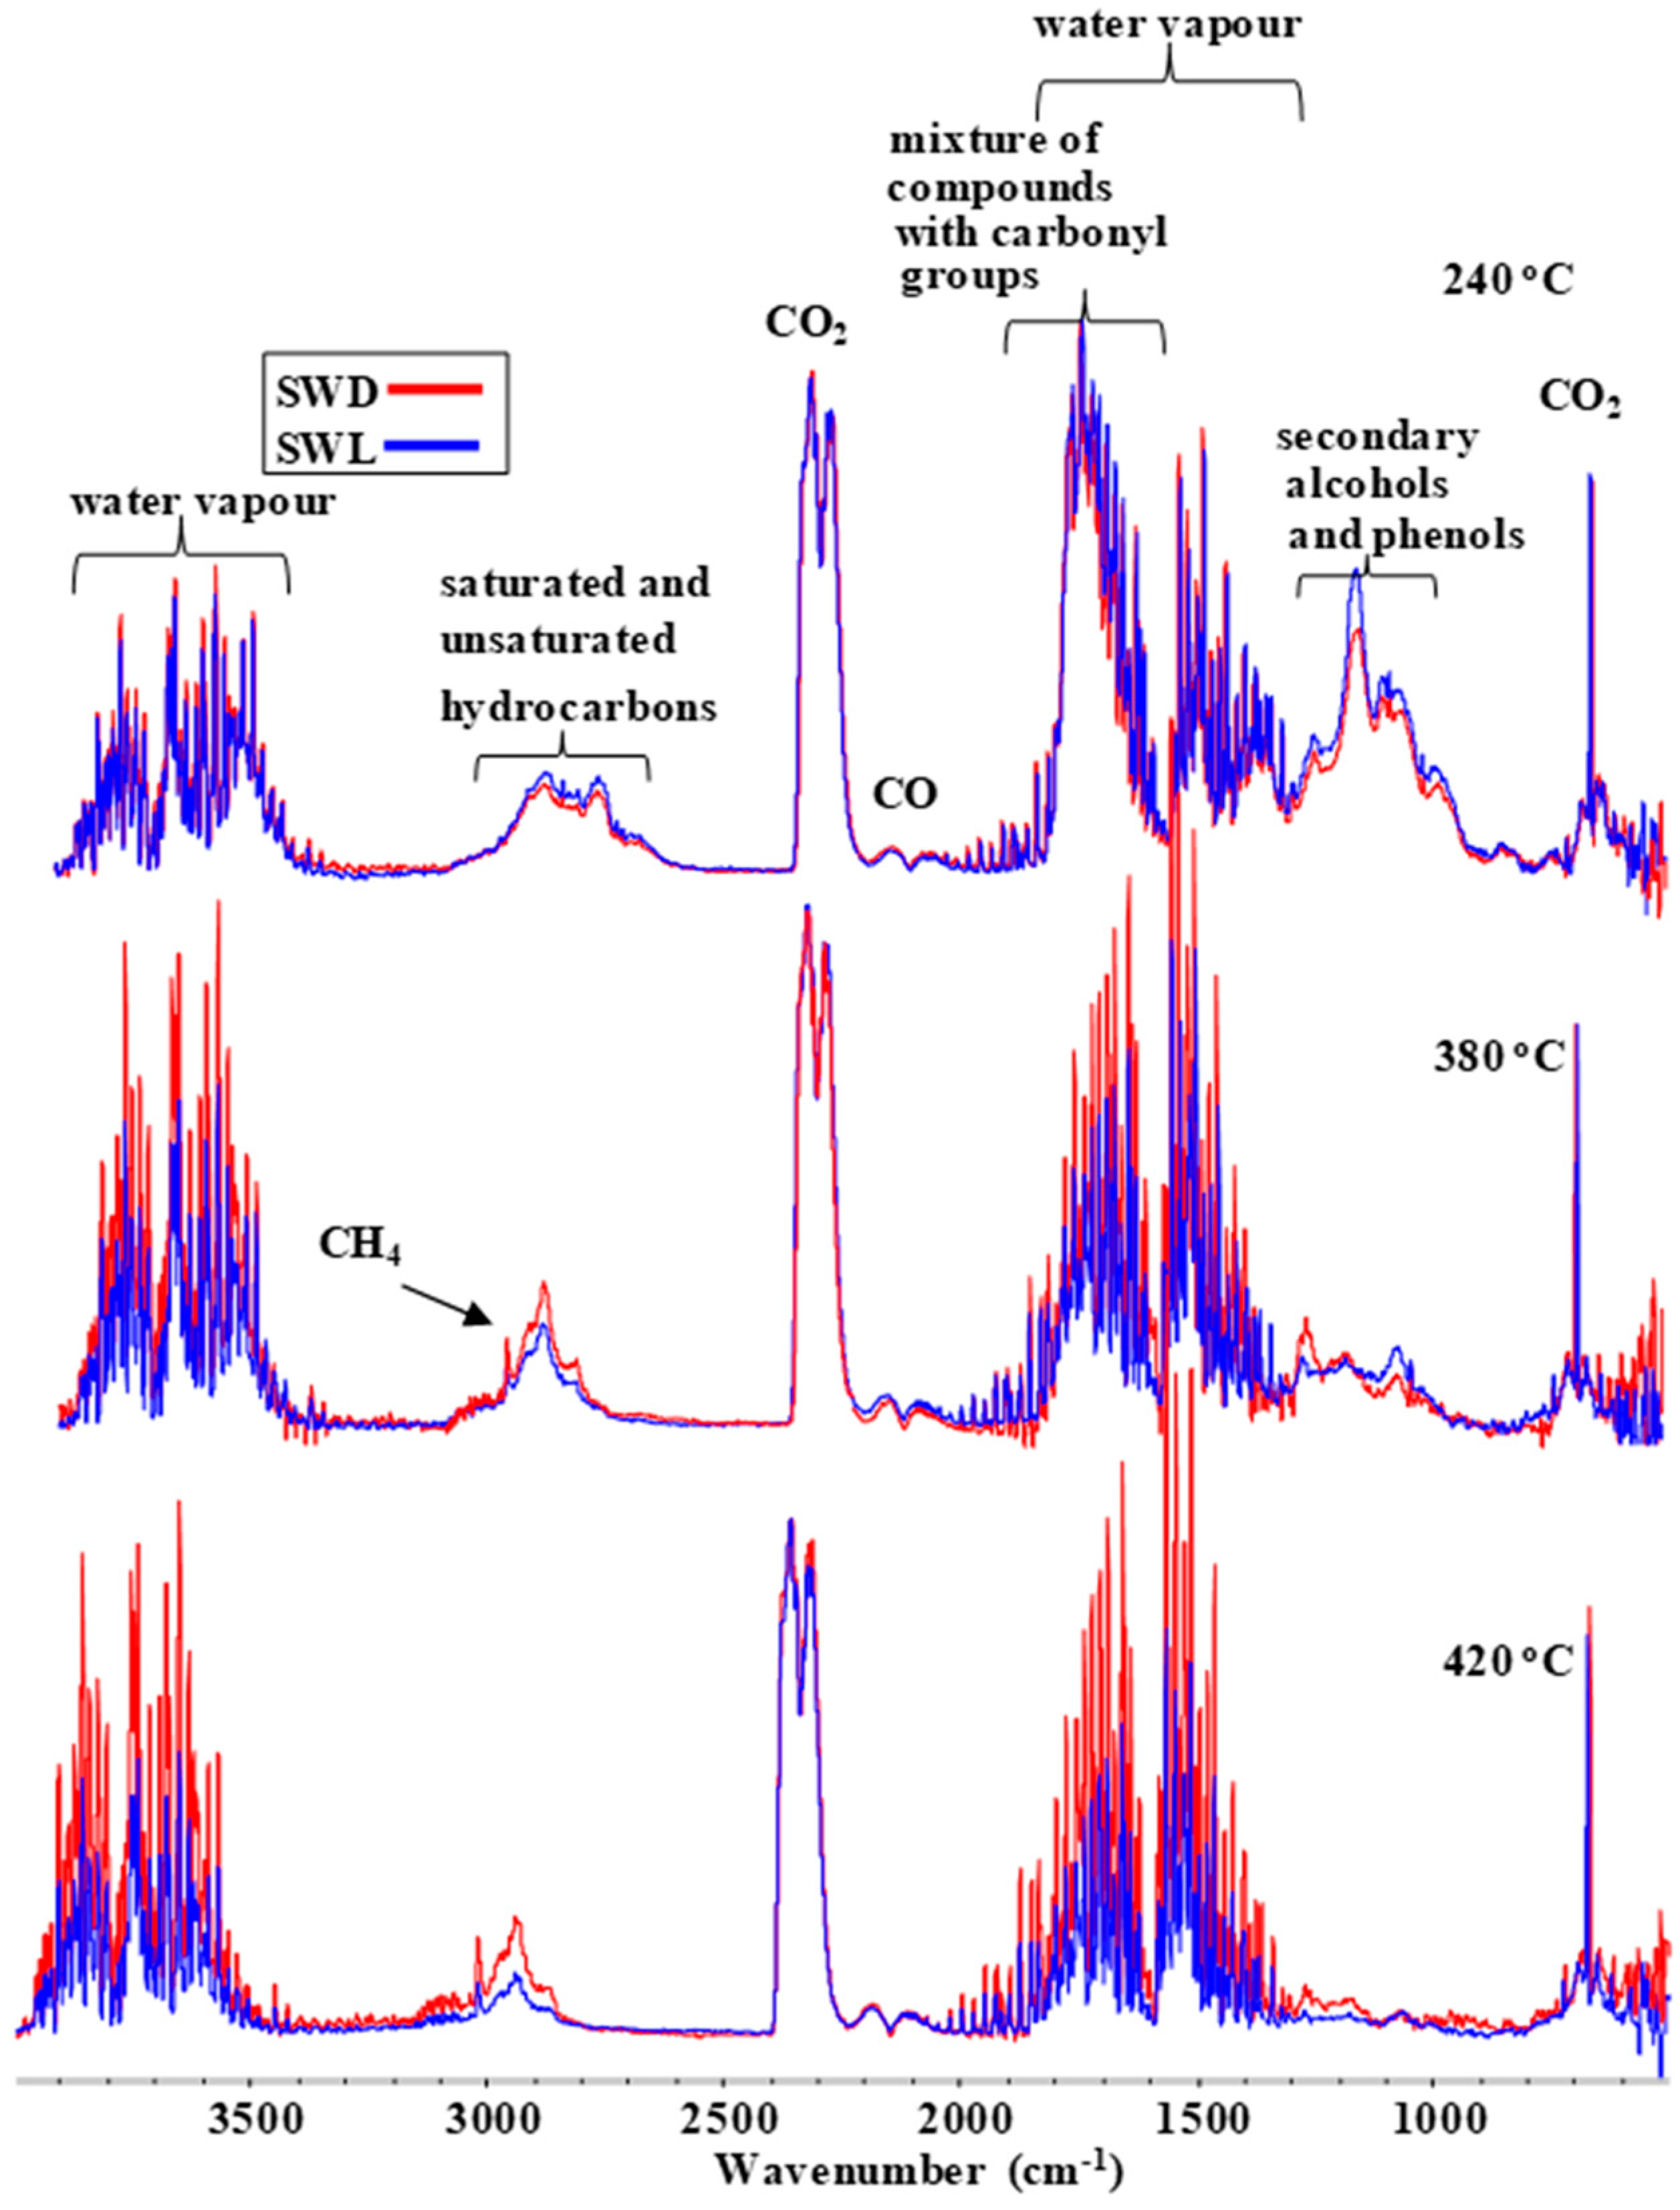
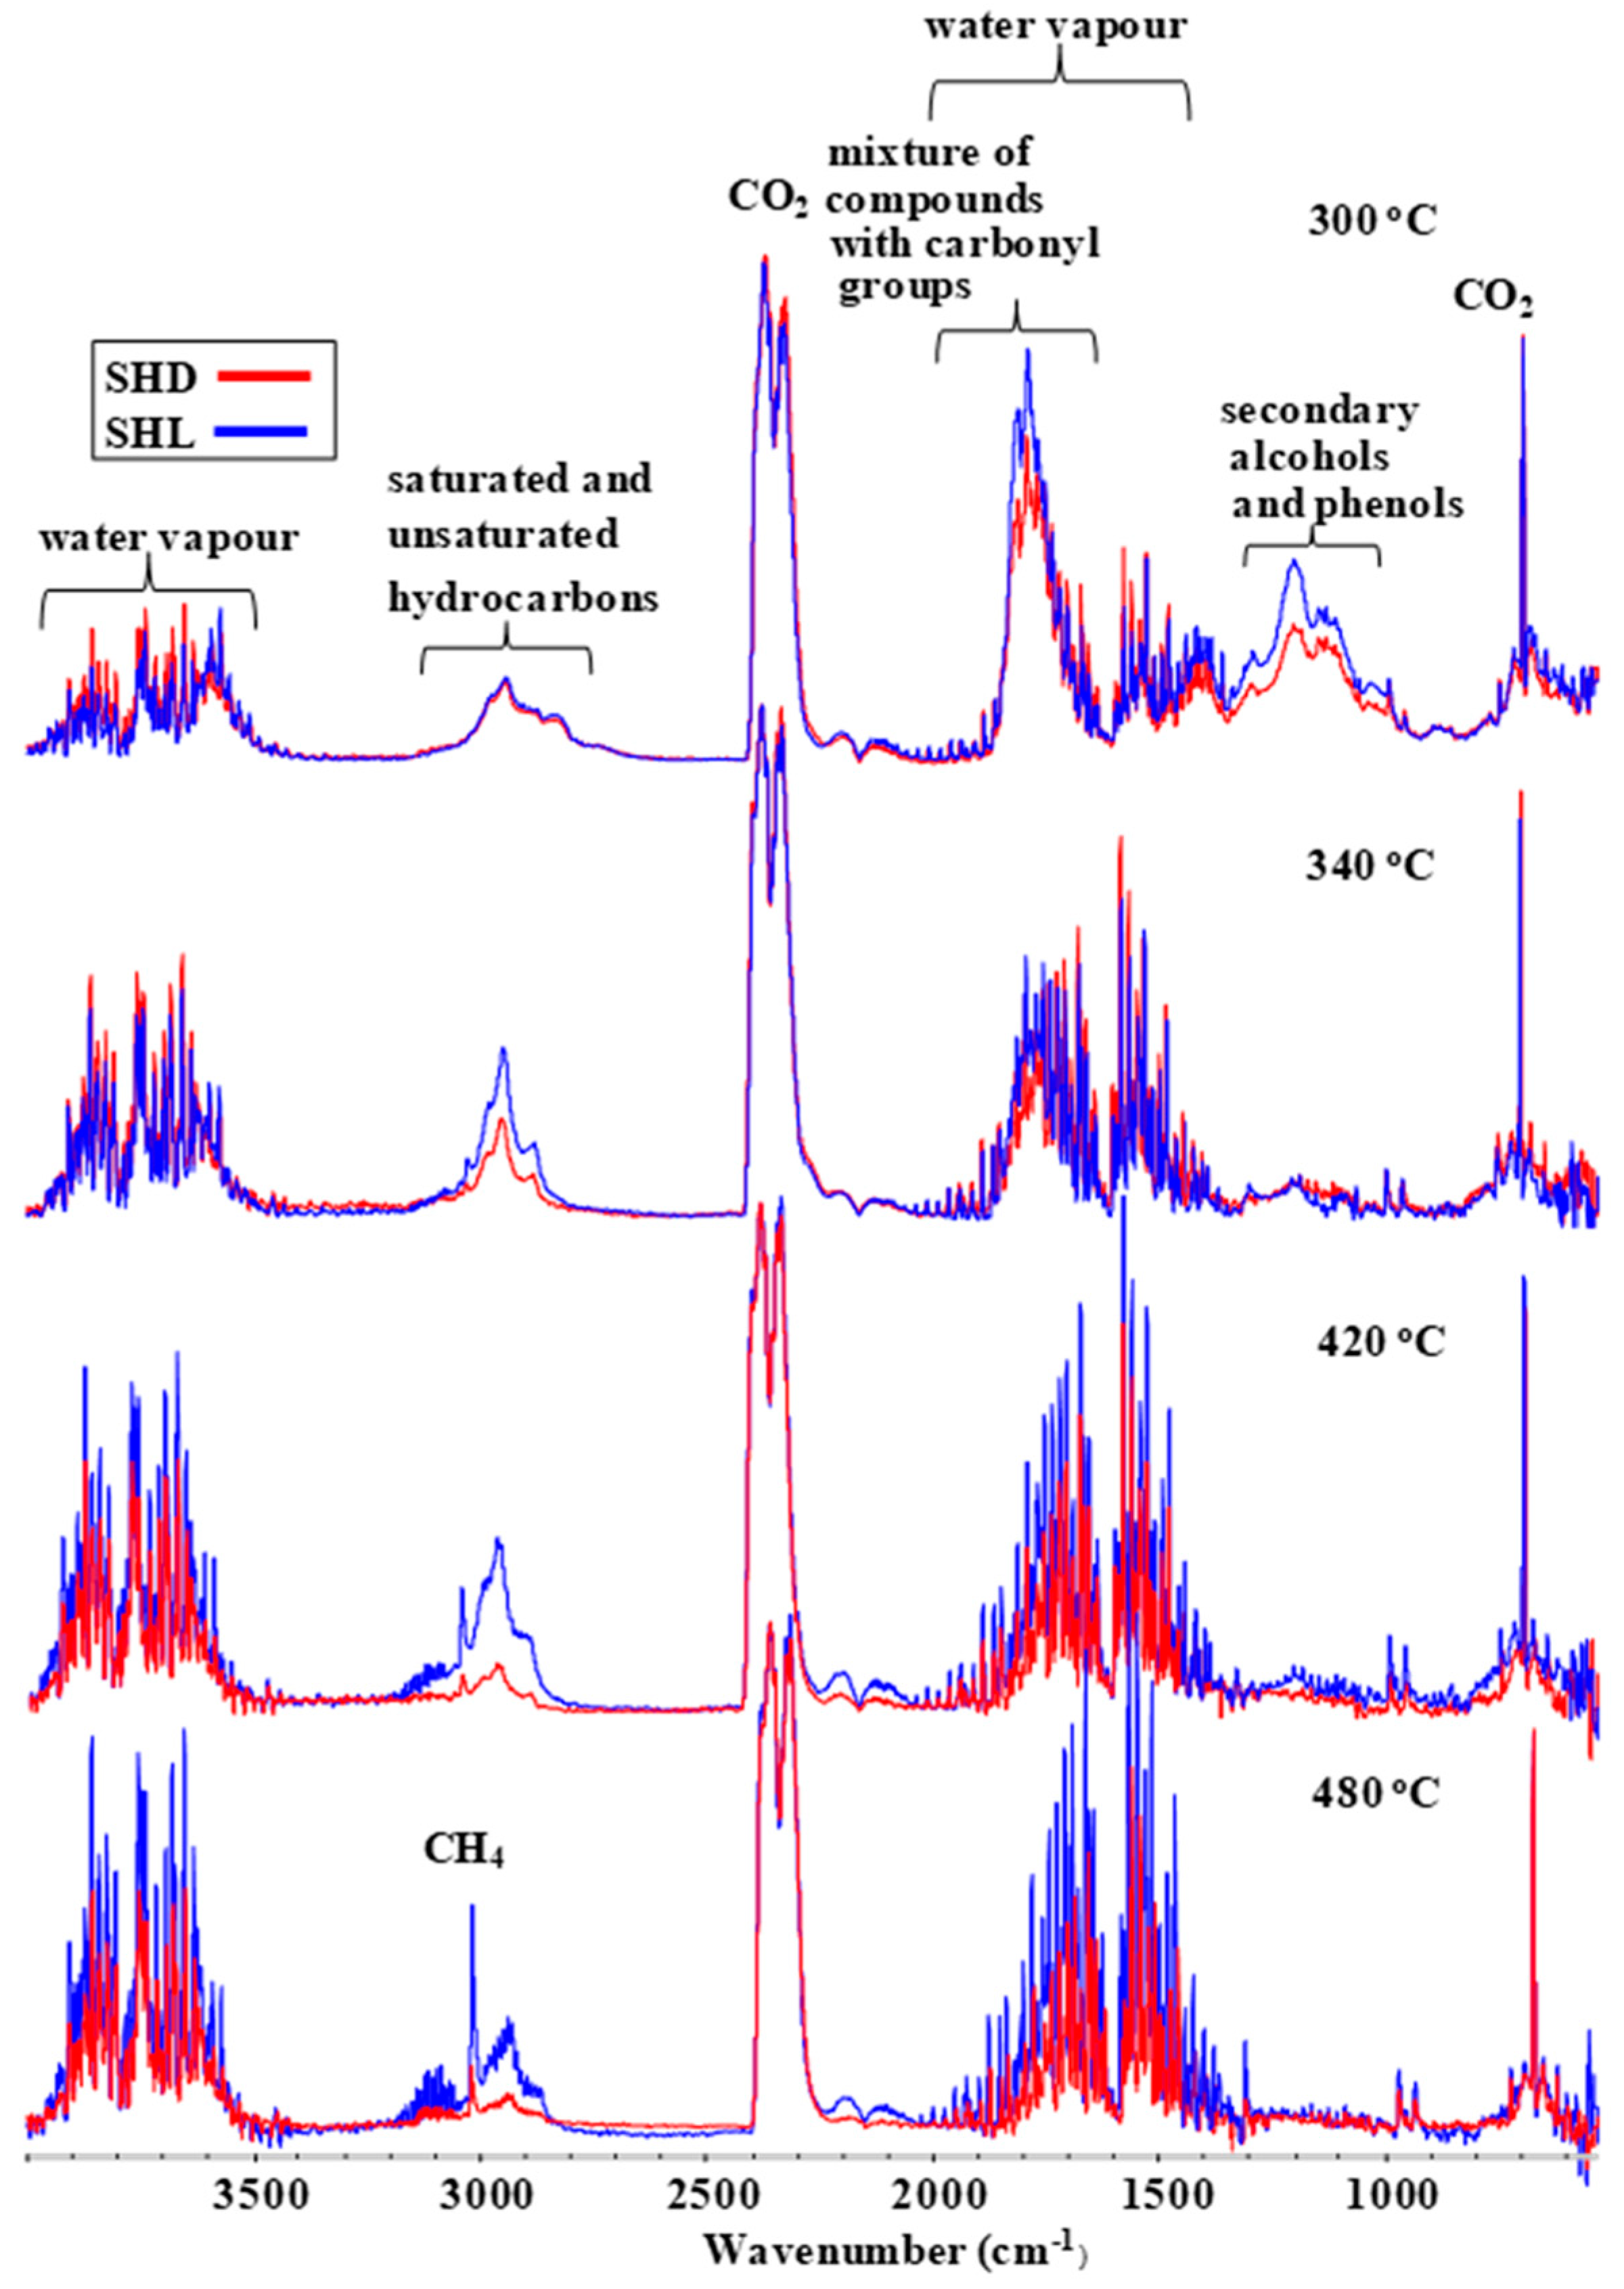
3.2. The Influence of Densification on the Composition of Volatile Products of Pyrolysis

Figure 2 presents the FT-IR spectra of volatile products of pyrolysis of WSL and WSD samples at the temperatures of 260, 300, and 420 °C. It follows from comparison of the FT-IR spectra of volatile products of WSL and WSD samples that the densification of wheat straw does not substantially change the contribution ratio of saturated and unsaturated hydrocarbons, alcohols, and phenols in the composition of volatile products of pyrolysis but it increases the contribution of compounds containing carbonyl groups at the temperatures of 260 and 420 °C.
The ratios of the surface area of these bands (range 1850–1700 cm−1) normalized in relation to the CO2 band from the densified samples were calculated with respect to appropriate bands from loose samples. The calculations prove that at the temperatures of 260, 300, and 420 °C these ratios are 1.7, 1.3, and 2.2 respectively. On the basis of research conducted by other authors [3,61,62,63], it can be suggested that during pyrolysis of the samples of densified wheat straw more compounds with carbonyl groups are released with volatiles, e.g., more aldehydes, ketones, acids, sugars, and aromatics.
Figure 3 presents the FT-IR spectra of volatile products emitted from SWL and SWD samples at the pyrolysis temperatures of 240, 380, and 420 °C.
The analysis of the shape of the normalized spectra and the calculations of the surface areas of bands imply that the densified sample tends to a lower emission of hydrocarbons, alcohols, and phenols only at T = 240 °C. Starting from the temperature of 380 °C, during pyrolysis process SWD sample emit 1.5 times more saturated and unsaturated hydrocarbons, 1.7 times more compounds with carbonyl groups, and 1.3 times more alcohols and phenols than SWL sample. This implies that the densification of SWD sample substantially influenced the interaction between volatiles and char.
SHD sample behave in a different way during pyrolysis (Figure 4). A contrastive analysis of the spectra of volatile products of SHL and SHD samples at the temperatures of 300, 340, 420, and 480 °C shows that much lower contribution ratios of hydrocarbons along with compounds containing carbonyl groups, alcohols, phenols, and moisture are emitted with volatiles during the entire pyrolysis process from the densified sample. At the temperature of 300 °C, SHL sample emit 1.3 times more compounds with carbonyl groups (ketones, aldehydes, acids, and ethers [3,61,62,63,64]) and 1.6 times more alcohols and phenols than SHD sample; at the temperature of 340 °C they emit 2 times more saturated and unsaturated hydrocarbons, 1.2 times more compounds with carbonyl groups, and 1.9 times more alcohols and phenols; at the temperature of 420 °C they emit 4.9 times more saturated and unsaturated hydrocarbons, 1.9 times more compounds with carbonyl groups; at the temperature of 480 °C they emit 3.5 times more saturated and unsaturated hydrocarbons, 1.7 times more compounds with carbonyl groups, and 2.7 times more alcohols and phenols [3,61,62,63,64]. These results suggest that the densification of SHD sample affected the volatile-char interactions to a greater extent.
The initial WS and SH samples have the same content of K element and similar contents of Ca element (Table 2). Taking into account the catalytic properties of these elements described in works [39,44,57], such changes in the course of the pyrolysis process in WS and SH samples was expected as well as their influence on changes in the composition of volatiles. However, the data presented in Figure 2, Figure 3 and Figure 4 imply that the changes in composition of volatile products of pyrolysis after the densification of WS and SH samples take place in different ways. In WSD and SHD samples, the interaction between volatiles and their chars takes place in a different way.

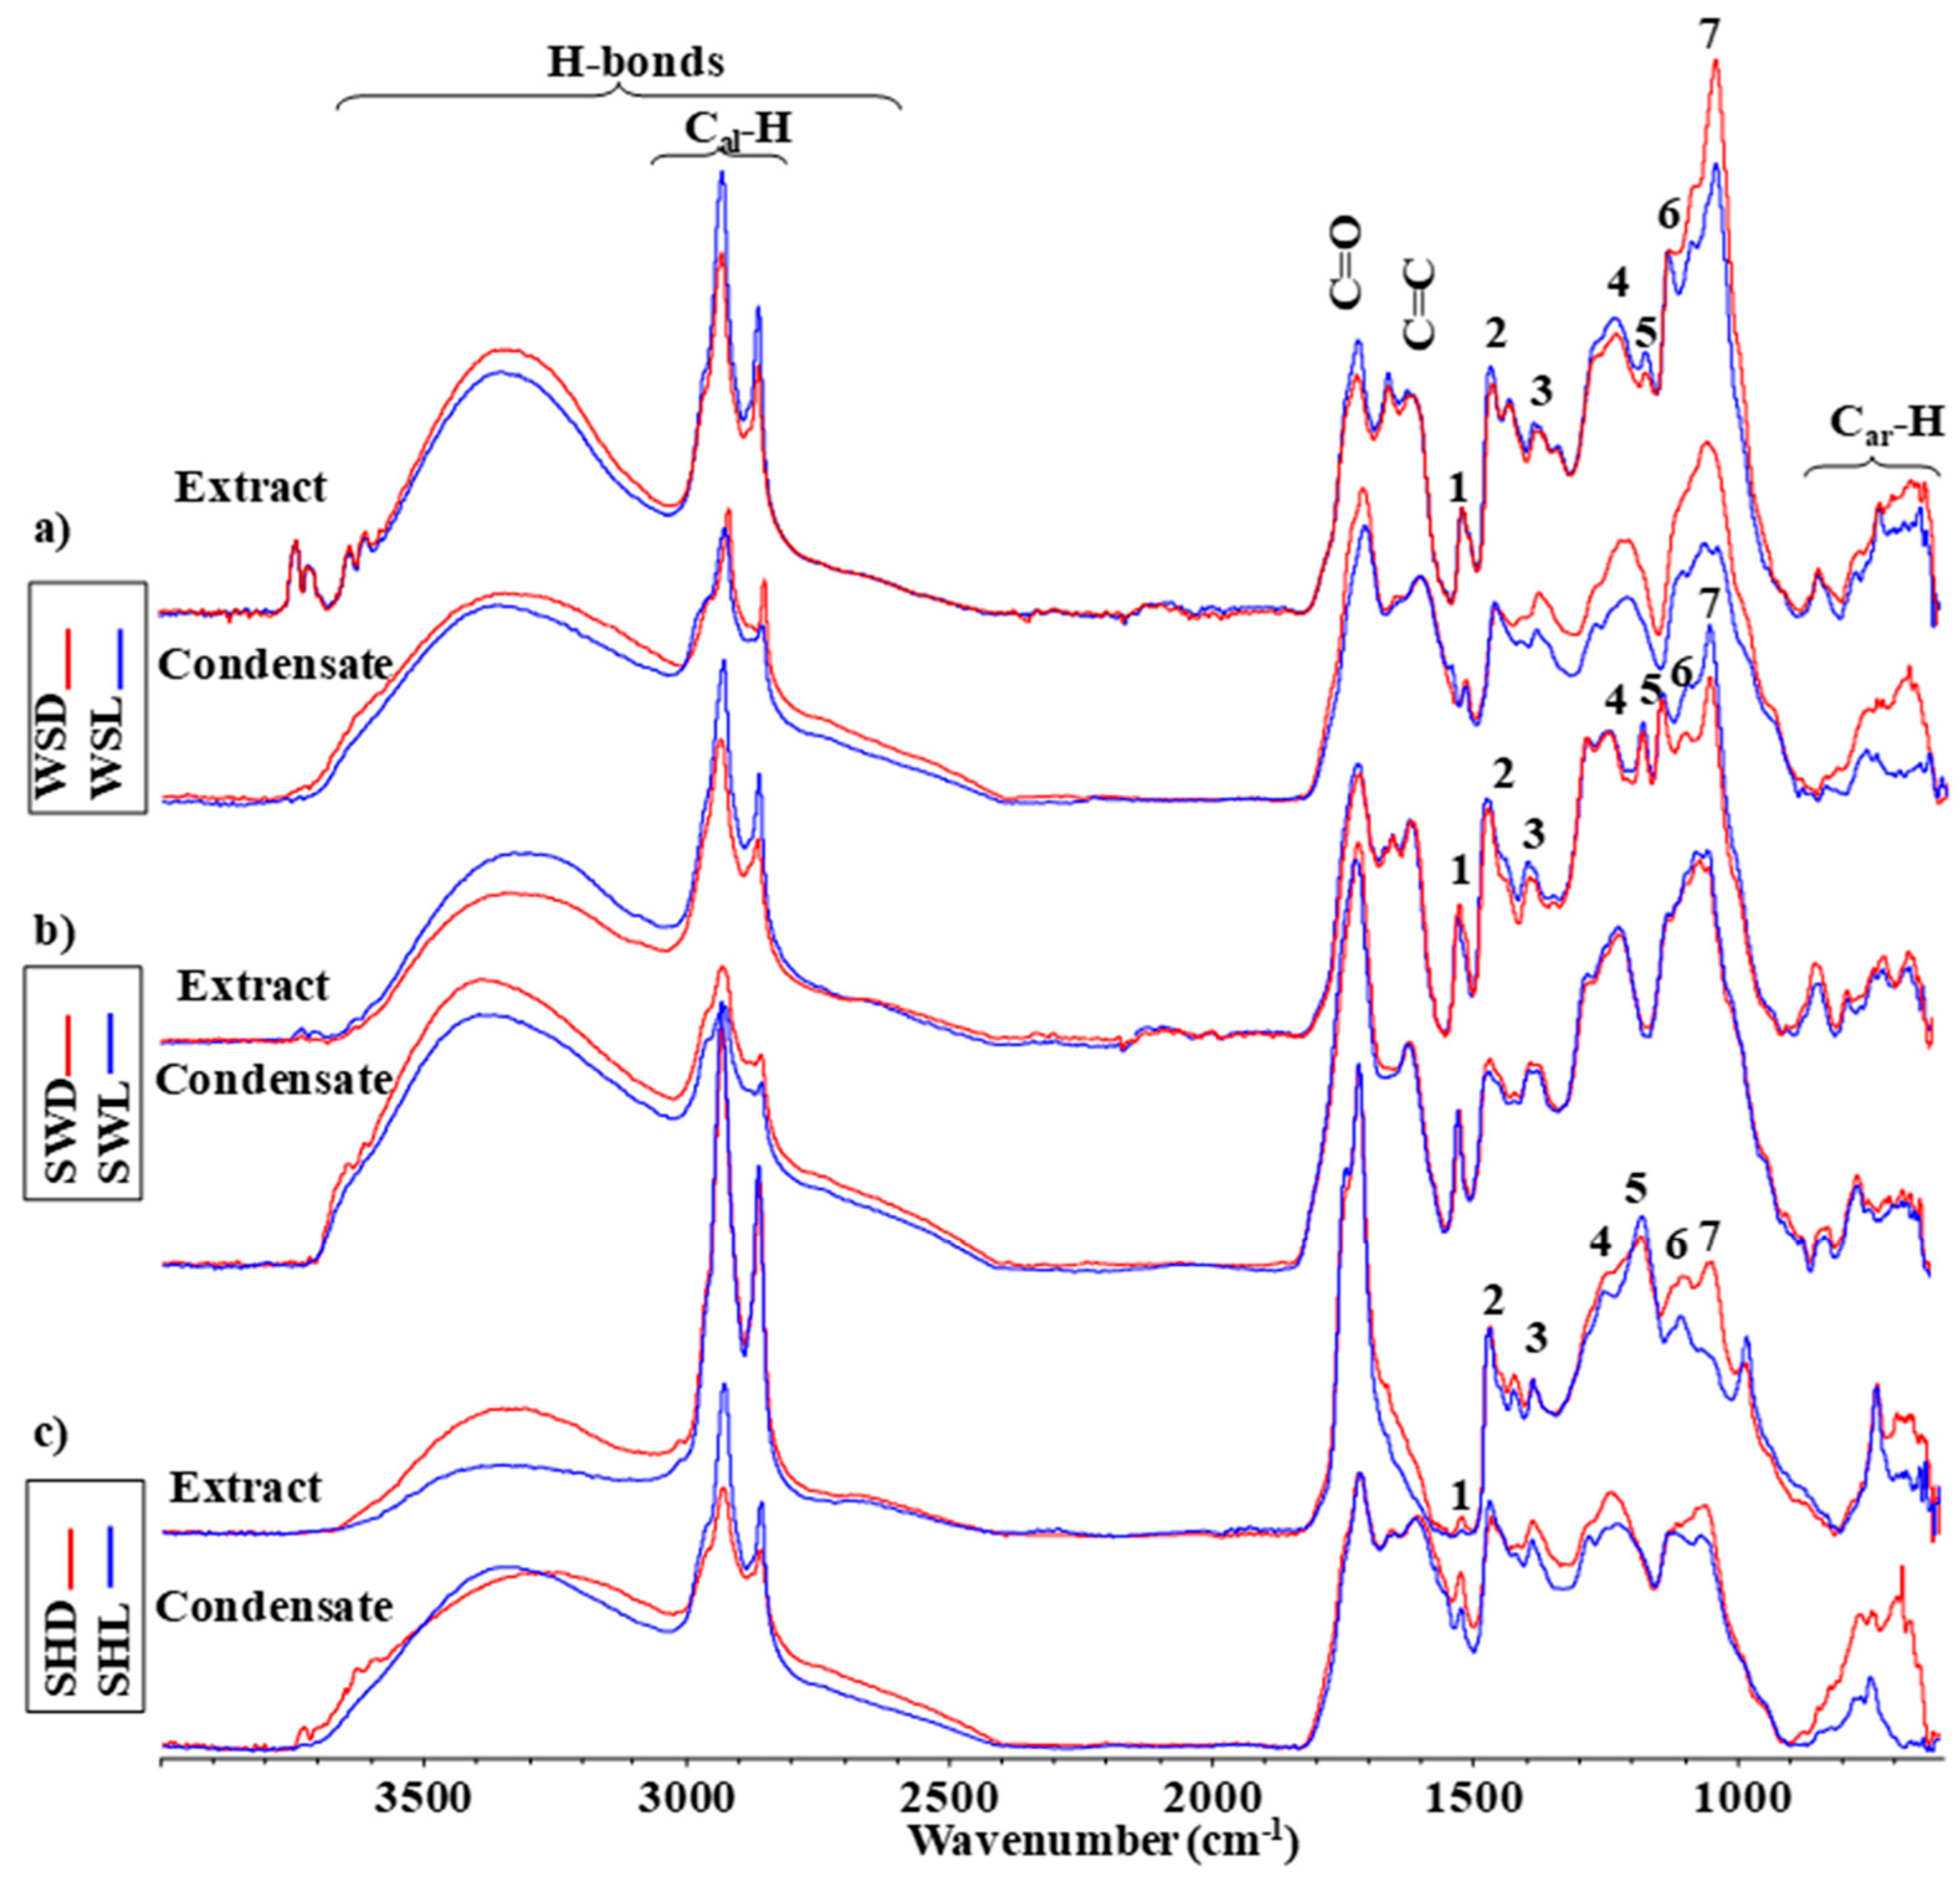
3.3. The Influence of Densification on Structural-Chemical Parameters of Liquid Products of Pyrolysis

Figure 5 sets out the ATR spectra of the material extracted from the studied samples and of condensates obtained during the process of pyrolysis to the temperature of 450 °C. In the ATR spectra of extracts and condensates, there are some spectra that correspond to the same functional groups and groups of atoms. This implies that, when performing extraction of the samples of studied biomass, some precursors, which cause the occurrence of saturated and unsaturated hydrocarbons, aldehydes, ketones, alcohols, and phenols in volatile products [65], can be partly removed from samples before pyrolysis.
It follows from the comparison of the normalized spectra in Figure 5 that the densification increases the contribution of polar compounds that are able to form hydrogen bonds in the extracts from WS (Figure 5a) and SH (Figure 5c) samples and condensates from WS (Figure 5a) and SW (Figure 5b) samples but it decreases the contribution of polar compounds in the extract from SW samples (Figure 5b). The densification increases the contribution ratio of compounds that cause the appearance of band near 1030 cm−1 in the extracts and condensates from WS (Figure 5a) and SH (Figure 5c) samples but decreases it in the extract from SW samples (Figure 5b). This band corresponds to C-O stretching in fragments of cellulose [51,63,64]. The densification does not exert influence on the contribution ratio of groups in fingerprint range (1500–1100 cm−1) in the extracts from WS (Figure 5a) and SW (Figure 5b) samples and in the condensate from SW (Figure 5b) samples. This indicates an increase in the relative contribution of cellulose and lignin decomposition fragments in the discussed samples. This is confirmed by the deconvolution results of the DTG curve presented in Figure 1. The densification increases the intensity of deformation vibrations of the Car-H type (in the range of 900–600 cm−1) in the ATR spectra of the condensates from WS (Figure 5a) and SH (Figure 5c) samples.

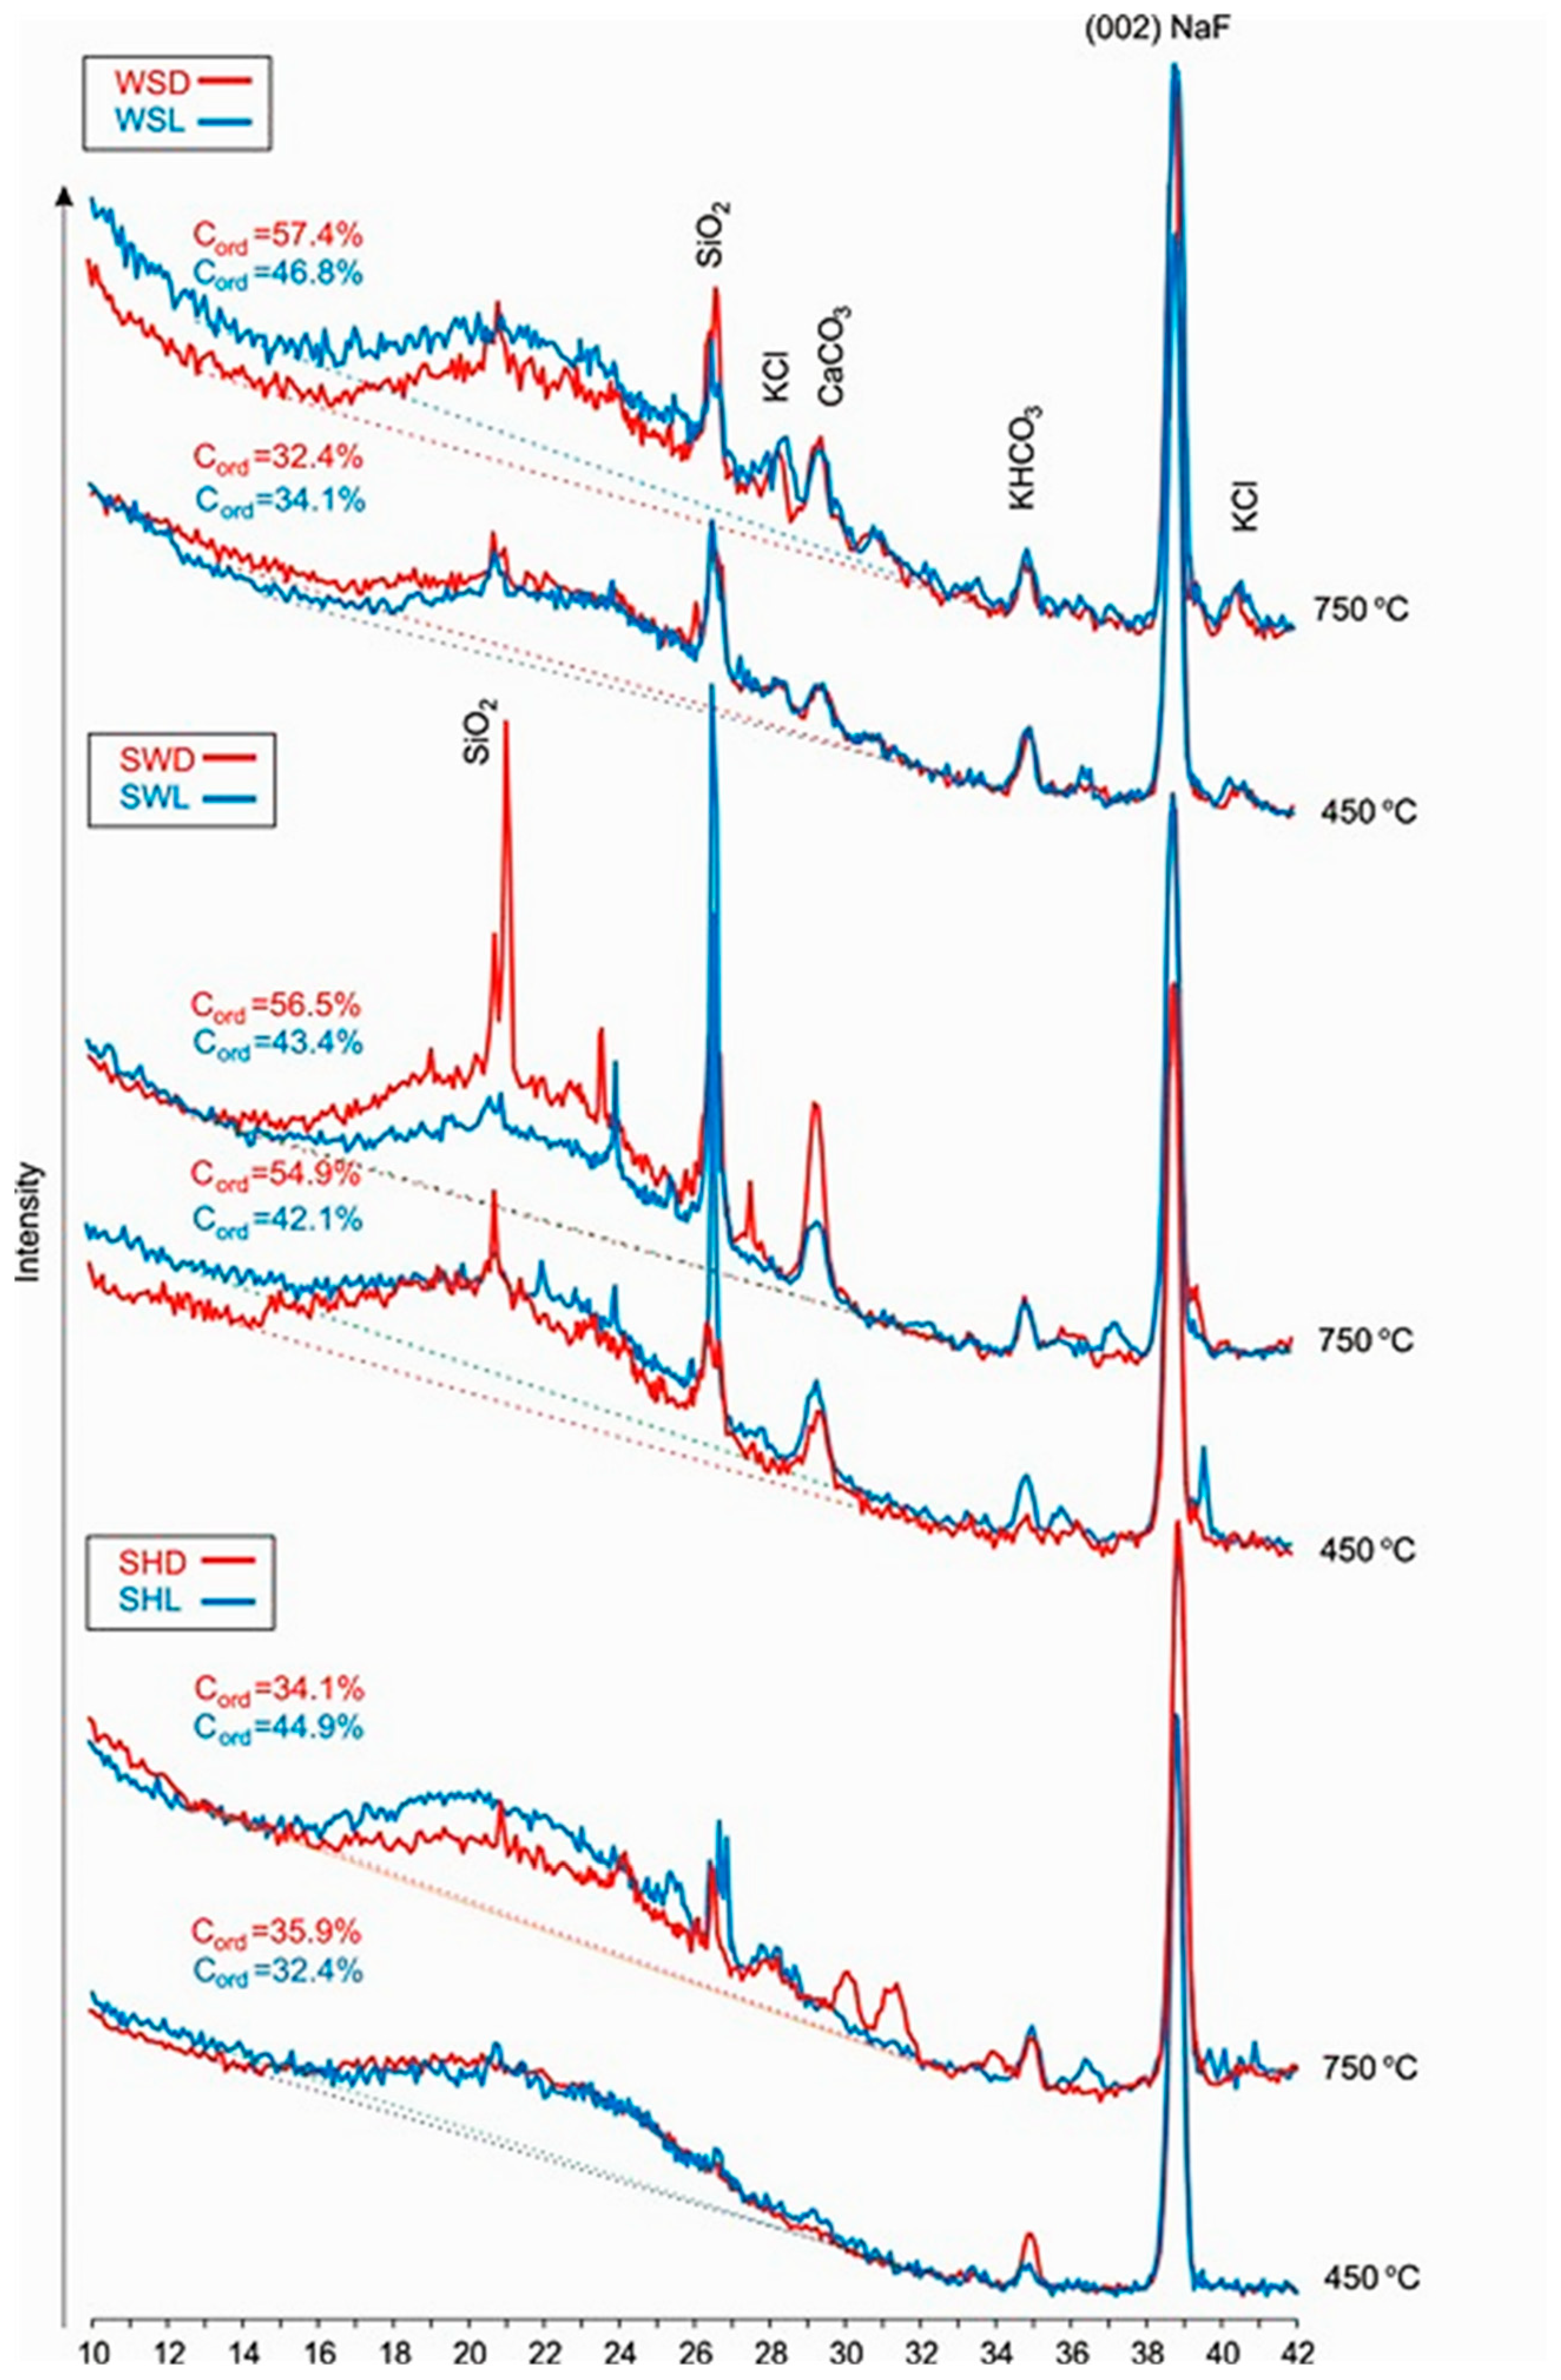
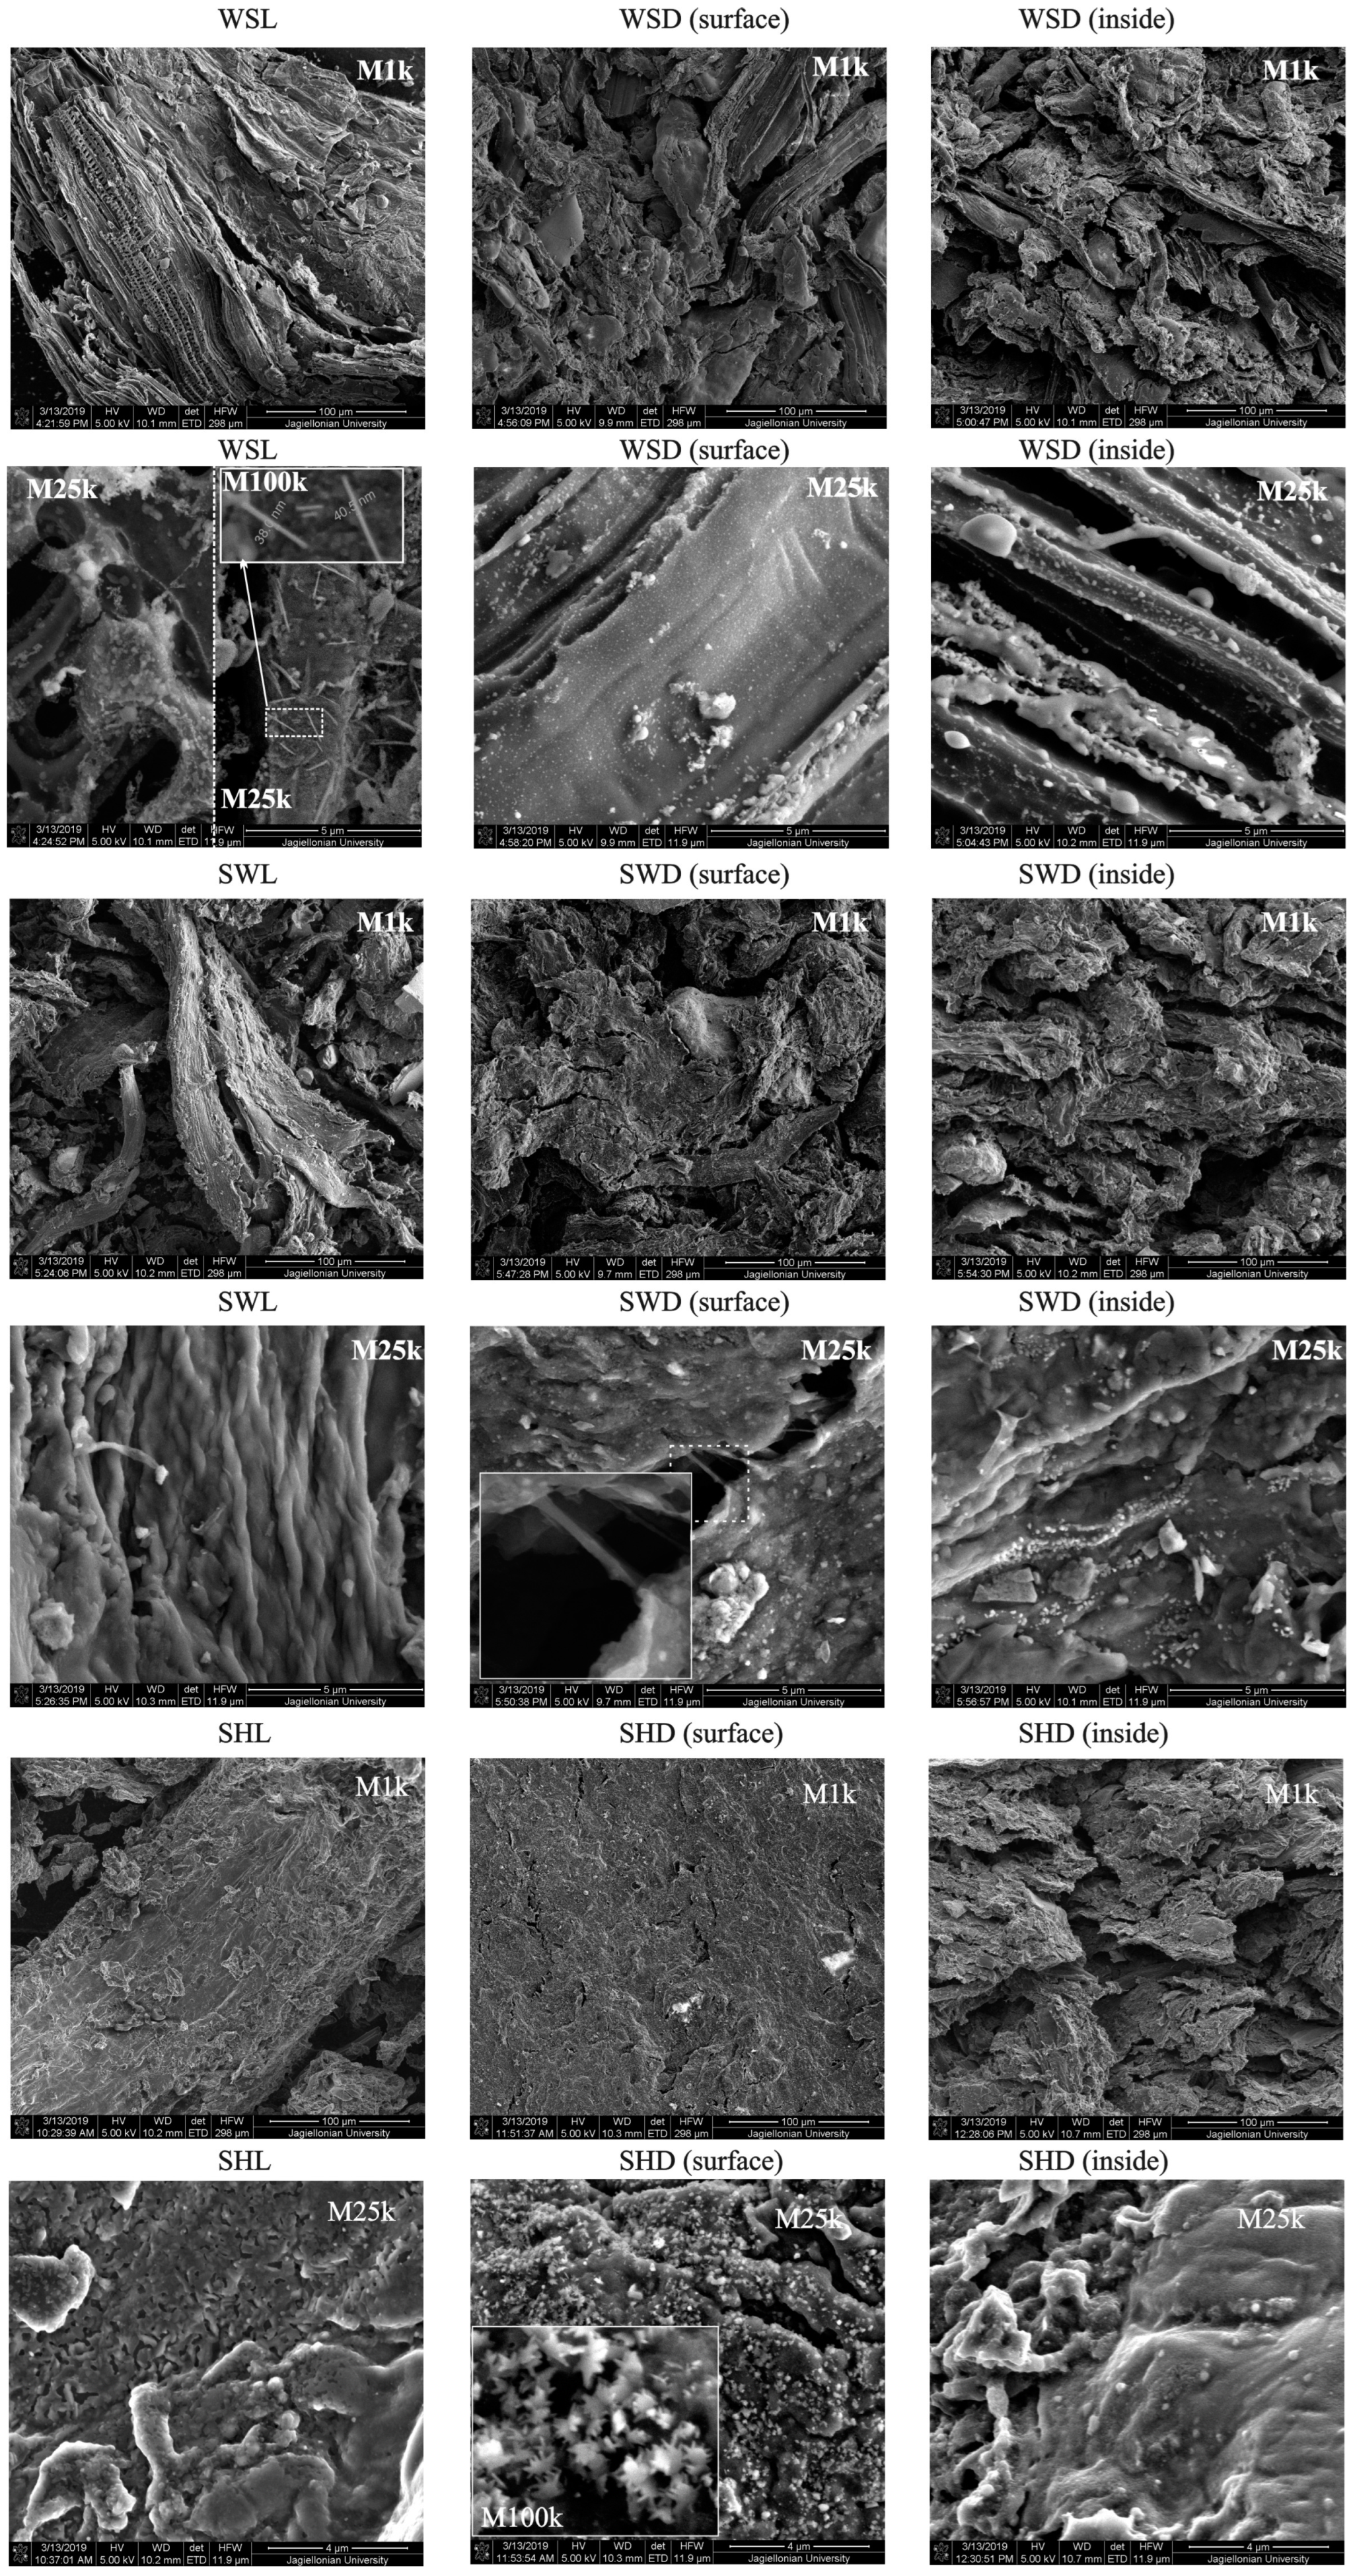
3.4. The Influence of Densification on Changes in Structure Texture of Chars

Figure 6 presents the diffractograms of studied samples in loose and densified forms that were pyrolyzed to the temperatures of 450 and 750 °C. A wide reflex in the range of angles of 2θ 14–30 degrees is present on all diffractograms. Taking into account this range of angles, it can be suggested that γ-fraction formed C atoms of ordered aliphatic chains has a significant contribution in formation of this reflex. These chains form the so-called local molecular arrangements, which were caused by the interference of the radiation scattered by the sample [66,67]. The appearance of γ reflex on diffractograms of chars was reported in works by other researchers [68,69]. The contribution of C atoms in graphite-like sheets (the peak of which should be near 2θ = 26 degrees) is insignificant in shaping of this reflex.
It follows from the shapes of the diffractograms that WS and SH samples, both loose and densified, after heating to the temperature of 450 °C, have similar surface areas under diffractograms, and hence they do not substantially differ by integral intensity. The values of the Cord parameter that determines the general degree of ordering of carbon atoms in aliphatic chains (γ-fraction) and in graphite-like sheets in their chars are 33.4 and 34.1% for WSD and WSL samples appropriately, and for SHD and SHL they are 35.9 and 32.4%, respectively (Figure 6).
However, SWD and SWL samples pyrolyzed to the temperature of 450 °C substantially differ from each other by Cord parameter that amounts to 54.9 and 42.1%, respectively. The degree of ordering increases in WSD and WSL samples when the pyrolysis temperature rises to 750 °C as is evidenced by an increase in value of the Cord parameter. WSD samples have a greater degree of ordering (parameter Cord = 57.5%) in comparison to WSL samples (parameter Cord = 46.8%). The ordering of structure takes place in a different way in SWD sample that at the temperature of 750 °C have the value of Cord parameter (Cord = 50.5%), less than it has at the temperature of 450 °C. The Cord parameter for SWL sample at the temperature of 750 °C was equal to 42.1%, and this parameter has the same value for SWL sample at the temperature of 450 °C. The processes of transformation of structure in the temperature range 450–750 °C occur for SHD sample in a completely different way. At the temperature of 750 °C, SHD sample have a somewhat lower value of the Cord parameter (Cord = 34.1%) compared to the value at the temperature of 450 °C (Cord = 35.9%). However, at the temperature of 750 °C there is an increase in the Cord parameter up to 44.9% of that observed for SHL sample.
The diffractograms and given values of the Cord parameter presented in Figure 6 imply that the densification influences transformations of structure of WS, SW, and SH samples during pyrolysis at various temperatures in different ways. The phenomenon of transformation of diffractogram profiles in the studied temperature ranges was observed by other researchers [70,71,72] who attributed a decrease in total intensity of reflexes in the studied range of 2θ angles to degradation of cellulose macromolecules.
Besides the reflex caused by the presence of ordered carbon atoms in ordered aliphatic chains and graphite-like sheets, there are some reflexes from inorganic components on the diffractograms of chars. The intensity of these reflexes rises with an increase in temperature from 450 °C to 750 °C. On the diffractograms of densified samples, the reflexes from inorganic components have somewhat greater intensity. This implies that volatile inorganic components can be emitted from densified samples to lesser extent. Hwang et al. [73] established that K and Ca agglomerate in higher concentration in bio-chars. Inorganic components [57] including alkali metals and alkaline earth metals can have a catalytic effect on the course of pyrolysis processes [39]. Compounds containing K can catalyze secondary reactions of cracking of volatile products of pyrolysis [43]. This would suggest that the reorganization of structure of chars in WS and SH samples would have taken place in similar way. However, the comparison of transformation of the profiles of reflexes on the diffractograms of WS and SH samples having similar content of K and Ca elements (Table 2) and the comparison of changes in their ordering degree at the temperatures of 450 and 750 °C do not confirm this.
The comparison of shapes and locations of the reflexes on the diffractograms imply that inorganic components can form alloys of different composition during pyrolysis of densified samples. In biomass samples, inorganic components can influence the yield of volatile products of biomass decomposition [41] and thus the processes of structural ordering of chars with which these volatiles will interact. Moreover, the presence of alloys of miscellaneous composition in the chars of samples will affect the processes of ordering of their structure in a different way.
Figure 7 presents SEM images of chars at the temperature of 750 °C at magnification of M1 k and M25 k.
It follows from Figure 7 that the pyrolyzed WSL sample has a heterogeneous structure. The magnification of M25 k shows the differences in shape of inorganic particles and in their location in different areas of the sample. In some areas inorganic particles have an irregular shape, and in others there are some nano-particles shaped like needles of about 40 nm in diameter (magnification of M100 k) that are visible near irregularly shaped particles. There were no such nano-objects found in the SEM images of densified samples. On the surface of WSD samples, the organic material does not show any visible differences but the edges of inorganic particles have some signs of melting. Inside the pyrolyzed WSD sample there are some areas of molten inorganic particles in the form of drops visible at a magnification of M25 k. The possibility of formation of “low melting alkali silicate component” was reported by Zevenhoven–Onderwater et al. [40].
Such a situation could have taken place in biomass rich in silicon. The occurrence of such areas in the pyrolyzed WSD sample suggests that they may result from a hindered removal of volatile products from inside of the sample. The volatile organic compounds were able to interact with inorganic components inside of the tablet longer but also the inorganic components could have formed various alloys and undergone coalescence.
In contrast to WS samples, SW and SH samples manifest the signs of melting of organic particles (Figure 7). At magnifications of M1 k, it is impossible to notice any differences in relief of the pyrolyzed material in SWL and SWD samples on the surface and inside of the tablet. However, at magnification of M25 k the material of the pyrolyzed SWL sample looks like swollen molten fibres, and the pyrolyzed SWD sample manifest traces of stickiness in contact points of particles of pyrolyzed material on the tablet surface. The material inside the tablet of the pyrolyzed SWD sample shows the traces of melting too. The possibility of melting of hemicellulose and lignin, in which cellulose chains were immersed, was reported by a number of authors [29,37,74]. The location of cellulose chains in molten lignin could have facilitated the formation of areas of parallel arrangement of its chains, what caused the lowering of the background line on the diffractogram of SWD sample on the side of lower angles of scattering at the temperature of 450 °C (Figure 6). The results of the conducted microanalysis of pyrolyzed SW samples (Figures S1–S3) show a tendency toward an increase in content of Fe and Ca elements in SWD sample. A possible influence of Fe and Ca elements on increased content of hydrocarbons in the composition of volatile products of pyrolysis was reported earlier by the authors [46,61]. The char of densified SWD sample shows a tendency toward an increase in contribution of Mg and K atoms. Moreover, the presence of Na was determined in this char. The presence of these elements in a char can cause secondary reactions between the char and volatile products [75]. The increase in contribution ratio of saturated and unsaturated hydrocarbons, compounds with carbonyl groups along with aldehydes and ketones in the volatile products of densified sample observed in Figure 3 can be probably connected with the cumulation of compounds containing the aforementioned elements in the char of SW samples.
The magnification of M25 k exposes clear signs of melting of particles of the SHL and SHD samples (Figure 7). It could be expected that, similar to WSD samples, SHD sample would show a greater structural ordering at the temperature of 750 °C. This was proposed on the basis of the data from Table 2; in SW and SH samples there are similar amounts of K, Ca, and Fe elements. However, in contrast to WSD samples, at the temperature of 750 °C SHD sample had a worse ordering than SHL sample (Figure 6). WS and SH samples belong to lignocellulose biomass but there is no pseudocomponent of cellulose I in the composition of SH samples (Figure 1c). This could have been the probable reason for the differences in thermal behavior of SHD sample and the differences in course of ordering of these samples under the influence of temperature.
The comparison of the results of microanalysis of SHL (Figure S4) and SHD (Figures S5 and S6) points to an increased content of such elements as Mg, P, S, and Fe. The presence of Ti was detected on the surface of the SHD sample. In the char of SHD sample, there are more K atoms cumulating than in the char of WSD. Inside of the char of WSD, there are more Ca atoms detected than in SHD sample. Moreover, the results of microanalysis of the chars of SH samples show the presence of N element in them. This element was not detected in the chars of WS and SW samples. It cannot be excluded that the presence of this element in SHD sample caused a decrease in the contribution of hydrocarbons in the composition of the volatile products of pyrolysis.
In contrast to WS and SW samples, there are greater amounts of inorganic nano-particles shaped like multi-pointed stars (M100 k) visible on the surface of SHD sample. Such particles were not found in SHL sample or inside the tablets of the pyrolyzed SHD sample. Taking into account a well-known fact that inorganic components can influence the changes in composition of volatile products of pyrolysis [43] and that the formed char can interact with volatile components [40], the differences in thermal behavior of the studied samples can be connected not only with the differences in composition of inorganic elements in the composition of the densified lignocellulose biomass but also with the location of agglomerates of inorganic components in the tablet or the type of morphology of particles in the formed agglomerates.
The agglomerates of inorganic particles were located inside the tablet, and the morphology of particles in WSD sample differed from the morphology of inorganic particles in WSL sample. The contribution ratio of compounds with carbonyl groups was greater in the composition of the volatile products emitted from WSD sample (Figure 2). On the micrographs of SWD sample (inside and on the surface of the tablet) there are greater amounts of inorganic particles than for SWL sample (Figure 7), which corresponds to a greater intensity of the reflexes on the diffractograms of SWD sample (Figure 6); i.e., there were more components that could have caused not only greater degradation of basic biomass components but also the interaction of volatile products both inside and on the surface of the tablet. This could have caused an increase in the contribution of saturated and unsaturated hydrocarbons, compounds with carbonyl groups, alcohols, and phenols in volatile products of pyrolysis of SWD sample compared to SWL sample (Figure 3). Some nano-particles in the shape of stars are visible on the surface of the tablet of SHD sample. This could have caused a lower emission of hydrocarbons in the composition of volatile products during pyrolysis of SHD sample. These results show that the location of inorganics in chars influences the volatile-char interactions.

4. Conclusions

The influence of the densification without additives of the three types of lignocellulose biomass (wheat straw, soft wood, and sunflower husk) on the composition of their solid, liquid, and gaseous pyrolysis products was investigated. It was found that the densification intensifies volatile-char interactions and causes the following changes in composition of volatile products of pyrolysis: at the temperature of 420 °C, the contribution of compounds with carbonyl groups emitted from wheat straw doubles; in case of soft wood, the contribution of saturated and unsaturated hydrocarbons along with compounds with carbonyl groups increases 1.8 times, and the contribution of emitted alcohols and phenols increases 1.3 times; however, in the case of sunflower husk, the contribution of saturated and unsaturated hydrocarbons decreases 4.9 times and the contribution of emitted compounds with carbonyl groups decreases 1.9 times.
At the temperature of 750 °C, the densification increases the degree of ordering of the tablets from pyrolyzed wheat straw and soft wood samples but lowers it in the tablets from pyrolyzed sunflower husk samples.
The densification changes the location of inorganic components in the samples of pyrolyzed tablets and, hence volatile-char interactions. In the char of wheat straw tablets, the agglomerates of inorganic particles occur inside the tablet; in the char of sunflower husk tablets, these agglomerates are observed only on the surface; and in the char of soft wood tablets, the inorganic components do not show any particular location disposition—it is the same as in the char of loose samples. It is suggested that a decrease in emission of hydrocarbons in the composition of volatile products can be connected with the morphology of inorganic components and the location of their agglomerates in the tablet.
The changes in composition and structural-chemical parameters of pyrolysis products cannot be caused by a hindered removal of volatile products of pyrolysis from the briquetted sample only; an interaction is powered by briquetting both between these products and basic biomass components directly in the sample and the volatile products on the surface of formed char. The results of the investigation of influence of the briquetting on the changes in structural-chemical parameters of liquid products of pyrolysis of wheat straw, soft wood, and sunflower husk samples prove that different types of lignocellulose biomass respond differently to this technological stimulus. That is why it is very difficult (or even probably impossible) to propose a single mechanism in order to explain the differences in nature of transformations taking place in briquetted and loose biomass during pyrolysis.
Taking into account that the pyrolysis process analyzed in this paper is the first stage of combustion, it can be suggested that wheat straw and soft wood should be burned in the loose form, and sunflower husk in the briquetted form. This would avoid incomplete combustion of wheat straw briquettes caused by formation of greater slag agglomerates and help prevent the emission of environmentally hazardous compounds.

Supplementary Materials

The following supporting information can be downloaded at: https://www.mdpi.com/article/10.3390/en15124257/s1, Figure S1. Results of microanalysis of SWL sample. Figure S2. Results of microanalysis of the surface of SWD sample. Figure S3. Results of microanalysis of the inside of SWD sample. Figure S4. Results of microanalysis of SHL sample. Figure S5. Results of microanalysis of the surface of SHD sample. Figure S6. Results of microanalysis of the inside of SHD sample.

Author Contributions

Conceptualization, V.Z. and M.B.; methodology, V.Z. and A.S.; validation, V.Z., M.B., and A.S.; investigation, A.S and M.B.; data curation, A.S.; writing—original draft preparation, V.Z. and M.B.; writing—review and editing, V.Z. and M.B.; visualization, A.S. and V.Z; project administration, V.Z.; funding acquisition, V.Z. All authors have read and agreed to the published version of the manuscript.

Funding

This research was funded by the Rector of Jan Kochanowski University in Kielce within the framework of Project SUPB. RN 21.191.

Institutional Review Board Statement

Not applicable.

Informed Consent Statement

Not applicable.

Data Availability Statement

Not applicable.

Acknowledgments

The authors would like to thank Lina Kieush for making biomass samples available for analysis.

Conflicts of Interest

The authors declare no conflict of interest.

References

  1. Bajwa, D.S.; Peterson, T.; Sharma, N.; Shojaeiarani, J.; Bajwa, S.G. A Review of Densified Solid Biomass for Energy Production. Renew. Sust. Energy Rev. 2018, 96, 296–305. [Google Scholar] [CrossRef]
  2. Liu, Z.; Zhang, F.; Yan, S.; Tian, L.; Wang, H.; Liu, H.; Wang, H.; Hu, J. Effects of Temperature and Low-Concentration Oxygen on Pine Wood Sawdust Briquettes Pyrolysis: Gas Yields and Biochar Briquettes Physical Properties. Fuel Process. Technol. 2018, 177, 228–236. [Google Scholar] [CrossRef]
  3. Albashabsheh, N.T.; Heier Stamm, J.L. Optimization of Lignocellulosic Biomass-to-Biofuel Supply Chains with Densification: Literature Review. Biomass Bioenergy 2021, 144, 105888. [Google Scholar] [CrossRef]
  4. Halim, S.A.; Swithenbank, J. Characterisation of Malaysian Wood Pellets and Rubberwood Using Slow Pyrolysis and Microwave Technology. J. Anal. Appl. Pyrolysis 2016, 122, 64–75. [Google Scholar] [CrossRef]
  5. Yang, Z.; Sarkar, M.; Kumar, A.; Tumuluru, J.S.; Huhnke, R.L. Effects of Torrefaction and Densification on Switchgrass Pyrolysis Products. Bioresour. Technol. 2014, 174, 266–273. [Google Scholar] [CrossRef] [PubMed]
  6. Florentino-Madiedo, L.; Díaz-Faes, E.; García, R.; Barriocanal, C. Influence of Binder Type on Greenhouse Gases and PAHs from the Pyrolysis of Biomass Briquettes. Fuel Process. Technol. 2018, 171, 330–338. [Google Scholar] [CrossRef] [Green Version]
  7. Muazu, R.I.; Stegemann, J.A. Biosolids and Microalgae as Alternative Binders for Biomass Fuel Briquetting. Fuel 2017, 194, 339–347. [Google Scholar] [CrossRef]
  8. Zhu, Y.; Yang, W.; Fan, J.; Kan, T.; Zhang, W.; Liu, H.; Cheng, W.; Yang, H.; Wu, X.; Chen, H. Effect of Sodium Carboxymethyl Cellulose Addition on Particulate Matter Emissions during Biomass Pellet Combustion. Appl. Energy 2018, 230, 925–934. [Google Scholar] [CrossRef]
  9. Si, Y.; Hu, J.; Wang, X.; Yang, H.; Chen, Y.; Shao, J.; Chen, H. Effect of Carboxymethyl Cellulose Binder on the Quality of Biomass Pellets. Energy Fuels 2016, 30, 5799–5808. [Google Scholar] [CrossRef]
  10. Manouchehrinejad, M.; Mani, S. Torrefaction after Pelletization (TAP): Analysis of Torrefied Pellet Quality and Co-Products. Biomass Bioenergy 2018, 118, 93–104. [Google Scholar] [CrossRef]
  11. Wu, S.; Zhang, S.; Wang, C.; Mu, C.; Huang, X. High-Strength Charcoal Briquette Preparation from Hydrothermal Pretreated Biomass Wastes. Fuel Process. Technol. 2018, 171, 293–300. [Google Scholar] [CrossRef]
  12. Araújo, S.; Vilas Boas, M.A.; Neiva, D.M.; de Cassia Carneiro, A.; Vital, B.; Breguez, M.; Pereira, H. Effect of a Mild Torrefaction for Production of Eucalypt Wood Briquettes under Different Compression Pressures. Biomass Bioenergy 2016, 90, 181–186. [Google Scholar] [CrossRef]
  13. Pradhan, P.; Mahajani, S.M.; Arora, A. Production and Utilization of Fuel Pellets from Biomass: A Review. Fuel Process. Technol. 2018, 181, 215–232. [Google Scholar] [CrossRef]
  14. Amarasekara, A.; Tanzim, F.S.; Asmatulu, E. Briquetting and Carbonization of Naturally Grown Algae Biomass for Low-Cost Fuel and Activated Carbon Production. Fuel 2017, 208, 612–617. [Google Scholar] [CrossRef]
  15. Zvicevičius, E.; Raila, A.; Čiplienė, A.; Černiauskienė, Ž.; Kadžiulienė, Ž.; Tilvikienė, V. Effects of Moisture and Pressure on Densification Process of Raw Material from Artemisia dubia. Wall. Renew. Energy 2018, 119, 185–192. [Google Scholar] [CrossRef]
  16. Tag, A.T.; Duman, G.; Yanik, J. Influences of Feedstock Type and Process Variables on Hydrochar Properties. Bioresour. Technol. 2018, 250, 337–344. [Google Scholar]
  17. Wang, Y.; Wu, K.; Sun, Y. Pelletizing Properties of Wheat Straw Blending with Rice Straw. Energy Fuels 2017, 31, 5126–5134. [Google Scholar] [CrossRef]
  18. Gendek, A.; Aniszewska, M.; Malaťák, J.; Velebil, J. Evaluation of Selected Physical and Mechanical Properties of Briquettes Produced from Cones of Three Coniferous Tree Species. Biomass Bioenergy 2018, 117, 173–179. [Google Scholar] [CrossRef]
  19. Rahaman, S.A.; Salam, P.A. Characterization of Cold Densified Rice Straw Briquettes and the Potential Use of Sawdust as Binder. Fuel Process. Technol. 2017, 158, 9–19. [Google Scholar] [CrossRef]
  20. Gilvari, H.; de Jong, W.; Schott, D.L. Quality Parameters Relevant for Densification of Bio-Materials: Measuring Methods and Affecting Factors—A Review. Biomass Bioenergy 2019, 120, 117–134. [Google Scholar] [CrossRef]
  21. Jiang, L.; Liang, J.; Yuan, X.; Li, H.; Li, C.; Xiao, Z.; Huang, H.; Wang, H.; Zeng, G. Co-pelletization of Sewage Sludge and Biomass: The Density and Hardness of Pellet. Bioresour. Technol. 2014, 166, 435–443. [Google Scholar] [CrossRef] [PubMed]
  22. Yank, A.; Ngadi, M.; Kok, R. Physical Properties of Rice Husk and Bran Briquettes under Low Pressure Densification for Rural Applications. Biomass Bioenergy 2016, 84, 22–30. [Google Scholar] [CrossRef]
  23. Riva, L.; Nielsen, H.K.; Skreiberg, Ø.; Wang, L.; Bartocci, P.; Barbanera, M.; Bidini, G.; Fantozzi, F. Analysis of Optimal Temperature, Pressure and Binder Quantity for the Production of Biocarbon Pellet to Be Used as a Substitute for Coke. Appl. Energy 2019, 256, 113933. [Google Scholar] [CrossRef]
  24. Sun, J.; Shen, Z.; Zhang, Y.; Zhang, Q.; Wang, F.; Wang, T.; Chang, X.; Lei, Y.; Xu, H.; Cao, J.; et al. Effects of Biomass Briquetting and Carbonization on PM2.5 Emission from Residential Burning in Guanzhong Plain, China. Fuel 2019, 244, 379–387. [Google Scholar] [CrossRef]
  25. Gao, A.; Wang, Y.; Lin, G.; Li, B.; Hu, X.; Huang, Y.; Zhang, S.; Zhang, H. Volatile-Char Interactions during Biomass Pyrolysis: Reactor Design toward Product Control. Renew. Energy 2022, 185, 1–7. [Google Scholar] [CrossRef]
  26. Song, Y.; Wang, Y.; Hu, X.; Hu, S.; Xiang, J.; Zhang, L.; Zhang, S.; Min, Z.; Li, C.Z. Effects of Volatile–Char Interactions on in Situ Destruction of Nascent Tar during the Pyrolysis and Gasification of Biomass. Part I. Roles of Nascent Char. Fuel 2014, 122, 60–66. [Google Scholar] [CrossRef]
  27. Huang, Y.; Liu, S.; Akhtar, M.A.; Li, B.; Zhou, J.; Zhang, S.; Zhang, H. Volatile–Char Interactions during Biomass Pyrolysis: Understanding the Potential Origin of Char Activity. Bioresour. Technol. 2020, 316, 123938. [Google Scholar] [CrossRef]
  28. Ding, K.; Wang, Y.; Liu, S.; Lin, G.; Syed-Hassan, S.S.A.; Li, B.; Hu, X.; Huang, Y.; Zhang, S.; Zhang, H. Volatile-Char Interactions during Biomass Pyrolysis: Insight into the Activity of Chars Derived from Three Major Components. J. Anal. Appl. Pyrolysis 2021, 159, 105320. [Google Scholar] [CrossRef]
  29. Guan, G.; Kaewpanha, M.; Hao, X.; Wang, Z.; Cheng, Y.; Kasai, Y.; Abudula, A. Promoting Effect of Potassium Addition to Calcined Scallop Shell Supported Catalysts for the Decomposition of Tar Derived from Different Biomass Resources. Fuel 2013, 109, 241–247. [Google Scholar] [CrossRef]
  30. Hosoya, T.; Kawamoto, H.; Saka, S. Solid/Liquid- and Vapor-Phase Interactions between Cellulose- and Lignin-Derived Pyrolysis Products. J. Anal. Appl. Pyrolysis 2009, 85, 237–246. [Google Scholar] [CrossRef] [Green Version]
  31. Chen, Y.; Fang, Y.; Yang, H.; Xin, S.; Zhang, X.; Wang, X.; Chen, H. Effect of Volatiles Interaction during Pyrolysis of Cellulose, Hemicellulose, and Lignin at Different Temperatures. Fuel 2019, 248, 1–7. [Google Scholar] [CrossRef]
  32. Penzik, M.V.; Kozlov, A.N.; Zhang, S.; Badenko, V.V.; Sosnovsky, I.K.; Shamansky, V.A. A Segmental Analysis of Pyrolysis of Woody Biomass. Thermochim. Acta 2022, 711, 179209. [Google Scholar] [CrossRef]
  33. Osman, A.I.; Young, T.J.; Farrell, C.; Harrison, J.; Al-Muhtaseb, A.H.; Rooney, D.W. Physicochemical Characterization and Kinetic Modeling Concerning Combustion of Waste Berry Pomace. ACS Sustain. Chem. Eng. 2020, 8, 17573–17586. [Google Scholar] [CrossRef]
  34. Ojha, D.K.; Kumar, V.S.P.; Vinu, R. Analytical Pyrolysis of Bagasse and Groundnut Shell Briquettes: Kinetics and Pyrolysate Composition Studies. Bioresour. Technol. Rep. 2021, 15, 100784. [Google Scholar] [CrossRef]
  35. Chen, D.; Cen, K.; Zhuang, X.; Gan, Z.; Zhou, J.; Zhang, Y.; Zhang, H. Insight into Biomass Pyrolysis Mechanism Based on Cellulose, Hemicellulose, and Lignin: Evolution of Volatiles and Kinetics, Elucidation of Reaction Pathways, and Characterization of Gas, Biochar and Bio-Oil. Combust. Flame 2022, 242, 112142. [Google Scholar] [CrossRef]
  36. Osman, A.I. Mass Spectrometry Study of Lignocellulosic Biomass Combustion and Pyrolysis with NOx Removal. Renew. Energ. 2020, 146, 484–496. [Google Scholar] [CrossRef]
  37. Feng, D.; Guo, D.; Shang, Q.; Zhao, Y.; Zhang, L.; Guo, X.; Cheng, J.; Chang, G.; Guo, Q.; Sun, S. Mechanism of Biochar-Gas-Tar-Soot Formation during Pyrolysis of Different Biomass Feedstocks: Effect of Inherent Metal Species. Fuel 2021, 293, 120409. [Google Scholar] [CrossRef]
  38. Couhert, C.; Commandre, J.M.; Salvador, S. Is It Possible to Predict Gas Yields of Any Biomass after Rapid Pyrolysis at High Temperature from Its Composition in Cellulose, Hemicellulose and Lignin? Fuel 2009, 88, 408–417. [Google Scholar] [CrossRef] [Green Version]
  39. Giudicianni, P.; Cardone, G.; Sorrentino, G.; Ragucci, R. Hemicellulose, Cellulose and Lignin Interactions on Arundo Donax Steam Assisted Pyrolysis. J. Anal. Appl. Pyrolysis 2014, 110, 138–146. [Google Scholar] [CrossRef]
  40. Zevenhoven-Onderwater, M.; Backman, R.; Skrifvars, B.J.; Hupa, M. The Ash Chemistry in Fluidised Bed Gasification of Biomass Fuels. Part I: Predicting the Chemistry of Melting Ashes and Ash–Bed Material Interaction. Fuel 2001, 80, 1489–1502. [Google Scholar] [CrossRef]
  41. Eom, I.Y.; Kim, J.Y.; Kim, T.S.; Lee, S.M.; Choi, D.; Choi, I.G.; Choi, J.W. Effect of Essential Inorganic Metals on Primary Thermal Degradation of Lignocellulosic Biomass. Bioresour. Technol. 2012, 104, 687–694. [Google Scholar] [CrossRef]
  42. Khelfa, A.; Bensakhria, A.; Weber, J.V. Investigations into the Pyrolytic Behaviour of Birch Wood and Its Main Components: Primary Degradation Mechanisms, Additivity and Metallic Salt Effects. J. Anal. Appl. Pyrolysis 2013, 101, 111–121. [Google Scholar] [CrossRef]
  43. Zhao, D.; Dai, Y.; Chen, K.; Sun, Y.; Yang, F.; Chen, K. Effect of Potassium Inorganic and Organic Salts on the Pyrolysis Kinetics of Cigarette Paper. J. Anal. Appl. Pyrolysis 2013, 102, 114–123. [Google Scholar] [CrossRef]
  44. Fan, H.; Gu, J.; Wang, Y.; Yuan, H.; Chen, Y.; Luo, B. Effect of Potassium on the Pyrolysis of Biomass Components: Pyrolysis Behaviors, Product Distribution and Kinetic Characteristics. Waste Manag. 2021, 121, 255–264. [Google Scholar] [CrossRef] [PubMed]
  45. Zhu, H.; Yi, B.; Hu, H.; Fan, Q.; Wang, H.; Yao, H. The Effects of Char and Potassium on the Fast Pyrolysis Behaviors of Biomass in an Infrared-Heating Condition. Energy 2021, 214, 119065. [Google Scholar] [CrossRef]
  46. Lu, Q.; Yuan, S.; Liu, C.; Zhang, T.; Xie, X.; Deng, X.; He, R. A Fe-Ca/SiO2 Catalyst for Efficient Production of Light Aromatics from Catalytic Pyrolysis of Biomass. Fuel 2020, 279, 118500. [Google Scholar] [CrossRef]
  47. Shen, Y.; Yu, S.; Yuan, R.; Wang, P. Biomass Pyrolysis with Alkaline-Earth-Metal Additive for Co-Production of Bio-Oil and Biochar-Based Soil Amendment. Sci. Total Environ. 2020, 743, 140760. [Google Scholar] [CrossRef] [PubMed]
  48. Sarkar, M.; Kumar, A.; Tumuluru, J.S.; Patil, K.N.; Bellmer, D.D. Gasification Performance of Switchgrass Pretreated with Torrefaction and Densification. Appl. Energy 2014, 127, 194–201. [Google Scholar] [CrossRef]
  49. Guo, F.; Liu, Y.; Wang, Y.; Li, X.; Li, T.; Guo, C. Pyrolysis Kinetics and Behavior of Potassium-Impregnated Pine Wood in TGA and a Fixed-Bed Reactor. Energy Convers. Manag. 2016, 130, 184–191. [Google Scholar] [CrossRef]
  50. Zhang, L.; Yang, Z.; Li, S.; Wang, X.; Lin, R. Comparative Study on the Two-Step Pyrolysis of Different Lignocellulosic Biomass: Effects of Components. J. Anal. Appl. Pyrolysis 2020, 152, 104966. [Google Scholar] [CrossRef]
  51. Zubkova, V.; Strojwas, A.; Bielecki, M.; Kieush, L.; Koverya, A. Comparative Study of Pyrolytic Behavior of the Biomass Wastes Originating in the Ukraine and Potential Application of Such Biomass. Part 1. Analysis of the Course of Pyrolysis Process and the Composition of Formed Products. Fuel 2019, 254, 115688. [Google Scholar] [CrossRef]
  52. Yang, H.; Yan, R.; Chen, H.; Lee, D.H.; Zheng, C. Characteristics of Hemicellulose, Cellulose and Lignin Pyrolysis. Fuel 2007, 86, 1781–1788. [Google Scholar] [CrossRef]
  53. Zong, P.; Jiang, Y.; Tian, Y.; Li, J.; Yuan, M.; Ji, Y.; Chen, M.; Li, D.; Qiao, Y. Pyrolysis Behavior and Product Distributions of Biomass Six Group Components: Starch, Cellulose, Hemicellulose, Lignin, Protein and Oil. Energy Convers. Manag. 2020, 216, 112777. [Google Scholar] [CrossRef]
  54. Gong, C.; Thomsen, S.T.; Meng, X.; Pu, Y.; Puig-Arnavat, M.; Bryant, N.; Bhagia, S.; Felby, C.; Ragauskas, A.J.; Thygesen, L.G. Effects of Different Pelleting Technologies and Parameters on Pretreatment and Enzymatic Saccharification of Lignocellulosic Biomass. Renew. Energy 2021, 179, 2147–2157. [Google Scholar] [CrossRef]
  55. Cao, Z.; Zhang, S.; Huang, X.; Liu, H.; Sun, M.; Lyu, J. Correlations between the Compressive Strength of the Hydrochar Pellets and the Chemical Components: Evolution and Densification Mechanism. J. Anal. Appl. Pyrolysis 2020, 152, 104956. [Google Scholar] [CrossRef]
  56. Kawamoto, H.; Watanabe, T.; Saka, S. Strong Interactions during Lignin Pyrolysis in Wood—A Study by in Situ Probing of the Radical Chain Reactions Using Model Dimers. J. Anal. Appl. Pyrolysis 2015, 113, 630–637. [Google Scholar] [CrossRef]
  57. Gargiulo, V.; Giudicianni, P.; Alfè, M.; Ragucci, R. Influence of Possible Interactions between Biomass Organic Components and Alkali Metal Ions on Steam Assisted Pyrolysis: A Case Study On Arundo donax. J. Anal. Appl. Pyrolysis 2015, 112, 244–252. [Google Scholar] [CrossRef]
  58. Fushimi, C.; Katayama, S.; Tsutsumi, A. Elucidation of Interaction among Cellulose, Lignin and Xylan during Tar and Gas Evolution in Steam Gasification. J. Anal. Appl. Pyrolysis 2009, 86, 82–89. [Google Scholar] [CrossRef]
  59. Wu, S.; Shen, D.; Hu, J.; Zhang, H.; Xiao, R. Cellulose-Lignin Interactions during Fast Pyrolysis with Different Temperatures and Mixing Methods. Biomass Bioenergy 2016, 90, 209–217. [Google Scholar] [CrossRef]
  60. Kawamoto, H.; Morisaki, H.; Saka, S. Secondary Decomposition of Levoglucosan in Pyrolytic Production from Cellulosic Biomass. J. Anal. Appl. Pyrolysis 2009, 85, 247–251. [Google Scholar] [CrossRef] [Green Version]
  61. Xia, S.; Li, K.; Xiao, H.; Cai, N.; Dong, Z.; Chen, X.; Chen, Y.; Yang, H.; Tu, X.; Chen, H. Pyrolysis of Chinese Chestnut Shells: Effects of Temperature and Fe Presence on Product Composition. Bioresour. Technol. 2019, 287, 121444. [Google Scholar] [CrossRef] [PubMed]
  62. Usino, D.O.; Ylitervo, P.; Moreno, A.; Sipponen, M.H.; Richards, T. Primary Interactions of Biomass Components during Fast Pyrolysis. J. Anal. Appl. Pyrolysis 2021, 159, 105297. [Google Scholar] [CrossRef]
  63. Herrera, R.; Erdocia, X.; Llano-Ponte, R.; Labidi, J. Characterization of Hydrothermally Treated Wood in Relation to Changes on Its Chemical Composition and Physical Properties. J. Anal. Appl. Pyrolysis 2014, 107, 256–266. [Google Scholar] [CrossRef]
  64. Traoré, M.; Kaal, J.; Cortizas, A.M. Application of FTIR Spectroscopy to the Characterization of Archeological Wood. Spectrochim. Acta A 2016, 153, 63–70. [Google Scholar] [CrossRef]
  65. Zubkova, V.; Strojwas, A.; Bielecki, M. Analysis of the Pyrolytic Behaviour of Birch, Maple, and Rowan Leaves. Energies 2021, 14, 2091. [Google Scholar] [CrossRef]
  66. Siddiqui, M.N.; Ali, M.F.; Shirokoff, J. Use of X-ray Diffraction in Assessing the Aging Pattern of Asphalt Fractions. Fuel 2002, 81, 51–58. [Google Scholar] [CrossRef]
  67. AlHumaidan, F.S.; Hauser, A.; Rana, M.S.; Lababidi, H.M.S.; Behbehani, M. Changes in Asphaltene Structure during Thermal Cracking of Residual Oils: XRD Study. Fuel 2015, 150, 558–564. [Google Scholar] [CrossRef]
  68. He, P.; Liu, Y.; Shao, L.; Zhang, H.; Lü, F. Particle Size Dependence of the Physicochemical Properties of Biochar. Chemosphere 2018, 212, 385–392. [Google Scholar] [CrossRef]
  69. Li, K.; Khanna, R.; Zhang, J.; Barati, M.; Liu, Z.; Xu, T.; Yang, T.; Sahajwalla, V. Comprehensive Investigation of Various Structural Features of Bituminous Coals Using Advanced Analytical Techniques. Energy Fuels 2015, 29, 7178–7189. [Google Scholar] [CrossRef]
  70. Tsaneva, V.N.; Kwapinski, W.; Teng, X.; Glowacki, B.A. Assessment of the Structural Evolution of Carbons from Microwave Plasma Natural Gas Reforming and Biomass Pyrolysis Using Raman Spectroscopy. Carbon 2014, 80, 617–628. [Google Scholar] [CrossRef]
  71. Wang, Z.; Cao, J.; Wang, J. Pyrolytic Characteristics of Pine Wood in a Slowly Heating and Gas Sweeping Fixed-Bed Reactor. J. Anal. Appl. Pyrolysis 2009, 84, 179–184. [Google Scholar] [CrossRef]
  72. Azargohar, R.; Nanda, S.; Kozinski, J.A.; Dalai, A.K.; Sutarto, R. Effects of Temperature on the Physicochemical Characteristics of Fast Pyrolysis Bio-Chars Derived from Canadian Waste Biomass. Fuel 2014, 125, 90–100. [Google Scholar] [CrossRef]
  73. Hwang, H.; Oh, S.; Cho, T.S.; Choi, I.G.; Choi, J.W. Fast Pyrolysis of Potassium Impregnated Poplar Wood and Characterization of Its Influence on the Formation as Well as Properties of Pyrolytic Products. Bioresour. Technol. 2013, 150, 359–366. [Google Scholar] [CrossRef] [PubMed]
  74. Hu, J.; Jiang, B.; Liu, J.; Sun, Y.; Jiang, X. Influence of Interactions between Biomass Components on Physicochemical Characteristics of Char. J. Anal. Appl. Pyrolysis 2019, 144, 104704. [Google Scholar] [CrossRef]
  75. Hu, S.; Jiang, L.; Wang, Y.; Su, S.; Sun, L.; Xu, B.; He, L.; Xiang, J. Effects of Inherent Alkali and Alkaline Earth Metallic Species on Biomass Pyrolysis at Different Temperatures. Bioresour. Technol. 2015, 192, 23–30. [Google Scholar] [CrossRef]
Figure 1. The TG, DTG, and Gram–Schmidt curves along with the deconvoluted DTG curves of biomass samples. (a) WSD and WSL samples; (b) SWD and SWL samples; (c) SHD and SHL samples.
Energies 15 04257 g001
Figure 2. The FT-IR spectra of volatile products of pyrolysis of WSL and WSD samples.
Energies 15 04257 g002
Figure 3. The FT-IR spectra of volatile products of pyrolysis of SWL and SWD samples.
Energies 15 04257 g003
Figure 4. The FT-IR spectra of volatile products of pyrolysis of SHL and SHD samples.
Energies 15 04257 g004
Figure 5. The ATR spectra of the obtained liquid products of pyrolysis of studied samples. (see explanation in the text). (a) WSD and WSL samples; (b) SWD and SWL samples; (c) SHD and SHL samples.
Energies 15 04257 g005
Figure 6. The diffractograms of obtained chars.
Energies 15 04257 g006
Figure 7. The SEM images of chars obtained at the temperature 750 °C.
Energies 15 04257 g007
Table 1. Main characteristics of studied samples.
Main CharacteristicsWSSWSH
C [%]39.90 ± 0.1545.34 ± 0.1345.82 ± 0.08
H [%]5.75 ± 0.025.86 ± 0.046.32 ± 0.02
N [%]0.65 ± 0.080.58 ± 0.112.61 ± 0.05
S [%]0.13 ± 0.050.17 ± 0.070.14 ± 0.02
O a [%]41.97 ± 0.0742.45 ± 0.0438.31 ± 0.08
A d [%]11.59 ± 0.765.60 ± 0.386.81 ± 0.51
HHV b [MJ·kg−1]16.12 ± 0.1918.23 ± 0.1319.31 ± 0.13
a calculated by difference, O [%] = 100 − C − H − N − S − Ash; b calculated by HHV [MJ·kg−1] = 0.3491 × C + 1.1783 × H + 0.1005 × S − 0.0151 × N − 0.1034 × O − 0.0211 × Ash. d dry basis.
Table 2. The content of selected inorganic elements in studied biomass [%].
ElementsWSSWSH
Al<0.010.20 ± 0.050.08 ± 0.05
P0.04 ± 0.020.07 ± 0.010.36 ± 0.02
S0.19 ± 0.010.08 ± 0.010.33 ± 0.02
Cl0.46 ± 0.010.03 ± 0.010.10 ± 0.01
K1.30 ± 0.040.36 ± 0.021.30 ± 0.04
Ca0.54 ± 0.041.32 ± 0.060.76 ± 0.05
Fe0.10 ± 0.010.37 ± 0.010.14 ± 0.01
Si2.58 ± 0.050.71 ± 0.030.70 ± 0.05
Zn<0.01<0.01<0.01
Publisher’s Note: MDPI stays neutral with regard to jurisdictional claims in published maps and institutional affiliations.

