Article

Research on the Mobile Refrigeration System at a High Temperature Working Face of an Underground Mine

1
School of Resources and Safety Engineering, Central South University, Changsha 410083, China
2
Chinalco Yuxi Mining Co., Ltd., Yuxi 653100, China
*
Author to whom correspondence should be addressed.
Energies 2022, 15(11), 4035; https://doi.org/10.3390/en15114035
Submission received: 4 April 2022 / Revised: 19 May 2022 / Accepted: 26 May 2022 / Published: 31 May 2022
(This article belongs to the Special Issue Energy Geotechnics and Geostructures)

Abstract

:
With an increase in mining depth, the problem of heat damage in metal mine working face has become increasingly prominent. In order to effectively reduce the temperature of the working face and provide a comfortable working environment for the miners, based on the concept of “cooling on demand”, a mobile refrigeration system for high-temperature working face was designed, and a field test was carried out in Dahongshan Copper Mine, Yunnan Province. At the same time, based on the experimental conditions, the parameter optimization research of the mobile refrigeration system was carried out. The results showed that: (1) The mobile refrigeration system could reduce the wet bulb temperature of the working face at the test site to below 30 °C, which is in line with the “Safety Regulations for Metal and Non-Metallic Mines” (GB16423-2020); (2) when the diameter of the air supply pipe was 600 mm and the air supply velocity was 12 m/s, the target cooling area could meet the continuous operation requirements stipulated in the “Safety Regulations for Metal and Non-metallic Mines” in China; (3) for every 2 °C decrease in supply air temperature, the average wet bulb temperature in the target cooling area decreased by 0.9 °C; (4) for every 10% decrease in supply air humidity, the wet bulb temperature and relative humidity in the target cooling area decreased by 0.76 °C and 4.38% on average, respectively. The research results provide new ideas and methods for the prevention and control of heat damage in metal mines.

1. Introduction

Mineral resources are the main source of human living and production materials. According to the white paper of the Chinese government, more than 95% of energy, more than 80% of industrial raw materials, more than 70% of agricultural production materials, and more than 30% of industrial and agricultural water use come from mineral resources in China. Simultaneously, the population boom and environmental change are driving up energy consumption [1]. With the continuous consumption of shallow mineral resources, the deep mining of mineral resources has become a development trend within the mining industry [2]. Consequently, the problem of heat damage in mines has become increasingly prominent. The harsh environment of high temperature and humidity in underground mines will seriously endanger the physical and mental health of the human body and can easily lead to occupational diseases such as heat stroke, heat collapse, skin diseases, rheumatism, heart disease, thermal fatigue, and mental diseasesetc. It greatly affect the labor productivity of miners and the safety of mine production [3,4,5]. Previous studies have shown that controlling workplace temperature can effectively reduce accident frequency [6]. At the same time, in order to minimize the damage to the human body caused by the thermal environment of the production mine, different regions have selected different evaluation indicators to evaluate the thermal hazard of the mine [7,8]. In China, the “Safety Regulations for Metal and Non-Metallic Mines” (GB16423-2020) stipulates that the operation should be stopped immediately when the wet bulb temperature of the thermal environment of underground mines exceeds 30 °C. Therefore, it has become an urgent task for mines to reduce the temperature to prevent and control mine heat damage and improve the working environment of miners.
Mine refrigeration methods can be divided into non-artificial and artificial refrigeration [9,10]. In terms of non-artificial refrigeration, since the ventilation system is a basic part of the mine development system, the use of ventilation to cool down has become the first choice in many high-temperature mines [11]. Ventilation cooling can be achieved by increasing the ventilation volume, selecting a reasonable ventilation system, and ventilation methods. Previous studies have shown that increasing the air volume can reduce the air temperature of a working face by 1–4 °C. Wang et al. [12] pointed out that the distance between the air supply outlet and the working face (Z m) and the heat generated by the scraper (QL) had a significant impact on the airflow velocity, relative humidity, and temperature distribution in the blind alley. A relatively optimal cooling performance could be achieved when Z m was set to 5 m. Zhou et al. [13] established two single-pipe and double-pipe models to study the influence of the ventilation pipe arrangement on the cooling effect under the same ventilation volume; six points were selected as the pipe hanging positions to form six ventilation duct models. At the same time, the cooling effect of each model was evaluated by analyzing the average temperature of the drift section, the three-dimensional distribution of drift temperature, and the velocity streamline of the entire drift. The results showed that the cooling effect of the double-pipe model was better. Huang et al. [14] proposed the concept of segmented ventilation cooling in long-distance, high-temperature drifts and established a mathematical model for segmented uniform ventilation. The simulation and design of the segmented ventilation cooling system were carried out using the FLUENT software. The results showed that the cooling effect of segmented ventilation was approximately 15% higher than that of conventional local ventilation. However, ventilation cooling is only suitable for mines with low heat damage, whereas artificial refrigeration should be adopted for mines with severe heat damage.
The refrigeration effect of the artificial refrigeration method is significant. Nie et al. [15] established an underground centralized cooling system with mine water as the cooling source on the basis of the optimization of the mine ventilation system, which reduced the temperature of the production site by 5–6 °C. Chen et al. [16] simulated and analyzed the thermal performance of a fractional vapor compression refrigerator and pointed out that the thermal performance of the system was better than that of the cooling water system and that the system was more suitable for the shallow part of the mine. Zhai et al. [17] designed an LCO2 circulating refrigeration system using the liquid carbon dioxide phase-change endothermic principle and used COMSOL Multiphysics software to simulate the heat transfer performance between CO2 and airflow. The results showed that when the CO2 consumption rate was 13.54 m3/h, the temperature of the airflow in the drift decreased by 7.72 °C. Zhang et al. [18] used a mobile refrigeration unit, water source heat pump refrigeration unit, and ground centralized ice-cold radiation system to form a comprehensive refrigeration system. The integrated system reduced the average temperature of the main operating site by 8 °C and the average temperature of the underground working surface was kept below 26 °C. Tu et al. [19] designed a free-cooling auxiliary air conditioning system that could significantly improve the annual average energy efficiency ratio of the system.
Since artificial refrigeration systems usually require the establishment of large refrigeration base stations, their construction and operating costs are relatively high. Many scholars have focused on reducing operation costs, implementing energy-saving technologies, and optimizing refrigeration systems [20,21,22,23]. In general, the artificial refrigeration method has a remarkable refrigeration effect, but is expensive, which limits its wide application in mines. Therefore, the development of cost-effective artificial refrigeration equipment or systems will become a future research topic.
The high temperature working face is one of the main working areas for the miners. Since the driving drift mainly adopts the local fan ventilation method, it is easy to cause heat accumulation. At the same time, in deep high temperature mines, the air temperature provided by local fans is often higher. Therefore, the use of ventilation and cooling cannot solve the problem of heat damage, and artificial refrigeration must be used.
In this study, an economical mobile local refrigeration method was proposed to cool the working face. A mobile artificial refrigeration system for a high-temperature working face was developed, and a field test and parameter optimization study of the mobile refrigeration system were carried out in the Dahongshan Copper Mine.

2. Overview of Dahongshan Copper Mine

2.1. Mine Geological Conditions

Dahongshan Copper Mine is located in Gasa Town, Xinping Yi and Dai Autonomous County, Yuxi City, Yunnan Province.
The geological conditions of the Dahongshan Copper Mine have an important influence on the underground high temperature rocks. The Dahongshan copper deposit is located on the south flank of the Gongdibadu anticline in the Dahongshan platform of the Kang-Dian axis, and only the southern end has a smaller secondary trend and anticline folds. The overall monoclinic structure hinders the upward transfer of heat, which leads to the accumulation of heat in the western section of the Dahongshan Copper Mine and aggravates the heat damage in the mine. Moreover, the entire Mesozoic caprock in the mining area was completely folded at the end of the Yanshan Movement, resulting in many fractures. Deep hot water entered the stratum through these fractures, but it was difficult to migrate to the shallow part because of the water-resisting layer, which kept the heat in the deep stratum and provided a heat source for the formation of heat damage. Moreover, frequent magmatic activities in the Dahongshan mining area have an impact on the geothermal distribution to a certain extent. For example, different types of magmatic activity occurred in the Cretaceous of Yanshan, the Early Paleozoic of Caledonian, the Middle Proterozoic of Jinning, the Early Proterozoic of Longchuan, and the Archean of Hongshan. In addition, the main ore rock types in the Dahongshan Copper Mine are tuff and schist. The thermal parameter test shows that the thermal conductivities of both are relatively high, and their values are 3.073 W/m·K and 3.46 W/m·K, respectively, which accelerates the spread of deep heat to the mining area.

2.2. Heat Source Analysis

The Dahongshan Copper Mine is a typical deep-high-temperature underground mine. The test results of air temperature in the mine show that the temperature of the driving drift is as high as 39 °C, the average temperature of the air inlet driving drift is 35.3 °C, and the temperature near the fan also exceeds 35 ℃. Simultaneously, the temperature of the original rock measured at the 140 level and below all exceeded 37 °C, which can be determined as a secondary heat damage area. The measured geothermal gradients ranged from 2.92 °C/100 m to 2.96 °C/100 m. According to the field investigation, the total heat release of the west mining section is approximately 18,736.6 kW, of which the heat dissipation of the surrounding rock accounts for as much as 50.27%, which is the main type of underground heat damage. In general, the Dahongshan Copper Mine has high air temperature and relative humidity, high original rock temperature, large geothermal gradient, and serious geothermal disasters.

3. Design and Field Test of Mobile Refrigeration System

3.1. The Design Idea of Mobile Refrigeration System

The design idea of the mobile refrigeration system is based on the concept of “on-demand refrigeration,” which is customized and developed for an underground environment. The mobile refrigeration system consists of refrigeration equipment, wind barrier, air pipes, blower, etc.
The refrigeration equipment adopts an integrated design without establishing a base station. It has the characteristics of a small footprint, convenient movement, long air supply distance, low cost of the entire machine, installation maintenance and operation, etc. Simultaneously, special treatment is carried out in terms of dust prevention and corrosion resistance, and the reliability is high. Figure 1 shows the mobile refrigeration equipment. The power of the device is 6.5 kW, and it mainly includes external components, such as cold air outlet joint, return air inlet joint, condenser protective shell, radiator shutter protective shell, and mobile platform.
The refrigeration equipment cooperates with the wind barrier to form a closed space, which can reduce the volume of the cooling space and improve the refrigeration efficiency. In addition, the cold air outlet and return air inlet of the refrigeration equipment are extended to the inside of the cooling space through the air pipes, so as to realize the benign air circulation of the refrigeration equipment. the return air pipe is a flexible pipe that relies on the blower to achieve the return air effect.
The novelty of the mobile refrigeration system proposed in this paper is the application of air pipes and wind barrier. Firstly, setting the return air inlet of the refrigeration equipment in the cooling space by means of connecting the air pipe can effectively reduce the temperature of the return air, so that the refrigeration equipment can operate normally in a high temperature environment. Secondly, form a closed target cooling space by setting wind barrier can effectively prevent the heat dissipation of the refrigeration equipment from entering the target cooling space, preventing the cold air from diffusing outward and achieve the purpose of blocking the heat dissipation. After installing the wind barrier at a position 5 m away from the working face, the ambient temperature after 1 h of starting the equipment was obtained, as shown in Figure 2 (the temperature measurement points in the figure were distributed on the centerline of the drift and 1.6 m away from the bottom plate). The ambient temperature changed abruptly before and after the wind barrier, and the temperature difference on both sides of the wind barrier reached 4 °C.
The setting of the wind barrier in the test site is not to completely close the entire drift section but to set the hanging position at the waist height of the three-core arch, and there is still space above the waist height to facilitate the airflow in the working face area. Moreover, the wind barrier setting plan is applied to rock drilling, prizing flexible rock, drift support and other processes, but not to processes such as blasting and slag-out production that are prone to dust and gun smoke. Therefore, problems such as the backflow of sewage and the accumulation of toxic and harmful gases are not considered.

3.2. Field Test

3.2.1. Field Test Environment and Process

The exploration crosscut of No. 132 line at the 140 m level in the west ore section was selected as the test site. According to field measurements, there were four types of heat sources in the test area, namely, heat dissipation from surrounding rocks, heat dissipation from water on the drift and the water in the drilling hole, heat dissipation from local fan air and heat dissipation of refrigeration equipment. The temperature measurements of various heat sources at the test site were shown in Table 1.
According to the design idea of mobile refrigeration system, the test site was set up as shown in Figure 3 and Figure 4, in which the drilling hole was located near the measuring point P32. The test process was shown in the Figure 5.

3.2.2. Result Analysis

It can be seen from Figure 6 that the wet bulb temperature at the measuring point P42 (the center of the drift) decreased with time, the overall cooling range was 3.68 °C, and the cooling rate was 1.84 °C/h. After 100 min of starting up the equipment, the wet bulb temperature of the measuring point P42 dropped below 30 °C, which was in line with the Safety Regulations for Metal and Non-Metallic Mines (GB16423-2020). This showed that the mobile refrigeration system could effectively reduce the wet-bulb temperature of the working face under the test conditions so that it can meet the environmental requirements of underground operations.

4. Numerical Model Establishment and Validation

The field test results confirmed that by setting up wind barrier and installing air pipes, the cooling target of the high-temperature working face could be achieved. To understand the cooling effect under different parameters of the mobile refrigeration system, with the help of ANSYS FLUENT software, parameter optimization of the mobile refrigeration system was carried out using the numerical calculation method.

4.1. Creation of Geometric Models

A geometric model was established according to the test conditions described above, as shown in Figure 7. To facilitate the modeling, the model was appropriately simplified without affecting the air flow in the test area. The cold air outlet and return air inlet of the refrigeration equipment were treated as the inlet and outlet of the model, respectively. The cross-sectional size of the driving dirft was 4 × 3.4 m. The length of the drift was 20 m. The diameters of the press-in fan duct outlet, cold air outlet, and return air inlet were all 300 mm, and the distances from the three to the working face were 10, 5, and 3 m, respectively. The size of the wind barrier was 3.2 × 2 m, 5 m away from the working face. The other parameter settings were consistent with those of the test site.

4.2. Mesh Division and Quality Evaluation

Skewness was used to evaluate the grid quality. Skewness is used to judge whether the mesh shape is close to the ideal state. When it is close to 0, it means that the mesh shape is closer to the ideal state. In general, for 3D analysis problems, the skewness of most meshes must be less than 0.5, and the skewness of the largest meshes should be less than 0.94. The average grid skewness of the model used in this simulation was 0.21454, and the maximum grid skewness was 0.84747. It can be observed that the grid quality was good, which ensured the accuracy of the analysis results.

4.3. Model Settings

Air in mines can be considered incompressible fluid. The pressure-based solver is suitable for low-velocity incompressible fluid solutions, and the realizable k-e turbulence model can better simulate the circular hole jet problem. Therefore, in this paper, the pressure-based steady-state solver and the realizable k-e turbulence model were used to solve the energy equation and realize the numerical solution.

4.4. Model Parameter Settings

4.4.1. Entry and Exit Boundary Conditions

Three inlet boundaries were set in the model: the inlet of the press-in fan duct, outlet of the cold air pipe of the refrigeration equipment (the inlet for the target cooling space), and outlet of the radiator of the refrigeration equipment (the inlet for the non-target cooling space). Two outlet boundaries were set: the inlet of the return air pipe of the refrigeration equipment (the outlet for the target cooling space) and the outlet of the drift.
The boundary conditions of each inlet and outlet were set according to the measured data on the test site, as shown in Table 2. For the outlets, the temperature and relative humidity listed in the table represent the return temperature and return relative humidity, respectively.
Table 2. Setting of Boundary Conditions for Each Inlet and Outlet.
LocationBoundary Condition TypeVelocity
m/s
Pressure
Pa
Temperature
°C
Relative Humidity
%
The inlet of press-in fan ductVelocity inlet1635.778.4
Cold air outletVelocity inlet1026.478.3
The outlet of the refrigeration equipment radiatorVelocity inlet6450
The return air inletPressure outlet−8026.8578.3
The outlet of the driftPressure outlet026.8578.4

4.4.2. Wall Boundary Condition

The wall boundary conditions mainly involve the surrounding rock of the drift, walls of the roof and bottom plate, walls of the refrigeration equipment, wall of the drilling hole, walls of the air pipes, and wall of the wind barrier. According to the measurement data of the test site, the specific settings of the boundary conditions of each wall were shown in Table 3.

4.5. Validation of Numerical Models

In order to verify the accuracy and reliability of the model simulation results, according to the position of the temperature measurement points in Figure 3, the measured dry bulb temperature and numerical simulation values of each temperature measurement point at a height of 1.6 m and a height of 0.8 m were obtained, respectively. Table 4 presented the results.
It can be observed from Table 4 that the error between the simulated value and the measured values of most temperature measurement points was not more than 1 °C, and the relative error was within 3%. The average relative error of the measurement points at the height of 1.6 m was 1.75%, and the average relative error of the measurement points at the height of 0.8 m was 2.12%. The reason for this error is that the numerical model is simplified, resulting in an error between the numerical calculation result and the measured value, but the error is small; therefore, the simulation result of the model can be considered reliable.

4.6. Parameter Setting of Mobile Refrigeration System

To analyze the refrigeration effect of the parameters of the mobile refrigeration equipment on the working face, the influence of the refrigeration equipment parameters on the cooling effect was discussed from the perspectives of the air supply volume, air supply temperature, and relative humidity. The specific settings were listed in Table 5.

5. Simulation Results and Discussion

Numerical calculations were performed according to the parameter-setting scheme of mobile refrigeration equipment. The velocity, relative humidity, and wet bulb temperature of each point on the centerline of the target cooling space (1.6 m from the floor) were used as evaluation indicators to analyze the influence of each parameter on the refrigeration effect. In the numerical calculation, it was assumed that the heat dissipation of the equipment under different air supply parameters was consistent with the heat dissipation measured during the test, regardless of the difference in the heat dissipation of the equipment under different powers.

5.1. The Volume of Supply Air

5.1.1. Air Supply Pipe Diameter

From the velocity distribution in Figure 8, the wind velocity more evidently fluctuated near the wind barrier and working face, forming two velocity peaks. This was because in the ventilation mode of the combination of pressure and extraction, the airflow conveyed by the air supply pipe was directly blown to the working face owing to the high wind velocity, and the velocity was reduced along the way owing to the ventilation resistance. Near the working face, a backflow was formed owing to the influence of the negative pressure at the outlet of the return air, which provided circulating air for good operation of the refrigeration equipment.
In general, the closer to the working face, the lower the wind speed. With an increase in the pipe diameter, the speed of each measuring point gradually increases.
Figure 9 shows the wet-bulb temperature distribution. The wet-bulb temperature of each measuring point gradually decreased with an increase in the diameter of the air supply pipe. For convenience, defining the concept of MoM drop describes the decrease in wet bulb temperature when the diameter of the air supply pipe increases by 100 mm. Compared with the air supply diameter of 300 mm, the cumulative drop in the wet-bulb temperature was 3.79 °C when the air supply pipe diameter was 800 mm. Among them, the pipe diameters with a higher MoM drop in wet bulb temperature were 500 mm, 600 mm, and 700 mm, and the drop ratios were 1.10 °C, 1.01 °C, and 0.95 °C, respectively. In addition, it can also be seen from Figure 8 that the cooling effect of the 6 different diameter air pipes could meet the requirement that the wet bulb temperature does not exceed 30 °C. Under the action of a pipe with a diameter of 600 mm and greater, the wet bulb temperature of the target cooling space could be maintained below 27 °C, and continuous operation in the mine could be realized. Considering the cooling effect and engineering practicability, it is more appropriate to select an air pipe with a diameter of 600 mm.

5.1.2. Air Supply Velocity

Figure 10 shows that with an increase in the air supply wind velocity, the wet-bulb temperature decreased, but the decrease range decreased with the increase in wind velocity. When the air supply speed increased from 10 m/s to 12 m/s, the temperature decreased relatively significantly, with an average decrease of 0.25 °C. It can be seen from Figure 11 that the relative humidity at each measuring point gradually increased with an increase in air supply velocity. To satisfy the requirements of continuous operation and minimize the relative humidity of the operating environment, it is more appropriate to set the supply air speed to 12 m/s.

5.2. Temperature of Supply Air

As shown in Figure 12, with an increase in the supply air temperature, the temperature of the measuring point on the centerline of the drift increased. For every 2 °C decrease in air supply temperature, the temperature drop of each point on the drift centerline was basically the same, and the wet bulb temperature dropped by 0.9 °C on average, which shows that reducing air supply temperature has a significant equal proportion cooling effect on reducing the airflow temperature of working face. In addition, the closer the measuring point was to the working face, the lower the temperature.
From the distribution of relative humidity in Figure 13, with a decrease in air supply temperature, the relative humidity of the airflow at each point on the centerline of the drift increased correspondingly, and the distance between each curve gradually increased with a decrease in the supply air temperature. This is because the saturated partial pressure of water vapor decreases with a decrease in the air flow dry-bulb temperature, and the two show a polynomial relationship (obtained by fitting). As the air supply temperature decreases at equal amplitudes, the dry bulb temperature of the air flow in the drift decreases at the same amplitude; thus, the saturation partial pressure of the air flow in the drift decreases. Therefore, the lower the air supply temperature, the smaller the saturated partial pressure of water vapor and saturated moisture content of air flow in the drift. Namely, the ability of air flow to absorb moisture or dry is reduced, which leads to an increase in relative humidity. And with an equal reduction in air supply temperature, the increase in relative humidity is increasing.

5.3. Relative Humidity of Supply Air

It can be seen from Figure 14 and Figure 15 that with the decrease in supply air humidity, the wet bulb temperature and relative humidity of each measuring point on the drift centerline decreased. As the supply air humidity decreased by equal magnitudes, the wet-bulb temperature and relative humidity also decreased by equal magnitudes. When the supply air humidity decreased by 10%, the average decrease in wet bulb temperature and relative humidity was 0.76 °C and 4.38%, respectively. The closer to the working face, the greater the distance between adjacent curves., It meant that the closer to the working face, the greater the contribution of the reduction in the relative humidity of the supply air to the reduction of the wet-bulb temperature and relative humidity of the measurement point on the drift centerline.

5.4. Costs of the Application of Mobile Refrigeration System

The cost of the mobile refrigeration system is mainly calculated from the perspective of equipment operation. The power of the refrigeration equipment is 6.5 kw, and the power of the blower in Figure 3 is 1.5 kw. The price of electricity used in mine production is 0.5 RMB/kW·h. Then the mobile refrigeration system costs 4 RMB per hour of operation. According to the above results, the electricity cost generated by the continuous operation of the mobile refrigeration system for one year is 35,040 RMB. Overall, the operating cost of the refrigeration system is lower.

6. Conclusions

(1)
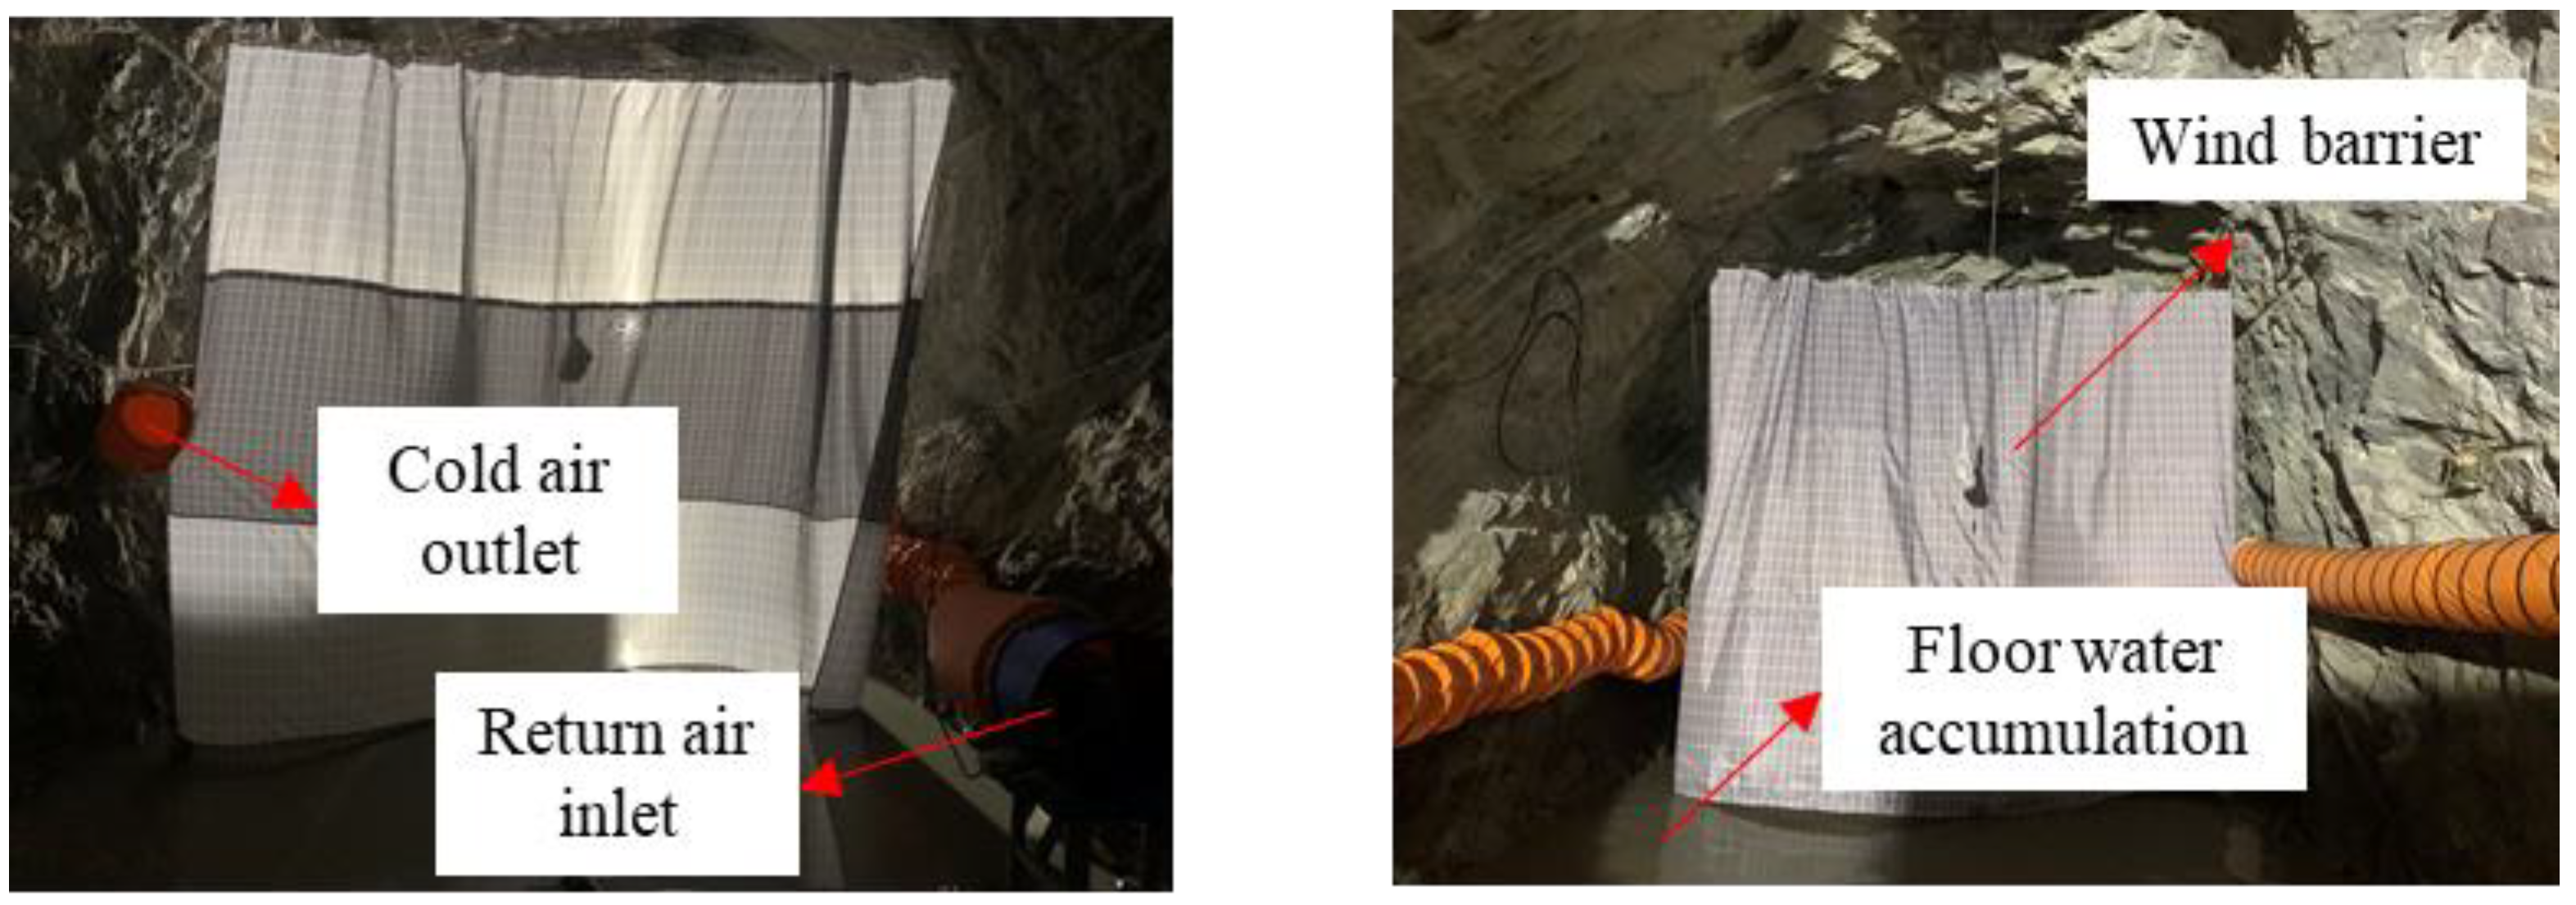
A mobile refrigeration system was developed to reduce the temperature of the high-temperature working face. The mobile refrigeration system consists of refrigeration equipment, wind barrier, air pipes, blower, etc.
(2)
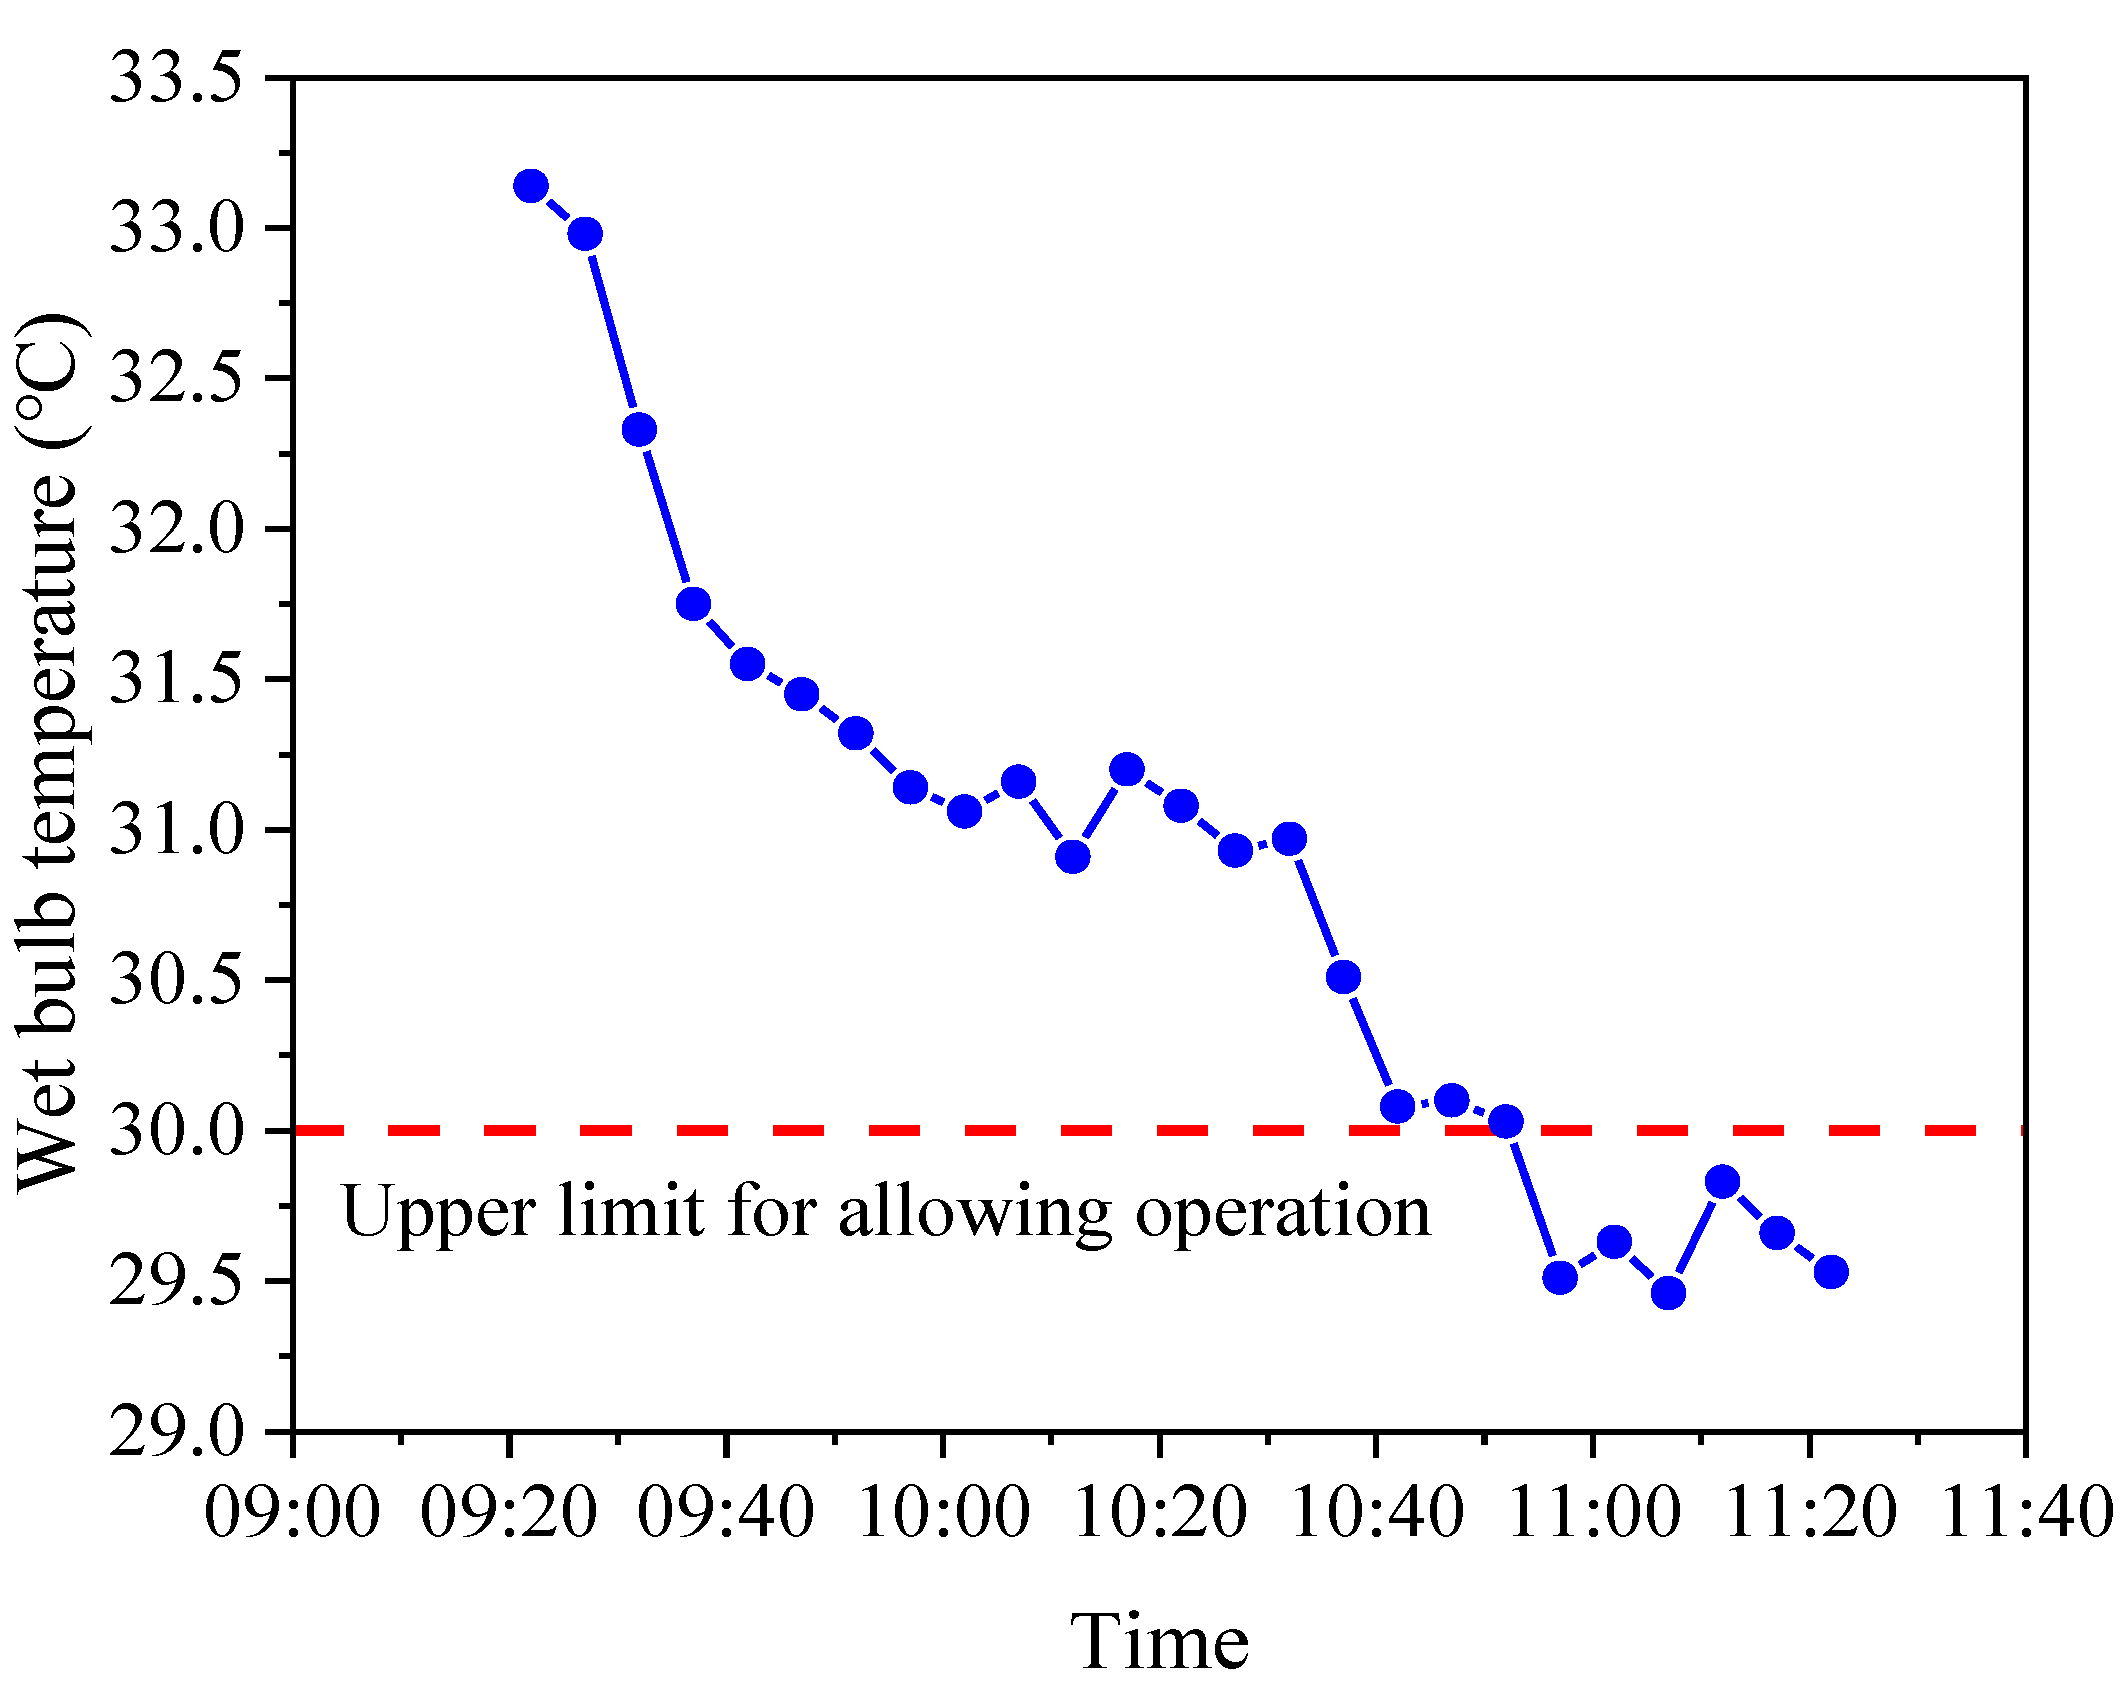
The field cooling test of the mobile refrigeration system was carried out in the exploration crosscut of No. 132 line at the 140 m level in the west ore section of Dahongshan Copper Mine in Yunnan. The test results showed that the wet bulb temperature of the target refrigeration space could be reduced to below 30 °C, which is in line with the relevant regulations of “Safety Regulations for Metal and Non-Metallic Mines” (GB 16423-2020), indicating that the mobile refrigeration system can effectively reduce the temperature of the working face.
(3)
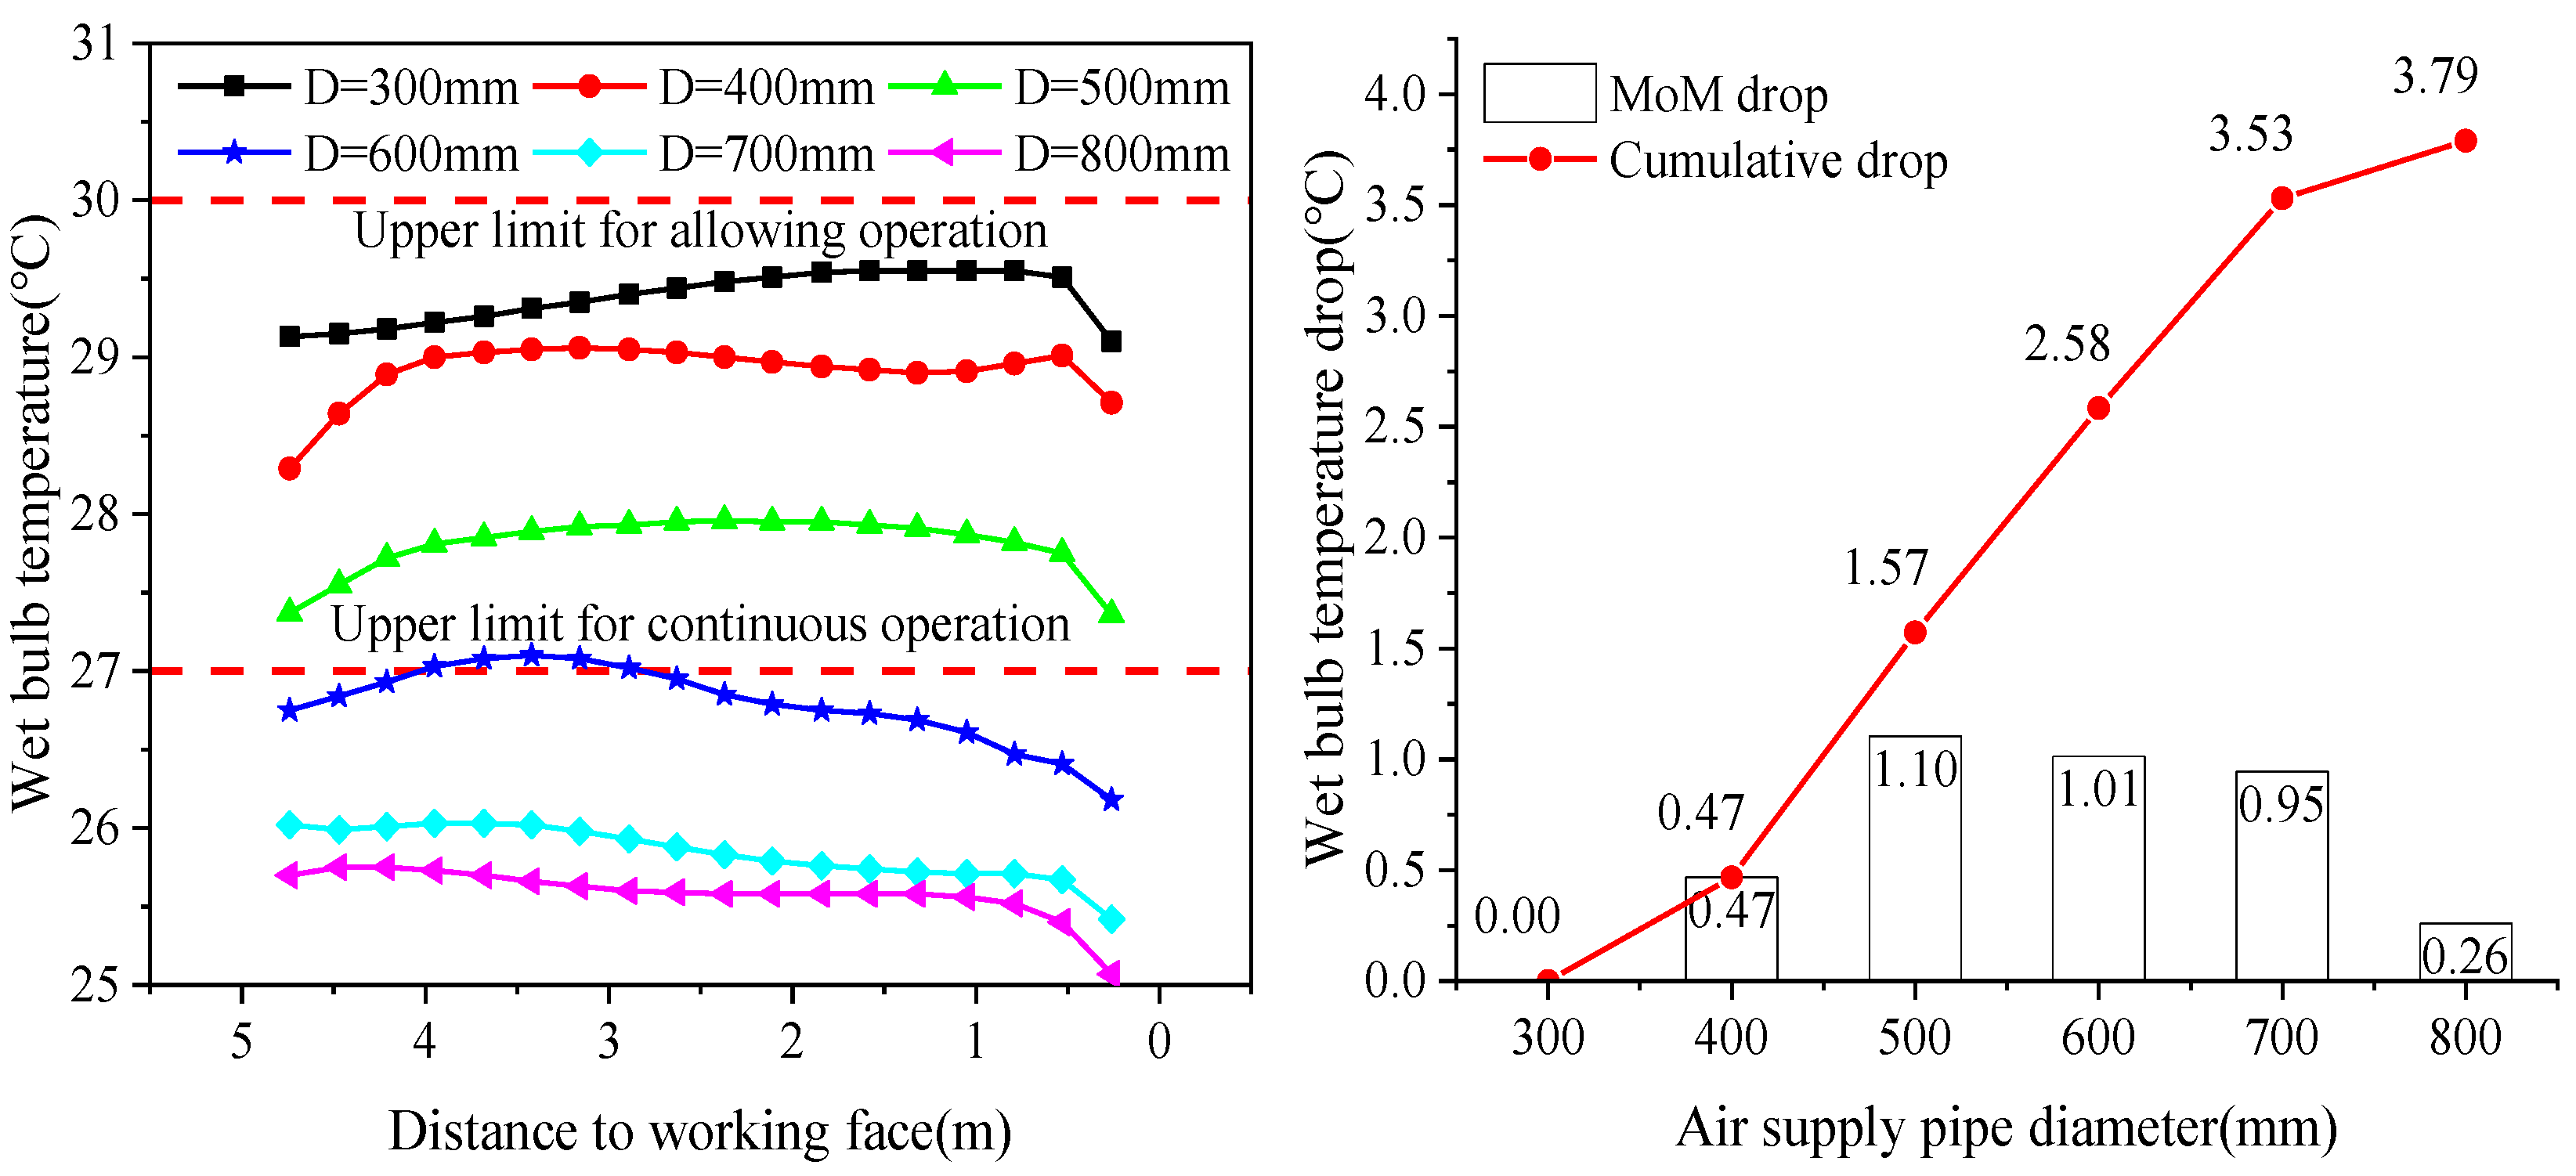
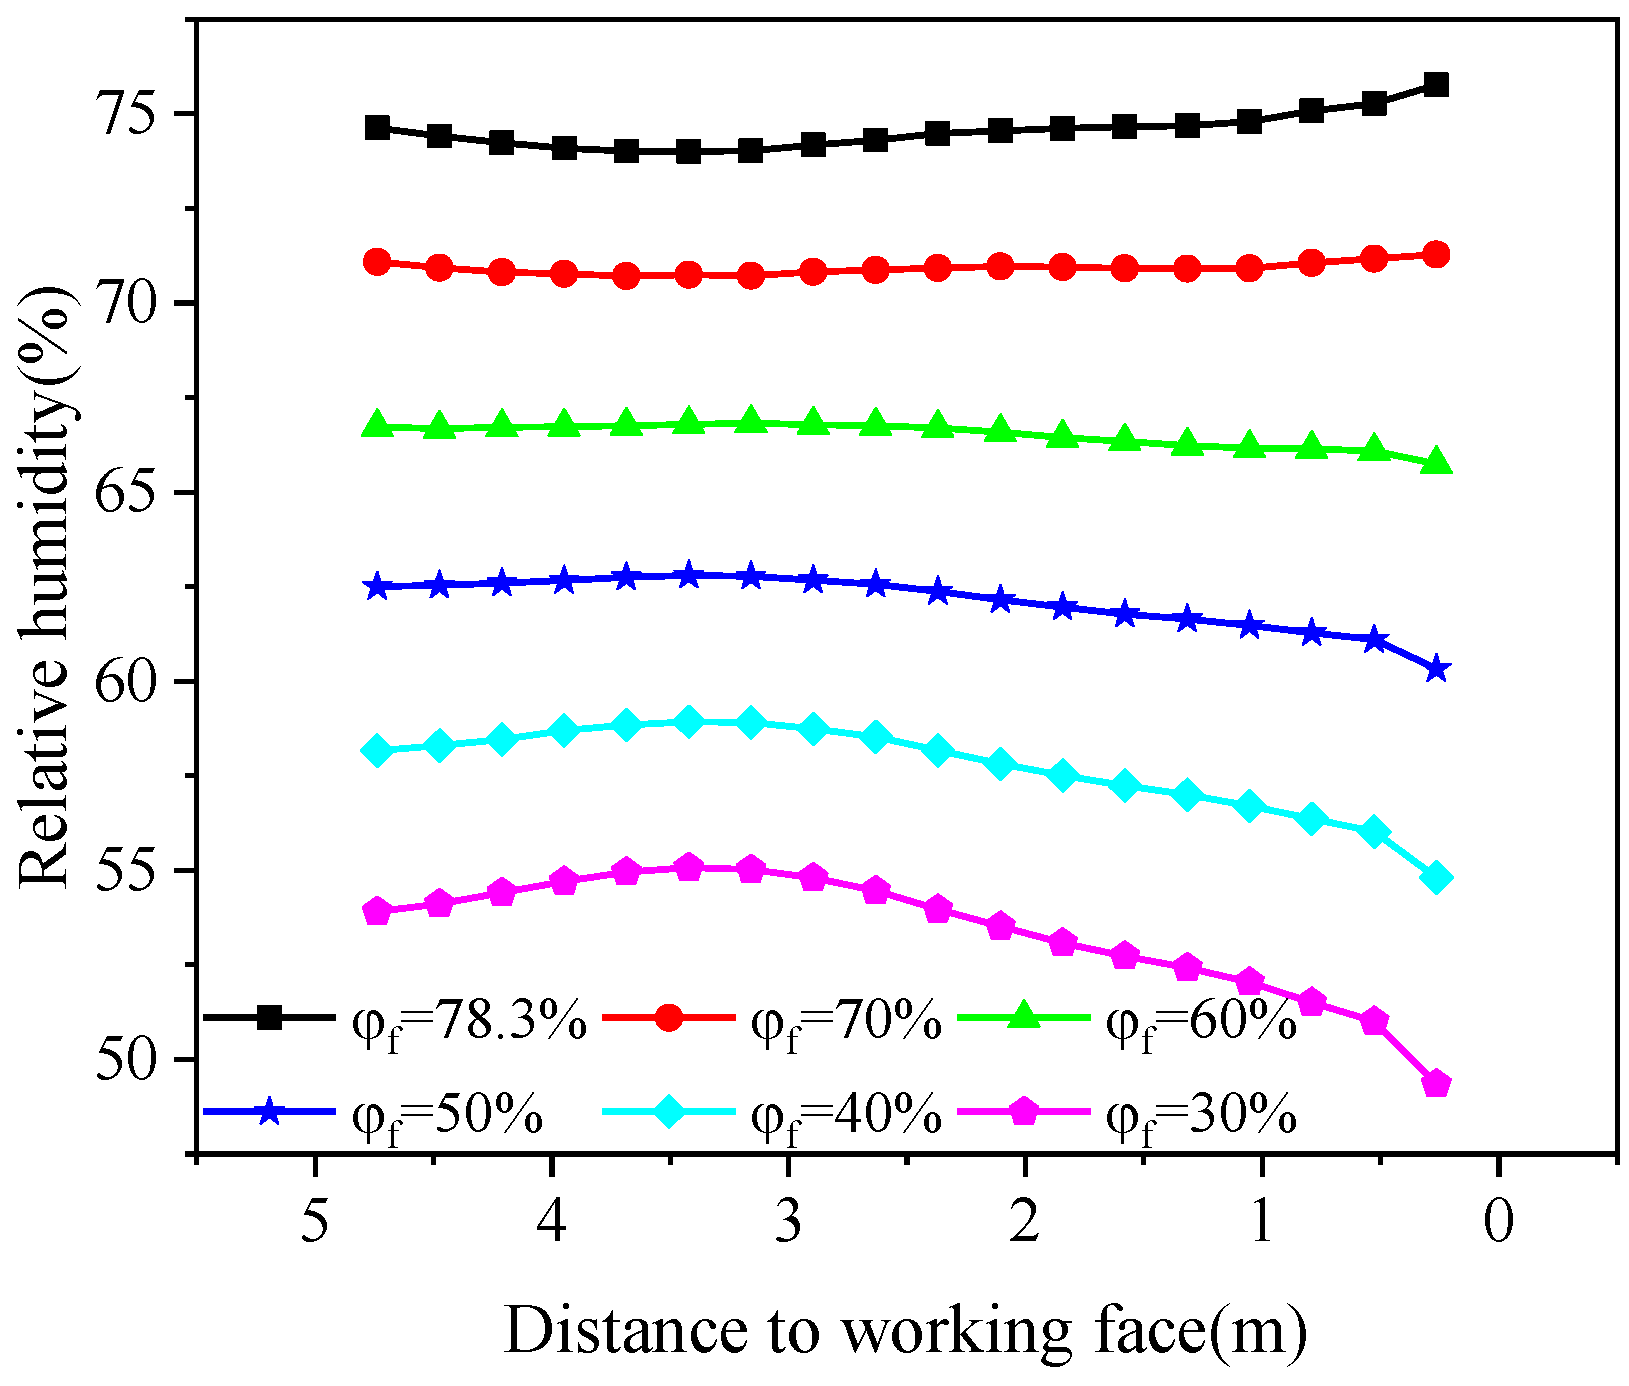
The influence of the parameters of the mobile refrigeration equipment on the refrigeration effect was analyzed. The results showed that the diameter of the air supply pipe was 600 mm and the air supply speed was 12 m/s, which could significantly reduce the temperature of the target cooling space, and the temperature of the working face could meet the requirements of continuous operation. Reducing the air supply temperature had a significant proportional cooling effect on reducing the airflow temperature of the working face. The average temperature of the supply air decreases by 2 °C, and the wet bulb temperature decreases by an average of 0.9 °C. Reducing the air supply humidity had a significant influence on reducing the wet-bulb temperature and relative humidity of the wind flow at the working face. For every 10% decrease in the air supply humidity, the wet-bulb temperature and relative humidity were reduced by an average of 0.76 °C and 4.38%, respectively.

Author Contributions

Conceptualization, methodology, J.L. and X.Y.; software, data curation, writing—original draft preparation, formal analysis, X.Y.; investigation, resources, C.H.; writing—review and editing, supervision, J.L. and K.Z. All authors have read and agreed to the published version of the manuscript.

Funding

This research was funded by the Fundamental Research Funds for the Central Universities of Central South University, grant number 2020zzts721 and Yunnan Province Science and Technology Talent and Platform Program (Academician Expert Workstation), grant number 202205AF150073 and the Natural Science Foundation of Hunan Province, China, grant number 2020JJ4712.

Institutional Review Board Statement

Not applicable.

Informed Consent Statement

Not applicable.

Data Availability Statement

Not applicable.

Conflicts of Interest

The authors declare no conflict of interest.

References

  1. Shahzad, M.W.; Burhan, M.; Ang, L.; Ng, K.C. Energy-water-environment nexus underpinning future desalination sustainability. Desalination 2017, 417, 52–64. [Google Scholar] [CrossRef]
  2. Ranjith, P.G.; Zhao, J.; Ju, M.H.; De Silva, R.V.S.; Rathnaweera, T.D.; Bandara, A.K.M.S. Opportunities and Challenges in Deep Mining: A Brief Review. Engineering 2017, 3, 546–551. [Google Scholar] [CrossRef]
  3. Ranjan, A.; Zhao, Y.X.; Sahu, H.B.; Misra, P. Opportunities and Challenges in Health Sensing for Extreme Industrial Environment: Perspectives from Underground Mines. IEEE Access 2019, 7, 139181–139195. [Google Scholar] [CrossRef]
  4. Henriques, V.; Malekian, R. Mine Safety System Using Wireless Sensor Network. IEEE Access 2016, 4, 3511–3521. [Google Scholar] [CrossRef]
  5. Wang, J.Z.; Du, C.F.; Wang, Y. Study on the Influence of Ventilation Parameters on the Airflow Temperature in Excavation Roadway and Ventilation Duct. Case Stud. Therm. Eng. 2021, 28, 101387. [Google Scholar] [CrossRef]
  6. Belle, B.; Biffi, M. Cooling Pathways for Deep Australian Longwall Coal Mines of the Future. Int. J. Min. Sci. Technol. 2018, 28, 865–875. [Google Scholar] [CrossRef]
  7. Drenda, J.; Pach, G.; Rozanski, Z.; Wrona, P.; Sułkowski, J. Safe Working Conditions in Hot Mine Environment—The Analysis of Different Indices. Arch. Min. Sci. 2018, 63, 111–124. [Google Scholar]
  8. Drenda, J.; Sulkowski, J.; Pach, G.; Różański, Z.; Wrona, P. Two Stage Assessment of Thermal Hazard in An Underground Mine. Arch. Min. Sci. 2016, 61, 309–322. [Google Scholar] [CrossRef] [Green Version]
  9. Dhillon, B.S. Mining Equipment Safety: A Review, Analysis Methods and Improvement Strategies. Int. J. Min. Reclam. Environ. 2009, 23, 168–179. [Google Scholar] [CrossRef]
  10. Wan, Z.J.; Zhang, Y.; Cheng, J.Y.; Zhou, C.B.; Gu, B.; Zhou, P. Mine Geothermal and Heat Hazard Prevention and Control in China. Disaster Adv. 2013, 6, 85–93. [Google Scholar]
  11. Wei, D.Y.; Du, C.F.; Xu, H.Y.; Zhang, L.F. Influencing Factors and Correlation Analysis of Ventilation and Cooling in Deep Excavation Roadway. Case Stud. Therm. Eng. 2019, 14, 100483. [Google Scholar]
  12. Wang, W.H.; Zhang, C.F.; Yang, W.Y.; Xu, H.; Li, S.S.; Li, C.; Ma, H.; Qi, G.S. In Situ Measurements and CFD Numerical Simulations of Thermal Environment in Blind Headings of Underground Mines. Processes 2019, 7, 313. [Google Scholar] [CrossRef] [Green Version]
  13. Zhou, Z.Y.; Cui, Y.M.; Tian, L.; Chen, J.H.; Pan, W.; Yang, S.; Hu, P. Study of the Influence of Ventilation Pipeline Setting on Cooling Effects in High-Temperature Mines. Energies 2019, 12, 4074. [Google Scholar] [CrossRef] [Green Version]
  14. Huang, P.; Huang, W.; Zhang, Y.L.; Tang, S.B. Simulation Study on Sectional Ventilation of Long-Distance High-Temperature Roadway in Mine. Arab. J. Geosci. 2021, 14, 1674. [Google Scholar] [CrossRef]
  15. Nie, X.X.; Wei, X.B.; Li, X.C.; Lu, C.W. Heat Treatment and Ventilation Optimization in a Deep Mine. Adv. Civ. Eng. 2018, 2018, 1529490. [Google Scholar] [CrossRef]
  16. Chen, W.; Liang, S.Q.; Liu, J. Proposed Split-Type Vapor Compression Refrigerator for Heat Hazard Control in Deep Mines. Appl. Therm. Eng. 2016, 105, 425–435. [Google Scholar] [CrossRef]
  17. Zhai, X.W.; Xu, Y.; Yu, Z.J. Design and Performance Simulation of a Novel Liquid CO2 Cycle Refrigeration System for Heat Hazard Control in Coal Mines. J. Therm. Sci. 2019, 28, 585–595. [Google Scholar] [CrossRef]
  18. Zhang, W.; Wang, T.Y.; Zhang, D.S.; Tang, J.J.; Xu, P.; Duan, X. A Comprehensive Set of Cooling Measures for the Overall Control and Reduction of High Temperature-Induced Thermal Damage in Oversize Deep Mines: A Case Study. Sustainability 2020, 12, 2498. [Google Scholar] [CrossRef] [Green Version]
  19. Tu, R.; Huang, L.J.; Jin, A.B.; Zhang, M.F.; Hai, X. Characteristic Studies of Heat Sources and Performance Analysis of Free-Cooling Assisted Air Conditioning and Ventilation Systems for Working Faces of Mineral Mines. Build. Simul. 2021, 14, 1725–1736. [Google Scholar] [CrossRef]
  20. Bornman, W.; Dirker, J.; Arndt, D.C.; Meyer, J.P. Integrated Energy Simulation of a Deep Level Mine Cooling System through a Combination of Forward and First-Principle Models Applied to System-Side Parameters. Appl. Therm. Eng. 2017, 123, 1166–1180. [Google Scholar] [CrossRef] [Green Version]
  21. Crawford, J.A.; Joubert, H.P.R.; Mathews, M.J.; Kleingeld, M. Optimised Dynamic Control Philosophy for Improved Performance of Mine Cooling Systems. Appl. Therm. Eng. 2019, 150, 50–60. [Google Scholar] [CrossRef]
  22. Pretorius, J.G.; Mathews, M.J.; Mare, P.; Kleingeld, M.; Van Rensburg, J. Implementing a DIKW Model on a Deep Mine Cooling System. Int. J. Min. Sci. Technol. 2019, 29, 319–326. [Google Scholar] [CrossRef]
  23. Li, X.; Fu, H.L. Development of an Efficient Cooling Strategy in the Heading Face of Underground Mines. Energies 2020, 13, 1116. [Google Scholar] [CrossRef] [Green Version]
Figure 1. Appearance of refrigeration equipment: (a) front view; (b) rear view.
Energies 15 04035 g001
Figure 2. Temperature change diagram of drift centerline.
Energies 15 04035 g002
Figure 3. Layout of the test site.
Energies 15 04035 g003
Figure 4. Layout of the test site.
Energies 15 04035 g004
Figure 5. Field test process.
Energies 15 04035 g005
Figure 6. Change in wet bulb temperature at measuring point P42.
Energies 15 04035 g006
Figure 7. Geometric model.
Energies 15 04035 g007
Figure 8. The velocity distribution of the working centerline under different air supply pipe.
Energies 15 04035 g008
Figure 9. Wet bulb temperature distribution of drift centerline under different air supply pipe.
Energies 15 04035 g009
Figure 10. Wet bulb temperature distribution of drift centerline under different air supply velocity.
Energies 15 04035 g010
Figure 11. Relative humidity distribution of drift centerline under different air supply velocity.
Energies 15 04035 g011
Figure 12. Wet bulb temperature distribution of drift centerline under different supply air temperatures.
Energies 15 04035 g012
Figure 13. Relative humidity distribution of drift centerline under different supply air temperatures.
Energies 15 04035 g013
Figure 14. Wet bulb temperature distribution of drift centerline under different supply air humidity.
Energies 15 04035 g014
Figure 15. Relative humidity distribution of drift centerline under different supply air humidity.
Energies 15 04035 g015
Table 1. Measured Temperature of Each Heat Source.
Heat.
Source
Surrounding RockAccumulated Water on the DriftFloorWater in the Drilling HoleLocal Fan Air
Measured temperature
(°C)
38.437.242.135.7
37.736.541.835.7
36.734.740.434.9
36.534.740.635.1
36.233.138.735.7
36.435.641.935.6
37.437.941.335.4
37.53641.735.3
37.136.142.435.9
37.1035.7641.2135.5
Table 3. Wall Boundary Condition Settings.
WallThermal Boundary ConditionSetting Temperature
°C
Setting the Wall Moisture Coefficient fRemark
Surrounding rockTemperature370.55f is obtained by comparing the simulated and measured values
RoofTemperature370.55f is obtained by comparing the simulated and measured values
Bottom plateTemperature361Floor covered with water
Refrigeration equipmentTemperature450
DrillingTemperature420
PipeHeat flux00Assuming complete insulation
Wind barrierCoupled
Table 4. Measured Value and Simulated Value of Each Temperature Measuring Point.
Measuring PointSimulated ValuesMeasured ValueRelative ErrorSimulated ValuesMeasured ValueRelative Error
Measuring Height is 1.6 mMeasuring Height is 0.8 m
P1133.4633.91.30%33.3633.71.01%
P1233.48341.53%33.3534.12.20%
P1333.5534.21.90%33.0934.23.25%
P2133.5034.42.62%33.4734.32.42%
P2233.5334.21.96%33.4634.32.45%
P2333.4934.11.79%33.2134.12.61%
P3133.4634.22.16%33.4934.11.79%
P3233.5134.22.02%33.4134.12.02%
P3333.6334.42.24%33.1234.43.72%
P4133.4133.81.15%33.5033.40.30%
P4233.2433.20.12%33.4733.70.68%
P4333.4434.22.22%33.0634.13.05%
average value33.4834.071.75%33.3334.042.12%
Table 5. The Parameter-Setting Scheme of Mobile Refrigeration Equipment.
Simulation IdeasParameter-Setting Scheme
Pipe Diameter
mm
Wind Velocity
m/s
Temperature of the Supply Air
°C
Relative Humidity of the Supply Air
%
Test conditions3001026.478.3
Change volume of the supply airPipe diameter300/400/500
600/700/800
1026.478.3
Wind velocityOptimal diameter10/12/14
16/18/20
26.478.3
Change temperature of the supply airOptimal diameterOptimal velocity26.4/24/22/20/18/1678.3
Change relative humidity of the supply airOptimal diameterOptimal velocity26.478.3/70/60
50/40/30
Publisher’s Note: MDPI stays neutral with regard to jurisdictional claims in published maps and institutional affiliations.

