Article

Structural and Operating Features of the Creation of an Interstate Electric Power Interconnection in North-East Asia with Large-Scale Penetration of Renewables

by
Sergei Podkovalnikov
*,
Lyudmila Chudinova
,
Ivan L. Trofimov
and
Leonid Trofimov
Electric Power Systems Department, Melentiev Energy Systems Institute of Siberian Branch of the Russian Academy of Sciences, Lermontov Str., 130, 664033 Irkutsk, Russia
*
Author to whom correspondence should be addressed.
Energies 2022, 15(10), 3647; https://doi.org/10.3390/en15103647
Submission received: 26 April 2022 / Revised: 13 May 2022 / Accepted: 14 May 2022 / Published: 16 May 2022

Abstract

:
Transition to green energy is the dominant process in the electricity sector globally, including in North-East Asia (NEA). The interstate power grid expansion in the NEA will facilitate the large-scale development of intermittent and uncertain green generation. This paper is aimed at considering the structural and operating features and effectiveness of a potential NEA power grid with large-scale penetration of renewables. A computing and geo-information system provides collection, processing, storage, and geo-visualization of technical and economic data. It incorporates a mathematical model for the optimization of the expansion and operation of power systems. Benefits (including saving the capacity, investment, fuel cost, and total cost) of power interconnection have been estimated in the study. Transfer capability required for the interstate electric ties was calculated and proved quite significant. A tax on greenhouse gases emission from thermal power plants, including carbon dioxide (CO2), has been used in the study as an economic incentive to facilitate the penetration of renewable energy sources in NEA power interconnection. An installed capacity, power generation mix, power exchange among countries, and operating modes (dispatching) have been calculated for different levels of CO2 emission tax. This study has shown the economic viability of the interconnection, defined major indices of interstate transmission grid infrastructure, revealed the changes in the mix of generating capacities and their operation under conditions of large-scale expansion of renewables, and found out the roles of various countries with different levels of CO2 tax, detailed the impact of CO2 emission tax in encouraging capacity additions and power generation growth from renewables. These capacities altogether suppress the expansion of coal-fired power plants in the potential North-East Asia power grid and contribute to achieving Sustainable Development Goals (SDG), particularly SDG 7, to ensure access to affordable, reliable, sustainable, and modern energy for all.

1. Introduction

Electric power integration is a global process that is being implemented through the construction of interstate electric ties (ISETs) and the creation of interstate power grids (ISPGs) [1]. It is consistent with the global trend of a large-scale increase in renewable energy sources (RES). These tendencies are also evident in North-East Asia (NEA).
In contrast to many other sub-regions in Europe, America, Asia, and even Africa, the electric power integration in NEA is in an early stage. There are bilateral intergovernmental energy commissions between separate countries in the NEA region. Russia, Mongolia, and China contact in the power sector on the level of Governmental agreements, bilateral intergovernmental commissions and working groups, industry, and academic representatives. These activities resulted in the construction of interstate transmission lines and power trading in the power sector.
The Economic and Social Commission for Asia and the Pacific serves as the United Nations’ regional hub promoting cooperation among North-East Asia countries to achieve sustainable energy development, a carbon-free future in the region, and others. These goals are particularly planned to be achieved by creating Asian Power Supergrid. Thus, electric power cooperation advances at the higher multilateral NEA-wide level. The prospective interstate power grid in NEA will facilitate the development of renewables as a means to reach sustainable carbon-free development goals.
The research of large-scale penetration of RESs (wind, solar, etc.) in the potential ISPG in NEA with optimization of their capacity and power concurrently with optimization of those for traditional power plants (thermal, nuclear, hydro) and transfer capability of interstate (intersystem) electric ties is presented in the paper.
As a methodology for the study, the authors compare the base case scenario (with no ISETs) with the ISPG creation scenario and estimate its benefits (described in chapter 3 below). A tax on CO2 emissions was used as a mechanism to stimulate the expansion of renewable (along with other carbon-free and low-carbon) power sources. The capacity, investment, fuel cost, and the total costs saving benefits to be gained from sub-regional power interconnection were calculated. Presented research continues and develops previous studies by the authors, including but not limited to [2,3,4,5,6]. The Computing and Geo-Information System (CGIS) is used with the optimization model as a research tool developed by the authors.
The study results showed that renewable energy sources, along with other free- and low-carbon generating capacities, could play a crucial part in potential electricity generation and installed capacity mix and in meeting consumer power loads of North-East Asia. The NEA ISPG, being more significant and more flexible than separate (not interconnected) national electric power systems, will facilitate complete utilization of renewables and, thus, will contribute to creating an environmentally friendly and effective electric power sector.
The research value of this study lies in the optimization of generating capacity and power mix and operating modes of ISPG in the NEA region with large-scale penetration of renewables due to the introduction of CO2 taxes. The different scenarios of NEA ISPG expansion, considering a wide range of levels of CO2 taxes, have been considered to envisage a sustainable carbon-free path of development for a future NEA electric power.
The organization of the paper is as follows. The first is the introduction section. It is followed by the literature review section, where the authors review the existing studies and show the significance and contribution of the proposed research. The third section presents the Computing and Geo-Information System as a research tool developed by the authors, which includes a mathematical model CANOE for optimization of expansion of generating and transmitting capacity and operating modes of power plants and transmission lines. The fourth section describes the assumptions made in the study, basic methodology, and input data. The fifth section provides the results, detailed analysis, and discussion. Conclusions summarize the conducted study.

2. Literature Review

Studies covering primarily technical and economic aspects of interstate power interconnection projects in NEA, including reliability, interstate transmission infrastructure, security, economic feasibility, costs, benefits, and others, are concisely presented below.
The study [2] outlines the potential scheme of ISETs in the northern Pacific region, particularly in North-East Asia, and explains capacity benefits gained from the interconnection of electric power systems (EPSs) with seasonally different annual load maxima (which is typical of the region), and considers costs, benefits, and reliability of some ISETs in this region. The economic viability of “Russia-Japan” and “Russia-China-Korea” potential ISETs is shown.
The studies [3,4] analyze the expansion of ISETs and creation of ISPGs; develop a methodology for assessing the economic viability of a power system interconnection; consider benefits from power system interconnection; and discuss natural, climatic, social, political, and economic features of NEA region, which are crucial for assessing the power system interconnection benefits and investigating the economic viability of ISETs connecting Russia with NEA countries.
The studies rely on the forerunner of the CANOE (Capacity and Network Operation and Expansion) optimization mathematical model presented below. In contrast to the current version of the CANOE model optimizing the expansion and operation of electric power systems for various types of traditional and unconventional generation capacities, it does not optimize renewable energy sources.
The article [7] deals with reliability issues of power system interconnection. It aims to calculate tie-line capacity for potential interconnection of power systems of South Korea, North Korea, and the Far East of Russia based on probabilistic reliability assessment. The reliability assessment program, named NEAREL, based on the tie line constrained equivalent assisting generator model, was used to determine the reasonable capacity of tie lines. An interconnection scenario of the power systems of three countries in North-East Asia is introduced. The reasonable capacities of the tie line for the interconnection scenario are determined by using the developed tool.
The article [8] considers potential interstate transmission infrastructure between South Korea, North Korea, and Russia, including transfer capability, feasible power exchange, cost, and economic benefit. The feasible interconnection scenario in technical, economic, and marketable viewpoints is proposed. It provides sizeable economic benefits and also contributes to the achievement of peace in this region.
The study [9] presents the results of an economic viability study of NEA power system interconnection comprising South Korea, North Korea, the Russian Far East, and East Siberia. The economic benefit gained from the interconnection is determined as the difference between the total cost for the interconnected EPSs (including investment, operation, and maintenance costs) and the total cost of EPSs without interconnection. The study employed a dedicated optimization mathematical tool. The obtained results showed that power system interconnection brings about substantial economic benefits. The noted above forerunner of the CANOE optimization mathematical model was used for the study.
The study [10] analyses energy security risks induced by cross-border trade from the viewpoint of Japan. The scenario suggesting Japan imports electricity from Russia is investigated. The method of assessing the interdependence between importing and exporting countries considers the worst-case scenarios. If Japan maintains its current capacity reserves, a demand response mechanism, and follows appropriate risk reduction strategies, there will be no electricity shortage in the country. The article proves that the Asian Super Grid project will not pose significant risks to Japan’s energy security.
Optimization studies of the prospects for the formation of an ISPG in the NEA region have been carried out in the article [5]. The expected power-economic benefits from the creation of NEA ISPG are determined, and the effectiveness of the ISPG is shown in general. The role of Russia in the framework of the NEA ISPG is presented. Russia’s contribution to the formation of integration benefits is given, and the modes of its power exchanges with neighboring countries in NEA are determined. Again, the above forerunner of the CANOE optimization mathematical model was used for the study.
A quantitative analysis of the opportunities and challenges of electric power grid interconnections in North-East Asia is conducted in [11]. A dedicated optimization model was developed to quantify the potential economic and environmental benefits of connecting power grids and developing renewables in NEA. As evidenced by the research, the scenarios of increased access to renewables significantly contribute to emission reductions and fuel cost savings compared to a “no grid extension” scenario. However, the results imply modest benefits in lowering total cost because of the significant initial investments needed in developing the renewables and the transmission lines. The results also suggest that grid interconnections become more economically attractive in higher fuel prices or lower initial cost cases. The model has nodes (representing Russia and Mongolia) without consumer electric loads and with only generating facilities to supply power for export. This simplifies the real conditions.
The article [12] quantifies the benefits of interconnections in the NEA region, suggests cost-benefit allocation techniques, and analyses the stability of the allocations, which is a crucial aspect in the regions where coordination and mutual trust between countries have not been built yet. The findings indicate that the grand coalition (i.e., the scenario where all countries agree on the cooperation) is a stable coalition that provides significant cost savings. In addition, a scheme of investment allocation and payments between the North-East Asian countries is suggested. The mathematical model used for the study does not optimize the expansion of generating capacities.
The article [13] addresses the development of the energy sector and power industry in North-East Asia in the medium and long term according to the large-scale clean energy development scenario. The Global Energy Interconnection comprehensive study platform for energy and power analysis was used for the study. The construction of multi-directional cross-border transmission channels for clean electricity transmission to NEA load centers in multiple directions is proposed. A “three-ring and one-line” power interconnection pattern is suggested to be formed by 2050 within NEA ISPG. This interconnection mainly includes five corridors, including Mongolia–China–South Korea–Japan, China–Russia, Russia–Japan, China–North Korea–South Korea, and Russia–North Korea–South Korea. In the north, these corridors will connect the hydropower of the Russian Far East and the wind power in Okhotsk Sea and Sakhalin; in the west, they will connect the wind power in North and North-East China, as well as the solar and wind power in Mongolia. They will also connect the load centers in North China, South Korea, and Japan.
The study [14] shows that the NEA countries gain the following economic benefits from participation in sub-regional ISPG development. First, it is higher gross domestic product growth compared to the base-case scenario (absence of ISPG). Second, it is an increase in overall investment in NEA at the cost of investment in ISPG expansion. Sectors that are investment-oriented and upstream of the NEA ISPG development, such as construction, iron, and steel production also expand. Third, countries that export renewable power benefit from expanding clean power production. Then, electricity importing NEA countries (namely, primary electricity users, such as households, and their upstream sectors, such as the service sector, etc.) benefit from cheaper electricity prices. At last, NEA ISPG development displaces fossil fuel use and contributes to carbon dioxide emission mitigation.
The next studies consider the market, organizational and institutional issues of future power system interconnection in the sub-region of North-East Asia [14,15,16,17,18].
The study [15] was conducted to examine concepts of benefits and relevant policy issues associated with cross-border power interconnection potential in the Asia Pacific Economic Cooperation (APEC) region and to identify relevant issues and propose policy recommendations. Different potential benefits resulting from power interconnection in the APEC region are analyzed. They include the mutual complementarity of energy resources and power markets, sharing of supply sources or reserves, reducing the cost of power sources, and enhancing system security. Potential impediments of power system interconnection are considered. They comprise institutional barriers, availability of financial resources, supply security concerns, political uncertainty, etc.
The study [16] states that one of the major obstacles in the way of North-East Asian cooperation in electricity sector development is the lack of a trade agreement or convention, binding all six countries of the region. In addition, there is no trade organization of which all six countries are members, such as APEC. Elaboration of Statement of Principles for Electric Power Trade between the six nations, followed by a document such as a North-East Asian Energy Charter would be a reasonable way to materialize electric power cooperation in the NEA sub-region. However, this process may evolve differently and be lengthy.
The article [17] assesses energy market integration in East Asia. Bilateral energy diplomacies, new trilateral institutions, and intense power competition co-exist there. The institutional structure allows for stepwise, technical infrastructure integration. The environmental management institution co-exists with energy security and development objectives supporting green energy cooperation. The overall structure of the institutions constrains deeper energy market integration.
As stated in the article [18], electric power cooperation in NEA proceeds based mainly on bilateral intergovernmental and inter-company agreements. Multilateral cooperation in the sub-region is just emerging. As the world experience witnesses, electric power cooperation succeeds when special multilateral intergovernmental bodies promote interstate power cooperation. Such a body needs to be established in North-East Asia to make NEA-wide electric power cooperation more intensive to promote and develop ISPG in the sub-region.
The study [19] states that establishing a multinational body that focuses on power grid connectivity is an important task because it can help build consensus among stakeholders and initiate the process of working together on the power system interconnection in NEA. The power system integration process will support the development of a secure, sustainable, and affordable interstate power grid in North-East Asia.
In the context of the Paris agreement requirements on the constraint of carbon dioxide (CO2) emissions and other greenhouse gases [20], studies of environmental aspects of NEA ISPG formation become crucial. Expansion of environmentally friendly RESs into future NEA power interconnection will meet Paris agreement requirements.
The next group of studies deals with the research of ISPG in NEA considering environmental issues and renewables development [21,22,23,24,25].
The article [20] presents an analytical study of environmental aspects, both globally and locally, of electricity grid interconnection in NEA in terms of air quality, social, and health benefits. The study of an “idealized” ISPG in the NEA sub-region based entirely on environmentally friendly carbon-free and low-carbon energy sources (including wind, solar, hydro, biomass, wastes, and gas) was performed by [22]. The study argues that such a system may be cost-effective compared to nuclear energy and carbon capture and storage alternatives. A linear optimization mathematical model was developed and used for the study. This model considers a wide range of renewable energy generation and storage technologies. Russia, with its substantial renewable energy resources potential, however, was not considered. The research on the feasibility of transition from the current state of the power system in North-East Asia to the state of its net-zero greenhouse gas emission was presented in the paper [23]. The results of the study show that the transition can be accomplished, and a totally renewable power system is both technically feasible and economically viable in North-East Asia. Solar photovoltaic will become a major power generating source in North-East Asia, and wind energy will supplement it. Decarbonization can be achieved in NEA by 2045.
The study [24] is a development of the research of [10] with an emphasis on renewable energy and environmental issues. The simulation results show that the expansion of the large-scale renewables in Mongolia contributes significantly to CO2 emission reduction in NEA. However, huge investments would be required for the massive renewables and cross-boundary transmission facilities, driving the cost of electricity up.
The research [25] aims to promote the creation of the renewable energy market in NEA and associated investments in renewable generation capacity there. It recommends that the development of renewable energy sources should be at the center of the agenda for NEA power interconnection creation. It is stated that the cornerstone of NEA ISPG and the market is the trading in renewable energy, as opposed to the simple trading in energy. Other recommendations include the necessity of political support of NEA interconnection, the development of new institutions to match the specific needs of the region, etc.
The above literature review indicates that many studies considering different aspects of the creation of NEA ISETs and ISPG have been conducted. Nevertheless, research in this field is still topical, since the ISPG formation in NEA draws the attention of scientists, engineers, economists, politicians, and the public in various aspects, and some of these aspects need further scrutiny. In particular, the large-scale development of renewable energy, which is now considered a path to a carbon-free future, dramatically affects the volumes and mix of different types of commissioned generating capacities and electricity generation, transmission infrastructure expansion, operating modes (dispatching) of power plants and power flows between power systems/countries, volumes, and modes of electricity export/import, cost, and benefits. These issues need to be carefully studied.
Table 1 shows the optimization models used for the studies of the prospective Northeast Asia ISPG expansion.
The analysis of the models described above shows that the required model should optimize the installed capacity and power generation mix and operating modes of EPSs with large-scale penetration of renewables in seasonal, weekly, daily, and hourly slices, while simultaneously considering the load flows through interstate/intersystem electrical ties. A wider range of options for EPSs expansion and operation should be considered in the model. It makes the study more accurate and realistic. Such kind of optimization tool is presented below.

3. Modeling System and Research Tool

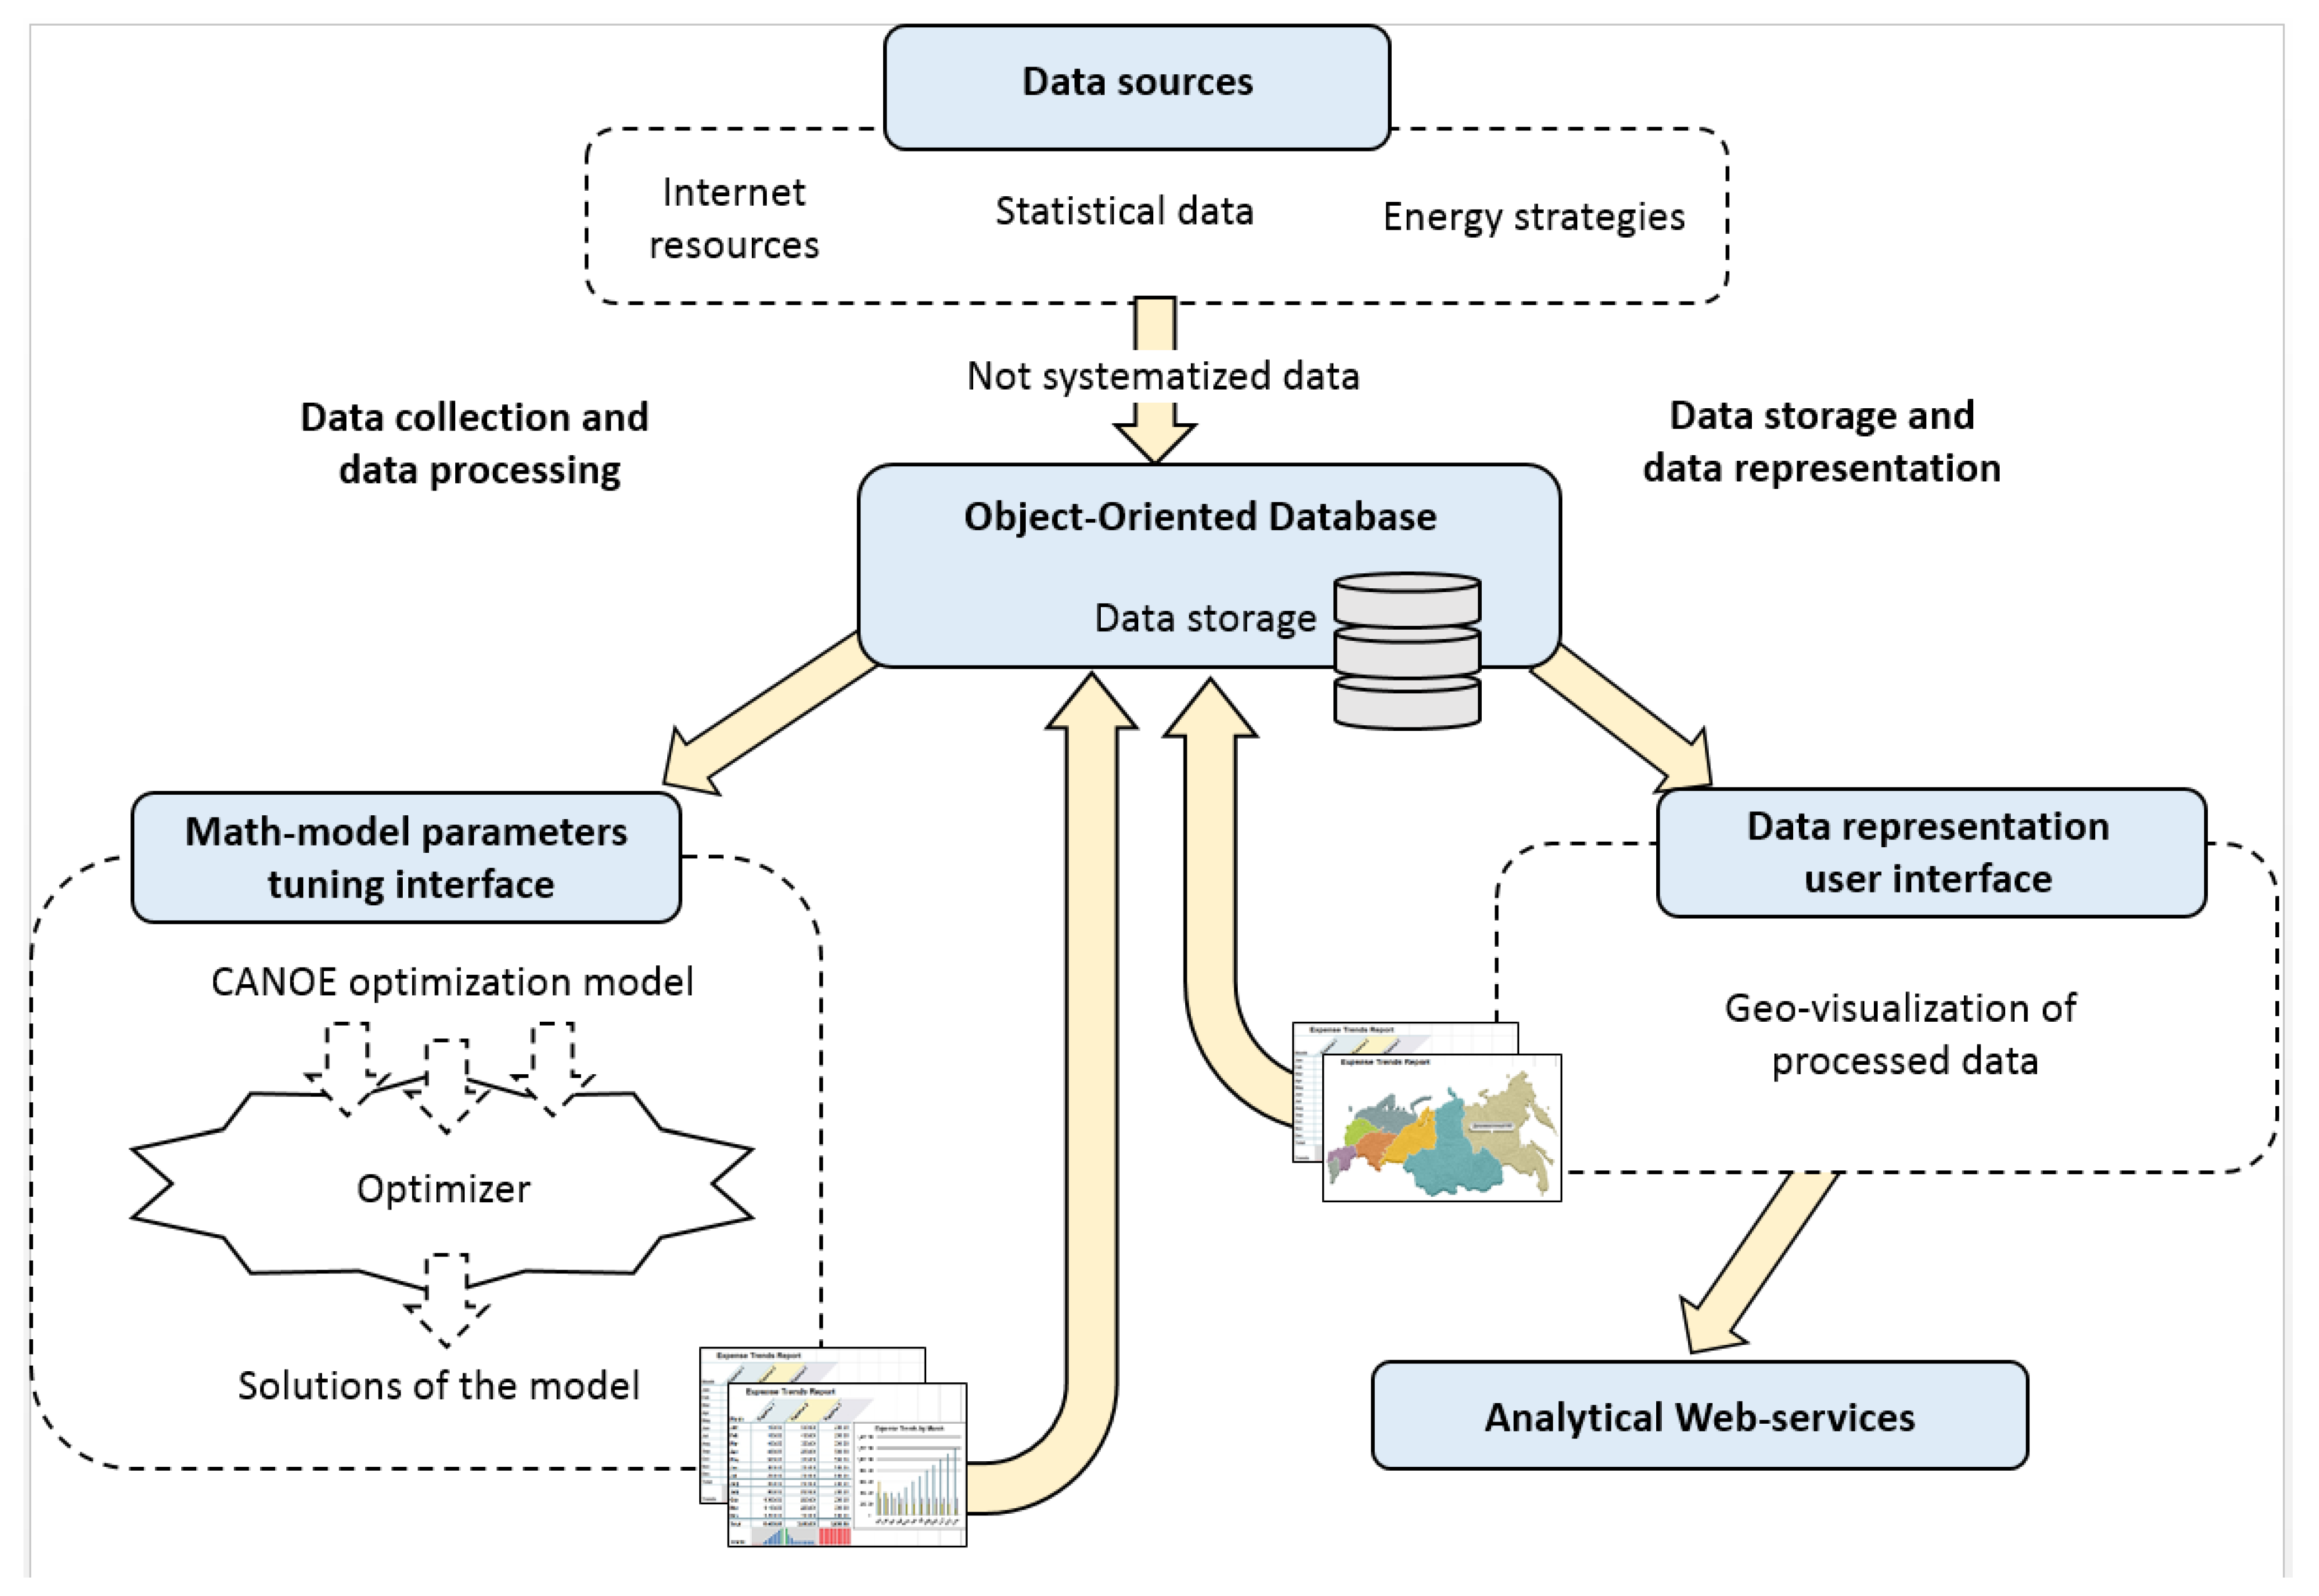
3.1. The Computing and Geo-Information System. Structure and Functions

The Computing and Geo-Information System was developed by the authors and used for the study. The CGIS integrates both computing and informational components in one software product [26,27]. The kernel of CGIS is the CANOE mathematical model for comprehensive optimization of prospective expansion and operating modes (dispatching) of electric power systems and interconnections are given the set of constraints on expansion and operation of generating capacities and transmission lines, hydropower resources and capacity, and actual power balance equations.
The Computing and Geo-Information System consists of several functional parts (software modules): a graphic module for visual analysis of processed data, a geo-information and cartographic module, and a module for working with the CANOE model, see Figure 1.
Each module of CGIS is intended to solve specific problems. They can be divided into three groups:
  • Optimization and computing problems:
    • assessment of technical feasibility and economic viability of intersystem and interstate electric ties;
    • assessment of technical feasibility and economic viability of power interconnections (grids);
    • optimization of electricity generation and transmission capacities and operating modes of electric power systems;
    • study of EPSs and interconnections expansion in different territories.
  • Information-analytical problems:
    • storage of energy and power data collected from various sources in a uniform structure;
    • data analysis over various periods to reveal trends of electric power industry development;
    • graphic and cartographic data representation–atlas geo-information mapping.
  • Coverage of research results on the Internet to attract the international scientific community. CGIS was used to develop an external energy-informational and analytical web service.
All data used in CGIS are stored and processed in its energy/power database. The CGIS database relies on the object-oriented file structure for storing and presenting energy/power data. Power plants with their parameters, power systems, electric ties, countries, and different territories can be objects of the database. The database objects contain geographical information for visual representation and qualitative analysis; information on the relationships between objects, their regional affiliation; technical and economic data.
CGIS has several features for working with the CANOE model. The user can specify and make changes to mathematical equations of the CANOE model, enable or disable model constraints, provide operational tuning of input parameters, and include and delete model nodes (and corresponding ties) by using CGIS visual interface. The CGIS user interface allows us to select and specify various scenarios and input data for the optimization model quite easily.

3.2. The CANOE Optimization Model

The authors have developed the CANOE optimization model to optimize the expansion and operating modes of electric power systems [1,2,3,4]. For this study, the model has been specially modified to consider the optimization of renewable energy sources.
General terms, indices, and constants of the model:
The CANOE mathematical model is linear, which is permissible, given the long-term nature of the problems solved and the significant scale of the modeled power systems and interconnections. The model is also multi-nodal, making it possible to consider the territorial distribution of electric power systems and interconnections. The model is static, which allows reducing the dimension of the model while maintaining a high degree of acceptability of the results, as the research experience shows. When necessary, the dynamics of the expansion of power systems can be factored in by setting the appropriate calculation schemes for subsequent time stages. Discreteness of individual power units and power facilities is not factored in because of the long-term consideration period (ten-fifteen years or more) and the large scale of national and regional power systems and interconnections.
The model determines the optimal installed capacities of power plants X i j for all types of plants i ( i I ) at each of the nodes j ( j J ), the optimal values of the transfer capabilities of electric ties X j j (ISETs) between the nodes j and j in the target year, and the optimal operating modes (dispatching) of these capacities and transfer capabilities.
Each of the nodes j   ( j J ) has I different types of power plants. They are grouped according to the fuel used and electricity generation technologies with similar technical and economic parameters: hydroelectric power plants (HPPs), pumped storage power plants (PSPPs), steam turbine power plants (STPPs), and co-generation power plants (CGPPs) (running on different types of organic fuel (gas, coal, oil)), nuclear power plants (NPPs), wind power plants (WPPs), and solar power plants (SPPs). In addition, specific power facilities (for example, export power plants) can be specified as a separate type. Thus, the list of the types of power plants can be as follows:
I = { H P P ,   P S P P ,   S T P P ,   C G P P ,   N P P ,   W P P ,   S P P }
Each type of power plant is characterized by an initial installed capacity N o i j equal to the total existing capacity of the corresponding type of power plant, given predetermined commissioning, dismantling, and modernization of units, as well as the maximum possible installed capacity of this type of power plant by the target year N M i j , including the initial installed capacity N o i j and new power plants.
In addition, the coefficients are set for all types of power plants:
a m i j s —coefficient of the minimum permissible capacity of the power plants of type i at node j in season s ;
a i j s —coefficient of availability of the power plants of type i at node j in season s .
These coefficients vary by season, given repairs of the units and seasonal constraints on the capacity of power plants (for example, a heating load of combined heat and power plant (CHPP), the minimum required water discharges of the HPPs, and others).
The specific capital investment k i j and the coefficients of fixed operating and maintenance costs b i j are set for new and expanding power plants of a different time. Additionally, specific variable (fuel) costs c i j are set for thermal power plants.
Electric ties between nodes j and j in the model are characterized by initial Π 0 j j and maximal Π M j j transfer capabilities, specific electricity transmission losses π j j capital investment k j j , and fixed operating and maintenance costs b i j .
The capacity additions of new power plants and electric ties are considered for a period from now up to the target year (for example, 2020–2035).
The model considers the daily load curves of working and weekend days with hourly intervals t   ( t T ) ,   T = 24 —the number of hours of working and weekend days of each node (EPS) j for each season of the year s   ( s S ) ,   S = 4 —the number of seasons.
Variables.
The optimized variables of the model are given below.
X i j —the installed capacity of power plants of various types i at node j ; for PSPPs, it means generating (discharge) power.
Since, as noted, daily load curves for the seasons under consideration are set for working and weekend days, it is also necessary to assign variables of the actual power of power plants for working and weekend days. These variables are presented below.
x i j t s —the actual power of power plants of type i at node j at hour t on working days in the season s of the year; for the PSPP, i = { P S P P } there is actual (discharge) power x i j t s and pumping (charge) power of PSPPs x i j t s c h of node j at hour t on working day of the season s ;
y i j t s —the actual power of power plants of type i at node j at hour t on weekends in the season s of the year; for the PSPP i = { P S P P } there is actual (discharge) power y i j t s and pumping (charge) power of PSPPs y i j t s c h of node j at hour t on working days of the season s ;
X j j —transfer capability of interstate and intersystem electric ties between nodes j and j .
The variables of power flow through electric ties, like the variables of the actual power of power plants, require separation by working days and weekends. These variables are listed below.
x j j t s w —power flow through electric tie from node j to node j at hour t on working day of the season s ;
x j j t s h —power flow through electric tie from node j to node j at hour t on working day of the season s ;
x j j t s w —power flow through electric tie from node j to node j at hour t on working day of the season s ;
x j j t s h —power flow through electric tie from node j to node j at hour t on working day of the season s .
Objective function.
The model objective function is the ISPG total annualized costs. They include specific fuel costs for electric power production by various types of power plants, costs for commissioning new capacities and their maintenance (investment and operation component), and costs of commissioning new transmission lines (tie lines) among nodes. The optimal solution is determined by minimized costs (1) when meeting the loads at all the nodes and imposed technical constraints considered below. In the light of the above-said, the objective function of the model has the following form:
j J i I s S t T τ s w c i j x i j t s + j J i I s S t T τ s h c i j y i j t s + + j J i I k i j ( r + b i j ) X i j + j J j J j 2 j > j k j j ( r + b j j ) X j j min
τ s w —the equivalent number of working days in a season s (the number of working days such that when multiplied by the amount of electricity on a working day with the maximum power load of the season, the electricity consumption is equal to the seasonal power consumption);
τ s h —equivalent number of weekends in a season s ;
r —discount rate.
The other parameters and indices from expression (1) have already been explained. The first two components of the objective function in this expression characterize the total annual fuel costs for the ISPG. The third component includes annualized investment in and fixed operating and maintenance costs of generating capacity. The fourth component is the fixed operating and maintenance costs of inter-system electric ties, including ISETs, and investment costs (reduced to annual dimension).
Non-zero increments of the variables X i j N o i j and/or X j j Π 0 j j in the optimal solution of the model indicate the economic effectiveness of the corresponding new power plants of type i and/or ISET j j . The values of variables x i j t s and y i j t s characterize optimal operating modes of power plants.
The investment in Equation (1) is defined for X i j and X j j totally. The constant values k i j Π o i j and k i j Π 0 j j included in the total investment do not affect the optimization result. They must be subtracted from the total volumes of investment obtained by the model to estimate the actual amount of investment in new power plants and lines.
The installed capacity of the CGPPs is set to meet consumer heat load and is not optimized in the model. Just actual electric power of the CGPPs is optimized in hourly electric power balances.
Balance expressions.
While optimizing, it is necessary to ensure a set of balance, operating, and other constraints, as shown below.
Balance expression for determining the necessary installed capacity additions of power plants and increase in the transfer capability of power transmission lines (including ISETs) is given below:
i I \ I X i j j J j 2 j j x j j t s w + j J j 2 j j x j j t s w ( 1 π j j ) P j t s + R j t s ,
j J ,   t T m a x ,   s S m a x ,
P j t s and R j t s —the consumer loads on working days and the required power reserve at the power plants at node j at hour t in season s (the seasons and hours of maximum consumer loads are considered; a load of consumers is accepted for working days since it is maximum during this period);
I —a subset of the set of types of power plants I , including wind and solar types of power plants I = { W P P ; S P P } ;
T m a x —the set of hourly intervals in which annual maximum consumer load occurs;
S m a x —the set of seasons in which annual maximum load occurs;
π j j —power loss factor in electric ties (ISETs) between nodes j and j .
Power plants based on renewable energy are non-guaranteed (not firm) sources of electricity and require full duplication (redundancy). This is why they cannot take part in the installed capacity balance, which is reflected in Equation (2) by subset I \ I not containing wind and solar types of power plants.
In Equation (2), power flows x j j t s w and x j j t s w are considered during the working day since the maximum loads considered in this expression fall on a working day.
The equations of hourly balances of the actual power of power plants and consumer loads are represented in the following equations:
{ i I x i j t s j J j 2 j j x j j t s w + j J j 2 j j x j j t s w ( 1 π j j ) = P j t s w + x i j t s c h i I y i j t s j J j 2 j j x j j t s h + j J j 2 j j x j j t s h ( 1 π j j ) = P j t s h + y i j t s c h
j J ;   t T ;   s S
P j t s h —the load of consumers on the weekend j at node at hour t in season s .
The charge (pumping) power of the PSPPs x i j t s c h and y i j t s c h increases the load of consumers and is, therefore, represented in the right parts of the system of Equation (3). These variables become non-zero during the valley of the load curve. In the period of maximum loads, these variables, on the contrary, are equal to zero since the PSPPs at this time perform the function of generators, which is represented in the left parts of the system of Equation (3) by the variables x i j t s and y i j t s . The representation of the PSPPs in the model will be considered in more detail below.
Renewables participate in actual power balances (3) along with other types of power plants.
Constraints.
Constraints on expansion of installed capacity of power plants:
N 0 i j X i j N M i j ,     i I ;   j J
Constraints on expansion of transfer capability of electric ties (including ISETs):
Π 0 j j X j j Π M j j ,   j , j J ;   j 1 ,   j > j
Constraints on the actual power of power plants:
{ a m i j s · X i j x i j t s a i j s · X i j , a m i j s · X i j y i j t s a i j s · X i j ,
i I ,   j J ,   t T ,   s S .
Constraints in Equation (6) characterize the adjustment range (range of changing actual power) of power plants, which may differ for different types of capacities. Besides, the right part of Equation (6) means that actual power x i j t s should not exceed installed capacity X i j considering the availability factor a i j s .
Constraints on power flow through electric ties (including ISETs):
{ Π m j j x j j t s w X j j , Π m j j x j j t s w X j j ,
j , j J ,   j j ,   t T ,   s S ,
where Π m j j —the minimum permissible load of an electric tie between nodes j and j (can be equal to 0).
Pumped storage and hydroelectric power plants.
PSPPs and HPPs require special constraints, owing, in particular, to the limited availability of hydropower resources. PSPPs also work in pumping/charging and generating/discharging modes.
Constraints on charge power of PSPPs are:
{ 0 x i j t s c h a i j s · X i j , 0 y i j t s c h a i j s · X i j ,
i = { P S P P } ,   j J ,   t T ,   s S .
The constraints on the power balances of charge and discharge for the PSPPs are given in expression (9) and for the total amount of electric power that can be stored in the PSPP reservoirs—in the ratio (10).
{ t T x i j t s η j P S P P t T x i j t s c h 0 , t T y i j t s η j P S P P t T y i j t s c h 0 ,
{ t T x i j t s h i j X i j , t T y i j t s h i j X i j ,
i = { P S P P } ,   j J ,   s S ,
where η j P S P P —efficiency of «charge-discharge» cycle of PSPP at node j ;
h i j , i = { P S P P } —the maximum possible daily number of utilization hours of the installed capacity of the PSPP of node j , which characterizes the capacity of the PSPP reservoir (hours t of working days and weekends in each season s, during which PSPPs are charged or discharged, are found in the optimization process).
Depending on the water storage capacity, constraints are imposed on the total generation of HPPs for each season (11) or the entire year (12):
t T ( τ s w x i j t s + τ s h y i j t s ) h i j s X i j ,
i = { H P P } ,   j J ,     s S ,
where h i j s , i = { H P P } —the maximum possible number of utilization hours of the installed capacity of the HPP at node j in the season s ;
s S t T ( τ s w x i j t s + τ s h y i j t s ) h i j X i j
i = { H P P } ,   j J ,     s S ,
where h i j ,   i = { H P P } —the maximum possible number of utilization hours of the installed capacity of the HPP at node j in the target year.
The constraints given in the right-hand sides of inequalities (11) and (12) are, respectively, the maximum seasonal and annual volumes of HPPs power generation, which reflect the volume of hydroelectric resources available to HPPs for the corresponding period.
Renewables.
Other renewable energy sources based on solar and wind resources are represented in the model by installed capacity X i j ,   i = { W P P ; S P P } and actual power x i j t s ,   i = { W P P ; S P P } . The former is optimized independent variables, while the latter depends on the former and is determined in stages. First, they are calculated using the following equations:
{ x i j t s = B i j t s · X i j ,   i = { W P P } x i j t s = C i j t s · X i j ,   i = { S P P } ,
j J ,   t T ,   s S ,
where B i j t s ,   i = { W P P } and C i j t s ,   i = { S P P } are sets of constants grouped in daily profiles formed based on available statistical information on the hourly dynamics of wind and solar intensity in the territories covered by the considered EPSs/ISPG translated into power output of WPPs and SPPs measured in relative units.
The actual power obtained in Equation (13) x i j t s ,   i = { W P P ; S P P } considers the availability of primary renewable energy resources (wind and solar).
To consider the technical availability of SPPs and WPPs, the obtained actual power should also be checked by inequality, Equation (14), which is the right part of double inequality, Equation (6):
x i j t s a i j s X i j ,   i = { W P P ,   S P P } .
If inequality, Equation (14) does not hold, x i j t s it is assumed to be equal to a i j s X i j ,   i = { W P P , S P P } , otherwise x i j t s it remains the same as was defined in Equation (13).
Thus, actual power x i j t s considers both the availability of renewable energy resources and the technical availability of renewable power plants.
Hourly actual power values x i j t s ,   i = { W P P ; S P P } constitute daily profiles of power generation of WPPs and SPPs in the considered nodes for all seasons for chosen by the model optimal variables of installed capacity X i j ,   i = { W P P ; S P P } . Actual power for these types of capacity is not distinguished for working days or holidays and x i j t s ,   i = { W P P ; S P P } is used to denote both x i j t s and y i j t s .
As pointed out above, renewable energy facilities are non-firm electricity sources, and they do not participate in the installed capacity balances, Equation (2). They do not substitute (save) the installed capacity of other power plants. However, renewables participate in electricity balances (Equation (3) integrated for all days and seasons of the target year), thereby saving fossil fuels of TPPs.
It is worth noting that renewables are represented in the model as sources with variable but deterministic power output, while in reality, they generate power stochastically. A numerical experiment was conducted with the representation of renewable power generation as a set of values obtained by a random number generator [28]. Obtained in this way, new actual hourly power of renewable energy sources, grouped into daily power profiles for each season, consider the stochastic generation of these sources. The total daily production of renewable energy sources, represented by random numbers, was assumed to be equal to that of a deterministic generation. The computation results show that when a stochastic profile of renewable energy generation is used instead of a deterministic one, although the operating modes of other types of power plants changed, the total cost for the power system/interconnection (the optimal value of the objective function, see Equation (1)) changed only by 0.1–0.2% [28], i.e., it is within the error range. Therefore, the representation of renewable sources in the model by variable deterministic power output profiles can be considered quite acceptable. Nevertheless, the representation of renewables in the model in more detail, considering their stochastic generation is planned.
Constraints on the expansion of renewable energy capacities for the target year (4) were taken from the national programs for the development of renewable energy.
The model has more than 56,000 equations and constraints, and 33,000 endogenous variables are used for the optimization problem solution in this research. If the number of nodes in the scenario increases, the number of equations will increase accordingly. The simplex method is used for optimization. The processor calculation time is about 1 min. The CGIS user interface allows us to select and specify various scenarios and input data for the optimization model quite easily.

4. Methodology and Data

4.1. Assumptions

The research aims to study the prospective ISET and ISPG expansion in North-East Asia with a deeper focus to be made on the expansion of renewable energy sources and environmental issues. It was assumed that solar and wind energy could be mainly developed in China [29,30,31], Mongolia (Gobitec project [32]), and hydro, including tidal energy [33,34]—in Russia.
The study assumed that all countries of NEA jointly impose a tax on CO2 emissions as an economic incentive for the introduction and expansion of renewable energy sources, and other carbon-free (hydro and nuclear power plants) and low-carbon (gas thermal power plants) generating capacities in NEA. The study was conducted for the target year of 2040.
Potential NEA ISPG covers a wide geographical area with various climatic, economic, and other conditions. Therefore, peak loads of consumers in NEA countries come at different times of the day and even in different seasons, and, accordingly, load curves of consumers have different shapes. Besides, NEA countries are located in different time zones. Thus, peak loads and daily load curves for all seasons and nodes (EPSs of countries or their territories) must be brought to a single time. Universal Time Coordinated (UTC) was assumed as such a time.
Russia is represented in the study by its Asian section of the Unified power system (UPS), including interconnected EPSs of Siberia and the Far East. Geographically, they are part of the NEA sub-region. EPS of China is represented in the study by North-East, and North, Central, and East regional interconnected power systems. North, Central, and East systems are considered all together (as one interconnected EPS) because, according to national plans for electric power systems development in China, these systems will shape interconnected EPS at the expense of reinforcement of intersystem transmission lines between them by the target year [35]. The above Chinese interconnected power systems are geographically located within the territory of the NEA sub-region.
It was assumed that the prospective ISETs in the NEA, including the transmission lines and submarine cables, would use HVDC ± 800 kV transmission technology. This nominal voltage has already been used in transmission lines, and it is expected to be used for submarine cables by the 2040 target year [36,37]. DC lines prevent the spread of cascading blackouts, thereby contributing to a reliable power supply to consumers.
Further development of nuclear power in Japan is impacted and constrained by the Fukushima accident [38]. RoK also does not consider prospects for nuclear power development [39]. Rigid constraints on the development of nuclear power in these countries were assumed in the study to consider these factors. These constraints were included in the CANOE optimization model presented above and used for the study.
It was assumed that countries-participants of potential NEA ISPG would coordinate the expansion and operation of their national power systems. This assumption supposes close cooperation of the involved countries. Maximum potential integration benefits will be gained from such cooperation. In mathematical modeling terms, it can be stated that each country behaves in such a way as to optimize the common objective function of the entire interstate power grid. This makes it possible to use the mathematical model CANOE with a single objective function intended for optimization of expansion and operation of power systems and their interconnections.
Democratic People’s Republic of Korea (DPRK) was assumed to cooperate with other NEA countries to gain benefit from interconnection, providing transmission corridors and participating in power exchanges and trading with neighboring countries.

4.2. Basic Methodology

The general methodology for the study involves a comparison of the base case scenario (with no ISETs) with the scenario of ISPG creation and estimation of its benefits as differences between main characteristics (annualized cost, fuel cost, required generating capacities, investments, etc.) of these scenarios. These scenarios were studied with the characteristics optimized using the CANOE model, which is a part of the Computing and Geo-Information System described above.
This methodology was developed by considering carbon dioxide (CO2) emission tax as an additional cost for fossil fuel power plant generation, which differs for gas- and coal-fired thermal power plants. Given the uncertainty of future conditions, different levels of CO2 emission tax, including zero CO2 emission tax, were assumed for the study. Pairs of scenarios, including Base case one and scenario of NEA ISPG formation, were developed for assumed levels of CO2 emission tax. Comparison of the scenarios and calculation of integration benefits are made for each pair of scenarios for assumed tax levels.
Particularly, the following scenarios k ∈ K with tax levels n ∈ N should be formed:
  • scenario 1: no power system interconnection, no CO2 tax;
  • scenario 2: ISPG formation, no CO2 tax;
  • scenario 3: no power system interconnection, CO2 tax level 1;
  • scenario 4: ISPG formation, CO2 tax level 1;
  • scenario K-1: no power system interconnection, CO2 tax level N;
  • scenario K: ISPG formation, CO2 tax level N.
The Interstate power grid in NEA is presented in the study as a 10-node diagram (Figure 2). Each node has generating capacities and consumer loads. Russia and China are represented in the diagram by three interconnected nodes (this was explained in the previous section); the rest countries are represented in the diagram by one node each.
It should be noted that there are no ISETs for the base case scenario. Therefore, the diagram in Figure 2 is divided into separate national EPSs represented by single nodes (for Mongolia, Japan, DPRK (North Korea), RoK (South Korea)) and several interconnected nodes (as in the case of China and Russia).

4.3. Input Data

The input data for the optimization research using the mathematical model described above was taken from the reports and studies made by international, governmental, and scientific organizations of the considered North-East Asian countries [40,41,42,43,44,45,46,47,48,49,50,51,52,53].
Prospective electricity demand and economic indices, although uncertain, are taken in the study as single-valued to reduce the volume and complexity of calculations. These data are taken from the base case (the most probable) scenarios of future energy and power development. Following these scenarios limits the distortion of the obtained results owing to the neglect of the uncertainty of the data.
The possible economic recession may affect prospective demand in NEA countries as elsewhere. However, as the authors show in [54], it does not significantly affect benefits due to power system interconnection in the sub-region. Besides, under these conditions, the CO2 emission tax continues to serve as an economic tool to encourage carbon-free or low-carbon generating technologies to be introduced. At the same time, the CO2 emission tax, as the main investigated and influenced parameter in the study, is taken as uncertain with a wide range of values. This is needed to study thoroughly its impact on the obtained results and avoid risks connected with limited consideration of this parameter and corresponding result distortion.
Daily, weekly, and seasonal variations of power demand were considered for each node of the NEA ISPG diagram in the study as corresponding load curves [45,46,47,48,49,53]. Prospective expansion of generating capacities at the nodes of the diagram of potential NEA ISPG (see Figure 2), including nuclear capacities in Japan and Korea, were collected from [43,44].
The main specific (per kilowatt of installed capacity of power plants/transfer capability of transmission lines or per kilowatt-hour of power generation) input data for the model are presented in Table 2, Table 3 and Table 4.
It was assumed that Mongolia would not develop gas-fired thermal power plants (TPPs). As can be seen in Table 2 and Table 3, there is no data on the specific capital and fuel cost of the Mongolian gas-fired TPPs. China was assumed to develop gas-fired co-generation power plants. Since CGPPs capacity expansion is not optimized in the model and is developed to meet preferably heat demand, there is no data on China’s CGPPs specific capital cost in Table 1. However, there is data on the specific fuel cost of China’s CGPPs in Table 2 because their electricity generation is optimized in the model.
The data given in Table 3 by range represent different power plants (located in various territories of a country or having different generating technologies) but using the same fuel. The estimated annual fixed operation and maintenance cost of renewables is about 2 percent of their investment cost [41]. Daily profiles of wind and solar power generation measured in relative units for each season and considered nodes of the NEA ISPG diagram were obtained based on statistics from [55,56,57,58,59]. There is no capital cost for wind and solar power plants in East Russia in Table 2 because they are practically not assumed to be developed in this territory [47].
The ISET’s specific costs in Table 4 were calculated considering a particular route length, transfer capability, costs of transmission lines and converter substations which vary by country, and others.
Considering the expected future uncertainty of the CO2 emission tax, it was presented in the study by three options–USD 30 (tax level 1), USD 60 (tax level 2), and USD 90 (tax level 3) per ton [60,61]. These values were assumed in such a way as to cover a wide range of changes in the tax (from low level through medium one and to high level) and to study its impact on the expansion and operation of different types of power plants, particularly renewables. The assumed levels of CO2 emission tax were then converted to units of fossil fuel cost and added to the fuel cost of thermal fossil fuel-fired power plants in relevant scenarios.

5. Results and Discussions

Table 5 presents the resulting economic benefits, which are quite high (7.1–12.3 Bln. USD/year), and other benefits obtained from the formation of the NEA ISPG for various levels of CO2 emission tax.
The introduction of the CO2 emission tax and its subsequent rise substantially reduce the total economic benefit and investment benefit. At USD 60/ton of CO2 tax, investment benefit becomes negative. This means that the total investment requirements in the scenario of power interconnection exceed the investment requirements in the scenario without power interconnection. Virtually, there is a comparative loss of investment in the interconnection scenario. At USD 90/ton of the tax, the loss substantially rises. The capacity benefit goes down with emission tax growth. This is because more RESs capacity is added when tax rises. RESs capacity, which is not firm, needs duplication by firm capacity (say TPPs) or electricity storage facilities, or both. Therefore, the total capacity of the interconnection increases with the growth of CO2 tax emissions.
Fuel benefit, in general, grows (with some exception, with a tax of USD 30) with the introduction and further increase of the tax. This is because carbon dioxide emission tax is, as noted above, translated into units of and added to fossil fuel cost in the model.
First, the cost of ISETs increases with the introduction of the CO2 tax. This means that the tax encourages electric ties expansion and, accordingly, the intensity of power exchange. However, when the tax is the highest, the costs of the ISETs, along with their expansion and the intensity of electricity exchange, decrease. This point will be considered below.
Table 6 gives detailed data on capacity additions by type of power plant and country for scenarios of absence and presence of ISPG and USD 60 per ton of CO2 emission tax, as its average value (excluding the zero level). Analogous data considering all levels of an emission tax is generalized and presented in Figure 2. This data confirms the values of capacity benefit given in Table 5 (as the difference between total capacity addition for the scenarios of absence and presence of the interconnection). Additionally, the data shows the contribution of different types of power plants and countries to the capacity benefit.
The data in Table 6 show the significant impact of the CO2 emission tax on the mix and volumes of installed generating capacity and the considerable stimulation of the expansion of RES and other carbon-free power sources (wind and solar in the amount of 338.5–358.6 GW, hydro–3–26.4 GW and nuclear–177.1–188.1 GW). This leads to a decline in the coal-fired capacity of 125.6–158.8 GW. In the presence of CO2 emission tax, renewables expand, especially in China (by about 270 GW for the case of the interconnection). RoK, Japan, and Mongolia also increase renewable capacities, totally by nearly 45 GW for the case of the interconnection.
The research showed that the formation of the NEA ISPG itself stimulates the additional growth of renewable and other carbon-free generating capacity (20.1 GW for wind and solar, 23.4 for hydro, and 11 GW for nuclear–as the difference between high and low values of the given above ranges). The ISPG creation accompanied by the introduction of CO2 emissions tax significantly affects the expansion of pumped storage power plants. This results from the fact that ISPG has a high ability to withstand irregular injection and withdrawal of RESs generation, which decreases the requirements of power systems in storage capacity.
The share of renewable energy sources in the total ISPG installed capacity additions, given the introduction of CO2 emission tax (in the amount of USD 60 per ton of CO2), is quite high, being nearly 38% in the case of no interconnection and exceeding 40% in the case of interconnection.
With the large-scale RES penetration, the total installed capacity of power systems, whether separate or interconnected, grows by 340.7–358.3 GW. This is because wind and solar facilities are non-firm power sources and need to be duplicated by firm power sources.
Figure 3 shows the change in capacity additions for all assumed levels of CO2 emission tax for the scenario of power system interconnection. As seen, capacity additions respond differently to the tax introduction. Hydropower capacity changes steadily and quite moderately from 58.8 GW to 85.6 GW in the entire range of tax emission levels. Renewables react sharply even to a CO2 emission tax of USD 30/ton. Both solar and wind capacity additions increase by two to three orders of magnitude (from 4.9 GW up to 180.8 GW and from 0.1 GW to 108.9 GW, respectively). Further growth of CO2 emission tax results in a relatively steady increase in capacity additions of these types of power plants (to 226.9 GW and then to 242.8 GW–solar and to 136.7 and then to 144.3–wind).
Large tidal capacity was envisaged in the Russian Far East (see above), but it did not enter the optimal capacity and power balances of the NEA ISPG even at the highest CO2 emission tax.
A tax of USD 30/ton affects nuclear expansion virtually in no way (increment of nuclear capacity addition with the tax introduced is just 0.1 GW). Nuclear energy responds to the CO2 emission tax introduction starting with the level of USD 60/ton. In this case, nuclear capacity additions increase by order of magnitude (from 13.6 GW up to 201.7 GW). Further tax rise does not cause an increase in the nuclear capacity because it reaches the upper constraint imposed on nuclear expansion in the model.
Capacity additions of thermal, particularly coal power plants, decrease steadily and substantially with the introduction and further growth of CO2 emission tax (from 348.4 GW down to 168.9 GW).
Figure 4 presents installed capacity by type of power plant for the scenario of power interconnection in NEA when there is no CO2 emission tax and tax is levied for USD 60/ton. As seen, coal-fired power plants still dominate, substantially surpassing solar or wind capacity. However, coal-fired capacity decreases by 125 GW, and wind and solar capacity, on the contrary, increases totally by about 358 GW if the tax is introduced. Thus, the share of RESs (wind and solar) in the total installed capacity of potential NEA ISPG (in the presence of CO2 tax) slightly exceeds 25%.
If we consider all carbon-free facilities, including additionally traditional hydro and nuclear, their total capacities reach nearly 1334 GW, which is nearly 190 GW higher than coal-fired capacity (in the presence of CO2 tax). With the low-carbon facilities considered additionally (particularly gas-fired power plants), carbon-free and low carbon capacities exceed 1609 GW, which is more than half of the total NEA ISPG capacity. The share of environmentally dirty coal-fired power plants in NEA ISPG is still high, exceeding 40% in the target year, despite such economic measures of environmental protection as CO2 emission tax.
Figure 5 presents shares of optimal installed generating capacities, including new carbon-free (wind and solar), all carbon-free (wind, solar, hydro, nuclear), carbon-free and low-carbon (wind, solar, hydro, nuclear, gas), and high-carbon (coal) in the total ISPG capacity under all assumed levels of CO2 emission tax.
With no CO2 emission tax, high-carbon coal-fired power plants predominate in the NEA ISPG mix, accounting for more than half the total installed capacity. However, even the introduction of the USD 30 tax changes the picture. The share of carbon-free and low-carbon capacities exceeds that of coal capacity. With a further increase in the tax up to USD 60, the share of only carbon-free capacity surpasses the coal capacity share. With a further rise in the tax, the trend toward an increasing role of carbon-free and low-carbon capacity strengthens, and, conversely, the influence of coal capacity weakens.
Figure 6 shows the power generation of potential NEA interconnection broken down by type of power plants (in the presence of a CO2 emission tax of USD 60 per ton). As follows from the figure, in contrast to the installed generating capacity mix, wind and solar play a less significant role in the power generation mix. This is because of a small number of utilization hours of RESs capacity, which is due to natural and climatic conditions. However, the total share of carbon-free and low-carbon power generation again exceeds half of the total generation. This is mainly because of the substantial contribution of nuclear capacity (having a high number of utilization hours) to power generation.
The introduction of CO2 emission tax, even for USD 30/ton enhances renewable capacity considerably. In combination with other carbon-free and low-carbon capacities, they exceed the capacity of thermal coal-fired power plants. As for power generation, as noted above, the situation is different. The contribution of new renewables to the total power generation in NEA interconnection with no CO2 emission tax is almost twice as less (Figure 7) as their contribution to the total installed capacity (Figure 5). All carbon-free and low-carbon environmentally friendly sources account for about one-third of the total NEA power interconnection generation. The other two-thirds are coal-fired power plants. The situation changes slightly with the introduction of the emission tax of USD 30. When the tax reaches USD 60, carbon-free and low-carbon sources start to predominate, accounting for more than half of power generation. With further growth in the tax to USD 90, their position becomes stronger. Coal-fired plants retain a share of about 40% in power generation (Figure 5) and installed capacity (Figure 7).
Considered the above behavior of the NEA ISPG influenced by the CO2 tax introduction is mainly determined by the behavior of China’s electric power (under the influence of the tax), which is the largest in the sub-region (and in the world). Other NEA countries contribute much less to the entire picture, although they may behave differently when introducing the tax. For example, the large share of RES in total national power generation in the context of NEA interconnection takes place in the Republic of Korea, exceeding 20% with the tax of USD 60/ton and 25% with the tax of USD 90/ton. Mongolia’s renewables have the highest contribution to the total national generation, amounting to 40% with the tax equal to USD 60/ton and 47% with the tax equal to USD 90/ton. This is due to Gobitec’s development under conditions of NEA interconnection.
Table 7 presents the optimal transfer capabilities of ISETs for the scenario of NEA power interconnection for the presence or absence of CO2 emission tax. As seen, the introduction of the tax and its further increase (from zero to USD 60/ton) encourage a steady growth of the total transfer capability of the ISETs. Particularly, ISETs Russia-DPRK, Mongolia-China, and RoK-Japan expand. On the contrary, the transfer capability of the ISET Russia-Japan decreases. Transfer capabilities of Russia-Mongolia, Russia-China, China-DPRK, and DPRK-RoK ISETs do not change since they have reached the upper constraint of the ISETs expansion.
When the tax reaches its highest level assumed, the growth trend of the total transfer capability of the ISETs is reversed, and the transfer capability decline by 10 GW. Russia-Mongolia, Russia-Japan, China-DPRK, and RoK-Japan ISETs have reduced their transfer capabilities, and ISET Mongolia-China continues its expansion. Such a multidirectional behavior can be better considered in the export/import power exchanges presented in Figure 8.
Figure 8 presents amounts of power exchange over ISETs among countries participating in the NEA ISPG under the presence and absence of CO2 emission tax. The total value of export-import power exchanges grows from 780 TWh/year, at zero-emission tax, to 830 TWh/year, at the tax equal to USD 60/ton, and declines to 650 TWh/year, at USD 90/ton of CO2.
As shown in Figure 8, with the increase in the tax on CO2 emission, China significantly (about 4.5 times) reduces its electricity export. At the same time, its electricity import increases in approximately the same proportion. This is because of the following reason. China possesses a great fleet of cheap coal-fired power plants. It can supply power to other countries and participate in the interstate electricity market when NEA ISPG is created and there is no CO2 tax. CO2 tax introduction makes power from China’s coal-fired power plants more expensive and less competitive in the NEA electricity market, and China decreases its power supply abroad. China’s export/import declines/increases steadily with emission tax growing from zero to USD 60/ton and sharply falls/soars at the tax of USD 90/ton. At this level, the tax power import by China becomes significantly higher than China’s power export. Change in export/import trends in China is so significant that it affects the overall power export/import within NEA interconnection, reducing them at an emission tax of USD 90/ton.
As seen in Figure 8, the largest electricity importer is Japan. Its import steadily grows with the growth of CO2 emission tax. When the tax reaches USD 90/ton, the import is halved. This is again owing to China, which substantially reduces its export in the direction of the Korean Peninsula–Japan at an emission tax of USD 90/ton, thereby curbing Japan’s power imports.
The Korean Peninsula countries are both large importers and exporters, although import predominates. This means that these countries are mainly net importers and transit countries providing corridors to transmit power through their territories to Japan. At the same time, RoK becomes a net exporter at the highest level of CO2 emission tax. Russia remains a net power exporter, although its territories (Siberia and the Far East) behave differently and enhances its power export even at the highest level of emission tax. Mongolia gradually expands its export and import over the entire range of the assumed tax levels, being mainly a transit country between Russia and China, and changes its status from net importer to net exporter at the tax of USD 90/ton. Its transit role is seen in Figure 9.
Dispatching of daily power generation by type of power plants and export/import power flows from/to Mongolia’s EPS for zero and highest levels of CO2 emission tax are presented in Figure 9. The highest tax level was assumed to factor in the changing trend in power exchange from increase to decrease (Table 4 and Figure 8). The summer season (as well as in Figure 10) is considered since the NEA ISPG system peak load is in summer. With no CO2 emission tax, renewables are almost absent in the power generation of Mongolia (Figure 9a). Mongolia imports power from Russia and China to meet its peak load and exports power to Russia during load valley not to reduce the load of coal-fired thermal power plants, which is technically quite challenging and economically inefficient. By the way, such a situation with power exchange between Mongolia and Russia is currently taking place. Virtually this is one of the system interconnection benefits resulting in fuel cost savings. As follows from Figure 9, Mongolia imports the amounts of power from Russia, which significantly exceeds its demand. The bulk of this import (with a small part remaining to cover Mongolia’s peak load) is exported to China. This power export from Mongolia (which, in actuality, is power export from Russia through Mongolia) aims to meet the summer peak load in China.
With the emission tax introduced, the power generation mix and operating modes of Mongolia’s EPS change (Figure 9b). Firstly, renewables backed by CO2 emission tax are substantially expanded. They are employed to meet domestic Mongolia’s power demand and enter the interstate power market to be created within potential NEA ISPG. Besides, the amount of power imported to Mongolia from Russia and, respectively, power exported from Mongolia to China increased. This agrees well with the above result (see Figure 8) when China significantly increases its total power import at the highest assumed level of CO2 emission tax.
Dispatching of daily power generation by type of power plants and export/import power flows from/to EPS of North-East China are presented in Figure 10. The consideration of this EPS is of interest because it plays a crucial role in the ISPG of NEA. This is because it is located in the heart of the NEA ISPG, being connected, from the one side with a very large power system of North, Central, and East China, and, from the other side-with EPSs of Russia and the countries of the Korean Peninsula and, through them, with EPS of Japan, thus influencing a significant part of the NEA ISPG.
With no CO2 emission tax (Figure 10a), thermal power plants in North-East China dominate power generation, although nuclear and renewables (hydro, wind, solar) are also available. North-East China exchanges power with adjacent power systems, including EPSs of North, Central, East China, Russia (Far East), and DPRK. A significant amount of power is exported to DPRK. DPRK and RoK using a minor part of this export (to meet their domestic demand), transit the bulk of the export further to Japan, as noted above. With the CO2 emission tax (Figure 10b), the contribution to power generation of thermal power plants drops, and that of nuclear and renewables rises. This trend was shown above for the entire NEA ISPG in Figure 7. Power export to North Korea and further to Japan reduces as presented in Table 4 and Figure 8. Import, particularly, from Russia (Far East), on the contrary, rises. Power transmission from North-East China to North, Central, and East China grows. This can be explained by the fact that the expansion of thermal power plants in China is curbed by the CO2 emission tax (see Figure 3, Figure 5 and Figure 7), and this requires transmission of power from adjacent EPS to North, Central, and East China to meet its peak consumer load.
Figure 9 and Figure 10 for Mongolia and North-East China are the most interesting and representative in terms of interaction between power systems within NEA ISPG and the impact of CO2 emission tax.

6. Conclusions

The NEA ISPG brings about economic benefits whether or not a CO2 emission tax is imposed. However, the integration benefits of the NEA power interconnection decrease with the introduction of the tax and its growth. When the tax is the highest, the economic benefit of power integration grows owing to the decrease in the cost of interstate transmission infrastructure. The cost goes down owing to the reduction in the transfer capability of ISETs. This is mainly due to the decline in power export from coal-fired power plants in China when the CO2 emission tax is high.
CO2 emission tax induces expansion of renewables and, in general, carbon-free (considering additionally hydro and nuclear) and low-carbon (gas-fired) generating capacities. Even with a tax of USD 30/ton, there is a sharp increase in wind and solar capacities. Further tax growth to USD 60/ton encourages some renewable capacity expansion, with the nuclear capacity increasing dramatically.
However, the tax does not enable renewables to get the prevailing position in the NEA interconnection by the target year. Wind and solar facilities are developed in China, RoK, Japan, and Mongolia. Thermal, environmentally unfriendly coal-fired power plants still play a significant role in NEA interconnection up to the target year even in the presence of the highest assumed level of CO2 emission tax of USD 90 per ton. However, together carbon-free (wind, solar, hydro, and nuclear) sources and low-carbon facilities (gas) in partnership dominate coal-fired power plants at a CO2 emission tax of USD 60/ton in terms of installed capacity and power generation by the target year.
Power interconnection itself, in addition to CO2 emission tax, encourages some expansion of renewables since larger interconnections have higher flexibility. The creation of interstate electric ties and the formation of the NEA ISPG allow power flows to exchange intensively among countries and territories involved in the potential power system interconnection.
Different countries play different parts in the NEA ISPG, which can change with changing CO2 emission tax. Japan is a net power importer in all ranges of the considered tax levels, although the country reduces its import while the tax grows. Russia is, on the contrary, a net power exporter. Mongolia and Korean Peninsula countries are mostly transit countries. At the same time, they are net importers. Mongolia and RoK change their role, becoming net exporters with the highest CO2 emission tax. China, the largest power exporter, decreases power export by introducing the tax and increasing it. The country turns into a net power importer at the highest level of emission tax.
The results of this study contribute to building the basis for the creation of a sustainable and environmentally-friendly electric power system interconnection in NEA in the future and to achieving sustainable development goals proclaimed by United Nations. Concerted actions of all NEA countries, the particular joint introduction of CO2 emission tax, are needed and may be recommended to realize NEA ISPG based on renewables.
The directions of further research are determined by the necessity to upgrade the CANOE mathematical model by representing renewables in the model in more detail, particularly, by considering the stochasticity of their power generation.

Author Contributions

S.P. set a problem, modernized the CANOE model, developed methodology, analyzed results, wrote the manuscript, and supervised the study. L.C. collected input data, and developed scenarios and a power interconnection diagram. I.L.T. developed the computing and geoinformation system, comprising the CANOE model. L.T. modernized the CANOE model and made calculations. All authors have read and agreed to the published version of the manuscript.

Funding

The research was funded by the State Assignment Project (no. FWEU-2021-0001) of the Fundamental Research Program of the Russian Federation 2021–2030.

Institutional Review Board Statement

Not applicable.

Informed Consent Statement

Not applicable.

Data Availability Statement

Not applicable.

Conflicts of Interest

The authors declare no conflict of interest. The funders had no role in the design of the study; in the collection, analyses, or interpretation of data; in the writing of the manuscript, or in the decision to publish the results.

References

  1. Voropai, N.; Podkovalnikov, S.; Chudinova, L. The evolution of interstate power grid formation. Glob. Energy Interconnect. 2021, 4, 335–353. [Google Scholar] [CrossRef]
  2. Belyaev, L.S.; Kovalev, G.F.; Podkovalnikov, S.V. Interstate Electric Ties in Northern Pacific Region. Int. J. Glob. Energy Issues 1998, 10, 220–227. [Google Scholar]
  3. Belyaev, L.; Chudinova, L.; Khamisov, O.; Kovalev, G.; Lebedeva, L.; Podkovalnikov, S.; Savelyev, V. Studies of Interstate Electric Ties in Northeast Asia. Int. J. Glob. Energy Issues 2002, 17, 228–249. [Google Scholar] [CrossRef]
  4. Belyaev, L.S.; Podkovalnikov, S.V.; Saveliev, V.A.; Chudinova, L.Y. Effectiveness of Interstate Electric Ties; Nauka: Sib. Publ. Company of RAS: Novosibirsk, Russian, 16 May 2008. [Google Scholar]
  5. Podkovalnikov, S.V.; Saveliev, V.A.; Chudinova, L.Y. Study of systemic energy-economic effectiveness of the formation of the interstate power interconnection of North-East Asia. Proc. Russ. Acad. Sci. Power Eng. 2015, 5, 16–32. (In Russian) [Google Scholar]
  6. Voropai, N.; Podkovalnikov, S.; Chudinova, L.; Letova, K. Development of electric power cooperation in Northeast Asia. Glob. Energy Interconnect. 2019, 2, 1–6. [Google Scholar] [CrossRef]
  7. Choi, J.S.; Tran, T.; Kwon, J.; Park, D.W.; Yoon, J.Y.; Moon, S.I.; Cha, J.M.; Billinton, R. Probabilistic Reliability-Based Tie Line Capacity for Interconnecting Power Systems of South Korea, North Korea, and Far East Russia. In Proceedings of the 2006 International Conference on Probabilistic Methods Applied to Power Systems, Stockholm, Sweden, 11 June 2006; pp. 1–5. [Google Scholar] [CrossRef]
  8. Yoon, J.; Park, D.; Kim, H. Feasible power exchange model between the ROK, the DPRK, and Russia. In Proceedings of the IEEE Power Engineering Society General Meeting, Montreal, QC, Canada, 18–22 June 2006; pp. 1–5. [Google Scholar] [CrossRef]
  9. Chung, K.-H.; Kim, B.-H.H. Economic Feasibility on the Interconnected Electric Power Systems in North-East Asia. J. Electr. Eng. Technol. 2007, 2, 452–460. [Google Scholar] [CrossRef] [Green Version]
  10. Kunstý, J.; Mano, S. Energy Security, and Cross-Border Electricity Trade: Can the Asian Super Grid project pose security risks for Japan? Can electricity imports be used as an extortion weapon? Jpn. Renew. Energy Found. 2013. Available online: https://www.renewable-ei.org/en/images/pdf/20140130/Energy_weapon_final.pdf (accessed on 13 May 2022).
  11. Otsuki, T.; Mohd Isa, A.B.; Samuelson, R.D. Electric power grid interconnections in Northeast Asia: A quantitative analysis of opportunities and challenges. Energy Policy 2016, 89, 311–329. [Google Scholar] [CrossRef] [Green Version]
  12. Churkin, A.; Pozo, D.; Bialek, J.; Korgin, N.; Sauma, E. Can cross-border transmission expansion lead to fair and stable cooperation? Northeast Asia case analysis. Energy Econ. 2019, 84, 104498. [Google Scholar] [CrossRef]
  13. Gao, Y.; Liu, Z.; Xu, X.; Guo, Y.; Li, J. Research and Outlook on Northeast Asian Energy Interconnection. E3S Web Conf. 2020, 209, 04006. [Google Scholar] [CrossRef]
  14. Wang, J.; Feng, S.; Xiang, J. Economic benefits of Northeast Asia energy interconnection: A quantitative analysis based on a computable general equilibrium model. Glob. Energy Interconnect. 2021, 4, 295–303. [Google Scholar] [CrossRef]
  15. Power Interconnection in the APEC Region. Current Status and Future Potential; Asia Pacific Energy Research Centre (APERC), Institute of Energy Economics, Japan (IEEJ): Tokyo, Japan, 2000.
  16. Bradbrook, A.J. Electric Power Interconnection in North-East Asia: Towards a North-East Asian Energy Charter. J. Energy Nat. Resour. Law 2002, 20, 135–143. [Google Scholar] [CrossRef]
  17. Aalto, P. Energy market integration and regional institutions in East Asia. Energy Policy 2014, 74, 91–100. [Google Scholar] [CrossRef]
  18. Chudinova, L.Y.; Podkovalnikov, S.V.; Trofimov, I.L. Multilateral cooperation for power interconnection in Northeast Asia. E3S Web Conf. 2018, 27, 01001. [Google Scholar] [CrossRef] [Green Version]
  19. Regional Power Grid Connectivity for Sustainable Development in North-East Asia. Policies and Strategies; United Nations Economic and Social Commission for Asia and the Pacific (UN ESCAP): Bangkok, Thailand, 2020.
  20. United Nations Framework Convention on Climate Change Paris Agreement, Cop21. 2015. Available online: https://unfccc.int/sites/default/files/english_paris_agreement.pdf (accessed on 13 May 2022).
  21. Streets, D.G. Environmental Aspects of Electricity Grid Interconnection in Northeast Asia. In Proceedings of the Workshop on Power Grid Interconnection in Northeast Asia, Beijing, China, 14–16 May 2001; pp. 1–19. [Google Scholar]
  22. Bogdanov, D.; Breyer, C. North-East Asian Super Grid for 100% renewable energy supply: Optimal mix of energy technologies for electricity, gas and heat supply options. Energy Convers. Manag. 2016, 112, 176–190. [Google Scholar] [CrossRef]
  23. Bogdanov, D.; Farfan, J.; Sadovskaia, K.; Fasihi, M.; Child, M.; Breyer, C. Arising role of photovoltaic and wind energy in the power sector and beyond: Changing the Northeast Asian power landscape. Jpn. J. Appl. Phys. 2018, 57, 08RJ01. [Google Scholar] [CrossRef]
  24. Otsuki, T. Costs, and benefits of large-scale deployment of wind turbines and solar PV in Mongolia for international power exports. Renew. Energy 2017, 108, 321–335. [Google Scholar] [CrossRef]
  25. Renewable Energy and Electricity Interconnections for a Sustainable Northeast Asia; International Renewable Energy Agency (IRENA), Korea Energy Economics Institute (KEEI): Abu Dhabi, United Arab Emirates, 2021.
  26. Podkovalnikov, S.V.; Trofimov, I.L.; Trofimov, L.N. Technical Features of the Computing and Geo-Information System for Research of Prospective Interstate Power Grid Expansion. Int. J. Electr. Electron. Eng. Telecommun. 2021, 10, 49–53. [Google Scholar] [CrossRef]
  27. Trofimov, I.L.; Trofimov, L.N.; Podkovalnikov, S.V.; Chudinova, L.Y.; Belyaev, L.S.; Savelév, V.A. The computing and information system for research of prospective electric power grids expansion. Yugosl. J. Oper. Res. 2019, 29, 465–481. [Google Scholar] [CrossRef] [Green Version]
  28. Trofimov, L.N.; Trofimov, I.L. The assessment of integration effects accounting for the stochasticity of wind and solar power plant generation in the Asian Power Grid. E3S Web Conf. 2019, 139, 3–7. [Google Scholar] [CrossRef]
  29. China 2050 High Renewable Energy Penetration Scenario and Roadmap Study. In Proceedings of the Energy Research Institute of National Development and Reform Commission, Beijing, China, 20 April 2015.
  30. 7th Basic Plan for Long-Term Electricity Supply-Demand (2015–2029); Ministry of Trade, Industry, and Energy (MOTIE): Sejong, Korea, 2015.
  31. Proposal for 2030 Energy Mix in Japan (First Edition): Establish a Society Based on Renewable Energy; Renewable Energy Institute (REI): Tokyo, Japan, 2 September 2015.
  32. Mano, S.; Ovgor, B.; Samadov, Z.; Dudlick, M.; Jülch, V.; Sokolov, D.; Yoon, J. Gobitec and Asian Super Grid for Renewable Energies in Northeast Asia. Technical Report; Energy Charter Secretariat, Energy Economics Institute of the Republic of Korea, Melentiev Energy Systems Institute of the Russian Federation, Ministry of Energy of Mongolia, Japan Renewable Energy Foundation: Brussels, Belgium, 2014. [Google Scholar]
  33. Belyaev, L.S.; Chudinova, L.Y.; Podkovalnikov, S.V.; Savelyev, V.A. Hydropower in Eastern Russia and its influence on interstate electric ties in NEA. Northeast. Asia Focus 2008, 5, 36–43. [Google Scholar]
  34. Podkovalnikov, S.V.; Savelév, V.A. Tidal energy in the Russian Far East and its potential role in the development of interstate electric ties in NEA and APR. Northeast. Asia Focus 2008, 5, 25–30. [Google Scholar]
  35. Zhou, T.; Tang, K. China Power Equipment Industry. Markets Research; Deutsche Bank: Hong Kong, China, 2017. [Google Scholar]
  36. Global Energy Interconnection Development and Outlook; GEIDCO: Beijing, China, 27 July 2017; p. 143.
  37. Zhao, X.; Liu, Y.; Wu, J.; Xiao, J.; Hou, J.; Gao, J.; Zhong, L. Technical and economic demands of HVDC submarine cable technology for Global Energy Interconnection. Glob. Energy Interconnect. 2020, 3, 120–127. [Google Scholar] [CrossRef]
  38. Center for Strategic & International Studies (CSIS). Japanese Nuclear Policy Background Paper; CSIS: Washington, DC, USA, 20 November 2014; p. 40. [Google Scholar]
  39. Richardson, L.; Gurtov, M. Protesting policy and practice in South Korea’s nuclear energy industry. Asia-Pac. J. 2017, 15, 1–17. [Google Scholar] [CrossRef]
  40. International Energy Outlook 2021. With Projections to 2050. Energy Information Administration (EIA), Washington. Available online: https://www.eia.gov/outlooks/ieo/ (accessed on 23 January 2022).
  41. The Projected Cost of Generating Electricity, 2020th ed.; International Energy Agency (IEA), Nuclear Energy Agency (NEA): Paris, French, 2020.
  42. Energy Demand and Supply Outlook 7th Edition; Asia Pacific Energy Research Center (APERC): Tokyo, Japan, 2019.
  43. IEEJ Outlook 2020; The Institute of Energy Economics (IEEJ): Tokyo, Japan, 2019.
  44. The 9th Basic Plan for Long-term Electricity Supply and Demand (2020–2034); Ministry of Trade, Industry, and Energy (MOTIE): Sejong, Korea, 2020.
  45. Electricity Statistics Information. The Federation of Electric Power Companies of Japan (FEPC), Tokyo. Available online: http://www.fepc.or.jp/english/library/statistics/ (accessed on 23 January 2022).
  46. Electric Power Statistics Information System. The Ministry of Trade, Industry, and Energy, Seoul. 2021. Available online: epsis.kpx.or.kr/epsisnew/selectEkgeGepGbpGrid.do?menuId=040204&locale=eng (accessed on 13 May 2022).
  47. The Scheme and Program for the Expansion of the Unified Energy System of Russia for 2021–2027, System Operator UES, Moscow. Available online: https://minenergo.gov.ru/node/20706 (accessed on 13 May 2022). (In Russian)
  48. The Energy Strategy of the Russian Federation in the period until 2035. Ministry of Energy of the Russian Federation (MERF), Moscow, Russia, 9 June 2020. Available online: http://static.government.ru/media/files/w4sigFOiDjGVDYT4IgsApssm6mZRb7wx.pdf (accessed on 13 May 2022). (In Russian)
  49. Mongolian Ministry of Energy. National Dispatch Center. Available online: https://www.energy.mn/web/?cat=75 (accessed on 23 January 2022).
  50. World Energy Investment, IEA. 2020. Available online: https://www.iea.org/reports/world-energy-investment-2020 (accessed on 23 February 2022).
  51. Mishra, P.M. A Comparison on Development of Pumped Storage Hydropower in Europe and Asia. Master’s Thesis, The Arctic University of Norway, Narvik, Norway, 2017. [Google Scholar]
  52. Meah, K.; Ula, S. Comparative Evaluation of HVDC and HVAC Transmission Systems. In Proceedings of the IEEE Xplore, Power Engineering Society General Meeting 2007, Tampa, FL, USA, 24–28 June 2007; pp. 1–5. [Google Scholar]
  53. Transmission Cost Estimation GUIDE. Miso Energy, MTEP20: Washington, USA, 11 February 2020. Available online: https://cdn.misoenergy.org/20200211%20PSC%20Item%2005c%20Cost%20Estimation%20Guide%20for%20MTEP20%20DRAFT%20Redline425617.pdf (accessed on 19 November 2021).
  54. Trofimov, L.N.; Trofimov, I.L.; Podkovalnikov, S.V. North-East Asia interstate power grid expansion in the conditions of possible economic recession in China. In Proceedings of the E3S Web Conference, Volzhsky, Russia, 14 December 2020; Volume 216, p. 01007. [Google Scholar] [CrossRef]
  55. Work Indicators Unified Power System/Interconnected Power System. System Operator UES, Moscow. Available online: https://www.so-ups.ru/functioning/ees/ees-indicators/ees-gen-consump-hour/ (accessed on 9 February 2021). (In Russian).
  56. DTU Wind Energy, World Bank Group. Global Wind Atlas. Technical University of Denmark (DTU). 2021. Available online: https://globalwindatlas.info/ (accessed on 23 January 2022).
  57. Obukhov, S.G.; Plotnikov, I.A.; Surzhikova, O.A.; Savkin, K.D. Method for Prediction of the Power Output from Photovoltaic Power Plant under Actual Operating Conditions. IOP Conf. Ser. Mater. Sci. Eng. 2017, 189, 12008. [Google Scholar] [CrossRef] [Green Version]
  58. Sohoni, V.; Gupta, S.C.; Nema, R.K. A Critical Review on Wind Turbine Power Curve Modelling Techniques and Their Applications in Wind Based Energy Systems. J. Energy 2016, 8519785, 1–18. [Google Scholar] [CrossRef] [Green Version]
  59. World Bank, ESMAP, SOLARGIS, IFC. Global Solar Atlas. 2020. Available online: https://globalsolaratlas.info/ (accessed on 23 January 2022).
  60. Luckow, P.; Stanton, E.A.; Fields, S.; Ong, W.; Biewald, B.; Jackson, S.; Fisher, J. Spring 2016 National Carbon Dioxide Price Forecast; Synapse, Energy Economics: Cambridge, MA, USA, 2016; pp. 1–38. [Google Scholar]
  61. World Bank. State and Trends of Carbon Pricing 2019; World Bank: Washington, DC, USA, 2019. [Google Scholar]
Figure 1. Structural and functional diagram of CGIS. Source: Author’s original figure.
Energies 15 03647 g001
Figure 2. The diagram of the prospective interstate power grid in North-East Asia. Source: Author’s original figure.
Energies 15 03647 g002
Figure 3. Capacity additions by type of power plants and level of CO2 emission tax, power system interconnection scenario. Source: calculated by authors.
Energies 15 03647 g003
Figure 4. The installed capacity of the NEA power grid. Source: calculated by authors.
Energies 15 03647 g004
Figure 5. Shares of new renewables, all carbon-free sources, carbon-free, and low-carbon sources, and high-carbon coal power plants in the total capacity of the NEA power grid. Source: calculated by authors.
Energies 15 03647 g005
Figure 6. Power generation in the NEA power grid, CO2 tax = USD 60/ton, TWh/year. Source: calculated by authors.
Energies 15 03647 g006
Figure 7. Shares of new renewables, all carbon-free sources, carbon-free, and low-carbon sources, and high-carbon coal power plants in the total power generation of the NEA power grid. Source: calculated by authors.
Energies 15 03647 g007
Figure 8. Export/import power flows within NEA ISPG. Source: calculated by authors.
Energies 15 03647 g008
Figure 9. Mongolia’s EPS operating modes (dispatching) within the NEA ISPG. Source: compiled by authors based on computing results. (a) No CO2 emission tax. (b) CO2 emission tax in USD 90/ton.
Energies 15 03647 g009
Figure 10. North-East China’s EPS operating modes (dispatching) within the NEA ISPG. Source: compiled by authors based on computing results. (a) No CO2 emission tax. (b) CO2 emission tax in USD 90/ton.
Energies 15 03647 g010
Table 1. Differences in optimization models used to study the NEA power grid. Source: compiled by authors based on data from [9,11,12,22].
Optimization ModelMain FeaturesLimitations
APERC’s Optimization ModelThis is a linear programming model, which determines cost-optimal power generating capacity and hourly operation by minimizing the annual total system cost for the Northeast Asia power grid [11].
Total system cost in this model includes capital, operation and maintenance, and fuel costs for generation, storage, and inter-regional transmission technologies.
The model divides regions by city nodes and supply nodes. City nodes have electricity demand as well as generation and storage facilities, while supply nodes have only generation and storage facilities to export to neighboring nodes. This assumption simplifies modeling and reduces the amount of required input data but makes the model less realistic.
Optimization model by Lappeenranta University of Technology (Finland)The energy system optimization model is based on a linear optimization of the system parameters under a set of applied constraints with the assumption of a perfect foresight of renewable energy power generation and power demand. This model considers a wide range of renewable energy generation and storage technologies.
The model was used to study the NEA ISPG expansion, based entirely on renewable energy resources [22].
Russia, with its significant renewable energy resources potential, was not taken into account.
It is not clear how technological constraints of different types of power plants are considered in the model.
Optimization model by Korea Electrotechnology Research Institute (KERI)This model is the forerunner of the CANOE optimization model (developed by the authors).
Features are the same as the CANOE model but without the optimization of renewables [9].
The forerunner of the CANOE optimization model does not optimize renewable energy sources.
Optimization model by Skoltech Institute (Russia)The power-economic benefits can be determined, and the effectiveness of the NEA ISPG is shown in general. Russia’s contribution to the formation of integration benefits is given, and the modes of its power exchanges with neighboring countries in NEA are determined [12].The model does not optimize the expansion of the NEA ISPG, particularly the expansion of installed generating capacities. It optimizes operating modes (dispatching) of ISPG of Northeast Asia.
Table 2. Specific capital investment in power plants, USD/kW. Sources: compiled by authors based on data from [44,46,52,53] etc.
Power
Plants/
Countries, Territories
HydroPumped StorageThermalNuclearWindSolarTidal
CoalGasFuel Oil
Russia2280–3400-1600–2000800–1000-2300--1860
Mongolia320010001260---1250950-
China25001000800--25001200730-
RoK25201200115084019002150200012501200
DPRK2500-200012001500-16001500-
Japan58002400242011101900400023002300-
Table 3. Specific fuel cost, USD/MWh. Sources: compiled by authors based on data from [41,43] etc.
Power
Plants/
Countries, Territories
ThermalNuclear
CoalGasFuel Oil
Russia14–2229–38-4–5
Mongolia21–28---
China21–2841-10
RoK27–3067–702499
DPRK2951110-
Japan28–3070–7324914
Table 4. Technical and economic indices of electric ties. Sources: compiled by authors based on data from [52,53] etc.
Tie Lines/
Indices
Russia Siberia–
Mongolia
Mongolia
–North-Center-East
China
Russia
Far East

North-East China
Russia
Far East
–DPRK
DPRK
–RoK
RoK
– Japan
North-East China

DPRK
Russia
Far East

Sakhalin
Russia Sakha-lin
–Japan
ISETs capital invest., USD/kW420260270480180950180550900
Losses, %5.05.64.97.11.03.71.83.44.6
Table 5. Benefits of the interconnection. Source: calculated by authors.
BenefitsEconomic
Benefit,
Bln.USD/Year
Investment
Benefit,
Bln.USD
Capacity Benefit, GW
Power PlantsFuelISETsTotalPower PlantsISETsTotal
CO2 tax, USD/
ton CO2
016.20−3.912.3122.2−31.690.655.9
3013.2−0.8−48.483.8−31.951.956.7
604.96.4−4.27.131.2−33.8−2.738.3
900.89.9−3.17.6−9.4−24.9−34.311.6
Table 6. Capacity additions for the scenarios with no ISPG, and with ISPG, zero CO2 emission tax/USD 60 per ton of CO2 emission tax, GW. Source: calculated by authors.
Capacity/
Country
HydroPumped StorageThermal CoalThermal GasNuclearWindSolarTotal
No power system interconnection
Russia0.5/
0.7
0/
0
0/
0
0.7/
0
0.3/
3.0
0.1/
0.1
0.1/
0.1
1.7/
3.9
China72.4/
72.2
88.1/
69.6
345.5/
188.6
0/
0
13.9/
188.3
0/
91.2
0.3/
180.5
520.2/
790.4
DPRK0.7/
2.9
0/
0
3.3/
2.4
7.4/
7.4
0/
0
0.8/
0.8
0.9/
0.9
13.1/
14.4
Japan0/
0
0/
0
0/
0
0/
0
0/
0
14.0/
16.3
0/
0
14.0/
16.3
RoK0.5/
0.5
22.1/
22.2
2.0/
1.9
12.8/
12.8
10.5/
10.5
0/
23.1
0/
39.6
47.9/
110.6
Mongolia0.3/
1.1
0.2/
0.2
2.5/
1.6
0/
0
0/
0
0/
0.2
0/
1.9
3.0/
5.0
Total74.4/
77.4
110.4/
92.0
353.3/
194.5
20.9/
20.2
24.7/
201.8
14.9/
131.7
1.3/
223.0
599.9/
940.6
Power system interconnection
Russia1.2/
8.6
0/
0
0.2/
0
0.5/
0.5
3.0/
3.0
0.1/
0.1
0.1/
0.1
5.1/
12.3
China54.3/
72.2
88.1/
15.4
345.5/
222.8
0/00/
188.2
0/
91.2
4.8/
180.5
492.7/
770.3
DPRK2.9/
2.9
0/00/
0
2.5/
0
0/
0
0/
0.8
0/
0
5.4/
3.7
Japan0/
0
0/
0
0.7/
0
0/
0
0/
0
0/
16.3
0/
0
0.7/
16.3
RoK0.5/
0.5
14.1/
0
2.0/
0
12.8/
12.8
10.5/
10.5
0/
26.3
0/
45.7
39.9/
95.8
Mongolia0/
1.1
0.2/
0.2
0/
0
0/
0
0/
0
0/
2.0
0/
0.6
0.2/
3.9
Total58.9/
85.3
102.4/
15.6
348.4/
222.8
15.8/
13.3
13.5/
201.7
0.1/
136.7
4.9/
226.9
544.0/
902.3
Table 7. Transfer capabilities of ISETs in the presence of NEA ISPG, GW. Source: calculated by authors.
CO2 Emission Tax/
ISETs
USD 0USD 30/tonUSD 60/tonUSD 90/ton
Russia (Siberia)
-Mongolia
15151512.9
Russia (East)-
DPRK
3.1555
Russia (East)
-China (North-East)
5555
Russia (East)
-Japan
553.60.3
Mongolia-China
(North, Central, East)
13.413.414.515
China (North-East) -DPRK15151513
DPRK-RoK15151515
RoK-Japan6.8710.27.1
Total78.380.483.373.3
Publisher’s Note: MDPI stays neutral with regard to jurisdictional claims in published maps and institutional affiliations.

