
Arc Voltage Distortion as a Source of Higher Harmonics Generated by Electric Arc Furnaces

Faculty of Transport, Electrical Engineering and Computer Science, Kazimierz Pulaski University of Technology and Humanities, Malczewskiego 29, 26-600 Radom, Poland
Energies 2022, 15(10), 3628; https://doi.org/10.3390/en15103628
Submission received: 18 April 2022
/
Revised: 3 May 2022
/
Accepted: 13 May 2022
/
Published: 16 May 2022
(This article belongs to the Special Issue Power System Dynamics and Renewable Energy Integration)
Abstract
:Due to high unit capacities, electric arc furnaces are among the receivers that significantly affect the power system from which they are supplied. Arc furnaces generate a number of disturbances to the power grid, including fast-changing voltage fluctuations causing the phenomenon of flickering light, asymmetry, and deformation of the voltage curve. The main issues discussed in the article are problems related to the distortion of current and voltage waveforms, resulting from the operation of electric arc furnaces. An analysis of the indices characterizing the voltage distortion recorded in the supply network of the arc furnaces is presented. The changes in the range of current and voltage waveform deformation in individual smelting phases in the arc furnace are also presented. Furthermore, the changes in the degree of deformation of the current and voltage waveforms in the individual smelting phases in an arc furnace are presented. A multi-voltage electric arc model used in computer simulations is proposed.
1. Introduction
Arc furnaces are among the receivers whose load changes in both dynamic and stochastic ways. These changes are caused by the technological process carried out in the furnace, which uses an electric arc to melt the charge. The mathematical description of an electric arc is very complex, as it includes electromagnetic and gasodynamic phenomena, as well as chemical reactions. The knowledge of the arc model is necessary to determine the optimal operating point of the arc device, i.e., ensuring the maximization of the arc power during scrap melting [1,2]. The stabilization of the operating point is achieved through the use of electrode shift control systems, which use algorithms dependent on the adopted arc model [3,4].
The nature and value of the arc device current are influenced by many factors. They can be divided into several groups. The first includes factors related to the parameters of the supply line. These are mainly the supply voltage level, resistance, and reactance of the supply network, which determine the amount of short-circuit power at the connection point of the arc furnaces. The second group depends on the parameters of the arc furnace: the furnace power in relation to the short-circuit power of the network, the construction of the high-current circuit, and the measures used to limit the impact of the furnace on the power system. Another group consists of factors related to the method of smelting, including the chemical composition of the medium in which the arc takes place, its pressure and temperature, the distance between the electrodes, their material, scrap quality, and the amount of injected oxygen [5,6].
The complexity and variability of the physicochemical processes occurring at various phases of the technological process, in the arc itself, as well as in the environment of the electrodes, and the conditions of supplying the arc from the power system make the analysis of the operation of a circuit with an electric arc a complicated task. The result has been the publication of a great variety of arch models. One of the first models of the arc was proposed by Cassie, in which he assumed that the arc has a cylindrical column with a uniform temperature and current density [7,8]. Mayer proposed an improved model in which he assumed that the arc had a constant diameter with varying temperature and conductivity. He considered that the power losses were due to heat conduction at low currents. This means that the conductance is strongly dependent on the temperature and independent of the arc cross-sectional area [9]. The models proposed by Cassie and Mayr were analyzed, among others, in [10,11,12].
The literature on the subject presents many different arc models, including nonlinear resistance models [13,14], models using current–voltage characteristics [15,16,17,18,19], models represented by voltage sources [20,21], models based on the relationship between arc length and voltage [22,23], and models using neural networks and fuzzy logic [24,25,26,27]. In many publications, the influence of arc furnaces on voltage distortion in the supply network was presented on the basis of modeling with the use of simulation programs [28,29,30].
The present article is a continuation of the issues concerning the impact of electric arc furnaces on the power system, described by the author in [31,32,33,34]. In [32,33], voltage fluctuations generated by arc furnaces were characterized in detail. The results of measurements of indicators characterizing energy quality (including light flicker coefficients) were presented. The results of model tests were proposed in which the electric arc of the electric arc furnace was replaced with a voltage whose value depends on the arc length. The phenomenon of current and voltage asymmetry in the lines supplying arc furnaces was presented in [34].
The aim of the research presented in the article was to evaluate the influence of electric arc furnaces on the deformation of the voltage supplying the arc devices.
The presented results are an extension of the information presented in [31]. An analysis of changes in the indices characterizing distorted voltage waveforms (THD, Uh) recorded in the lines supplying the arc furnaces was performed.
The measurements were carried out for various supply conditions of the steelworks (at different short-circuit powers of the supply networks) and for arc furnaces with different power of furnace transformers.
In the model tests, the electric arc model of the electric arc furnace developed by the author was used. The presented model studies were aimed at estimating how the deformation of the electric arc voltage affects the power system from which the arc furnaces are supplied. The main objective of the model tests was to determine the influence of the supply conditions (short-circuit power of supply lines) in metallurgical plants (steel mills). The influence of the arc voltage deformation on the melting power (active power consumed by the arc furnace) was also determined.
The article does not deal with the issues related to limiting the distortion of currents and voltages generated by arc furnaces.
2. Deformation of Voltages and Currents Arising during Steel Smelting in an Electric Arc Furnace
The source of higher harmonics in the supply networks of arc furnaces is the nonlinear nature of the arc. The arc voltage changes its shape during the smelting from close to rectangular in the initial stage of smelting the scrap, and from triangular to sinusoidal in the final stage of smelting.
Arc furnaces generate the greatest disturbances in the initial phase of scrap melting. This is caused by dynamic changes in the electric arc voltage. The arc furnace operates from the short-circuit of the electrodes with the charge to the idle state (electric arc break). After ignition of the electric arc between the charge and the electrodes, the arc voltage curve changes very dynamically (Figure 1a).
The electric arc of the electric arc furnace changes its length, which causes a change in the voltage value between the charge and the electrodes. As the scrap melts, the arc voltage at this stage is closer to the square wave (Figure 1b), which can be used to extract the arc voltage frequency. In the next step of smelting the scrap, the arc voltage is triangular in shape (Figure 1c). In the final stage of smelting the scrap, the arc voltage is sinusoidal (Figure 1d). The electric arc is covered with foamed slag, which causes thermal stabilization of the furnace operation [31].
Changes in the arc voltage waveform distort the arc furnace current waveform. The result of current distortion in the mains supplying the arc devices is a distorted voltage drop. As a result, the supply voltage of the steelworks has a deformed course.
Figure 2 presents the changes in the value of the harmonic distortion of the THDI current and the THDU voltage, recorded during one smelting in the arc furnace. There is a significant correlation between the THDI and THDU waveforms. The correlation coefficient is rTHDI-U = 0.71.
Analytical determination of the indices characterizing the deformation of voltages and currents in the circuits of arc furnaces is very difficult due to the fact that the values of these indices are random variables. Additionally, the shape of the current (similar to the arc voltage—Figure 1) changes with the time of smelting. The harmonic content of the voltage in the electric arc furnace supply network increases with the increase in the furnace power and decreases with the increase in the short-circuit power of the network.
The main cause of the arc furnace current distortion is the arc voltage distortion between the electrodes and the charge. The distorted current is the cause of the distorted voltage drop on the impedance of the arc supply line. As a result, the supply voltage of the steel plant does not have a perfect sinusoidal wave.
Figure 3 shows the current waveform recorded in the initial stage of smelting in the arc furnace supply network with the power of a 20 MVA furnace transformer. In this phase, there are changes in which the frequency of the current cannot be clearly determined because it is not periodic.
In the next part of the smelting, powerless periods occur sporadically. The current, however, shows dynamic changes in value, which in turn causes voltage fluctuations in the supply network (Figure 4).
In the last stage of the smelting, with the melt and the smelting with foamed slag, it is possible to speak of a furnace current whose shape is similar to a sinusoidal course (Figure 5).
In order to assess the voltage distortion in the networks supplying arc devices, measurements were made, and then an analysis of changes in the indices characterizing distorted waveforms (THD, Uh) was carried out. Figure 6 shows the changes in the THDU harmonic distortion coefficient recorded in the steelwork supply network (110 kV) and in the arc furnace supply line (30 kV).
For the presented power supply system of the steelworks (rated voltage of the supply line UN = 110 kV), the ratio of the short-circuit power of the network to the power of the arc furnace is Scc/Strc = 134. It was estimated that the influence of the electric arc furnace on voltage distortion at the level of 110 kV is small. Changes of the THDU_110 kV coefficient are typical for the waveforms corresponding to the daily changes of the power system load. In the case of the furnace transformer supply line (rated line voltage UN = 30 kV), the influence of the arc furnace on voltage distortion is much greater. There is a visible increase in THDU_30 kV during the operation of the arc furnace. For the analyzed line, the ratio of the short-circuit power of the network to the power of the electric arc furnace is Scc/Strc = 20.
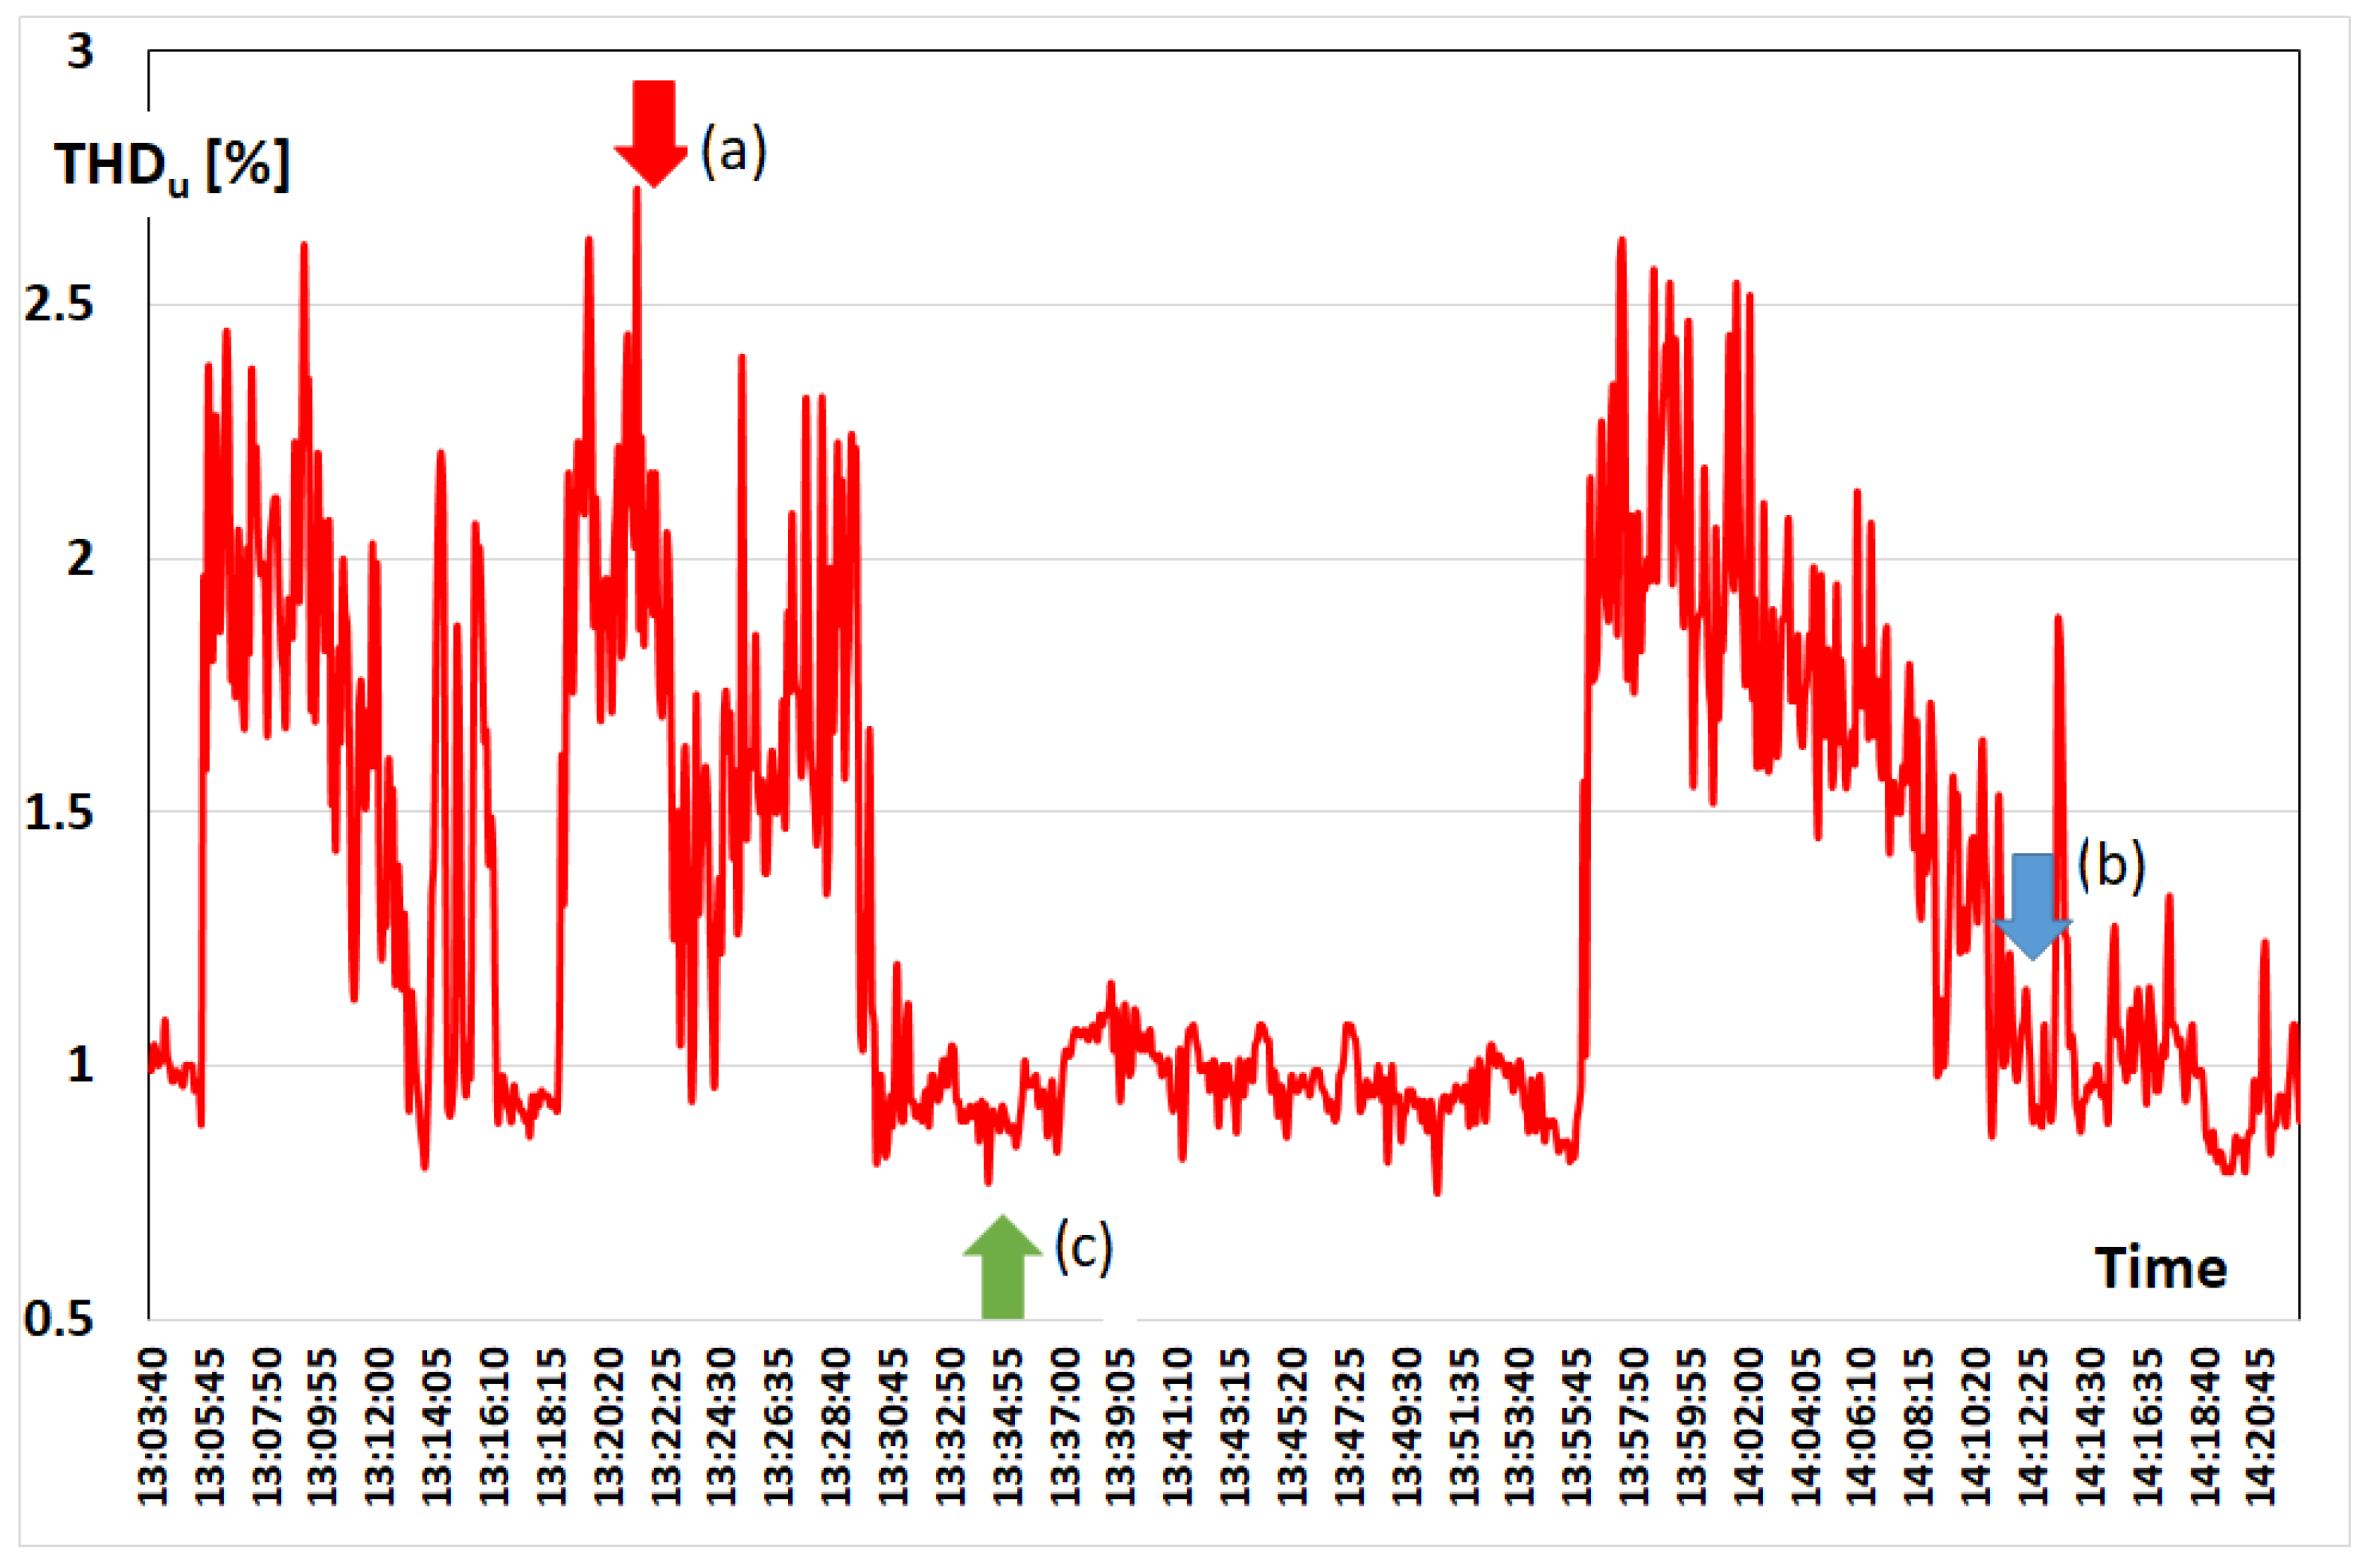
During the individual stages of steel smelting in the electric arc furnace, the values of the parameters characterizing the energy quality change. The reason for this is the dynamically changing current of the arc furnace. The indices determining the deformation of the supply voltage, i.e., THDU and Uh, also change during the smelting. Figure 7 shows the changes in the total harmonic distortion of the THD voltage recorded during one smelting.
After starting steel smelting in the electric arc furnace, when the arc voltage is the most deformed (the shape of the voltage curve is close to a square wave), the greatest deformation of the furnace current also occurs. This results in the greatest distortion of the voltage supplied to the arc furnaces (Figure 7, point a). Then, there are odd harmonics (U(3) = 1.238%, U(5) = 1.913%, U(7) = 0.428%, and U(9) = 0.151%) and even harmonics (U(2) = 0.372%, U(4) = 0.252%, U(6) = 0.267%, U(8) = 0.191%, and U(10) = 0.151%), as shown in Figure 8a When the scrap is melted, the voltage distortion and the content of individual harmonics are reduced, e.g., U(2) = 0.111%, U(4) = 0.116%, U(6) = 0.03%, U(8) = 0.015%, U(10) = 0.035% and odd U(3) = 0.186%, U(5) = 0.982%, U(7) = 0.554%, and U(9) = 0.015% (Figure 8b). Figure 8c shows the spectrum of voltage harmonics recorded with the arc furnace off, where U(5) = 0.644% of the fundamental harmonic, while U(3) = 0.367% and U(7) = 0.267%.
The changing spectrum of harmonics, in terms of both the value of individual components and their order (odd and even harmonics appearing—Figure 9 and Figure 10), may cause disturbances in the operation of the furnace system equipment.
Capacitor batteries used to compensate for the reactive power of the arc furnace are particularly at risk. A voltage surge may occur at the capacitor terminals due to resonance conditions. Figure 11 shows a damaged capacitor battery used to compensate for reactive power of the arc furnace. The cause of the capacitor failure was resonance phenomena causing an increase in the voltage supplying the capacitor bank. The next section of the article presents model studies presenting the influence of power supply conditions for arc furnaces (short-circuit power of the network) on transient phenomena resulting from switching on the capacitor bank.
3. Multi-Voltage Model of the Arc Device
Voltage distortion in arc supply networks depends both on disturbances caused by arc furnaces and on the influence of other nonlinear loads supplied from the power system. This is confirmed in Figure 6, showing changes in the THDU coefficient recorded over a week in the power line supplying arc furnaces (at the voltage level of 110 kV or 30 kV). The value of the THDU factor also depends on the short-circuit power of the network from which the steel plant is supplied and changes with the phases of smelting in the arc furnace. Additionally, during smelting, the spectrum of harmonics of the current and arc voltage changes. These factors make modeling of voltage distortions caused by arc devices extremely difficult. Due to the very high rated powers of furnace transformers and the dynamically changing load, arc furnaces are complex research facilities. Therefore, a certain compromise should be taken into account between the degree of complexity of the model and the accuracy (approximation) in reproducing the real conditions and its practical use.
Due to the fact that, in individual phases, there is a very large correlation between the changes in the total distortion factor voltage harmonics, by analyzing the voltage distortion caused by arc furnaces, the article considers the phase with the greatest deformation (the highest THDU value), which results from a very large correlation between changes in the THDU value in individual phases, e.g., for the steelworks supply line (Figure 12), i.e., rTHD12 = 0.995, rTHD23 = 0.995, and rTHD31 = 0.995.
Analyzing the THDU changes recorded in the individual phases of the steel supply line (Figure 13), during one melt (at 5 s measurement intervals), a significant correlation was also found, i.e., rTHD12 = 0.905, rTHD23 = 0.880, and rTHD31 = 0.897.
Taking into account the significant correlation of THD changes in individual phases of the supply line to the arc furnaces, a single-phase equivalent diagram of the arc device with a multi-voltage electric arc model is proposed in Figure 14 [31].
The following designations are adopted in Figure 14: USV—rated voltage, US—steelwork supply voltage, RL, XL—power line resistance and reactance, RTarc, XLarc—resistance and reactance high-current path with the furnace transformer, Iarc—arc furnace current, U(1)(t), U(2)(t), …, U(h)(t)—voltage harmonics, and U(t)arc—arc voltage.
The article proposes a model based on harmonic voltage (harmonic voltage source model—HVSM). In this model, the arc furnace is represented as a series connection of the resistance RT and the reactance XT representing the high-current path and the arc voltage Uarc(t) (Figure 15).
The arc voltage is calculated as the difference between the measured voltage US(t),
and that determined on the basis of the measured current, iarc(t), with the voltage US(t) on the impedance of the high-current circuit.
Hence,
The presented two models based on the measurements of real voltages and currents in networks supplying arc devices can be classified as dynamic models of the arc device.
Parallel to the measurements of indicators characterizing the quality of electric energy (e.g., THDU, Uh) in the lines supplying the arc furnaces, the voltage of the electric arc was recorded. The recorded waveforms of the electric arc voltage were the basis for the development of a multi-voltage model of the arc device. The proposed model takes into account changes in the arc voltage shape during the smelting process. This model consists of series connected voltage sources of successive harmonics representing the changing arc voltage. The change in both the value and the shape of the arc voltage is taken into account. Figure 16a shows an example of the recorded arc voltage. The spectrum of the true arc voltage is determined using FFT. Knowing the spectrum of voltage harmonics, the arc device was modeled using the proposed model (Figure 16b) [31].
Taking into account the change in the arc voltage shape and the change in the content of higher harmonics of this voltage, the operation of the arc device in the phase after melting the scrap in the arc furnace was modeled (Figure 17).
The power supply conditions of the steelworks have a decisive influence on the deformation of the voltage supplying arc furnaces. These conditions are determined by the ratio of the short-circuit power of the network supplying the arc devices to the power of the arc furnace at the short-circuit of the electrodes with the charge—Scc/Sts. Assuming the actual supply conditions of the steel mill, two different ratios of the short-circuit power of the network to the power of the furnace at the short-circuit of the electrodes with the charge were assumed: Scc/Sts = 134—Figure 18a and Scc/Sts = 20—Figure 18b.
The article proposes a single-phase equivalent diagram of the arc device. A certain simplification of the presented electric arc furnace based on the multi-voltage model of the electric arc is the two-voltage model of the arc device—Figure 19.
Figure 20 shows the spectrum of voltage harmonics for an ideal square wave. In the case of a square wave, the harmonic distortion factor THDUrec is about 0.483, assuming the amplitude of the first harmonic as 1.
The harmonic distortion factor THD for a rectangular arc voltage can also be determined from Equation (4).
Figure 21 shows the changes in the value of the arc voltage distortion coefficient THDUarc as a function of parameter b. For the parameter b = 0, the arc voltage waveform is rectangular (THDUarc = 0.483); when b = 1, the arc voltage shape is sinusoidal (THDUsin = 0).
The THDUarc factor for a given arc voltage waveform distortion is described by Equation (5).
In the PSpice program, model tests were carried out with the use of a three-voltage model of the electric arc furnace. The purpose of the model tests was, among others, to estimate the distortion of the supply voltage depending on the degree of deformation of the arc voltage and the supply conditions of the arc furnaces. Figure 21 shows the spectrum of harmonics and the waveform of the voltage supplied to the steel mill US. A rectangular shape of the arc voltage Uarc was assumed, and the ratio of the short-circuit power of the Scc network to the short-circuit power of the electrodes with the Strc charge was Scc/Strc = 134—Figure 22.
Figure 23 shows the spectrum of harmonics and the voltage waveform of the US steelwork supply, at the rectangular arc voltage Uarc, for the ratio of the short-circuit power of the Scc network to the short-circuit power of the electrodes with the charge Strc equal to Scc/Strc = 20. This corresponds to the actual supply conditions for the metallurgical plant and the steel plant from which the arc furnaces are powered.
Arc furnaces are characterized by a high consumption of inductive reactive power. This is due to the high inductance of the high-current circuit supplying the arc. Therefore, it becomes necessary to use reactive power compensation, mainly with the use of capacitors. When the arc furnace is turned on (the arc burns without interruption, and the arc voltage has a rectangular waveform Uarc(t)), the voltage drops on the impedance of the supply network, which causes a decrease in the value and voltage distortion on the rails of the US(t) steel plant (Figure 24).
Using the proposed model of the electric arc, the influence of the connected capacitor bank on the improvement of the power supply conditions was analyzed.
Figure 25 shows the course of the supply voltage US(t) at the moment of switching on the capacitor bank. A sharp increase in the US voltage is visible. The arc voltage waveform Uarc(t) has a rectangular shape [31].
Depending on the supply conditions of arc furnaces (supply line parameters: resistance RL and reactance XL), there may be transients of different duration. The waveforms for the supply voltage USV(t), the voltage steelworks US(t), and the current i(t) during the capacitors’ connection are shown in Figure 26. The supply line is characterized by a low short-circuit power in relation to the power of arc furnaces.
In the case of worse supply conditions for the arc furnace (lower short-circuit power), the furnace has a greater influence on the value and deformation of the voltage supplying the steel plant. Sudden voltage increases due to transients occurring during the capacitor bank switching on can be limited by the use of suppressors.
4. Influence of the Arc Voltage Distortion on the Melting Power of the Electric Arc Furnace
On the basis of the proposed model of the arc device, an analysis was made of the influence of the electric arc voltage deformation on the scrap melting power (maximum electric arc power). The adoption of the single-phase circuit of the arc device was based on, inter alia, on analyzing the results of measurements of indicators recorded in the networks supplying arc devices and symmetry of the high-current track structure with elements of the furnace installation, conducting the steel smelting process under operational symmetry, i.e., with the same currents and arc voltages in each phase. Figure 27 shows the single-phase equivalent power supply diagram of the arc device. The impedance of the supply line to the smelter was omitted (as opposed to the diagram shown in Figure 14 and Figure 19). The voltage Us is in this case the supply voltage of the steelworks.
This circuit includes the arc supply system, consisting of an equivalent, ideal voltage source, with the phase voltage US(t),
and equivalent resistance RT and inductance LT or, for fundamental harmonic, reactance XT = ωLT.
The electric arc of the electric arc furnace is replaced by a system of ideal voltage sources connected in series, one with a sinusoidal waveform Usin(t) and the other with a square waveform Urec(t),
where Uarc1 is the amplitude of the fundamental harmonic of the arc voltage.
The waveform i(t), in the circuit given in Figure 27, is determined by the following differential equation:
The instantaneous value of the current in the circuit (in steady state) resulting from this equation is the sum of three waveforms,
The value of i1(t) is forced by the voltage of the supply source Formula (10) and is equal to
where
The isin(t) waveform is forced by the sinusoidal component of the arc voltage Usin(t), i.e., the first of the expressions in
and the wave of irec(t), forced by the rectangular component of the arc voltage Urec(t), i.e., the second of the expressions in
where the auxiliary quantities are
The instantaneous value of the arc power is given by the formula
The calculations for an exemplary arc device are presented below. The calculations were performed in relative units, taking the following as the basic quantities:
Supply phase amplitude,
arc device rated current,
The reactance of the supply circuit was determined assuming that the theoretical short-circuit current of the electrodes with the charge is twice as high as the rated one.
The assumed reactance value is
The circuit resistance was assumed to be five times lower than the reactance, i.e.,
Similar assumptions were made when analyzing the voltage fluctuations generated by the arc furnaces presented in [31,32]. The operating characteristics of the power released in the arcs as a function of the current consumed by the arc device were determined (Figure 28).
This power is expressed as a percentage of the maximum value occurring at the sinusoidal current (assumption b = 1, i.e., Urec = 0).
Maximum power occurs at the following current:
The value of the maximum arc power decreases with the increase in the nonlinearity of the arc, i.e., with the decrease in the parameter b value from unity Urec = 0 to zero|Usin = 0. The relative reduction of the maximum arc power as a function of parameter b is shown in Figure 29.
The arc power value decreases gradually from the value p = 100% for b = 1 to p = 97.8% for b = 0.75, through p = 96.1% for b = 0.5, p = 94.3% for b = 0.25, and p = 92.5% for b = 0.
5. Summary
In the case of complex research objects such as arc devices, a certain compromise should be taken into account between the degree of model complexity and the accuracy (approximation) in reproducing the real conditions and its practical use.
The presented measurements show that the voltage distortion in the networks supplying the arc devices is influenced by both the arc furnaces and other nonlinear loads supplied from the same part of the power system. This is evidenced by the waveforms of the total coefficient of distortion of the THD voltage, the changes of which recorded during the week of measurements are typical for daily changes in the power system load. The THD value also depends on the short-circuit power of the network from which the steel plant is supplied. Additionally, during smelting, the spectrum of harmonics of the current and arc voltage changes. All these factors make modeling of voltage distortions caused by arc devices extremely difficult.
The multi-voltage model of the arc furnace presented in the article is a compromise between the accuracy of the determined deformation of the supply voltage and its practical application. In this model, the electric arc voltage waveforms registered in industrial conditions are used.
On the basis of the analysis of the results of the measurements of arc voltage and furnace current recorded herein, several conclusions can be drawn. The changing shape of the arc voltage and its length cause distortion of the furnace current and changes in its value, which are the reason for the generation of higher harmonics and voltage fluctuations by arc furnaces. The waveforms of the arc voltage and furnace current, especially in the initial stage of smelting, are not symmetrical with respect to the time axis and are also not periodic. During the smelting process in the arc furnace, the shape and value of the arc voltage change, starting from an almost rectangular waveform, through a triangular curve, ending with a waveform close to a sinusoidal one. The time when the arc furnace causes the greatest disturbances in the power system (the beginning of smelting), to a large extent, depends on the quality of the scrap, which affects the speed of the formation of the melt wells under the electrodes. Loading subsequent baskets with scrap causes a renewed increase in disturbances generated by arc furnaces. The greatest disturbances occur when loading the first basket (commencement of smelting).
The conclusion from the conducted theoretical considerations and model calculations is that the maximum power generated in the arcs occurs at a very similar value of the arc current (with an accuracy of less than 0.5%), and the value of this maximum decreases with an increase in the nonlinearity of the arc (a decrease in the value of parameter b).
Funding
Stakeholder of the Faculty of Transport, Electrical Engineering and Computer Science: Zakład Usług Technicznych, Energoaudyt sp. z o.o., Radom, Poland.
Institutional Review Board Statement
Not applicable.
Informed Consent Statement
Not applicable.
Conflicts of Interest
The author declares no conflict of interest.
Abbreviations
The following nomenclature is used in this manuscript:
| Iarc | arc furnace current |
| IN | rated arc furnace current |
| IW | scrap melting current with maximum power |
| RL | power line resistance |
| XL | power line reactance |
| RT | resistance high-current path with the furnace transformer |
| XT | reactance high-current path with the furnace transformer |
| Scc | short-circuit power |
| Str | power of the arc furnace transformer |
| Strc | power at short-circuit of electrodes with charge |
| THDU | voltage total harmonic distortion |
| THDI | current total harmonic distortion |
| Uh | percentage of voltage higher harmonic in relation to the fundamental harmonic |
| USV | supply voltage |
| US | steelworks supply voltage |
| Uarc | arc voltage |
| Usin(t) | sinusoidal arc voltage |
| Urec(t) | rectangular arc voltage |
| r | correlation coefficient |
| Parc | melting power for scrap metal |
| Parcmax | maximum melting power for scrap metal |
References
- Wąsowski, A. The impact of the actual operating conditions of a three-phase arc furnace on the criterion of maximum efficiency and overall efficiency. (In Polish: Wpływ rzeczywistych warunków eksploatacyjnych trójfazowego pieca łukowego na kryterium maksymalnej wydajności oraz na sprawność ogólną). Jakość I Użytkowanie Energii Elektr. 2000, 6, 71–76. [Google Scholar]
- Wąsowski, A. Adaptation of the Three-Phase Arc Device to the Power System (Dopasowanie Trójfazowego Urządzenia Łukowego do Systemu Elektroenergetycznego, (In Polish)); Kazimierz Pulaski University of Technology and Humanities: Radom, Poland, 2009. [Google Scholar]
- Andriy Lozynskyy, A.; Kozyra, J.; Łukasik, Z.; Aldona Kuśmińska-Fijałkowska, A.; Andriy Kutsyk, A.; Paranchuk, Y.; Kasha, L. A Mathematical Model of Electrical Arc Furnaces for Analysis of Electrical Mode Parameters and Synthesis of Controlling Influences. Energies 2022, 15, 1623. [Google Scholar] [CrossRef]
- Lozynskyy, A.; Perzyński, T.; Kozyra, J.; Biletskyi, Y.; Kasha, L. The Interconnection and Damping Assignment Passivity-Based Control Synthesis via the Optimal Control Method for Electric Vehicle Subsystems. Energies 2021, 14, 3711. [Google Scholar] [CrossRef]
- Karbowniczek, M.; Kamiński, P. Wpływ palników gazowo-tlenowych na roztapianie wsadu w elektrycznym piecu łukowym. Hut. Wiadomości Hut. 2003, 70, 142–149. [Google Scholar]
- Karbowniczek, M.; Sadowski, A.; Hryniewicz, M. Możliwości zastosowania odpadów poszlifierskich z produkcji łożysk jako wsadu w piecu łukowy. Hut. Wiadomości Hut. 2005, 72, 371–377. [Google Scholar]
- Cassie, A.M. Theorie Nouvelle des Arcs de Rupture et de la Rigidité des Circuits; CIGRE: Paris, France, 1939; Volume 102, pp. 588–608. [Google Scholar]
- Cassie, A.M. Arc Rupture and Circuit Severity/Theorie Nouvelle Des Arcs De Rupture Et De La Rigidité Des Circuits; CIGRE: Paris, France, 1939; pp. 588–608. [Google Scholar]
- Mayr, O. Beitrage zur Theorie des Statischen und des Dynamischen Lichthogens. Arch. Für Elektrotechnik 1943, 37, 588–608. [Google Scholar] [CrossRef]
- Bhonsle, D.C.; Kelkar, R.B. Analyzing power quality issues in electric arc furnace by modeling. Energy 2016, 115, 830–839. [Google Scholar] [CrossRef]
- Bhonsle, D.C.; Kelkar, R.B. Simulation of Electric Arc Furnace Characteristics for Voltage Flicker study using MATLAB. In Proceedings of the International Conference on Recent Advancements in Electrical, Electronics and Control Engineering, Sivakasi, India, 15–17 December 2011. [Google Scholar]
- Samet, H.; Farjah, E.; Zahra Sharifi, Z. A dynamic, nonlinear and time-varying model for electric arc furnace. Int. Trans. Electr. Energy Syst. 2015, 25, 2165–2180. [Google Scholar] [CrossRef]
- Alonso, M.A.P.; Donsion, M.P. An improved time domain arc furnace model for harmonic analysis. IEEE Trans. Power Deliv. 2004, 19, 367–373. [Google Scholar] [CrossRef]
- Varadan, S.; Makram, E.B.; Girgis, A.A. A new time domain voltage source model for an arc furnace using EMTP. IEEE Trans. Power Deliv. 1996, 11, 1685. [Google Scholar] [CrossRef]
- Cano Plata, E.A.; Tacca, H.E. Arc Furnace Modeling in ATP-EMTP. In Proceedings of the 6th International Conference on Power Systems Transients, Montreal, QC, Canada, 20–23 June 2005; pp. 19–23. [Google Scholar]
- Höke, W.; Brethauer, K. Die Schwankungen des Spannungs-bedarfs des Hochstrolichtbogens in einem Lichtbogrnofen infolge der Bogenbewegung. In Elektrowarme Inrernätional; Vulkan Verlag GmbH: Essen, Gemany, 1981; Volume 39, pp. 274–282. [Google Scholar]
- Lozynskyi, O.Y.; Paranchuk, Y.S.; Paranchuk, R.Y.; Matico, F.D. Development of methods and means of computer simulation for studying arc furnace electric modes. Electr. Eng. Electromechan. 2018, 3, 29–36. [Google Scholar] [CrossRef]
- Odenthal, H.J.; Kemminger, A.; Krause, F.; Sankowski, L.; Uebber, N.; Vogl, N. Review on Modeling and Simulation of the Electric Arc Furnace (EAF). Steel Res. Int. 2018, 89, 1700098. [Google Scholar] [CrossRef]
- Sadeghian, A.; Lavers, J.D. Dynamic reconstruction of nonlinear v–i characteristic in electric arc furnaces using adaptive neuro-fuzzy rule-based networks. Appl. Soft Comput. 2011, 11, 1448. [Google Scholar] [CrossRef]
- Mokhtari, H.; Hejri, M. A new three phase time-domain model for electric arc furnace using MATLAB. In Proceedings of the IEEE Asia-Pacific Transmission and Distribution Conference and Exhibition, Yokohama, Japan, 6–10 October 2002; Volume 3, pp. 2078–2083. [Google Scholar]
- Tang, L.; Kolluri, S.; McGranaghan, M.F. Voltage flicker prediction for two simultaneously operated AC arc furnaces. IEEE Trans. Power Deliv. 1997, 12, 985–992. [Google Scholar] [CrossRef] [Green Version]
- Panoiu, M.; Panoiu, C.; Ghiormez, L. Modeling of the Electric Arc Behavior of the Electric Arc Furnace. In Advances in Intelligent Systems and Computing; Springer: Berlin/Heidelberg, Germany, 2013; pp. 195–261. [Google Scholar]
- Panoiu, M.; Panoiu, C.; Iordan, A.; Ghiormez, L. Artificial neural networks in predicting current in electric arc furnaces. In IOP Conf. Series: Materials Science and Engineering, Proceedings of the International Conference on Applied Sciences (ICAS2013), Seoul, Korea, 29–31 August 2014; IOP: Bristol, UK, 2020; p. 57. [Google Scholar]
- Chang, G.W.; Cheng, C.I.; Liu, Y.J. A neural-network-based method of modeling electric arc furnace load for power engineering study. IEEE Trans. Power Syst. 2009, 25, 138. [Google Scholar] [CrossRef]
- Chang, G.W.; Liu, Y.J.; Chen, C.I. Modeling voltage-current characteristics of an electric arc furnace based on actual recorded data: A comparison of classic and advanced models. In Proceedings of the IEEE Power and Energy Society General Meeting—Conversion and Delivery of Electrical Energy in the 21st Century, Pittsburgh, PA, USA, 20–24 July 2008; pp. 1–6. [Google Scholar]
- Wang, F.; Jin, Z.; Zhu, Z. Modeling and Prediction of Electric Arc Furnace Based on Neural Network and Chaos Theory, Advances in Neural Networks. In Lecture Notes in Computer Science; Springer: Berlin/Heidelberg, Germany, 2005; Volume 3498, p. 819. [Google Scholar]
- Garcia-Segura, R.; Vázquez Castillo, J.; Martell-Chavez, F.; Longoria-Gandara, O.; Ortegón Aguilar, J. Electric Arc FurnaceModeling with Artificial Neural Networks and Arc Length with Variable Voltage Gradient. Energies 2017, 10, 1424. [Google Scholar] [CrossRef]
- Acha, E.; Madrigal, M. Power Systems Harmonics: Computer Modeling and Analysis; John Wiley & Sons: Hoboken, NJ, USA, 2001. [Google Scholar]
- Acha, E.; Semlyen, A.; Rajakovic, N. A harmonic domain computational package for nonlinear problems and its application to electric arcs. IEEE Trans. Power Deliv. 1990, 5, 1390–1397. [Google Scholar] [CrossRef]
- Vinayaka, K.U.; Puttaswamy, P.S. Review on characteristic modeling of electric arc furnace and its effects. In Proceedings of the 2017 International Conference on Intelligent Computing, Instrumentation and Control Technologies (ICICICT), Kerala, India, 6–7 July 2017. [Google Scholar]
- Łukasik, Z.; Olczykowski, Z. Estimating the impact of arc furnaces on the quality of power in supply systems. Energies 2020, 13, 1462. [Google Scholar] [CrossRef] [Green Version]
- Olczykowski, Z. Modeling of Voltage Fluctuations Generated by Arc Furnaces. Appl. Sci. 2021, 11, 3056. [Google Scholar] [CrossRef]
- Olczykowski, Z.; Łukasik, Z. Evaluation of Flicker of Light Generated by Arc Furnaces. Energies 2021, 14, 3901. [Google Scholar] [CrossRef]
- Olczykowski, Z. Electric Arc Furnaces as a Cause of Current and Voltage Asymmetry. Energies 2021, 14, 5058. [Google Scholar] [CrossRef]
Figure 1.
The shape of the arc voltage curve: (a) arc ignition start; (b) smelting scrap; (c) the main phase of melting the scrap; (d) final stage of smelting [31].
Figure 1.
The shape of the arc voltage curve: (a) arc ignition start; (b) smelting scrap; (c) the main phase of melting the scrap; (d) final stage of smelting [31].

Figure 2.
Changes in THDI and THDU coefficients in the different smelting phases in the electric arc furnace.
Figure 2.
Changes in THDI and THDU coefficients in the different smelting phases in the electric arc furnace.

Figure 3.
The oscillogram of the arc current in the initial phase of melting the scrap.

Figure 4.
The oscillogram of the arc furnace current recorded in the next phase of scrap melting.

Figure 5.
Oscillogram of the current with complete melting of the charge in the electric arc furnace.
Figure 5.
Oscillogram of the current with complete melting of the charge in the electric arc furnace.

Figure 6.
Harmonic distortion changes THDU recorded during the measurement week in the steel plant supply network and the arc furnace supply line.
Figure 6.
Harmonic distortion changes THDU recorded during the measurement week in the steel plant supply network and the arc furnace supply line.

Figure 7.
Changes in THD coefficient in the different smelting phases in the electric arc furnace (a) start of scrap melting, (b) final smelting phase—molten scrap, (c) arc furnace off.
Figure 7.
Changes in THD coefficient in the different smelting phases in the electric arc furnace (a) start of scrap melting, (b) final smelting phase—molten scrap, (c) arc furnace off.

Figure 8.
Spectrum of voltage harmonics in different melting phases in the arc furnace: (a) commencement of melting the charge; (b) melted charge; (c) when the furnace is turned off (loading the scrap into the furnace).
Figure 8.
Spectrum of voltage harmonics in different melting phases in the arc furnace: (a) commencement of melting the charge; (b) melted charge; (c) when the furnace is turned off (loading the scrap into the furnace).

Figure 9.
Changes of the amplitude in odd harmonics of the voltage during the smelting process in the arc furnace.
Figure 9.
Changes of the amplitude in odd harmonics of the voltage during the smelting process in the arc furnace.

Figure 10.
Even harmonic amplitude changes of voltage during smelting in an arc furnace.

Figure 11.
Damaged capacitor battery used to compensate for the reactive power of the arc furnace.

Figure 12.
Changes in the total harmonic distortion THDU recorded in three phases of the steel supply network during the week of measurements.
Figure 12.
Changes in the total harmonic distortion THDU recorded in three phases of the steel supply network during the week of measurements.

Figure 13.
Changes in the total harmonic distortion THD recorded in three phases of the steelwork supply network during one melting in the arc furnace.
Figure 13.
Changes in the total harmonic distortion THD recorded in three phases of the steelwork supply network during one melting in the arc furnace.

Figure 14.
Single-phase diagram of equivalent power supply for an arc furnace with a multi-voltage electric arc model [31].
Figure 14.
Single-phase diagram of equivalent power supply for an arc furnace with a multi-voltage electric arc model [31].

Figure 15.
The arc furnace model based on the harmonics of the electric arc voltage (HVSM).

Figure 16.
Electric arc voltage oscillograms recorded in real conditions (a) and determined using the proposed model (b)—initial stage of melting [31].
Figure 16.
Electric arc voltage oscillograms recorded in real conditions (a) and determined using the proposed model (b)—initial stage of melting [31].

Figure 17.
Electric arc voltage oscillograms recorded in real conditions (a) and determined using the proposed model (b)—after melting the charge [31].
Figure 17.
Electric arc voltage oscillograms recorded in real conditions (a) and determined using the proposed model (b)—after melting the charge [31].

Figure 18.
Oscillograms of the voltage in the supply line USV(t) and the arc voltage Uarc(t) for Scc/Sts = 134 (a) and Scc/Sts = 20 (b) [31].
Figure 18.
Oscillograms of the voltage in the supply line USV(t) and the arc voltage Uarc(t) for Scc/Sts = 134 (a) and Scc/Sts = 20 (b) [31].

Figure 19.
Single-phase equivalent circuit with a two-voltage electric arc model.

Figure 20.
The spectrum of higher harmonics for the rectangular waveform of the arc voltage.

Figure 21.
Dependence of changes in the value of the arc voltage distortion coefficient on the value of parameter b.
Figure 21.
Dependence of changes in the value of the arc voltage distortion coefficient on the value of parameter b.

Figure 22.
Oscillogram and harmonics spectrum of the supply voltage of the steel plant for Scc/Strc = 134.
Figure 22.
Oscillogram and harmonics spectrum of the supply voltage of the steel plant for Scc/Strc = 134.

Figure 23.
Oscillogram and harmonics spectrum of the supply voltage of the steel plant for Scc/Strc = 20.
Figure 23.
Oscillogram and harmonics spectrum of the supply voltage of the steel plant for Scc/Strc = 20.

Figure 24.
Oscillograms of the supply (source) voltage USV(t), the arc furnace supply voltage US(t), the arc voltage Uarc(t), and the arc furnace current i(t)—switching on the arc furnace.
Figure 24.
Oscillograms of the supply (source) voltage USV(t), the arc furnace supply voltage US(t), the arc voltage Uarc(t), and the arc furnace current i(t)—switching on the arc furnace.

Figure 25.
Oscillograms of the supply (source) voltage USV(t), the arc furnace supply voltage US(t), the arc voltage Uarc(t), and the arc furnace current i(t)—switching on the capacitor bank [31].
Figure 25.
Oscillograms of the supply (source) voltage USV(t), the arc furnace supply voltage US(t), the arc voltage Uarc(t), and the arc furnace current i(t)—switching on the capacitor bank [31].

Figure 26.
Oscillograms of the supply (source) voltage USV(t), the arc furnace supply voltage US(t), the arc voltage Uarc(t), and the arc furnace current i(t)—switching on the capacitor bank, with high short-circuit power of the network [31].
Figure 26.
Oscillograms of the supply (source) voltage USV(t), the arc furnace supply voltage US(t), the arc voltage Uarc(t), and the arc furnace current i(t)—switching on the capacitor bank, with high short-circuit power of the network [31].

Figure 27.
Single-phase equivalent power supply diagram of the arc device.

Figure 28.
Arc force as a function of the arc current for different values of the parameter b.

Figure 29.
Relative decrease in maximum arc power as a function of parameter b.

Publisher’s Note: MDPI stays neutral with regard to jurisdictional claims in published maps and institutional affiliations. |
© 2022 by the author. Licensee MDPI, Basel, Switzerland. This article is an open access article distributed under the terms and conditions of the Creative Commons Attribution (CC BY) license (https://creativecommons.org/licenses/by/4.0/).
Share and Cite
MDPI and ACS Style
Olczykowski, Z. Arc Voltage Distortion as a Source of Higher Harmonics Generated by Electric Arc Furnaces. Energies 2022, 15, 3628. https://doi.org/10.3390/en15103628
AMA Style
Olczykowski Z. Arc Voltage Distortion as a Source of Higher Harmonics Generated by Electric Arc Furnaces. Energies. 2022; 15(10):3628. https://doi.org/10.3390/en15103628
Chicago/Turabian StyleOlczykowski, Zbigniew. 2022. "Arc Voltage Distortion as a Source of Higher Harmonics Generated by Electric Arc Furnaces" Energies 15, no. 10: 3628. https://doi.org/10.3390/en15103628
Note that from the first issue of 2016, this journal uses article numbers instead of page numbers. See further details here.