Article

Dielectric Properties of Electrical Insulating Liquids for High Voltage Electric Devices in a Time-Varying Electric Field

Department of Electric Power Engineering, Faculty of Electrical Engineering and Informatics, Technical University of Košice, Letná 9, 04200 Košice, Slovakia
*
Author to whom correspondence should be addressed.
Energies 2022, 15(1), 391; https://doi.org/10.3390/en15010391
Submission received: 10 November 2021 / Revised: 17 December 2021 / Accepted: 31 December 2021 / Published: 5 January 2022

Abstract

:
The motivation to improve components in electric power equipment brings new proposals from world-renowned scientists to strengthen them in operation. An essential part of every electric power equipment is its insulation system, which must have the best possible parameters. The current problem with mineral oil replacement is investigating and testing other alternative electrical insulating liquids. In this paper, we present a comparison of mineral and hydrocarbon oil (liquefied gas) in terms of conductivity and relaxation mechanisms in the complex plane of the Cole-Cole diagram and dielectric losses. We perform the comparison using the method of dielectric relaxation spectroscopy in the frequency domain at different intensities of the time-varying electric field 0.5 kV/m, 5 kV/m, and 50 kV/m. With the increasing intensity of the time-varying electric field, there is a better approximation of the Debye behavior in all captured polarization processes of the investigated oils. By comparing the distribution of relaxation times, mineral oil shows closer characteristics to Debye relaxation. From the point of view of dielectric losses at the main frequency, hydrocarbon oil achieves better dielectric properties at all applied intensities of the time-varying electric field, which is very important for practical use.

1. Introduction

The problems of the constant increase of electricity consumption and its supply to the end customer in the required quality and with high reliability correspond to the state of electrical equipment that participates in the whole process. The fundamental component in this system is the insulation of electrical equipment, which is required to operate as efficiently as possible [1,2,3,4,5]. The condition of the insulation system is an essential indicator of the operational reliability of power transformers and other high voltage equipment in the power system. The transformer is included as one of the main components in the transmission and distribution network, and its service life depends on the condition of the insulation system. Said system continuously withstands thermal, chemical, and electrical stresses during its operation. Insulation and cooling effects are the basic properties of fluids used in transformers [6,7,8,9,10,11,12,13].
The development of materials is advancing, which also applies to liquid insulating materials. Mineral oil produced based on non-renewable petroleum products has long been used in power transformers due to its low cost and relatively high rate of heat dissipation. Therefore, based on its biodegradability, global researchers are focusing on alternative, electrical insulating liquids [10,14,15,16]. In researching new materials, it is possible to draw on the knowledge currently acquired during the research or by monitoring the materials after commissioning [6]. In recent years, it is possible to register the development of hydrocarbon transformer oil, produced based on GTL (Gas to Liquid) technology, which is obtained by converting natural gas into liquid waxy hydrocarbons using the Fischer-Tropsch process. These hydrocarbons are finally transformed using a unique technology that includes new catalysts and subsequently distilled into a wide range of products, including electrical insulating oils and other raw materials for the chemical industry. The difference is that the products do not contain inorganic substances such as sulfur, but only pure hydrocarbons, ensuring sufficient paraffin saturation. The absence of sulfur and the negligible amount of aromatic and unsaturated hydrocarbons, significantly present in conventional mineral oils, provide GTL with excellent properties compared to the mineral oils used in operation [17,18,19].

2. Motivation of the Experiment

The publication [20] contains, among other things, a comparison of mineral oil and hydrocarbon oil (liquefied gas) in terms of dielectric losses at different intensities of time-varying electric field (100 kV/m –900 kV/m) at a mains frequency of 50 Hz. Through comparing dielectric losses, it was found that hydrocarbon oil has better insulating properties than conventional mineral oil at all applied electric field intensities. However, the contribution does not include the dielectric behavior of the compared oils in the frequency spectrum but only at the frequency of the network. The reason is that the authors focused their research on the response of the investigated samples only when applying relatively high intensities of the electric field with an industrial frequency. Dielectric behavior in a specific frequency spectrum characterizes the method of dielectric relaxation spectroscopy, which includes measurements of dielectric parameters when applying lower electric field intensities, as mentioned above in [20]. Therefore, our paper will deal with comparing mineral and hydrocarbon oil at lower electric field intensities (E ≤ 50 kV/m), the method of dielectric relaxation spectroscopy in the frequency domain to describe the dielectric in more detail phenomena occurring in the material.
The paper [21] presents frequency-dependent dielectric relaxation spectroscopy of a weakly polar ferrofluid based on mineral oil Mogul TRAFO CZ-A with a nanoparticle concentration of 6.6% at a time-varying electric field intensity of 20 kV/m. Spectroscopic measurements of complex permittivity showed that the investigated sample showed a polarization process close to Debye relaxation in the measured frequency spectrum of 20 Hz–100 kHz. Said process is shown in Figure 1.
Therefore, another goal of our paper is to examine only the carrier medium (i.e., mineral oil Mogul TRAFO CZ-A), supplemented with a comparison with the hydrocarbon oil Shell DIALA S4 ZX-1, produced based on GTL technology. Compared to the contribution [21], we introduce a different experimental study, where dielectric measurements and analyses were conducted at different intensities of the time-varying electric field (lower and higher than 20 kV/m), and also the dielectric processes monitored in the lower frequency band (0.1 mHz–3 kHz).
To investigate dielectric processes, it is necessary to study dynamic polarization spectra, extended by the analysis of conductivity characteristics. Impedance analysis of Cole-Cole formalism in dielectric spectroscopy is a suitable method for studying the conductivity of a material. The paper [22] generally explains the processes of ionic hopping and relaxation in disordered rigid structures through complex plane impedance and frequency-dependent electrical conductivity. The mentioned conductivity performance analysis will be used in our study to describe the conductivity characteristics of electrical insulating oils in the applied time-varying electric field.
As only data for sulfur-containing naphthenic mineral oil—Mogul TRAFO CZ-A are known, our goal is to compare these data with a unique type of transformer oil, which has a minimum sulfur content and was produced by liquefaction of natural gas. Dielectric spectroscopy is one of the diagnostic tools that examine the quality of the insulation system. However, comparative data at different electric field intensities and test voltage frequencies are not available, so that we will address this in this paper.
In power engineering, the dielectric properties of electrical insulating liquids are critical, therefore a complex experimental investigation is required at lower and higher electric field intensities, together with the coverage of the most comprehensive possible frequency spectrum. Dielectric spectroscopy in the frequency domain is a useful method for general insulation testing in diagnostics. Dielectric spectroscopy has many advantages over standard dielectric power loss tests at 50 and 60 Hz. One of the main advantages is the testing of the material in a wide range of frequencies, which makes it possible to selectively distinguish the properties of the insulation system [21,23].

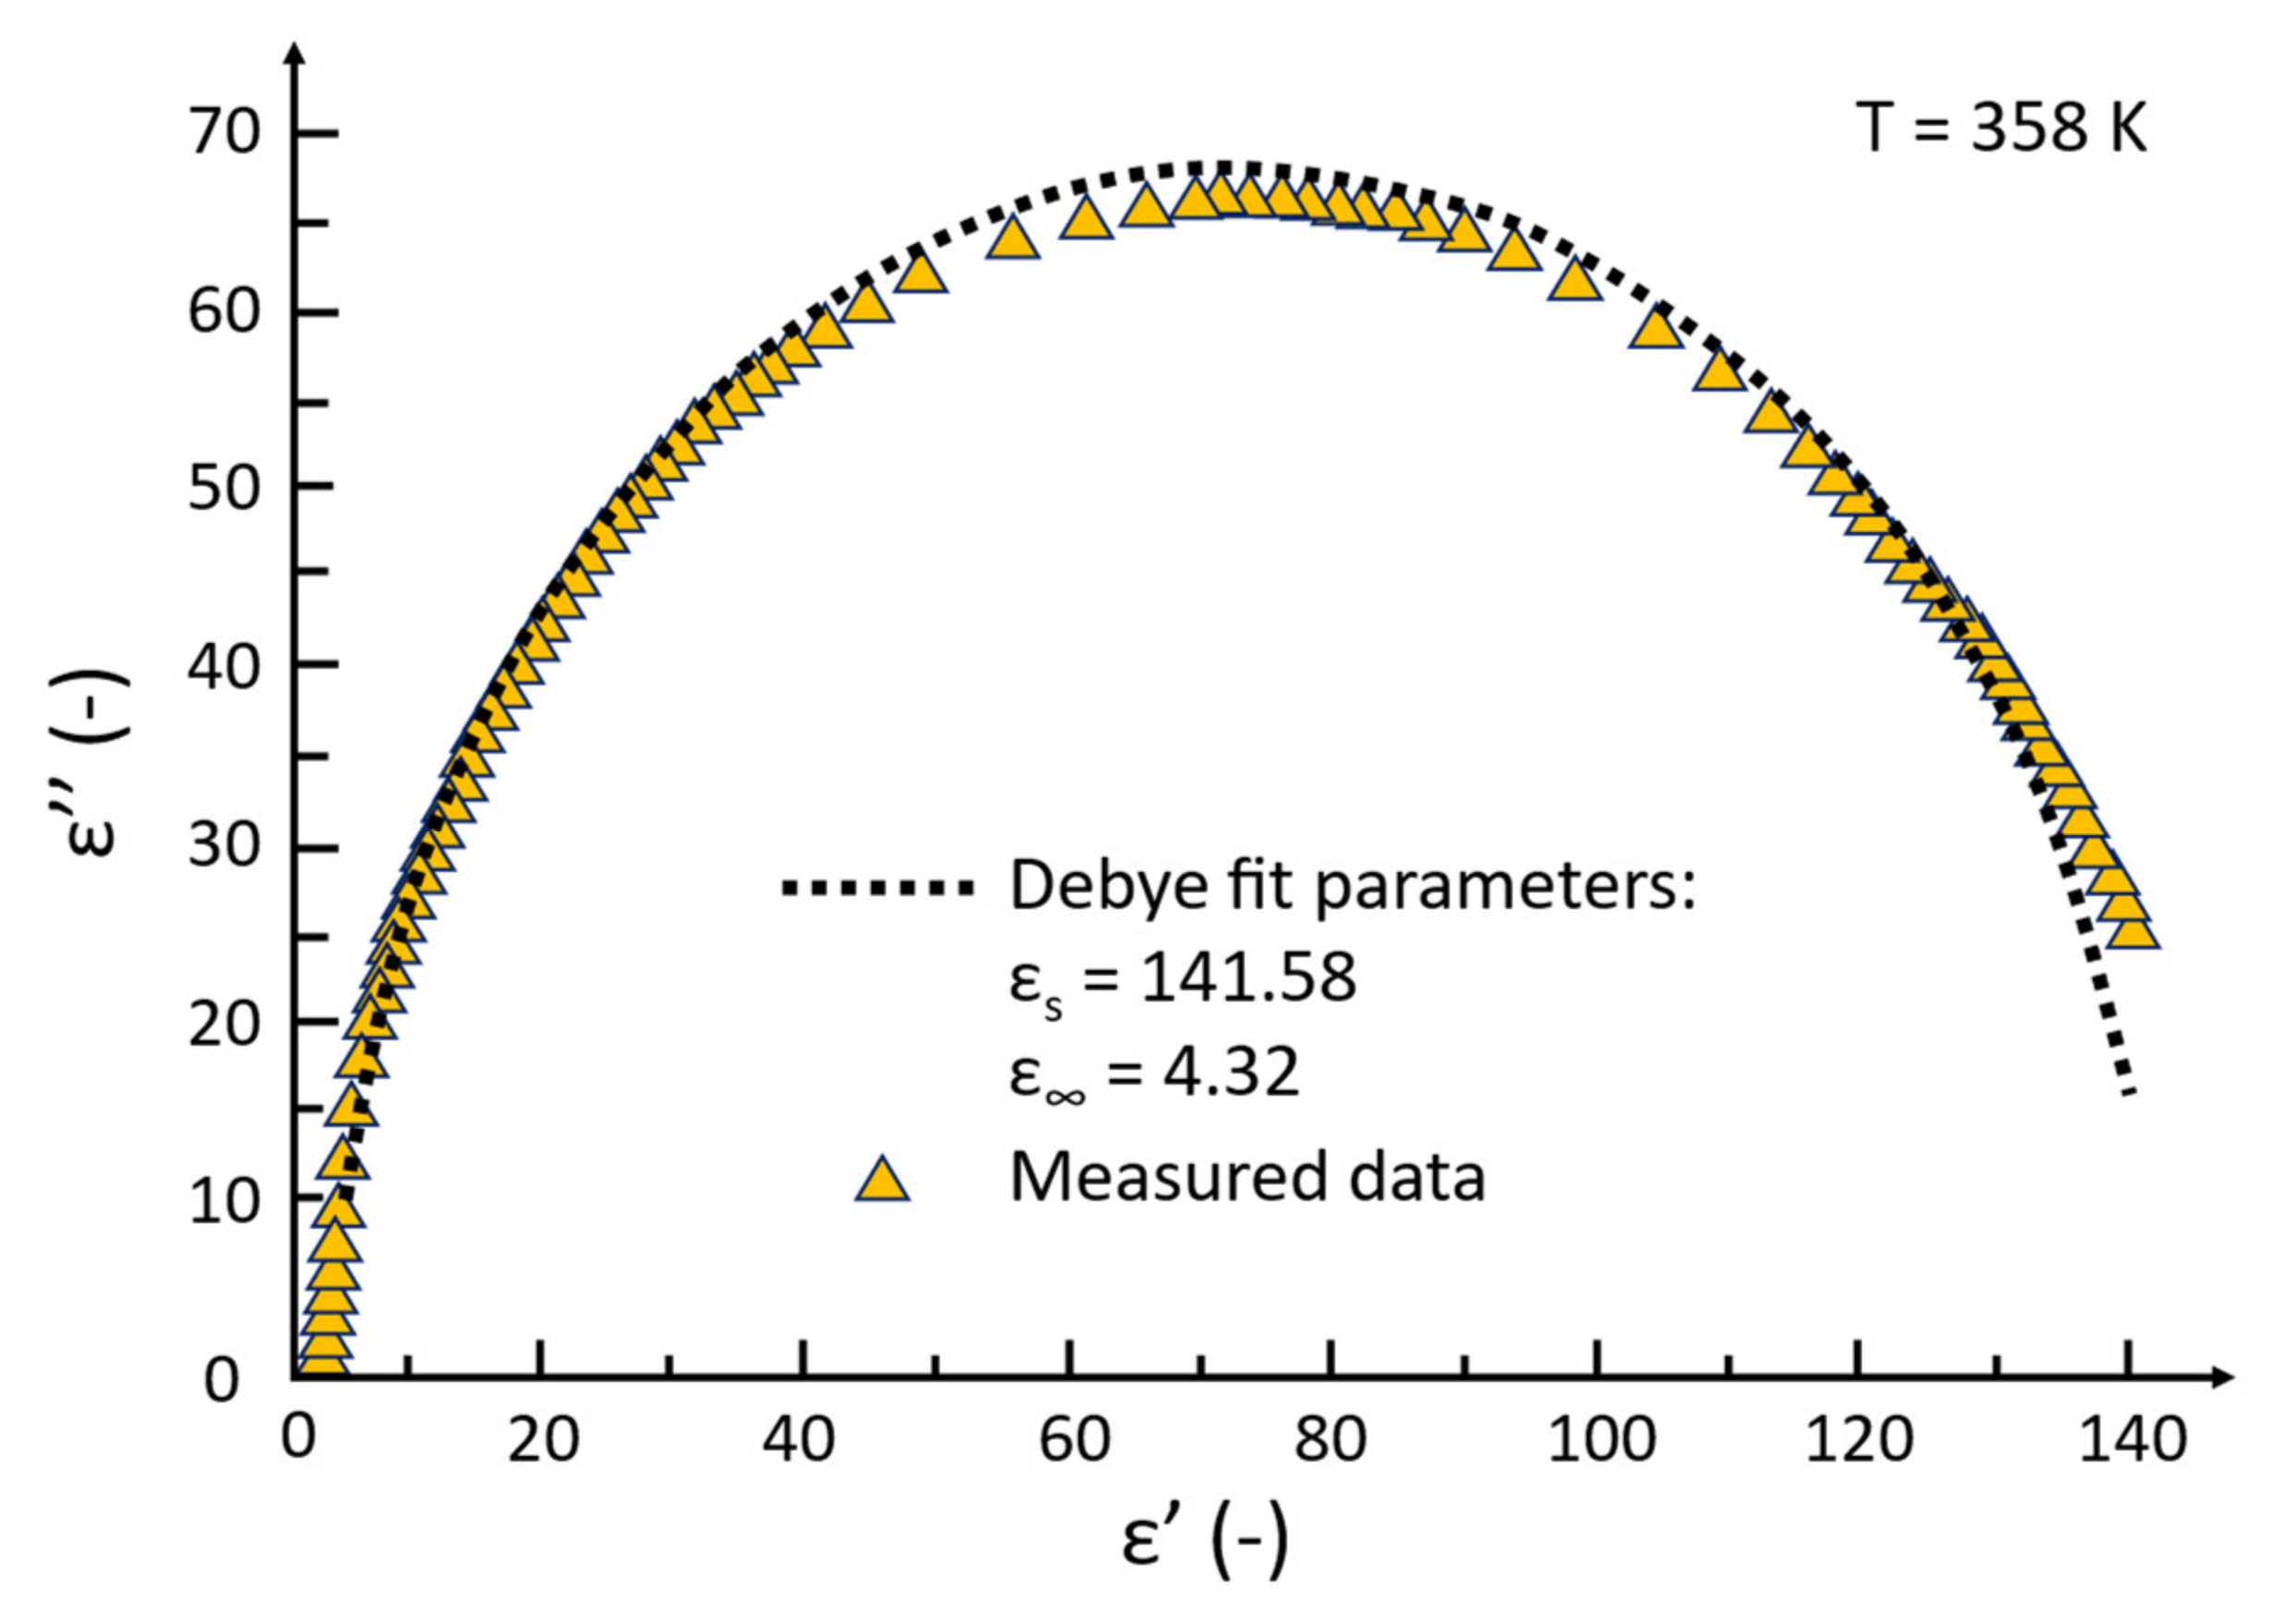
3. Dielectric Relaxation Spectroscopy Using a Complex Electric Modulus

Complex electric modulus M* is defined as the inverse of the complex permittivity ε*. The complex permittivity is given by the relation ε*(ω) = ε′(ω) – iε″(ω), where ε′(ω) is the real part of the complex permittivity (relative permittivity) and ε″(ω) is the imaginary part of the complex permittivity, representing the factor of dielectric losses and ω is the angular velocity. It follows that M* is expressed according to the equation:
M* = 1/ε* = (ε′/ε2 + ε2) + i(ε″/ε2 + ε2) = M′ + iM
The complex electric modulus was first used by Macedo et al. to research relaxation processes in glassy ionic conductors. It has also been used to provide information on electric charge dynamics and dielectric polarization in polymer electrolytes. It has rarely been used to describe the dielectric behavior of insulating materials [24,25,26,27,28,29,30].
The Cole-Cole dielectric relaxation is given by the complex permittivity ε*:
ε*(ω) = ε + (εsε/1 + (iωτ)1−α)
where ε is the optical permittivity, εs is the static permittivity, and τ is the relaxation time within the complex permittivity, where β (0 < β < 1) is a parameter of the semicircle shape in the complex plane of the Cole-Cole diagram and β = 1 − α holds. Based on Equation (2), a complex electric modulus can be defined as:
M*(ω) = 1/ε* = 1/(ε + (εsε/1 + (iωτ)β)) = M − (MMs/1 + (iωτM)β)
In this case, M = 1/ε is the optical electric modulus, and Ms = 1/εs is the static electric modulus. Then for the real and imaginary part of the complex electric modulus:
M′(ω) = M + (MsM/1 + (ωτM)2)
M″(ω) = (Ms− M) ωτM/1 + (ωτM)2
where τM is the relaxation time for M* equal to:
τM = τ(ε/εs)1/β
In general, εs is greater than ε, so τM is less than τ. It causes relaxation processes at higher frequencies within the complex electric modulus M*, in contrast to the low-frequency relaxation processes described by the complex permittivity ε*. The position ε and ε″ in the denominator of Equation (1) causes low values of M and M″ under the condition of higher values of ε and ε″. The relaxation peaks are completely bounded in the frequency spectra of M and M″. The shape of the curve in the complex plane does not change during the transformation from ε* to M* and thus not even β, as expressed in Equation (3). In other words, for complex permittivity and complex electric modulus in the complex plane, a lower value of β is related to a larger distribution of relaxation times τ or τM in each respective center of the semicircle [24,25,31].
The degree of Cole-Cole relaxation time distribution between M* and ε* does not change through the parameters α and β. The difference is that the position of their loss peaks Mmax″ and εmax″ will be different. Mmax″ is shifted to higher frequencies at position (ωτ)Mmaxα = εs, while εmax″ is located at position (ωτ)εmax = 1. This is because M″ converts the low-frequency increase ε″, caused by the ion distribution, into a conductive peak characterizing the ohmic relaxation time. Thus, it is clear that complex electric modulus analysis offers better separation between dipole relaxations and losses with significant ionic distribution than complex permittivity analysis. Simply put, in the low-frequency spectrum, the complex permittivity and the dielectric dissipation factor are significantly affected by the effect of electrode polarization and conductivity. The reduction of the influence of these factors is caused by M*(ω), therefore it is understood as a valuable tool for highlighting the details of relaxation information registered in insulation materials in the low-frequency band [31,32].

4. Experiment

4.1. Examined Samples

We performed experimental measurements on two new, ageless samples of electrical insulating liquids:
  • Mogul TRAFO CZ-A, hereinafter referred to as MO;
  • Shell DIALA S4 ZX-1, hereinafter referred to as SD.
MO is an inhibited mineral oil with an oxidation inhibitor, which meets all the requirements placed on its use properties. It is used as an insulating and cooling liquid for transformers of all voltage levels and other power equipment. It has low density, high surface tension, excellent electrical insulating properties, high oxidative stability, and long life. It is made from high-quality hydrocracked deep-refined base oil obtained from paraffin oil using state-of-the-art technology. Its characteristic parameters are given in Table 1 [33].
SD is a hydrocarbon oil produced based on GTL technology with long service life, negligible sulfur content, and low content of aromatic and unsaturated substances. The service life is an inhibited oil with good oxidizing properties. The negligible sulfur content does not cause corrosion of copper. It does not contain polychlorinated biphenyls (PCBs) and reacts positively to antioxidants. It has excellent viscous properties at low temperatures, which causes efficient heat transfer in the transformer. The characteristic parameters are given in Table 2 [17,18].

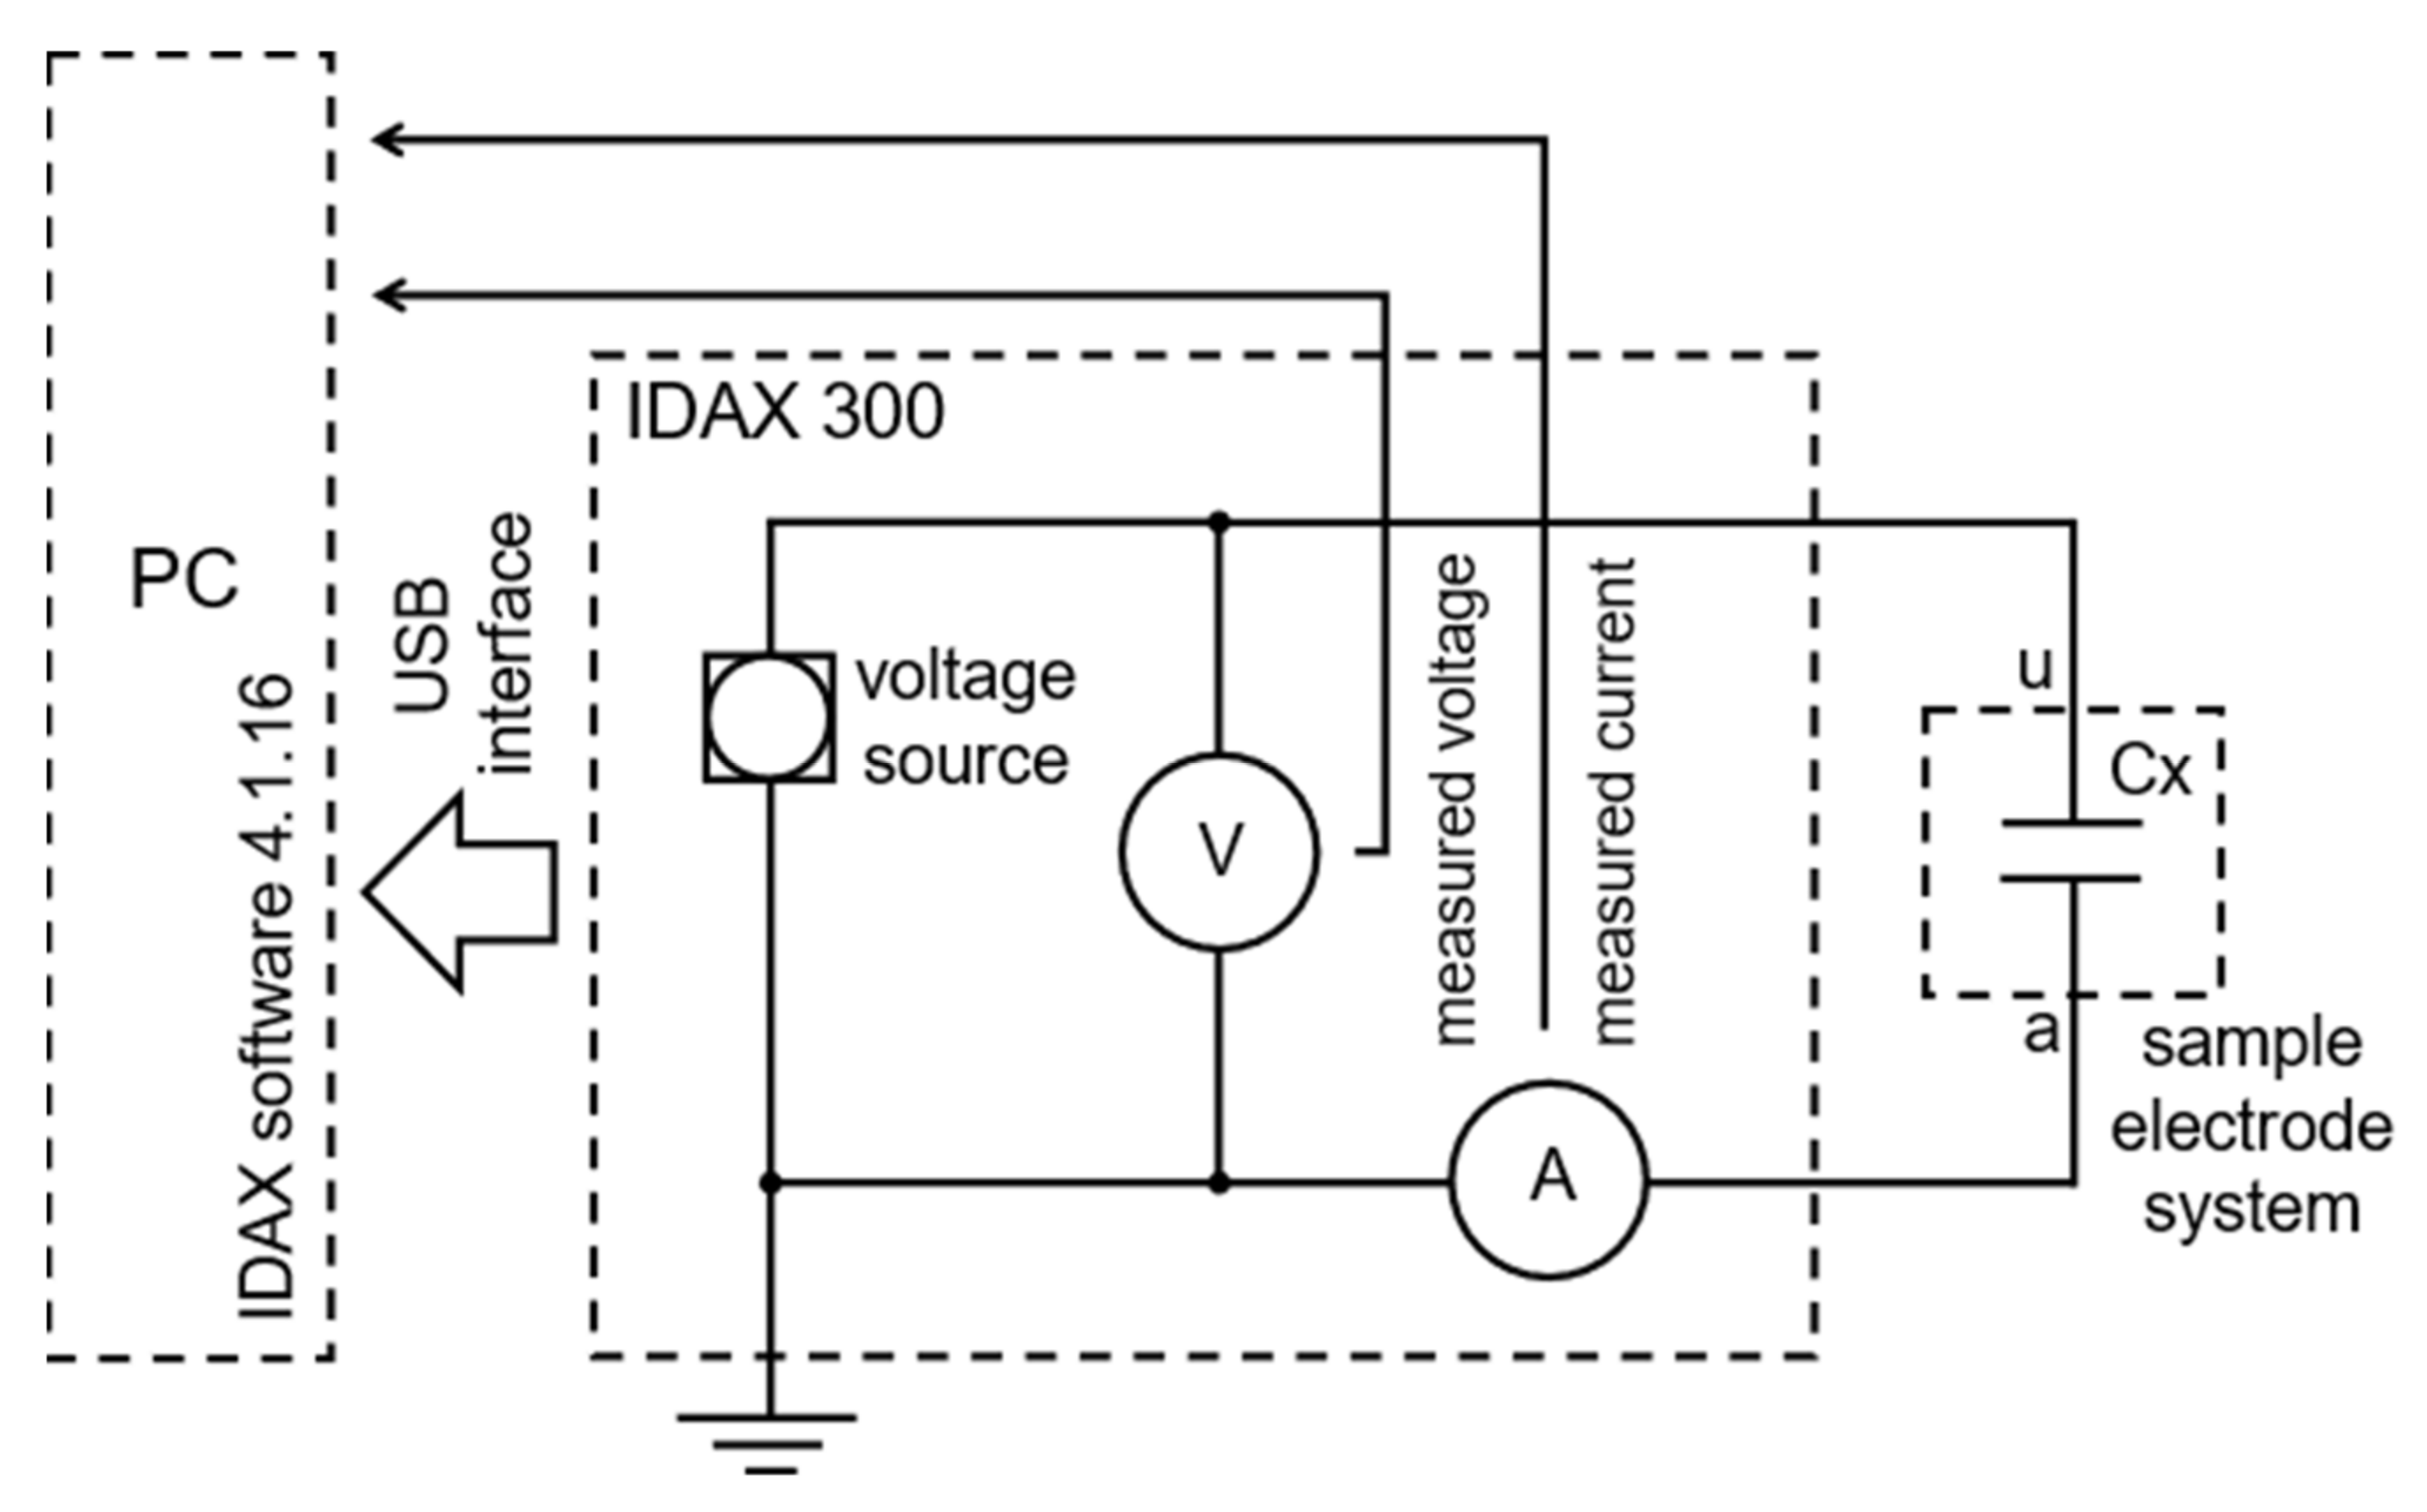
4.2. Experimental Workplace and Instrumentation

Experimental measurements were performed under laboratory conditions with an atmospheric air pressure of 1013 hPa at a temperature of 294 K. We chose the connection of the measuring setup, which is shown in Figure 2.
The diagram in Figure 2 contains the Tettex AG Zürich electrode system type 2903a (protective ring capacitor) with the stainless steel electrode material. It has a geometric capacity of 60 pF, a distance between the electrodes of 2 × 10⁻³ m, a volume of 40 × 10−3 L, and a maximum test field strength of 1 MV/m [34]. Testing of electrical insulating liquids was performed using an IDAX 300 measuring device [35], which was connected via USB (Universal Serial Bus) to a computer with IDAX 4.1.16 software, with which the measured data were collected.

4.3. Realization of the Experiment

We connected all the devices described above, according to the diagram in Figure 2. We first applied a sample of MO mineral oil stored in a plastic canister to the prepared electrode system using a syringe with a volume of 40 × 10−3 L. Subsequently, we placed the electrode system with the MO oil sample in a deaeration pump to eliminate air bubbles for one hour. By using shielded connecting wires we connected the high-voltage and low-voltage electrodes to the IDAX 300 measuring device. In the test procedure, three time-varying electric field intensities with a decimal gradation of 0.5 kV/m, 5 kV/m, and 50 kV/m (RMS – Root Mean Square) were applied to the oil sample in order of the field intensity magnitude in the frequency range from 0.1 mHz to 3 kHz. The measured data were transferred to a computer, from which we analyzed by dielectric relaxation spectroscopy. After obtaining the spectroscopic characteristics of the MO oil, we cleaned, dried, degreased the electrode system, and prepared for the application of the second examined sample of the SD hydrocarbon GTL oil in a similar manner. The SD oil sample was finally subjected to dielectric relaxation spectroscopy at the same applied time-varying electric field intensities in the same frequency spectrum compared with MO oil.

4.4. Description of Applied Electrical Parameters for the Experiment

It is clear that higher harmonics are present in power transformers up to 150 kHz, but their amplitude is small. In [36] there is shown the supraharmonic spectrum of the current at the output of the PV (Photovoltaic) system at the level of mA units. The investigation of the dielectric spectrum in this supraharmonic range requires appropriate measuring apparatus. Most available devices have a test voltage of up to 2 V, which will generate an electric field strength of 1 kV/m. In this paper, we do not deal with the whole range of harmonics and supraharmonic spectra [36], but with the highly polarizing dynamic range given by the fundamental harmonics and close harmonics and subharmonics of the power system. The publication [37] and standards [38,39] state, that the quality of the power system is assessed up to the 40th (2 kHz) and 50th harmonic components of the electric current (2.5 kHz), respectively. Our frequency range for examining the dielectric quantities of insulating oils is 0.1 mHz–3 kHz, which is in line with the assessment of the quality of the power system. In addition, it is necessary to study the frequency spectrum from approximately 1 mHz to 10 kHz to describe the dynamics of conductivity and polarization processes simultaneously. If an LCR meter with a frequency range from 20 Hz to 2 MHz were used, it would not be possible to study conductivity processes that occur in the low-frequency band (0.1 mHz–1 Hz). Therefore, several diagnostic methods would be needed to investigate conductivity processes. From this point of view, the use of the IDAX 300 measuring instrument is suitable for covering several diagnostic methods simultaneously [35,40]. Dealing with power transformers, the frequency range used for frequency-domain spectroscopy analysis is typically 1 mHz–1 kHz [41], which is in line with the analysis of frequency-dependent dielectric parameters in [42,43,44,45,46,47,48,49,50,51,52,53,54].
The standard [54] states that the average electric field strength for testing a sample of dielectric material shall not be less than 5 kV/m (RMS). Higher stress tests are required but must not exceed the ionization threshold at which the sample would be exposed to electric discharges. Dielectric spectroscopy is a non-destructive diagnostic method, so the application of high electric fields to the material would not even be possible [51]. The average electric field test ranges are from 5 kV/m to 30 kV/m (RMS). No minimum voltage is specified when using low voltage measurement instruments for routine tests. However, high electrical stresses must not be applied, which would degrade the test material [54]. In this study, we apply electric field intensities of 0.5 kV/m, 5 kV/m, and 50 kV/m (RMS), as described in Chapter 4.3. The selected electric field intensities are under the normal and average test range of electric stress similarly as in [21,27,43,46,49,53,54]. Our goal was to obtain experimental data at the electric field intensity, which can occur in the power transformer during normal operation, see [55]. Intensities of 0.5 kV/m, 5 kV/m, and 50 kV/m (RMS), which were produced in the experimental test fixture [34], corresponded to the application of test voltages 1 V, 10 V, and 100 V (RMS). Dielectric tests require an increased current load on the test apparatus, therefore a professional test cell Tettex AG Zürich 2903a was used to achieve the required electric field strength [34,56]. Another reason for applying these electric field intensities is to investigate the dielectric behavior of oils at lower and higher intensities, as in [21], with decimal scaling to compare the effect of a 10-fold increase in the electric field on samples. The IDAX 300 m has a frequency range from 0.1 mHz to 10 kHz and a maximum test voltage of 200 V (RMS), which would cause a field strength of 100 kV/m. The frequency spectrum investigated by us is limited to 3 kHz due to the applied voltage of 100 V (50 kV/m), because in the frequency band 4 kHz–10 kHz, a higher electric current is generated, which burdens the source of the measuring instrument. It is due to a decrease in capacitive reactance with increasing frequency. Simply put, increasing the frequency (4 kHz–10 kHz) decreases the capacitive reactance of the measuring apparatus, which creates a higher electric current in the measuring circuit (at 100 V), which loads the source of the IDAX 300 m [23]. Therefore, the frequency limit of the measuring circuit, to achieve the highest possible electric field intensity, is up to 3 kHz. An increase in the applied voltage (>100 V) would cause a decrease in the frequency band (<3 kHz), which would mean less coverage of the investigated phenomena in the insulating fluids.

5. Analysis of Dielectric Properties of Electrical Insulating Oils by Dielectric Relaxation Spectroscopy

For the analysis of experimental samples, we chose dielectric relaxation spectroscopy to examine the dielectric parameters, the complex electric modulus M*, the electrical conductivity σ, and the complex impedance Z*. Complex electric modulus M* was derived by application of the measured values of the complex permittivity ε* to Equation (1).

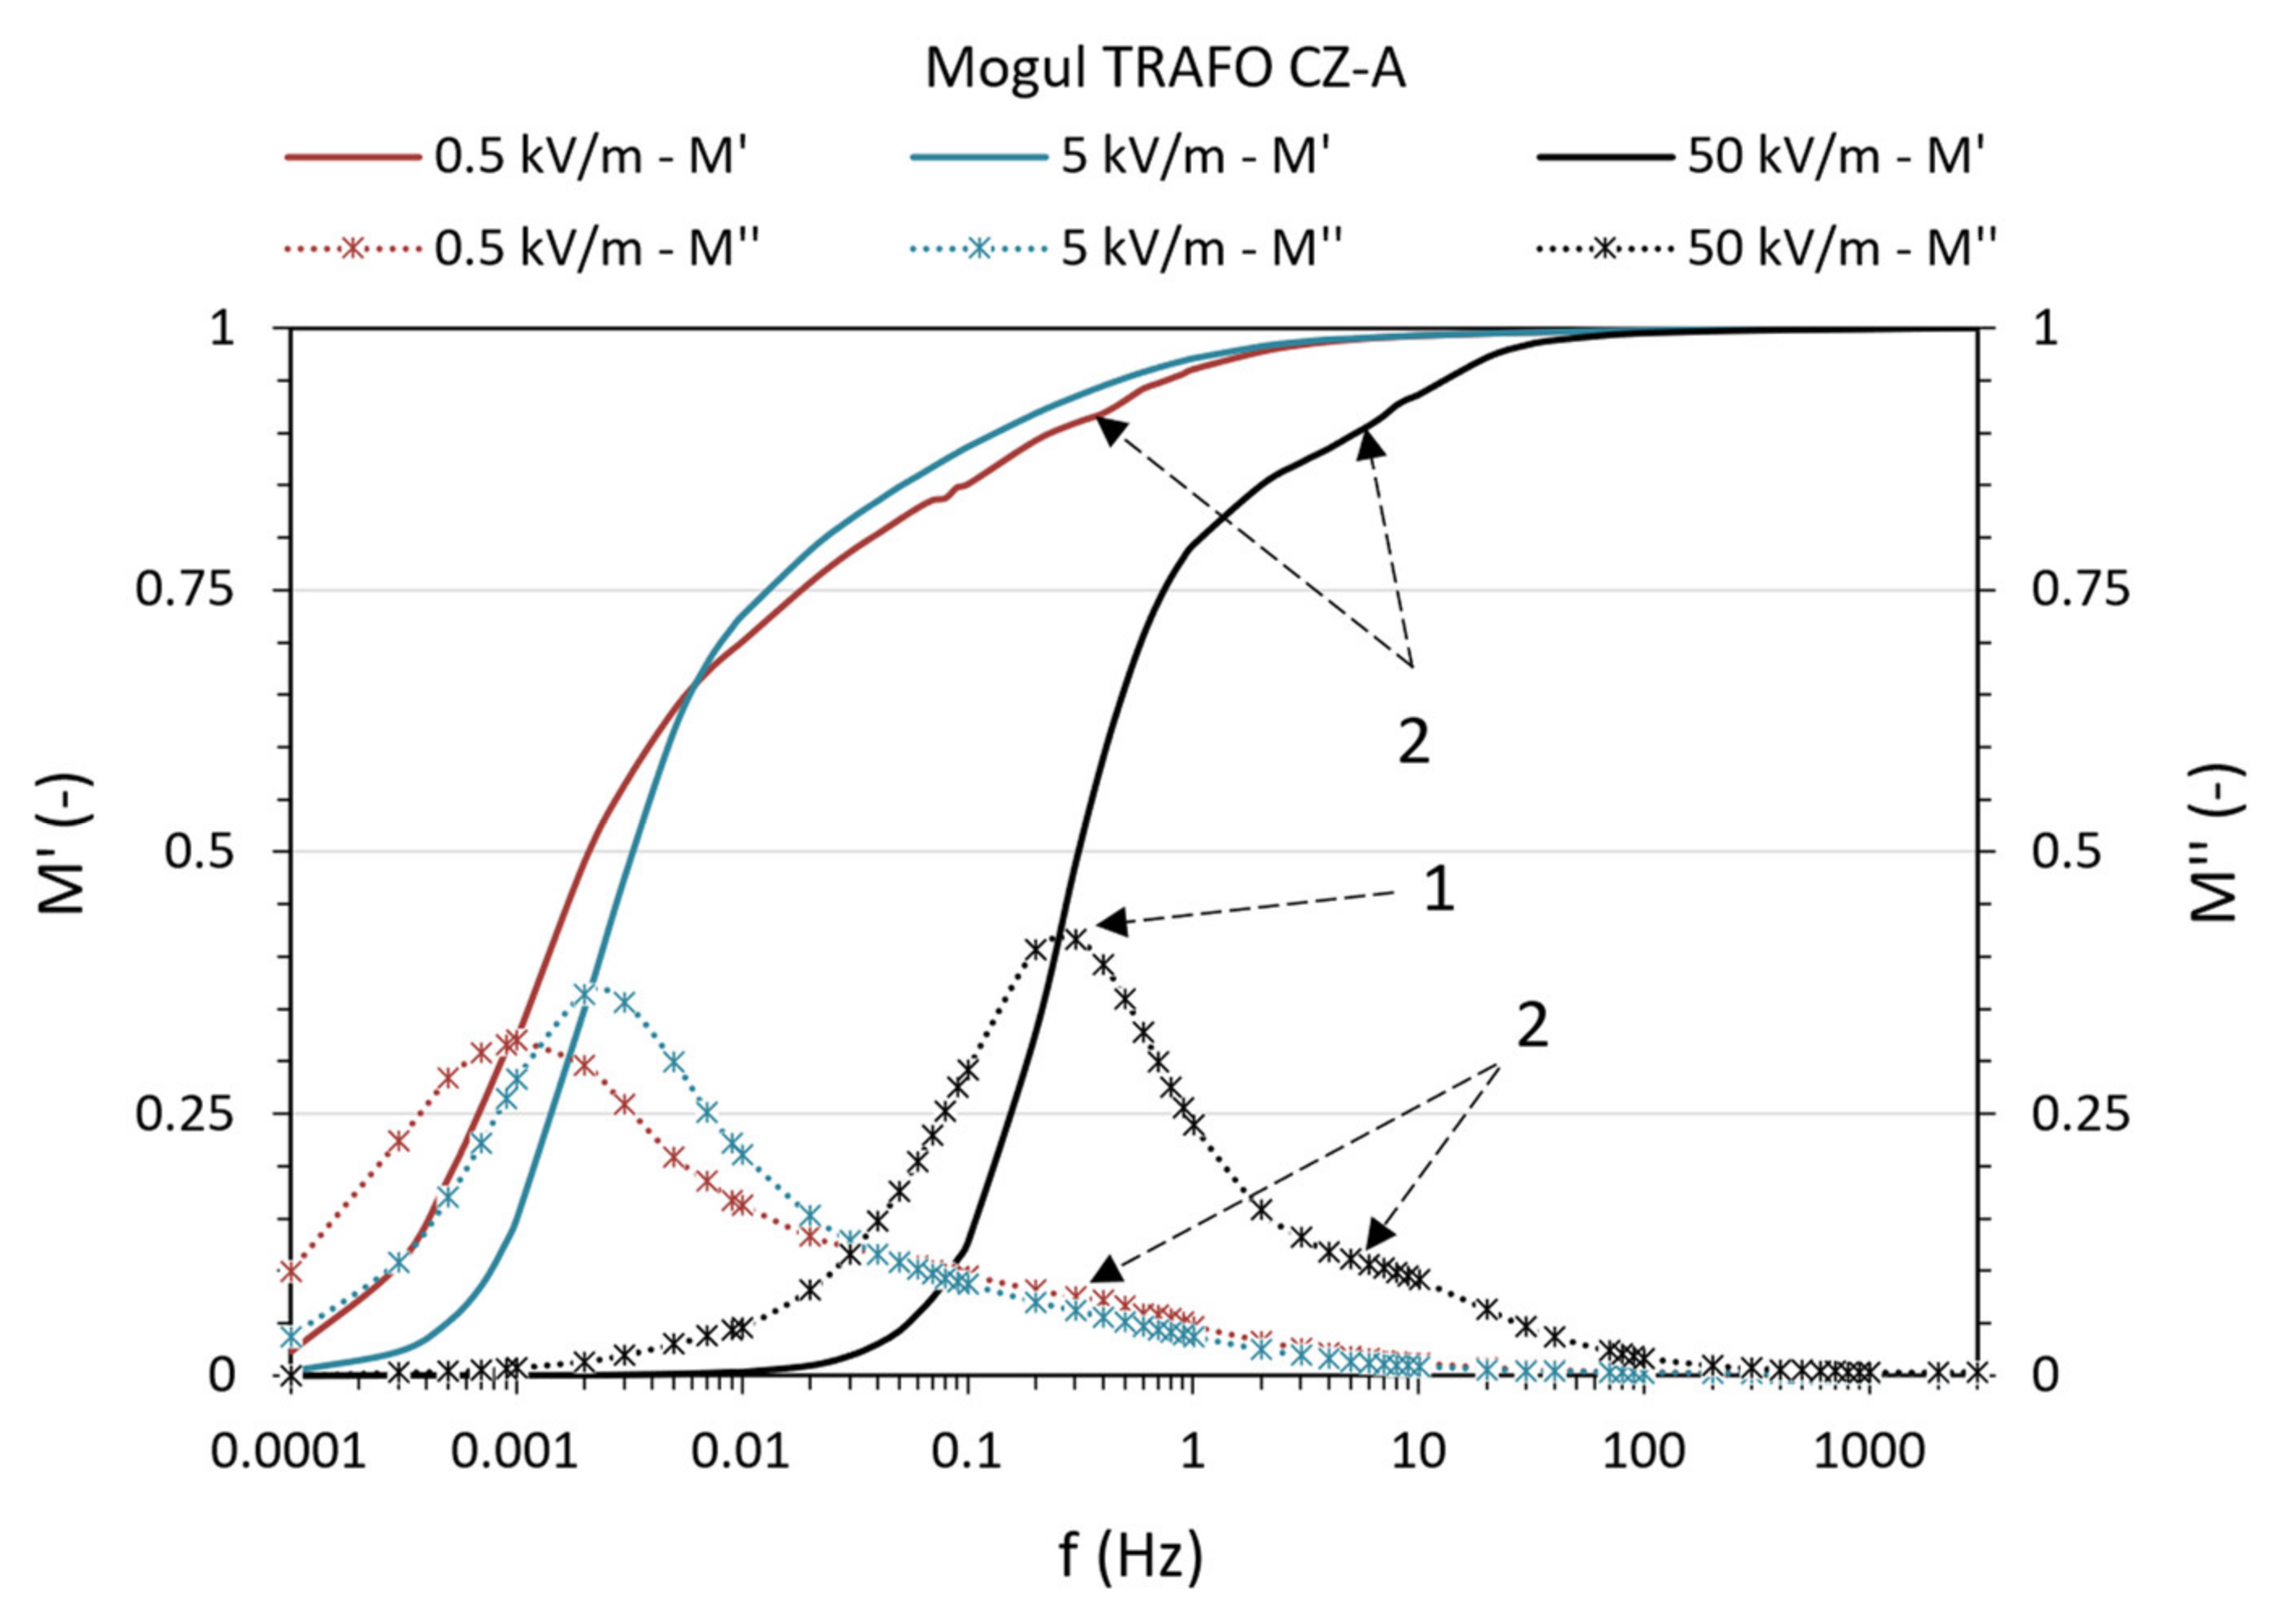
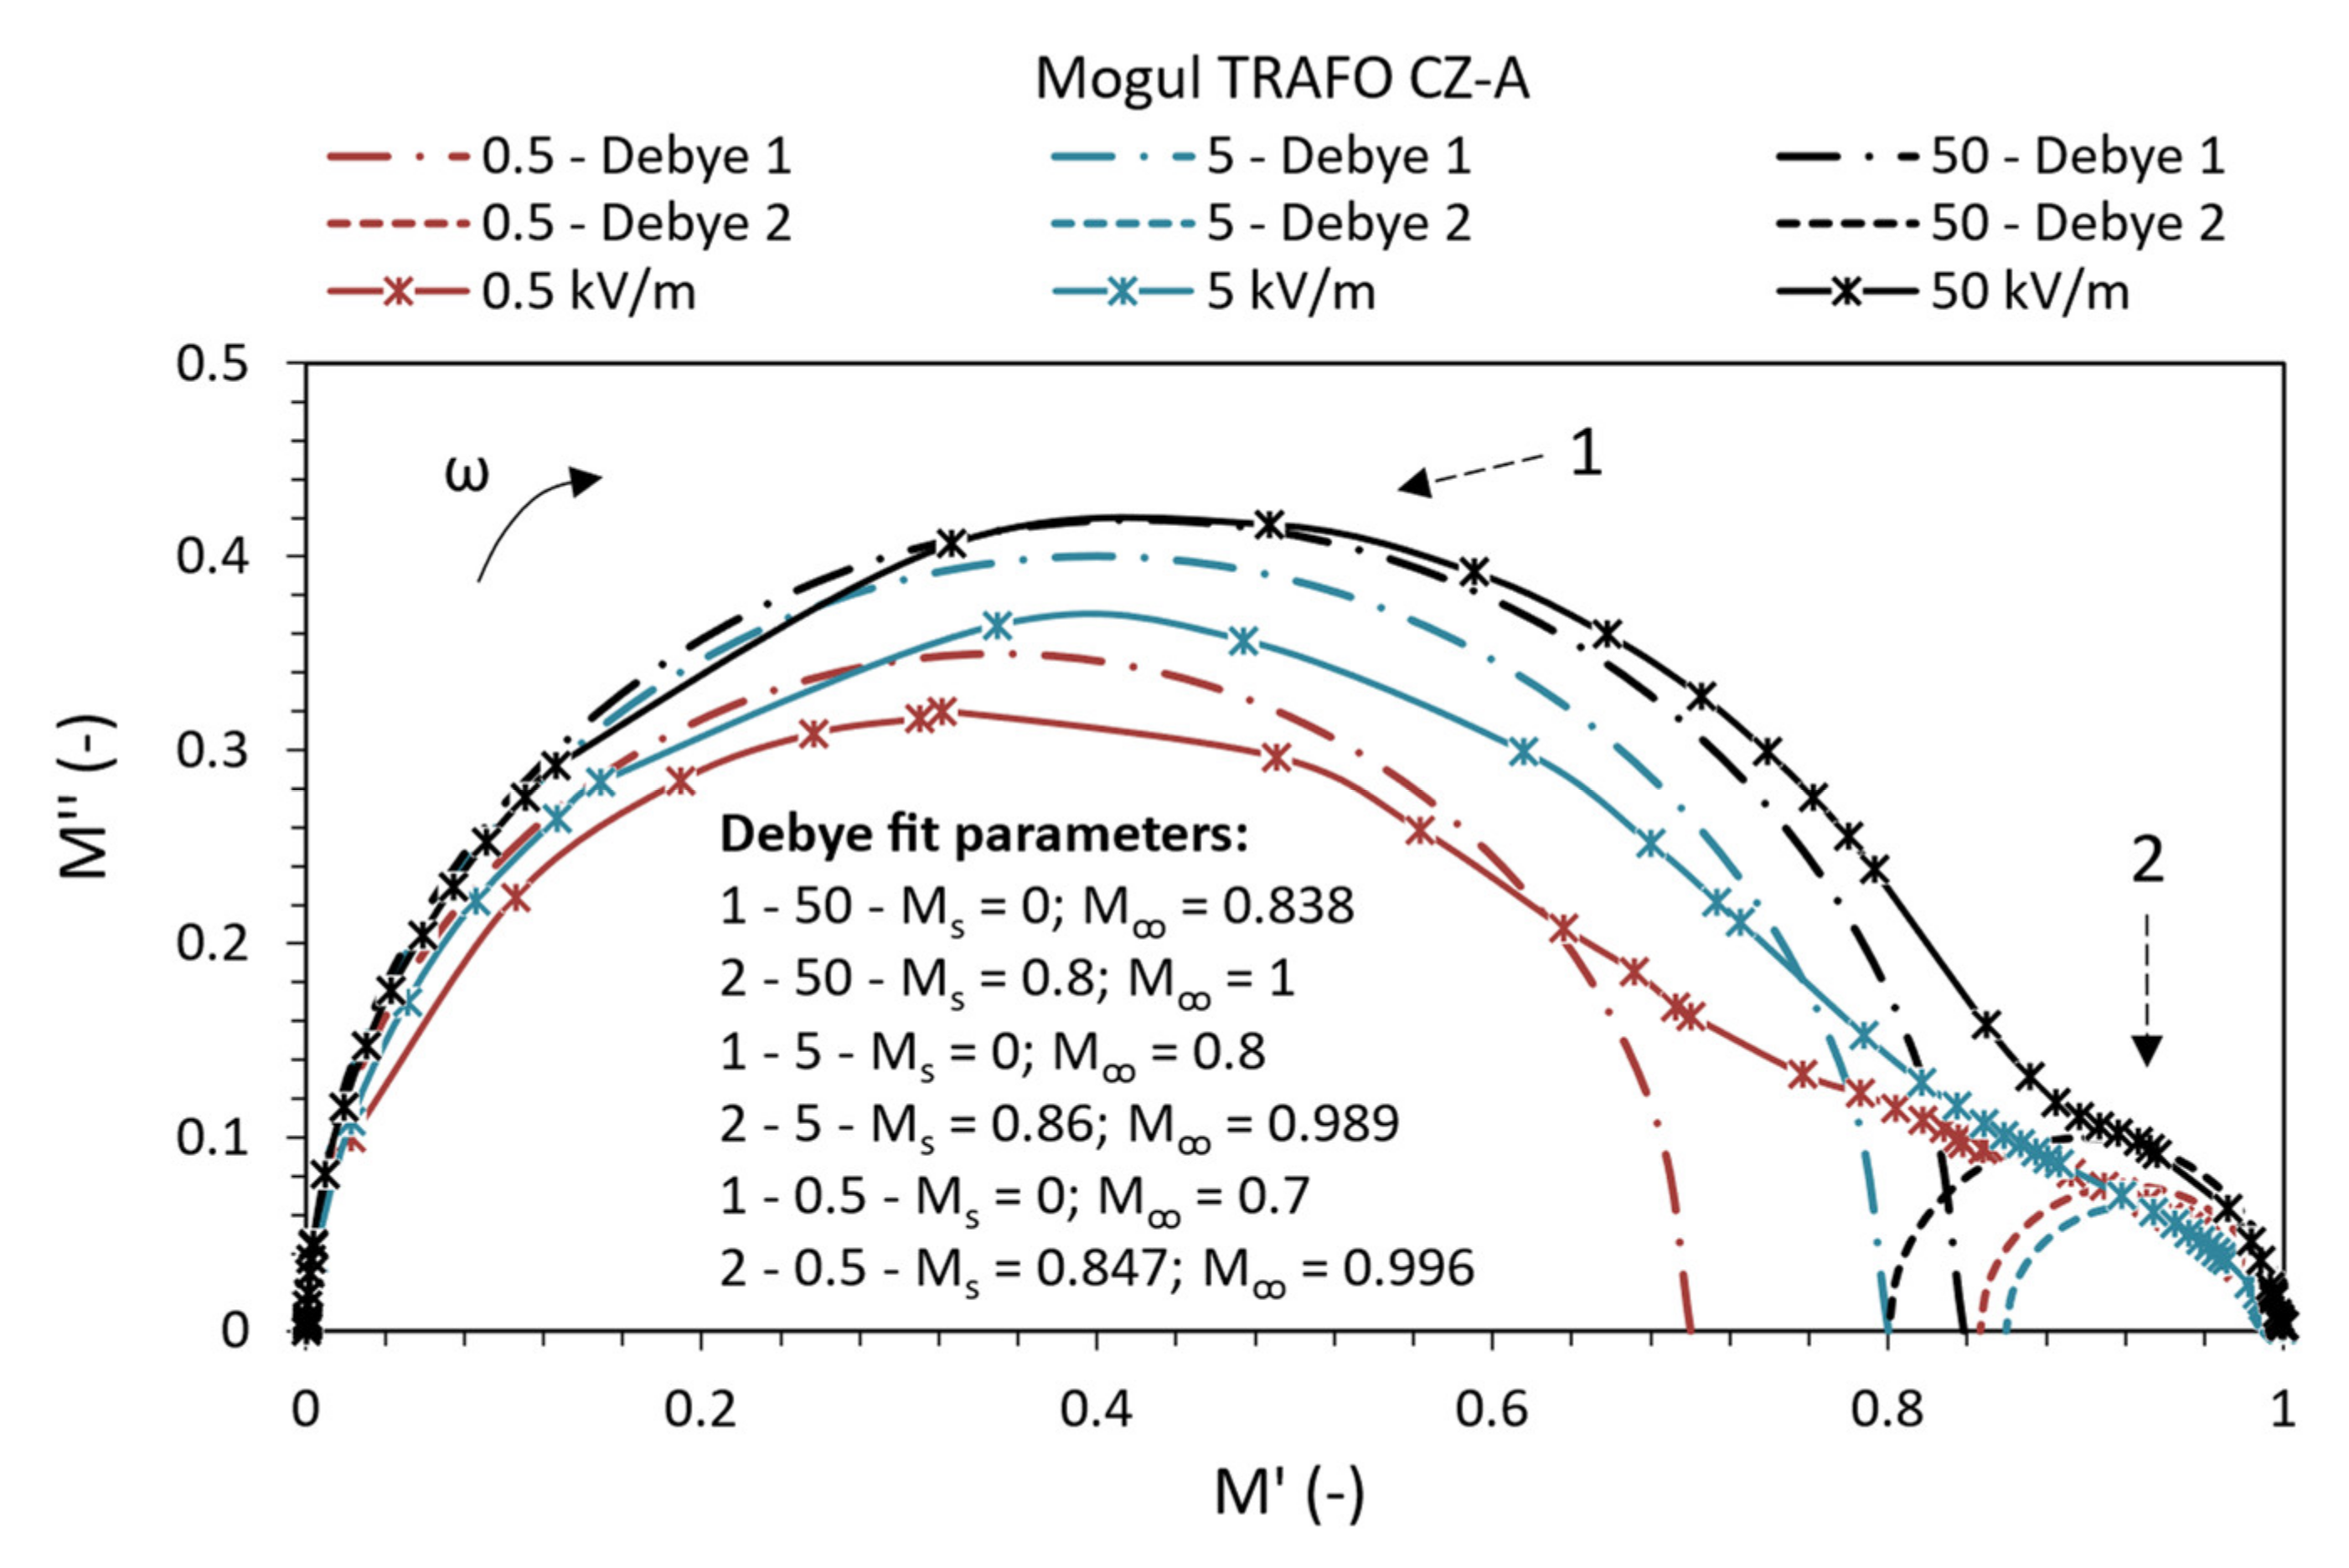
5.1. Analysis of Polarization Processes of MO Oil

Figure 3 shows the dependence of a complex electric modulus’s real and imaginary parts in the measured frequency spectrum 0.1 mHz–3 kHz. A decimal increase in the applied intensity of the time-varying electric field causes the curves of the real and imaginary part of the complex electric modulus of MO oil to shift to higher frequencies. With this shift, the maximum values of the imaginary part Mm″ also increase. Considering the state of ideal dielectric parameters with the relation Mm″ = 1/2 (Mm′) it is clear that increasing the intensity of the electric field improves the dielectric properties of the oil MO by approaching Mm″ to 0.5. The given mechanism is attributed to the dielectric relaxation, indicated in Figure 3 by the number 1. These are relaxation peaks whose position is according to a decimal increase in the intensity of the electric field at frequencies of 1 mHz, 2 mHz, and 0.3 Hz. The deformation of the curves M′ and the broadening of the curves M″ is indicated by the number 2, as the second relaxation process in the measured frequency band. Their relaxation peaks are located at frequencies of 0.3 Hz and 7 Hz in order of decimal increase in electric field strength.
According to the Cole-Cole diagram, the representation of the values of the real and imaginary parts of the complex electric modulus in the complex plane is shown in Figure 4. This diagram confirms all the mentioned processes in Figure 3. All the continuous curves in Figure 4 show the character of a waveform composed of two polarization processes with different relaxation times τM. According to Equation (3), ideal Debye relaxation curves were plotted for both polarization processes (dotted and dashed curves) with the indicated fitting parameters based on the Cole-Cole principle of the distribution of relaxation times. By obtaining the Debye characteristics and comparing them with the measured data, the parameter α was expressed, characterizing the degree of distribution of relaxation times. For this parameter, it was necessary to obtain the angle π∙α/2, formed by the line (between the center of the semicircle and the coordinates (0; 0)) and the x-axis of the real part complex electric modulus M. By obtaining the parameter α (Table 3), we can say that with increasing intensity of the time-varying electric field in the measured frequency band of the oil MO, there is a more excellent approximation of the Debye behavior in both captured polarization mechanisms (1 and 2).

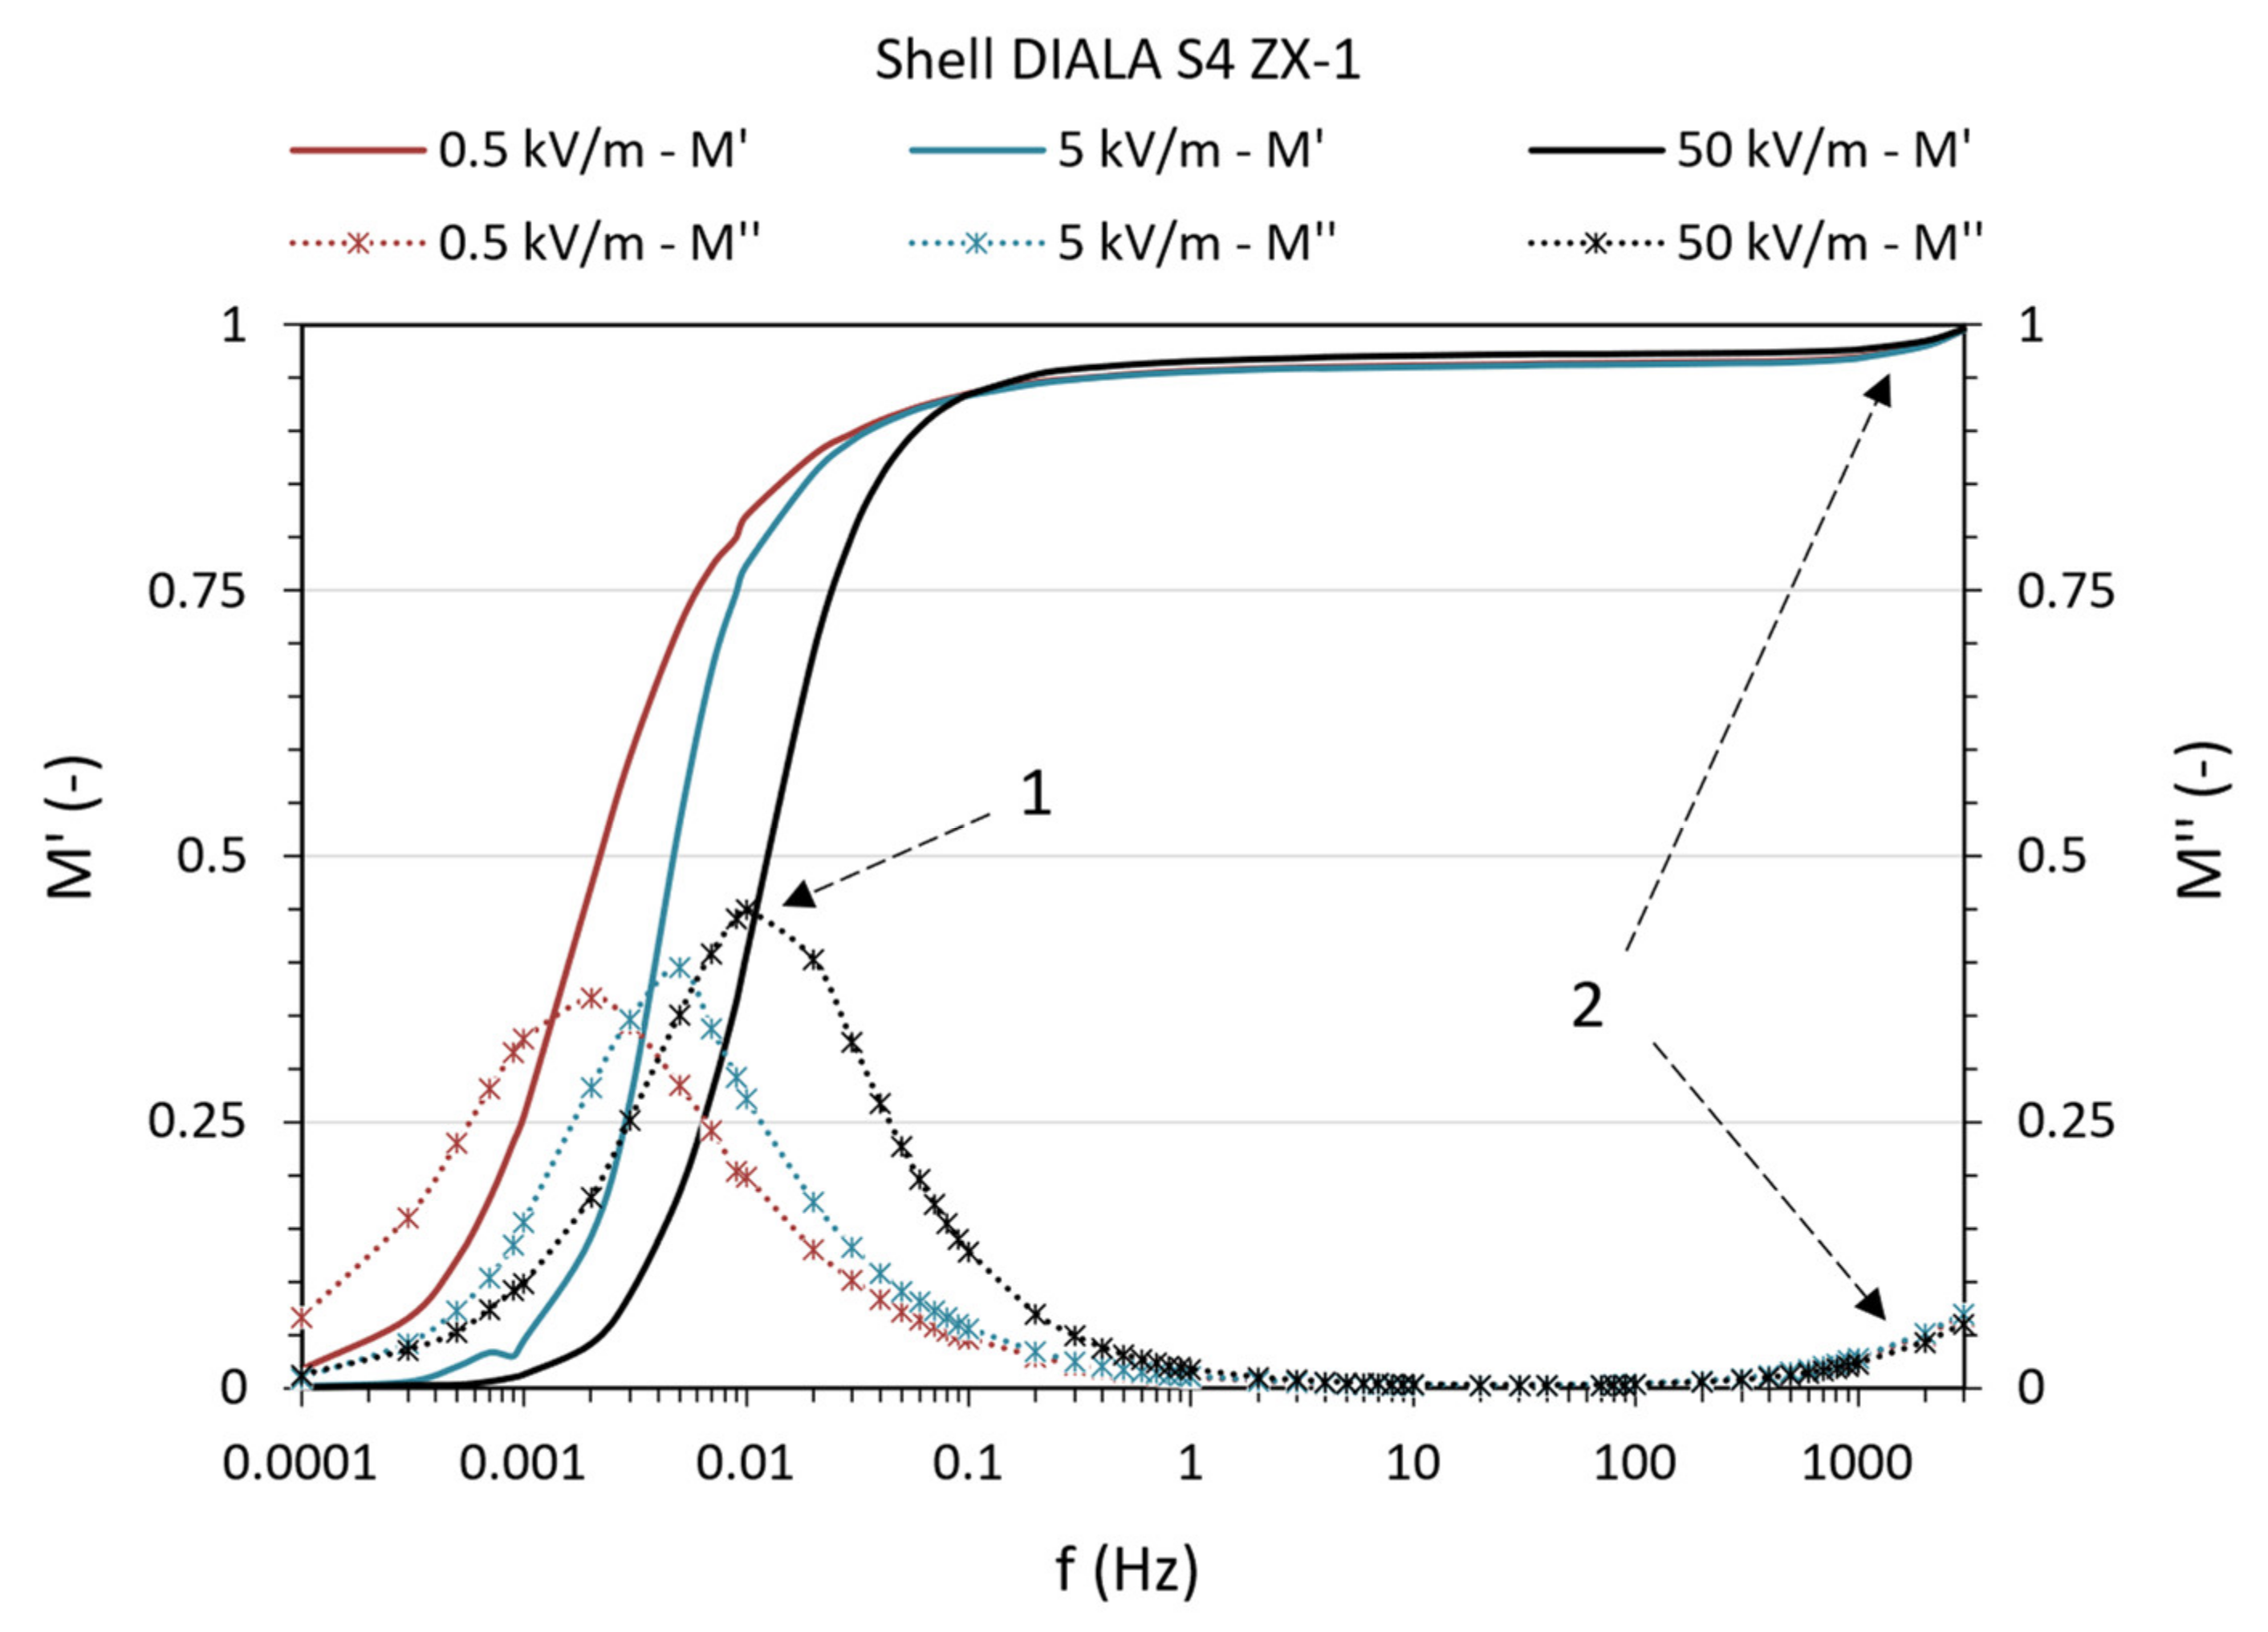
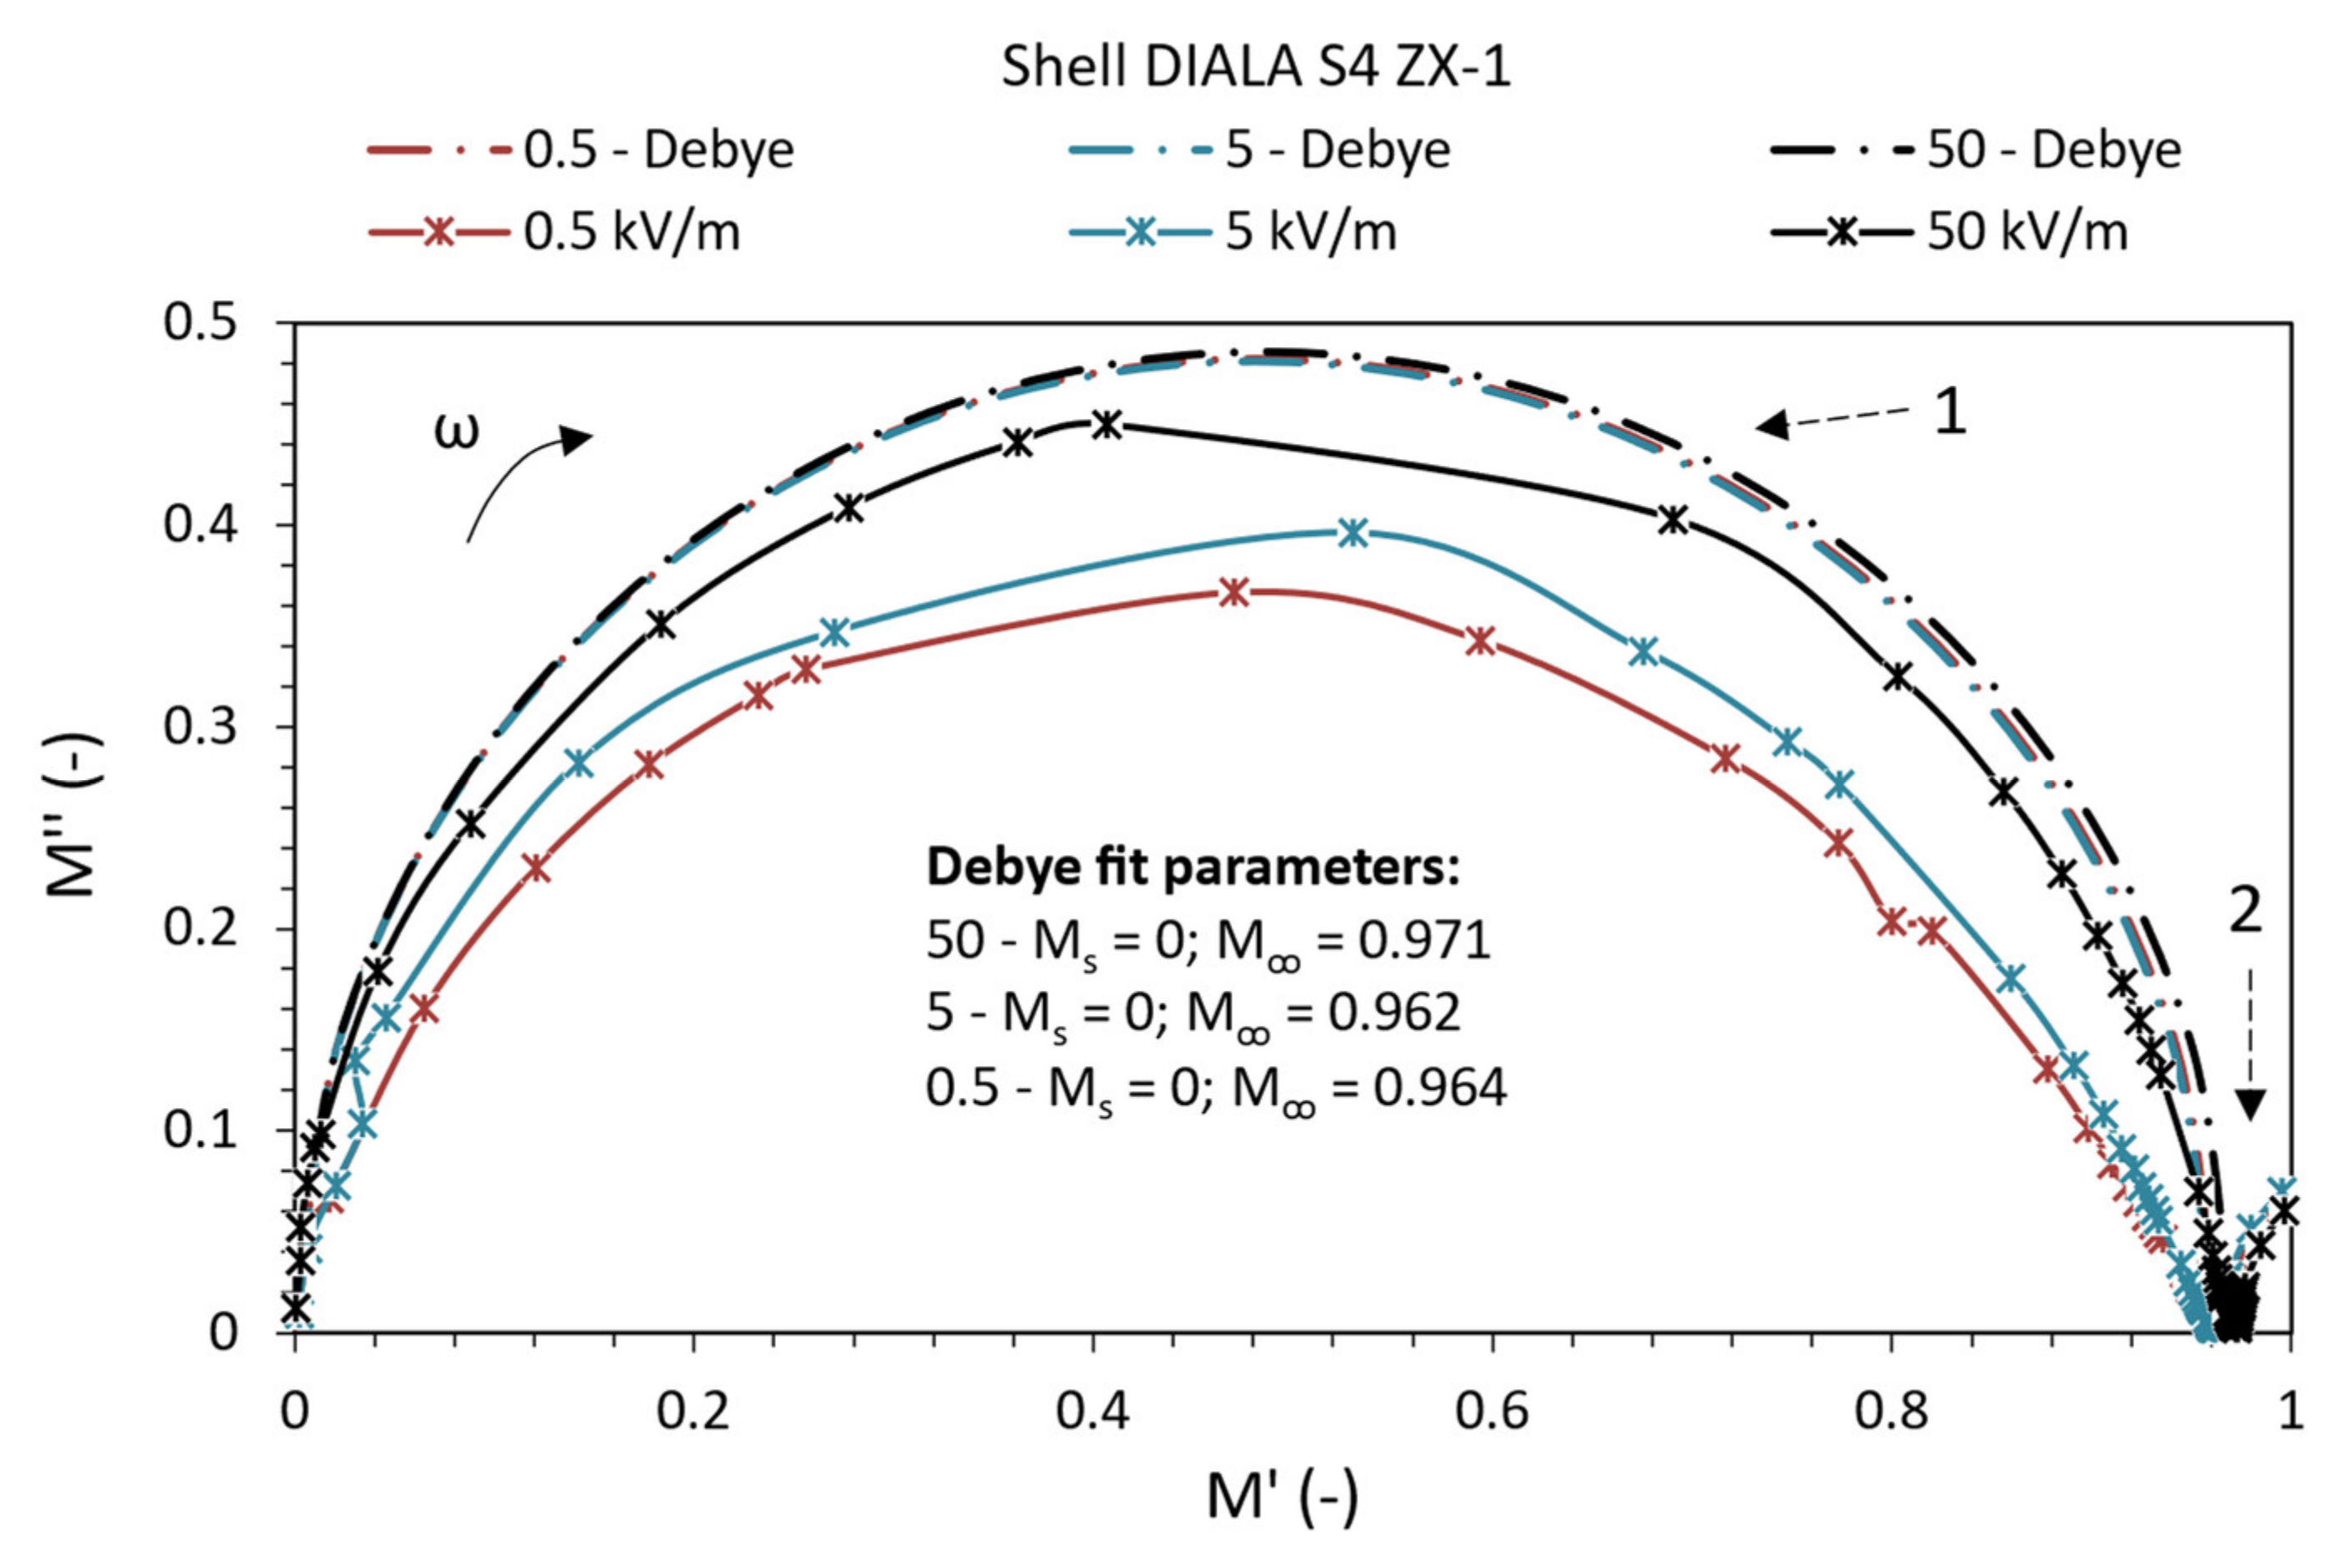
5.2. Analysis of Polarization Processes of SD Oil

The frequency dependences of the real and imaginary parts of the complex electric modulus of SD oil are shown in Figure 5. As the intensity of the time-varying electric field increases, the curves M′ and M″ shift to higher frequencies. With said dispersion of the curves M′, there is a gradual increase in the values of Mm″ with the decimal applied intensity of the electric field. This effect indicates an improvement in the dielectric properties in approaching the ideal state with a value of 0.4865 for a given relaxation process. The number 1 in Figure 5 denotes the first polarization process, manifested by a peak (at M″) together with an S-shaped curve (at M′). The process manifested itself at frequencies of 2 mHz, 5 mHz, and 10 mHz, respectively, according to a decimal increase in electric field strength. In the high-frequency band of the measured frequency spectrum, from approximately 400 Hz, the values of M′ and M″ gradually increase. The given increase in values is attributed to the developing polarization phenomenon, marked with the number 2. Its relaxation maximum cannot be defined due to the limited frequency range of the measuring instrument.
Confirmation of the ongoing events in the SD oil of Figure 5 is presented by plotting it in the Cole-Cole diagram in Figure 6. In this view, we point to the presence of one polarization process with a capture of the beginning of the developing second polarization process. According to the Cole-Cole principle, ideal Debye curves were obtained for different electric field intensities, the output parameters of which differ only slightly. The obtained parameters α, given in Table 3, indicate a more significant distribution of relaxation times with a decimal decrease of the applied intensity of the time-varying electric field. It is due to the increasing displacement of the center of the semicircle below the real axis M′. In the developing second polarization process in the frequency band, it was not possible to determine the ideal characteristics of Debye, as this is only an indication of said relaxation.

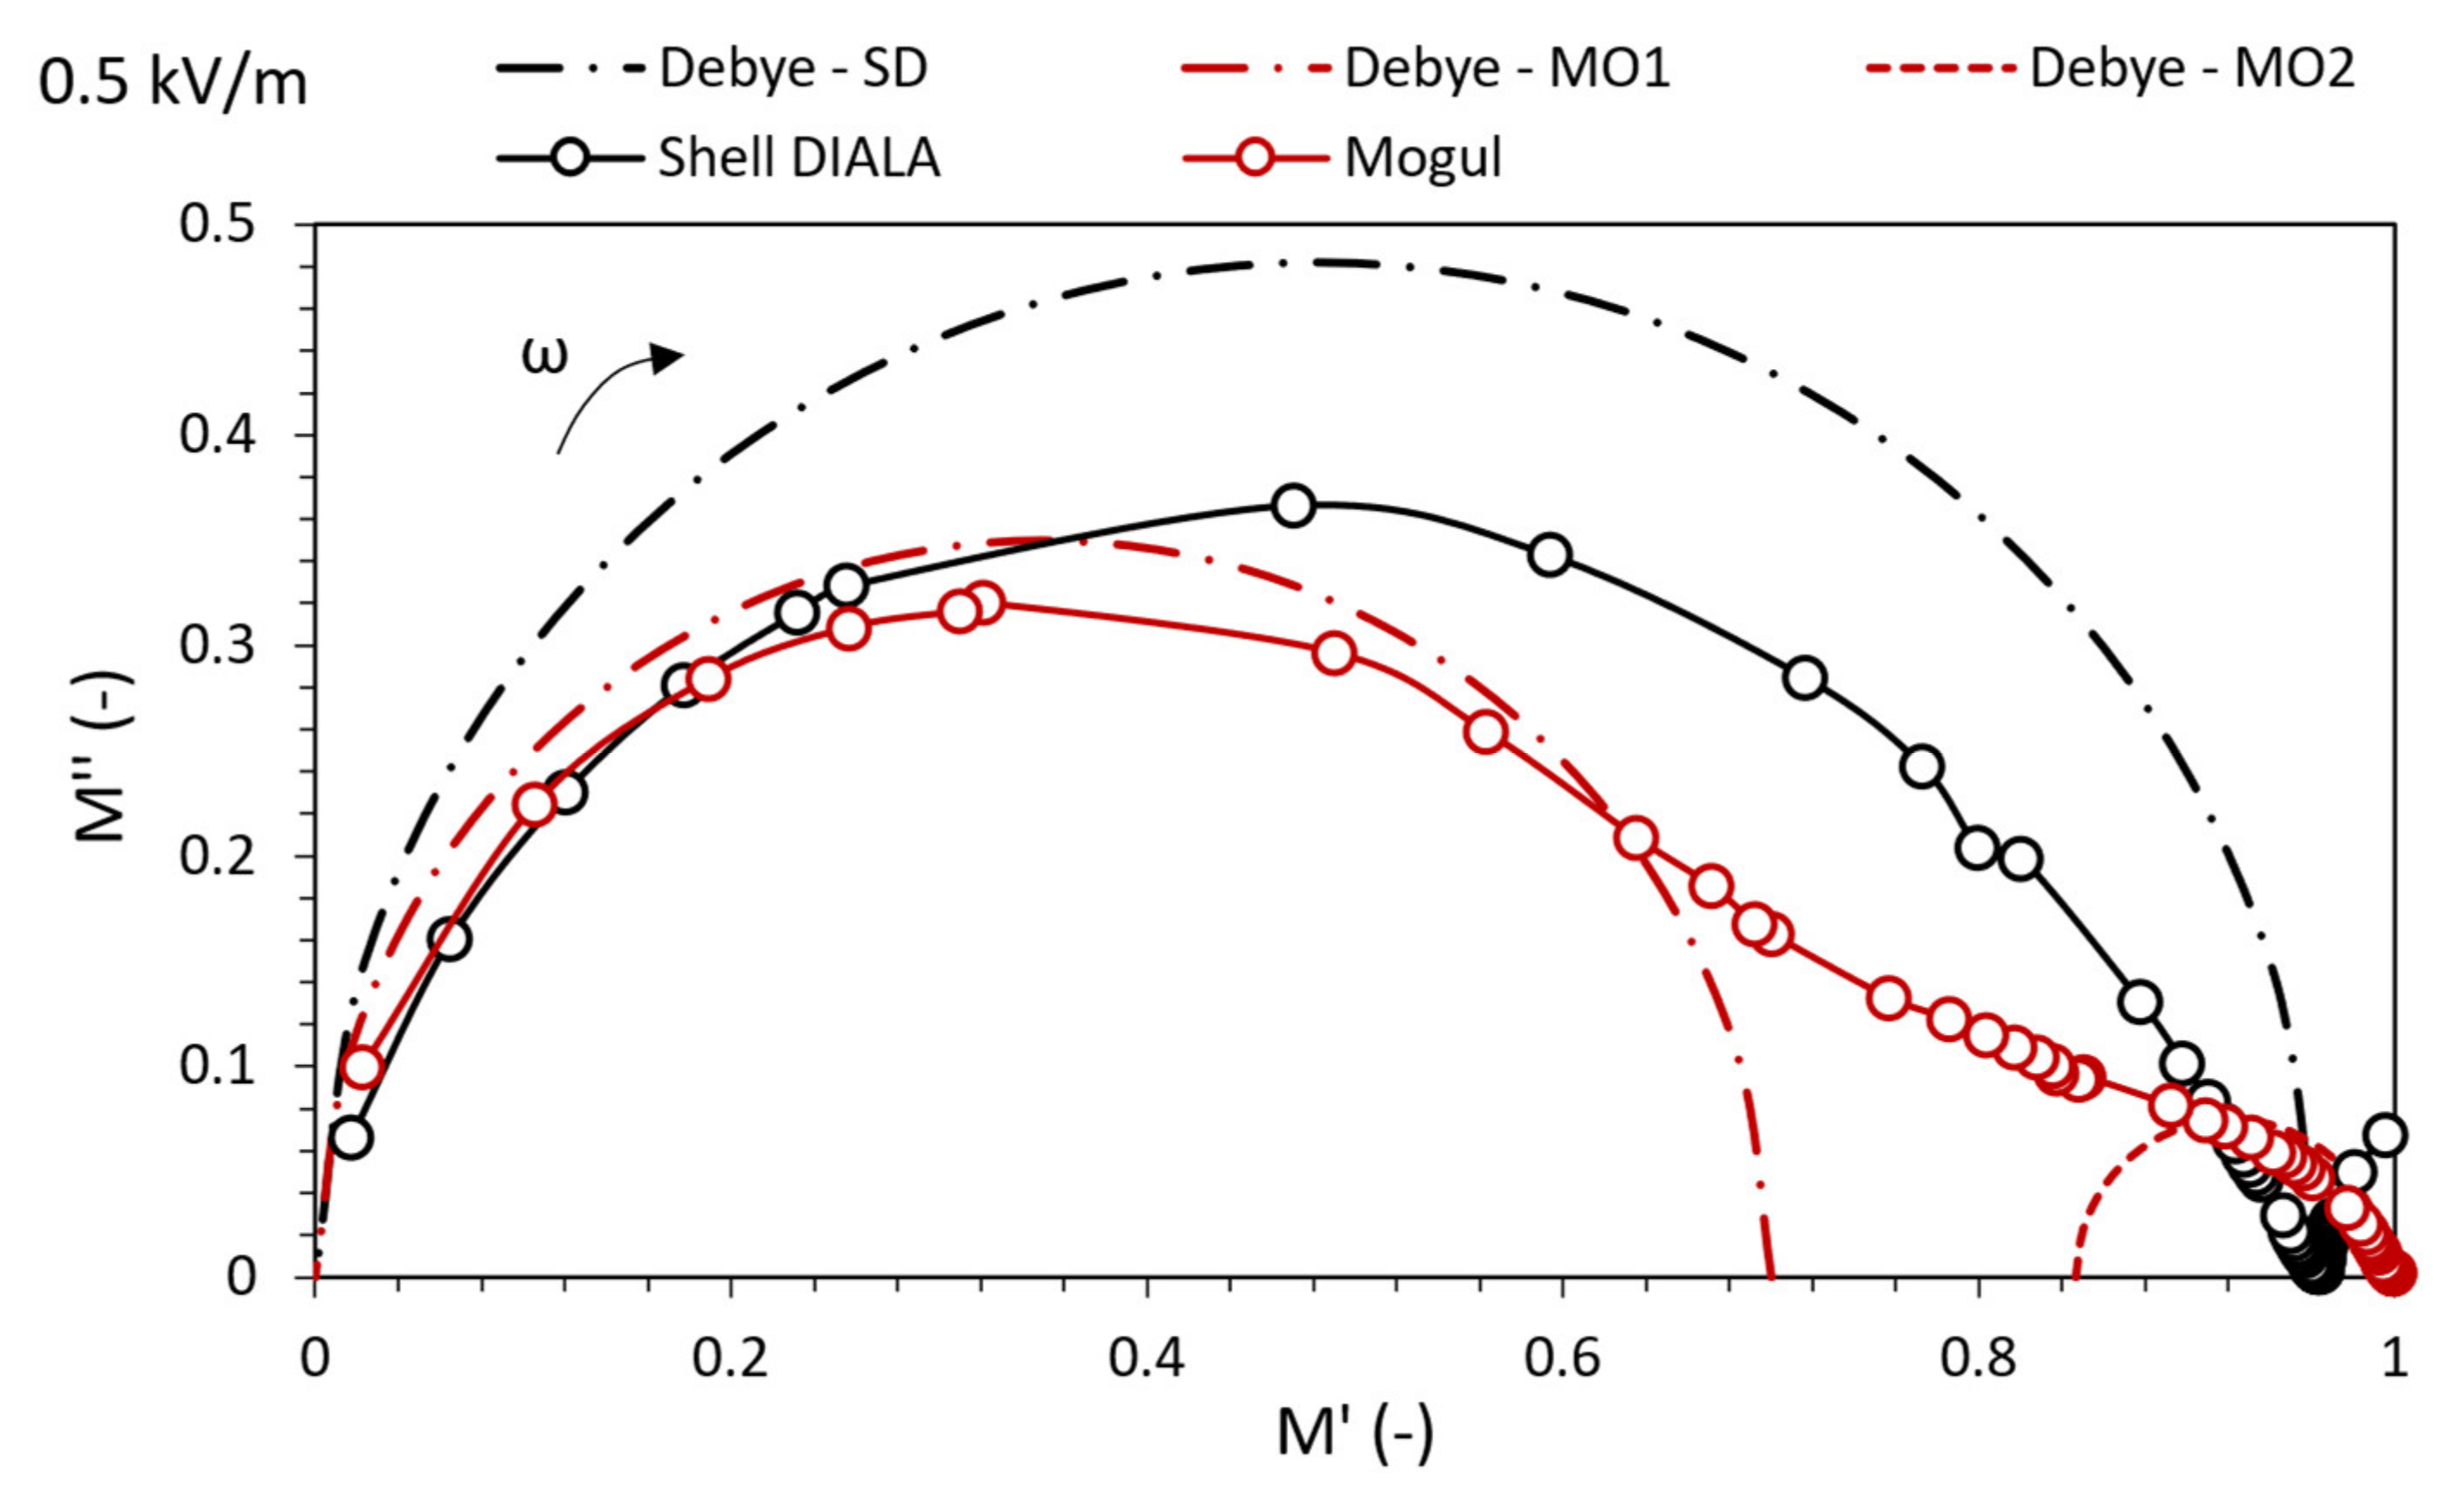
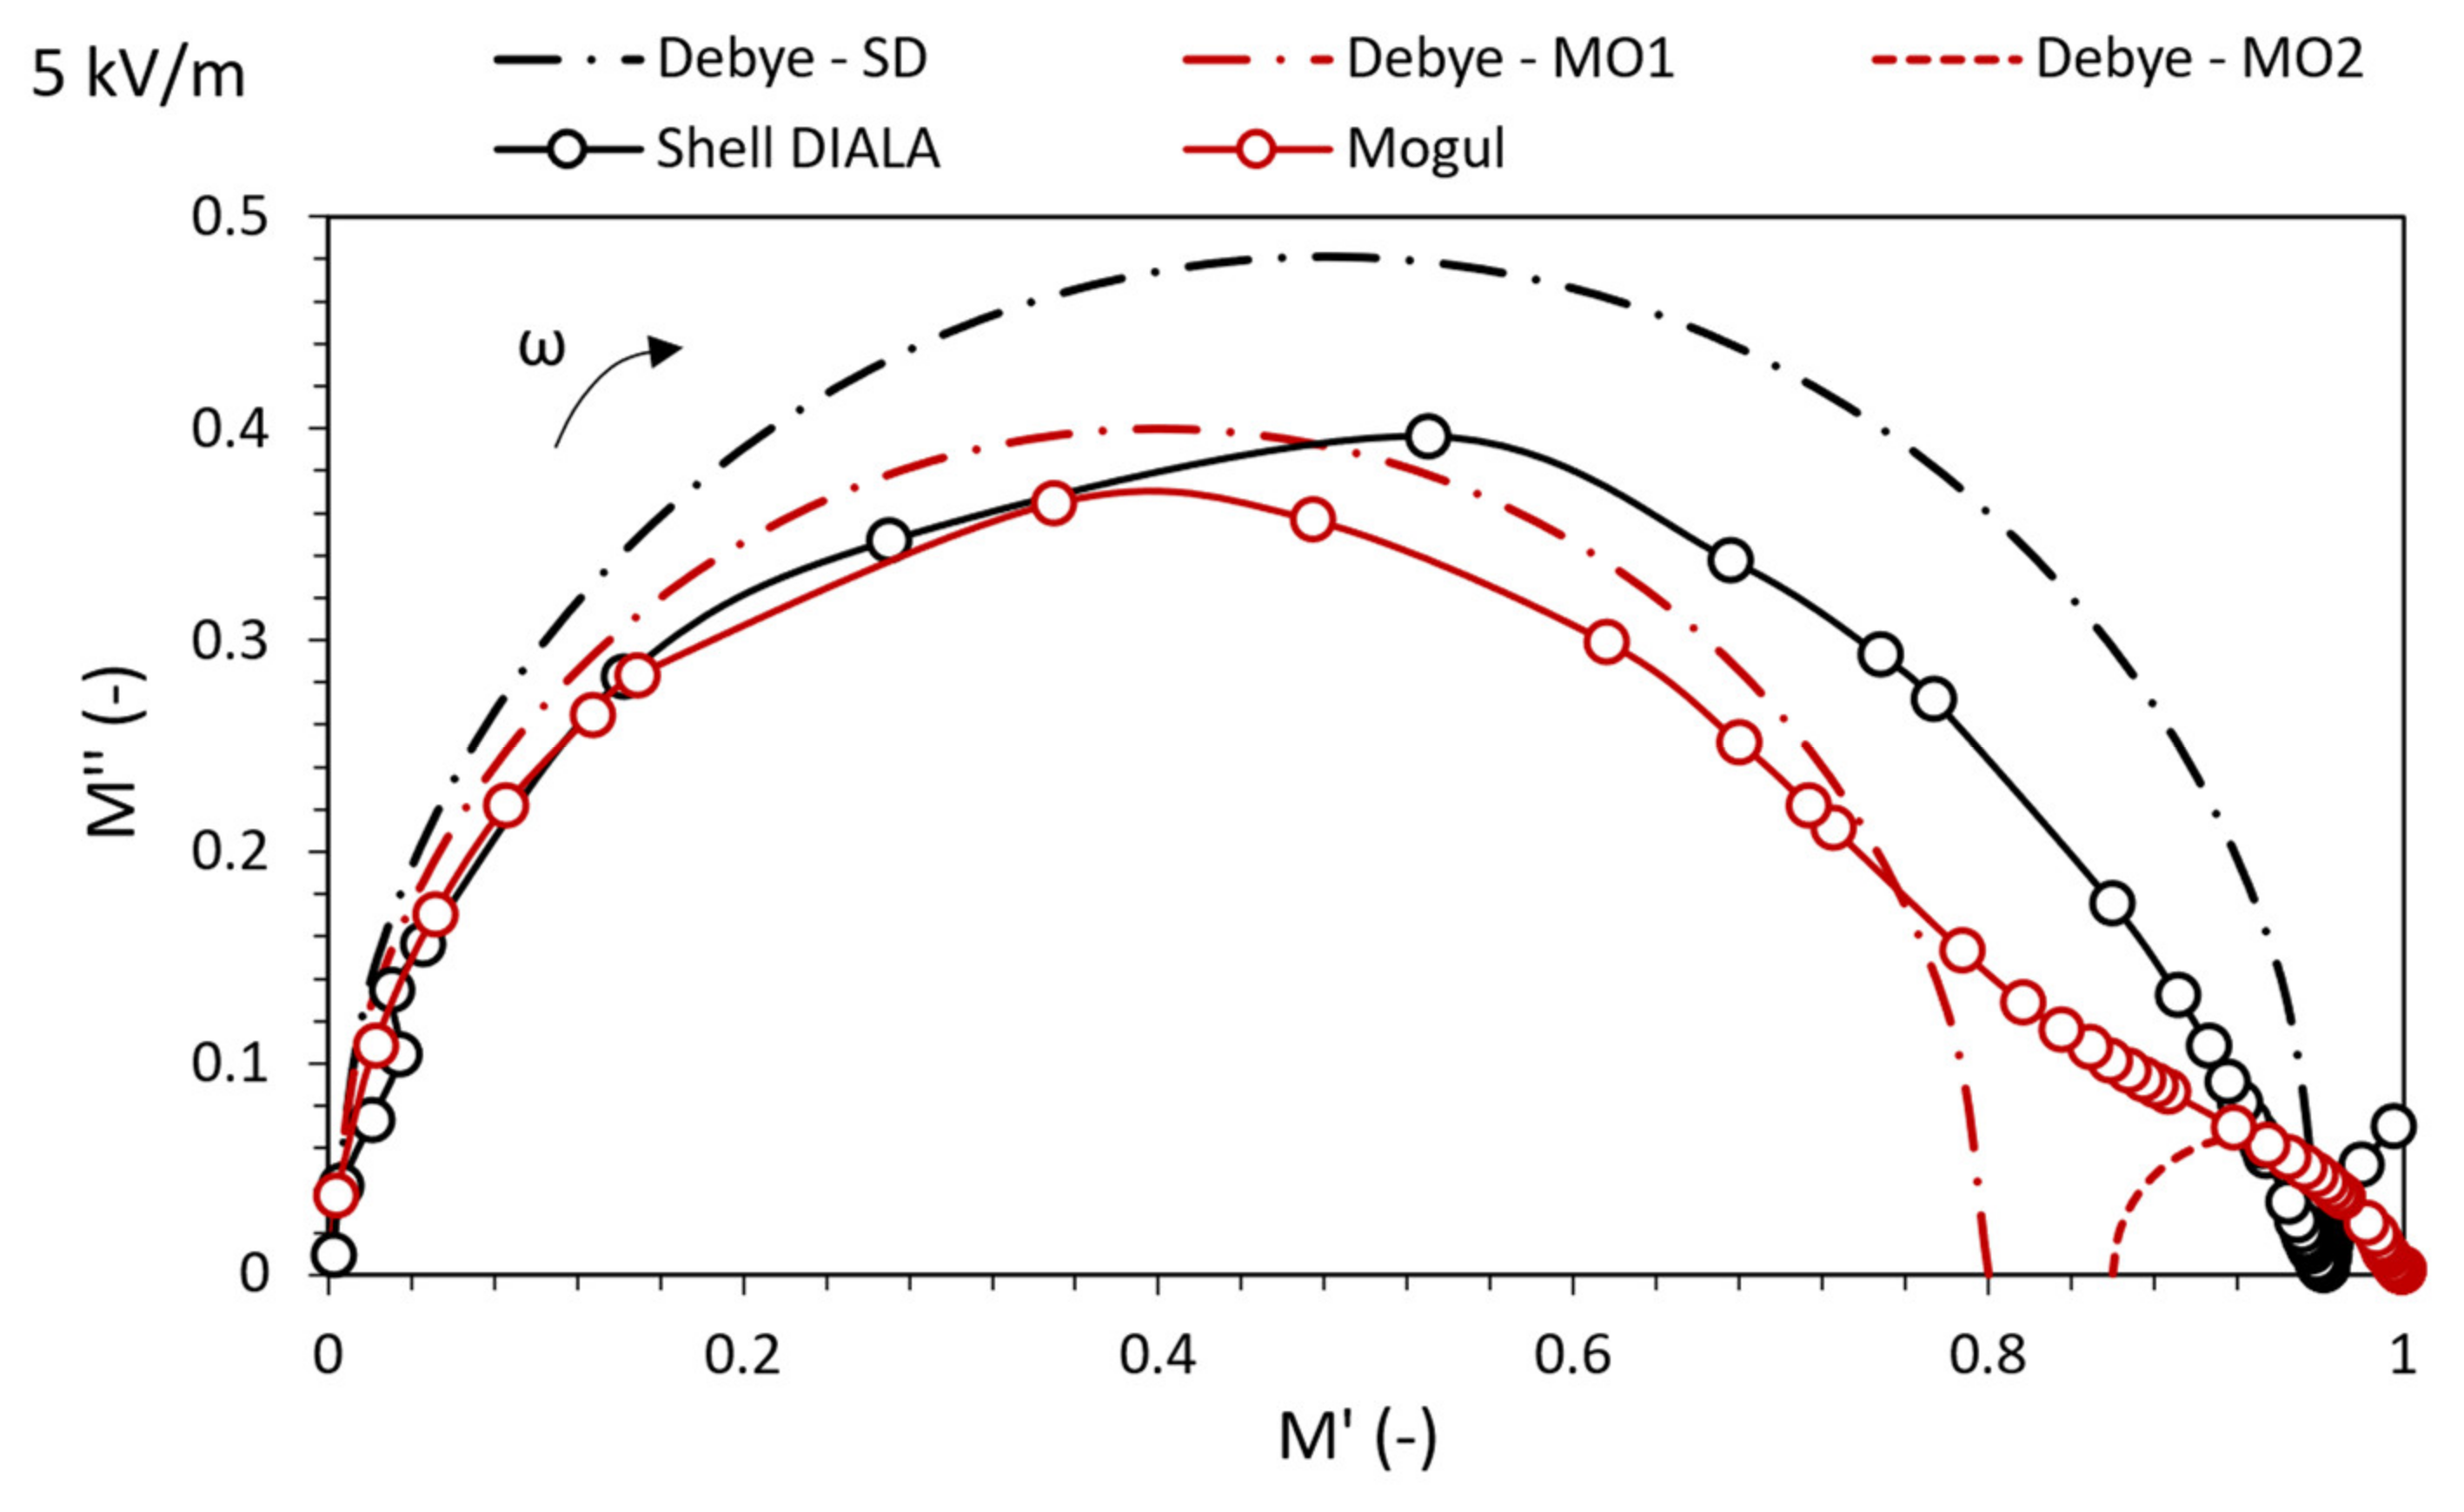
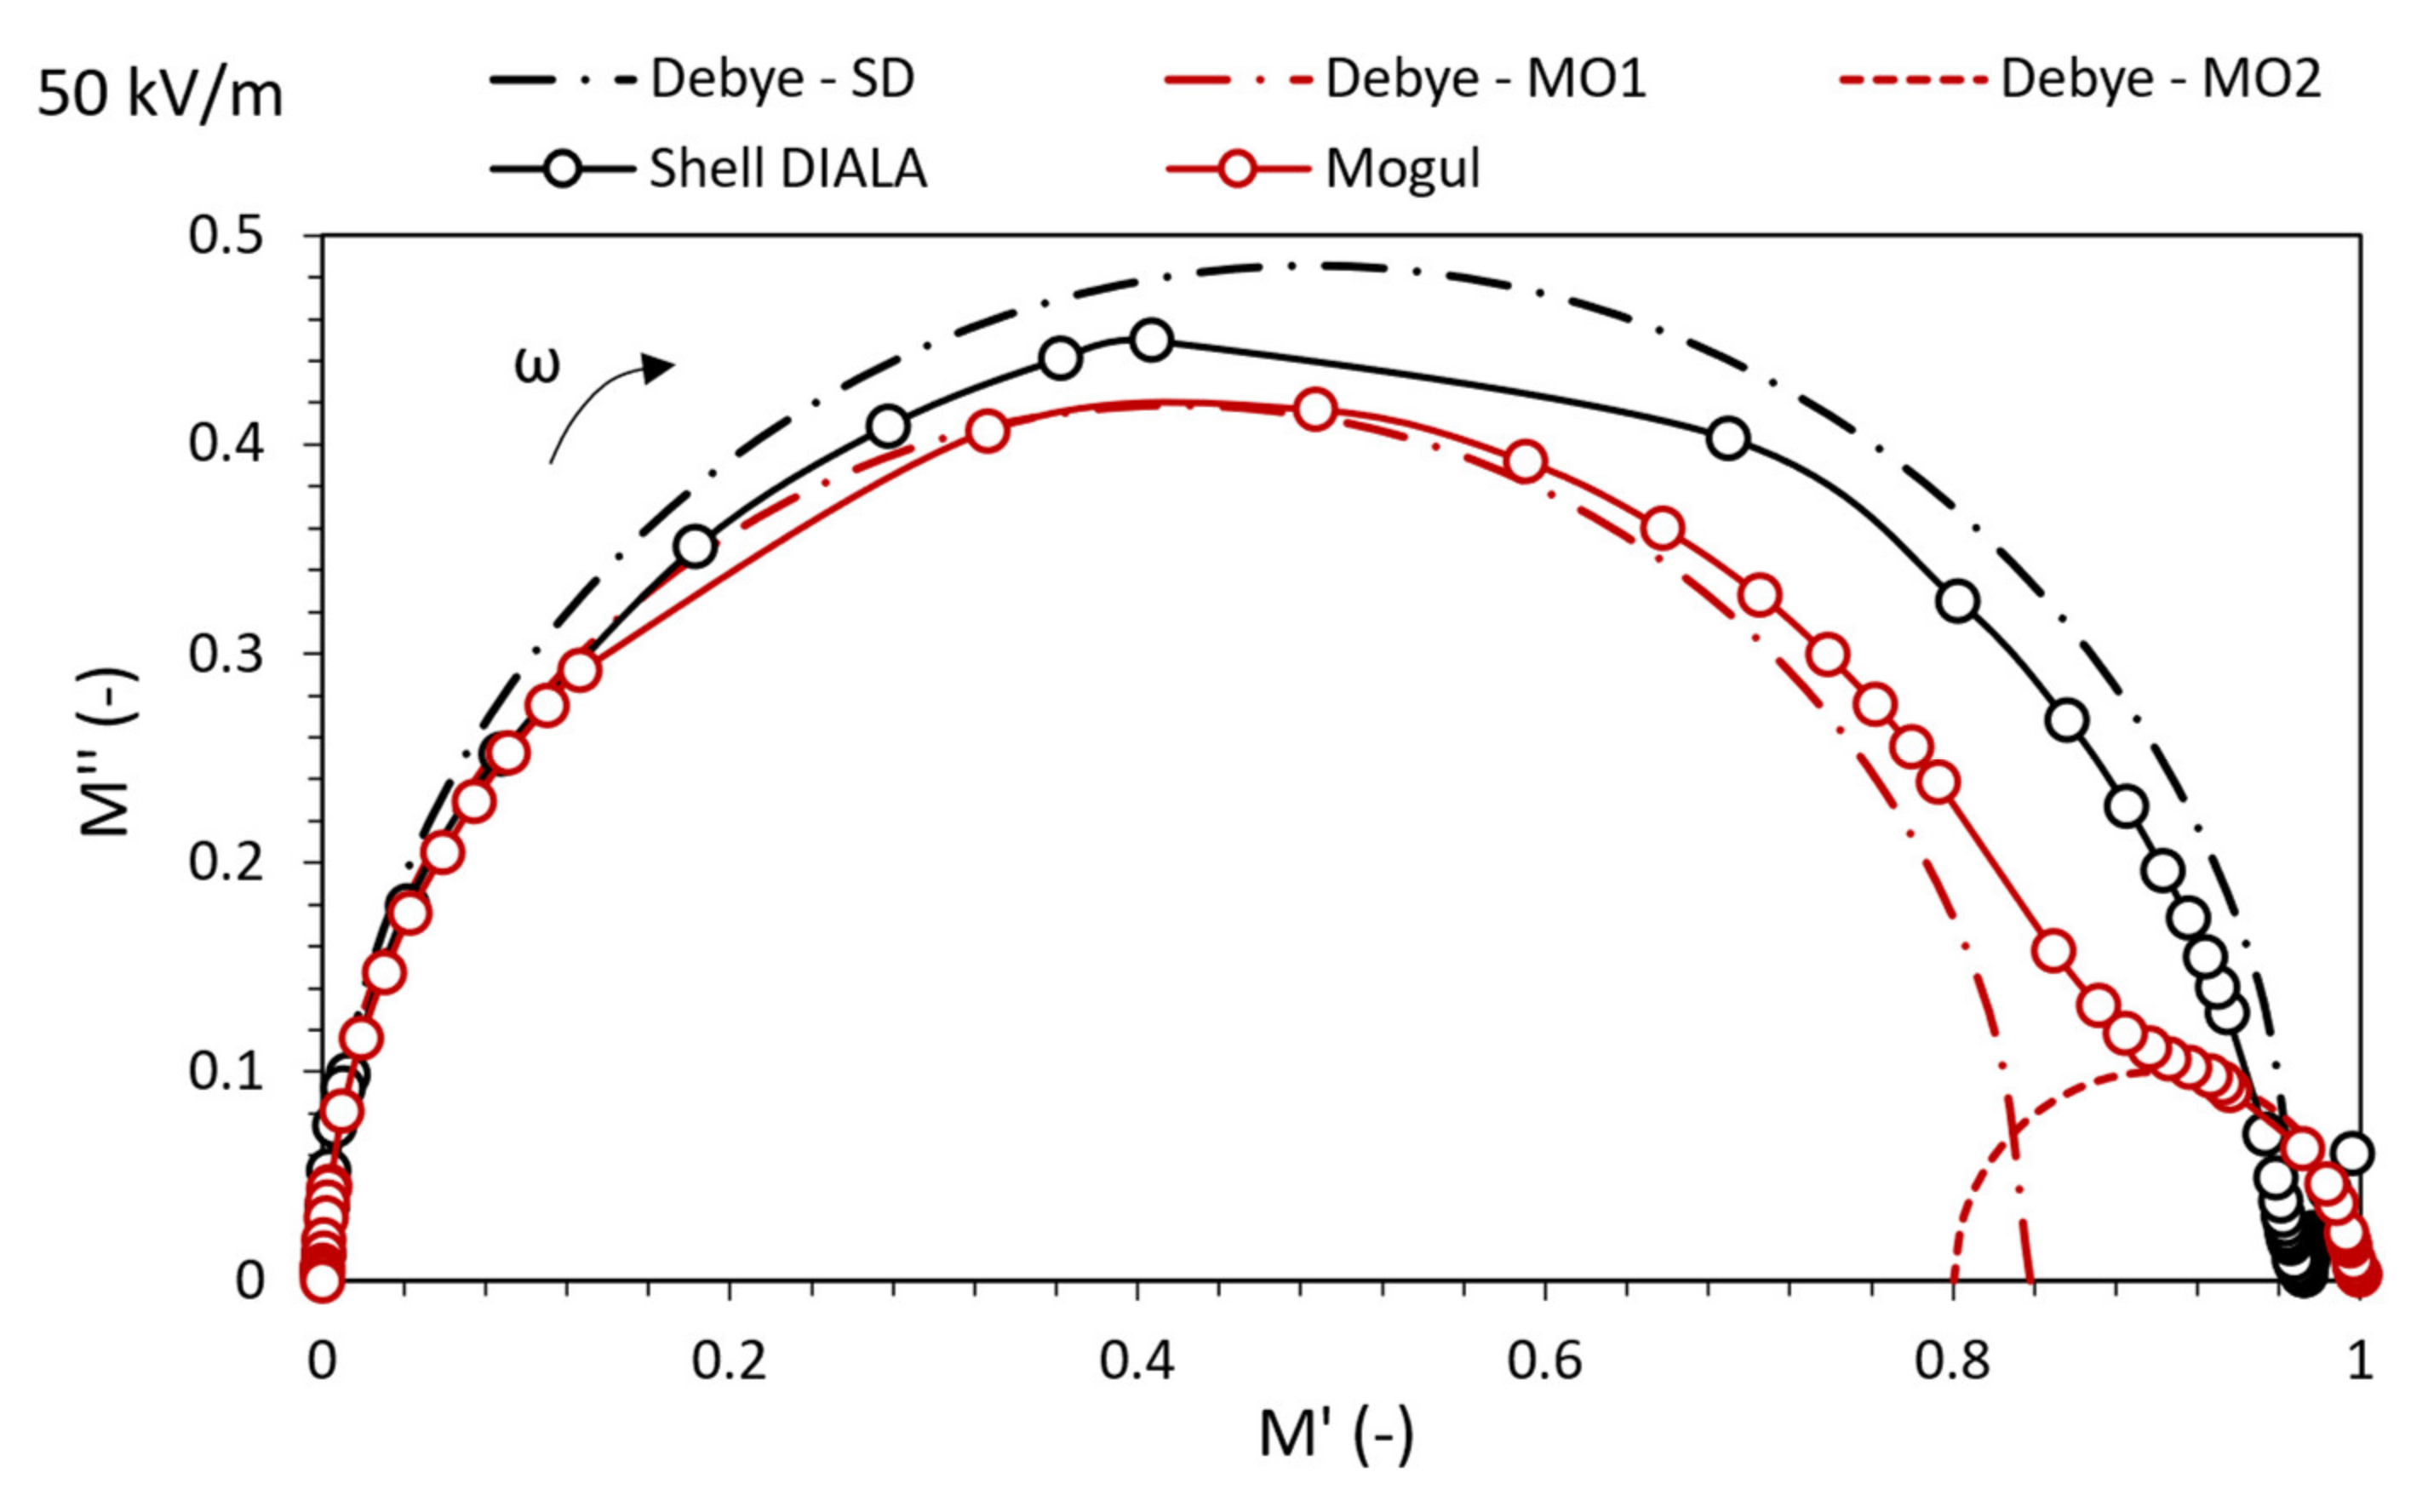
5.3. Comparison of Polarization Processes of Oils

In this section, we present a comparison of MO and SD electrical insulating oils by plotting a complex electric modulus in the complex plane of the Cole-Cole diagram. Figure 7 shows a comparison of oils at a time-varying electric field intensity of 0.5 kV/m. Mineral oil MO shows two complete polarization processes (MO1 and MO2) in the measured frequency spectrum, while hydrocarbon oil SD shows one complete and the other developing. The dielectric behavior of oils in terms of relaxation processes is positively inclined to the mineral oil side at an electric field intensity of 0.5 kV/m due to the smaller distribution of relaxation times in captured polarization processes in the investigated frequency band.
The dielectric properties of oils with a decimal increase in electric field strength to 5 kV/m (Figure 8) show better-distinguished parameters than 0.5 kV/m. Comparing the measured MO and SD data to the ideal Debye characteristics, MO also shows better-distinguished parameters in the investigated frequency band concerning α.
Increasing the intensity of the time-varying electric field to 50 kV/m in Figure 9 yields the same interactions in terms of oil comparison as the field strength of 0.5 kV/m and 5 kV/m. Simply put, a comparison of MO oil and SD shows better-distinguished characteristics of the behavior of polarization processes in mineral oil MO even at a field intensity of 50 kV/m. From a visual point of view, it is clear that the measured curve of the mineral oil MO converges in the vicinity of the two captured relaxation processes to a very high degree. In comparison, SD hydrocarbon oil has a specific deviation from the ideal Debye state, even at an intensity of 50 kV/m.

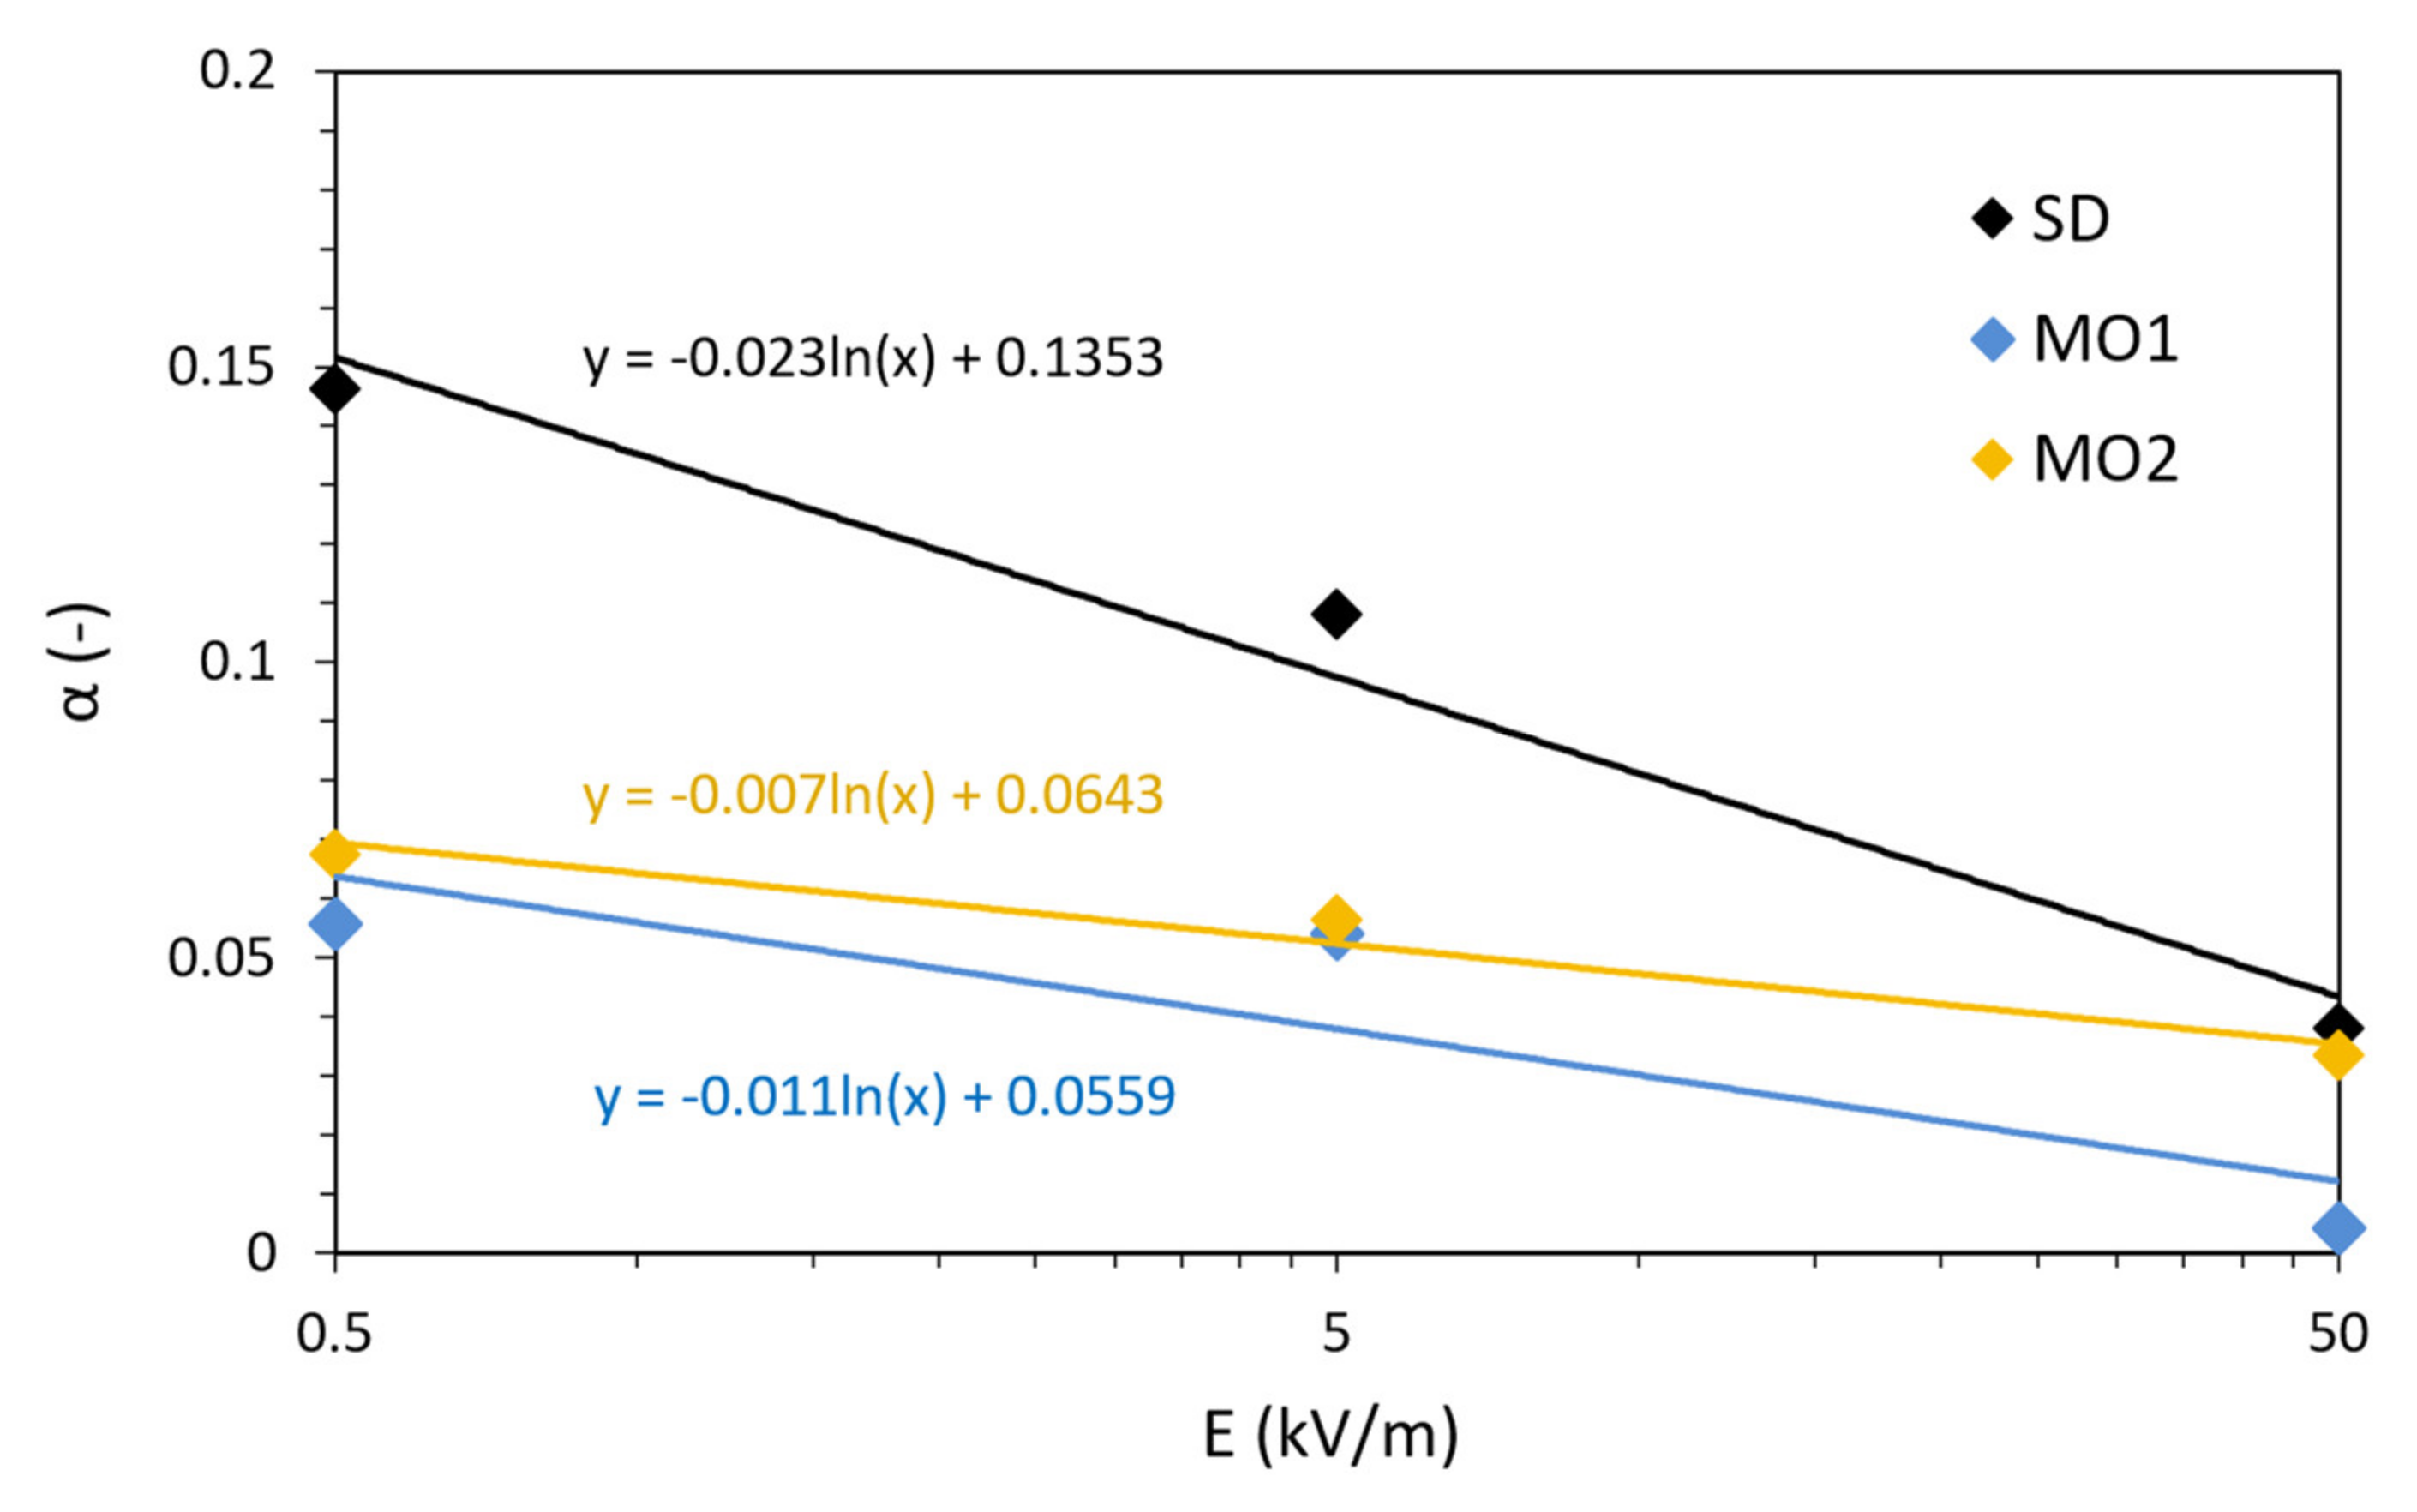
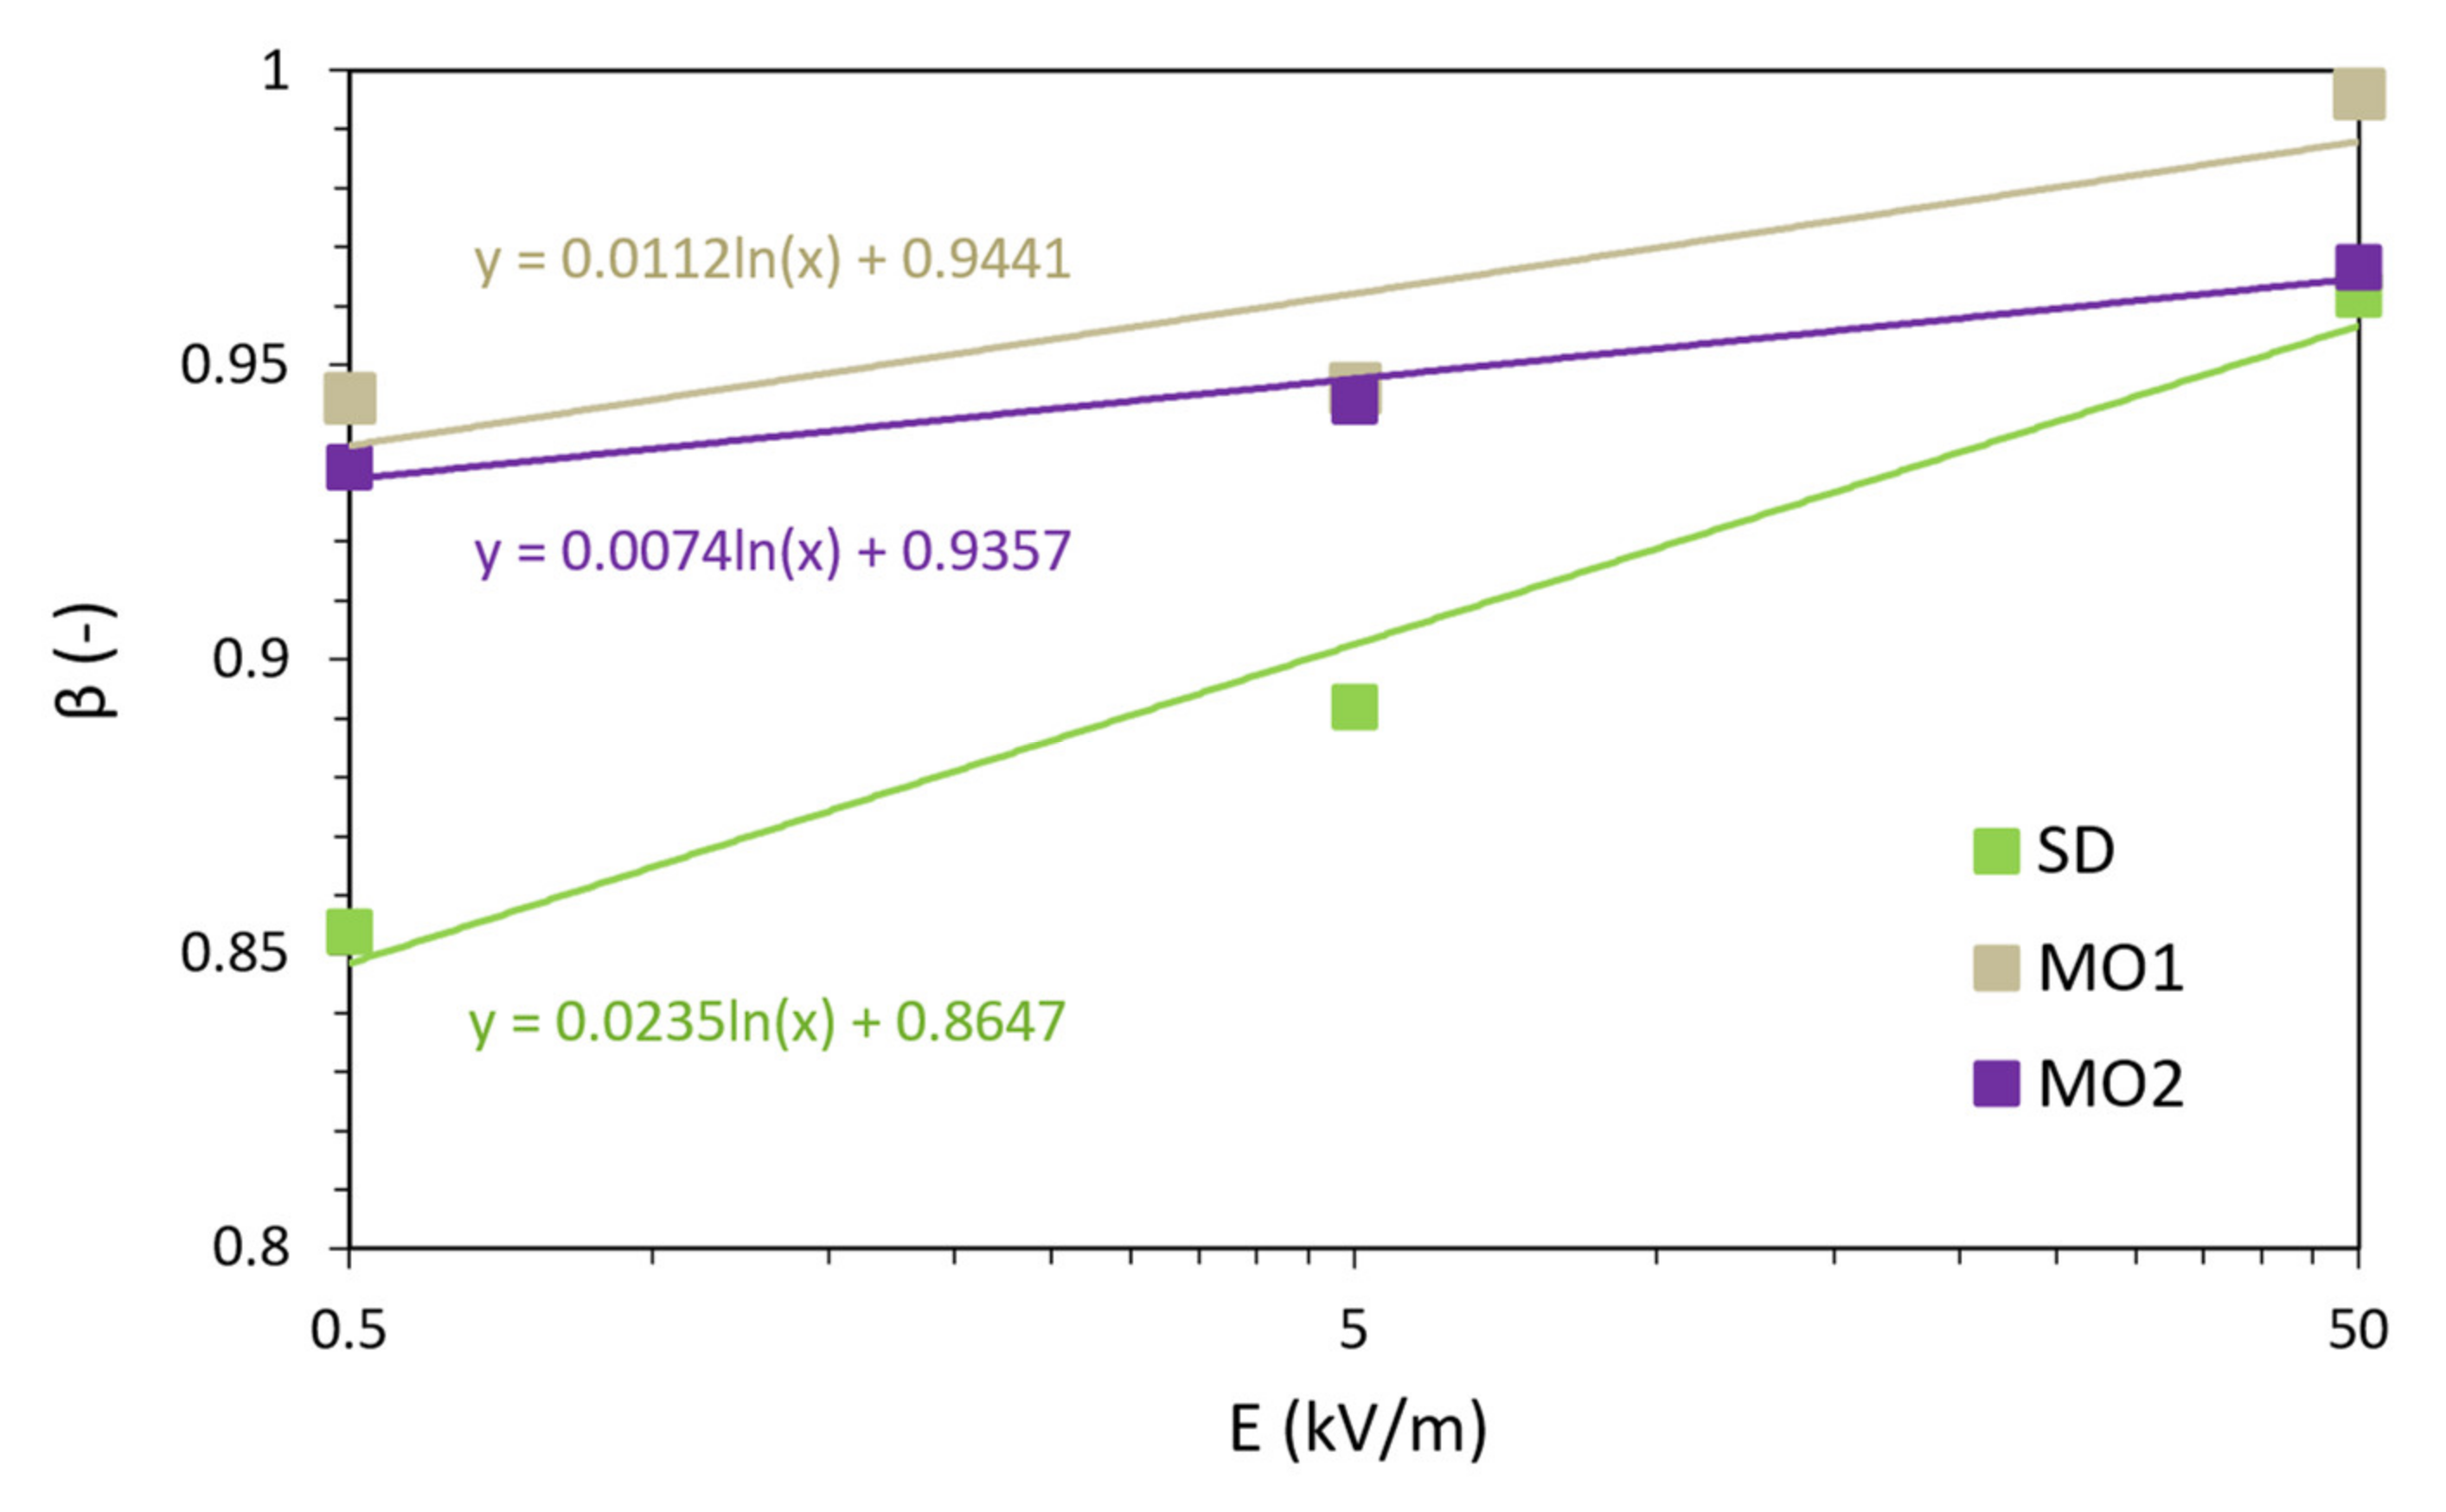
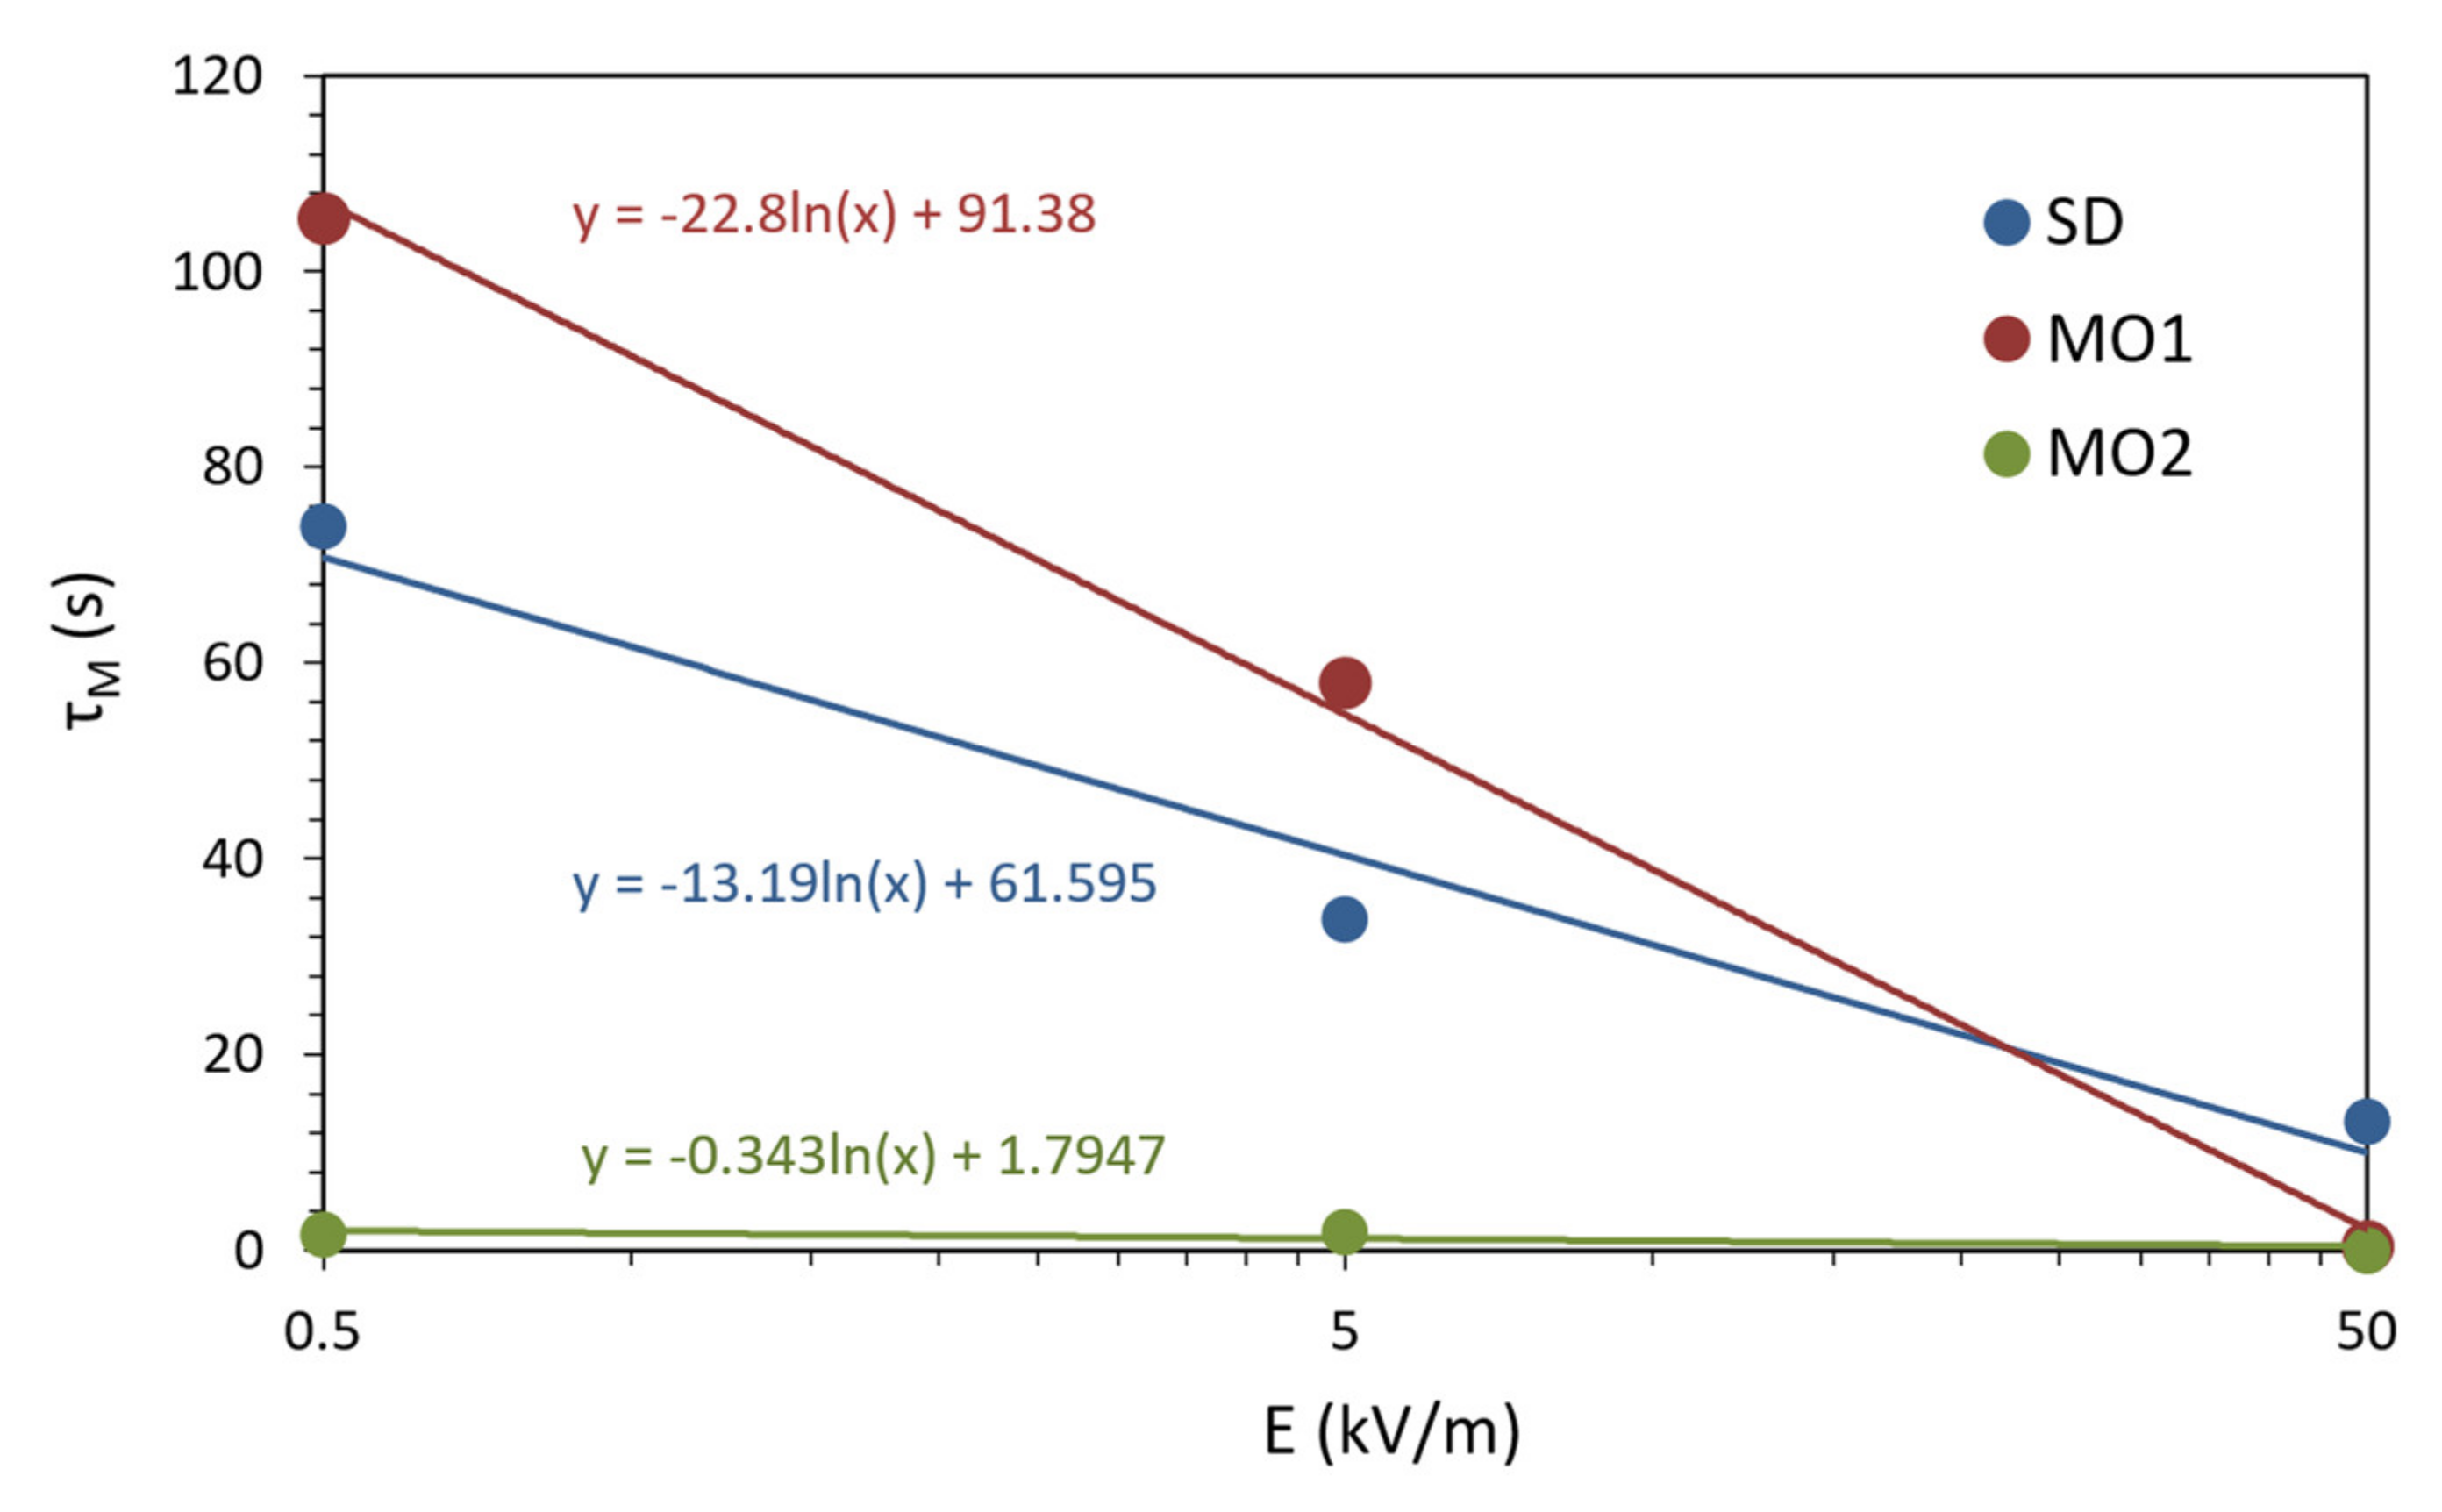
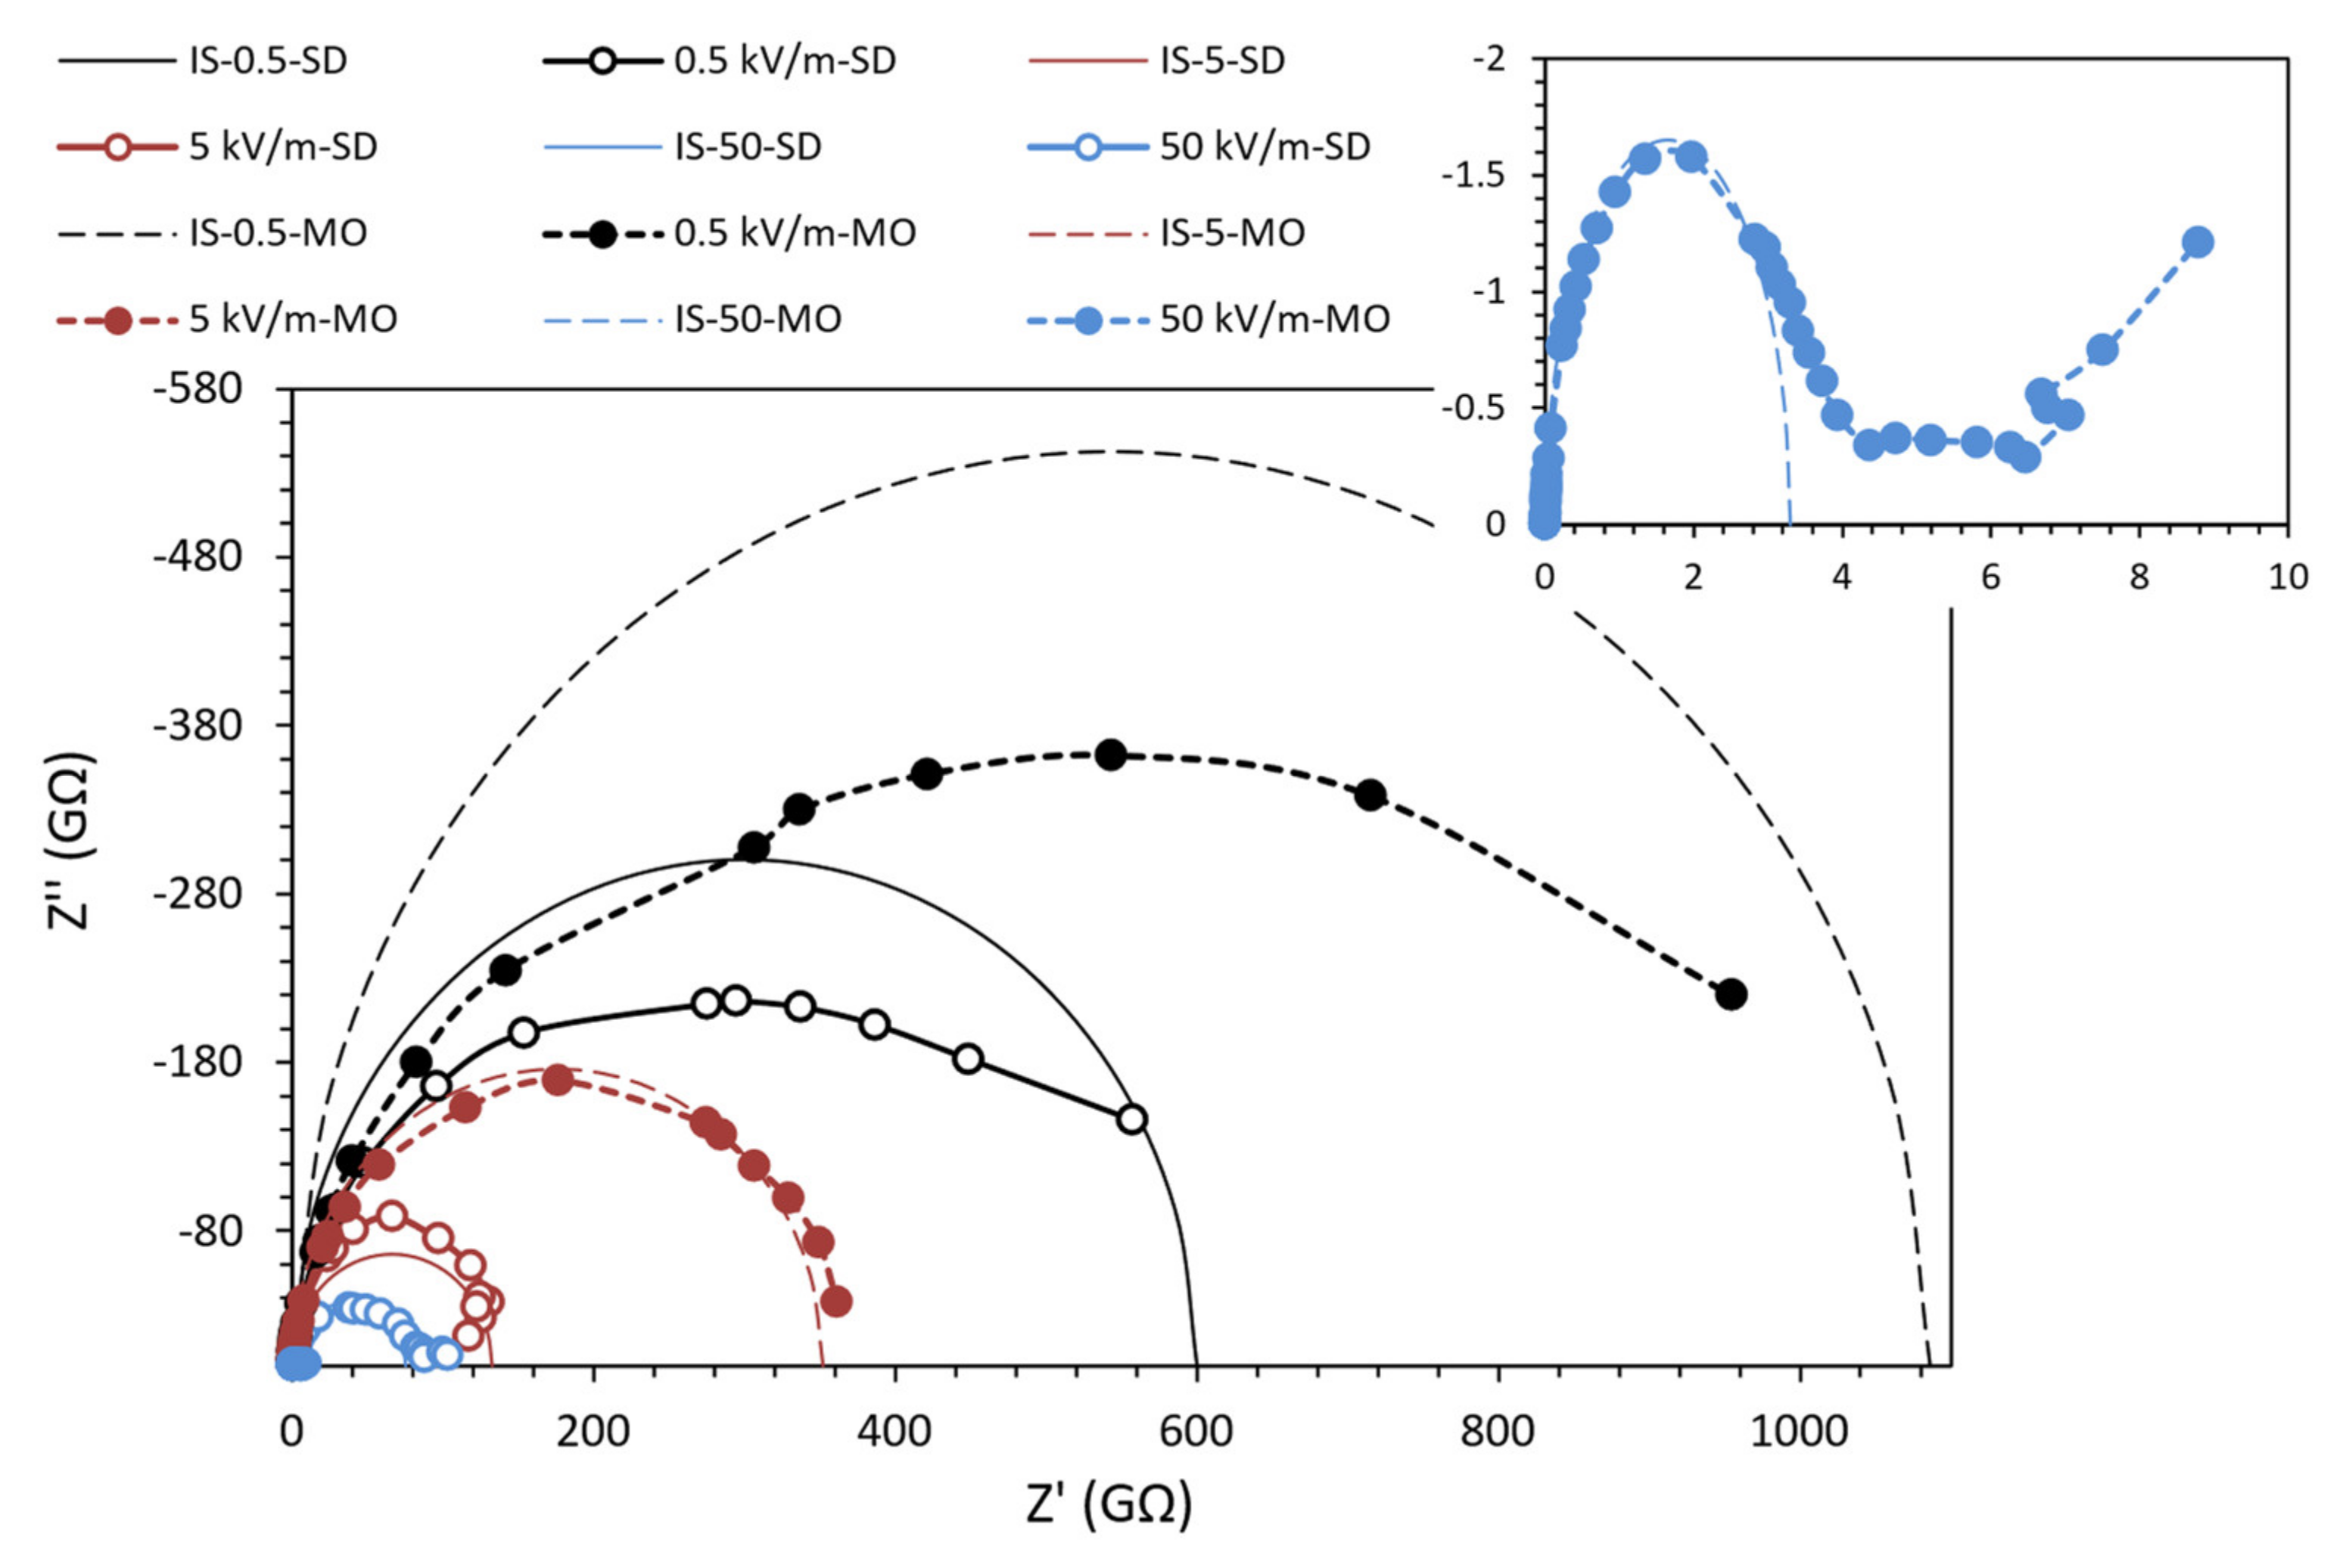
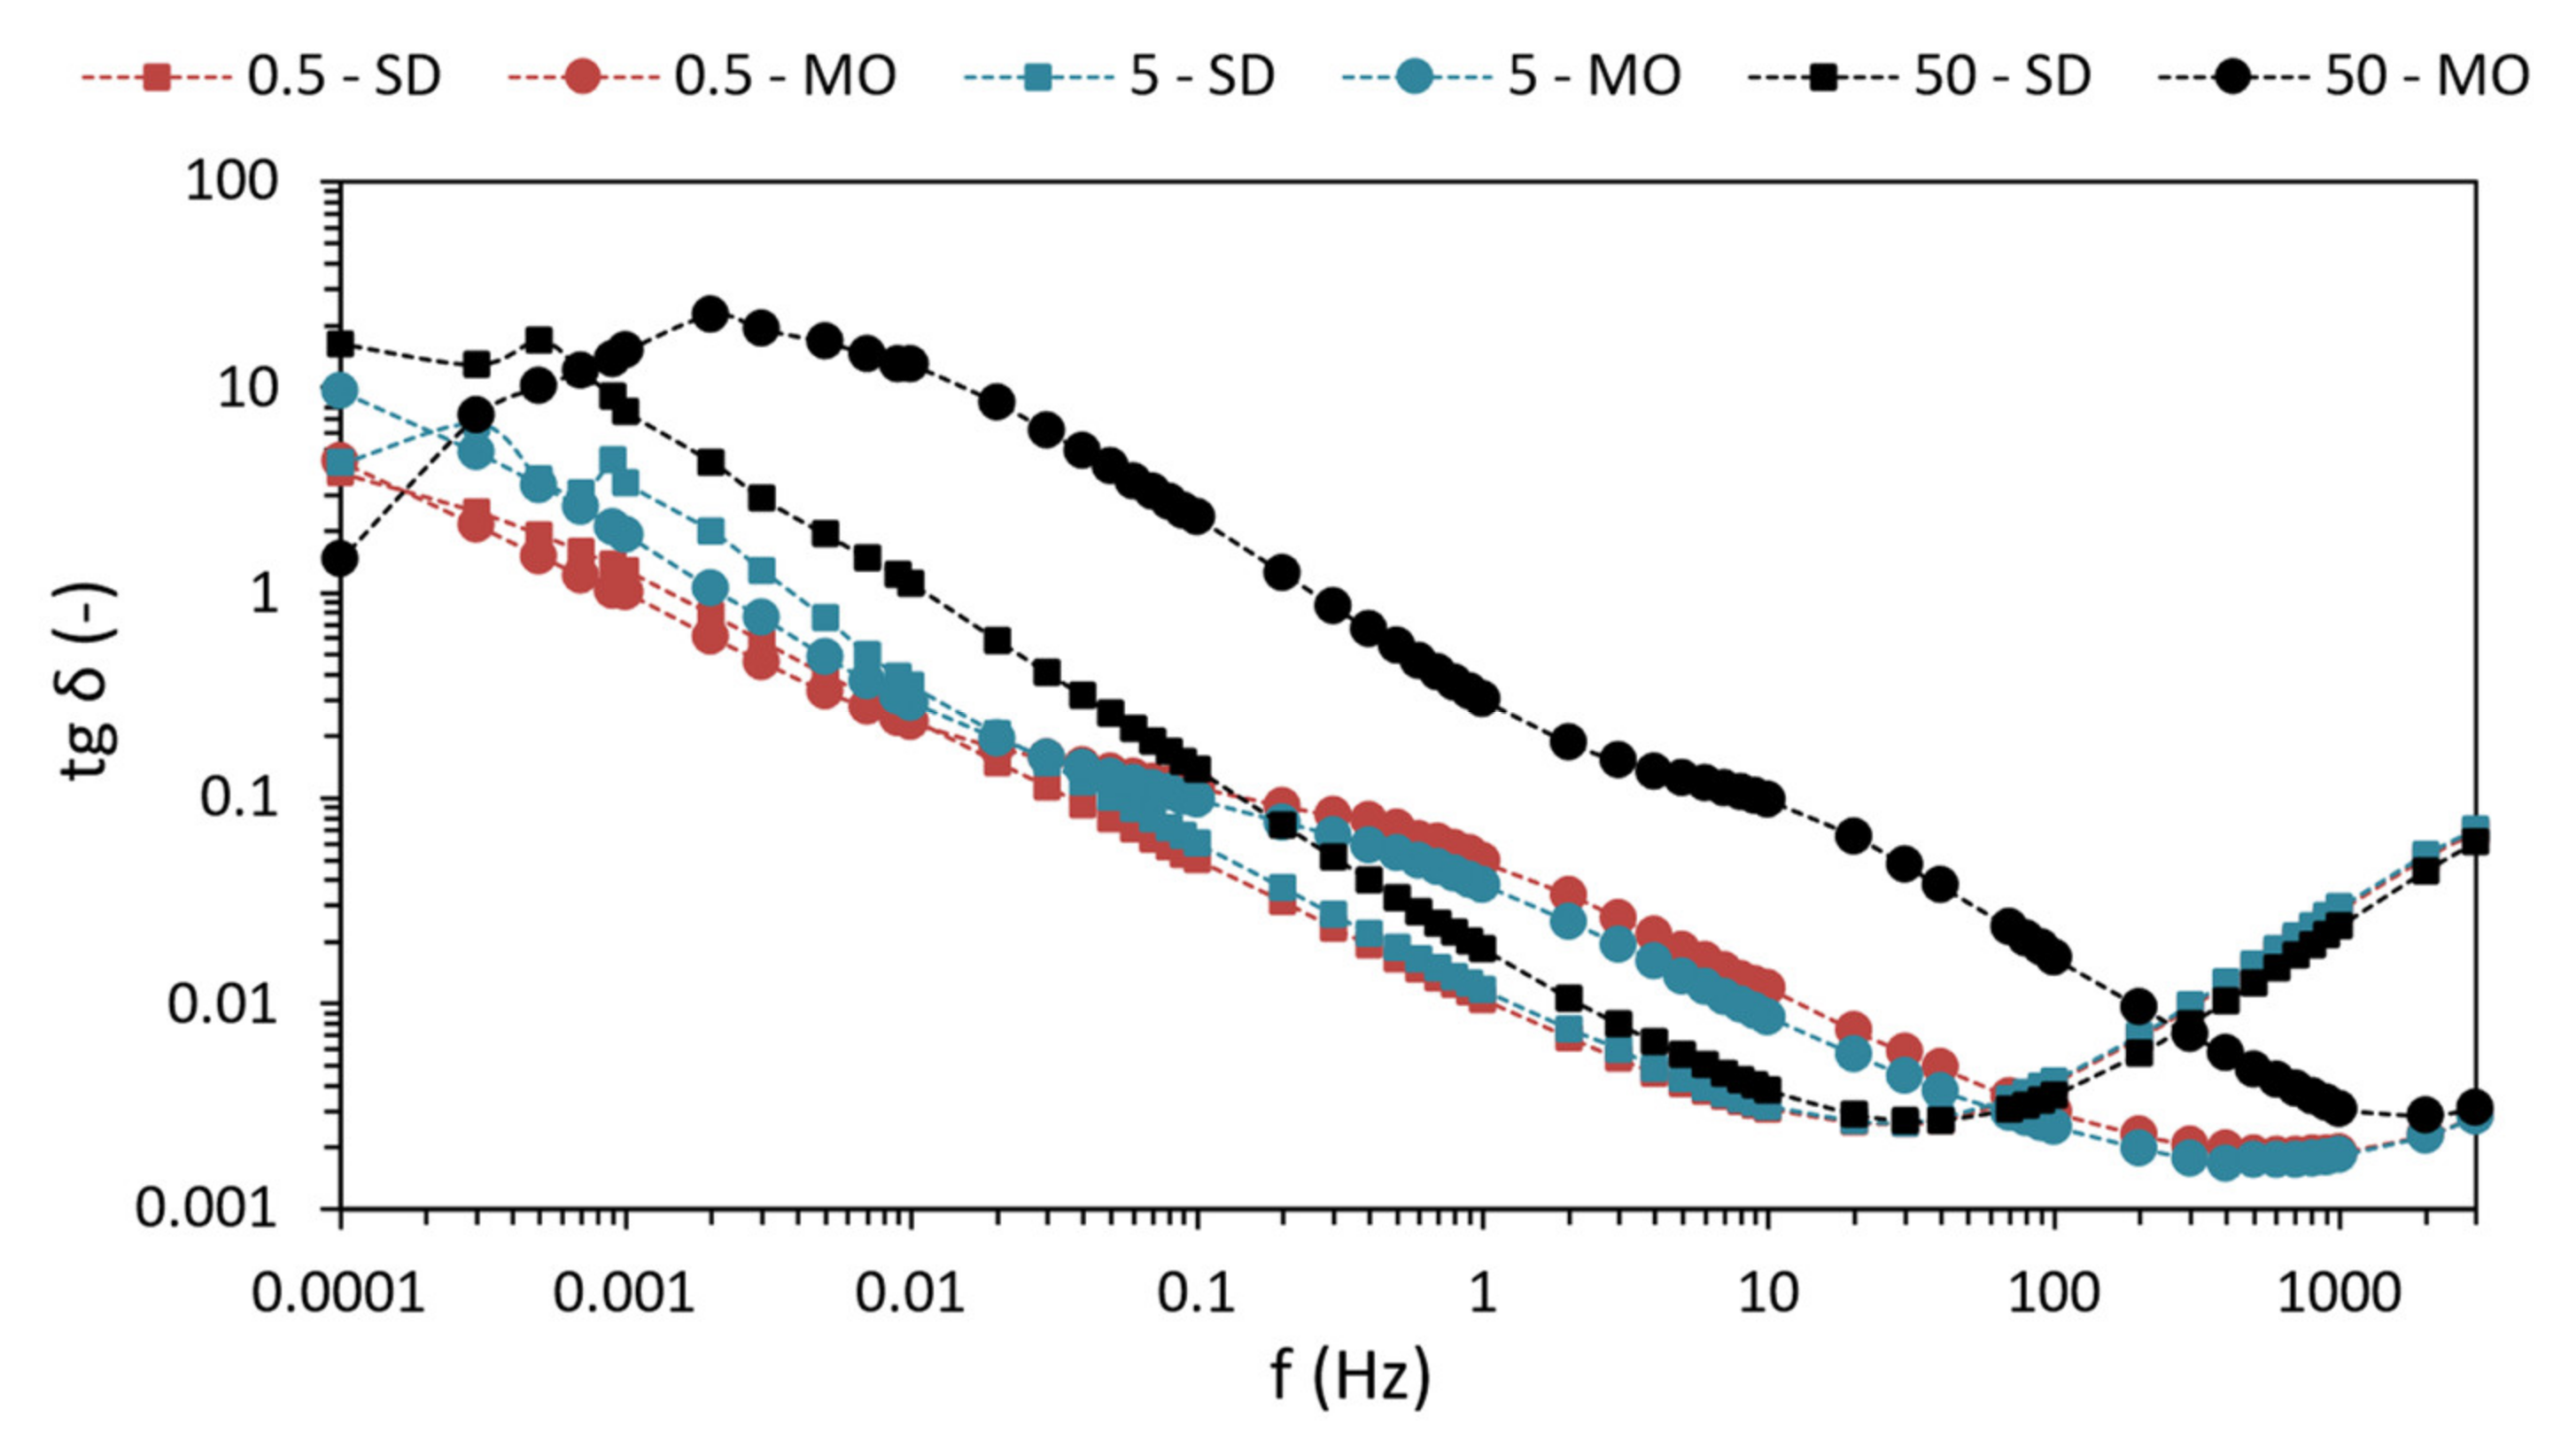
5.4. Comparison of Relaxation Mechanisms

In Section 5.1, Section 5.2 and Section 5.3, the relaxation processes occurring in the measured frequency spectrum of MO and SD oils were analyzed using a complex electric modulus regarding Table 3, which is given in this section. Therefore, this section describes in detail the parameters of relaxation processes captured in the samples.
In Table 3, in addition to the parameter α, the parameter β is given as the distribution of relaxation times with the opposite relation. We also report the relaxation times τM and the maximum values Mm″, also associated with the degree of approach to the ideal characteristics of Debye relaxation.
Figure 10 shows the regression lines of the relaxation time distribution parameter α depending on the applied intensity of the time-varying electric field. With a decimal increase in the intensity of the electric field, α decreases in all captured relaxation processes. By comparing oils, MO mineral oil has a lower relaxation time distribution than SD oil, similar to that described in Section 5.3.
The parameter β in Figure 11 shows an increasing trend of approaching the ideal Debye characteristics with a decimal increase in the applied intensity of the time-varying electric field. Publication [21] contains the dielectric behavior of a weakly polar ferrofluid based on mineral oil MO. Relaxation process very close to Debye’s behavior was captured at an intensity of 20 kV/m and an oil temperature of 358 K. From our measurements we found that MO mineral oil shows Debye behavior (β = 0.996 and β = 0.967) even without additional nanoparticles of Fe3O4 magnetite, at the different intensity of time-varying electric field (50 kV/m), at a different oil temperature (294 K) and lower frequency spectrum (0.1 mHz–3 kHz).
The observed relaxation times τM of the captured polarization processes depending on the intensity of the time-varying electric field are shown in Figure 12. The relaxation times of the polarization processes decrease with increasing intensity of the time-varying electric field in both oils. It means that a higher electric field intensity accelerates changes in the rotation of the electric dipoles behind changes in the time-varying electric field.

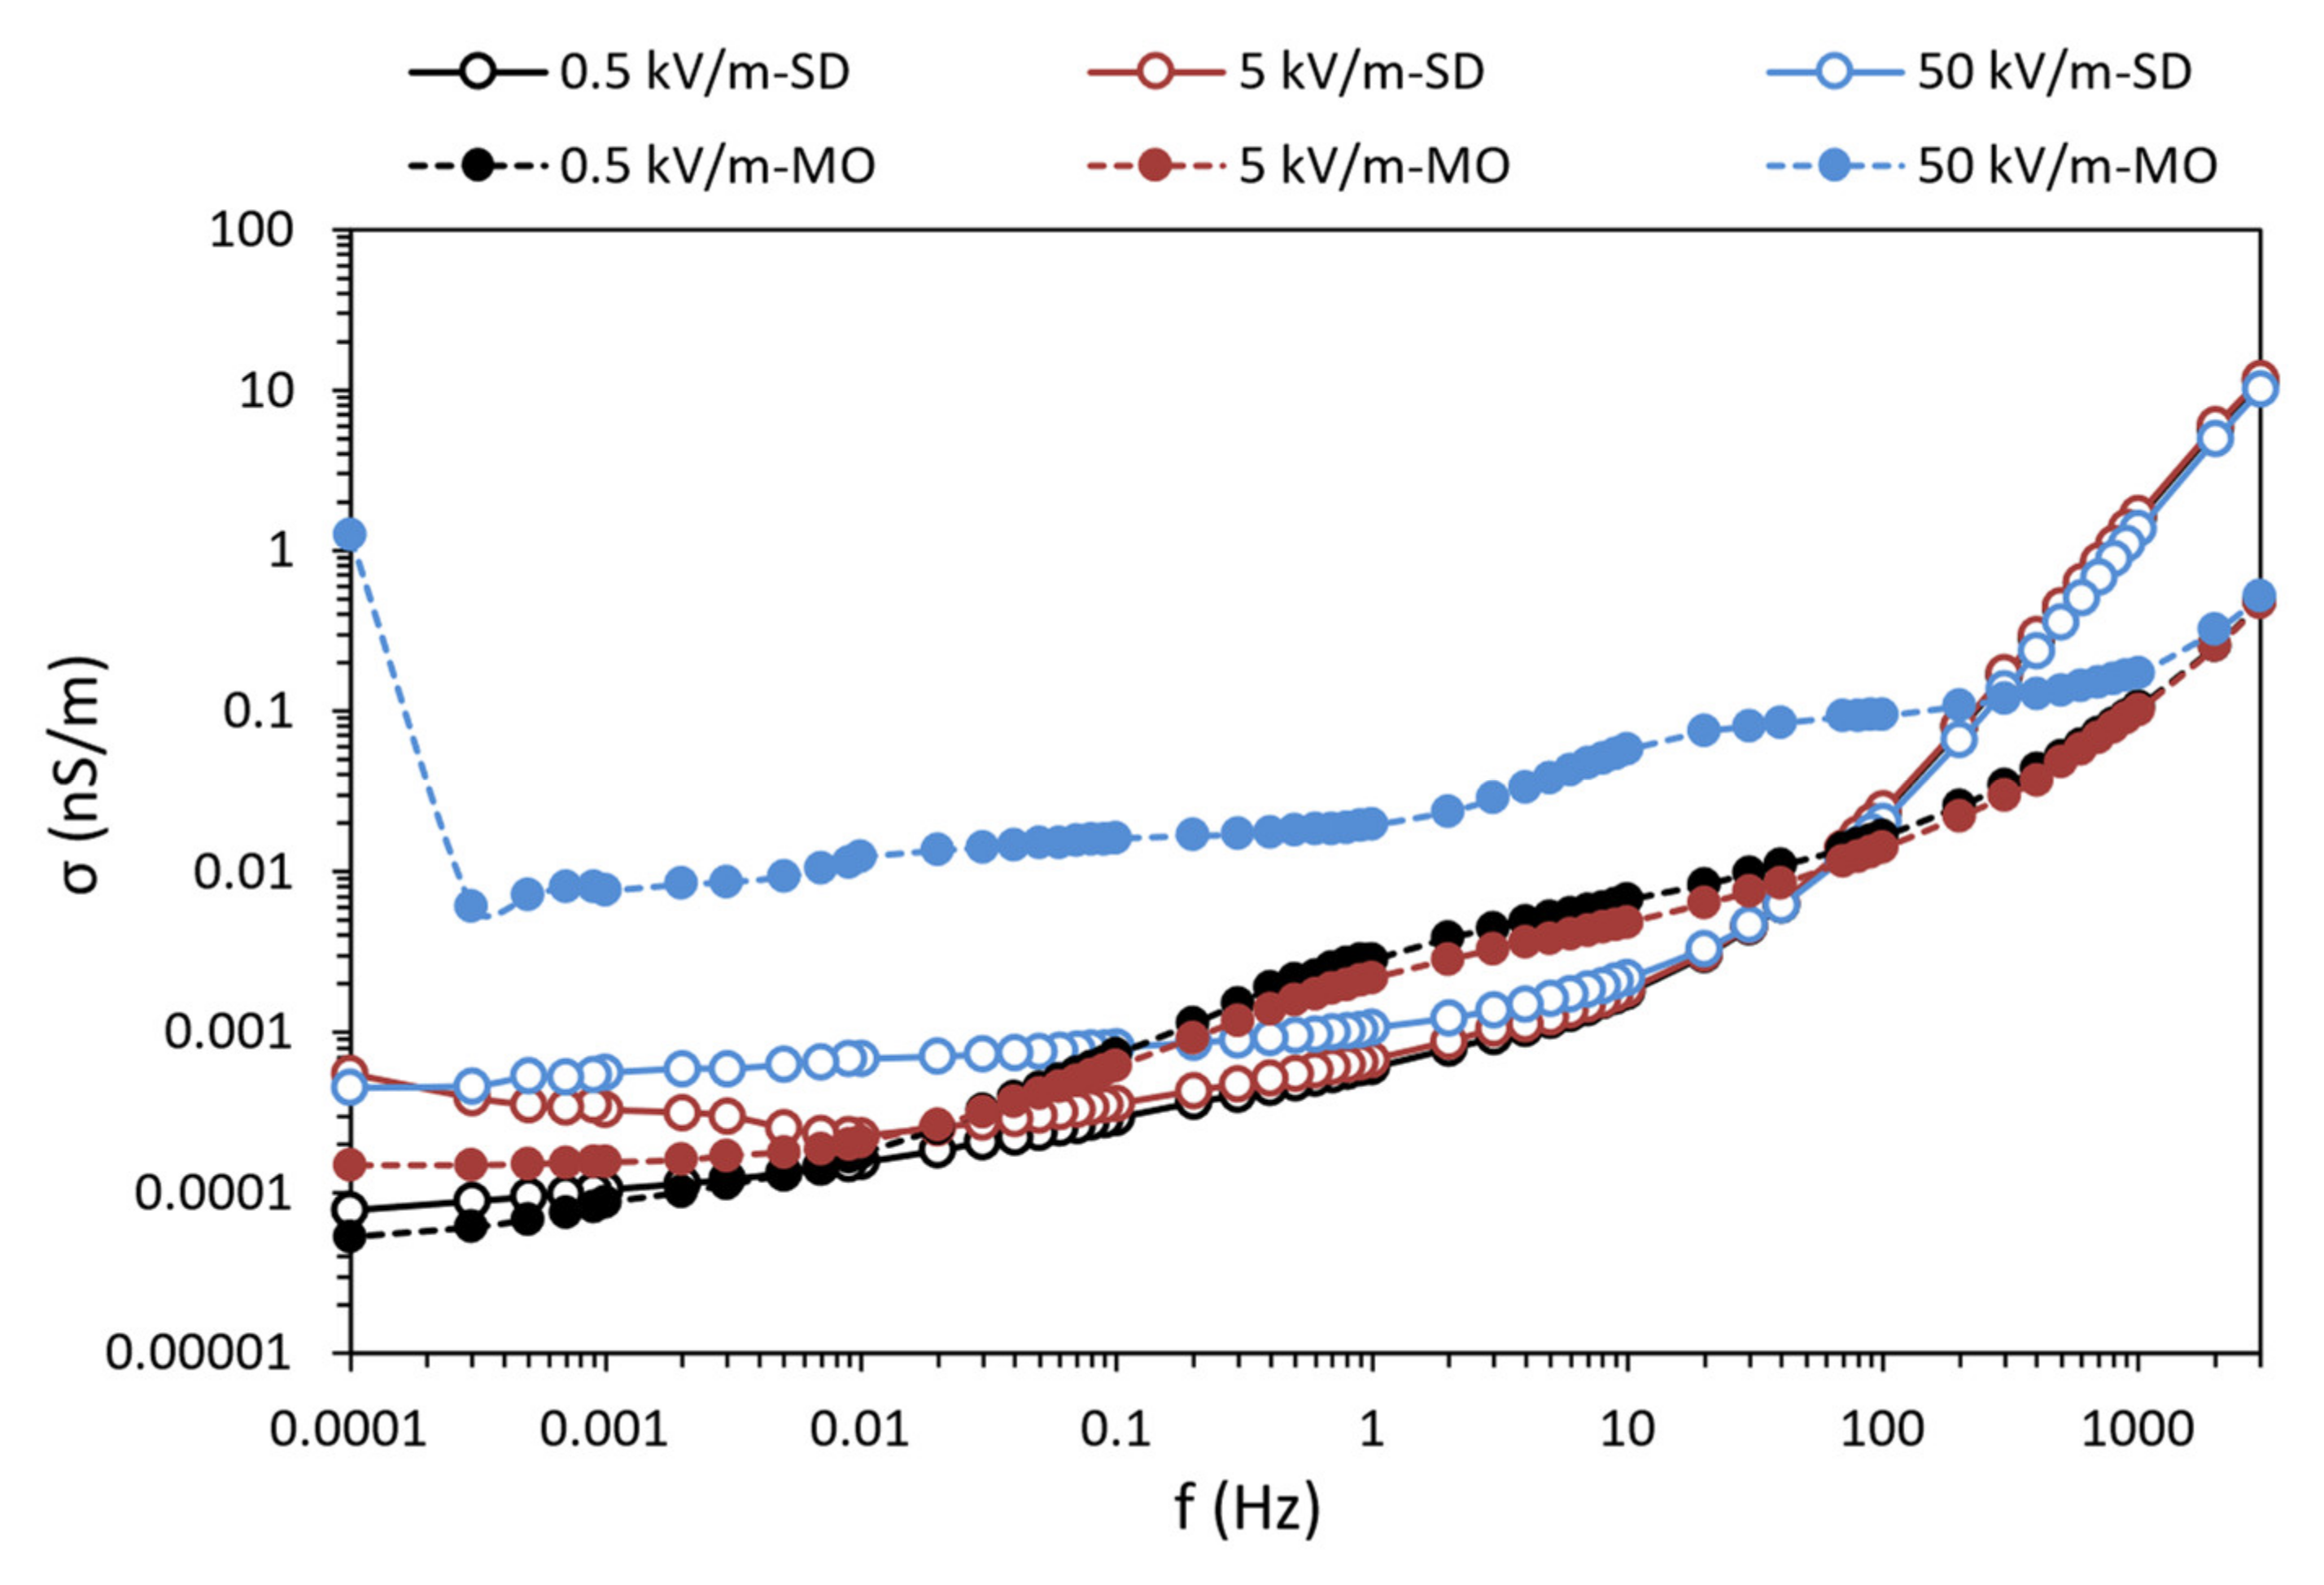
5.5. Comparison of Conductivity Processes of Oils

Electrical conductivity is also an important parameter for characterizing the state of a dielectric material. For a complete description of the investigated electrical insulating oils with an impact for use in practice, we must also consider the conductivity processes in the material when applying the intensity of the electric field. Figure 13 shows the frequency dependence of the electrical conductivity σ of the investigated oils at the intensity of the time-varying electric field. The electrical conductivity of the researched oils increases with increasing frequency, which corresponds to the theoretical assumptions. Said increase in the electrical conductivity of the hydrocarbon oil SD is steeper than the increase in the electrical conductivity of the mineral oil MO, especially in the high-frequency range. The influence of the intensity of the time-varying electric field is directly proportional to the increase of the electrical conductivity of the investigated oils, especially in the low-frequency band. This dispersion is present in the entire frequency spectrum at an applied electric field strength of 50 kV/m for MO mineral oil. Through the frequency-dependent electrical conductivity characteristics of oils at main frequencies of 50 Hz and 60 Hz, the dielectric response indicates a higher conductivity of MO mineral oil, caused by less charge absorption and greater distribution of free charges in the liquid. It applies to all applied intensities of the time-varying electric field. The condition of the hydrocarbon oil SD is better in this respect, which would improve the operation of the AC (Alternating Current) power equipment.
To test the electrical insulating character of MO and SD oils, we present graphs of complex impedance Cole-Cole in Figure 14. As the intensity of the time-varying electric field increases, the impedance in the complex plane decreases. It means that it is not possible to display all impedance characteristics in detail. An increase in impedance with a decrease in field strength causes a detailed capture of the low-frequency range of Cole-Cole characteristics. These impedances in the complex plane correspond to the low-frequency spectrum in Figure 13, where it increases that as the impedance of the material increases, the electrical conductivity decreases. In addition to the Cole-Cole impedance curves, ideal semicircles (IS) were plotted for all applied electric field intensities of both investigated oils. According to [57], the conductivity of a material is described by impedance in the complex plane, where it is stated that the ideal Cole-Cole formalism represents pure unidirectional conductivity. Comparing the Cole-Cole complex impedance curves with the plotted ideal semicircles in Figure 14, it is clear that the distribution of free charges in the investigated fluids under a time-varying electric field is not purely unidirectional. Therefore, we attribute this dispersion to the superimposed conductivity of direct current and alternating current. This statement is also supported by the Cole-Cole impedance study in [57].

6. Discussion

The comparison of the investigated electrical insulating oils in our paper focuses on analyzing dielectric phenomena in the measured frequency spectrum using a complex electric modulus and a complex impedance in the complex plane of the Cole-Cole diagram. We found that the recorded relaxation processes of MO mineral oil showed more characteristical parameters in terms of approach to the characteristics of Debye than the relaxation process of hydrocarbon oil SD at all applied intensities of the time-varying electric field.
Electrical insulating oils show dielectric losses under high voltage stress. Knowledge of dielectric losses is very important from the point of view of the design and operation of the equipment to prevent failure due to dielectric thermal effects. Measuring dielectric losses at regular intervals is the only diagnostic tool to determine the degree of degradation of the insulating fluid in the aging process. Dielectric losses are described by the dissipation factor tg δ as a measure of the power loss in a liquid when a time-varying electric field is applied. The generated energy is converted into heat and heats the liquid, which requires additional energy for faster heat dissipation. For this reason, monitoring and optimizing the dissipation factor is very important to maintain sufficient efficiency of electricity transmission with the lowest possible operating costs [44,58]. Figure 15 shows the dependence of dielectric losses in the frequency band.
The paradox is that in terms of dielectric losses of electrical insulating oils at mains frequency (50 and 60 Hz), SD hydrocarbon oil achieves better dielectric properties, i.e., lower dielectric losses, because it has lower dissipation factor values at a given frequency at all times applied intensities of the time-varying electric field. From Figure 15, we conclude that this dispersion is due to the trapped relaxation process number 2 of MO oil, which increases the dielectric losses at the mains frequency. The dissipation factor particular values are presented in detail in Table 4.
In work [20] authors present the comparison of mineral and hydrocarbon oil in terms of dielectric losses at the mains frequency of 50 Hz and at higher intensities of the time-varying electric field (100–900 kV/m). At given electric field intensities, hydrocarbon oil achieved lower dielectric losses. Our experiment and analysis presented in this work confirmed this because hydrocarbon oil showed lower dielectric losses even at lower intensities of time-varying electric field (E ≤ 50 kV/m).
According to [59], new transformer oils based on natural esters are being developed. So far, their major disadvantage is the lower resistance to thermal stress that is present in large power transformers. In addition, at low temperatures, their viscosity is significantly higher than that of naphthenic mineral oil, which significantly affects the cooling of the transformer. Therefore, for such transformers, a liquefied gas oil with a very low sulfur content with the preserved advantages of naphthenic mineral oil appears to be a suitable choice from an ecological and operational point of view.
Compared to the conditions inside the transformer, our measured dissipation factor frequency spectra show slight changes because these are initial data. In the operating mode of the transformer, the initial data are affected by temperature, electrical stress, chemical processes in the aging process, and the like, which cause changes in the measured diagnostic parameters [43,60,61]. However, this study does not address and consider all operating conditions in the transformer, only comparing the dynamic behavior of insulating fluids in a time-varying electric field. Indeed, the determination of dielectric properties is generally not covered by only one method, so the subject of further research is the application and evaluation of the condition of insulating fluids through other methods. The insulating liquid must be examined for changes in the influence of individual parameters, such as intensity of electrical stress, thermal stress intensity, aging time to electrical strength, dielectric dissipation factor, complex permittivity, gas chromatography, furan content, resistance to partial discharges, and the like. However, it is always based on the initial state, and the changed values are compared against it. Our work aimed to find out the initial state of classic mineral oil and a unique hydrocarbon oil based on liquefied natural gas and compare them. The evaluation of the oil performance using complex permittivity was not unambiguous. However, the examination using a complex electric modulus is significantly more advantageous.

7. Conclusions

Using the method of dielectric relaxation spectroscopy, we found that the mineral oil MO shows two complete polarization events in the measured frequency spectrum, in contrast, the hydrocarbon oil SD offers one complete and the other developing. We found that with increasing intensity of the time-varying electric field, there is a more excellent approximation to Debye behavior in all captured polarization processes of the investigated oils, by monitoring the parameters α, β, and Mm″. The obtained relaxation times of the polarization processes decrease with increasing intensity of the time-varying electric field for both oils. By comparing the Cole-Cole curves of complex impedance with the plotted ideal semicircles, we found that the distribution of free charges in the investigated fluids under a time-varying electric field is not purely unidirectional but superimposed on alternating conductivity. The frequency-dependent electrical conductivity characteristics of the oils at main frequencies of 50 Hz and 60 Hz indicate a higher conductivity of MO mineral oil, which is caused by less charge absorption and greater distribution of free charges in the liquid. Complex electrical modulus appears to be a more capable parameter for comparing dielectric properties than complex permittivity. We have proved that the mineral oil MO depends on the complex electric modulus on the electric field intensity closer to the ideal Debye model than the hydrocarbon oil SD. Mineral oil MO shows Debye behavior (β = 0.996 and β = 0.967) even without additional magnetite nanoparticles, at a different intensity of time-varying electric field (50 kV/m), at different oil temperatures (294 K), and in lower frequency spectrum (0.1 mHz–3 kHz). It means that mineral oil is more homogeneous in terms of polarization processes. However, in the case of mineral oil, we capture a fully developed second relaxation (MO2), which causes higher dielectric losses around the mains frequency than the losses of hydrocarbon oil SD at all applied intensities of the time-varying electric field. This fact is crucial from practical use and points to the progressiveness and fundamental difference of SD hydrocarbon oil in the operation and cooling of power transformers. Therefore, we recommend applying hydrocarbon oil in the operation of AC power equipment. At 60 Hz, there is a more significant percentage loss difference between oils in favor of SD hydrocarbon oil. We mean that operators of power transformers or other power equipment at a frequency of 60 Hz will reduce more operating costs after replacing mineral oil with hydrocarbon oil. However, this does not mean that SD oil operation in power transformers is more efficient than operating at 50 Hz. Our research has shown that applying SD hydrocarbon oil in power transformers with a frequency of 50 Hz is more advantageous in dielectric losses than with a frequency of 60 Hz. It is due to the gradual capture of the second relaxation mechanism, which increases the dielectric loss with increasing frequency. As MO mineral oil at a field intensity of 50 kV/m shows ideal parameters in the low-frequency band (0.1 mHz–0.3 Hz), its application would be more suitable in high-voltage direct current equipment. The added value of this publication lies in the comparison of progressive hydrocarbon oil-based on liquefied natural gas and conventional naphthenic mineral oil concerning individual dielectric spectra and loss ratios, as SD hydrocarbon oil is not sufficiently researched.
Liquefied natural gas-based oil has been shown to have lower dielectric losses at mains frequencies of 50 and 60 Hz even after applying electric field strengths lower than 50 kV/m. The paper states that the same applies to electric field strengths higher than 50 kV/m [20]. It can therefore be considered as a suitable mineral oil substitute. In addition, the research of the authors of the article is currently focused on the development of magnetic fluids based on mineral oils. From an ecological point of view, it is necessary to replace their carrier fluid with more environmental variants while maintaining or improving its dielectric parameters. Liquefied natural gas has been shown to meet this condition, and it is possible to continue research into magnetic fluids, where the carrier base is this oil. Future research will focus on the dielectric properties of hydrocarbon oil SD enriched with impurities based on nanoparticles of magnetite Fe3O4 and fullerene C60, which will analyze its diagnostic parameters at different stresses to describe the progressive material in more detail.

8. Contribution and Recommendation for Practice

The distribution of the thermal field in the power transformers is very important from the point of view of the operation of the equipment. The motivation to reduce the thermal impact and make electricity transmission more efficient is enormous worldwide. The general requirement is to reduce the environmental impact, which corresponds to the reduction in heating into the atmosphere caused by the inefficient operation of power transformers, which has a slight contribution to climate change. These facts are related to dielectric losses of liquid insulation in power transformers. This study provides a reasoned proposal to replace mineral oil with SD hydrocarbon oil. This is related to the investigated frequency-dependent polarization and conductivity spectra. We have found that in the vicinity of the mains frequency of 50 Hz and 60 Hz, mineral oil has a higher electrical conductivity than hydrocarbon oil. As for the captured polarization mechanisms at the stated frequencies, the mineral oil shows an additional polarization mechanism (MO2). These basic dielectric parameters cause an increase in the dielectric losses of the mineral oil at all applied intensities of the time-varying electric field, which has a direct effect on the operation of the power transformers. Increasing the life of the transformer by optimizing operating conditions by using suitable and reliable diagnostic data means great cost savings for the equipment operator. Obtaining the correct diagnostic data is conditioned by examining suitable dielectric parameters, such as complex permittivity and complex electrical modulus undoubtedly. The complex electrical modulus has been shown to be a suitable diagnostic parameter for condition-based diagnostics of power transformers. In the case of the investigated oil insulation, it can point out changes that are more difficult to evaluate when analyzing by complex permittivity due to the shift of dielectric mechanisms in the studied frequency spectrum.

Author Contributions

Conceptualization, P.H. and Ľ.Š.; methodology, I.K. and J.K. (Jozef Király); software, P.H.; validation, R.C., B.D. and J.K. (Juraj Kurimský); formal analysis, D.M.; investigation, P.H.; resources, R.C.; data curation, P.H.; writing—original draft preparation, P.H.; writing—review and editing, B.D. and J.K. (Juraj Kurimský); visualization, V.K.; supervision, R.C.; project administration, R.C.; funding acquisition, R.C. All authors have read and agreed to the published version of the manuscript.

Funding

This research was funded by the Ministry of Education, Youth and Sports within the project VEGA 2/0011/20 and 1/0154/21 and the Slovak Agency for Research and Development based on contracts no. APVV-15-0438, APVV-17-0372, and APVV-18-0160.

Institutional Review Board Statement

Not applicable.

Informed Consent Statement

Not applicable.

Data Availability Statement

The data presented in this study are available on request from the corresponding author. The data are not publicly available because it is confidential.

Conflicts of Interest

The authors declare no conflict of interest. The funders had no role in the design of the study.

References

  1. Wang, X.; Tang, C.; Huang, B.; Hao, J.; Chen, G. Review of Research Progress on the Electrical Properties and Modification of Mineral Insulating Oils Used in Power Transformers. Energies 2018, 11, 487. [Google Scholar] [CrossRef] [Green Version]
  2. Lavesson, N.; Walfridsson, L.; Schiessling, J. DC characterization of isoparaffinic insulation oil. IEEE Trans. Dielec. Electr. Insul. 2020, 27, 1525–1528. [Google Scholar] [CrossRef]
  3. Kurimský, J.; Rajňák, M.; Bartko, P.; Paulovičová, K.; Cimbala, R.; Medveď, D.; Džamová, M.; Timko, M.; Kopčanský, P. Experimental study of AC breakdown strength in ferrofluid during thermal aging. J. Magn. Magn. Mater. 2018, 465, 136–142. [Google Scholar] [CrossRef]
  4. Ojha, S.K.; Purkait, P.; Chakravorti, S. Modeling of relaxation phenomena in transformer oil-paper insulation for understanding dielectric response measurements. IEEE Trans. Dielec. Electr. Insul. 2016, 23, 3190–3198. [Google Scholar] [CrossRef]
  5. Wei, Y.; Han, W.; Li, G.; Liang, X.; Gu, Z.; Hu, K. Aging Characteristics of Transformer Oil-Impregnated Insulation Paper Based on Trap Parameters. Polymers 2021, 13, 1364. [Google Scholar] [CrossRef] [PubMed]
  6. Pavlík, M.; Kruželák, L.; Mikita, M.; Špes, M.; Bucko, S.; Lisoň, L.; Kosterec, M.; Beňa, L.; Liptai, P. The impact of electromagnetic radiation on the degradation of magnetic ferrofluids. Arch. Electr. Eng. 2017, 66, 361–369. [Google Scholar] [CrossRef]
  7. Khaled, U.; Beroual, A. AC Dielectric Strength of Mineral Oil-Based Fe3O4 and Al2O3 Nanofluids. Energies 2018, 11, 3505. [Google Scholar] [CrossRef] [Green Version]
  8. Monzón-Verona, J.M.; Gonzázez-Domínguez, P.I.; García-Alonso, S.; Reboso, J.V. Characterization of Dielectric Oil with a Low-Cost CMOS Imaging Sensor and a New Electric Permittivity Matrix Using the 3D Cell Method. Sensors 2021, 21, 7380. [Google Scholar] [CrossRef]
  9. Nezami, M.M.; Equbal, M.D.; Khan, S.A.; Sohail, S.; Ghoneim, S.S.M. Classification of Cellulosic Insulation State Based on Smart Life Prediction Approach (SLPA). Processes 2021, 9, 981. [Google Scholar] [CrossRef]
  10. Amalanathan, A.J.; Sarathi, R.; Harid, N.; Griffiths, H. Investigation of the Effect of Silver Sulfide on the Dielectric Properties of Mixed Insulating Liquid. In Proceedings of the 2020 International Symposium on Electrical Insulating Materials (ISEIM), Tokyo, Japan, 13–17 September 2020; IEEE: Piscataway, NJ, USA, 2020; pp. 343–346. [Google Scholar]
  11. Ghoneim, S.S.M.; Dessouky, S.S.; Boubakeur, A.; Elfaraskoury, A.A.; Sharaf, A.B.A.; Mahmoud, K.; Lehtonen, M.; Darwish, M.M.F. Accurate Insulating Oil Breakdown Voltage Model Associated with Different Barrier Effects. Processes 2021, 9, 657. [Google Scholar] [CrossRef]
  12. Hadi, M.H.H.; Ker, P.J.; Lee, H.J.; Leong, Y.S.; Hannan, M.A.; Jamaludin, M.Z.; Mahdi, M.A. Color Index of Transformer Oil: A Low-Cost Measurement Approach Using Ultraviolet-Blue Laser. Sensors 2021, 21, 7292. [Google Scholar] [CrossRef] [PubMed]
  13. Alshehawy, A.M.; Mansour, D.A.; Ghali, M.; Lehtonen, M.; Darwish, M.M.F. Photoluminescence Spectroscopy Measurements for Effective Condition Assessment of Transformer Insulating Oil. Processes 2021, 9, 732. [Google Scholar] [CrossRef]
  14. Thomas, P.; Hudedmani, N.E.; Prasath, R.T.A.R.; Roy, N.K.; Mahato, S.N. Synthetic ester oil based high permittivity CaCu3Ti4O12 (CCTO) nanofluids an alternative insulating medium for power transformer. IEEE Trans. Dielec. Electr. Insul. 2019, 26, 314–321. [Google Scholar] [CrossRef]
  15. Mentlik, V.; Trnka, P.; Hornak, J.; Totzauer, P. Development of a Biodegradable Electro-Insulating Liquid and Its Subsequent Modification by Nanoparticles. Energies 2018, 11, 508. [Google Scholar] [CrossRef] [Green Version]
  16. Saman, N.M.; Zakaria, I.H.; Ahmad, M.H.; Abdul-Malek, Z. Effects of Plasma Treated Alumina Nanoparticles on Breakdown Strength, Partial Discharge Resistance, and Thermophysical Properties of Mineral Oil-Based Nanofluids. Materials 2021, 14, 3610. [Google Scholar] [CrossRef]
  17. Shell Lubricants. Shell DIALA S4 ZX-1. Technical Paper. Available online: https://www.shell.com/promos/lubes/btb-products/the-perfect-partner/ (accessed on 2 October 2021).
  18. Münster, T.; Gratz, O.; Gockenbach, E.; Werle, P.; Friedel, J.; Hilker, A. Investigation on the impregnation characteristics of a new GTL based synthetic insulating fluid. In Proceedings of the 2017 IEEE 19th International Conference on Dielectric Liquids (ICDL), Manchester, UK, 25–29 June 2017; IEEE: Piscataway, NJ, USA, 2017; pp. 1–4. [Google Scholar] [CrossRef]
  19. Yu, H.; Liu, Q.; Wang, Z.; Krause, C.; Hilker, A. Effects of Electric Field Uniformity on Streamer and Breakdown Characteristics in a Gas-to-Liquid Oil under Positive Lightning Impulse. In Proceedings of the 2020 IEEE International Conference on High Voltage Engineering and Application (ICHVE), Beijing, China, 6–10 September 2020; IEEE: Piscataway, NJ, USA, 2020; pp. 1–4. [Google Scholar] [CrossRef]
  20. Cimbala, R.; Havran, P.; Bartko, P. Comparison of behavior of electroinsulating oils using thermo-hysteresis dependencies. In Proceedings of the 2020 21st International Scientific Conference on Electric Power Engineering (EPE), Prague, Czech Republic, 19–21 October 2020; IEEE: Piscataway, NJ, USA, 2020; pp. 1–5. [Google Scholar] [CrossRef]
  21. Rajňák, M.; Kurimský, J.; Dolník, B.; Cimbala, R.; Paulovičová, K.; Kopčanský, P.; Timko, M. Temperature Dependence of a Dielectric Relaxation in Weakly Polar Ferrofluids. Act. Phys. Pol. A 2017, 131, 943–945. [Google Scholar] [CrossRef]
  22. Rim, Y.H.; Baek, C.G.; Yang, Y.S. Insight into Electrical and Dielectric Relaxation of Doped Tellurite Lithium-Silicate Glasses with Regard to Ionic Charge Carrier Number Density Estimation. Materials 2020, 13, 5232. [Google Scholar] [CrossRef] [PubMed]
  23. Megger. Case Study IDAX 300 + VAX020. Technical Paper. Available online: https://megger.widen.net/view/pdf/0icatvbptc/200401-Case-Study-on-IdaxVax020-002.pdf?t.download=true (accessed on 16 December 2021).
  24. Tian, F.; Ohki, Y. Electric modulus powerful tool for analyzing dielectric behavior. IEEE Trans. Dielec. Electr. Insul. 2014, 21, 929–931. [Google Scholar] [CrossRef]
  25. Saltas, V.; Pentari, D.; Vallianatos, F. Complex Electrical Conductivity of Biotite and Muscovite Micas at Elevated Temperatures: A Comparative Study. Materials 2020, 13, 3513. [Google Scholar] [CrossRef] [PubMed]
  26. Ito, S.; Hirai, N.; Ohki, Y. Changes in mechanical and dielectric properties of silicone rubber induced by severe aging. IEEE Trans. Dielec. Electr. Insul. 2020, 27, 722–730. [Google Scholar] [CrossRef]
  27. Zukowski, P.; Rogalski, P.; Kierczynski, K.; Koltunowicz, T.N. Precise Measurements of the Temperature Influence on the Complex Permittivity of Power Transformers Moistened Paper-Oil Insulation. Energies 2021, 14, 5802. [Google Scholar] [CrossRef]
  28. Tang, Z.; Wu, K.; Huang, Y.; Li, J. High Breakdown Field CaCu3Ti4O12 Ceramics: Roles of the Secondary Phase and of Sr Doping. Energies 2017, 10, 1031. [Google Scholar] [CrossRef] [Green Version]
  29. Kudryashov, M.A.; Logunov, A.A.; Mochalov, L.A.; Kudryashova, Y.P.; Trubyanov, M.M.; Barykin, A.V.; Vorotyntsev, I.V. Hopping Conductivity and Dielectric Relaxations in Ag/PAN Nanocomposites. Polymers 2021, 13, 3251. [Google Scholar] [CrossRef]
  30. Cernea, M.; Radu, R.; Amorín, H.; Greculeasa, S.G.; Vasile, B.S.; Surdu, V.A.; Ganea, P.; Trusca, R.; Hattab, M.; Galassi, C. Lead-Free BNT-BT0.08/CoFe2O4 Core-Shell Nanostructures with Potential Multifunctional Applications. Nanomaterials 2020, 10, 672. [Google Scholar] [CrossRef] [PubMed] [Green Version]
  31. Liu, J.; Fan, X.; Zhang, Y.; Zheng, H.; Jiao, J. Temperature correction to dielectric modulus and activation energy prediction of oil-immersed cellulose insulation. IEEE Trans. Dielec. Electr. Insul. 2020, 27, 956–963. [Google Scholar] [CrossRef]
  32. Wübbenhorst, M.; Turnhout, J. Analysis of complex spectra. I. One-dimensional derivative techniques and three-dimensional modeling. J. Non-Cryst. Sol. 2002, 305, 40–49. [Google Scholar] [CrossRef]
  33. PARAMO. Mogul TRAFO CZ-A. Technical Data Sheet. Available online: https://eshop.paramo.cz/data/VyrobkovaDokumentace/ti_trafo_cza_z5.pdf (accessed on 2 October 2021).
  34. Test Cell for Liquid Insulants. 2903. Datasheet. Available online: https://www.pfiffner-group.com/fileadmin/user_upload/HAEFELY/Products/Instruments/Solid_and_Liquid_Dielectric_Analysers/Datasheets/2903_-_Test_Cell_Liquid_Insulants_-_HAEFELY_-__Datasheet_V2103.pdf (accessed on 16 December 2021).
  35. Megger. IDAX 300. Insulation Diagnostic Analyzer. Technical Paper. Available online: https://www.techrentals.com.au/wiki/learn-about/_electrical-power/transformer-testers/megger-idax-300-insulation-diagnostic-analyser/Megger-IDAX-300-Insulation-Diagnostic-Analyser-DataSheet.pdf (accessed on 16 December 2021).
  36. Menti, A.; Barkas, S.; Kaminaris, S.; Psomopoulos, C.S. Supraharmonic emission from a three-phase PV system connected to the LV grid. Energy Rep. 2021, 7, 527–542. [Google Scholar] [CrossRef]
  37. Santoso, S.; McGranaghan, M.F.; Dugan, R.C.; Beaty, H.W. Electrical Power Systems Quality, 3rd ed.; McGraw-Hill: New York, NY, USA, 2012; p. 580. [Google Scholar]
  38. EN 50160: Voltage Characteristics of Electricity Supplied by Public Electricity Networks; CENELEC: Brussels, Belgium, 2010.
  39. EN 61000-2-12: Electromagnetic Compatibility (EMC). Part 2-12: Environment—Compatibility Levels for Low-Frequency Conducted Disturbances and Signaling in Public Medium-Voltage Power Supply Systems, 1st ed.; IEC: Geneva, Switzerland, 2003.
  40. Megger. IDAX 300/350. Insulation Diagnostic Analyzer. Technical Paper. Available online: https://embed.widencdn.net/pdf/plus/megger/0fjj5whwum/IDAX300-350_DS_en.pdf (accessed on 16 December 2021).
  41. Nair, K.R.M. Power and Distribution Transformers: Practical Design Guide, 1st ed.; CRC Press: Boca Raton, FL, USA, 2021; p. 497. [Google Scholar]
  42. Cui, L.; Zhou, X.; Li, H.; Chen, J. Analysis of oil paper insulation state based on frequency domain spectroscopy. In Proceedings of the 2021 13th International Conference on Measuring Technology and Mechatronics Automation (ICMTMA), Beihai, China, 16–17 January 2021; IEEE: Piscataway, NJ, USA, 2021; pp. 780–783. [Google Scholar] [CrossRef]
  43. Gäfvert, U.; Adeen, L.; Tapper, M.; Ghasemi, P.; Jönsson, B. Dielectric spectroscopy in time and frequency domain applied to diagnostics of power transformers. In Proceedings of the 6th International Conference on Properties and Applications of Dielectric Materials (Cat. No. 00CH36347), Xi´an, China, 21–26 June 2000; IEEE: Piscataway, NJ, USA, 2020; pp. 825–830. [Google Scholar] [CrossRef]
  44. 4-2013—IEEE Standard for High-Voltage Testing Techniques; IEEE: Piscataway, NJ, USA, 10 May 2013. [CrossRef]
  45. C57.12.00-2015—IEEE Standard for General Requirements for Liquid-Immersed Distribution, Power, and Regulating Transformers; IEEE: Piscataway, NJ, USA, 12 May 2016. [CrossRef]
  46. Xie, J.; Dong, M.; Yu, B.; Hu, Y.; Yang, K.; Xia, C. Physical Model for Frequency Domain Spectroscopy of Oil-Paper Insulation in a Wide Temperature Range by a Novel Analysis Approach. Energies 2020, 13, 4530. [Google Scholar] [CrossRef]
  47. Liu, J.; Fan, X.; Zhang, Y.; Zhang, C.; Wang, Z. Aging evaluation and moisture prediction of oil-immersed cellulose insulation in field transformer using frequency domain spectroscopy and aging kinetics model. Cellulose 2020, 27, 7175–7189. [Google Scholar] [CrossRef]
  48. Zhou, Y.; Hao, M.; Chen, G.; Wilson, G.; Jarman, P. Space charge polarization in insulating mineral oil. In Proceedings of the 2013 Annual Report Conference on Electrical Insulation and Dielectric Phenomena, Chenzhen, China, 20–23 October 2013; IEEE: Piscataway, NJ, USA, 2013; pp. 587–590. [Google Scholar] [CrossRef]
  49. Dumitran, L.M.; Gorun, F.; Nicolae, Ş.; Mirica, C. Dielectric Properties of Mineral and Vegetable Oils Mixtures for Power Transformers. In Proceedings of the 2019 11th International Symposium on Advanced Topics in Electrical Engineering (ATEE), Bucharest, Romania, 28–30 March 2019; IEEE: Piscataway, NJ, USA, 2019; pp. 1–6. [Google Scholar] [CrossRef]
  50. Yang, K.; Dong, M.; Hu, Y.; Xie, J.; Ren, M. The Application of Dielectric Modulus in the Oil-impregnated Paper Insulation. In Proceedings of the 2020 IEEE Electrical Insulation Conference (EIC), Knoxville, TN, USA, 5 August 2020; IEEE: Piscataway, NJ, USA, 2020; pp. 103–106. [Google Scholar] [CrossRef]
  51. Zaengl, W.S. Application of dielectric spectroscopy in time and frequency domain for HV power equipment. IEEE Elec. Insul. Mag. 2003, 19, 9–22. [Google Scholar] [CrossRef]
  52. Jaya, M.; Geißler, D.; Leibfried, T. Accelerating Dielectric Response Measurements on Power Transformers—Part I: A Frequency-Domain Approach. IEEE Trans. Power Deliv. 2013, 28, 1469–1473. [Google Scholar] [CrossRef]
  53. Flora, S.D.; Rajan, J.S. Study of Frequency Domain Spectroscopy on model transformer windings at elevated temperatures. In Proceedings of the 2015 IEEE 11th International Conference on the Properties and Applications of Dielectric Materials (ICPADM), Sydney, NSW, Australia, 15 October 2015; IEEE: Piscataway, NJ, USA, 2015; pp. 340–343. [Google Scholar] [CrossRef]
  54. ASTM D924—08: Standard Test Method for Dissipation Factor (or Power Factor) and Relative Permittivity (Dielectric Constant) of Electrical Insulating Liquids. Available online: https://toaz.info/doc-viewer (accessed on 17 December 2021).
  55. Del Vecchio, R.; Del Vecchio, R.M.; Poulin, B.; Feghali, P.T.; Shah, D.M.; Ahuja, R. Transformer Design Principles, 3rd ed.; CRC Press, Taylor & Francis Group: Boca Raton, FL, USA, 2017; p. 612. [Google Scholar]
  56. Rajab, A.; Sulaeman, A.; Sudirham, S.; Suwarno, A. Comparison of Dielectric Properties of Palm Oil with Mineral and Synthetic Types Insulating Liquid under Temperature Variation. ITB J. Eng. Sci. 2011, 43, 191–208. Available online: http://journal.itb.ac.id/index.php?li=article_detail&id=827 (accessed on 17 December 2021). [CrossRef] [Green Version]
  57. Asandulesa, M.; Kostromin, S.; Tameev, A.; Aleksandrov, A.; Bronnikov, S. Molecular Dynamics and Conductivity of a PTB7:PC71BM Photovoltaic Polymer Blend: A Dielectric Spectroscopy Study. ACS Appl. Polym. Mater. 2021, 3, 4869–4878. [Google Scholar] [CrossRef]
  58. C57.106-2015—IEEE Guide for Acceptance and Maintenance of Insulating Mineral Oil in Electrical Equipment; IEEE: Piscataway, NJ, USA, 23 March 2016. [CrossRef]
  59. Chronis, I.; Kalogeropoulou, S.; Psomopoulos, C.S. A review on the requirements for environmentally friendly insulating oils used in high-voltage equipment under the eco design framework. Environ. Sci. Pollut. Res. 2021, 28, 33828–33836. [Google Scholar] [CrossRef] [PubMed]
  60. Yan, W.; Yang, L.; Cui, H.; Ge, Z.; Li, S.; Li, S. Comparison of Degradation Mechanisms and Aging Behaviors of Palm Oil and Mineral Oil during Thermal Aging. In Proceedings of the 2018 Condition Monitoring and Diagnosis (CMD), Perth, WA, Australia, 23–26 September 2018; IEEE: Piscataway, NJ, USA, 2018; pp. 1–6. [Google Scholar] [CrossRef]
  61. Mehmood, M.A.; Li, J.; Wang, F.; Huang, Z.; Ahmad, J.; Bhutta, M.S. Analyzing the health condition and chemical degradation in field aged transformer insulation oil using spectroscopic techniques. In Proceedings of the 2018 International Conference on Diagnostics in Electrical Engineering (Diagnostika), Pilsen, Czech Republic, 4–7 September 2018; IEEE: Piscataway, NJ, USA, 2018; pp. 1–4. [Google Scholar] [CrossRef]
Figure 1. Dielectric behavior of weakly polar ferrofluid based on mineral oil Mogul TRAFO CZ-A in the complex plane. Adapted from [21].
Energies 15 00391 g001
Figure 2. Wiring diagram of the experimental measuring setup.
Energies 15 00391 g002
Figure 3. Complex electric modulus M* of MO oil in the frequency band.
Energies 15 00391 g003
Figure 4. Cole-Cole diagram of a complex electric modulus M* of MO oil.
Energies 15 00391 g004
Figure 5. Complex electric modulus M* of SD oil in the frequency band.
Energies 15 00391 g005
Figure 6. Cole-Cole diagram of a complex electric modulus M* of SD oil.
Energies 15 00391 g006
Figure 7. Comparison of electrical insulating oils of the intensity E of time-varying electric field 0.5 kV/m.
Energies 15 00391 g007
Figure 8. Comparison of electrical insulating oils of the intensity E of time-varying electric field 5 kV/m.
Energies 15 00391 g008
Figure 9. Comparison of electrical insulating oils of the intensity E of time-varying electric field 50 kV/m.
Energies 15 00391 g009
Figure 10. Regression lines of α parameter depend on the intensity E of the time-varying electric field.
Energies 15 00391 g010
Figure 11. Regression lines of β parameter depend on the intensity E of the time-varying electric field.
Energies 15 00391 g011
Figure 12. Regression lines of relaxation time τM depending on the intensity E of the time-varying electric field.
Energies 15 00391 g012
Figure 13. Frequency spectra of electrical conductivity σ of investigated oils at intensity E of the time-varying electric field.
Energies 15 00391 g013
Figure 14. Cole-Cole diagram of the complex impedance Z* of the investigated oils.
Energies 15 00391 g014
Figure 15. The dielectric dissipation factor tg δ of electrical insulating oils in the frequency band of decimal graduated intensity E of the time-varying electric field.
Energies 15 00391 g015
Table 1. Characteristic parameters of MO oil. Adapted from [33].
ParameterUnitValue
Density at 288.15 Kkg/m3840
Viscosity at 313.15 Kmm2/s10
Viscosity at 243.15 Kmm2/s850
FlashpointK448.15
Flow pointK228.15
Acid numbermg KOH/g0.005
Surface tensionmN/m55
Breakdown voltagekV75
Dissipation factor tg δ at 363.15 K0.001
ResistivityΩ cm 10121000
Inhibitor content%0.4
Amount of distillate up to 623.15 K%82
Table 2. Characteristic parameters of SD oil. Adapted from [17].
ParameterUnitValue
Density at 293.15 Kkg/m3805
Viscosity at 313.15 Kmm2/s9.6
Viscosity at 243.15 Kmm2/s382
FlashpointK464.15
Flow pointK231.15
Acid numbermg KOH/g0.02
Volumetric water contentmg/kg6
Breakdown voltagekV75
Dissipation factor tg δ at 363.15 K<0.001
Sludge content%<0.01
Inhibitor content%0.2
Total sulfur contentmg/kg<1
Table 3. Relaxation parameters in the investigated frequency spectrum of electrical insulating oils.
0.5 kV/m5 kV/m50 kV/m
αMmαMmαMm
SD0.1460.3670.1080.3960.0380.45
MO10.0560.3160.0540.3640.0040.417
MO20.0670.0670.0560.0590.0330.095
βτMβτMβτM
SD0.85473.970.89233.910.96213.21
MO10.944105.50.94658.020.9960.517
MO20.9331.6560.9441.9950.9670.075
Table 4. Dielectric dissipation factor tg δ values at mains frequency.
SD–tg δ (-)MO–tg δ (-)Difference (%)
0.5 kV/m50 Hz0.002890.00396≈27
60 Hz0.00310.00442≈30
5 kV/m50 Hz0.002980.00319≈7
60 Hz0.00320.00346≈8
50 kV/m50 Hz0.00280.02811≈90
60 Hz0.002920.03274≈91
Publisher’s Note: MDPI stays neutral with regard to jurisdictional claims in published maps and institutional affiliations.

