Article

Improving Energy Efficiency by Utilizing Wetted Cellulose Pads in Passive Cooling Systems

by
Ebrahim Morady
1,
Madjid Soltani
1,2,3,4,*,
Farshad Moradi Kashkooli
1,
Masoud Ziabasharhagh
1,
Armughan Al-Haq
3 and
Jatin Nathwani
3
1
Department of Mechanical Engineering, K. N. Toosi University of Technology, Tehran 19967-15433, Iran
2
Department of Electrical and Computer Engineering, University of Waterloo, Waterloo, ON N2L 3G1, Canada
3
Waterloo Institute for Sustainable Energy (WISE), University of Waterloo, Waterloo, ON N2L 3G1, Canada
4
Advanced Energy Initiative Center, K. N. Toosi University of Technology, Tehran 14176-14411, Iran
*
Author to whom correspondence should be addressed.
Energies 2022, 15(1), 369; https://doi.org/10.3390/en15010369
Submission received: 30 November 2021 / Revised: 29 December 2021 / Accepted: 30 December 2021 / Published: 5 January 2022
(This article belongs to the Section A3: Wind, Wave and Tidal Energy)

Abstract

:
The effectiveness of using wetted cellulose pads on improving the performance of two conventional passive cooling systems has been evaluated. First, an experimental design was developed to determine the impact of using a wetted cellulose pad on the temperature and velocity of the airflow. A cellulose pad (7090 model) with a cross-sectional area of 0.5 × 0.5 m2 and three different thicknesses of 10, 15, and 30 cm were selected and tested. The results indicated that using wetted cellulose pads with thicknesses ranging from 10–30 cm decreased the outlet airflow temperature from 11.3 to 13.7 °C on average. For free airflow at velocity 3.5 m/s, the outlet airflow velocity from the wetted cellulose pad decreased to 0.9, 0.7 and 0.6 m/s, respectively, for cellulose pads with thicknesses of 10, 15, and 30 cm. By applying experimental results on a psychrometric chart, the humidity ratio of outlet airflow was obtained between 40–70%. The study established airflow velocity as the critical parameter in passive cooling systems. With the novel concept of combining wetted cellulose pads for passive cooling systems (i.e., wind catchers and induced ventilation), there is good potential to reduce the energy requirements for thermal comfort in buildings in regions with a hot and arid climate.

1. Introduction

The rising demand for cooling and thermal comfort, with consequential increases in energy consumption in the building sector, is an emerging concern. Data on energy consumption show that about 40% of total energy consumption, and up to 30% of the world’s CO2 production, is related to the building sector. In the United States, 20% of the total energy consumption, and 50% of energy consumption in buildings is related to air conditioning systems [1,2,3]. Studies in China have shown that energy consumption in the construction sector will reach 35% of its total energy consumption by 2020 [4,5]. Energy consumption growth and increasing CO2 production has led to a strong research focus on identifying strategies for improving energy efficiency in buildings [6,7,8,9,10,11,12]. Use of passive methods offers a promising pathway to reducing energy consumption and CO2 emissions from buildings. Among different passive ventilation methods, the utilization of wind as a passive energy source to create comfortable conditions in buildings has been a common method from ancient times. For years, in central and southern parts of Iran, wind catchers, i.e., Badgirs, have been used as an effective method for cooling homes. Figure 1 shows a traditional type of wind catcher that is used in central parts of Iran.
Wind catchers are divided into four general types, reflecting their shapes and the number of entrance sections [13]:
(i)
One-sided wind catchers, which have one opening (Figure 2a). To receive maximum airflow, the opening is in front of the dominant outside air direction. Many one-sided wind catchers are used in other directions [13];
(ii)
Two-sided wind catchers, with two openings: one in the direction of the wind and the other on almost the opposite side (Figure 2b). In comparison with one-sided wind catchers, two-sided wind catchers perform better [13];
(iii)
Cylindrical wind catchers are the most advanced type, and have a better performance than the other types. Cylindrical wind catchers (Figure 2c) do not have the limitations of the other types [13];
(iv)
Four, six, or eight-sided wind catchers with varying dimensions. The height of the opening is utilized depending on the climate of the region (Figure 2d) [13].
In recent years, various parameters related to wind catchers have been evaluated analytically, numerically, and experimentally [13,14,15,16,17,18,19,20,21,22,23,24,25,26,27,28,29,30,31,32,33,34,35]. Montazeri and Azizian [15] experimentally evaluated the performance of a one-sided wind catcher using a wind tunnel. For different inlet air incident angles, the induced airflow and pressure coefficient were measured, and smoke was used to visualize the flow pattern in and over the wind catcher. Results showed that the performance of the wind catcher was highly dependent on the wind incident angles. The wind catcher acts like a chimney, with air entering through the windows and exiting through the wind catcher. Results also showed that for a full dimension wind catcher in an atmospheric condition, the performance of the wind catcher decreases by 50% at a zero-wind incident angle. Bekleyen and Melïkoğlu [16] investigated the thermal effects of the wind catchers on the Iwan zone in buildings. It was found that the Iwan of buildings is the coolest part of the house in the day during the summer. Alsailani et al. [19] evaluated the impacts of geometrical characteristics of the wind catchers on the ventilation effectiveness in buildings. Results showed that increasing the pressure difference between the wind catcher outlet and the window, as well as minimizing pressure losses, are among the most effective parameters on the effectiveness of wind catchers, whereas rounding inner and outer bends and sloping ceilings and side walls have a marginal effect. Bahadori et al. [28] investigated wind catchers with wetted columns and wetted surfaces experimentally and numerically, and compared their performance against conventional wind catchers. It was found that a one-sided wind catcher has good potential for improving thermal comfort in buildings. Kazemi Esfeh et al. [36] experimentally examined the impact of the wind catcher roof shape on the induced flow to the one-sided wind catcher. Three types of wind catcher roof shapes (i.e., flat, inclined, and curved) were examined. The results illustrated that roof geometry of a wind catcher has a significant effect on the flow pattern inside the wind catcher, and the wind catcher with a curved roof had a better performance than the others. Due to the limitations of traditional wind catchers, Dehghani-Sanij et al. [13] proposed a new type of wind catcher that is capable of setting itself in the maximum ambient air direction. By using a wind vane, the direction of the wind can be detected, and the head of the wind catcher can be rotated manually or electronically to set the maximum wind velocity at frontal face. Easy installation, better performance, and the ability of setting itself in front of the maximum wind speed are some of the advantages of the proposed wind catcher. Afshin et al. [37] experimentally evaluated the effects of angle and velocity of wind on a two-sided wind catcher, using a wind tunnel and smoke flow visualization. Pressure coefficient and induced air velocity were investigated for different wind incident angles. Results showed that the performance of the two-sided wind catcher was highly affected by wind incident angles, and for wind incident angles greater than 55°, the wind catcher acted as a chimney. Soltani et al. [38] numerically investigated airflow patterns in a new design of wind catcher with a wetted surface. Results showed that wind velocity has a significant role in the wind catcher performance, and wind catcher had a better performance for higher wind velocities. Khani et al. [39] experimentally and analytically investigated the effects of using a wetted surface in the inflow section of a modular wind catcher. It was found that using a wind catcher with a wetted surface can decrease the inlet air temperature by an average of 10 °C, and increase relative humidity by an average of 40%.
For centuries, people in Middle East have used wind catchers and openings on the external walls as passive methods to ventilate their houses. However, as it is known, these methods simply guide outdoor air into internal spaces and have no effect on the air properties, such as temperature and humidity—critical parameters for creating thermal comfort in buildings. A novel method to improve the performance of these methods is to combine them with an evaporative cooling system, such as a wetted surface or a wetted column, to decrease the air temperature and increase the air humidity. Using forced evaporative cooling system in buildings [40,41,42,43,44], especially in hot and arid regions, is a common method to create thermal comfort. Among them, cellulose pads have a high potential in evaporative cooling.
The main purpose of this research is to evaluate the performance of wind catchers using a corrugated cellulose pad (7090 model) as a wetted surface. To this aim, and due to the lack of valid data regarding free air flow passing through the cellulose pad, an experimental design was developed. Then, using a constant ambient air velocity that was created by a centrifugal fan, the outlet airflow velocity and temperature was measured. Data for three different cellulose pad thicknesses (10, 15, and 30 cm) with five different inlet airflow temperatures were recorded. The water consumption in the process was calculated analytically, based on the inlet and outlet airflow temperature from the cellulose pad. The evaporative cooling process is illustrated on the psychrometric chart to determine the outlet airflow humidity from the wetted cellulose pad. Finally, the use of the wetted cellulose pad in the wind catchers and the induced ventilation of two passive cooling systems are evaluated.

2. Materials and Methodologies

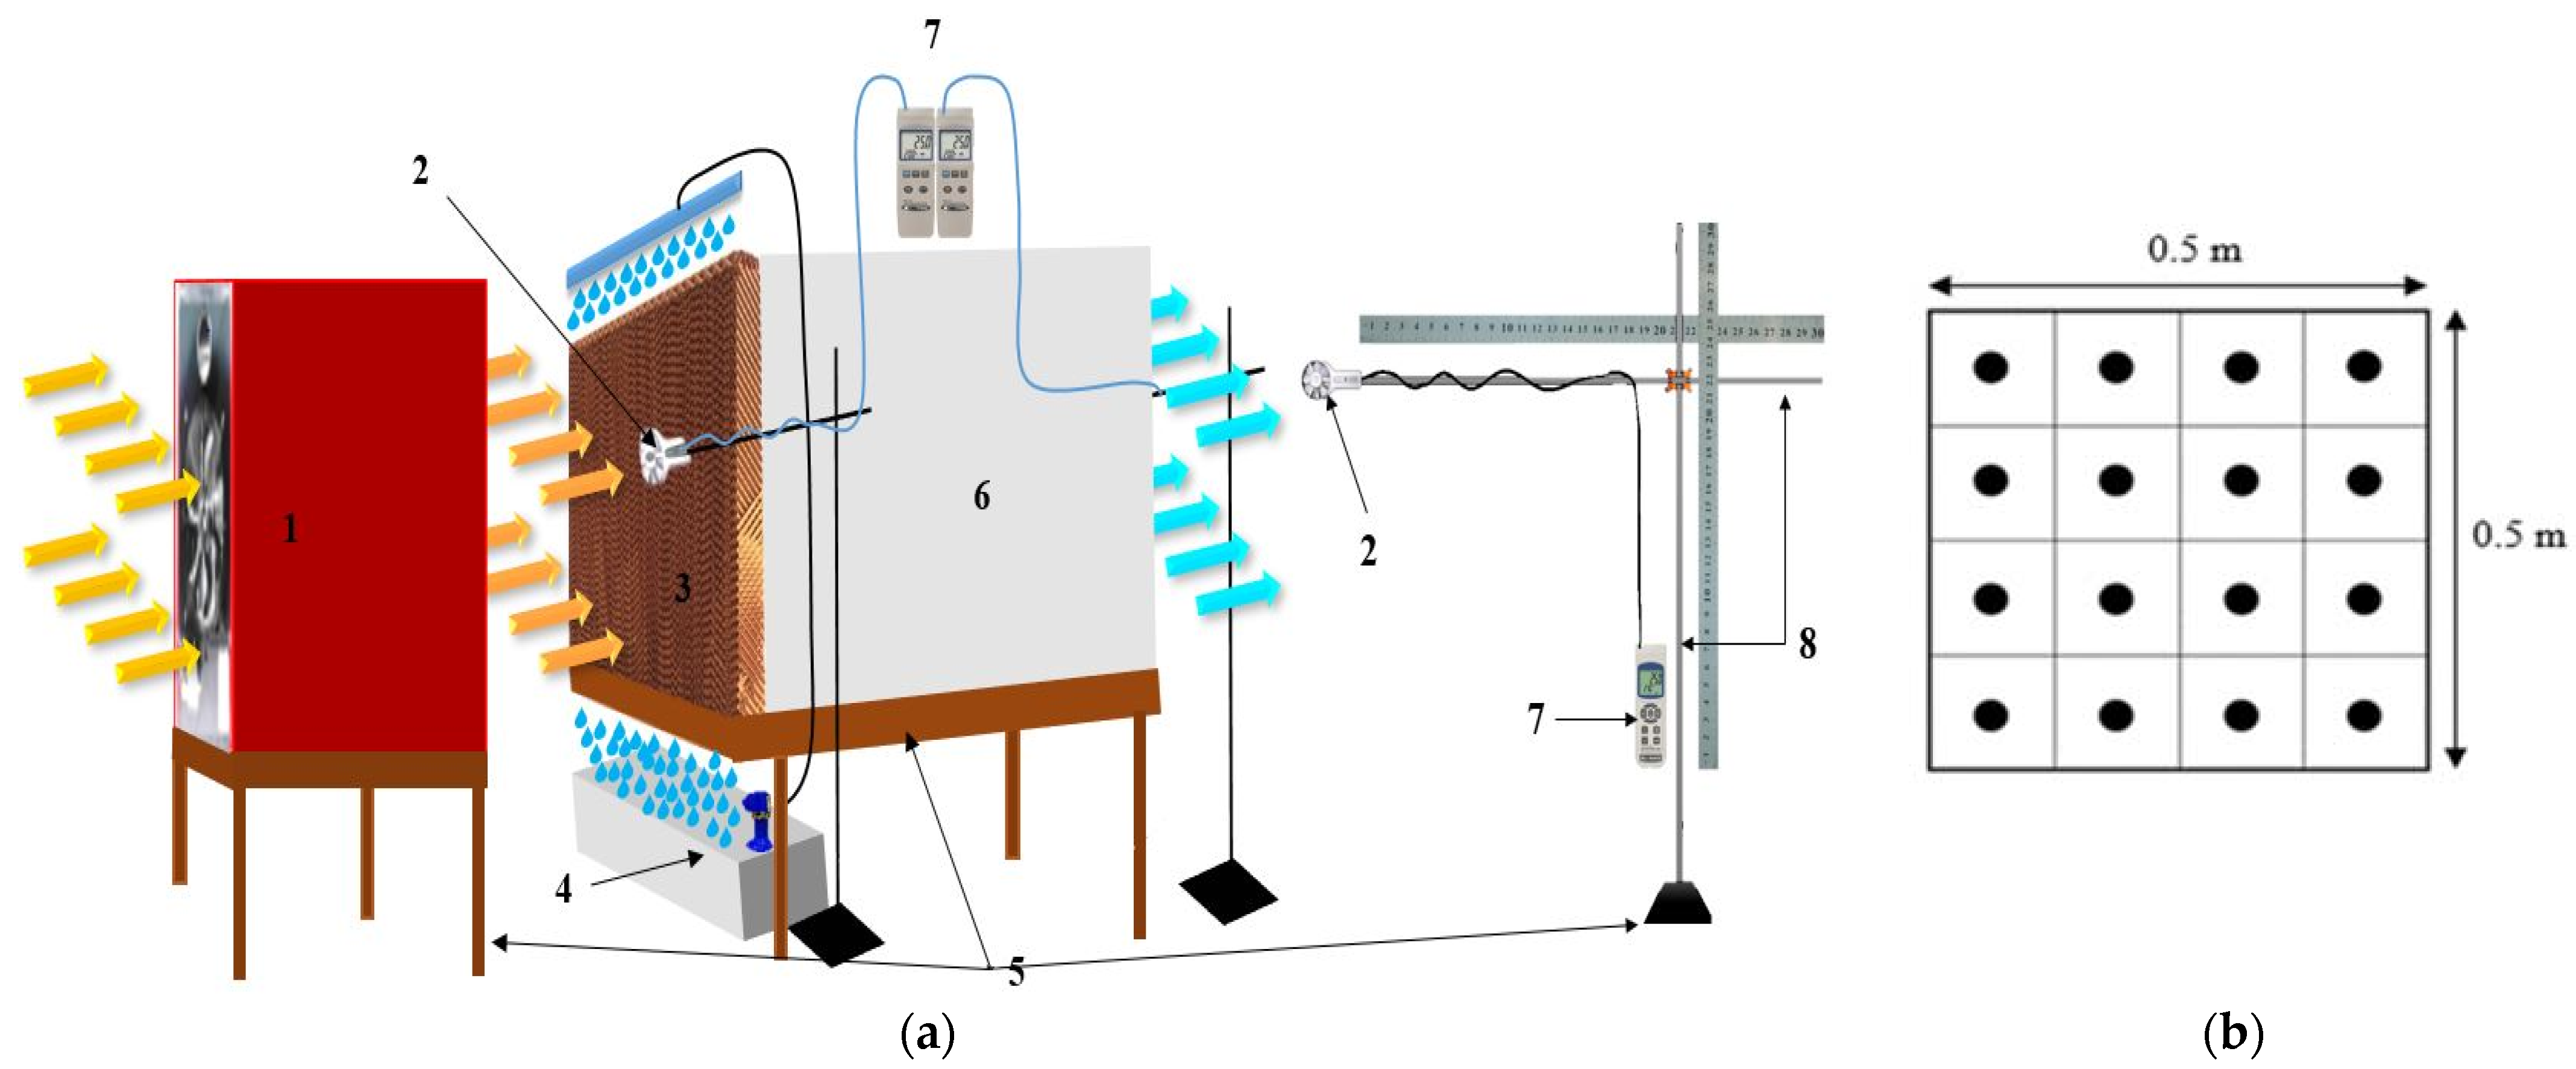
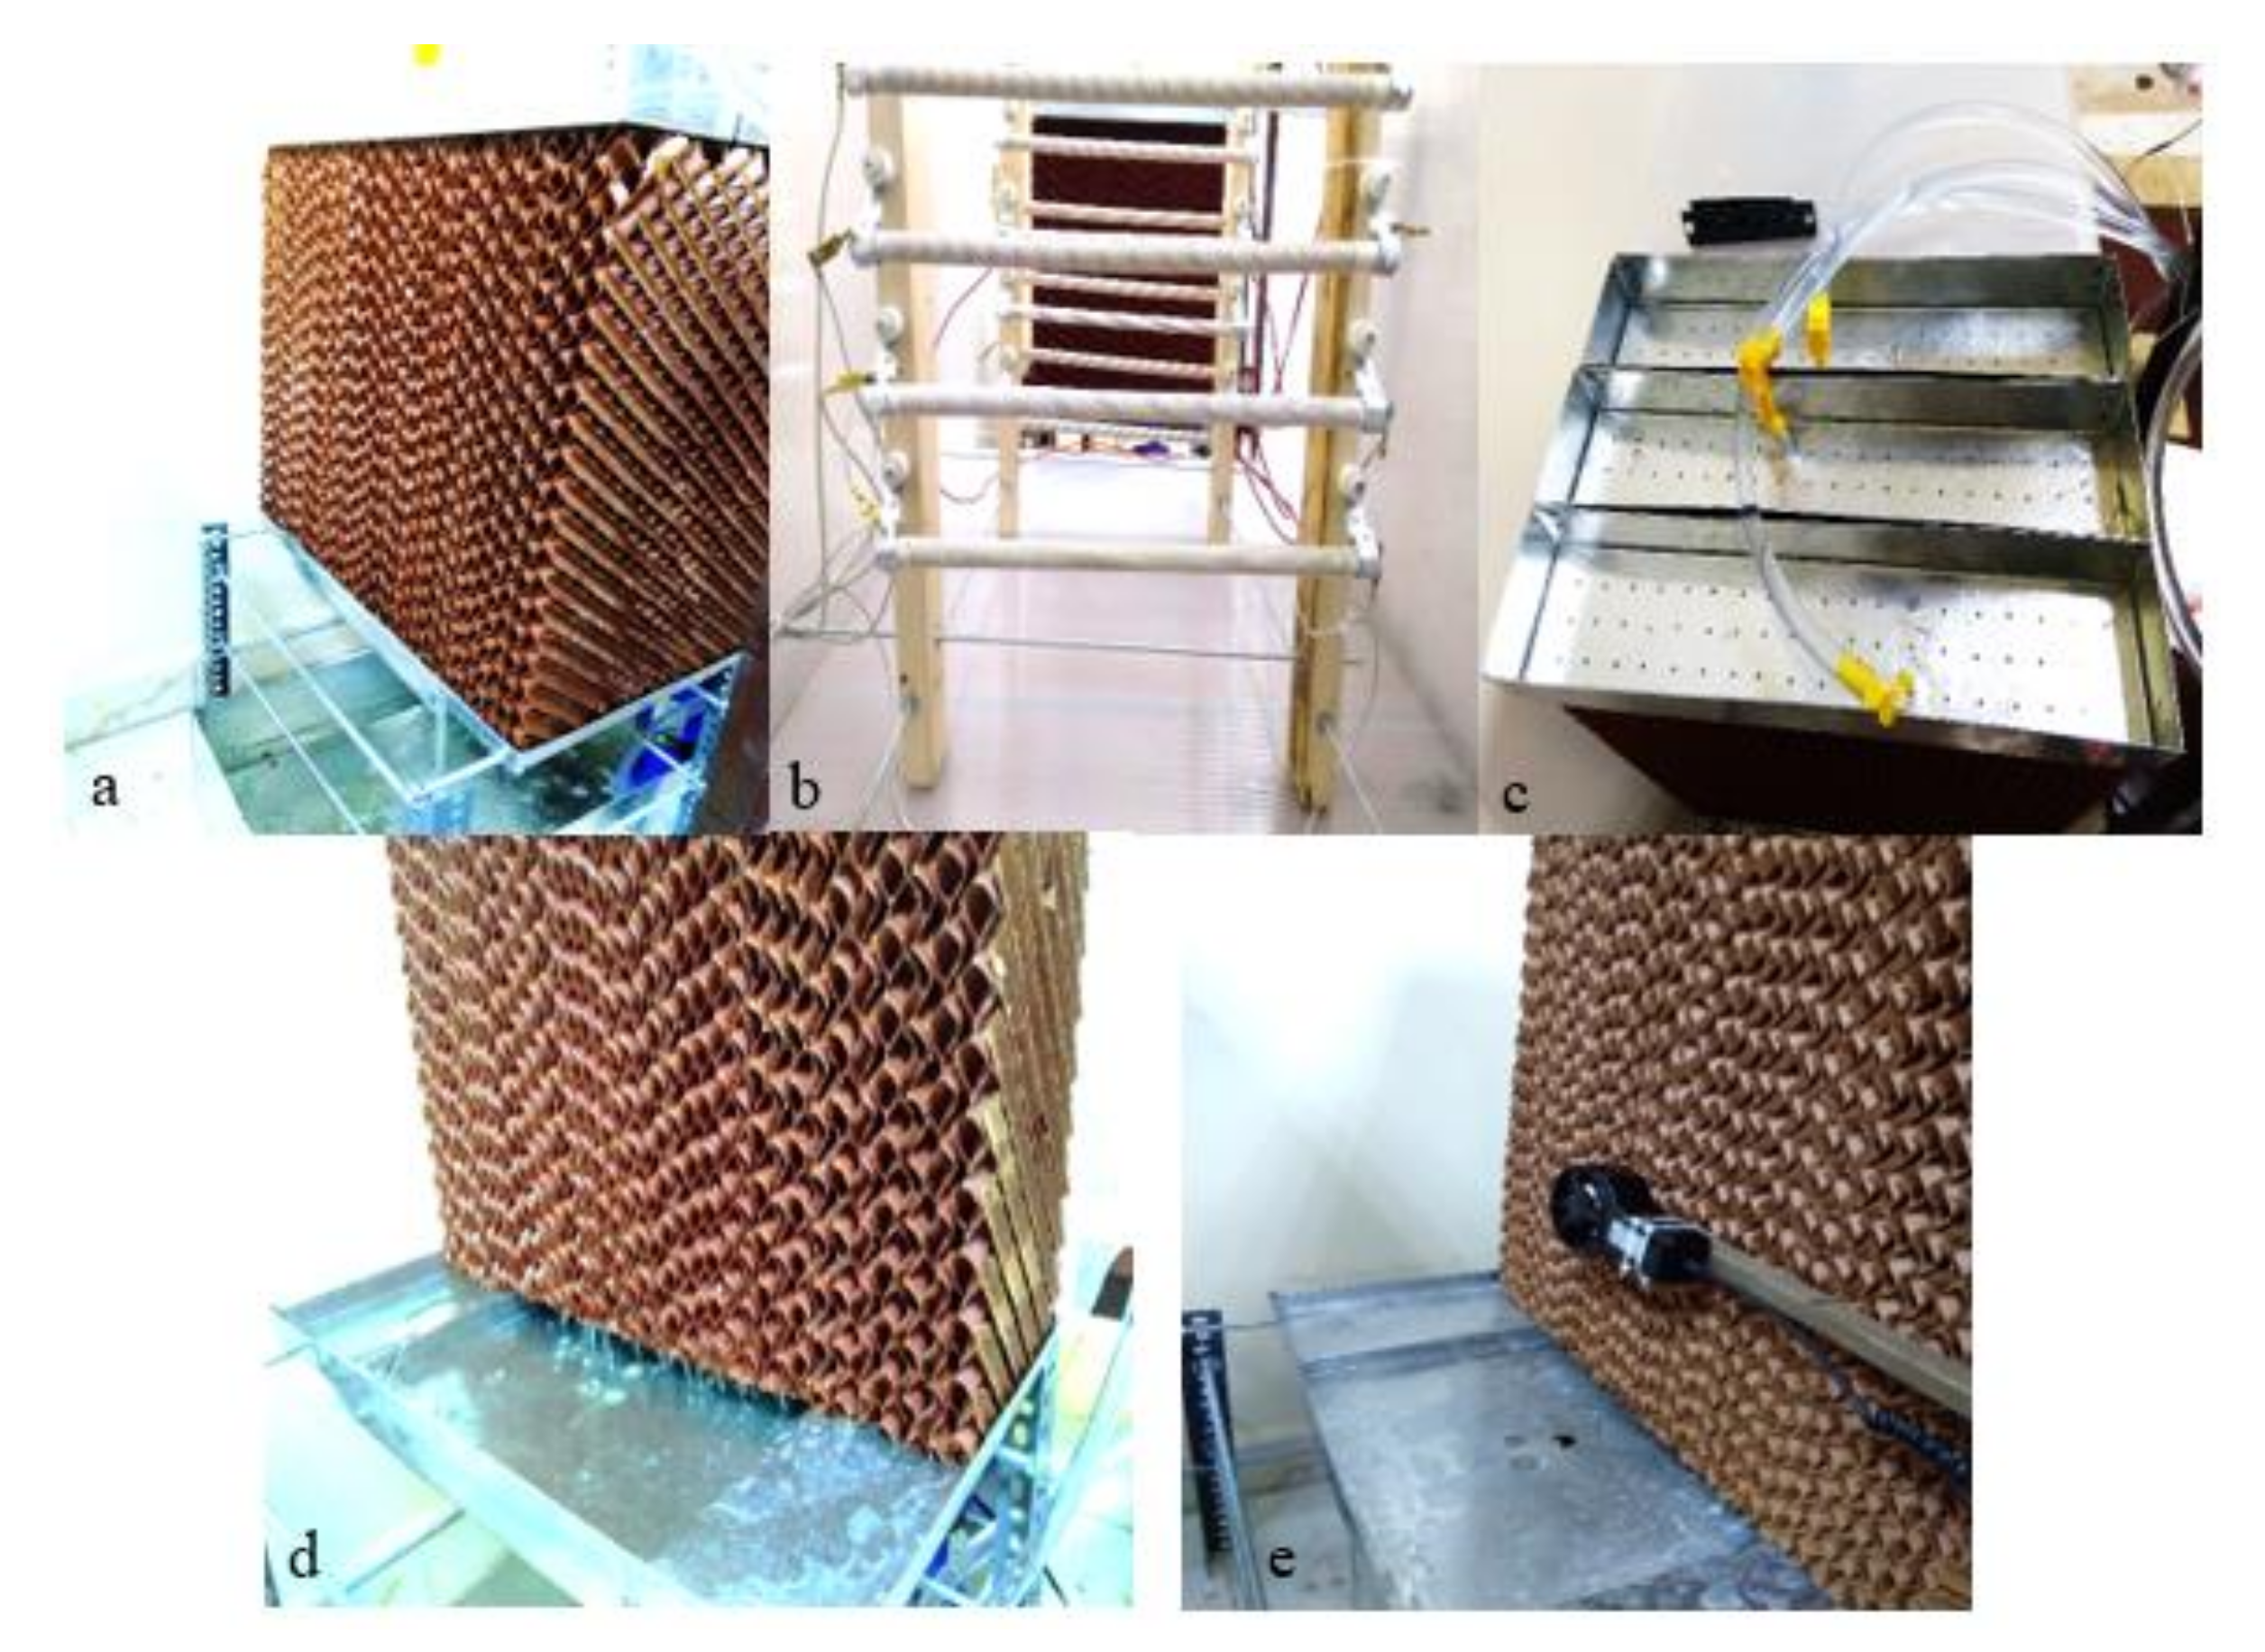
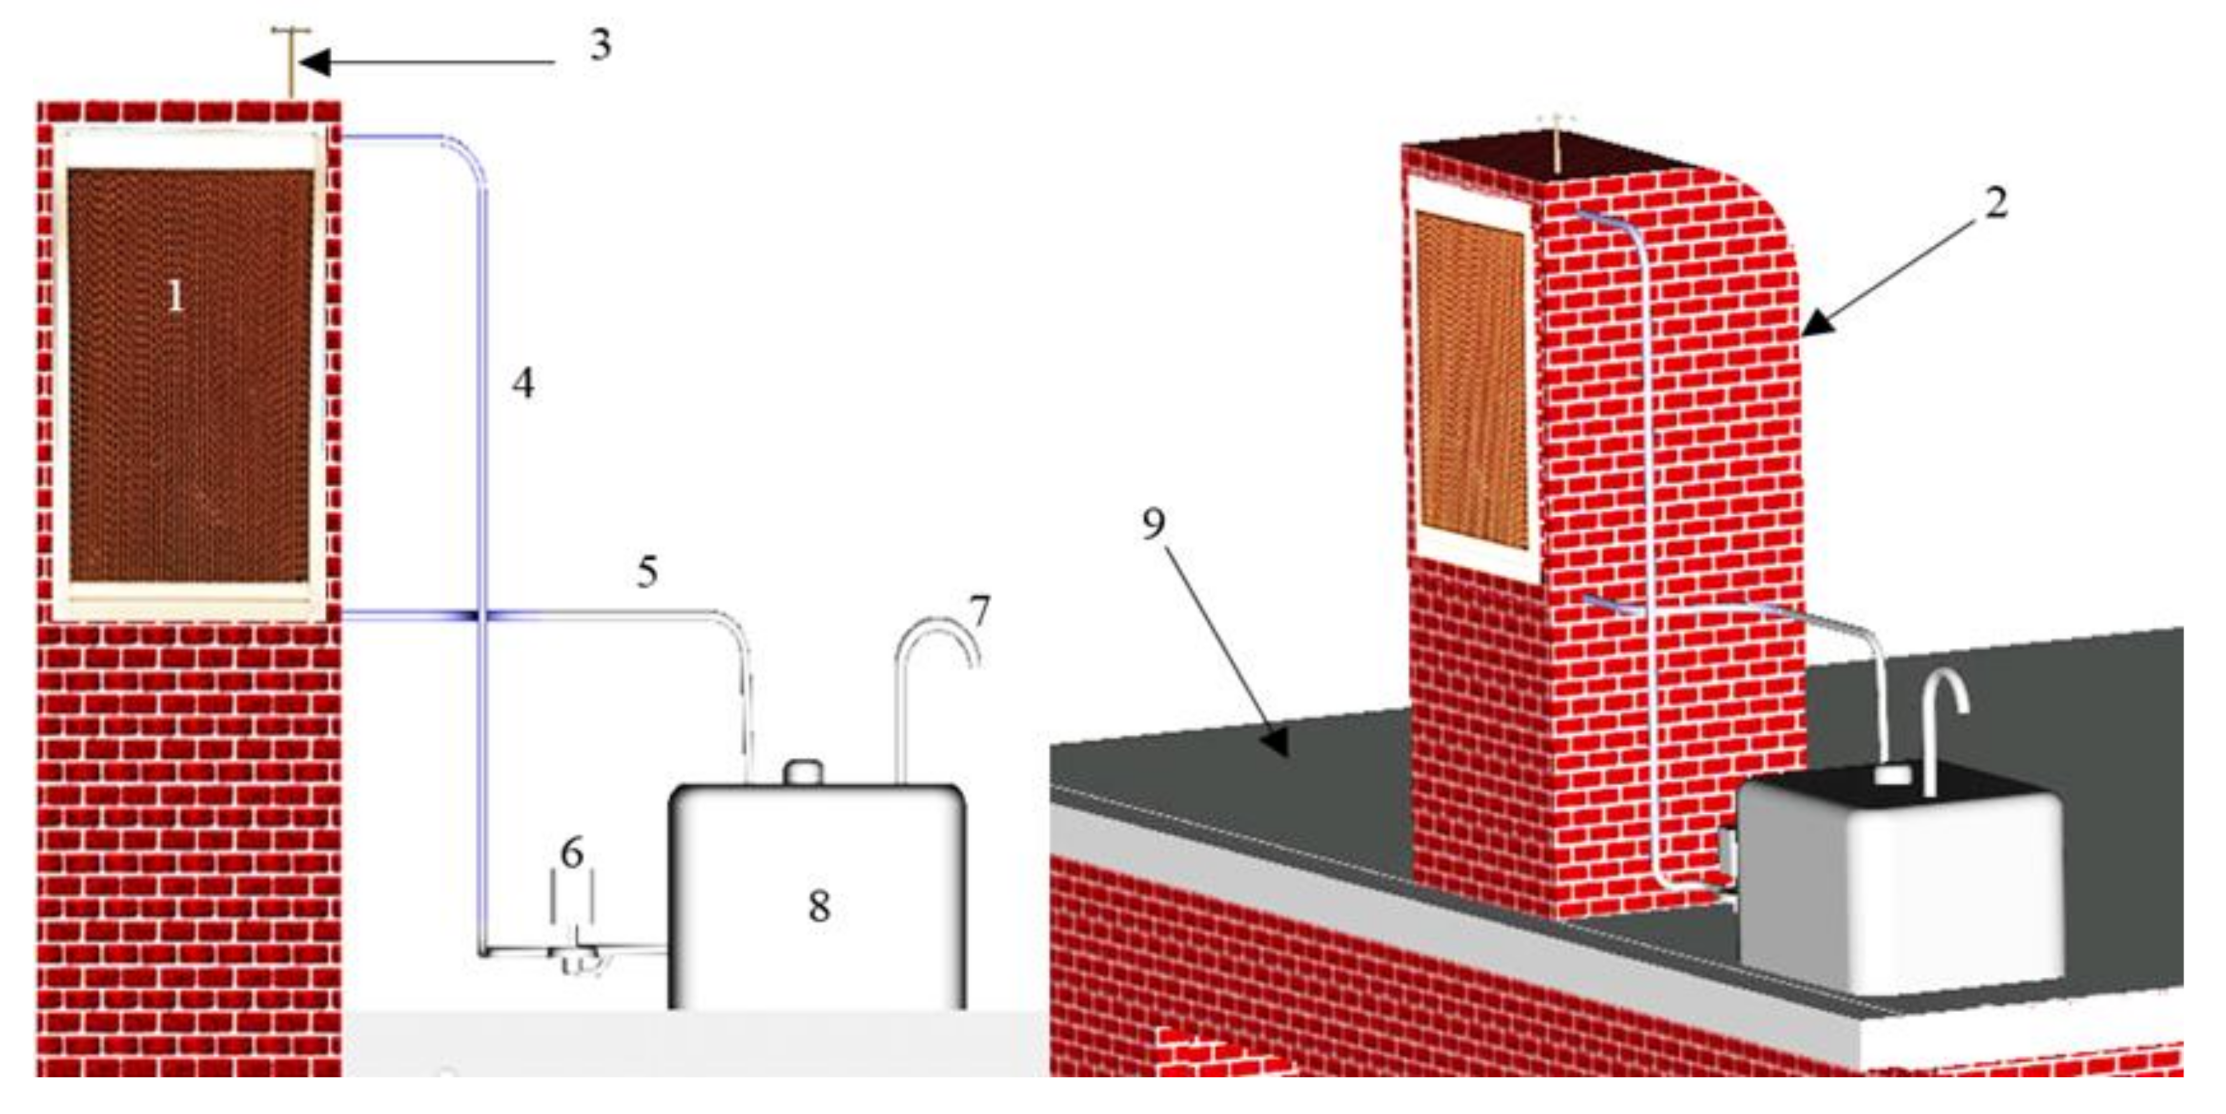
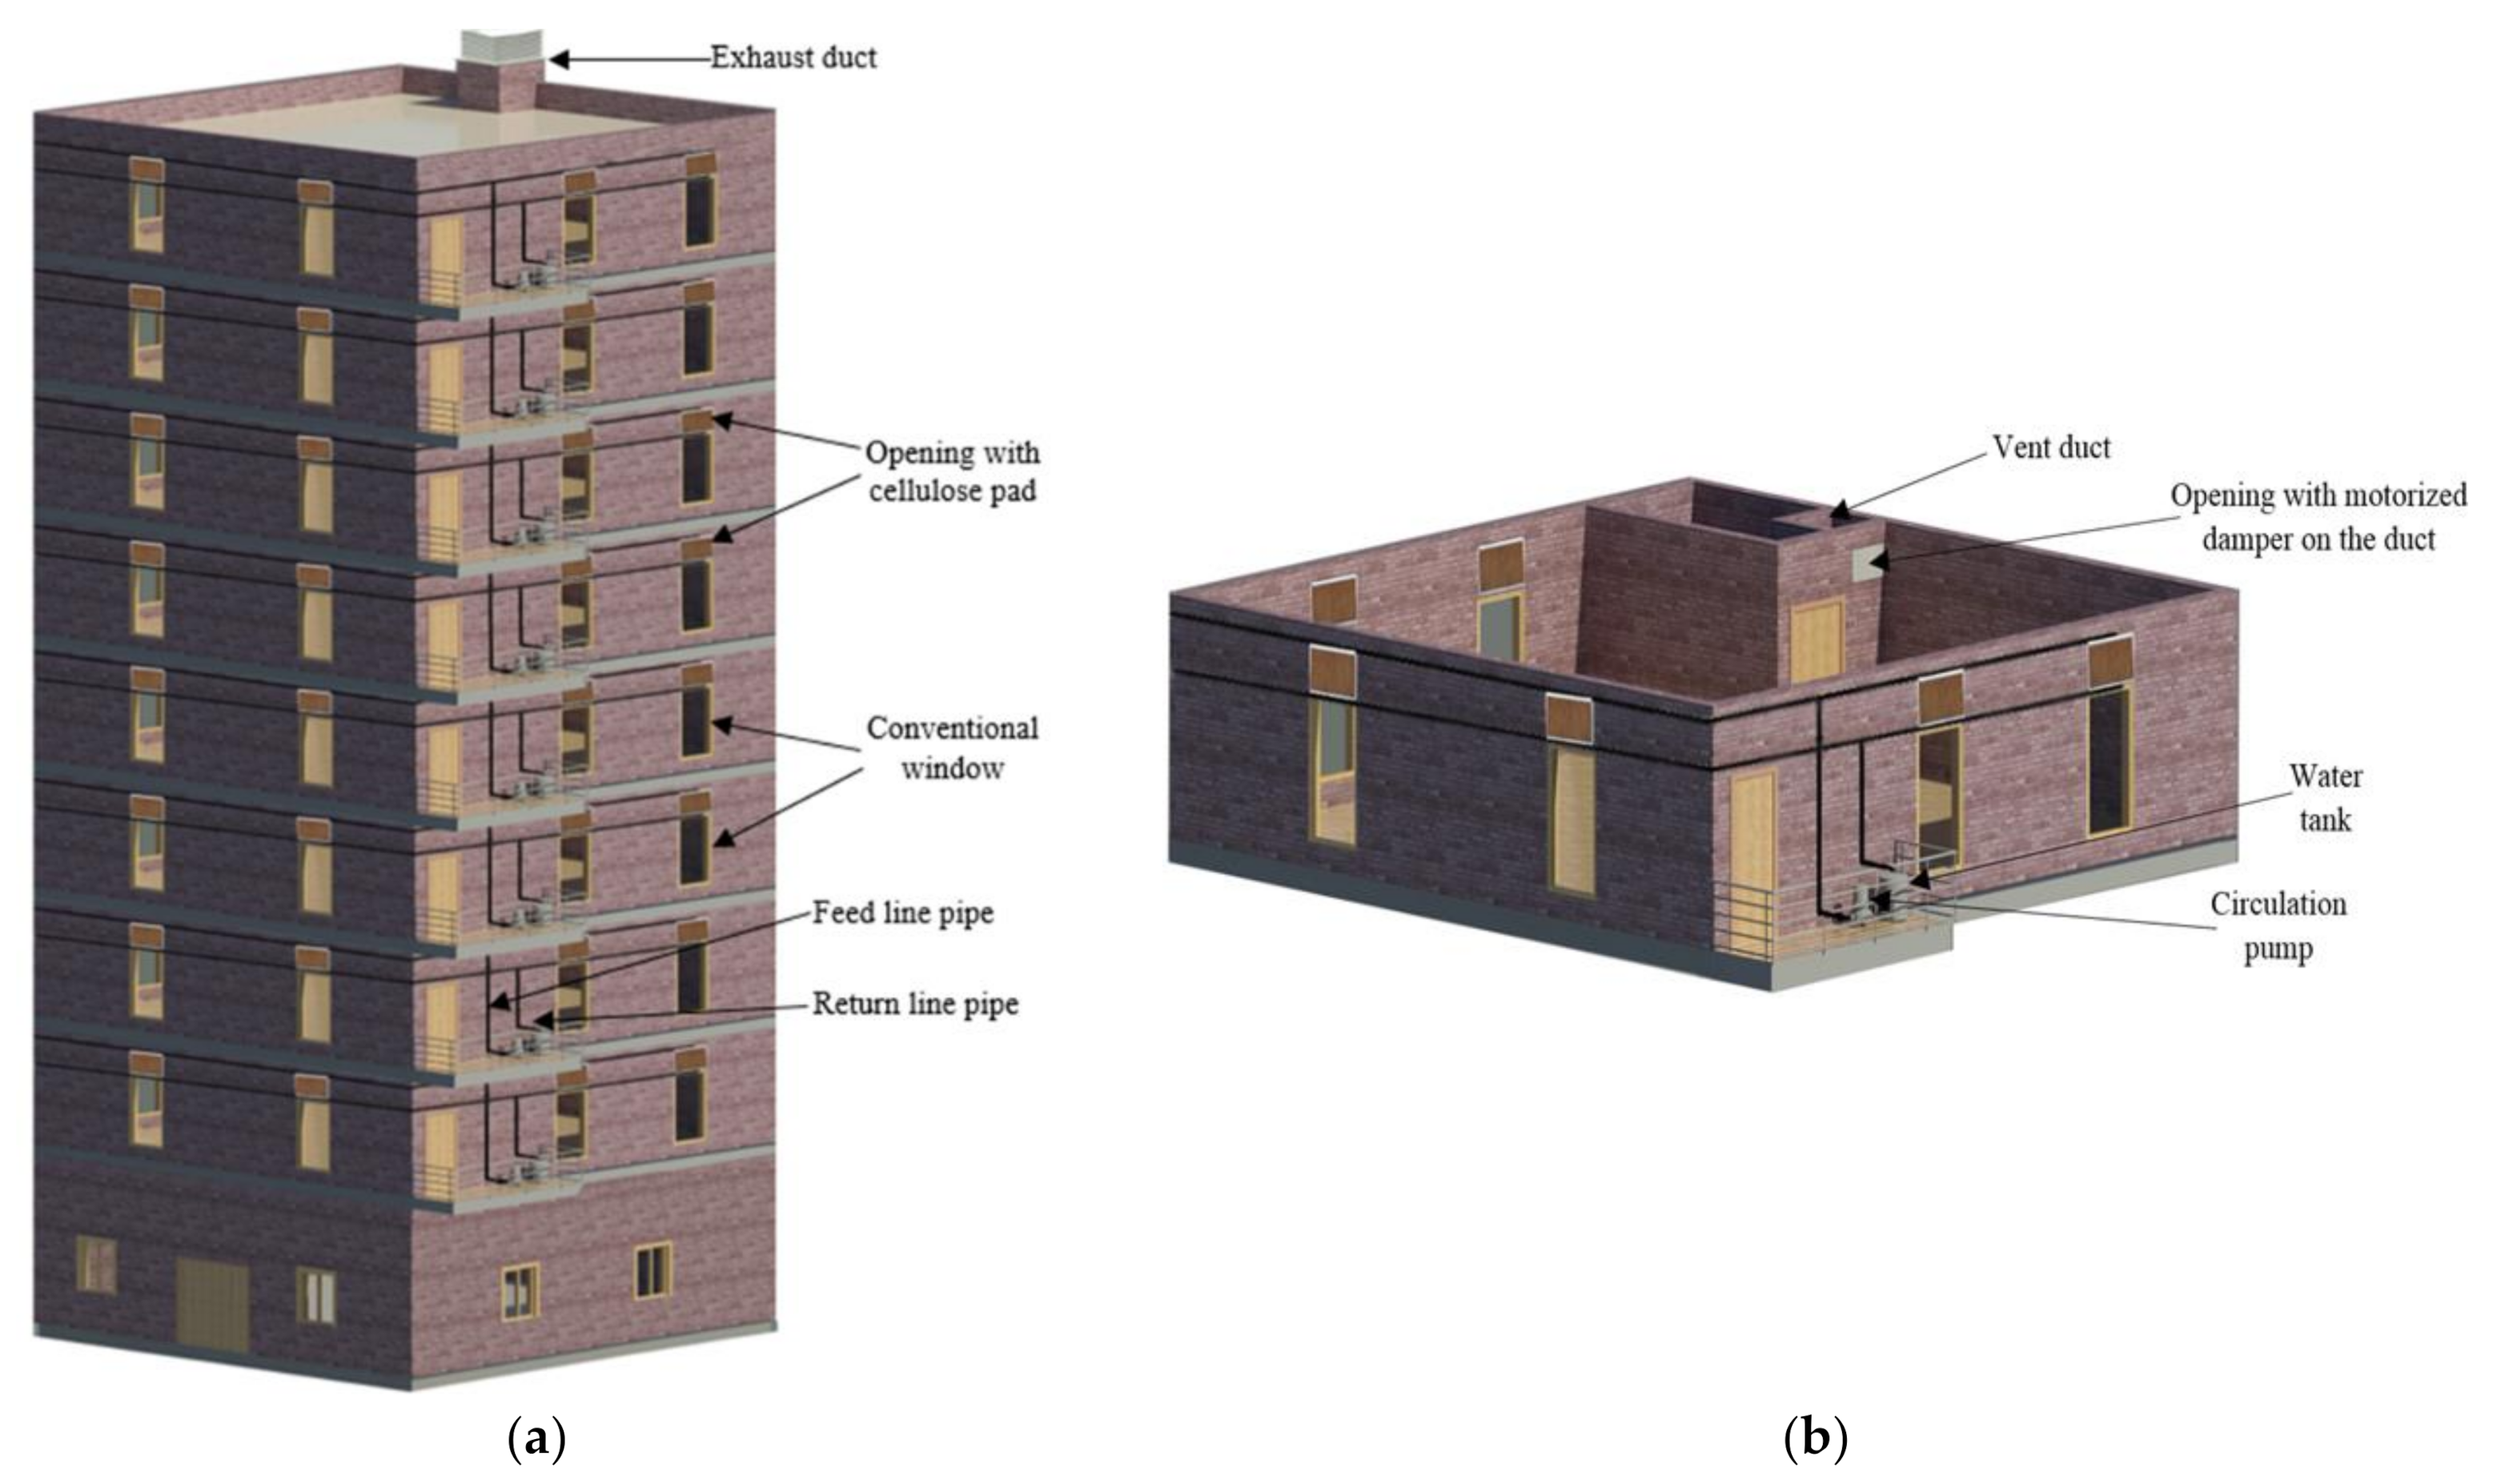
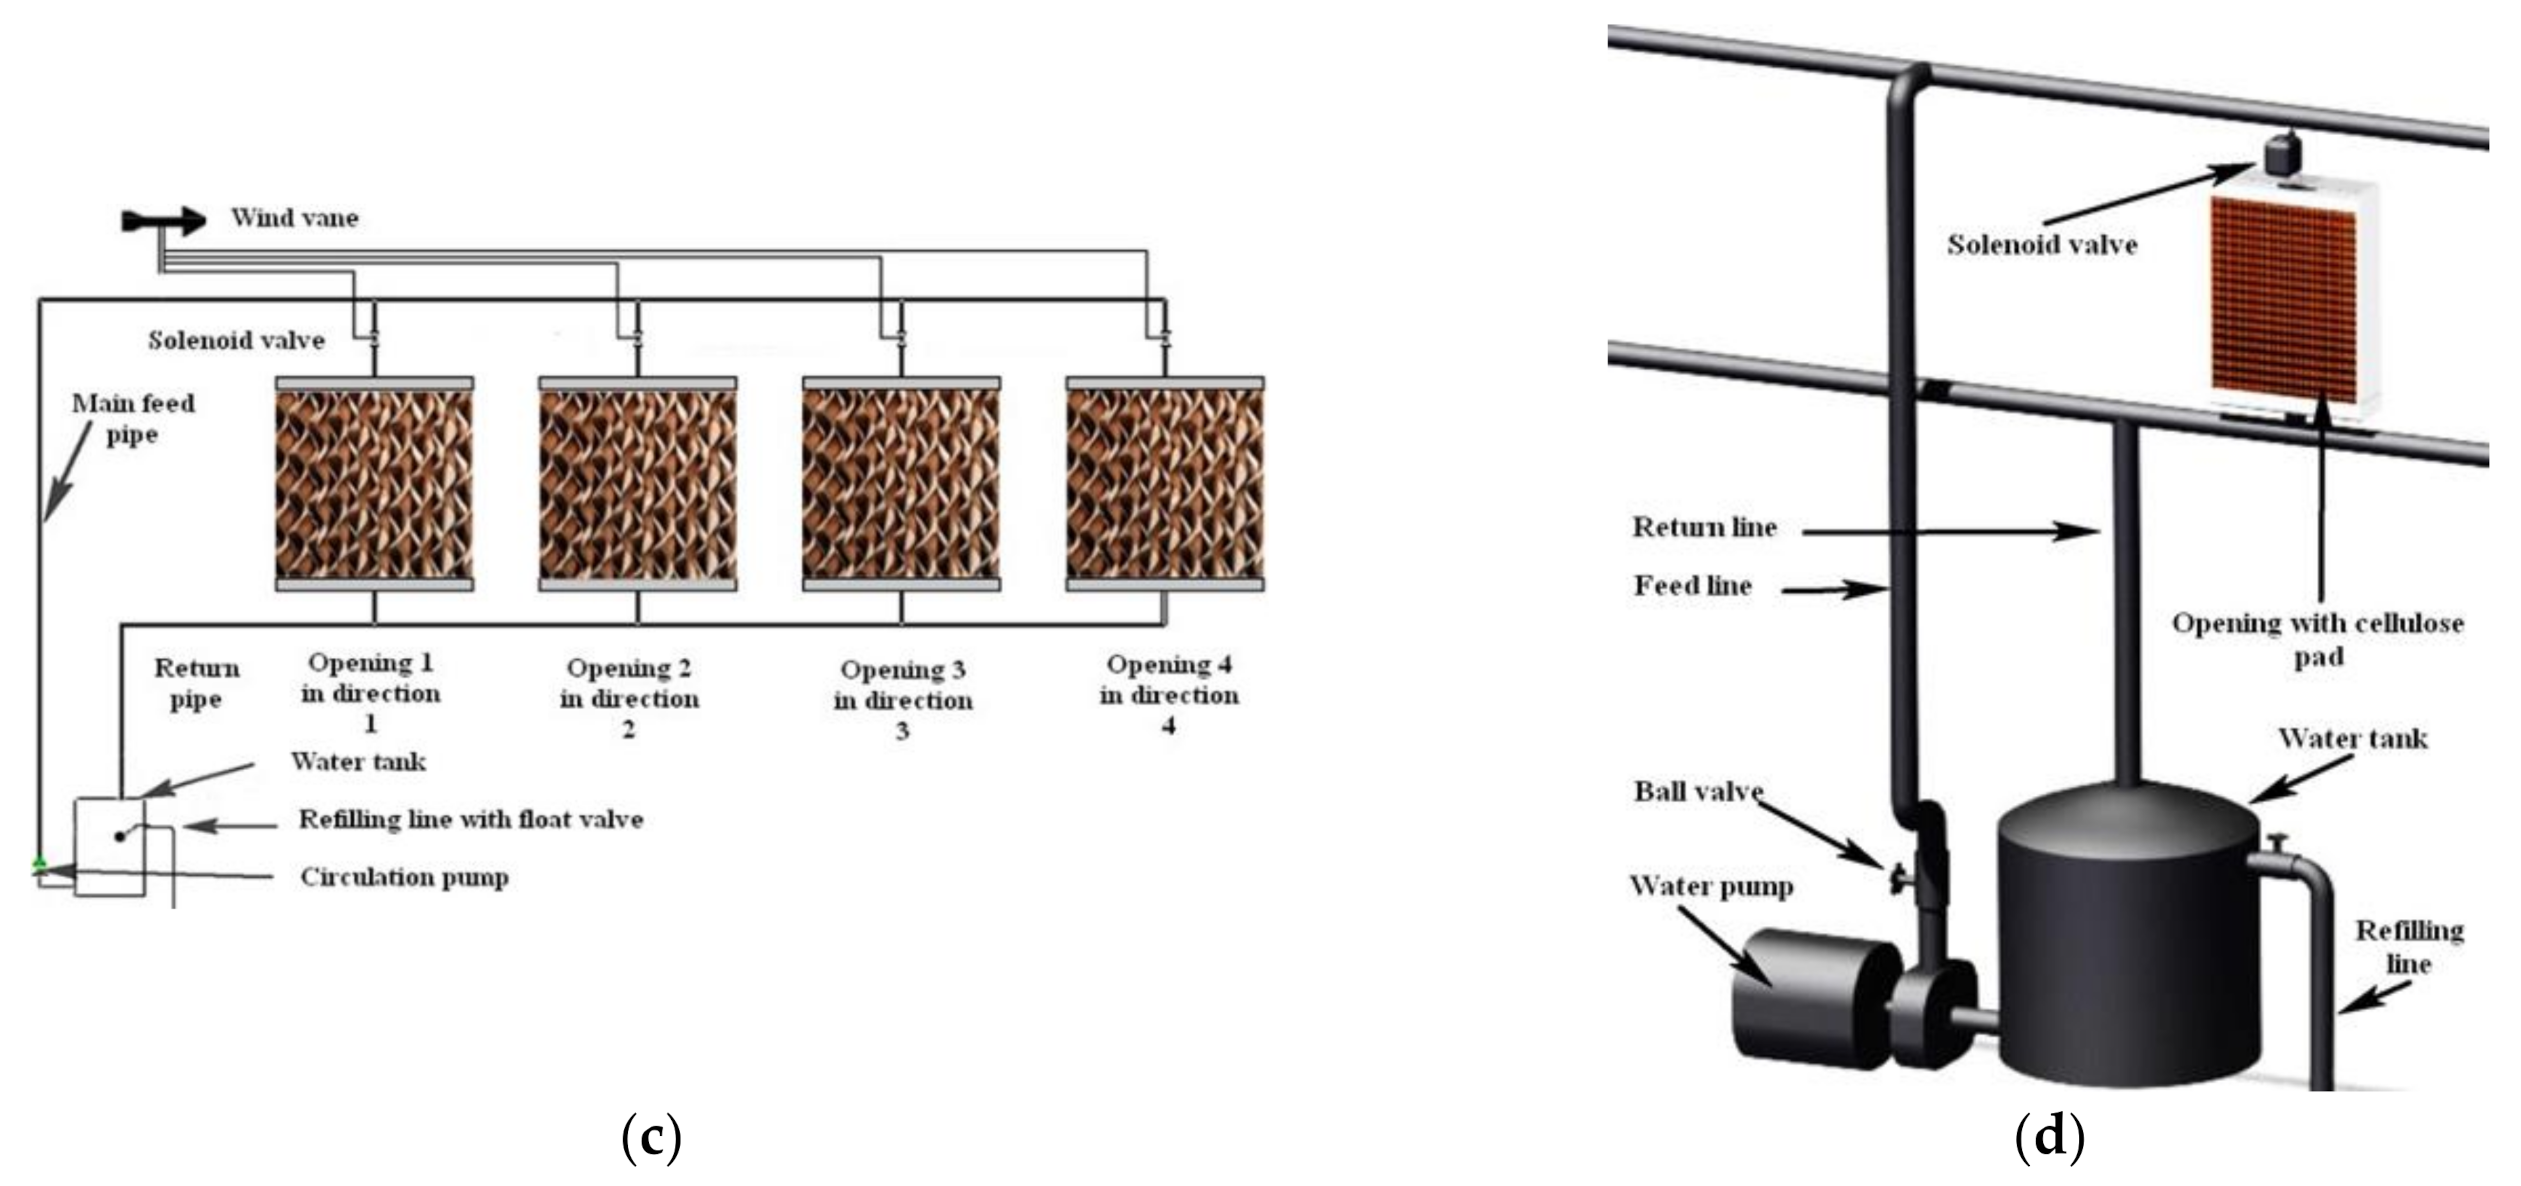
2.1. Experiment Set-Up and Experimental Procedure

A laboratory prototype was built to carry out the tests (Figure 3a). The prototype was mainly composed of a centrifugal fan, two polyethylene ducts, an electrical heater, a water pump, a measurement sensor, a water distributer tray, and holders. The tests were performed in a laboratory with an average elevation of 1200 m from sea level (32° N, 55° E). The task of the first section that included the fan, electrical heater, and primary duct was to create a steady airflow with a steady velocity and temperature. The second part included the pads and secondary duct with a dimension equal to the pad dimension (0.5 × 0.5 m2). The water pump recirculated water between the reservoir in the bottom and the distributor tray on the top of the cellulose pad. Pump outlet flow was divided into three equal branches and, to make the pads wetted, one branch for 10 cm, two branches for 15 cm, and three branches for 30 cm thickness were used. Free airflow created by the first section then went through the second part. The temperature and velocity of the portion of the airflow flowing through the cellulose pad was measured at the end of the secondary duct for all thicknesses and temperatures of the inlet airflow. Figure 4a shows the cellulose pad with the maximum thickness, which is used in this study. Figure 4b shows the electrical elements that were used to heating the inlet airflow to the desirable temperature. Figure 4c shows the top water distributor tray that was used to spray water on top of the cellulose pads. Three distributor trays were created with three rows of holes with 2 mm diameter on the bottom to properly spray water on the pads. Figure 4d shows the bottom water collector tray, which was used to collect extra water that was sprayed on top of the pads. Water collected in a tank and was circulated by a centrifugal pump. Figure 4e shows the measurement probe which was used to measure the airflow velocity and temperature in this study. Table 1 shows the specification of the set-up components.

2.2. Measurement Procedure
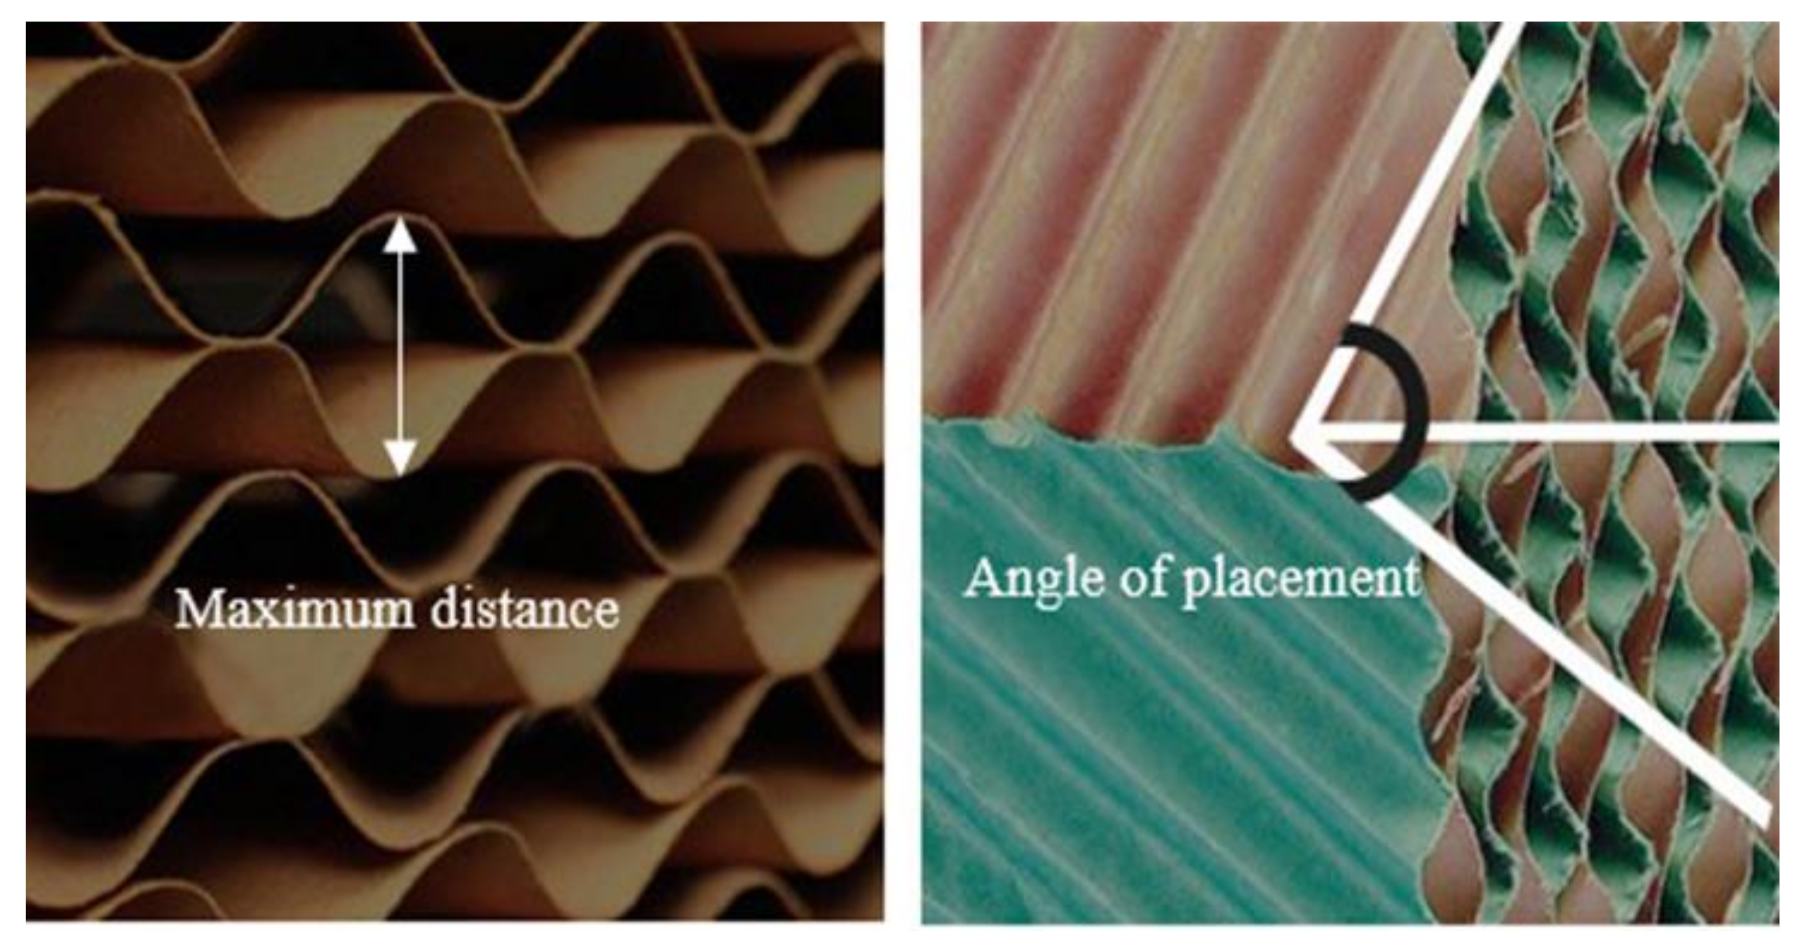
To perform tests, first the mean free airflow velocity and temperature at the entrance of the cellulosic pad was measured. To measure the mean values of temperature and velocity, the entrance section was divided into 16 equal parts, as shown in Figure 3b. The temperature and velocity of the center of each part was measured using a horizontal and vertical calibrated rod to place the measuring probe in the dotted point shown in Figure 3b. Then, the mean values were calculated using Equations (1) and (2). Airflow wet bulb was measured by using a thermometer. Equation (3) [40] was used to evaluate the effectiveness of cellulose pad in reducing free airflow temperature:
V a v = i = 1 16 V i A i A t = i = 1 16 V i 16
T a v = i = 1 16 V i A i T i V a v A t = i = 1 16 V i T i 16 V a v
Ai = Area of section (m2) (i);
At = Total entrance section area (m2);
Vi = Center velocity of section (m/s) (i);
Vav = Mean velocity (m/s);
Ti = Center temperature of section (°C) (i);
Tav = Mean temperature (°C);
16 = Number of divisions.
E f f e c t i v e n e s s = T o u t T i n T o u t T w b
where T o u t , T i n , and T w b denote the mean outlet and inlet flow temperature (°C), and the free-flow wet bubble temperature, respectively.
Since water consumption in regions with hot and arid climate, is of great importance, in order to evaluate the water consumption in the process the following equation is used:
m ˙ w × L v = m ˙ a × C p × T
where m ˙ w and   L v denote the water mass flow rate (kg/s) and water evaporation latent heat k j k g , respectively. m ˙ a and C p correspond to the air mass flow rate (kg/s) and air specific heat capacity k j k g · º C , respectively, and ΔT (°C) is related to the difference in mean temperature of the inlet and outlet airflow from the cellulose pad.

2.3. Cellulose Pad

Cellulose pads consisted of corrugated thin layers that stuck together, and were identified by a four-digit number. In this study, a 7090 model of cellulose pad was evaluated. The first digit in the 7090-pad model represented half maximum distance (mm) between the two sheets placed on each other, and the last two digits indicated the angle of the sheets on each other. Indeed, distance between sheets and angle of replacement in the cellulose pads had a significant effect on the performance of the pads [45,46]. Lower distance caused low airflow through the pad, and vice versa. A lower angle of replacement used during the cooling process was very important. The maximum distance and angle of placement of the layers have been clearly shown in Figure 5.

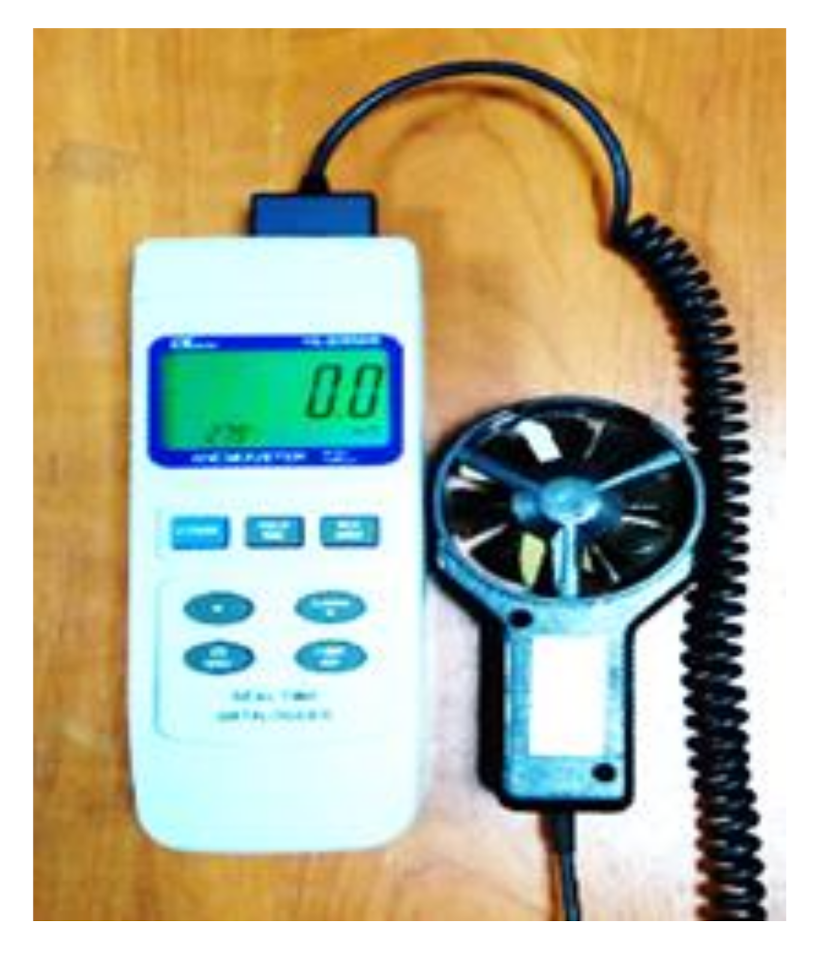
2.4. Measurement Instrument

A turbine anemometer, as shown in Figure 6, was used to measure the temperature and velocity of the airflow. It was calibrated in the factory by the manufacturer, and a mercury thermometer was used to measure the airflow wet-bulb temperature. Table 2 and Table 3 show the accuracy of the measuring instruments.

3. Results and Discussion

Using passive methods in building ventilation is important, but finding a way to reduce the inlet airflow temperature is even more important. The airflow velocity and temperature decrease after passing the wetted cellulose pad. Due to the importance of the airflow velocity and temperature on creating thermal comfort conditions in buildings, numerous tests were performed in this study to establish how much the airflow velocity and temperature decreased after passing throughout a wetted cellulose pad. Outlet airflow velocity and temperature were measured for three cellulose pad thicknesses with five different inlet airflow temperatures.
Figure 7 shows the experimental results for the outlet airflow velocity passing through the wetted cellulose pad with three thicknesses of 10, 15 and 30 cm. It was observed that using cellulose pad significantly reduced the airflow velocity from 3.5 m/s at the inlet to 0.9, 0.7, and 0.6 at the outlet, respectively. Results for outlet airflow velocity show the limitation of using wetted cellulose pads with higher thicknesses.
Figure 8 shows the experimental results for the outlet airflow temperature from the wetted cellulose pad for three thicknesses of 10, 15 and 30 cm with a constant free flow velocity of 3.5 m/s. It was observed that the use of the wetted cellulose pad significantly reduced the outlet flow temperature, and temperature reduction increased with increasing pad thickness. The reason was that by increasing the thickness of the cellulose pad, the thermal exchange surface area between inlet airflow and sprayed water on the cellulose pad increased. In addition, it was observed that by decreasing the inlet airflow temperature to the cellulose pad, the temperature of the outlet airflow from the pads decreased less.
Figure 9 illustrates the effect of free airflow temperature and pad thickness on the wetted cellulose pad effectiveness. Effectiveness does not have a scale. It is a factor, and starts with zero, but there is no maximum amount for it. As the effectiveness factor goes up, it shows that using a wetted cellulose pad has a higher effect on the evaporative cooling process. For an effectiveness factor equal to one, this means that the wetted pad efficiency is equal to 50%. By decreasing inlet airflow temperature, effectiveness decreases. This is because the minimum temperature that can be achieved by the evaporative cooling process is the wet-bulb temperature of the inlet airflow, and as the inlet airflow temperature becomes closer to its wet-bulb temperature, the efficiency of the evaporative cooling process decreases. In addition, increasing the thickness of the cellulose pad increased the effectiveness, due to increasing the thermal exchange surface area between inlet airflow and sprayed water on the cellulose pad.
Figure 10 demonstrates the impacts of cellulose pad thickness and inlet airflow temperature on the amount of evaporated water that was calculated analytically, using Equation (4). By increasing cellulose pad thickness and inlet airflow temperature, the amount of evaporated water also increased. As the pad thickness and inlet airflow temperature increased, the amount of heat transferred between the water and inlet airflow increased, due to increasing the thermal exchange surface area and temperature difference.
Figure 11a–c shows the evaporative cooling process performed during each experiment on a psychrometric chart for different pad thicknesses. The inlet and outlet air conditions, with the ideal outlet air condition to evaluate the performance of the cellulose pad, have been illustrated on Figure 11a–c. Using the wetted cellulose pad significantly increased outlet airflow humidity, and by increasing cellulosic pad thickness, outlet airflow humidity increased further. As seen, using cellulosic pads with different thicknesses increased the outlet airflow relative humidity about 30–50%.
In Figure 7, Figure 8, Figure 9, Figure 10 and Figure 11, the experimental results of using wetted cellulose pads as a wetted surface are illustrated, regarding an ambient airflow velocity of 3.5 m/s. According to Iran’s wind mean speed map [47], it is shown that Iran has a great potential to use wind as a power source. Central regions of Iran have a hot and arid climate, and using wind catchers to ventilate houses has been a common method for these regions since ancient times. The early wind catchers only directed outside air into the houses, and had no effect on the incoming air temperature, so they were not able to create comfortable thermal conditions. Over time, various methods have been used to reduce the inlet air temperature, among them using wetted surfaces. As it has been seen, outlet airflow temperature from wetted cellulose pads significantly decreases, and it is an effective idea to use wetted cellulose pads in the inlet section of the wind catchers. A schematic of using cellulose pads in the inflow section of a wind catcher is shown in Figure 12. It was found that the thicker cellulose pad had better performance, but (as demonstrated in Figure 10) by increasing thickness, water consumption also increased, and outlet airflow velocity decreased significantly, both of which are very important in regions with hot and arid climates. To optimize water consumption, we suggest using a wind vane to turn off the pump when the ambient airflow velocity is very low.
In the past centuries, it was easy and economical to build wind catchers in houses due to the low height of the buildings, but with high-rise buildings, using traditional wind catchers is not possible due to the number of building floors. On the other hand, based on the literature [47], mean wind speed increases with increasing altitude from the earth surface. For these types of buildings, combining a wetted cellulose pad with induced ventilation as a passive ventilation method is a practical way to create comfortable thermal conditions, as demonstrated in Figure 13a,b. Induced ventilation is an excellent concept for providing thermal comfort in high-rise buildings, with the potential for a substantial reduction of energy demand for cooling services. In this method, openings are created on the external walls of buildings, and a duct is created all over the building, from the first floor to the top, to vent the internal airflow. In today’s buildings, this duct is usually already created, and the only task that needs to be performed is the creation of an opening covered with a motorized damper on the duct. The motorized damper should be interlocked with the water pump, to prevent the airflow from the duct to the living rooms when the passive cooling process is not in use. In this method, pads are put in the entrance of the openings, and water is sprayed on the pads by using a water pump. To reduce water consumption and minimize the pump size, water is sprayed only on those pads which are in front of the maximum ambient wind velocity direction. To this aim, the ambient air direction must be detected by a wind vane; then, the wind vane sends a signal to a solenoid valve on the inlet water pipe of pads, which is normally closed. Figure 13c,d demonstrate a schematic of the process. If the direction of the dominant wind speed is known, it is not necessary to create an opening in all directions. An anemometer can be used to set the on/off time of the pump due to the ambient air velocity. The main problem in induce ventilation is the outlet airflow rate from cellulose pads, due to the effect on the ventilation process. As it was found, increasing the pads’ thickness decreased the outlet airflow velocity from the pads. On the other hand, increasing the pads’ thickness decreased the outlet airflow temperature more. So, to calculate total pads cross-section area, the effects of these two parameters should be regarded at the same time.
In this study, using a wetted cellulose pad as a wetted surface in two practical passive ventilation methods was evaluated. As mentioned before, increasing cellulose pad thickness decreased the outlet airflow temperature. For example, with a free airflow temperature of 42.2 °C, the outlet airflow temperature with a 30 cm thick pad was about 19% lower than that of the 10 cm thick pad. On the other hand, the outlet airflow velocity from 30 cm thick pad was about 33% lower than that of the 10 cm thick pad. A simple calculation showed that to create an equal evaporative cooling load with a cellulose pad thickness of 30 cm, the cross-section of the 10 cm cellulose pad thickness must be increased by 25%. As tests were performed on a laboratory prototype, and there was no real installation, the results are an estimation of the real process, and may be different with the outlet airflow temperature and velocity.
To evaluate the accuracy of the measurements, an error analysis was developed: the averaging equations and accuracy of the devices mentioned in Section 2.3 and Section 2.4, respectively. To combine all errors, following calculations were performed:
E a r s s = 1 16 x i f x i 2
in which E a r s s [48] is absolute residual sum of squares, x i is for T i (°C) and V i (m/s), x i is device accuracy, and f is for T a v (°C) and V a v (m/s) in which T a v and V a v are the average outlet temperature and velocity. Table 4 and Table 5 show the data for velocity and temperature measurements and probable errors. Data for velocity and temperature measurements illustrate probable errors in the range of 5.8 to 8.7% and 6.2 to 6.45%, respectively, which shows the acceptable accuracy of the tests.

4. Conclusions

Using passive cooling methods, such as wind catchers, is an efficient way to reduce energy consumption and CO2 production in buildings. The main aim of the present study was to assess the performance of a wind catcher using a corrugated cellulose pad as a wet surface at its inlet. For this purpose, an experimental design was developed, and the outlet air flow velocity and temperature were measured. The most important findings are as follows:
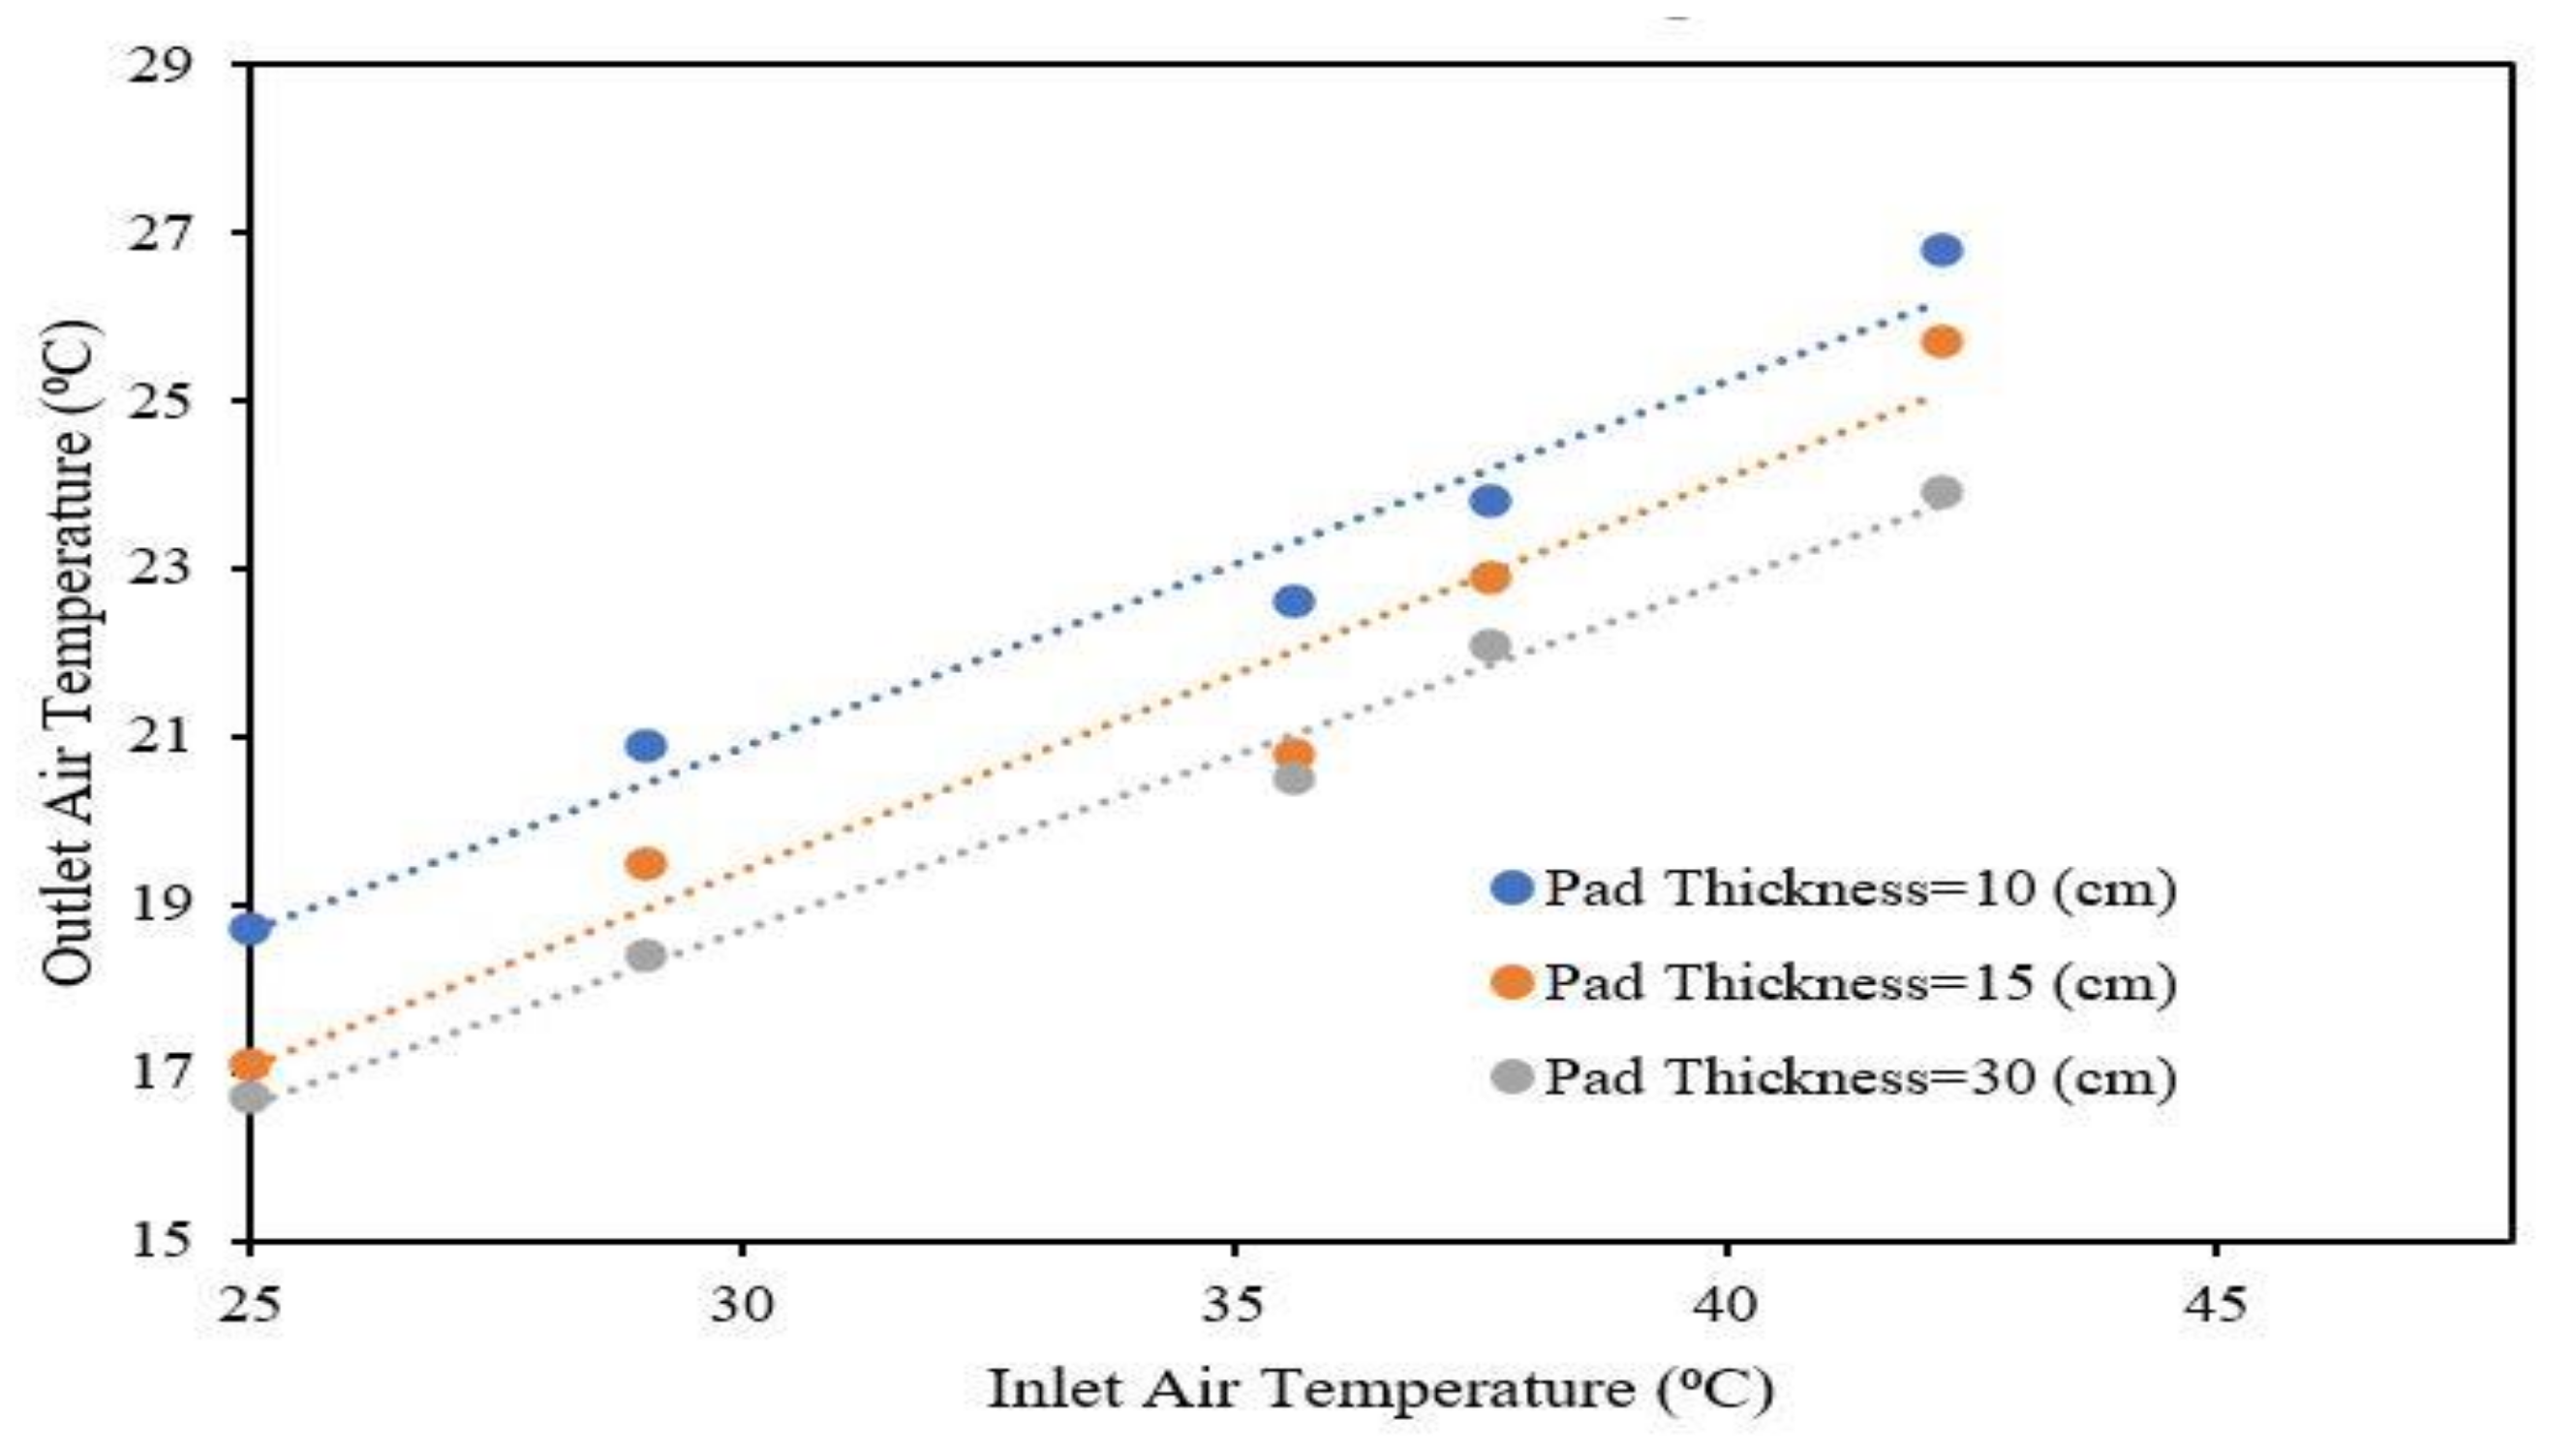
  • Experimental results showed that the use of the wetted cellulose pad with 10, 15, and 30 cm thicknesses at the inlet section of the wind catchers and openings of the high-rise buildings reduced the temperature of the inlet airflow by an average of 11.3, 12.7, and 13.7 °C, respectively, in regions with hot and arid climates;
  • It was observed that a 50% increase in the wetted cellulose pad thickness (10 cm thickness to 15 cm) caused a 12% increase in the mean outlet airflow temperature reduction, whereas a 100% increase in the wetted cellulose pad thickness (15 cm thichness to 30 cm) caused an 8% increase in the mean outlet airflow temperature reduction;
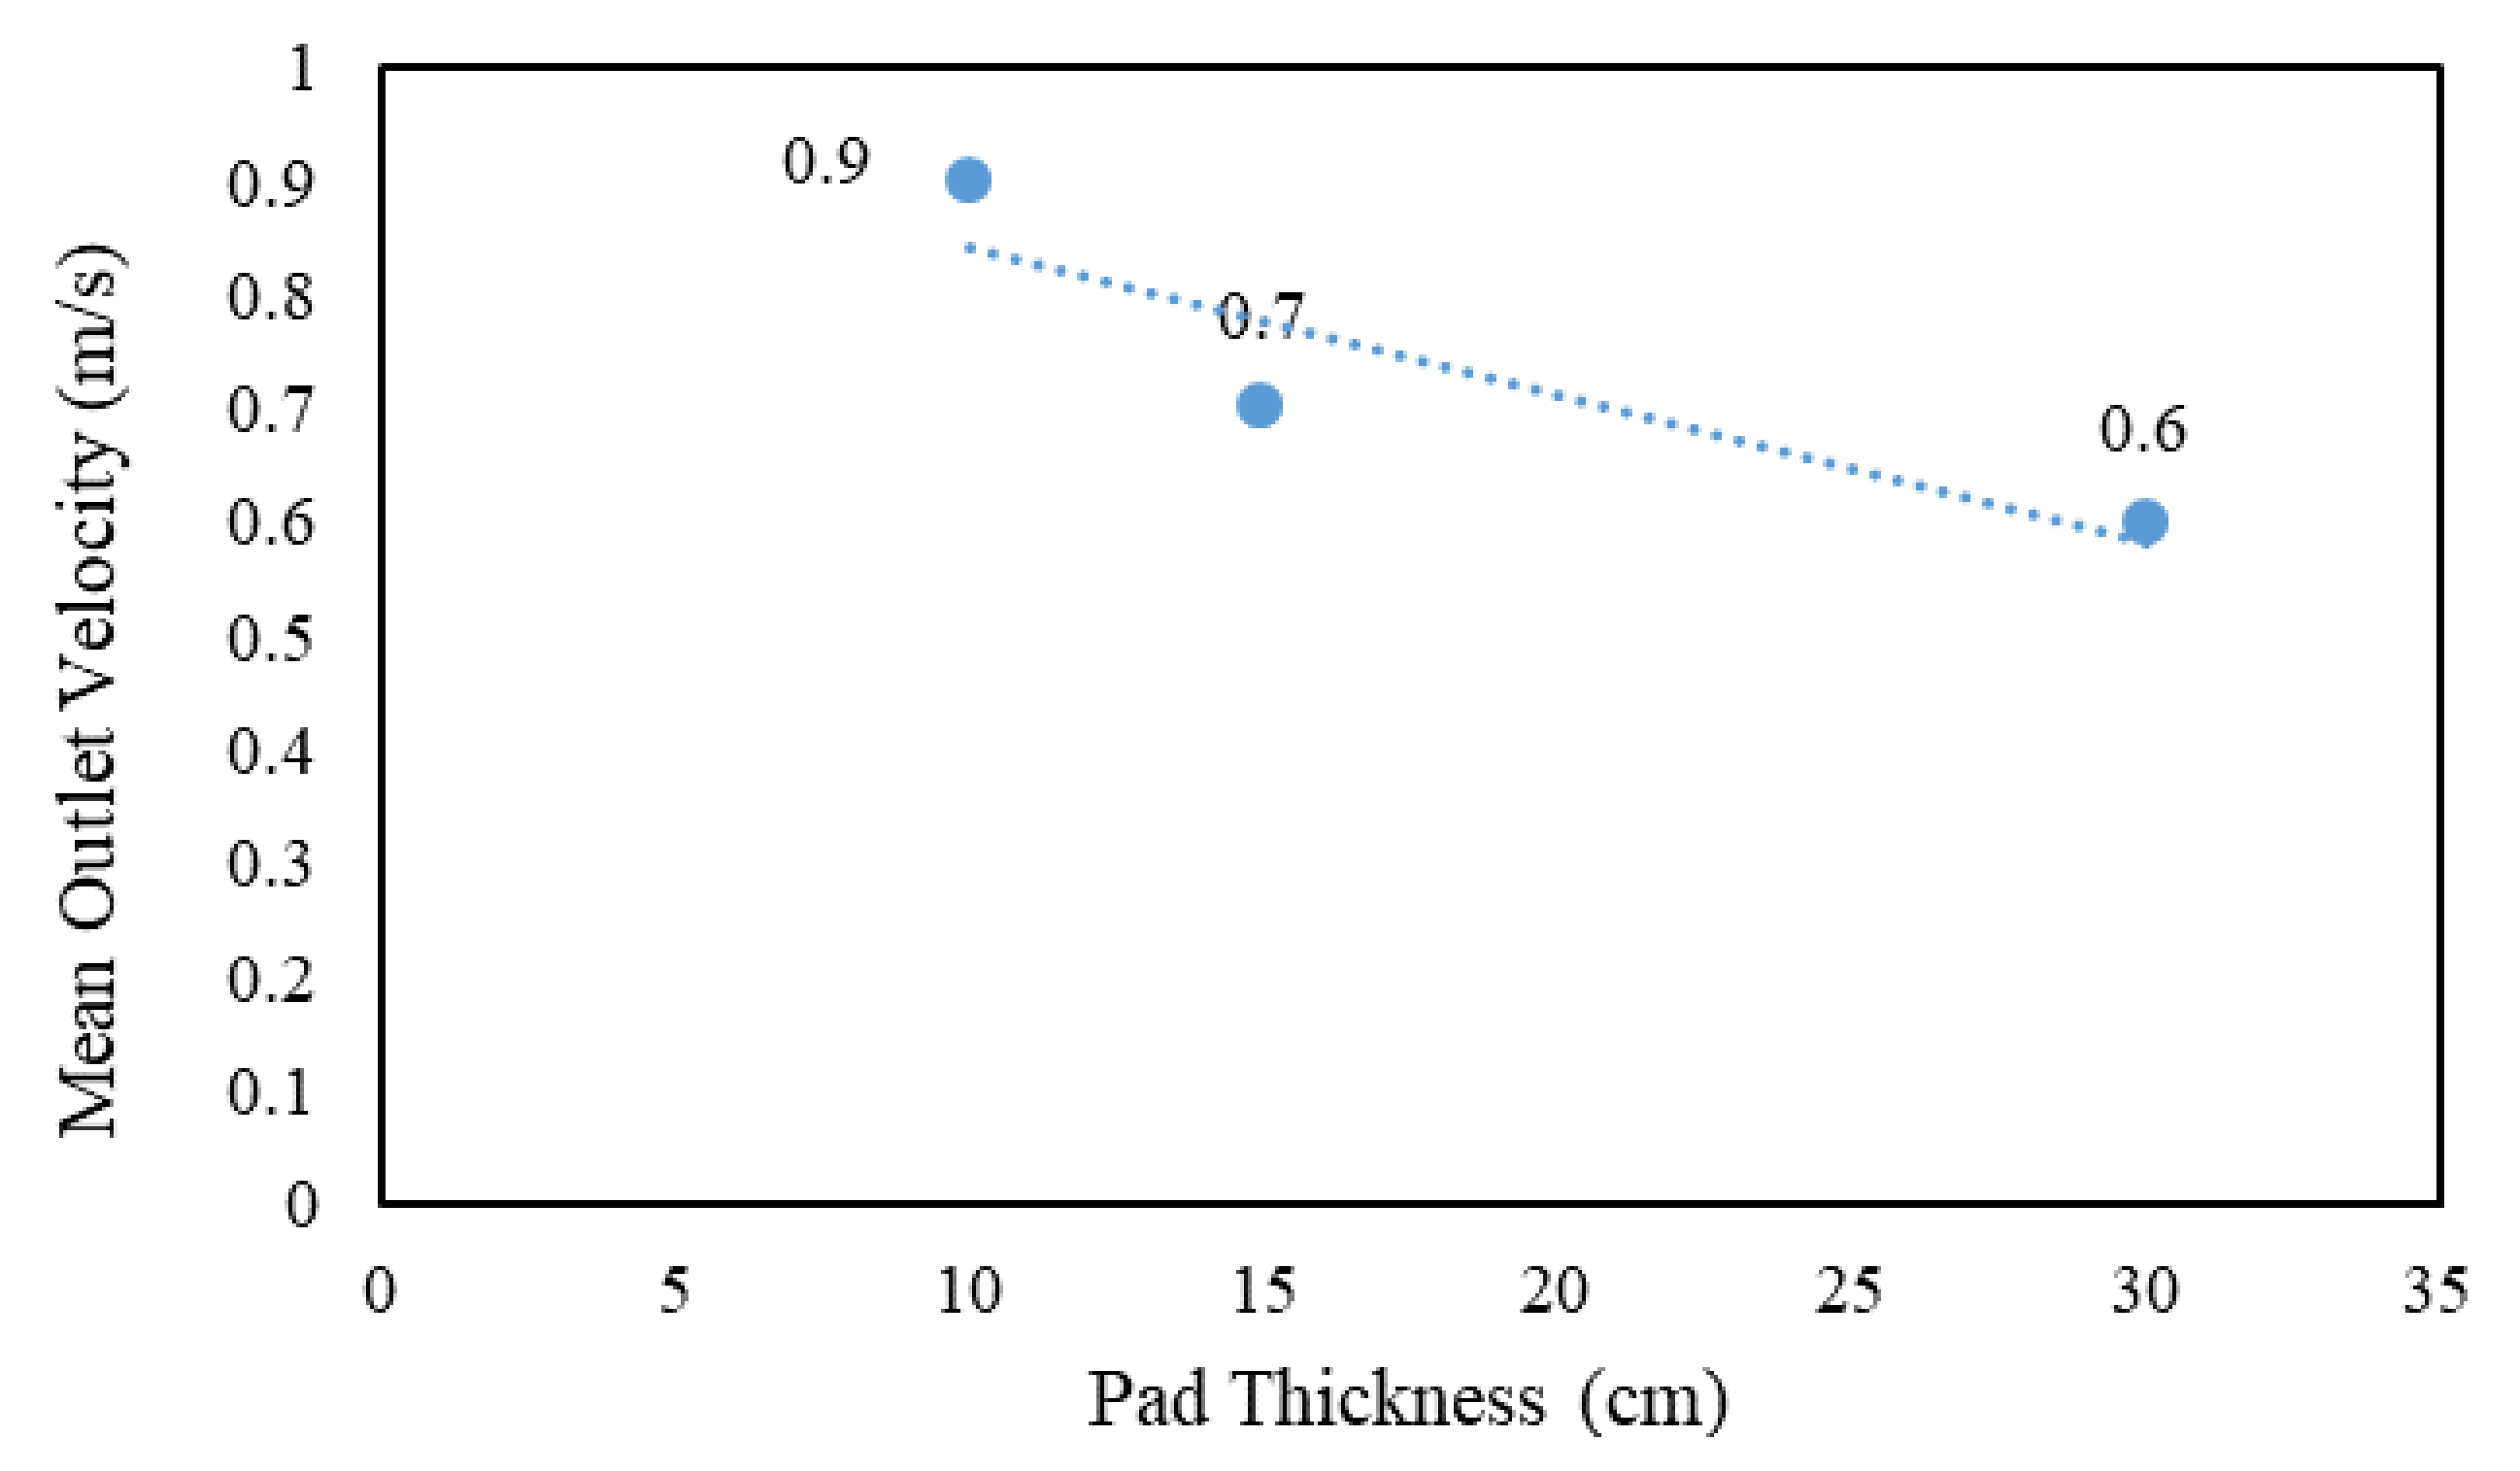
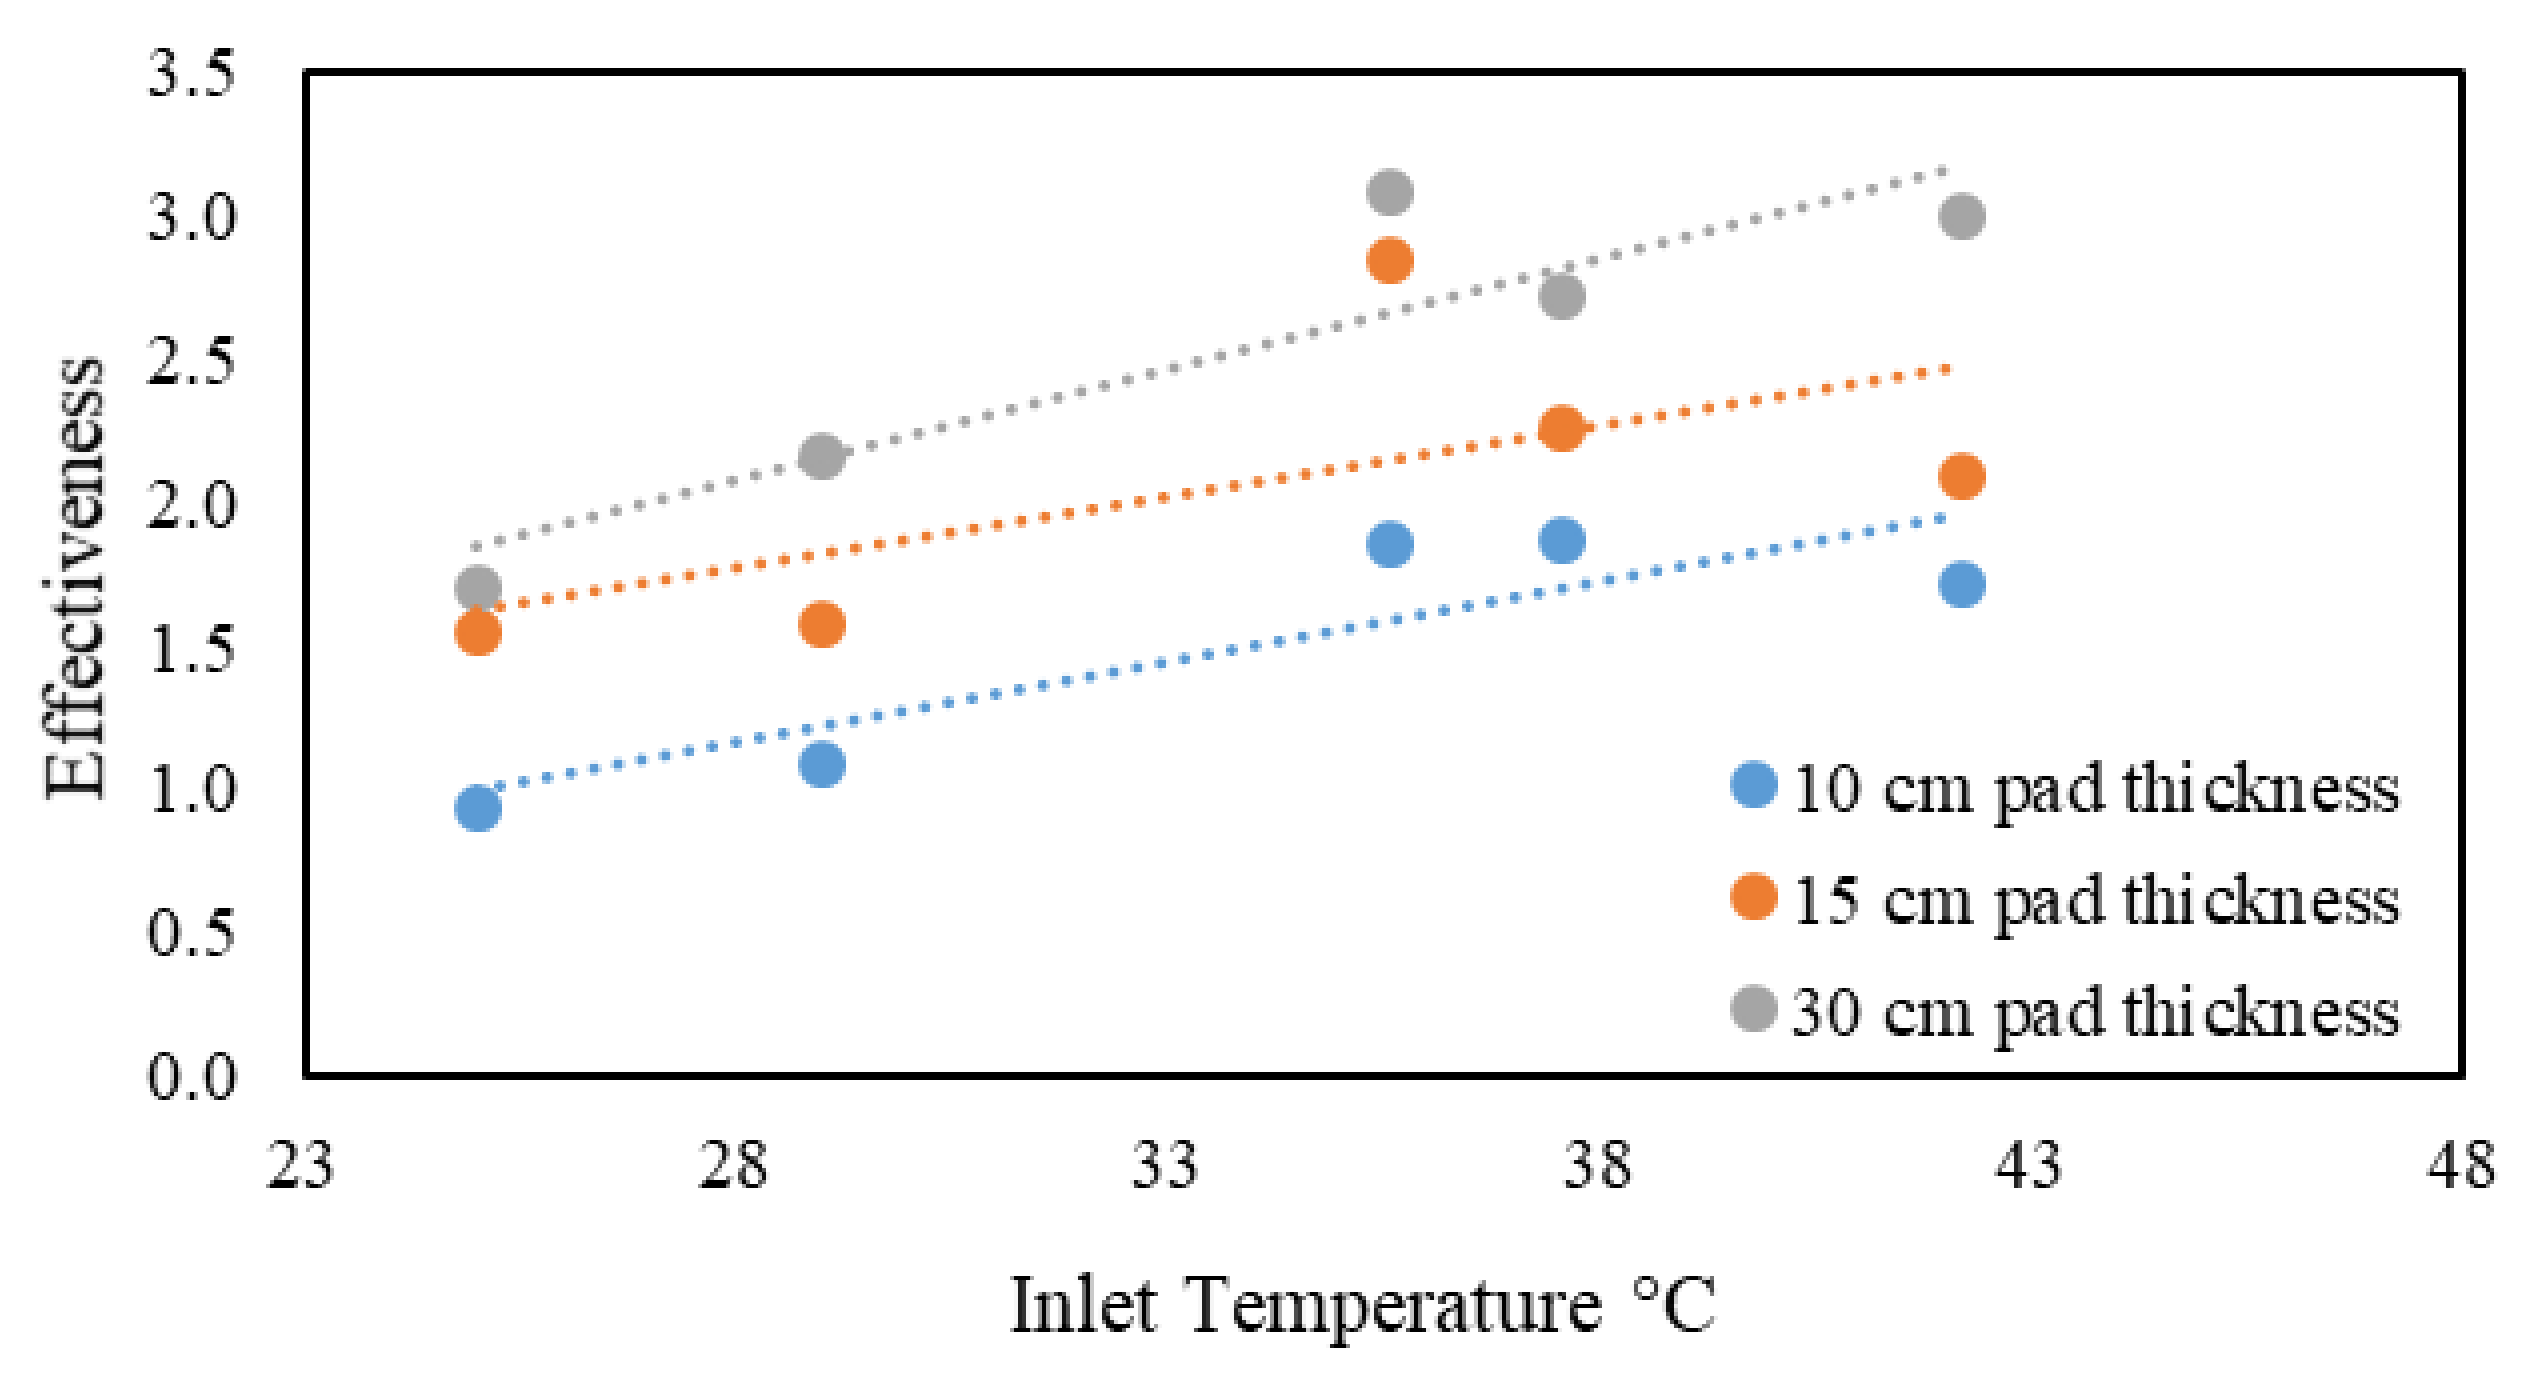
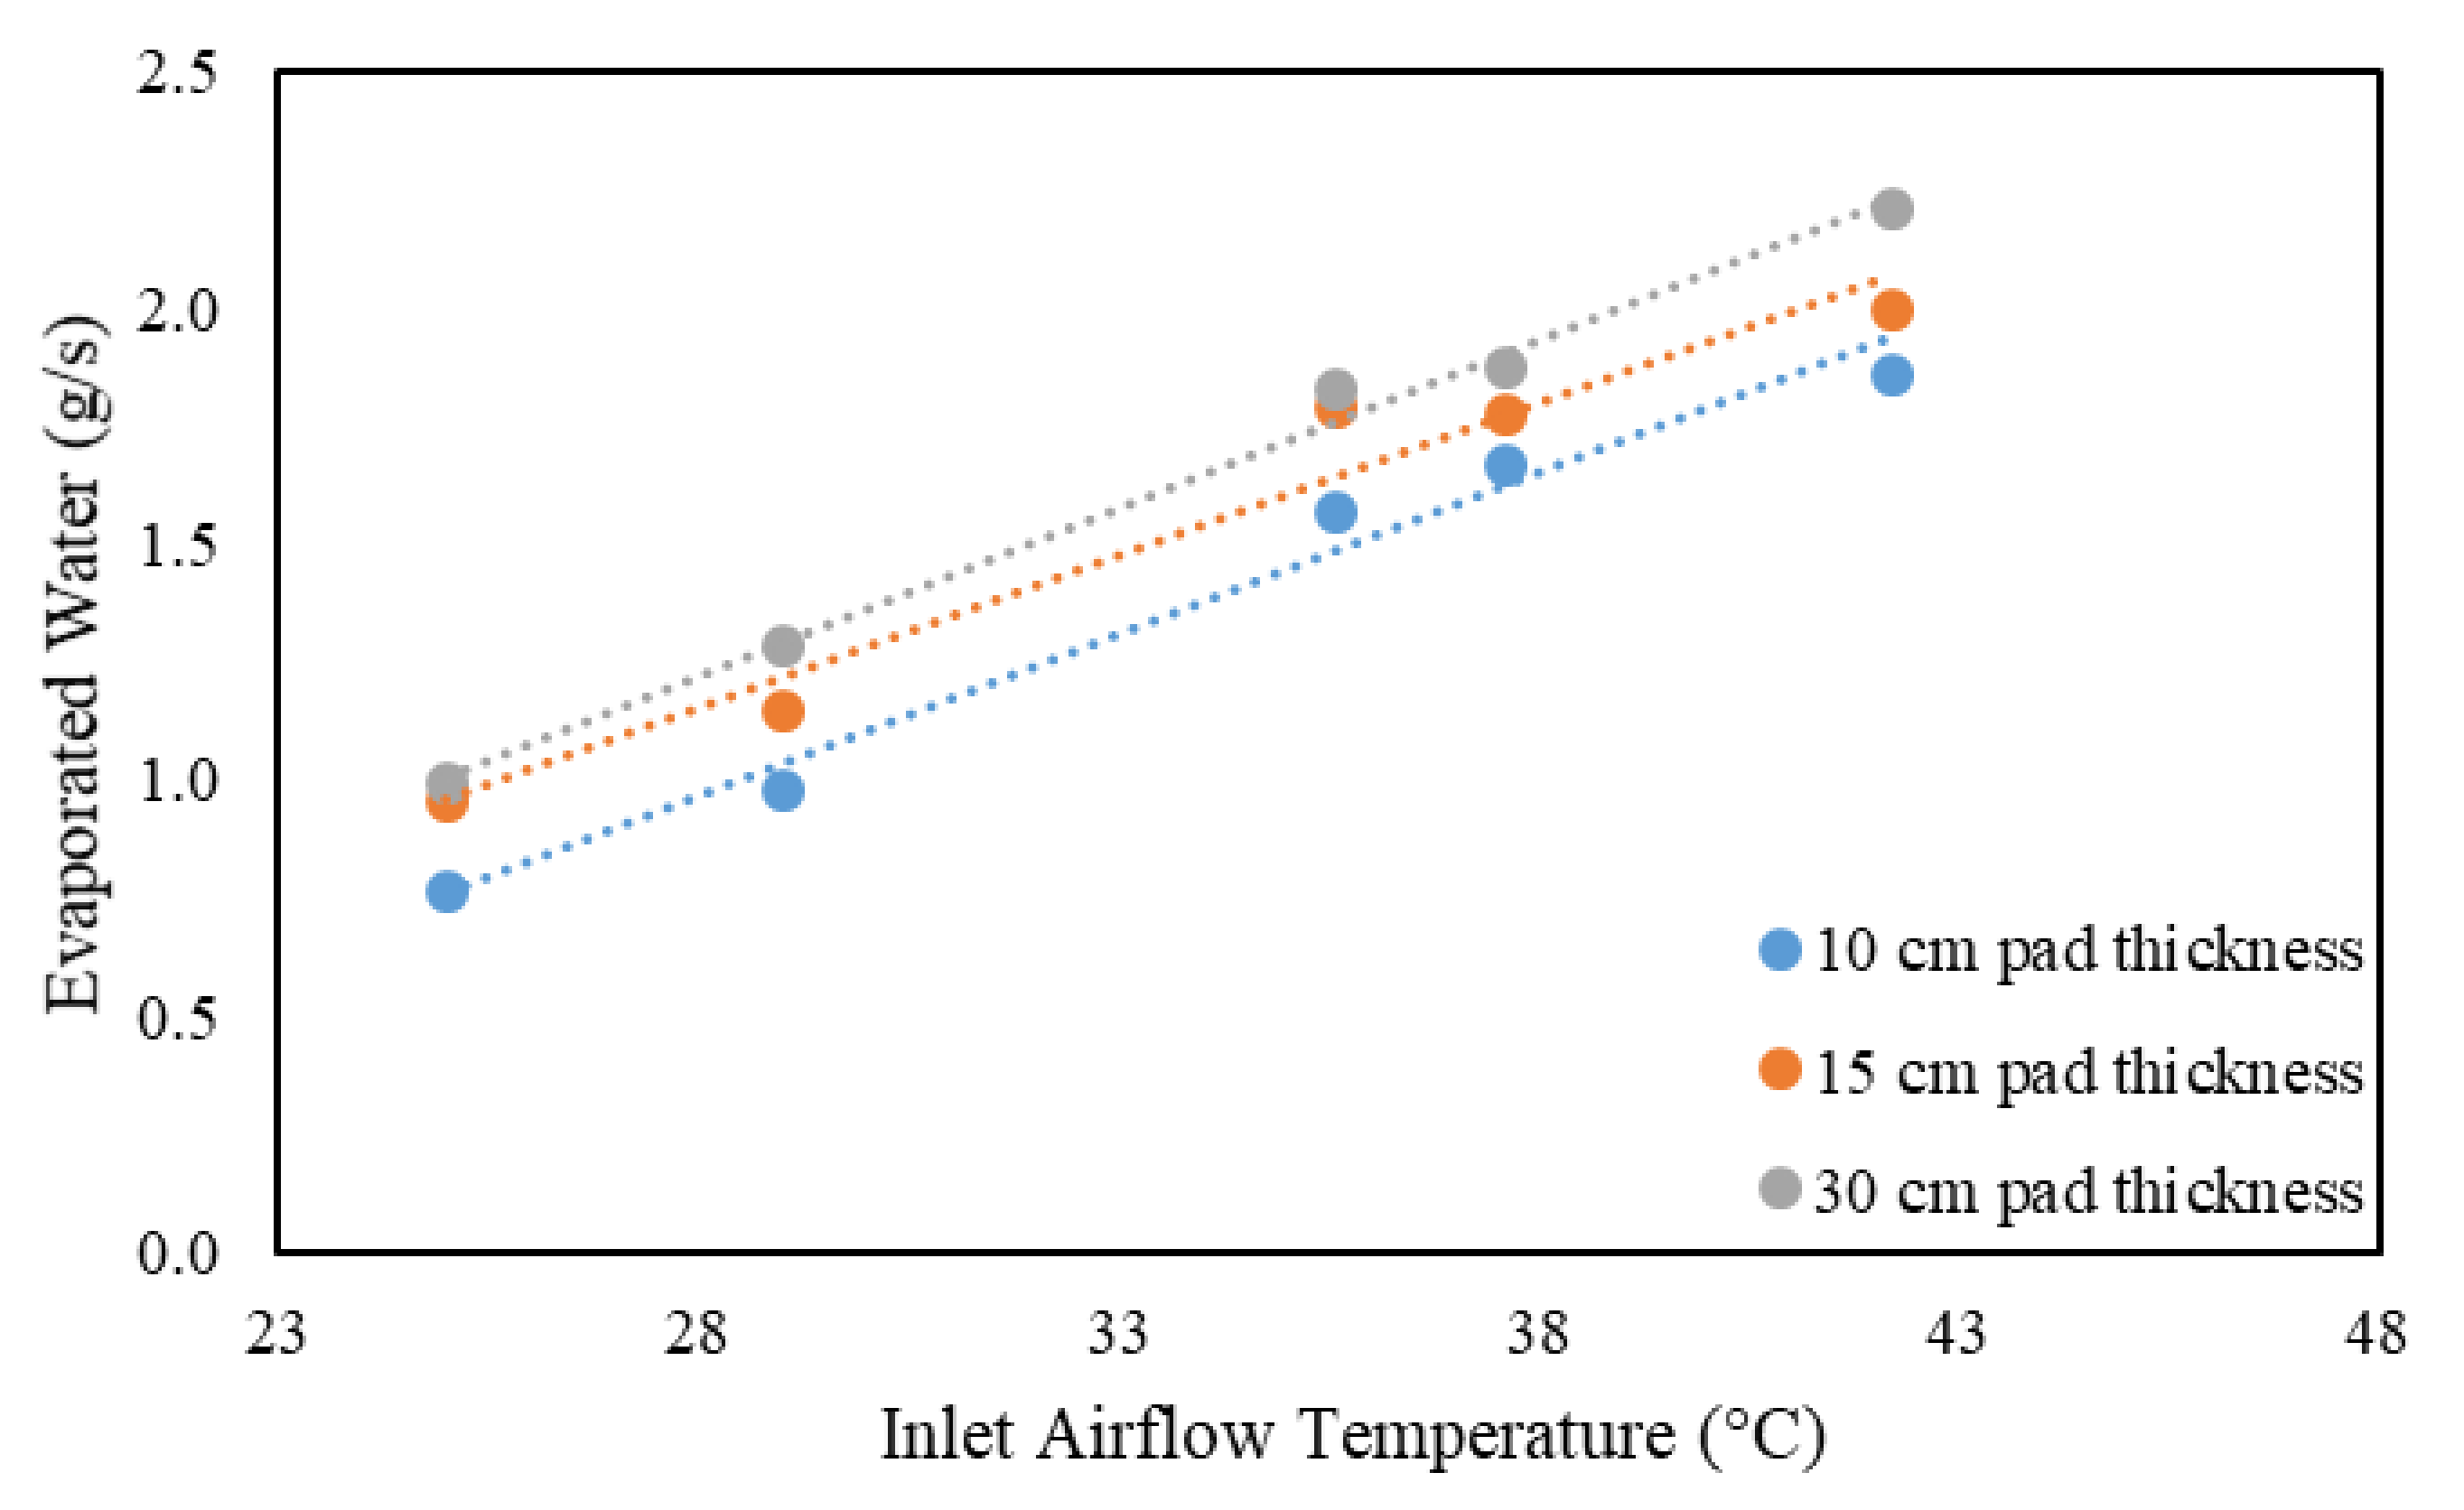
  • Airflow velocity was an important parameter in passive cooling. Although increasing cellulose pad thickness increased the effectiveness, it reduced outlet airflow velocity and increased water consumption. Additionally, a larger thickness required a larger water distribution tray, more space for installation and more investment, which all are significant limitations that should be considered when increasing the thickness of the cellulose pad;
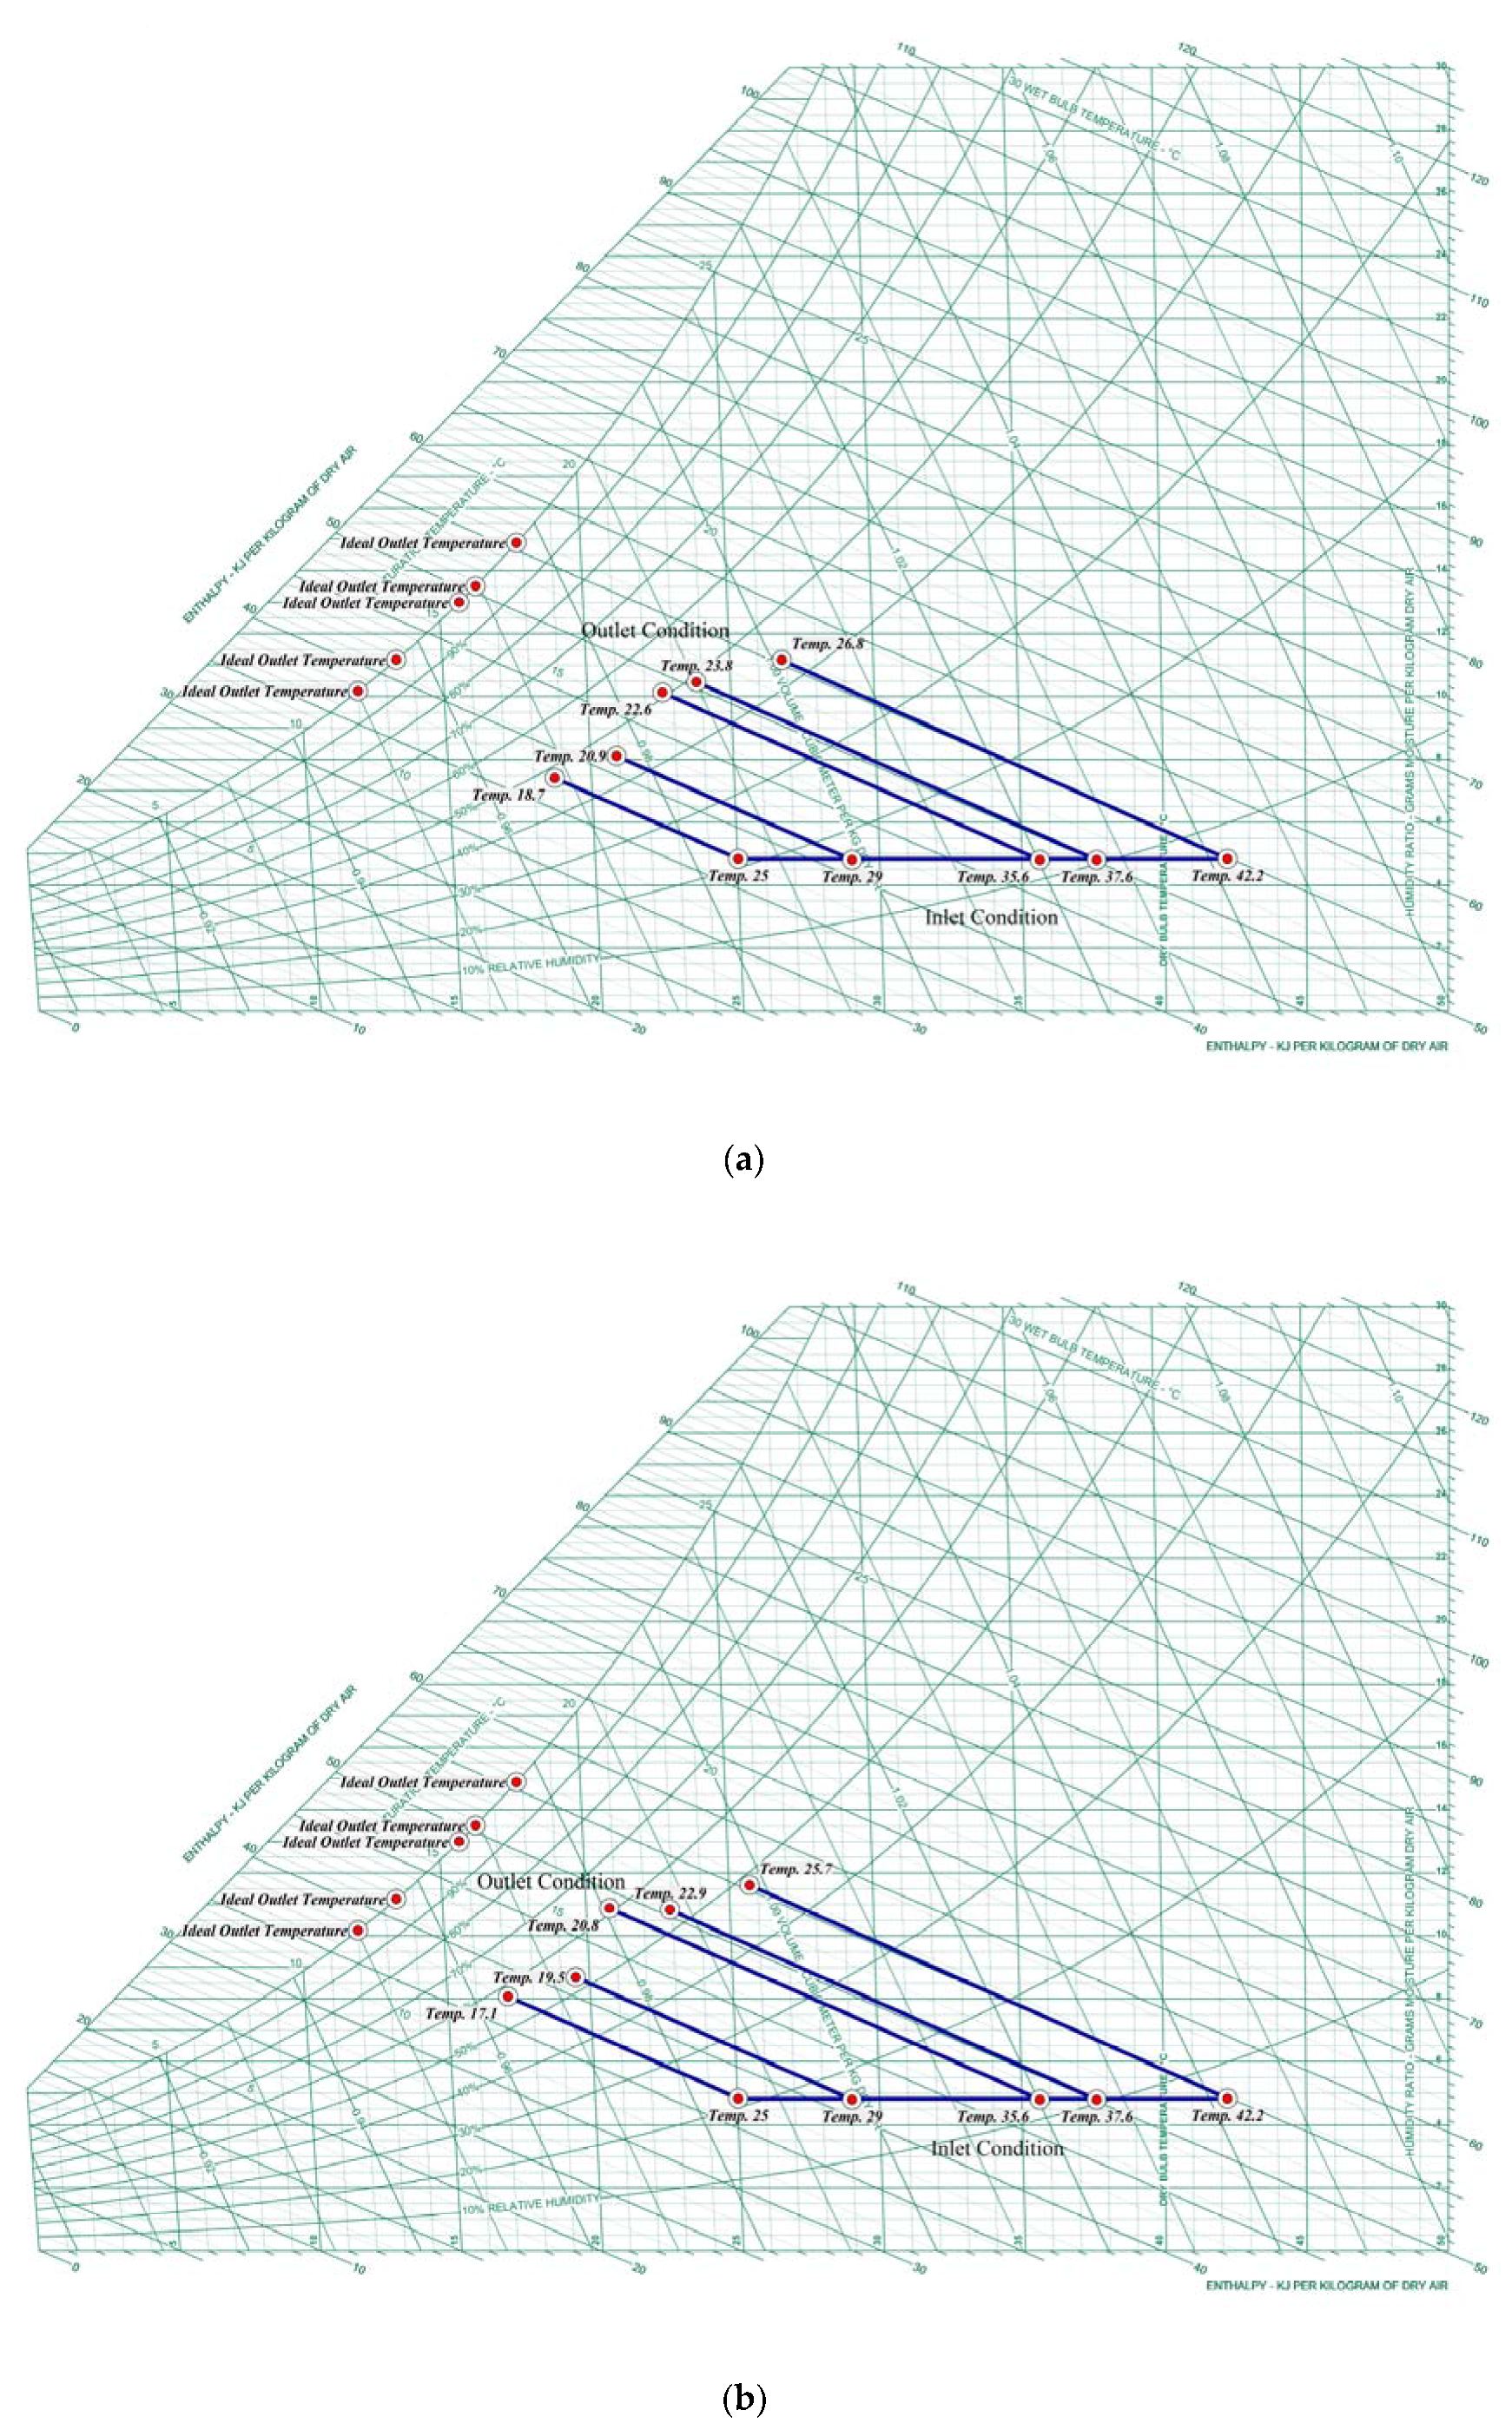
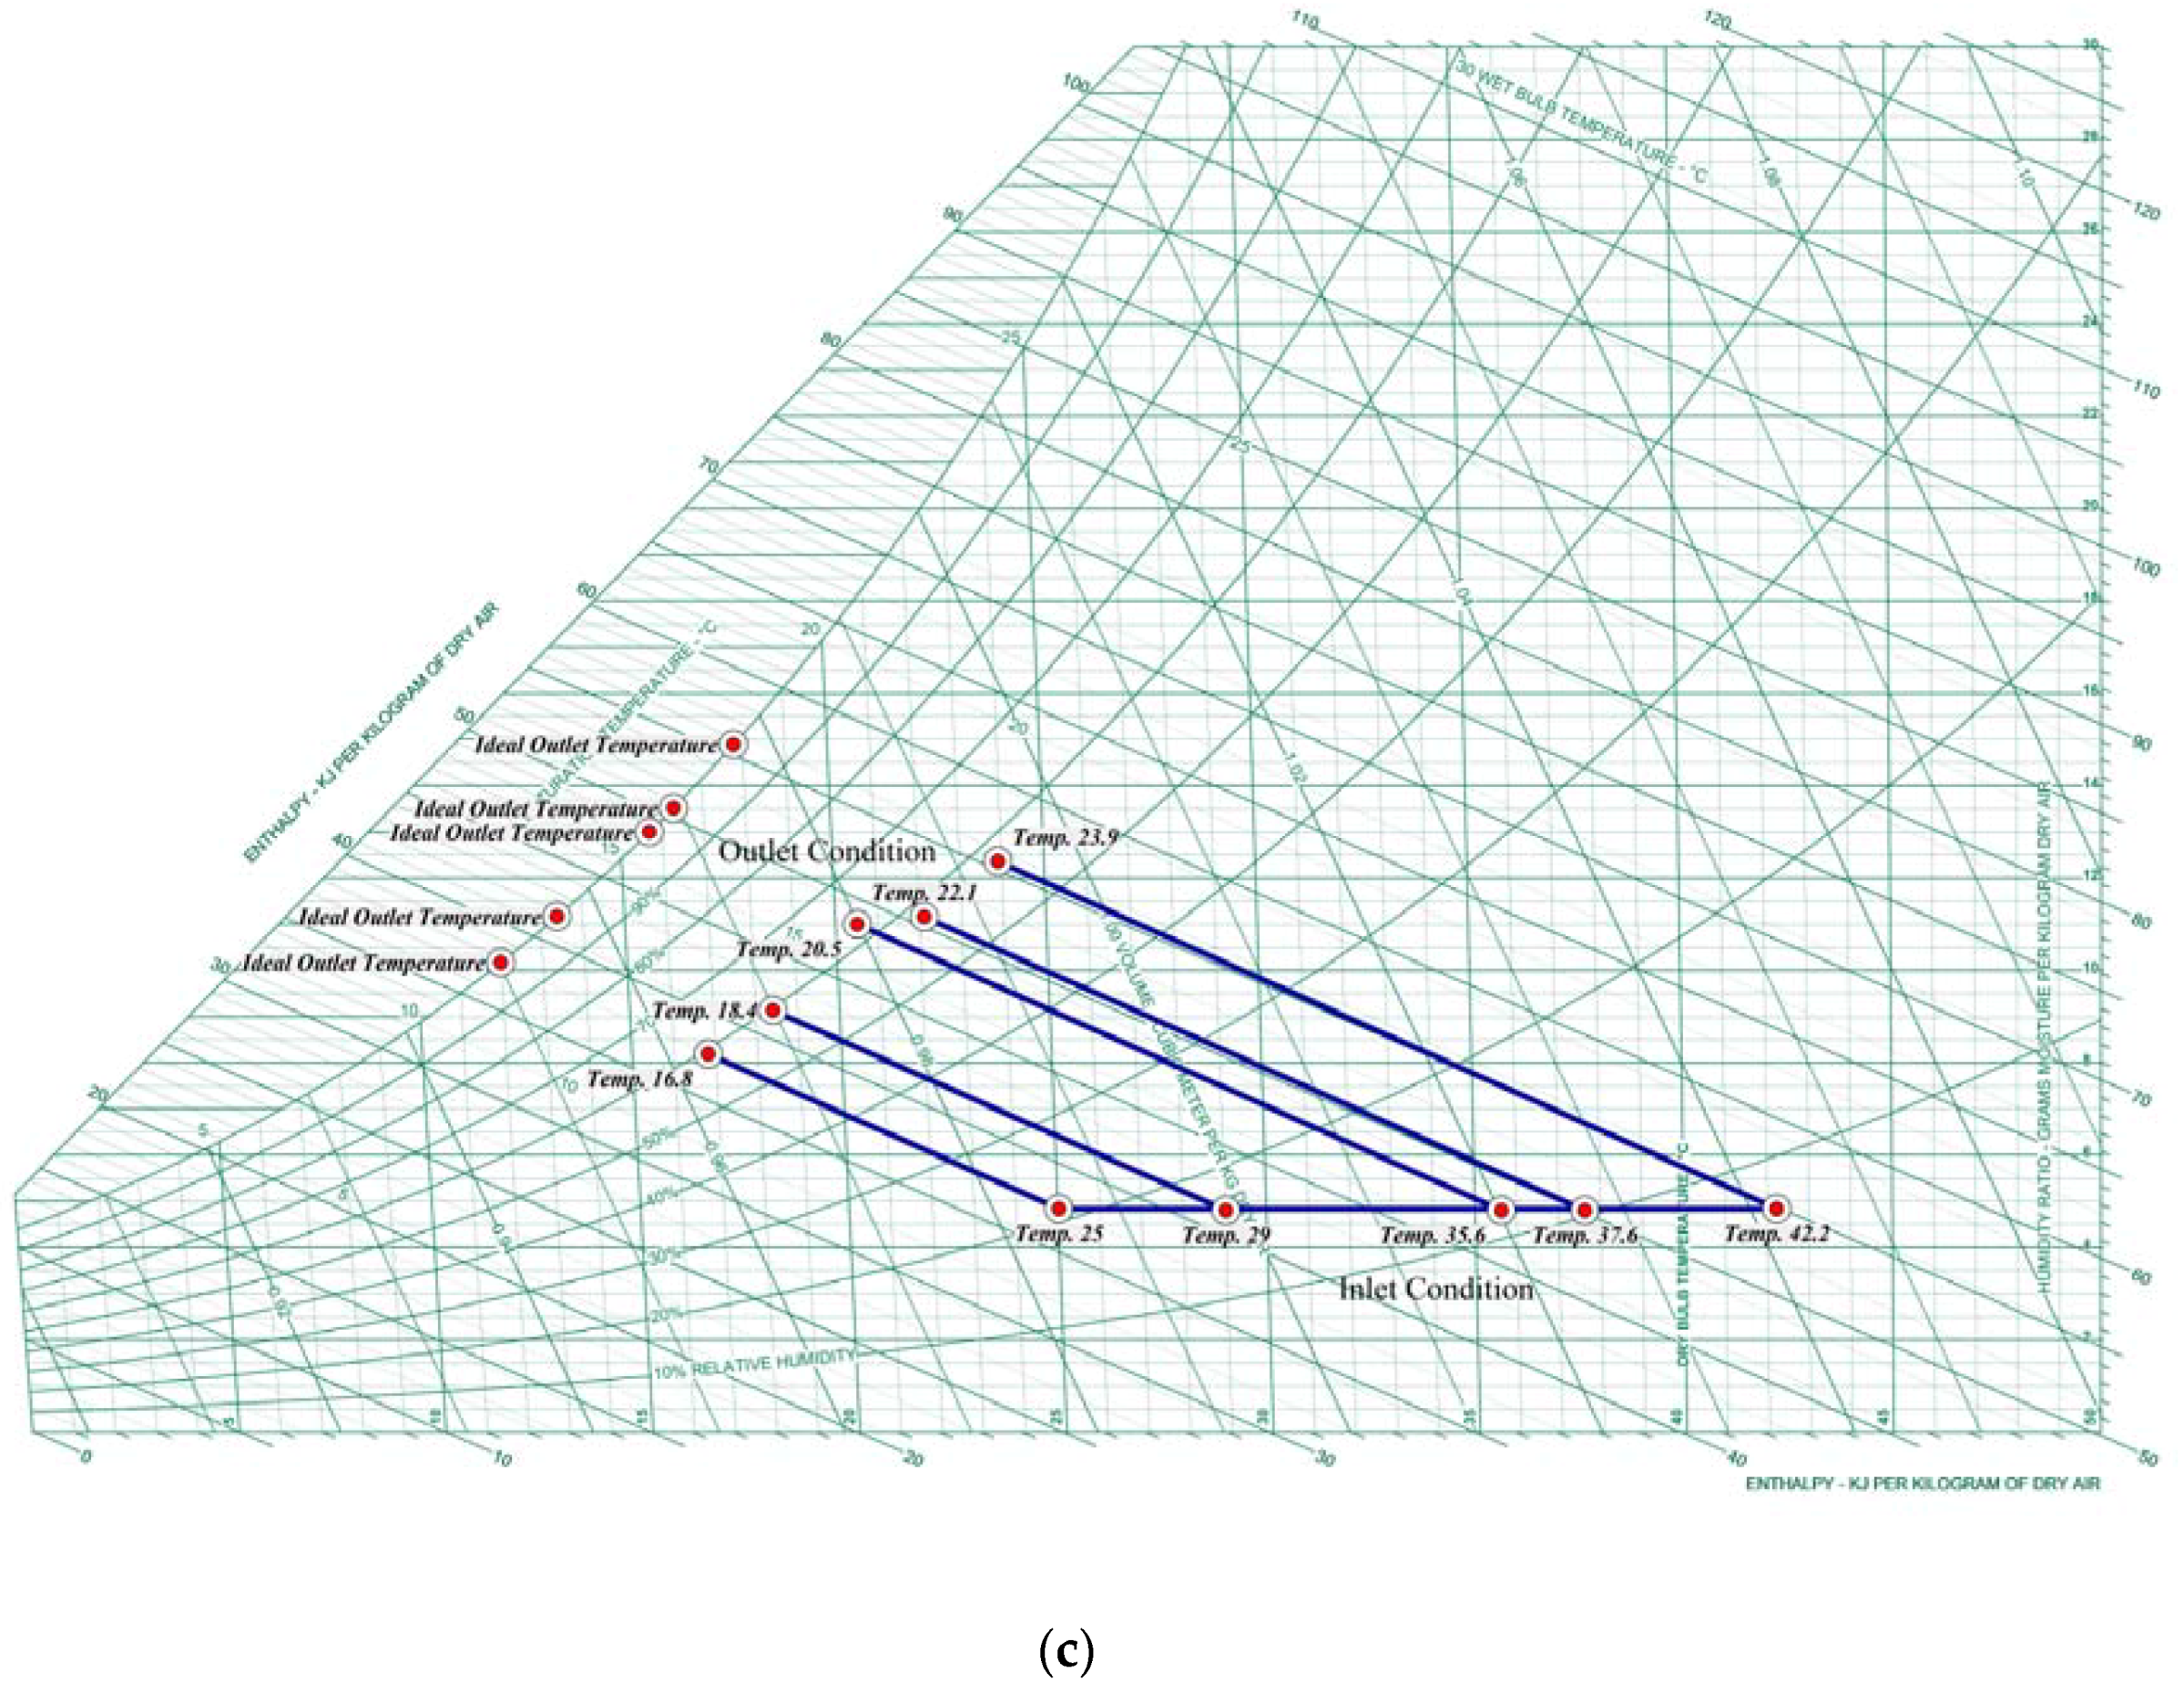
  • Another important parameter in creating thermal comfort is relative humidity. It was observed that using a wetted cellulose pad increased the outlet airflow relative humidity and, as it was shown on the psychrometric chart, relative humidity of the outlet airflow was between 40–70%, which was placed in the thermal comfort zone;
  • Combining wind catchers or induced ventilation with the wetted cellulose pad is a novel idea in order to make passive cooling methods more efficient for creating thermal comfort in buildings, especially in regions with hot and arid climates;
  • Using wetted cellulose pads at the opening inlet section of buildings and wind catchers reduced outlet velocity significantly—this is not desirable. So, a balance between these two parameters should be created in order to optimize the required pad area, and consequently the opening cross-section area;
  • In this study, due to some of the limitations, the ambient velocity was set to a constant amount of 3.5 m/s. It is well known that by increasing the altitude, the ambient air velocity increases. It is suggested this issue be investigated by other researchers, in order to evaluate the effect of the ambient air velocity on the passive cooling process, especially in the induced ventilation;
  • Due to the limitations of using a thicker cellulose pad, we recommend using wetted cellulose pads with a maximum thickness of 15 cm, in order to place the cellulose pad inside the walls. This thickness is more accessible, and smaller than almost all exterior wall thicknesses in buildings.
As the ambient airflow velocity plays a significant role in passive ventilation, we propose that other researchers investigate the effects of the different ambient airflow velocities on the efficiency of wetted cellulose pads. In addition, relative humidity is another effective parameter of passive ventilation with wetted surfaces that should be recommended. We also suggest doing the tests of the current study in a real condition, with different pad models and ambient airflow velocities. Moreover, the numerical simulation of the current study in order to analyze different parameters could be an interesting future work. The last recommendation is the analysis of wetted pads for different types of wind catchers, both numerically and experimentally.

Author Contributions

Conceptualization, E.M., M.S. and F.M.K.; methodology, E.M. and M.S.; investigation, E.M. and F.M.K.; experiments: E.M.; resources, M.S., F.M.K., M.Z., A.A.-H. and J.N.; data curation, E.M.; writing—original draft preparation, E.M.; writing—review and editing, M.S., F.M.K., M.Z., A.A.-H. and J.N.; visualization, E.M.; supervision, M.S. and M.Z.; project administration, M.S.; funding acquisition, A.A.-H. and J.N. All authors have read and agreed to the published version of the manuscript.

Funding

This research received no external funding.

Institutional Review Board Statement

Not applicable.

Informed Consent Statement

Not applicable.

Data Availability Statement

All the data are presented in the manuscript.

Acknowledgments

The authors are very grateful to Majid Ahmadi, Koolancel company.

Conflicts of Interest

The authors declare no conflict of interest.

References

  1. Pérez-Lombard, L.; Ortiz, J.; Pout, C. A review on buildings energy consumption information. Energy Build. 2008, 40, 394–398. [Google Scholar] [CrossRef]
  2. European Parliament and Council. Directive 2010/31/EU of the European Parliament and of the Council of 19 May 2010 on the energy performance of buildings. Off. J. Eur. Union 2010, L153, 13–35. [Google Scholar]
  3. Yang, L.; Yan, H.; Lam, J.C. Thermal comfort and building energy consumption implications—A review. Appl. Energy 2014, 115, 164–173. [Google Scholar] [CrossRef]
  4. Yao, R.; Li, B.; Steemers, K. Energy policy and standard for built environment in China. Renew. Energy 2005, 30, 1973–1988. [Google Scholar] [CrossRef]
  5. Wang, J.; Zhai, Z.J.; Jing, Y.; Zhang, C. Influence analysis of building types and climate zones on energetic, economic and environmental performances of BCHP systems. Appl. Energy 2011, 88, 3097–3112. [Google Scholar] [CrossRef]
  6. Soltani, M.; Kashkooli, F.M.; Souri, M.; Rafiei, B.; Jabarifar, M.; Gharali, K.; Nathwani, J.S. Environmental, economic, and social impacts of geothermal energy systems. Renew. Sustain. Energy Rev. 2021, 140, 110750. [Google Scholar] [CrossRef]
  7. Neij, L.; Sandin, S.; Benner, M.; Johansson, M.; Mickwitz, P. Bolstering a transition for a more sustainable energy system: A transformative approach to evaluations of energy efficiency in buildings. Energy Res. Soc. Sci. 2021, 72, 101864. [Google Scholar] [CrossRef]
  8. Coraci, D.; Brandi, S.; Piscitelli, M.S.; Capozzoli, A. Online Implementation of a Soft Actor-Critic Agent to Enhance Indoor Temperature Control and Energy Efficiency in Buildings. Energies 2021, 14, 997. [Google Scholar] [CrossRef]
  9. Farzanehkhameneh, P.; Soltani, M.; Kashkooli, F.M.; Ziabasharhagh, M. Optimization and energy-economic assessment of a geothermal heat pump system. Renew. Sustain. Energy Rev. 2020, 133, 110282. [Google Scholar] [CrossRef]
  10. Soltani, M.; Kashkooli, F.M.; Dehghani-Sanij, A.R.; Kazemi, A.R.; Bordbar, N.; Farshchi, M.J.; Elmi, M.; Gharali, K.; Dusseault, M.B. A comprehensive study of geothermal heating and cooling systems. Sustain. Cities Soc. 2019, 44, 793–818. [Google Scholar] [CrossRef]
  11. Soltani, M.; Moradi Kashkooli, F.; Dehghani-Sanij, A.R.; Nokhosteen, A.; Ahmadi-Joughi, A.; Gharali, K.; Mahbaz, S.B.; Dusseault, M.B. A comprehensive review of geothermal energy evolution and development. Int. J. Green Energy 2019, 16, 971–1009. [Google Scholar] [CrossRef]
  12. Mehryan, S.A.M.; Kashkooli, F.M.; Soltani, M. Comprehensive study of the impacts of surrounding structures on the aero-dynamic performance and flow characteristics of an outdoor unit of split-type air conditioner. Build. Simul. 2018, 11, 325–337. [Google Scholar] [CrossRef]
  13. Saadatian, O.; Haw, L.C.; Sopian, K.; Sulaiman, M.Y. Review of windcatcher technologies. Renew. Sustain. Energy Rev. 2012, 16, 1477–1495. [Google Scholar] [CrossRef]
  14. Dehghani-sanij, A.; Soltani, M.; Raahemifar, K. A new design of wind tower for passive ventilation in buildings to reduce energy consumption in windy regions. Renew. Sustain. Energy Rev. 2015, 42, 182–195. [Google Scholar] [CrossRef] [Green Version]
  15. Montazeri, H.; Azizian, R. Experimental study on natural ventilation performance of one-sided wind catcher. Build. Environ. 2008, 43, 2193–2202. [Google Scholar] [CrossRef]
  16. Bekleyen, A.; Melïkoğlu, Y. An investigation on the thermal effects of windcatchers. J. Build. Eng. 2021, 34, 101942. [Google Scholar] [CrossRef]
  17. Miri, P.; Babakhani, P. On the failure of the only vernacular windcatcher in the mountainous region of Western Iran: Opportunities for energy-efficient buildings. J. Clean. Prod. 2021, 295, 126383. [Google Scholar] [CrossRef]
  18. Harrouz, J.P.; Ghali, K.; Ghaddar, N. Integrated solar–Windcatcher with dew-point indirect evaporative cooler for classrooms. Appl. Therm. Eng. 2021, 188, 116654. [Google Scholar] [CrossRef]
  19. Alsailani, M.; Montazeri, H.; Rezaeiha, A. Towards optimal aerodynamic design of wind catchers: Impact of geometrical characteristics. Renew. Energy 2021, 168, 1344–1363. [Google Scholar] [CrossRef]
  20. Sakhri, N.; Moussaoui, A.; Menni, Y.; Sadeghzadeh, M.; Ahmadi, M.H. New passive thermal comfort system using three renewable energies: Wind catcher, solar chimney and earth to air heat exchanger integrated to real-scale test room in arid region (Experimental study). Int. J. Energy Res. 2021, 45, 2177–2194. [Google Scholar] [CrossRef]
  21. Nejat, P.; Ferwati, M.S.; Calautit, J.; Ghahramani, A.; Sheikhshahrokhdehkordi, M. Passive cooling and natural ventilation by the windcatcher (Badgir): An experimental and simulation study of indoor air quality, thermal comfort and passive cooling power. J. Build. Eng. 2021, 41, 102436. [Google Scholar] [CrossRef]
  22. Nejat, P.; Hussen, H.M.; Fadli, F.; Chaudhry, H.N.; Calautit, J.; Jomehzadeh, F. Indoor environmental quality (IEQ) analysis of a two-sided windcatcher integrated with anti-short-circuit device for low wind conditions. Processes 2020, 8, 840. [Google Scholar] [CrossRef]
  23. Abdo, P.; Huynh, B.P.; Braytee, A.; Taghipour, R. An experimental investigation of the thermal effect due to discharging of phase change material in a room fitted with a windcatcher. Sustain. Cities Soc. 2020, 61, 102277. [Google Scholar] [CrossRef]
  24. Moosavi, L.; Zandi, M.; Bidi, M.; Behroozizade, E.; Kazemi, I. New design for solar chimney with integrated windcatcher for space cooling and ventilation. Build. Environ. 2020, 181, 106785. [Google Scholar] [CrossRef]
  25. Sheikhshahrokhdehkordi, M.; Khalesi, J.; Goudarzi, N. High-performance building: Sensitivity analysis for simulating different combinations of components of a two-sided windcatcher. J. Build. Eng. 2020, 28, 101079. [Google Scholar] [CrossRef]
  26. Jomehzadeh, F.; Hussen, H.M.; Calautit, J.K.; Nejat, P.; Ferwati, M.S. Natural Ventilation by Windcatcher: A Review on the Impacts of Geometry, Microclimate and Macroclimate. Energy Build. 2020, 226, 110396. [Google Scholar] [CrossRef]
  27. Ghoulem, M.; El Moueddeb, K.; Nehdi, E.; Zhong, F.; Calautit, J. Design of a Passive Downdraught Evaporative Cooling Windcatcher (PDEC-WC) System for Greenhouses in Hot Climates. Energies 2020, 13, 2934. [Google Scholar] [CrossRef]
  28. Bahadori, M.N.; Mazidi, M.; Dehghani, A.R. Experimental investigation of new designs of wind towers. Renew. Energy 2008, 33, 2273–2281. [Google Scholar] [CrossRef]
  29. Javan Amoli, F. An Analytic Survey of the Two Types of Modern Drenched Wind Towers. BSc Thesis, School of Mechanical Engineering, Sharif University of Technology, Tehran, Iran, 1990. [Google Scholar]
  30. Memarie, G.H. An Analysis of the Performance and Comparison of Two Modern Designs of Wind Towers. BSc Thesis, School of Mechanical Engineering, Sharif University of Technology, Tehran, Iran, 1991. [Google Scholar]
  31. Pakzad, A.R. Analysis of Two New Designs of Wind Towers. MSc Thesis, School of Mechanical Engineering, Sharif University of Technology, Tehran, Iran, 1997. [Google Scholar]
  32. Dehghani, A.R. An Experimental Evaluation of Two New Designs of Wind Towers and a Comparison with a Conventional Wind Tower. BSc Thesis, Yazd University, Yazd, Iran, 2001. [Google Scholar]
  33. Mosavi Davar, S. An Empirical Study and Performance Analysis Wind Towers and Their Feasibility of Use in the Buildings. BSc Thesis, Department of Mechanical Engineering, Faculty of Polytechnic, Gillan University, Gillan, Iran, 2002. [Google Scholar]
  34. Mazidi, M. Assessment of the Efficiency of Yazd University Masque through Analytical and Empirical Methods. MSc Thesis, Department of Power-Plant, Shahid Abbas Pour Water and Electricity University, Tehran, Iran, 2005. [Google Scholar]
  35. Bahadori, M. A passive cooling/heating system for hot arid regions. In Proceedings of the American Solar Energy Society Conference, Cambridge, MA, USA, 18–24 June 1988; pp. 364–367. [Google Scholar]
  36. Esfeh, M.K.; Dehghan, A.A.; Manshadi, M.D.; Mohagheghian, S. Visualized flow structure around and inside of one-sided wind-catchers. Energy Build. 2012, 55, 545–552. [Google Scholar] [CrossRef]
  37. Afshin, M.; Sohankar, A.; Manshadi, M.D.; Esfeh, M.K. An experimental study on the evaluation of natural ventilation performance of a two-sided wind-catcher for various wind angles. Renew. Energy 2016, 85, 1068–1078. [Google Scholar] [CrossRef]
  38. Soltani, M.; Dehghani-Sanij, A.; Sayadnia, A.; Kashkooli, F.M.; Gharali, K.; Mahbaz, S.; Dusseault, M.B. Investigation of airflow patterns in a new design of wind tower with a wetted surface. Energies 2018, 11, 1100. [Google Scholar] [CrossRef] [Green Version]
  39. Khani, S.M.R.; Bahadori, M.N.; Dehghani-Sanij, A.; Nourbakhsh, A. Performance evaluation of a modular design of wind tower with wetted surfaces. Energies 2017, 10, 845. [Google Scholar] [CrossRef] [Green Version]
  40. Malli, A.; Seyf, H.R.; Layeghi, M.; Sharifian, S.; Behravesh, H. Investigating the performance of cellulosic evaporative cooling pads. Energy Convers. Manag. 2011, 52, 2598–2603. [Google Scholar] [CrossRef]
  41. Sohani, A.; Zabihigivi, M.; Moradi, M.H.; Sayyaadi, H.; Balyani, H.H. A comprehensive performance investigation of cellulose evaporative cooling pad systems using predictive approaches. Appl. Therm. Eng. 2017, 110, 1589–1608. [Google Scholar] [CrossRef]
  42. Tejero-González, A.; Franco-Salas, A. Optimal operation of evaporative cooling pads: A review. Renew. Sustain. Energy Rev. 2021, 151, 111632. [Google Scholar] [CrossRef]
  43. Tejero-González, A.; Franco-Salas, A. Direct evaporative cooling from wetted surfaces: Challenges for a clean air conditioning solution. Wiley Interdiscip. Rev. Energy Environ. 2021, e423. [Google Scholar] [CrossRef]
  44. Ghani, S.; El-Bialy, E.M.A.A.; Bakochristou, F.; Rashwan, M.M.; Abdelhalim, A.M.; Ismail, S.M.; Ben, P. Experimental and numerical investigation of the thermal performance of evaporative cooled greenhouses in hot and arid climates. Sci. Technol. Built Environ. 2020, 26, 141–160. [Google Scholar] [CrossRef] [Green Version]
  45. Available online: https://www.koolancel.ir/wp-content/uploads/2017/09/cool-wave-lenght.jpg (accessed on 1 September 2017).
  46. Available online: https://www.koolancel.ir/wp-content/uploads/2017/09/angle.jpg (accessed on 1 September 2017).
  47. Global Wind Atlas 3.0, a Free, Web-Based Application Developed, Owned and Operated by the Technical University of Denmark (DTU). The Global Wind Atlas 3.0 Is Released in Partnership with the World Bank Group, Utilizing Data Provided by Vortex, Using Funding Provided by the Energy Sector Management Assistance Program (ESMAP). Available online: https://globalwindatlas.info/en/area/IslamicRepublicofIran/ (accessed on 1 July 2021).
  48. Doebelin, E.O. Measurement System: Application and Design, 4th ed.; McGraw–Hill Publishing Company: New York, NY, USA, 1990. [Google Scholar]
Figure 1. A view of one-sided wind catchers in Kashan city, Isfahan province, Iran.
Energies 15 00369 g001
Figure 2. A view of a different types of wind catcher. (a) One-sided wind catcher, Kashan city, Esfahan province, Iran. (b) Two-sided wind catcher [14]. (c) A cylindrical wind catcher [14]. (d) A four-sided wind catcher [14].
Energies 15 00369 g002aEnergies 15 00369 g002b
Figure 3. A schematic of (a) the laboratory prototype; (1) fan; electrical element and primary channel; (2) probe; (3) cellulose pad; (4) water storage tank with circulation pump; (5) holder; (6) secondary channel; (7) monitor; (8) calibrated rod. (b) Diagram of the sensor arrangement—measuring points—in the inlet and outlet section.
Energies 15 00369 g003
Figure 4. Different parts of the laboratory prototype of the present study; (a) pad with maximum thickness; (b) electrical elements; (c) top water distributor tray; (d) bottom water collector tray; (e) measurement probe.
Energies 15 00369 g004
Figure 5. Maximum distance and angle of placement of the cellulose pads.
Energies 15 00369 g005
Figure 6. Turbine anemometer.
Energies 15 00369 g006
Figure 7. Experimental results for outlet airflow velocity (from 7090 cellulose pad model).
Energies 15 00369 g007
Figure 8. Experimental results for outlet air temperature (from 7090 cellulose pad model).
Energies 15 00369 g008
Figure 9. Effectiveness of 7090 cellulose pad model.
Energies 15 00369 g009
Figure 10. The rate of evaporated water for 7090 cellulose pad model.
Energies 15 00369 g010
Figure 11. Evaporative cooling process for different pad thicknesses. (a) 10 cm. (b) 15 cm. (c) 30 cm.
Energies 15 00369 g011aEnergies 15 00369 g011b
Figure 12. A schematic of using wetted cellulose pad in the inflow section of the wind catcher: (1) cellulose pad; (2) wind catcher; (3) wind vane; (4) feed water pipe; (5) return pipe; (6) water circulation pump; (7) vent; (8) water reservoir tank; and (9) roof.
Energies 15 00369 g012
Figure 13. A schematic of (a) a high-rise tower with induced ventilation as a passive cooling method; (b) a floor of a high-rise tower with induced ventilation as a passive cooling method; (c) whole passive cooling process; and (d) an opening with cellulose pad and piping lines.
Energies 15 00369 g013aEnergies 15 00369 g013b
Table 1. Specifications of the laboratory prototype.
Power (w)Dimensions/Diameter (m)Rate (m3/h)Number
LengthWidthHeight
Electrical element7000.30---16
Fan3800.5<80001
Water pump<50-<0.661
Primary duct-10.60.6-1
Secondary duct-10.50.5-1
Holder---0.5--
Water distributer tray-0.50.10.1-3
Probe holder (index)-1-1--
Table 2. Specifications of the turbine anemometer for velocity.
Air Velocity
Measurement
RangeResolutionAccuracy
m/s0.4–30.0 m/s0.1 m/s±(2% + 0.2 m/s)
km/h1.4–126.0 km/h0.1 km/h±(2% + 0.8 km/h)
Table 3. Specifications of thermometer and turbine anemometer for air temperature.
ThermometerTurbine Anemometer
Measurement Range−10 °C to +110 °C0 °C to 50 °C
Resolution1 °C0.1 °C
Accuracy+1 °C±0.8 °C
Table 4. Data for velocity measurements and probable errors.
Pad Thickness (cm)Average Outlet Velocity (m/s)Error_Earss (%)
100.95.80
150.77.55
300.68.70
Table 5. Data for temperature measurements and probable errors.
Pad Thickness (cm)Average Outlet Temperature (°C)Error_Earss (%)
1026.86.33
23.86.32
22.66.36
20.96.37
18.76.39
1525.76.30
22.96.20
20.86.39
19.56.34
17.16.36
3023.96.35
22.16.38
20.56.38
18.46.40
16.76.45
Publisher’s Note: MDPI stays neutral with regard to jurisdictional claims in published maps and institutional affiliations.

