Article

Economic Feasibility of Green Hydrogen Production by Water Electrolysis Using Wind and Geothermal Energy Resources in Asal-Ghoubbet Rift (Republic of Djibouti): A Comparative Evaluation

by
Mohamed Osman Awaleh
1,*,
Abdi-Basid Adan
1,*,
Omar Assowe Dabar
1,*,
Mohamed Jalludin
1,
Moussa Mahdi Ahmed
1 and
Ismael Abdillahi Guirreh
2
1
Centre d’Etudes et de Recherches de Djibouti (CERD), Institut des Sciences de la Terre, Route de l’aeroport, Djibouti City B.P. 486, Djibouti
2
Département Logistique & Transport, Institut Universitaire de Technologie, Université de Djibouti, Croisement RN2-RN5, Balbala B.P. 1904, Djibouti
*
Authors to whom correspondence should be addressed.
Energies 2022, 15(1), 138; https://doi.org/10.3390/en15010138
Submission received: 30 November 2021 / Revised: 14 December 2021 / Accepted: 20 December 2021 / Published: 26 December 2021
(This article belongs to the Topic Sustainable Energy Technology)

Abstract

:
The Republic of Djibouti has untapped potential in terms of renewable energy resources, such as geothermal, wind, and solar energy. This study examines the economic feasibility of green hydrogen production by water electrolysis using wind and geothermal energy resources in the Asal–Ghoubbet Rift (AG Rift), Republic of Djibouti. It is the first study in Africa that compares the cost per kg of green hydrogen produced by wind and geothermal energy from a single site. The unit cost of electricity produced by the wind turbine (0.042 $/kWh) is more competitive than that of a dry steam geothermal plant (0.086 $/kWh). The cost of producing hydrogen with a suitable electrolyzer powered by wind energy ranges from $0.672/kg H2 to $1.063/kg H2, while that produced by the high-temperature electrolyzer (HTE) powered by geothermal energy ranges from $3.31/kg H2 to $4.78/kg H2. Thus, the AG Rift area can produce electricity and green hydrogen at low-cost using wind energy compared to geothermal energy. The amount of carbon dioxide (CO2) emissions reduced by using a “Yinhe GX113-2.5MW” wind turbine and a single flash geothermal power plant instead of fuel-oil generators is 2061.6 tons CO2/MW/year and 2184.8 tons CO2/MW/year, respectively.

1. Introduction

The Republic of Djibouti is located in the Horn of Africa, at the intersection of the Red Sea and the Indian Ocean (Figure 1). Djibouti benefits from a geostrategic position over the world’s main shipping road, and it is the natural outlet for the landlocked countries in the region. On the other hand, the Republic of Djibouti is one of several African countries located on the East African Rift System (EARS) (Figure 1). As in other rifting zones, the EARS activity corresponds to large seismic, tectonic, and volcanic activities [1]. This unique geodynamical environment puts the Republic of Djibouti in an excellent position to develop geothermal energy. Indeed, the Republic of Djibouti, one of the few countries with geothermal potential in Africa, is endowed with a substantial amount of this energy, which is found scattered along the Gulf of Tadjourah ridge and the western part of the country (Supplementary Figure S1) [2,3]. However, the most geologically active area in Djibouti is the Lake Asal area, and the AG Rift is one of two emergent oceanic ridges globally, the other being in Iceland [1]. Therefore, several studies have been carried out on the Republic of Djibouti geothermal areas to either select the most favorable geothermal prospects for exploration by deep drilling or estimate their geothermal potential [2,3,4,5,6,7,8].
The Government of Djibouti has established an ambitious long-term development plan to improve energy access and energy security as a primary strategic focus by using alternative energy sources. Indeed, the Republic of Djibouti is endowed with strong potential in terms of renewable energy resources in addition to geothermal energy, such as wind and solar [9,10,11,12]. The plan aims at diversifying energy resources and focusing on renewable energy, which the country is endowed with, such as wind and solar and geothermal energy [9,10,11,12]. Furthermore, the Republic of Djibouti is among the fifteen African countries having the best wind resource potential [13], Wind energy is the world’s fastest growing renewable energy technology [14,15]. For example, Zhang et al. [16] used two years of wind data measured at four heights above sea level to determine the wind potential of the southern coast of Pakistan. Soltani et al. [17] investigated the environmental, economic, and social impacts of geothermal energy systems. They provided a detailed review of barriers and highlighted options for increasing the global geothermal energy capacity and production needed to meet “net-zero” carbon emission goals [17].
In addition to electricity production, wind and geothermal energies can also generate green hydrogen via the water electrolysis process, which consists of splitting the water molecule under the effect of an electric current [18,19]. Despite the growth of the hydrogen market as a promising energy source, conventional routes for hydrogen production, i.e., from fossil fuels, have negative environmental impacts [20]. However, the power-to-gas concept, based on water electrolysis using electricity from renewable energy sources (wind, solar, geothermal), is the most environmentally friendly approach. Water electrolysis, a mature technique with relatively good efficiency [21,22], currently accounts for 4% of hydrogen production, but this is expected to expand significantly in the coming years, with a 22% market share projected for 2050 [23].
The primary consumers of hydrogen are the oil refining, metallurgy, chemical, and pharmaceutical industries. The growth of the above-mentioned industries leads to an increase in hydrogen demand. Numerous studies have investigated the integration of renewable energy for green hydrogen production. Ishaq and Dincer [24] performed a comparative assessment of renewable energy-based hydrogen production methods (i.e., Biomass, solar and geothermal). Hydrogen production using the biomass gasification technique offers higher energetic and exergetic efficiencies than the hydrogen production system using geothermal or solar energy [24]. Al-Sharafi et al. [25] investigated the potential of power generation and hydrogen production via solar and wind energy resources at different locations in Saudi Arabia. The optimization results showed that the minimum levelized cost of energy is 0.609 USD/kWh, and the cost of hydrogen production (COH) is 43.1 USD/kg. Mostafaeipour et al. [26] investigated the suitable areas in Afghanistan for harvesting wind energy for hydrogen production. On the other hand, few studies have been conducted on electricity and hydrogen production using wind energy in Africa countries [22,27]. Ayodele and Munda assessed the potential and cost-efficiency of green hydrogen production from South Africa’s wind energy resources [22]. They reported a potential annual production of 6.51–226.82 metric tons of hydrogen and a minimum production cost of $1.4–39.55/kg, depending on the wind turbine model used. On the other hand, the geothermal-assisted hydrogen production cost based on water electrolysis can compete with other renewable energy resources such as wind power [28]. Indeed, Rahmouni et al. performed an environmental investigation on a geothermal-based hydrogen production process, where the cost of the produced hydrogen was estimated at about $8.24/kg H2 [29]. Yilmaz et al. realized the thermoeconomic evaluation of hydrogen production by the binary geothermal power plant and estimated the cost at $2.366/kg H2 [30]. In another study, Yilmaz et al. [31] performed a thermodynamic and economic analysis of a geothermal energy-assisted hydrogen production system using real-time artificial neural networks on a field programmable gate array. The overall exergy efficiency of the system, the unit cost of the produced hydrogen, and the simple payback period of the system were calculated as 7978 kW, 38.37%, 1.088 $/kg H2, and 4.074 years, respectively.
The main contribution of this study is to compare the economic feasibility of hydrogen production by water electrolysis from wind and geothermal energy resources for a given site in Africa. Indeed, to the best of our knowledge, no study of green hydrogen production using geothermal energy has been conducted so far in Africa. In this regard, this paper analyzes the cost of green hydrogen production from wind and geothermal energy in the Asal–Ghoubbet region, located in the southwestern part of the Republic of Djibouti, thus helping potential investors and developers of hydrogen production units in the Republic of Djibouti. In sum, the contributions of this work are:
  • The analysis of the wind energy potential of the Ghoubbet region
  • The selection of the most appropriate wind turbine and electrolyzer for electricity and hydrogen production in the study area
  • The performance of thermodynamic analysis to select the appropriate geothermal energy production processes for the Rift AG region
  • Estimating the cost per Kg of hydrogen produced by combining a geothermal power plant in the Rift AG with an appropriate electrolyzer
  • Evaluating the CO2 emission reduction of wind and geothermal energy in the study area.

2. Site Description and Data Collection

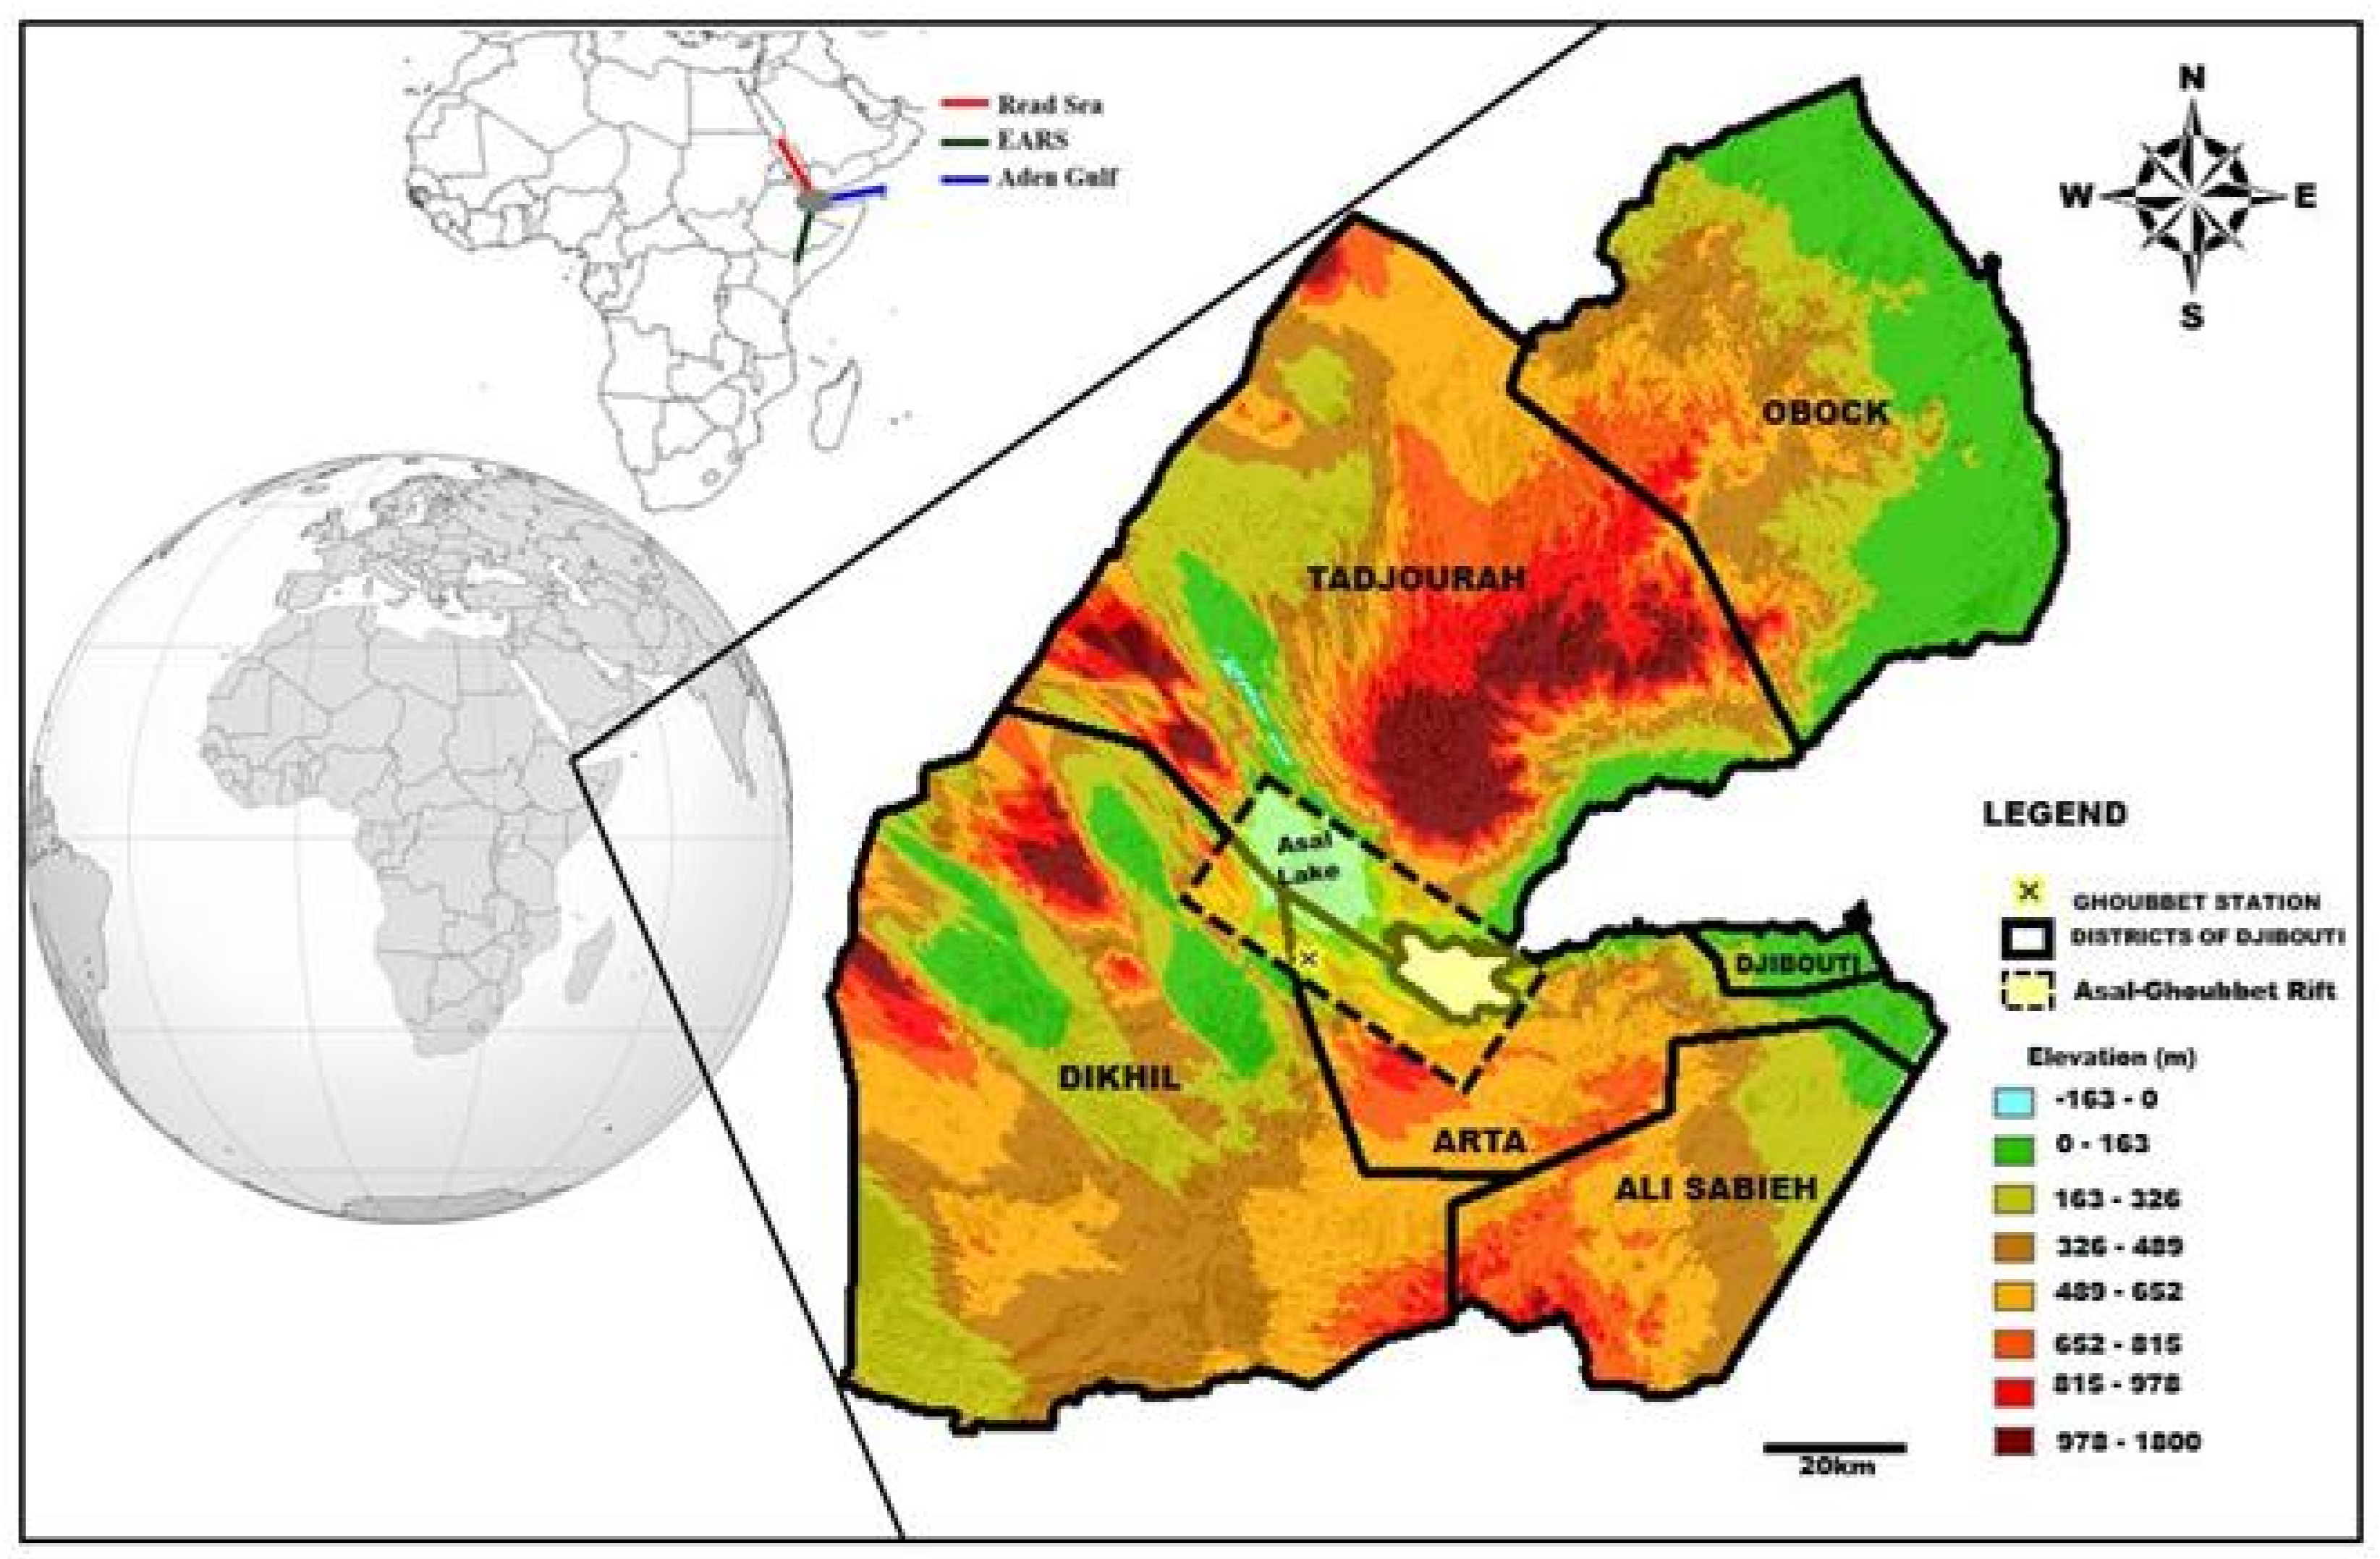
2.1. Site Description

The Republic of Djibouti is located in the Horn of Africa, bounded by Eritrea to the north, Ethiopia to the west and southwest, and Somalia to the southeast (Figure 1). The Köppen–Geiger climate classification of the area ranges from “hot desert” to “semi-arid” with a low precipitation regime and annual mean rainfall of 150 mm (climate type codes BWh and BSh, respectively) [32,33]. Two seasons predominate: a cool season (winter) from October to April with a monthly mean temperature of 20–30 °C and a hot season (summer) from May to September with a monthly mean temperature of 30–45 °C. In summer, an equatorial westerly wind zone dominates, and the mean temperature increases to between 30 and 45 °C with a high rate of evapotranspiration amounting to 2000 mm per year [7,8]. As shown in Figure 1, the AG Rift is located in an area that extends from the Arta region to the Tadjourah region. The Asal—Ghoubbet region, a land barrier of 12 km long and 10 km wide, of volcano-tectonic type, is a very recent active rift fewer than one million years old [34]. It encompasses the Asal Lake and the Ghoubbet al Kharab Gulf.

2.2. Wind Data Source

The present study uses wind data measured at meteorological stations installed by the Djibouti Centre for Research and Studies (CERD in French) at Ghoubbet (Latitude 11.5382°; Longitude 42.4119°, Figure 1). The wind speed data were collected and measured at three heights (i.e., 20 m, 40 m and 60 m) for a 10-min time interval throughout 2014–2015. The wind speeds are recorded using NRG#40C anemometers with an accuracy of 0.1 m/s in the range 1–96 m/s [35]. All data were checked thoroughly to identify any values that are outside the range of the sensors. The wind directions are recorded using an NRG 200P wind vane. A barometric pressure sensor (BP200) and temperature sensor (NRG 100S) were enclosed in a circular six-plate radiation shield to ensure accurate measurements and mounted on the tower. Further details regarding the tower, the instruments, and the support structure can be found on the website of NRG systems [35].

3. Methodology

The feasibility of green hydrogen production from wind and geothermal energy in the Republic of Djibouti was assessed using the following approach (Figure 2): (1) assessment of the wind and geothermal energy in the study area, (2) selection of the most suitable wind turbine and geothermal power plant, (3) assessment of the levelized cost of electricity ($/kWh) produced from wind and geothermal energy, (4) selection of the most appropriate electrolyzer, (5) evaluation of the levelized cost of hydrogen ($/kg), (6) evaluation of the CO2 savings for wind and geothermal energy, (7) comparison of the levelized cost of hydrogen produced by an electrolyzer powered by wind and geothermal energy. The proposed research framework is based on the flowchart given in Figure 2.

3.1. Wind Resource Assessment

3.1.1. Weibull Density Function

The Weibull distribution model is applied for describing and analyzing wind data. This function is used to predict the characteristics of prevailing wind profile precisely [36]. To use the Weibull probability distribution, it is necessary to calculate two parameters, the scale parameter (k) and the dimensionless shape factor (c). Indeed, the two parameter Weibull distribution f(v) of measured wind speed v (m/s) and the cumulative distribution of Weibull are defined by the following equation [37,38]:
f ( v ) = ( k c ) ( v c ) k 1 e x p [ v c ] k
F ( v ) = 1 e x p [ v c ] k
In the literature, several methods to estimate the scale and shape parameters of the Weibull distribution function are reported [39]. In this study, four methods available are selected to estimate the Weibull parameters, namely the maximum likelihood method, WAsP method, moment method, and empirical method of Jestus. These methods have been detailed in the Supplementary Material. Root mean square error, determination of coefficient, and mean bias error are computed to validate and compare the computed results.

3.1.2. Wind Shear Coefficient

Estimating the wind power generated by any wind turbine, the wind speed should be observed at the turbine hub height. However, in most cases, wind speeds are observed at a height different from the turbine hub height. In this case, the power-law method is the most commonly used to adjust the wind speed to the turbine hub-height as follows [40]:
V 2 = V 1   ×   ( Z 2 Z 1 ) α  
where V2 and V1 are the wind velocities at heights Z2 and Z1, respectively, and α is the wind shear coefficient or power exponent.

3.1.3. Wind Power Density

The wind power density (PD) is an indicator used to evaluate the available wind energy. The PD represents the flux of kinetic energy available in the wind per unit area, according to the wind speed V and air density ρ. It can be assessed using the following equation [41]:
P D = 1 N i = 1 N ρ v i 3  
where v i is the measured wind speed for every 10 min period expressed in m/s and N is the total number of sample data for each year. ρ is the air density in kg/m3 (ρ = 1.225 kg/m3 at the sea level).

3.1.4. Annual Energy Production

The total amount of energy produced and the capacity factor of a turbine are essential indicators used to assess the performance and economic sustainability of wind turbines at a specific location. The wind turbine annual energy production (Eout) over a desired period can be calculated as follows [42]:
E o u t = 8760 × P o u t = 8760 × P r × [ e ( v c / c ) k e ( v r / c ) k ( v r / c ) k ( v c / c ) k ] e ( v f / c ) k
Furthermore, the capacity factor (Cf), the ratio of energy produced annually from a wind turbine (Eout) and annual rated power (Er), can be defined as fellows [43]:
C f = E o u t E r

3.2. Geothermal Resources Assessment

The geothermal resources in the Asal–Ghoubbet area were evaluated using the volumetric method according to the United States Geological Survey (USGS) [44]. This method assesses the total geothermal energy in the fluids and the rock masses of the reservoir. Moreover, the volumetric method is combined with the Monte Carlo method to minimize parameter uncertainty. A brief description of the Monte Carlo simulation method parameters is presented in the Supplementary Material. The electrical potential of the geothermal reservoir can be evaluated using the following equation [45]:
G P P = E G T × R f × C e L f × L t
In this study, the single flash and dry steam systems are considered for geothermal power generation. The thermodynamic performance of these two systems is evaluated in terms of energy and exergy efficiency. The details of the thermodynamic evaluation are reported in the Supplementary Material. The electrolyzer uses the energy produced by the geothermal plant to produce hydrogen from water.

3.3. Hydrogen Production from Wind and Geothermal Energy

3.3.1. Hydrogen Production from Wind Energy

Hydrogen can be generated through water electrolysis by using renewable energy, such as wind and geothermal energy. The proposed system for converting wind and geothermal energy to produce hydrogen is shown in Figure 3. An AC/DC converter delivering the quantity of energy required by the electrolyzer for its operation under real conditions is also employed. The efficiency of the converter is assumed to be 90% [46]. There are several types of electrolyzer in the literature. In this study, the polymer electrolyte membrane electrolyzer (PEME), high temperature electrolyzer (HTE), and alkaline water electrolyzer (AWE) were used because of their good ability for integration with renewable energy systems. For PEME and AWE electrolyzers, the water temperature is between 60 and 90 °C [47], while for the high temperature electrolyzer (HTE), the water temperature can vary from 800 to 1000 °C [48].
Considering the amount of hydrogen that could be produced yearly by each electrolyzer, the annual wind turbine energy has a direct relationship with production and can be formulated with the following mathematical equation [46]:
M H 2 = E o u t E e l e c t r o l y z e r x   η c o n v  

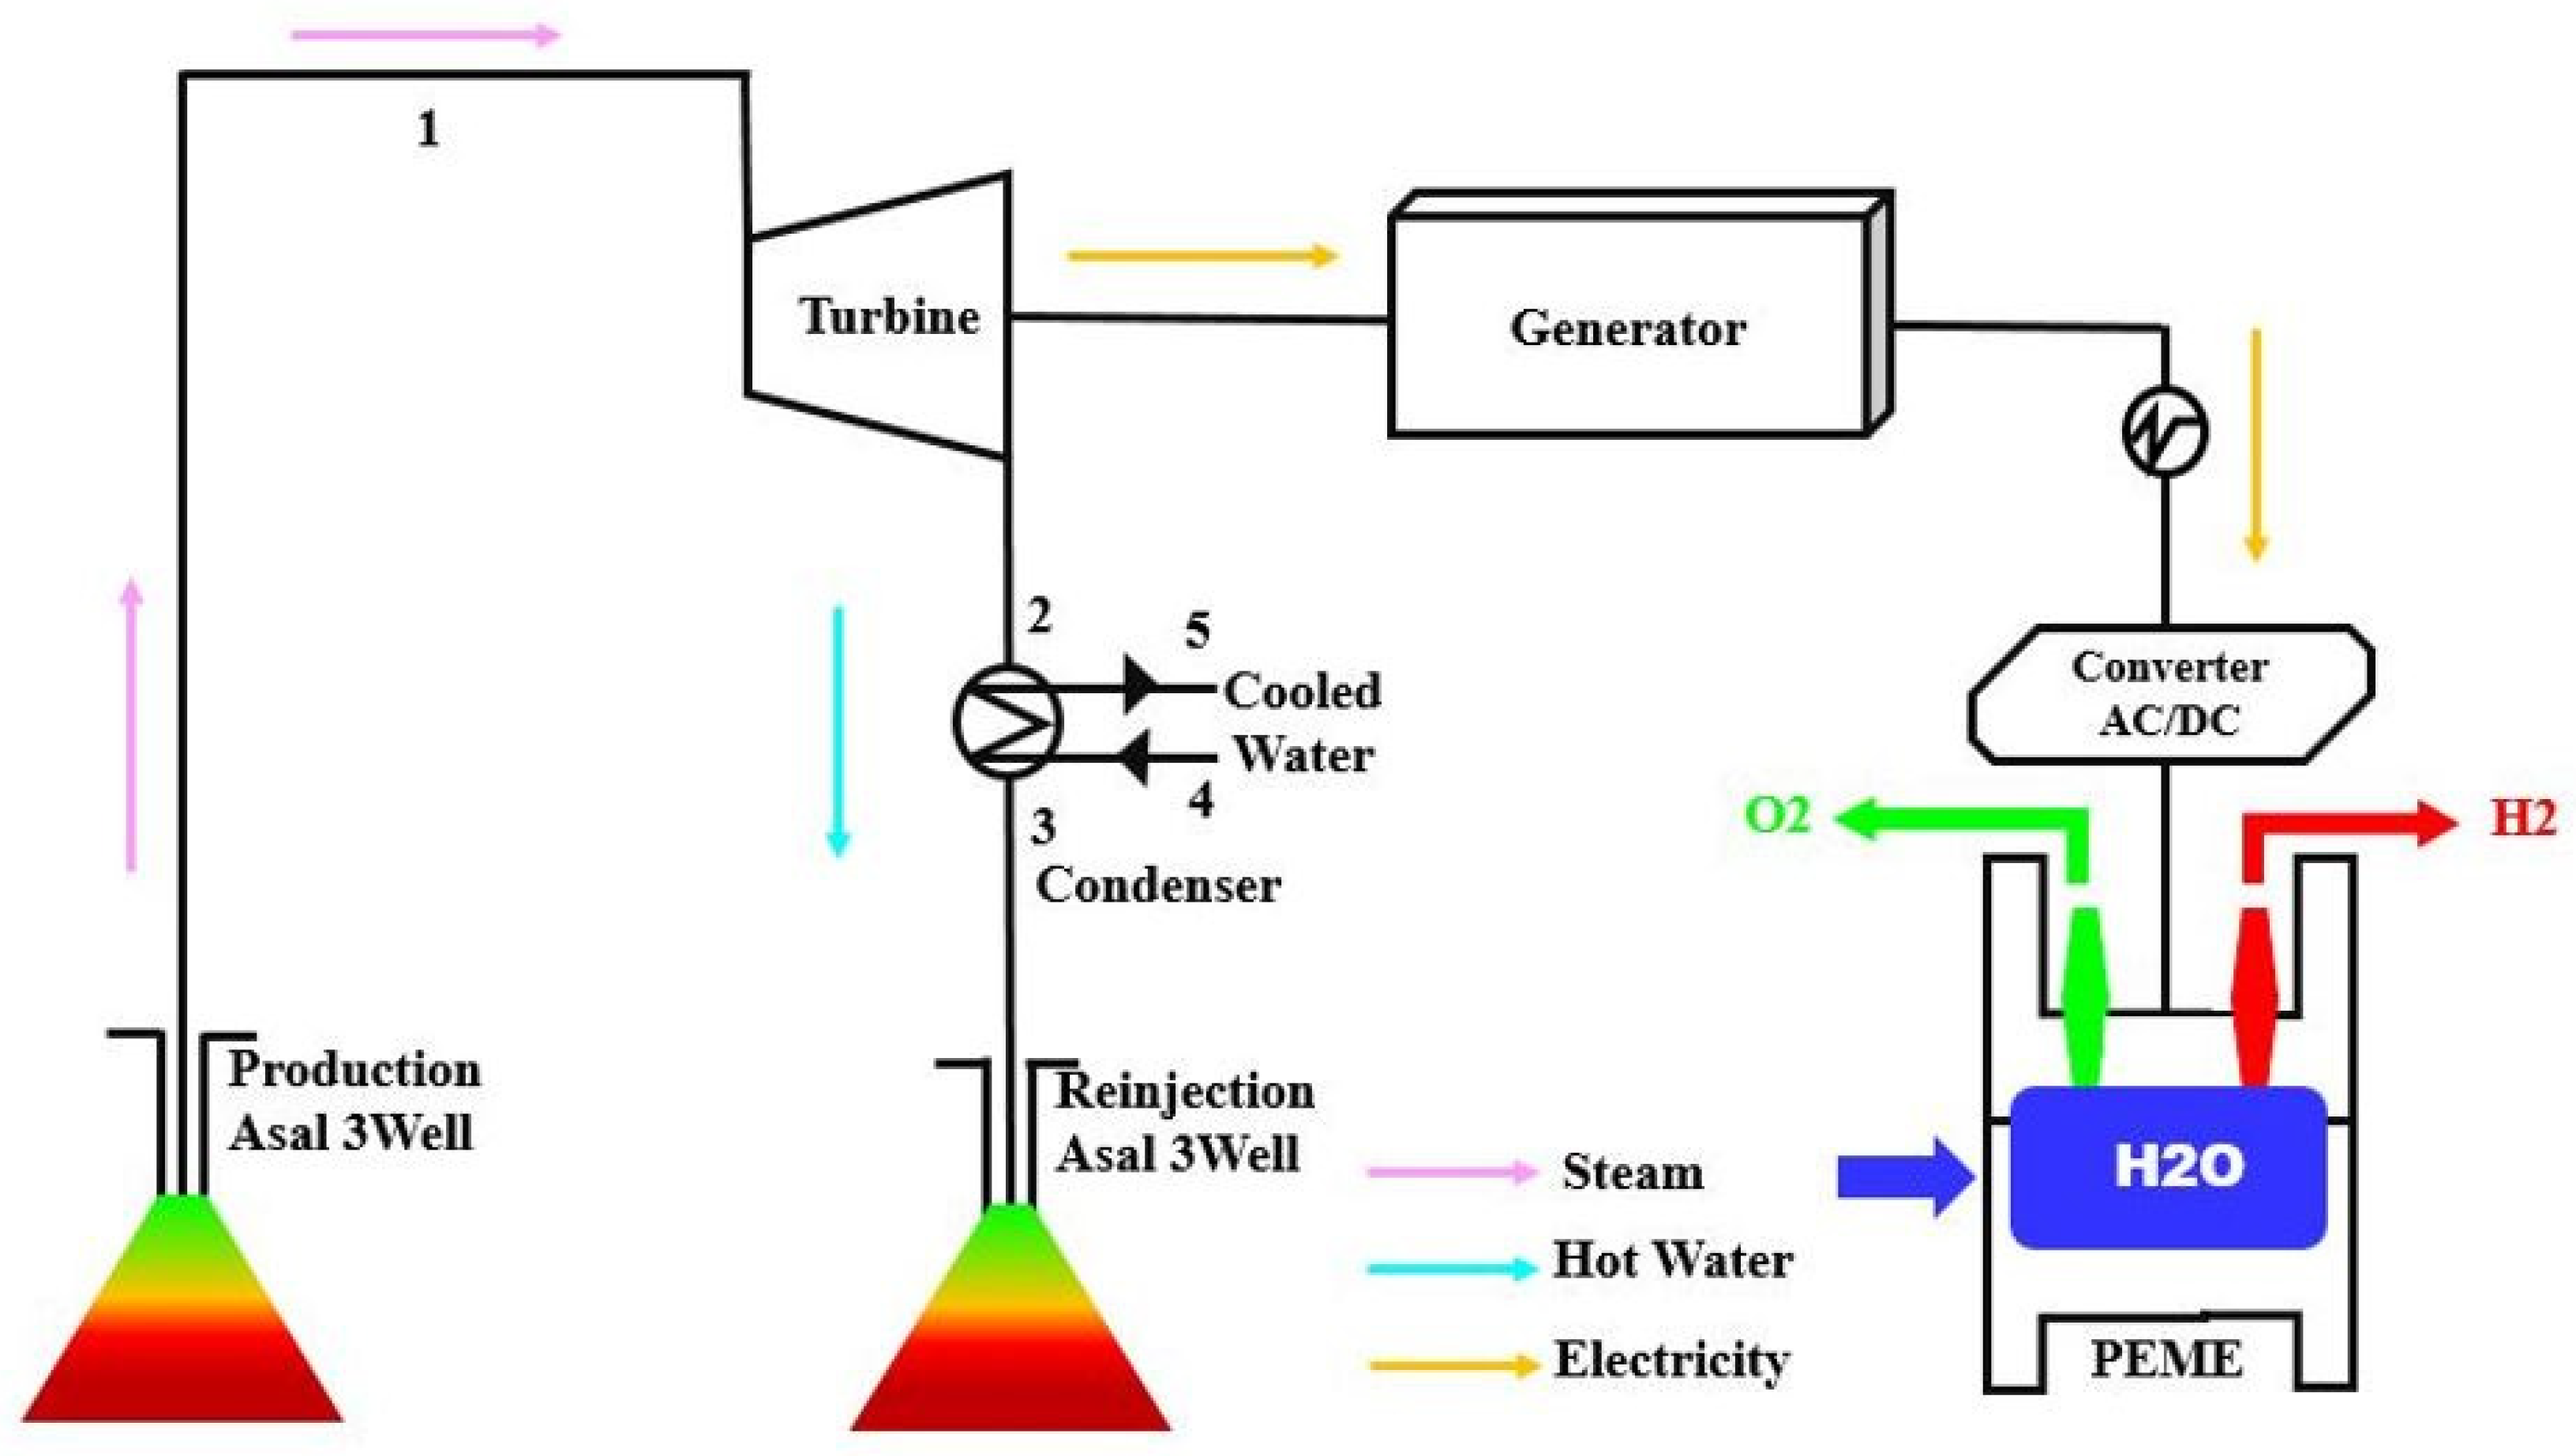
3.3.2. Hydrogen Production from Geothermal Energy

The thermodynamic evaluation of geothermal energy is a prerequisite for using this renewable energy in green hydrogen production. Therefore, both reversible and irreversible system operations were considered to evaluate the cost of hydrogen production. The maximum specific work that can be provided by a geothermal power plant, using a resource of a reference temperature T s in an environment whose temperature is T 0 is given by the following mathematical expression [49]:
W r e v ,   g e o = c ( T s T o ) T o c l n ( T s T o )  
Indeed, the geofluid in the reservoir is assumed to be an incompressible liquid. The minimum work required in (kJ/kg) for the electrolyzer in ideal (Equation (10)) and non-ideal (Equation (11)) operation can be expressed as follows [49]:
W r e v ,   e l e c t r o l y s i s = G e l e c t r o l y s i s ,   H 2 0 M H 2
W a c t ,   e l e c t r o l y s i s = W r e v , e l e c t r o l y s i s η e l e c t r o l y z e r
The amount of hydrogen produced per unit of geofluid is defined as the ratio of the work output from the geothermal plant to that of the electrolyzer. For reversible operations, it can be evaluated with the following equation [49]:
y p r o d , H 2 = m a s s   o f   H 2 p r o d u c e d   m a s s   o f   g e o t h e r m a l   w a t e r   u s e d = W r e v , g e o W r e v ,   e l e c t r o l y s i s

3.4. Economic Assessment of Wind Energy

To estimate and compare the viability of electricity generation based on wind technology, the most widely used economic indicator is the levelized costs of energy (LCOE) [50]. It is defined as the total investment cost required for one unit of electricity produced during a period. Thus, in the case of wind power, the following mathematical expression can be used to evaluate the cost assessment [51]:
L C O E = P V C E o u t =   C I ( 1 + C O & M [ ( 1 + I d ) t 1 I d ( 1 + I d ) t ] ) 8760 × P r × t × C f
CI = rated power (kw) × CAspec($/kW) × (1 + variable capital cost as a fraction)

3.5. Economic Evaluation of Geothermal Energy

The cost of geothermal electricity takes into account several factors, such as the cost of drilling and construction; annual operation and maintenance expenses; financial rates; the type of geothermal resource (steam or hot water); the productivity of the reservoir; the size and type of geothermal plant considered, etc. [52]. The levelized cost of electricity generated by geothermal energy can be calculated using the following formula [53,54]:
L C O E = t = 0 t = l i f e t i m e C S U , t   ( 1 + i ) t + C O & M , t ( 1 + i ) t + C f u e l ( 1 + i ) t t = 1 t = l i f e t i m e W ˙ n e t   N   L f   ( 1 + i ) t
C s u r f = 3300 × e x p ( 0.0031 ( W ˙ n e t 5 ) )
C o & m = 2.6 × e x p ( 0.002536 ( W ˙ n e t 5 ) )
However, in this study, the additional cost of capital investment for drilling and completion is taken into account and can be evaluated with the following equations [55,56]:
W D C = a × n × log ( d ) + b × n × d 2 + c
C W C = 1.72.10 e 8 × d 2 + 2.3.10 e 4 × d 0.62

3.6. Hydrogen Cost from Wind and Geothermal Energy

In order to compare and evaluate the economic viability of hydrogen production powered by wind or geothermal energy, LCOH is used. The LCOH of green hydrogen produced from wind energy can be estimated using the following mathematical equations [46]:
L C O H = C E l e c t r o l y z e r + C E l e c t r i c i t y M H 2   ·   T
C E l e c t r o l y z e r = C u · M H 2 x   E e l e c t r o l y z e r 8760   x   C f   x   η e l e c t r o l y z e r
C E l e c t r i c i t y = L C O E   x   i = 1 t E o u t t
The economic evaluation of hydrogen production from geothermal energy can be calculated as follows [57]:
c H 2   = E c + M O M + I c
E c = E e l e c t r o l y z e r . C E l e c t r i c i t y
M O M = 0.41 H 0.23
I c = 0.5 H 0.025
Two models of electrolyzer were considered for green hydrogen production from geothermal energy (i.e., PEME and HTE) and wind energy (i.e., PEME, AWE). The performance characteristics of the electrolyzers are given in Supplementary Table S1.

3.7. Energy and Exergy Analysis

Energy and exergy analyses are performed on the dry steam and single flash configuration systems (Figure 4 and Figure 5), considering the operating conditions presented in Supplementary Tables S2 and S3. Further, an average geothermal reservoir temperature and mass flow rate of 306 °C and 40 kg/s respectively were used in the thermodynamic modelling [58,59].

4. Results

4.1. Wind Energy

4.1.1. Wind Resource Analysis

We analyzed measured wind data collected at the Ghoubbet site. Temporal wind speed data were recorded for two years with 10-min intervals and preprocessed by converting them into hourly and monthly mean wind speeds at 80 m. A statistical analysis of the wind data was first performed, which predicted the energy output of a typical wind energy conversion. The wind potential characterization is based on the Weibull statistical distribution. Average wind speeds and wind characteristics are inferred from the temporal distribution of the study site. Four Weibull methods (i.e., moment method (MM), empirical methods of Jestus (EMJ), WAsP, and maximum likelihood method (MLM)) were used to predict the existing wind potential at the height of 80 m. The Weibull distribution and cumulative density function at the AG Rift are shown in Figure 6a,b.
Analysis of the distribution diagram reveals that the moment method (MM), empirical method of Jestus (EMJ), and maximum likelihood method (MLM) have the best accuracy in terms of the Weibull distribution compared to the WAsP Method (WM), which underestimates the wind distribution (Figure 6a). This difference is also noticed in the cumulative density function (Figure 6b), where the three methods are homogeneous compared to the WM values. Statistical tests of R2, RMSE, and MAE were also performed to strengthen this evaluation in respect of the quantitative approach. In our case, the values of the Weibull shape parameter (k) range from 2.65 to 2.96 at Asal–Ghoubbet at the height 80 m (Table 1). In our case, the Weibull shape parameter (k) values range from 2.65 to 2.96 at Asal–Ghoubbet at the height of 80 m (Table 1). The Weibull scale parameter (c) varies between 11.19 m/s and 11.25 m/s (Table 1). Indeed, the most accurate method is used to estimate the capacity factor of the Ghoubbet wind speed regime. The performance of the Weibull methods in Table 1 reveals that the moment method has the highest value of coefficient of determination (R2) and the lowest value of mean square error (RMSE) and mean absolute error (MAE). On this basis, the moment method is the most appropriate for estimating the Weibull parameter in Asal–Ghoubbet. The EMJ method presents satisfactory results to fit the wind speed observations at a level of 80 m at Asal–Ghoubbet (Table 1). On the other hand, the average wind speeds predicted by the four methods are about 10 m/s, indicating that the match to the measured data is very high (Supplementary Table S2).
The wind speed data at the height of 80 m were extrapolated from the wind data measured at the height of 60 m using the lowest power coefficient. The average annual power density is estimated to be about 904.45 W/m2 for an altitude of 80 m at the Ghoubbet location.
According to the power density classification established as [11]:
Fair (PD < 100 W/m2)
Fairly good (100 W/m2 ≤ PD < 300 W/m2)
Good (300 W/m2 ≤ PD < 700 W/m2)
Very good (PD ≥ 700 W/m2)
Wind direction analysis is essential for the planning of wind turbine installations. The frequencies of wind directions at 60 m during 2015 are presented in Supplementary Figure S2. The distribution of polar diagrams indicates that the East (90°) and South East (135°) sectors are the most reactive and have the highest wind frequencies. The average annual wind speed at Ghoubbet is estimated at 10 m/s (Supplementary Table S4).

4.1.2. Performance of Wind Turbine

Supplementary Table S5 shows the characteristics of the different wind turbine models considered in our study, ranging in capacity from 1 to 5 MW [60]. This allows for the selection of the most suitable turbine for the wind regime at the given site.
The performance of the wind turbine is evaluated in terms of capacity factors. Indeed, a turbine with a capacity factor (Cf) below the limit of 0.25 cannot be used for wind power generation. While a Cf value higher than 0.5 ensures a significant conversion of wind energy into electricity [61]. Therefore, the most suitable turbine has the highest possible Cf value. The annual energy production (Eout) and the Cf at 80 m hub height are reported in Supplementary Table S5. The annual wind energy production for the 42 wind turbines varies from 1677.45 MWh/year to 30,335.40 MWh/year, which depends on the wind turbine technology.

4.1.3. Cost Analysis for Wind Energy Generation

The economic evaluation is based on the selected wind turbine “Yinhe GX113-2.5MW” of 80 m height that best matches the wind regime for the Ghoubbet area. This turbine showed the most interesting capacity factor (0.8496) and annual electricity production (Table S5). Table 2 shows the economical parameters of a “Yinhe GX113-2.5MW” turbine with a capacity of 2.5 MW. The initial investment for such a turbine is estimated to be about $4,000,000 (i.e., an average specific cost of $1600 USD/kW is assumed). Installation costs, the cost of logistical transport of the equipment to the site, and other variable costs are estimated at 30% of the initial investment. The annual operation and maintenance cost (CO&M) is 25% [11]. The present value cost (PVC) of power generation from the “Yinhe GX113-2.5MW” turbine over 20 years is therefore estimated to be about US$15,640,958.47. The annual energy produced by the “Yinhe GX113-2.5MW” turbine is about 18,606.64 MWh/year. The cost of wind energy produced by the selected turbine in the Ghoubbet area is estimated at 0.042 USD per KWh (Table 2). The annual economic analysis of wind power generation is provided in Supplementary Table S6.

4.1.4. Hydrogen Production from Wind Energy

Wind energy can be easily coupled with an electrolyzer to produce green hydrogen from water splitting processes. Both the alkaline water electrolyzer (AWE) and the polymer membrane exchange electrolyzer (PEME) are commercially available in different sizes. Supplementary Table S1 shows three size classes (i.e., small, medium, and large) of these two types of electrolyzers. Furthermore, a converter with 90% efficiency was considered for the present study. The most suitable production capacity observed for the PEME electrolyzer is the medium sized one with a production of about 310.1 tons H2/year (Supplementary Table S7). Regarding the AWE electrolyzers, the large size was the most suitable with a production capacity of about 398.7 tons H2/year (Supplementary Table S7).
The total investment cost is related to the amount of hydrogen produced, which varies according to the available energy. The energy produced by the “Yinhe GX113-2.5MW” wind turbine could run three AWEl or 14 PEMEm electrolyzers. The capital costs for the three AWEl and 14 PEMEm electrolyzers are estimated to be $4,629,860 and $3,463,096, respectively (Table 3).

4.2. Geothermal Energy

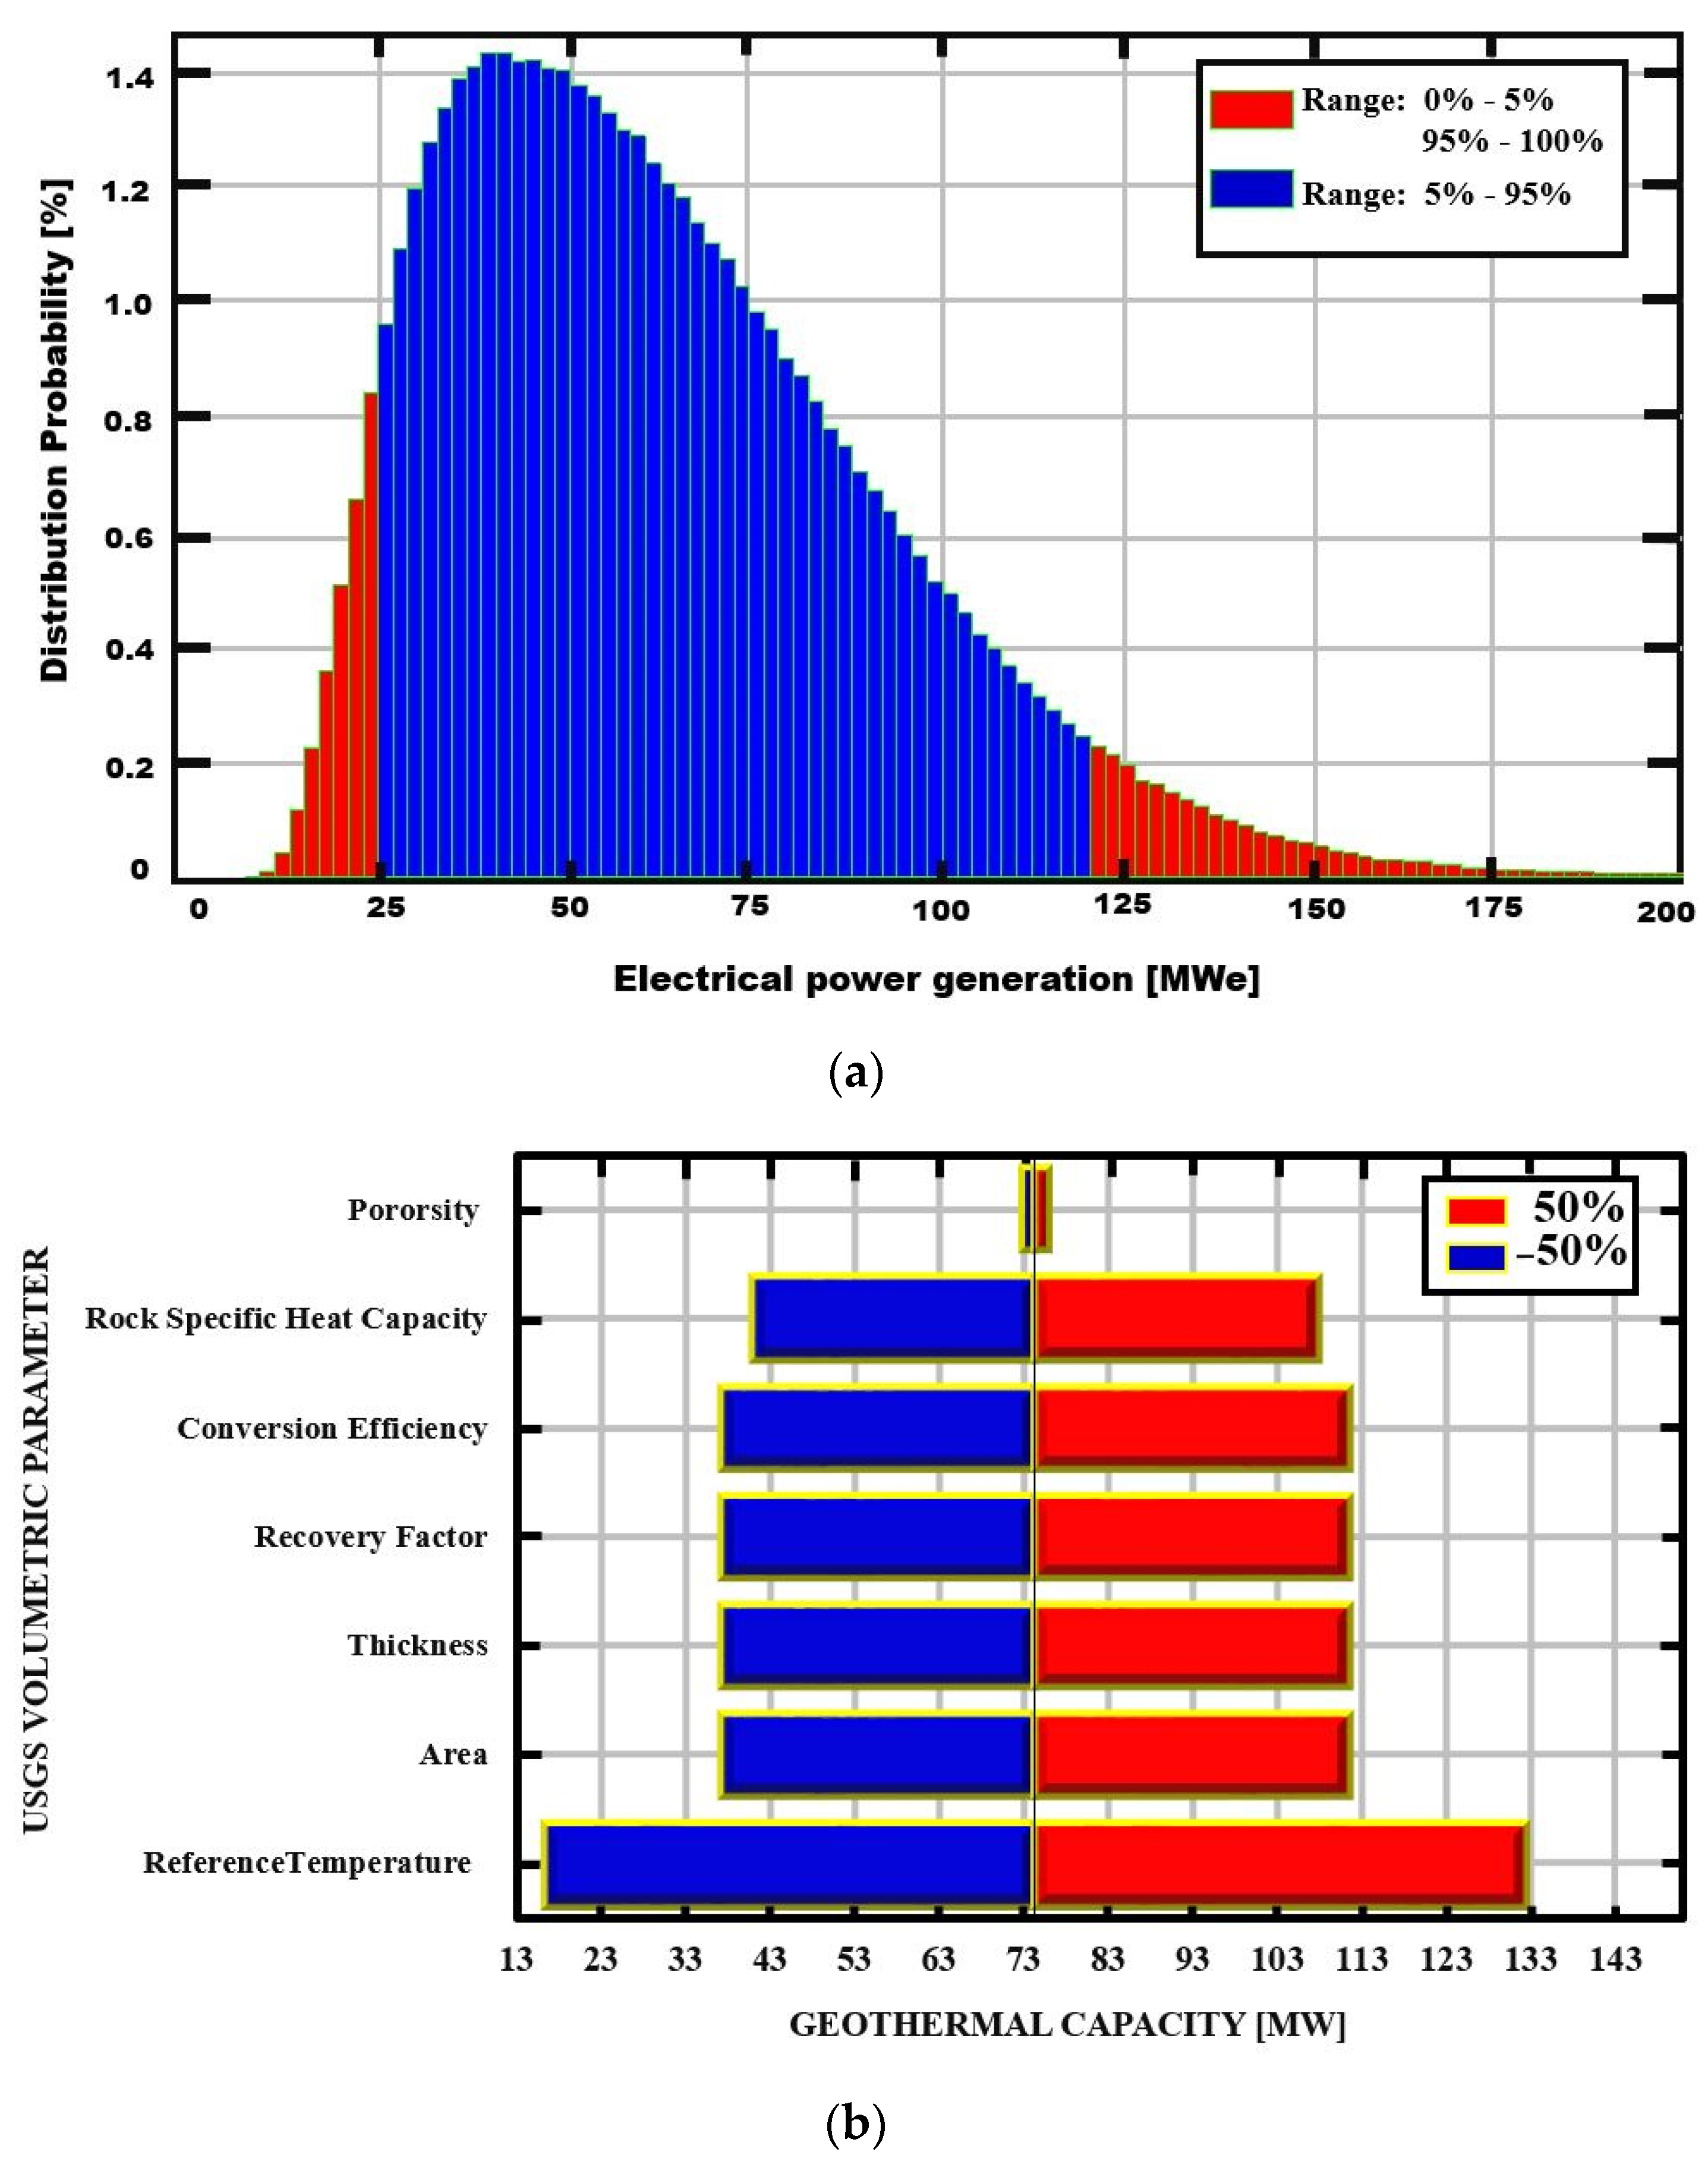
4.2.1. Electrical Power Analysis

Four geothermal wells were drilled in the AG Rift in the late 1980s [58]. However, some parameters were not reported for these geothermal wells to use the USGS volumetric method to estimate the geothermal energy of the AG Rift system. Therefore, the missing parameters were supplemented with data from geothermal areas with similarities to the AG Rift (Supplementary Table S8). The result of the USGS volumetric method show that the geothermal potential of Asal–Goubbet could contain potential energy of about 67.18 MWe.
Table 4 shows the result of the thermodynamic assessment of dry steam and a single flash cycle. Since the highest value of thermal, operating, and isentropic efficiencies is demonstrated by dry steam compared to single flash, the former system is therefore thermodynamically interesting compared to the performance of single flash (Table 4). Further, the thermodynamics calculation predicted 22.22 MW for dry steam and 4.9 MW for single flash, considering the geothermal reservoir’s preliminary mass flow and temperature conditions in the study area.

4.2.2. Thermoeconomic Analysis

Based on depth (e.g., 2500 m), the average cost of geothermal drilling at AG Rift is estimated to be approximately US$12,964,527 (Supplementary Tables S10 and S11). Indeed, this cost is similar to that of the geothermal drilling carried out within the framework of the Fiale project (Asal Region, Djibouti). The results of the economic analysis of the dry steam plant and the single flash plant are shown in Supplementary Tables S9 and S10. The average cost of a 22.22 MW dry steam geothermal power plant is estimated to be about US$3157.49/KW (Table S10), while the average cost of a 4.91 MW single flash geothermal power plant is estimated to be US$3294.20/KW (Supplementary Table S11). The electrical production cost of the dry steam and single flash geothermal power plant is estimated to be 8.66 $cents/KWh and 12.53 $cents/KWh, respectively (Supplementary Tables S9 and S10).

4.2.3. Hydrogen Production from Geothermal Energy

The economic analysis of two electrolyzers (i.e., PEMEm and HTE) coupled with dry steam and a single flash geothermal plant is performed. The thermodynamic analysis results show that with a temperature of 306 °C in the AG Rift geothermal reservoir and a dead state temperature of 25 °C, the maximum specific work is estimated to be about 362.05 kJ/kg of geothermal water (Table 5).

5. Discussion

5.1. Wind Energy

The analysis of the distribution diagram reveals that the moment method (MM), empirical method of Jestus (EMJ), and maximum likelihood method (MLM) have the best accuracy in terms of the Weibull distribution compared to the WAsP Method (WM), which underestimates the wind distribution (Figure 6a). This difference is also noticed in terms of the cumulative density function (Figure 6b), where the three methods are homogeneous compared to the WM values.
The performance of the Weibull methods in Table 1 reveals that the moment method has the highest value of the coefficient of determination (R2) and the lowest value of mean square error (RMSE) and mean absolute error (MAE). On this basis, the moment method is the most appropriate for estimating the Weibull parameter in Asal–Ghoubbet. The EMJ method presents satisfactory results to fit the wind speed observations at a level of 80 m at Asal–Ghoubbet (Table 1). On the other hand, the average wind speeds predicted by the four methods are about 10 m/s, indicating that the match to the measured data is very high (Supplementary Table S4).
In addition, the wind potential of Ghoubbet reveals a promising site for the installation of a large-scale wind farm for electricity and hydrogen production. Moreover, the power densities predicted by the four Weibull fitting methods are estimated to be 921.3745 W/m2, 912.1199 W/m2, 919.1252 W/m2, and 878.3873 W/m2, respectively, for the MM, the MLM, the EMJ, and the WM. Nevertheless, the average monthly wind power density depends on the season. It can be observed that for the season June–September, the power density is at its lowest (192 to 194 W/m2) for the year 2015 (Figure 7a) and can reach a wind speed below 5 m/s in several hours (Figure 7b). The performances of 42 wind turbines were analyzed in terms of energy production and capacity factors to allow for the selection of the turbine that best matches the wind regime of the given site. The calculated Cf of the 42 turbines ranges from 0.114 to 0.849 (Supplementary Table S5). The Yinhe GX113-2.5MW turbine with a height of 80 m was found to be the best turbine model with a Cf of 84.9% for Asal–Ghoubbet (Supplementary Table S5). The annual energy produced by the “Yinhe GX113-2.5MW” turbine is about 18,606.64 MWh/year. According to the result, the capacity factor is high when the values of cut-in speed, rated speed, and cut-out speed are low.
Therefore, the selected wind turbine was used to evaluate the economic feasibility of electricity generation and hydrogen production in the Asal–Ghoubbet area. The levelized cost of the electricity produced by this wind turbine in the Ghoubbet area is estimated at 0.042 USD per KWh (Table 2). The annual economic analysis of wind power generation is provided in Supplementary Table S6. An annual analysis of environmental issues related to wind power performance, including a degradation rate, is presented in Supplementary Table S14.
In order to compare the cost hydrogen produced using wind energy, two electrolyzer models (PEME and AWE) with different sizes were analyzed. The cost of hydrogen production from wind turbines ranges between 0.680 $/kg H2 and 7.187 $/kg H2, depending on the electrolyzer models and capacities (Supplementary Table S7). Furthermore, between the two suitable electrolyzers selected in this study, the PEMEm has a more attractive cost than the AWEl (Table 3, and Supplementary Table S7). The cost of hydrogen production was estimated to be 1.063 $/kg and 0.68 $/kg for AWEl and PEMEm electrolyzers, respectively (Table 3). Since the cost of green hydrogen can vary from 1.4 to 7.9 $/kg according to Ayodele and Munda, 2019 [20], our results would indicate the competitiveness of wind-generated green hydrogen at Asal–Ghoubbet Rift.

5.2. Geothermal Energy

The quantification of uncertainties in the probability distribution parameters can be dealt with quite well using the Monte Carlo simulation method (Figure 8, Supplementary Figures S4–S10). Thus, the low, best, and high estimates of AG Rift megawatts can be represented by the probability of P90, P50, and P10, which correspond to 28.385 MWe, 57.729 MWe, and 103.868 MWe, respectively (Supplementary Table S11). This result implies a preliminary assessment of the energy potential of 8.73 MWe/km2 for a maximum duration of 25 years. However, the prediction of the geothermal potential should be studied further with a more accurate assessment (Supplementary Table S11).
In order to assess the uncertainty of the volumetric parameters in the potential geothermal estimate of the Rift AG, it is useful to decipher the degree of influence of these parameters using the sensitivity analysis approach. Figure 8b shows the sensitivity of the AG Rift electric potential estimation for to the main parameters over a range of variation of ±50%. It can be noted that the degree of influence of these parameters on the geothermal potential is not the same. For example, when the area, thickness, recovery factor, conversion efficiency, and specific heat capacity parameters of the AG Rift rock separately increase by 50%, the total geothermal energy estimate increases from 74.33 MWe to 111.49 MWe. However, the porosity parameter does not directly influence the AG Rift geothermal energy estimate, whether it increases or decreases by 50% (Figure 8b). Further, an overall sensitivity analysis was performed using a ±10/60% increase and decrease in the mean value of the key parameters (Supplementary Figure S11).
In the Monte Carlo simulation, the most significant and positive correlation (0.73) with the geothermal energy potential of the AG rift is found to be with the recovery factor parameter (Figure S12). In other words, the higher the value of the recovery factor, the greater the geothermal potential of the AG Rift.
Thus, our result is very consistent with the LCOE proposed by Abdallah et al. [64]. Furthermore, assuming an average capacity of 2.5 MW per geothermal well at AG Rift, it should be noted that to maintain power generation at a constant level with a single flash plant, two additional 2.5 MW wells may be required for approximately eight years of service. While for a 22.22 MW dry steam plant, ten additional wells would have to be operational for three years of regular electricity production. Therefore, the total cost of 3–11 geothermal wells required to generate electricity for a single flash and a dry steam could be $38,893,581 and $142,609,797, respectively. It should also be noted that in our economic evaluation we have included the cost of drilling one well in the unit cost of electricity supplied by AG Rift’s dry steam and single expansion plant (Supplementary Tables S9 and S10).
Assuming a liquid inlet state of one atm and a saturated liquid, the reversible specific work provided by the PEMEm electrolyzer shows that 324.97 kg of geothermal water is required to produce 1 kg of hydrogen, whereas under non-ideal operation this could be as much as 526.45 kg of AG rift geothermal water. Moreover, we found that 253.72 kg of geothermal water using the HTE electrolyzer could produce 1 kg of hydrogen in the reversible case and can reach 296.61 kg for the non-ideal operation. Furthermore, the annual hydrogen production capacity varies from 451.51 tons H2/year to 6453.78 tons H2/year (Table 5). The annual O&M and yearly electrical cost for hydrogen production in different conditions (reversible and irreversible) are given in Supplementary Table S12.
The unit cost of hydrogen production ranges from $3.31/kg H2 to $8.16/kg H2 depending on the electrolyzer models/sizes (Table 5). Despite the high green hydrogen production capacity of the HTE electrolyzer relative to the PEME electrolyzer with the same energy input, it should be noted that the PEME is economically reliable, due to its 20-year life span [22,65]. At the same time, the operation life of the HTE electrolyzer is 10 years (Supplementary Table S1).

5.3. Overall Comparison

A comparative analysis is performed to evaluate the technical and economic aspects of hydrogen production with wind and geothermal energy (Table 6). In this study, wind power would produce 124.04 tons/MW/yr, while dry steam and single flash geothermal plants would produce 91.92 and 91.96 tons/MW/yr, respectively (Table 6). In addition, the fossil oil barrels saved by dry steam and single flash geothermal power plants would be about 4811.216 bbl/MW/yr and 4809.354 bbl/MW/yr, respectively (Table 6). On the other hand, wind power could save 4540.02 bbl/MW/year. An annual analysis of environmental issues related to wind power performance, including a degradation rate, is presented in Supplementary Table S14. In the present study, the cost of wind-generated electricity is $0.042/kWh. However, the cost of geothermal power in the study area is higher (i.e., $0.086/kWh for dry steam and $0.125/kWh for single flash), probably due to the higher capital cost. This is likely because the study area has a high available wind potential relative to geothermal potential. In other words, the limited data available for geothermal energy in the study area show the difficulties of exploiting this renewable energy, especially due to the very high salinity of the geothermal fluid, which leads to the clogging of geothermal wells [58].
The result of exergoenvironmental modelling showed that the impact index factors of a single flash and dry steam geothermal power plant are about 0.69 and 0.46, respectively (Supplementary Table S15). This indicates a better exergo-environmental performance of the system concerning its unusable waste exergy output and exergy destruction [66]. Furthermore, the improvement in the previous index is estimated to be 1.18 for the dry steam geothermal power plant, while it is 0.45 for a single flash geothermal power plant. This indicates that the dry steam geothermal power plant is more beneficial for the environment (Supplementary Table S15).
The cost of hydrogen production depends on the amount of hydrogen that renewable energy sources can produce. In this study, it is clear that the use of wind energy results in the lowest cost of hydrogen production ($0.672/kg) compared to the use of geothermal energy. Indeed, the greater amount of hydrogen produced by wind energy compared to geothermal energy, in this case, would probably explain the low cost of hydrogen produced by wind energy. On the other hand, it has been observed for the study area that the investment cost of wind energy seems to be lower than that of geothermal energy. The cost of hydrogen production is estimated to be about $5.80/kg H2 and $8.16/kg H2 for dry steam and simple flash, respectively.
Hydrogen production via electrolysis using renewable energy resources provides a sustainable and environmentally friendly energy solution. The result obtained in the present study is promising and shows that by using renewable energies, such as wind and geothermal energy, it is technically and economically feasible to produce green hydrogen at a low cost at the Asal–Ghoubbet site. However, further research is needed to simulate other green hydrogen production scenarios and to study the interface with other renewable energy sectors.

6. Conclusions

The wind speed potential in the Asal–Ghoubbet rift zone was evaluated with the Weibull distribution. A comparison of 42 wind turbines in the power range of 1–5 MW was conducted to assess their performance in adapting to the wind speed regime of Ghoubbet at 80 m height, as well as for the evaluation of unit costs of electricity produced. The Yinhe GX113-2.5MW wind turbine was found to be the most efficient in terms of energy production (18,606.6 MWh/year) and to have the lowest unit electricity cost ($0.042/KWh) for this site. PEMEm and AWEl electrolyzers could produce approximately 124.04 tons H2/MW/year and 159.48 tons H2/MW/year, respectively. The cost of producing hydrogen from a Yinhe GX113-2.5MW wind turbine was estimated to be $1.045/kg H2 and $0.672/kg H2 for the AWEl and PEMEm electrolyzers, respectively. In this case, wind energy can reduce emissions by 2061.6 tons CO2/MW/year, assuming no degradation of wind capacity.
The potential of the Asal geothermal reservoir was evaluated using the USGS volumetric method at 67.18 MWe. A dry steam plant and a single flash power plant were selected for electricity production from a geothermal resource. Thermodynamic and thermo-economic analyses were carried out to compare the performance of these two geothermal plants in order to select the most appropriate for the Asal geothermal site. The cost of electricity from geothermal energy is evaluated at $0.1253/KWh and $0.0867/KWh for a single flash and dry steam geothermal power plant, respectively. The combination of a single flash power plant with HTE and PEMEm electrolyzers resulted in a hydrogen production cost of $4.78/kg H2 and $8.16/kg H2, respectively. However, with the combination of dry steam with HTE and PEMEm electrolyzers, the hydrogen production cost is evaluated at approximately $3.46/kg H2 and $5.80/kg H2, respectively. In addition, dry steam and single flash power plants can save 2183.9 tons CO2/MW/year and 2184.8 tons CO2/MW/year, respectively.
The overall results show that the Asal–Ghoubbet Rift area can produce energy and green hydrogen at a low cost using wind energy compared to geothermal energy.

Supplementary Materials

The following are available online at https://www.mdpi.com/article/10.3390/en15010138/s1: Figure S1. A schematic geological map of the Republic of Djibouti (SE Afar Rift) and hydrothermal activity of the Republic of Djibouti. In the inset: schematic map of the Afar Depression with the location of Djibouti (black rectangle); Figure S2. Annual wind direction for Ghoubbet at level of 60 m of year 2015; Figure S3. Different equipment of RO, Guangzhou Kai Yuan Water Treatment Equipment Co. Ltd; Figure S4. Probability distribution of Monte Carlo simulation of Area of Asal-Ghoubbet Rift in m²; Figure S5. Probability distribution of Monte Carlo simulation of Thickness of Asal-Ghoubbet Rift; Figure S6. Probability distribution of Monte Carlo simulation of Recovery Factor of Asal-Ghoubbet Rift; Figure S7. Probability distribution of Monte Carlo simulation of Heat Specific of Rock of Asal-Ghoubbet Rift in J/kg°C; Figure S8. Probability distribution of Monte Carlo simulation of Reference Temperature of Asal-Ghoubbet Rift in °C; Figure S9. Probability distribution of Monte Carlo simulation of Load Factor of Asal-Ghoubbet Rift; Figure S10. Probability distribution of Monte Carlo simulation of Conversion efficiency of Asal-Ghoubbet Rift; Figure S11. Sensitivity diagram for volumetric parameters variation; Figure S12. Chart Correlation in Monte Carlo simulation; Table S1. Different size of water electrolysis model (0.4 to 800 Nm3/h); Table S2. Important parameters for the major stages of a single flash Power Plant; Table S3. Important parameters for the major stages of a dry steam power plant; Table S4. Statistics summary of wind speed at level of 80 m of Ghoubbet; Table S5. Characteristics of the different wind turbine models considered in this study and the calculated Annual energy production and the capacity factor; Table S6. Cost prospect of the wind-powered hydrogen production system in Ghoubbet without and with degradation rate; Table S7. Electrolyzer performance analysis using wind energy; Table S8. Most probable values and distributions for the parameters of USGS volumetric method for Asal-Ghoubbet Rift; Table S9. Result of thermoeconomics analysis of dry steam Asal power plant; Table S10. Result of thermoeconomics analysis of single flash Asal power plant; Table S11. Result of Monte Carlo simulation for potential capacity of Asal Well; Table S12. Result of economic analyses of green hydrogen production supply with the geothermal energy; Table S13. Energy efficiency of the wind-powered hydrogen production system in Ghoubbet without and with degradation rate; Table S14. CO2 and fuel oil avoided with Wind energy development; Table S15. Exergoenvironnment of dry steam and single flash power plant.

Author Contributions

Methodology, writing—original draft, review & editing, M.O.A.; software, validation, writing—original draft preparation, A.-B.A.; model formulations and software simulation, writing—original draft, review & editing, O.A.D.; methodology and results, supervision, and resources, M.J., M.M.A. and I.A.G. All authors have read and agreed to the published version of the manuscript.

Funding

The Djibouti Centre for Research and Studies (CERD in French) was funded this study.

Institutional Review Board Statement

Not applicable.

Informed Consent Statement

Not applicable.

Data Availability Statement

Not applicable.

Acknowledgments

The authors would like to thank the Djibouti Centre for Research and Studies (CERD in French) for financial support. We would like to thank Ali Ahmed from the University of Djibouti for proofreading the manuscript. We would also like to thank the three anonymous reviewers for their constructive comments that improved the manuscript.

Conflicts of Interest

The authors declare no conflict of interest.

Nomenclature

Variables
cSpecific heat of liquid water [kJ/kg K]
C Electrolyzer Capital cost of the electrolyzer wind system [$]
C Electricity Cost of wind electricity [$]
CfCapacity Factor [%]
CfuelCost of fuel [$]
CITotal investment cost of Wind Energy [$]
CH2Cost of hydrogen from geothermal energy [$]
CAspecAverage specific cost of wind turbine [$/KW]
CO&MCost operating and maintenance of Wind Turbine [$]
C SU , t Capital cost of geothermal power plant [$]
C u Unit cost of electrolyzer [$/kW]
C s u r f Cost of construction [$]
CWCCompletion well cost [$]
dWell Depth [m]
EcYearly cost of geothermal electricity [$]
EelectrolyzerElectricity required for 1 kg H2 [kWh/kgH2]
EoutWind electricity production [kWh]
GPPGeothermal power plant [MWe]
HHydrogen rate production [kg/s]
iDiscount rate [%]
IcCapital cost of electrolyser-Geothermal system [$]
IdInterest rate [%]
LCOELevelized cost of electricity [$/kWh]
LCOHLevelized cost of hydrogen [$/kWh]
LFLoad Factor [%]
M H 2 Molar mass of hydrogen [kg / kmol]
M H 2 Amount of hydrogen produced [kg]
MOMOperation and maintenance cost of electrolyser-Geothermal power plant system [$]
NPeriod of study [year]
PDPower Density [W/m2]
PVCPresent value cost [$]
PrRated power of wind turbine [KW]
tLife span of the commercial wind turbine [years]
TLife time of the commercial electrolyser [years]
TsReference temperature [°C]
T0Ambiant temperature [°C]
W a c t ,   e l e c t r o l y s i s Minimum work required for an electrolyzer in non-ideal operation [kj/kg]
WDCWell drilling cost [$]
W ˙ net Steam Turbine net power output [kW]
W rev ,   geo Maximum specific work [kj/kg]
W rev ,   electrolysis Minimum work required for an electrolyzer in ideal operation [kj/kg]
Greek symbols
α Shear coefficient
η electrolyzer Electrolyzer efficiency [%]
η conv Efficiency of rectifier [%]
G electrolysis ,   H 2 0 Change in the Gibbs function [kJ/kmol]
Subscripts
0Dead state
1,2,3State numbers, wind speed level
a,b,cDrilling Coefficients
geoGeothermal fluid
H2OFresh Water
H2Hydrogen gas
CO2Carbone Dioxide
lLarge
mMedium
nNumber of well
outOutput
revReversible
sSmall
Abbreviations
AG Asal-Ghoubbet
AWEAlkaline water electrolyzer
AWElLarge-size Alkaline water electrolyzer
AWEmMedium-size Alkaline water electrolyzer
AWEs small-size Alkaline water electrolyzer
BShSemiarid tropical steppe climate
BWhHot desert climate
CDFCumulative probability distribution function
EARSEast African Rift System
Eq.Equation
EMJEmpirical Method of Jestus
HTEHigh temperature electrolyzer
MAEMean Absolute Error
MLMMaximum Likelihood Method
MMMoment Method
O&MOperation and Maintenance
PDFProbability distribution function
PEMEPolymer electrolyte membrane electrolyzer
PEMElLarge-size Polymer electrolyte membrane electrolyzer
PEMEmMedium-size Polymer electrolyte membrane electrolyzer
PEMEsSmall-size Polymer electrolyte membrane electrolyzer
RMSERoot Mean Square Error
USGSUnited States Geological Survey
WMWasp Method

References

  1. Mlynarski, M.; Zlotnicki, J. Fluid circulation in the active emerged Asal-Ghoubbet Rif (east Africa, Djibouti) inferred from self-Potential and Telluric—Telluric Prospecting. Tectonophysics 2001, 339, 455–472. [Google Scholar] [CrossRef]
  2. Fouillac, A.M.; Fouillac, C.; Cesbron, F.; Pillard, F.; Legendre, O. Water-rock interaction between basalt and high-salinity fluids in the Asal-Ghoubbet Rif, Republic of Djibouti. Chem. Geol. 1989, 76, 271–289. [Google Scholar] [CrossRef]
  3. Aden, A.H.; Raymond, J.; Giroux, B.; Sanjuan, B. New Insights into Hydrothermal Fluid Circulation Affected by Regional Groundwater Flow in the Asal Rift, Republic of Djibouti. Energies 2021, 14, 1166. [Google Scholar] [CrossRef]
  4. D’Amore, F.; Giusti, D.; Abdallah, A. Geochemistry of the high-salinity geothermal field of Asal, Republic of Djibouti, Africa. Geothermics 1998, 27, 197–210. [Google Scholar] [CrossRef]
  5. Awaleh, M.O.; Hoch, F.B.; Boschetti, T.; Soubaneh, Y.D.; Egueh, N.M.; Elmi, S.A.; Jalludin, M.; Khaireh, M.A. The geothermal resources of the Republic of Djibouti—II: Geochemical study of the Lake Abhe geothermal field. J. Geochem. Explor. 2015, 159, 129–147. [Google Scholar] [CrossRef]
  6. Awaleh, M.O.; Boschetti, T.; Soubaneh, Y.D.; Baudron, P.; Kawalieh, A.D.; Dabar, O.A.; Ahmed, M.M.; Ahmed, S.I.; Daoud, M.A.; Egueh, N.M.; et al. Geochemical study of the Sakalol—Harralol geothermal field (Republic of Djibouti): Evidences of a low enthalpy aquifer between Manda-Inakir and Asal-Ghoubbet Rif settings. J. Volcanol. Geotherm. Res. 2017, 331, 26–52. [Google Scholar] [CrossRef]
  7. Awaleh, M.O.; Boschetti, T.; Soubaneh, Y.D.; Kim, Y.; Baudron, P.; Kawalieh, A.D.; Ahmed, M.M.; Daoud, M.A.; Dabar, O.A.; Kadieh, I.H.; et al. Geochemical, multi-isotopic studies and geothermal potential evaluation of the complex Djibouti volcanic aquifer (republic of Djibouti). Appl. Geochem. 2018, 97, 301–321. [Google Scholar] [CrossRef]
  8. Awaleh, M.O.; Boschetti, T.; Adaneh, A.E.; Daoud, M.A.; Ahmed, M.M.; Dabar, O.A.; Soubaneh, Y.D.; Kawalieh, A.D.; Kadieh, I.H. Hydrochemistry and multi isotope study of the waters from Hanlé-Gaggadé grabens (Republic of Djibouti, East African Rift System): A low-enthalpy geothermal resource from a transboundary aquifer. Geothermics 2020, 86, 101805. [Google Scholar] [CrossRef]
  9. Pillot, B.; Muselli, M.; Philippe Poggi, P.; Haurant, P.; Hared, I. Solar energy potential atlas for planning energy system off-grid electrification in the Republic of Djibouti. Energy Convers. Manag. 2013, 69, 131–147. [Google Scholar] [CrossRef] [Green Version]
  10. Daher, D.H.; Gaillard, L.; Amara, M.; Ménézo, C. Impact of tropical desert maritime climate on the performance of a PV grid-connected power plant. Renew. Energy 2018, 125, 729–737. [Google Scholar] [CrossRef]
  11. Assowe Dabar, O.; Awaleh, M.O.; Kirk-Davidoff, D.; Olauson, J.; Söder, L.; Awaleh, S.I. Wind resource assessment and economic analysis for electricity generation in three locations of the Republic of Djibouti. Energy 2019, 185, 884–894. [Google Scholar] [CrossRef]
  12. Assowe Dabar, O.; Camberlin, P.; Pohl, B.; Waberi, M.M.; Awaleh, M.O.; Silah-Eddine, S. Spatial and temporal variability of rainfall over the Republic of Djibouti from 1946 to 2017. Int. J. Climatol. 2021, 41, 2729–2748. [Google Scholar] [CrossRef]
  13. Elimax, H. Etude Strategique de Déploiement de L’énergie Eolienne en Afrique. Rapport Final; Canadian International Development Agency: Ottawa, ON, Canada, 2004. [Google Scholar]
  14. Aliyu, A.K.; Modu, B.; Tan, C.W. A review of renewable energy development in Africa: A focus in South Africa, Egypt and Nigeria. Renew. Sustain. Energy Rev. 2018, 8, 2502–2518. [Google Scholar] [CrossRef]
  15. Saidur, R.; Islam, M.R.; Rahim, N.A.; Solangi, K.H. A review on global wind energy policy. Renew. Sustain. Energy Rev. 2010, 14, 1744–1762. [Google Scholar] [CrossRef]
  16. Saeed, M.A.; Ahmed, Z.; Zhang, W. Wind energy potential and economic analysis with a comparison of different methods for determining the optimal distribution parameters. Renew. Energy 2020, 161, 1092–1109. [Google Scholar] [CrossRef]
  17. Soltani, M.; Mohammad Jabarifar, M.; Kashkooli, F.M.; Souri, M.; Rafiei, B.; Gharali, K.; Nathwani, J.S. Environmental, economic, and social impacts of geothermal energy systems. Renew. Sustain. Energy Rev. 2021, 140, 110750. [Google Scholar] [CrossRef]
  18. Mahmoud, M.; Ramadan, M.; Naher, S.; Pullen, K.; Abdelkareem, M.A.; Olabi, A.G. A review of geothermal energy-driven hydrogen production systems. Therm. Sci. Eng. Prog. 2021, 22, 100854. [Google Scholar] [CrossRef]
  19. Genç, M.S.; Çelik, M.; Karasu, I. A review on wind energy and wind–hydrogen production in Turkey: A case study of hydrogen production via electrolyzer system supplied by wind energy conversion system in Central Anatolian Turkey. Renew. Sustain. Energy Rev. 2012, 16, 6631–6646. [Google Scholar] [CrossRef]
  20. Short, W.; Blair, N.; Heimiller, D. Modeling the Market Potential of Hydrogen from Wind and Competing Sources; National Renewable Energy Lab: Golden, CO, USA, 2005.
  21. Kato, T.; Kubota, M.; Kobayashi, N.; Suzuoki, Y. Effective utilization of by-product oxygen from electrolyzer hydrogen production. Energy 2005, 30, 2580–2595. [Google Scholar] [CrossRef]
  22. Ayodele, T.R.; Munda, J.L. Potential and economic viability of green hydrogen production by water electrolyzer using wind energy resources in South Africa. Int. J. Hydrogen Energy 2019, 44, 17669–17687. [Google Scholar] [CrossRef]
  23. Cornell, A. Hydrogen production by electrolyzer. In Proceedings of the 1st International Conference on Electrolyzer, Copenhagen, Denmark, 13–15 June 2017; pp. 12–15. [Google Scholar]
  24. Ishaq, H.; Dincer, I. Comparative assessment of renewable energy-based hydrogen production methods. Renew. Sustain. Energy Rev. 2021, 135, 110192. [Google Scholar] [CrossRef]
  25. Al-Sharafi, A.; Sahin, A.Z.; Ayar, T.; Yilbas, B.S. Techno-economic analysis and optimization of solar and wind energy systems for power generation and hydrogen production in Saudi Arabia. Renew. Sustain. Energy Rev. 2017, 69, 33–49. [Google Scholar] [CrossRef]
  26. Mostafaeipour, A.; Dehshiri, S.J.H.; Dehshiri, S.S.H.; Jahangiri, M. Prioritization of potential locations for harnessing wind energy to produce hydrogen in Afghanistan. Int. J. Hydrogen Energy 2020, 45, 33169–33184. [Google Scholar] [CrossRef]
  27. Rahmouni, S.; Negrou, B.; Settou, N.; Dominguez, J.; Gouareh, A. Prospects of hydrogen production potential from renewable resources in Algeria. Int. J. Hydrogen Energy 2017, 42, 1383–1395. [Google Scholar] [CrossRef]
  28. Ghazvini, M.; Sadeghzadeh, M.; Ahmadi, M.H.; Moosavi, S.; Pourfayaz, F. Geothermal energy use in hydrogen production: A review. Int. J. Energy Res. 2019, 43, 7823–7851. [Google Scholar] [CrossRef]
  29. Rahmouni, S.; Settou, N.; Chennouf, N.; Negrou, B.; Houari, M. A technical, economic and environmental analysis of combining geothermal energy with carbon sequestration for hydrogen production. Energy Procedia 2014, 50, 263–269. [Google Scholar] [CrossRef] [Green Version]
  30. Yilmaz, C.; Kanoglu, M.; Abusoglu, A. Exergetic cost evaluation of hydrogen production powered by combined flash-binary geothermal power plant. Int. J. Hydrogen Energy 2015, 40, 14021–14030. [Google Scholar] [CrossRef]
  31. Yilmaz, C.; Koyuncu, I.; Alcin, M.; Tuna, M. Artificial Neural Networks based thermodynamic and economic analysis of a hydrogen production system assisted by geothermal energy on Field Programmable Gate Array. Int. J. Hydrogen Energy 2019, 44, 17443–17459. [Google Scholar] [CrossRef]
  32. Beck, H.E.; Zimmermann, N.E.; McVicar, T.R.; Vergopolan, N.; Berg, A.; Wood, E.F. Present and future Köppen-Geiger climate classification maps at 1-km resolution. Sci. Data 2018, 5, 180214. [Google Scholar] [CrossRef] [Green Version]
  33. Geiger, R. Klassifikation der klimate nachW. Köppen. Landolt-Börnstein– Zahlenwerte Und Funkt. Aust. Phys. Chem. Astron. Geophys. Technol. 1954, 3, 603–607. [Google Scholar]
  34. Manighetti, I.; Tapponnier, P.; Gillot, P.Y.; Jacques, E.; Courtillot, V.; Armijo, R.; Ruegg, J.C.; King, G. Propagation of rifting along the Arabia-Somalia plate boundary: Into Afar. J. Geophys. Res. 1998, 103, 4947–4974. [Google Scholar] [CrossRef]
  35. NRG Systems. 60m XHD NOW System. 2021. Available online: https://www.nrgsystems.com/products/complete-met-systems/wind-resource-assessment-systems/detail/34m-xhd-now-system/ (accessed on 27 January 2021).
  36. Mohammadi, K.; Mostafaeipour, A. Using different methods for comprehensive study of wind turbine utilization in Zarrineh, Iran. Energy Convers. Manag. 2013, 65, 463–470. [Google Scholar] [CrossRef]
  37. Akdag, S.A.; Dinler, A. A new method to estimate Weibull parameters for wind energy applications. Energy Convers. Manag. 2009, 50, 1761–1766. [Google Scholar] [CrossRef]
  38. Kwon, S.D. Uncertainty analysis of wind energy potential assessment. Appl. Energy 2010, 87, 856–865. [Google Scholar] [CrossRef]
  39. Ombeni, J.M. Performance evaluation of Weibull analytical methods using several empirical methods for predicting wind speed distribution. Energy Sources Part A Recovery Util. Environ. Eff. 2020. [Google Scholar] [CrossRef]
  40. Bahrami, A.; Teimourian, A.; Okoye, C.O.; Hiri, H. Technical and economic analysis of wind energy potential in Uzbekistan. J. Clean. Prod. 2019, 20, 801–814. [Google Scholar] [CrossRef]
  41. Mentis, D.; Hermann, S.; Howells, M.; Welsch, M.; Siyal, S.H. Assessing the technical wind energy potential in Africa a GIS-based approach. Renew. Energy 2015, 83, 110–125. [Google Scholar] [CrossRef]
  42. Abam, F.I.; Ohunakin, O.S. Economics of wind energy utilisation for water pumping and CO2 mitigation potential in Niger Delta, Nigeria. Int. J. Ambient Energy 2015, 38, 229–239. [Google Scholar] [CrossRef]
  43. Ahmed, A.S.; Hanitsch, R. Electricity generation and wind potential assessment at Hurghada, Egypt. Renew. Energy 2008, 33, 141–148. [Google Scholar] [CrossRef]
  44. Muffler, P.; Cataldi, R. Methods for regional assessment of geothermal resources. Geothermics 1978, 7, 53–89. [Google Scholar] [CrossRef] [Green Version]
  45. Ciriaco, A.E.; Zarrouk, S.J.; Zakeri, G. Geothermal resource and reserve assessment methodology: Overview, analysis and future directions. Renew. Sustain. Energy Rev. 2020, 119, 109515. [Google Scholar] [CrossRef]
  46. Rezaei, M.; Khozani, N.N.; Jafari, N. Wind energy utilization for hydrogen production in an underdeveloped country: An economic investigation. Renew. Energy 2019, 147, 1044–1057. [Google Scholar] [CrossRef]
  47. D’ Amore-Domenech, R.; Santiago, Ó.; Leo, T.J. Multicriteria analysis of seawater electrolyzer technologies for green hydrogen production at sea. Renew. Sustain. Energy Rev. 2020, 133, 110166. [Google Scholar] [CrossRef]
  48. Jónsson, V.K.; Gunnarsson, R.L.; Árnason, B.; Sigfússon, T.I. The feasibility of using geothermal energy in hydrogen production. Geothermics 1992, 21, 673–681. [Google Scholar] [CrossRef]
  49. Kanoglu, M.; Bolatturk, A.; Yilmaz, C. Thermodynamic analysis of models used in hydrogen production by geothermal energy. Int. J. Hydrogen Energy 2010, 35, 8783–8791. [Google Scholar] [CrossRef]
  50. Ueckerdt, F.; Hirth, L.; Luderer, G.; Edenhofer, O. System LCOE: What are the costs of variable renewables? Energy 2013, 63, 61–75. [Google Scholar] [CrossRef]
  51. Li, Y.; Wu, X.P.; Li, Q.S.; Tee, K.F. Assessment of onshore wind energy potential under different geographical climate conditions in China. Energy 2018, 152, 498–511. [Google Scholar] [CrossRef]
  52. Coskun, A.; Bolatturk, A.; Kanoglu, M. Thermodynamic and economic analysis and optimization of power cycles for a medium temperature geothermal resource. Energy Convers. Manag. 2014, 78, 39–49. [Google Scholar] [CrossRef]
  53. Sun, J.; Liu, Q.; Duan, Y. Effects of evaporator pinch point temperature difference on thermo-economic performance of geothermal organic Rankine cycle systems. Geothermics 2018, 75, 249–258. [Google Scholar] [CrossRef]
  54. Fallah, M.; Ghiasi, R.A.; Mokarram, N.H. A comprehensive comparison among different types of geothermal plants from exergy and thermoeconomic points of view. Therm. Sci. Eng. Prog. 2018, 5, 15–24. [Google Scholar] [CrossRef]
  55. Shamoushaki, M.; Fiaschi, D.; Manfrida, G.; Niknam, P.H.; Talluri, L. Feasibility study and economic analysis of geothermal well drilling. Int. J. Environ. Stud. 2021, 78, 1022–1036. [Google Scholar] [CrossRef]
  56. Lukawski, M.Z.; Anderson, B.J.; Augustine, C.; Capuano, L.E.; Beckers, K.F.; Livesay, B.; Tester, J.W. Cost analysis of oil, gas, and geothermal well drilling. J. Pet. Sci. Eng. 2014, 118, 1–14. [Google Scholar] [CrossRef]
  57. Yilmaz, C.; Kanoglu, M.; Bolatturk, A.; Gadalla, M. Economics of hydrogen production and liquefaction by geothermal energy. Int. J. Hydrogen Energy 2012, 37, 2058–2069. [Google Scholar] [CrossRef]
  58. Aquater. Djibouti Geothermal Exploration Project Republic of Djibouti: Final Report; Aquater: Djibouti, Republic of Djibouti, 1989; p. 159. [Google Scholar]
  59. Virkir-Orkint Consulting Group Ltd. Geothermal Scaling And corrosion Study, Final Report; Virkir-Orkint Consulting Group Ltd.: Reykjanik, Iceland, 1990. [Google Scholar]
  60. Lucas, B.; Silvio, M. The Big Portal for Wind Energy. Available online: https://en.wind-turbine-models.com/models (accessed on 25 July 2021).
  61. Ayodele, T.R.; Ogunjuyigbe, A.S.O.; Amusan, T.O. Wind power utilization assessment and economic analysis of wind turbines across fifteen locations in the six geographical zones of Nigeria. J. Clean. Prod. 2016, 129, 341–349. [Google Scholar] [CrossRef]
  62. Banque Centrale de Djibouti (BCD). Rapport Annuel. 2019. Available online: https://banque-centrale.dj/wp-content/uploads/2020/09/BCD-Rapport-Annuel-2019.pdf (accessed on 22 December 2021).
  63. Greiner, C.; Korpas, M.; Holen, A. A Norwegian case study on the production of hydrogen from wind power. Int. J. Hydrogen Energy 2007, 32, 1500–1507. [Google Scholar] [CrossRef]
  64. Abdallah, A.; Gandino, A.; Sommaruga, C. Technical-economic studies of geothermal projects: The Djibouti case. Geothermics 1985, 14, 327–334. [Google Scholar] [CrossRef]
  65. Motazedi, K.; Salkuyeh, Y.K.; Laurenzi, I.J.; MacLean, H.L.; Bergerson, J.A. Economic and environmental competitiveness of high temperature electrolyzer for hydrogen production. Int. J. Hydrogen Energy 2021, 46, 21274–21288. [Google Scholar] [CrossRef]
  66. Adebayo, V.; Abid, M.; Adedeji, M.; Hussain Ratlamwala, T.A. Energy, exergy and exergo-environmental impact assessment of a solid oxide fuel cell coupled with absorption chiller & cascaded closed loop ORC for multi-generation. Int. J. Hydrogen Energy 2021, in press. [Google Scholar]
Figure 1. Locations of the wind measurement towers with topographical elevation (The dashed lines show the Asal-Ghoubbet Rift).
Energies 15 00138 g001
Figure 2. Methodology schematic diagram.
Energies 15 00138 g002
Figure 3. Simplified diagram of the hydrogen production from wind and geothermal energy.
Energies 15 00138 g003
Figure 4. Schematic of the dry steam cycle with electrolyzer for Asal-Ghoubbet hydrogen production.
Energies 15 00138 g004
Figure 5. Schematic of the single flash cycle with electrolyzer for Asal-Ghoubbet hydrogen production.
Energies 15 00138 g005
Figure 6. (a) Annual 80 m wind speed Weibull distribution (PDF) and (b) cumulative distribution function (CDF) at level of 80 m for Ghoubbet.
Energies 15 00138 g006
Figure 7. (a) Monthly average wind speed and wind power density at Ghoubbet and (b) Hourly pattern available wind speed at 80 m.
Energies 15 00138 g007
Figure 8. (a) Probability distribution of Monte Carlo simulation and (b) Tornado diagram for sensitivity result of volumetric parameters.
Energies 15 00138 g008
Table 1. Result of Weibull parameters at level of 80 m of Ghoubbet.
Weibull Distribution ModelingParametersPerformance
Weibull Model
Wind Speed (m/s)
kc (m/s)R2RMSEMAEWavg (m/s)
Moment Method (MM)2.6811.250.905250.009840.0076710.00
WAsP Method (WM)2.9611.250.881310.011020.0083610.04
Empirical Method of Jestus (EMJ) 2.6911.250.905000.009860.0076910.00
Maximum Likelihood Method (MLM)2.6511.190.899320.010150.007809.947
Table 2. Unit cost of electricity generated by Turbine “Yinhe GX113-2.5MW”.
ParametersUnitsValues of Turbine T25
Specific cost of wind turbineUS$/KW1600 a
Life timeYear20 b
Initial investment costUS$4,000,000
Variable capital cost (30%)%1,200,000 c
Total investment costUS$5,200,000
Interest rate of Djibouti%0.1087 d
Discount rate of Djibouti%0.125 e
Operation & Maint. Cost (25%)%1,300,000 f
Capacity factor of Turbine%84.96
Energy output of TurbineKWh/yr18,606,641.39
Present Value CostUS$15,640,958.47
LCOEUS$/KWh0.04203
a,b,c,f [11], d,e [62].
Table 3. Unit cost of hydrogen produced from wind energy.
ParameterUnitValue of AWELValue of PEMEm
Rated power KW1000 1185 2
Specific cost of electrolyzer US$/KW1547 1900 2
Unit cost of electrolyserUS$1,547,000166,500
Capital investment cost US$4,629,8603,463,096
Installation cost of electrolyzerUS$185,64019,980
Stack replacement costUS$618,80066,600
Operation & Maintenance costUS$61,8806660
Specific cost of converterUS$/KW155 1155 1
Investment of converterUS$154,70028,619.5
Operation & Maintenance cost of converterUS$61881145
Total investment cost electrolyzer US$5,817,956.493,615,864.87
Cost of electricityUS$782,047.92782,047.92
Interest rate%10.87 310.87 3
Unit cost of hydrogenUS$/kg1.0450.672
1 [63] 2 [22] 3 [62].
Table 4. Thermodynamic result of dry steam and single flash cycle.
Geothermal Power Plant Dry Steam
Power Plant
Single Flash
Power Plant
Output power (MW)22.224.91
Exergy destruction (MW)18.8310.81
First law efficiency (%)21.579.68
Second law efficiency (%)54.1331.24
Isentropic efficiency (%)76.3867.91
Table 5. Result of green hydrogen production supply with the geothermal energy analysis.
Thermodynamic
Operation
Electrolyser Coupled with Geothermal Power PlantMaximum Work Requirement
(kJ/kg)
Minimum Work Requirement
(kJ/kg)
Minimum Work Input
(kWh/kg)
H2 Produced (Tons/Year)LCOH
($/kg)
Reversible caseSingle flash-PEMEm362.05117,65132.68731.445.51
Dry steam-PEMEm362.05117,65132.683308.833.97
Single flash-HTE362.0591,85825.521426.664.56
Dry steam-HTE362.0591,85825.526453.783.31
Irreversible caseSingle flash-PEMEm362.05190,60252.95451.518.16
Dry steam-PEMEm362.05190,60252.952042.495.80
Single flash-HTE362.0597,72127.141341.064.78
Dry steam-HTE 362.0597,72127.146066.563.46
Table 6. Comparative analysis of hydrogen production from wind and geothermal energy using PEME electrolyzer.
UnitWind TurbineDry Steam *
Power Plant
Single Flash * Power Plant
Rated powerMW2.522.224.91
Energy outputMWh/year18,606.6175,186.638726.3
Hydrogen produced Tons/MW/year124.0491.92 91.96
CO2 avoidedTons/MW/year2061.62183.92184.8
Fuel oil savedbbl/MW/year4540.024809.3544811.216
Energy cost$/kWh0.0420.0860.125
Hydrogen cost$/kg0.6725.80 8.16
* Irreversible operation case.
Publisher’s Note: MDPI stays neutral with regard to jurisdictional claims in published maps and institutional affiliations.

