
The Comparison of Solar-Powered Hydrogen Closed-Cycle System Capacities for Selected Locations

 , ,
, ,
Abstract
:1. Introduction
- -
- To simulate the hybrid photovoltaic-hydrogen power plant (PV-H PP) and determine the number of PV panels in the array for different locations using the Matlab/Simulink package.
- -
- To determine the volume of hydrogen storage tank assuming the same 1 kW constant consumption in each location.
2. Methods and Approaches
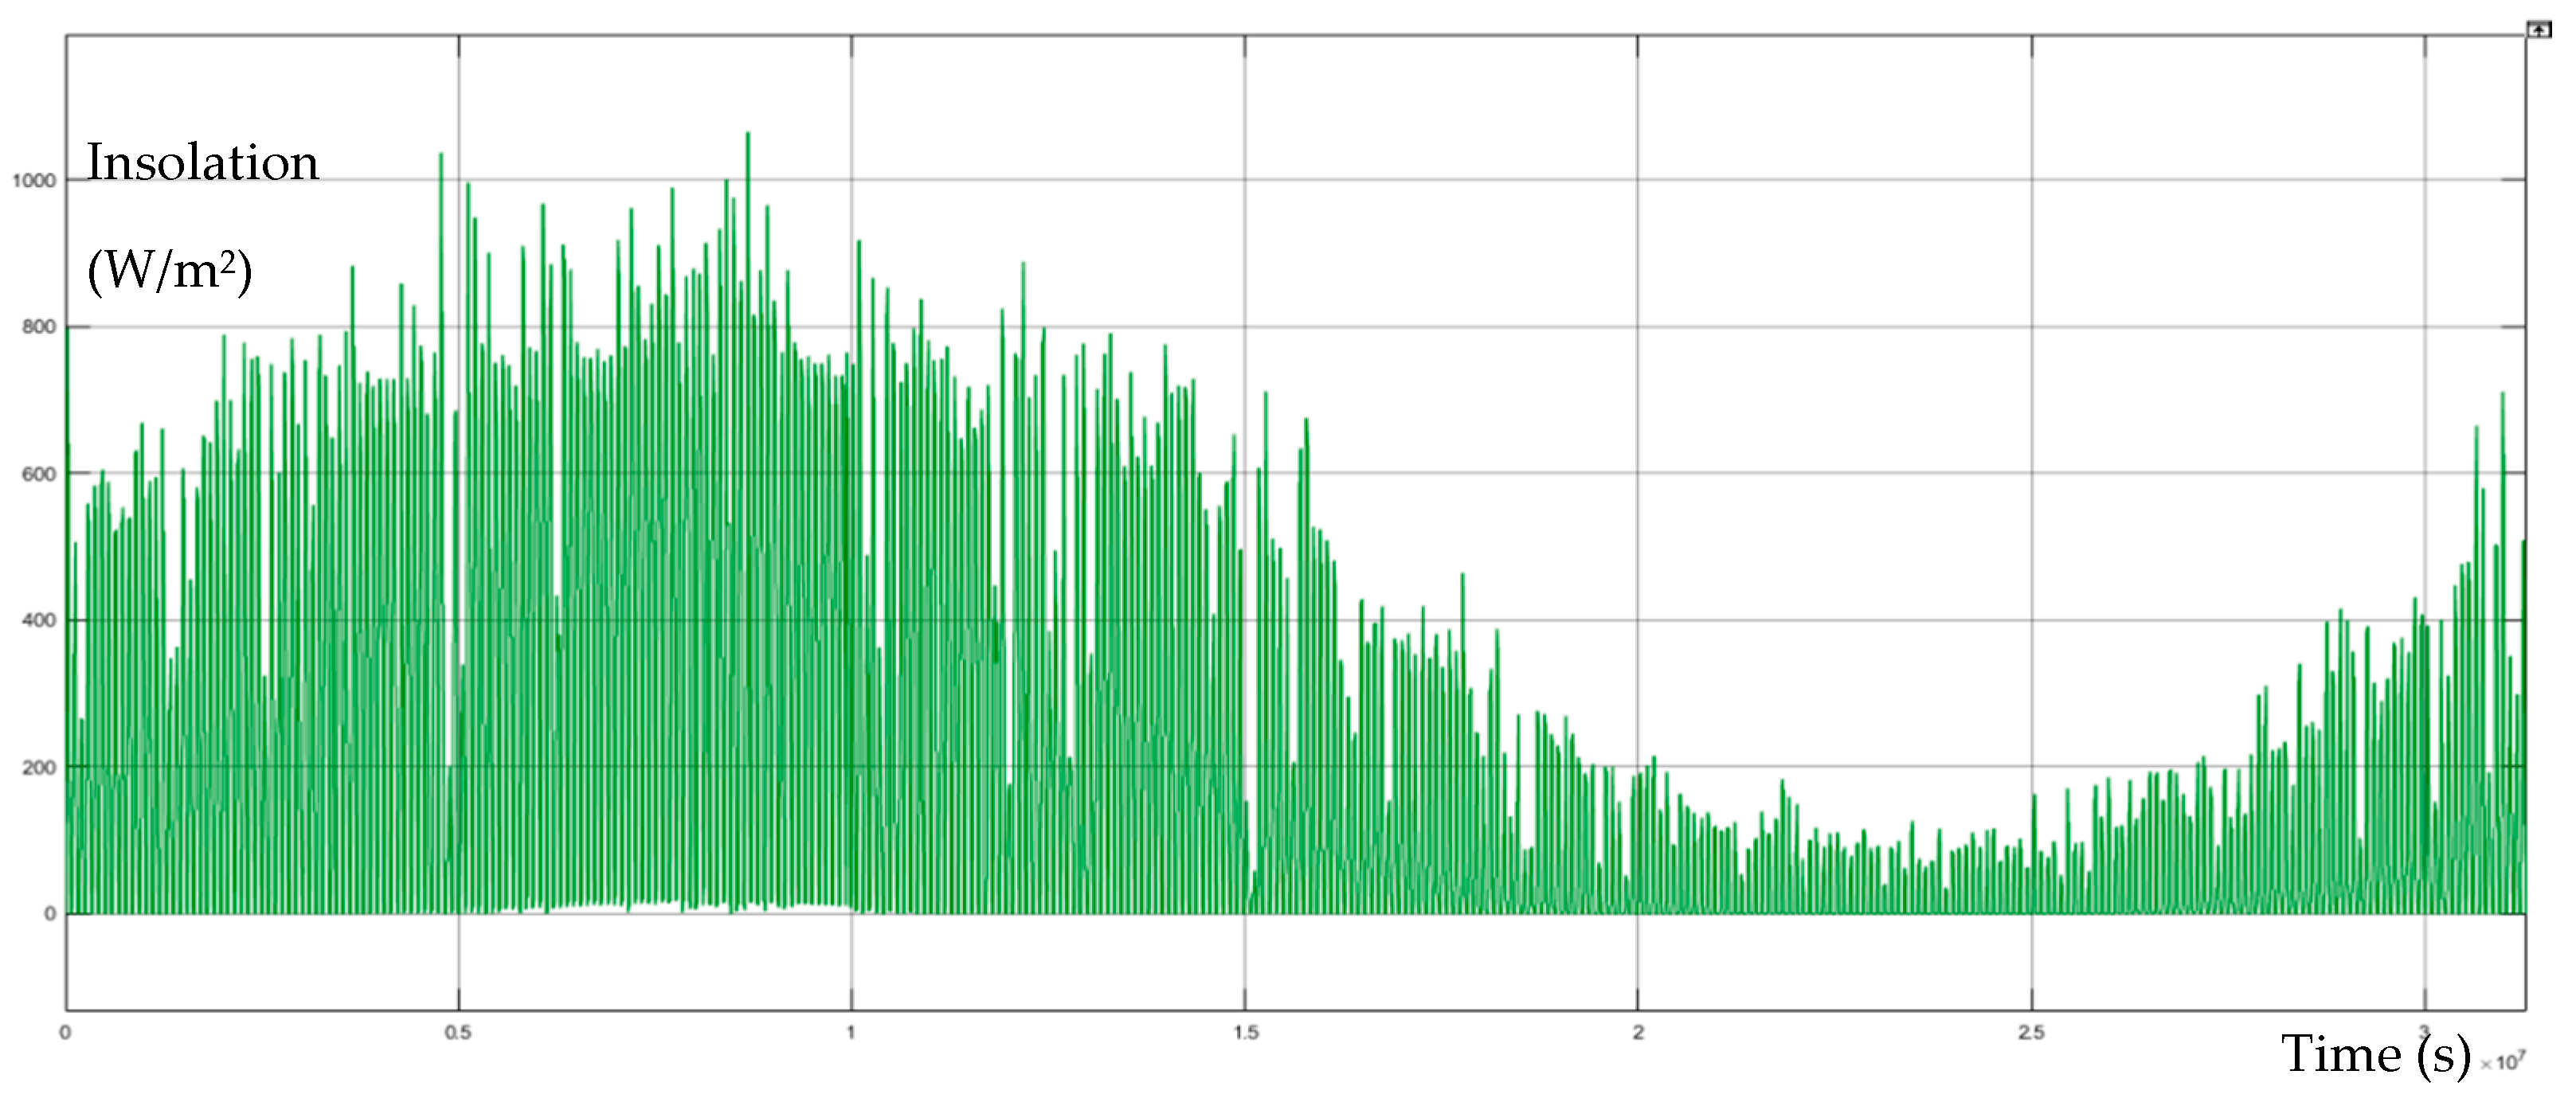
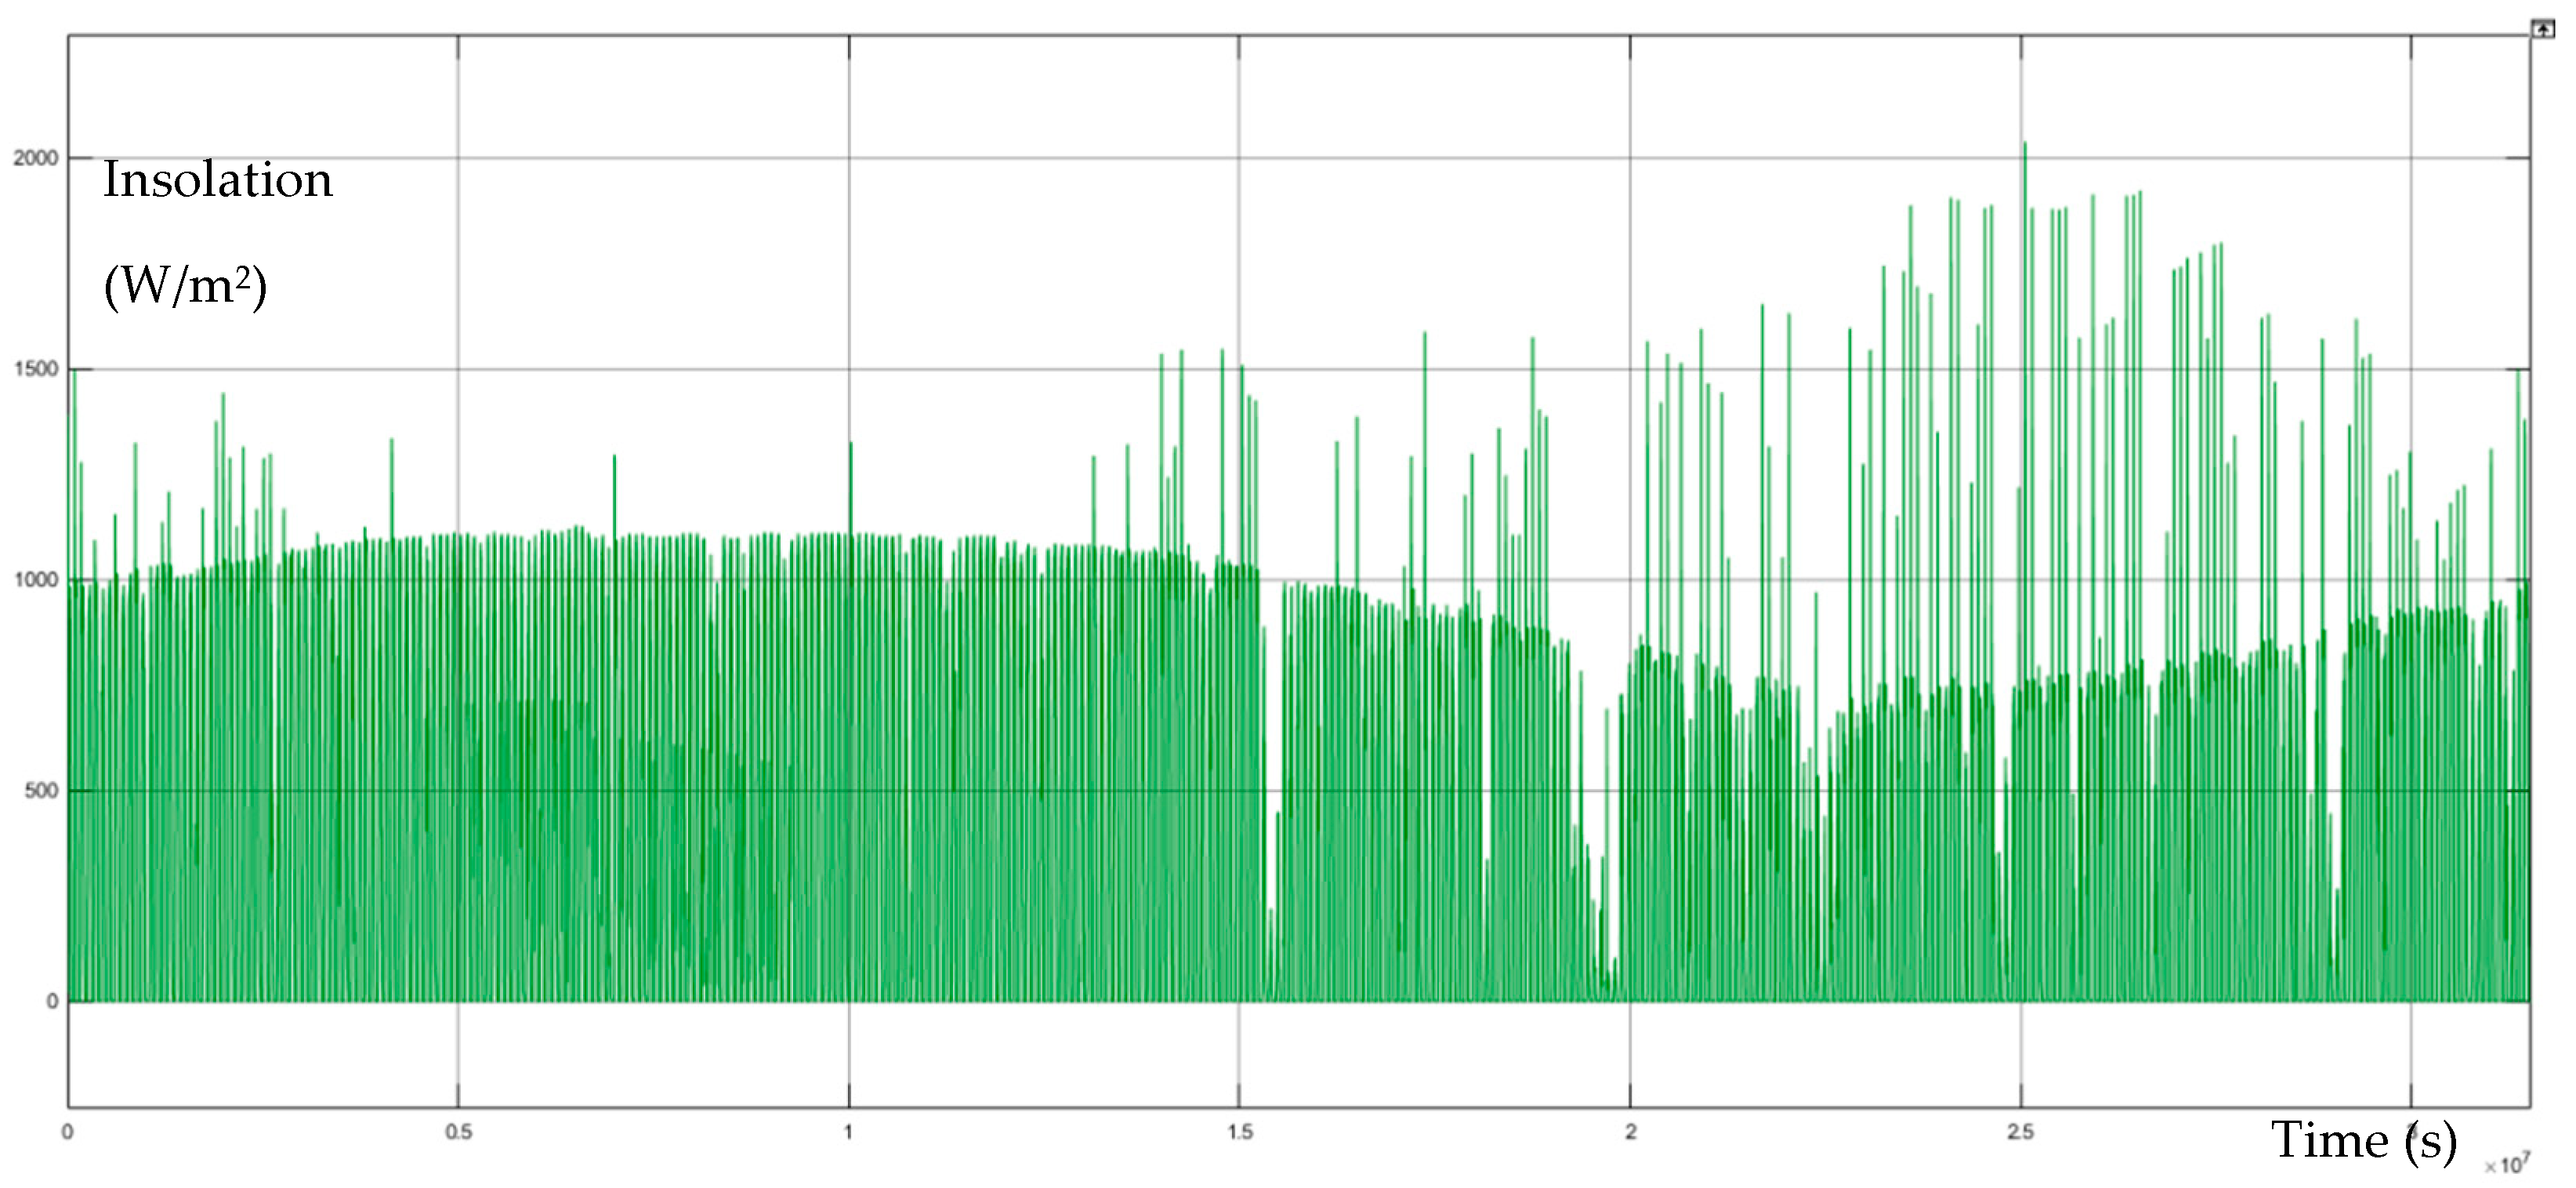
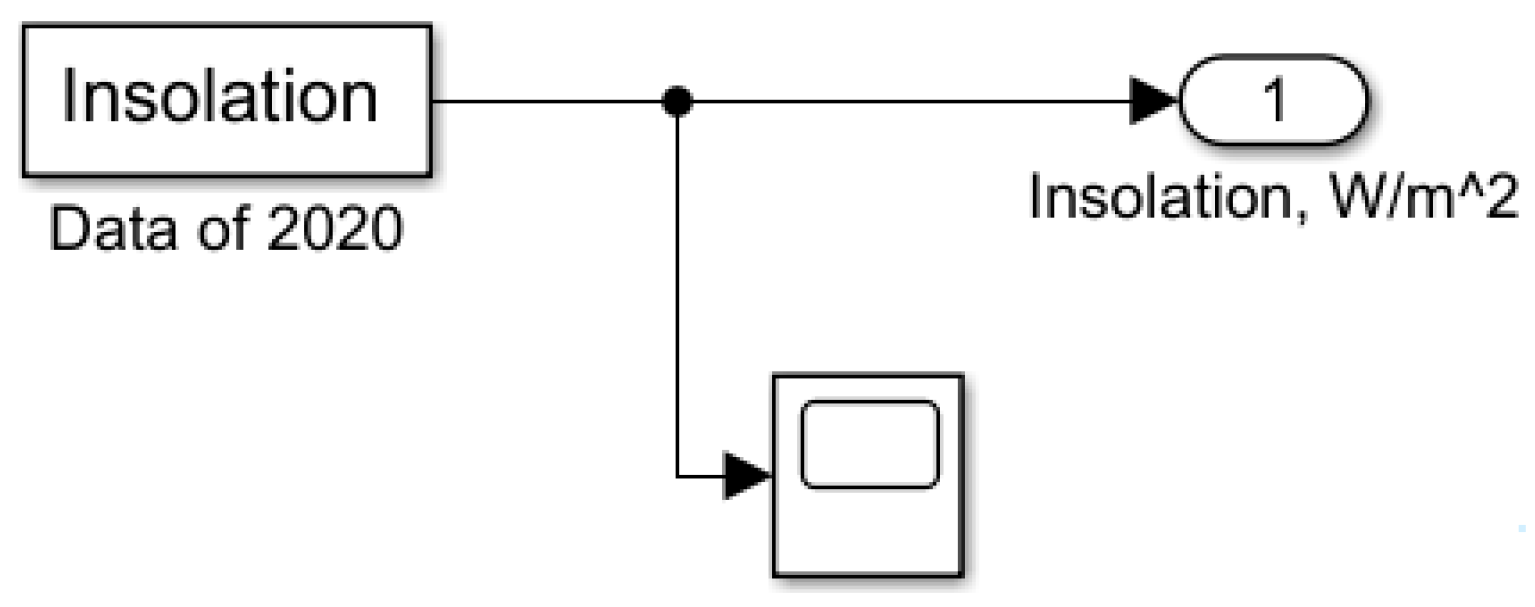
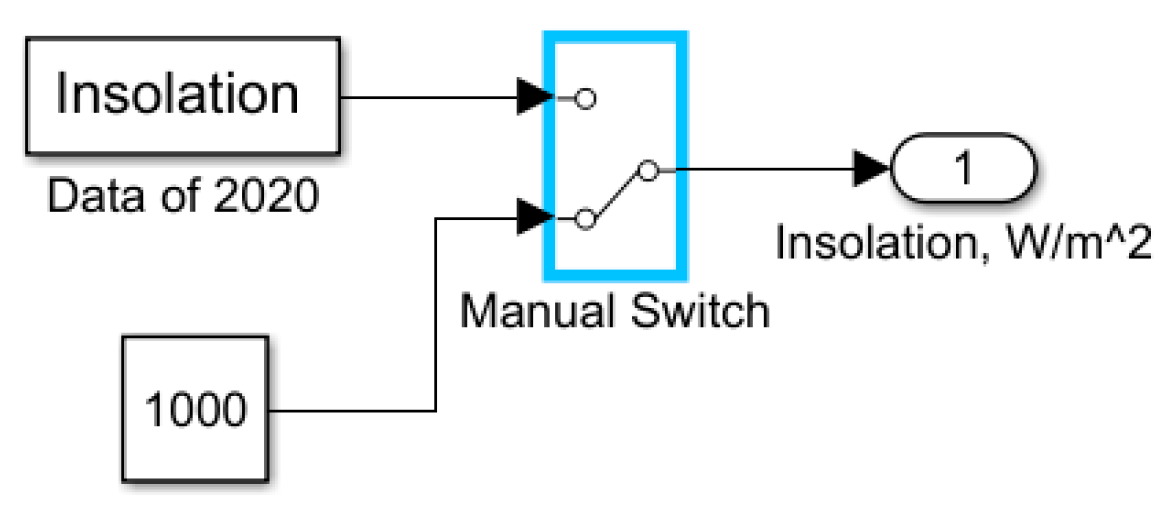
2.1. Insolation Measurements
2.1.1. Insolation Data for Chelyabinsk, Russia
2.1.2. Insolation Data for Manipal, India
2.1.3. Insolation Data for Gnaraloo, Australia
2.2. The Equipment Parameters Used in the Simulation
2.2.1. Consumer
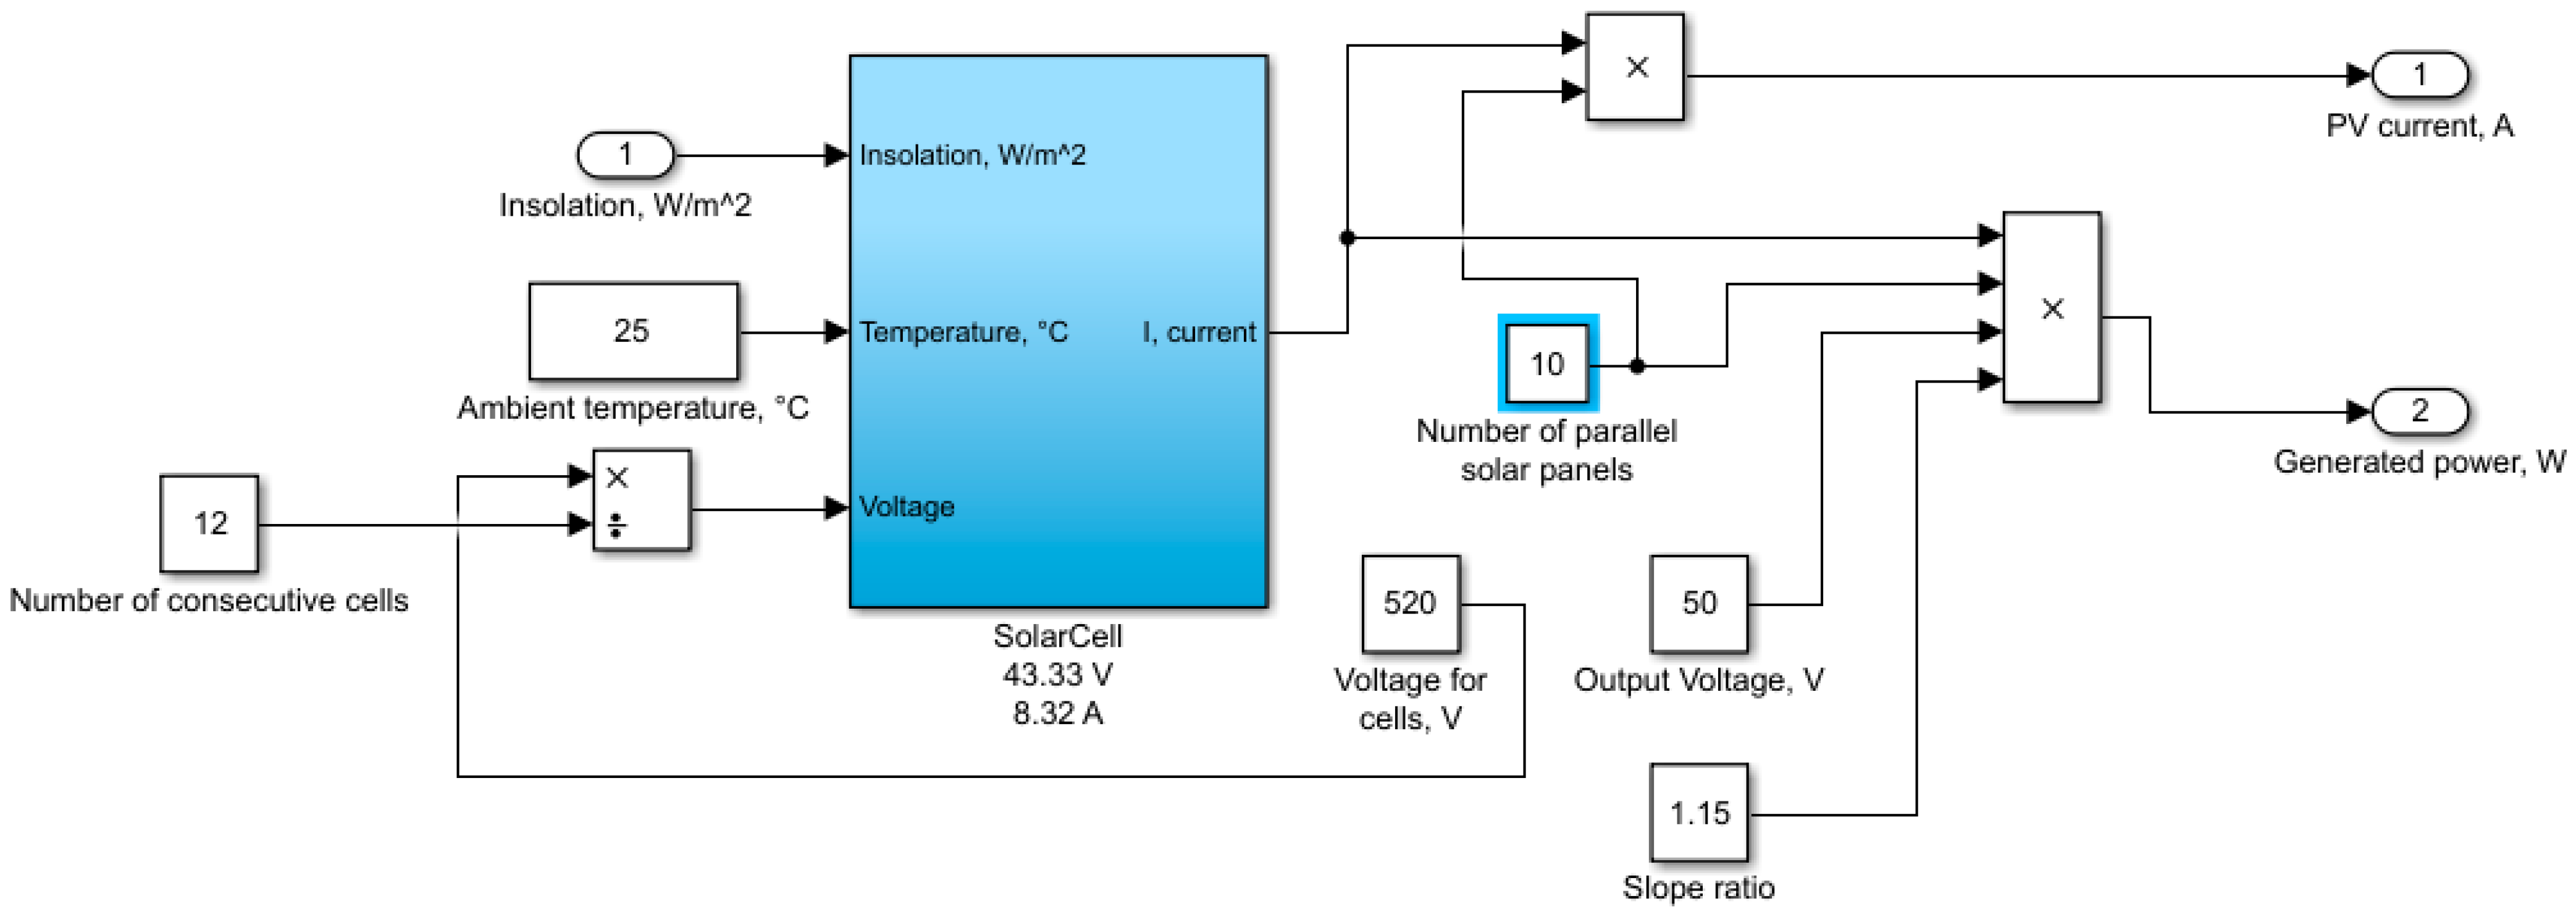
2.2.2. Solar Module Array
2.2.3. Electrolyzer
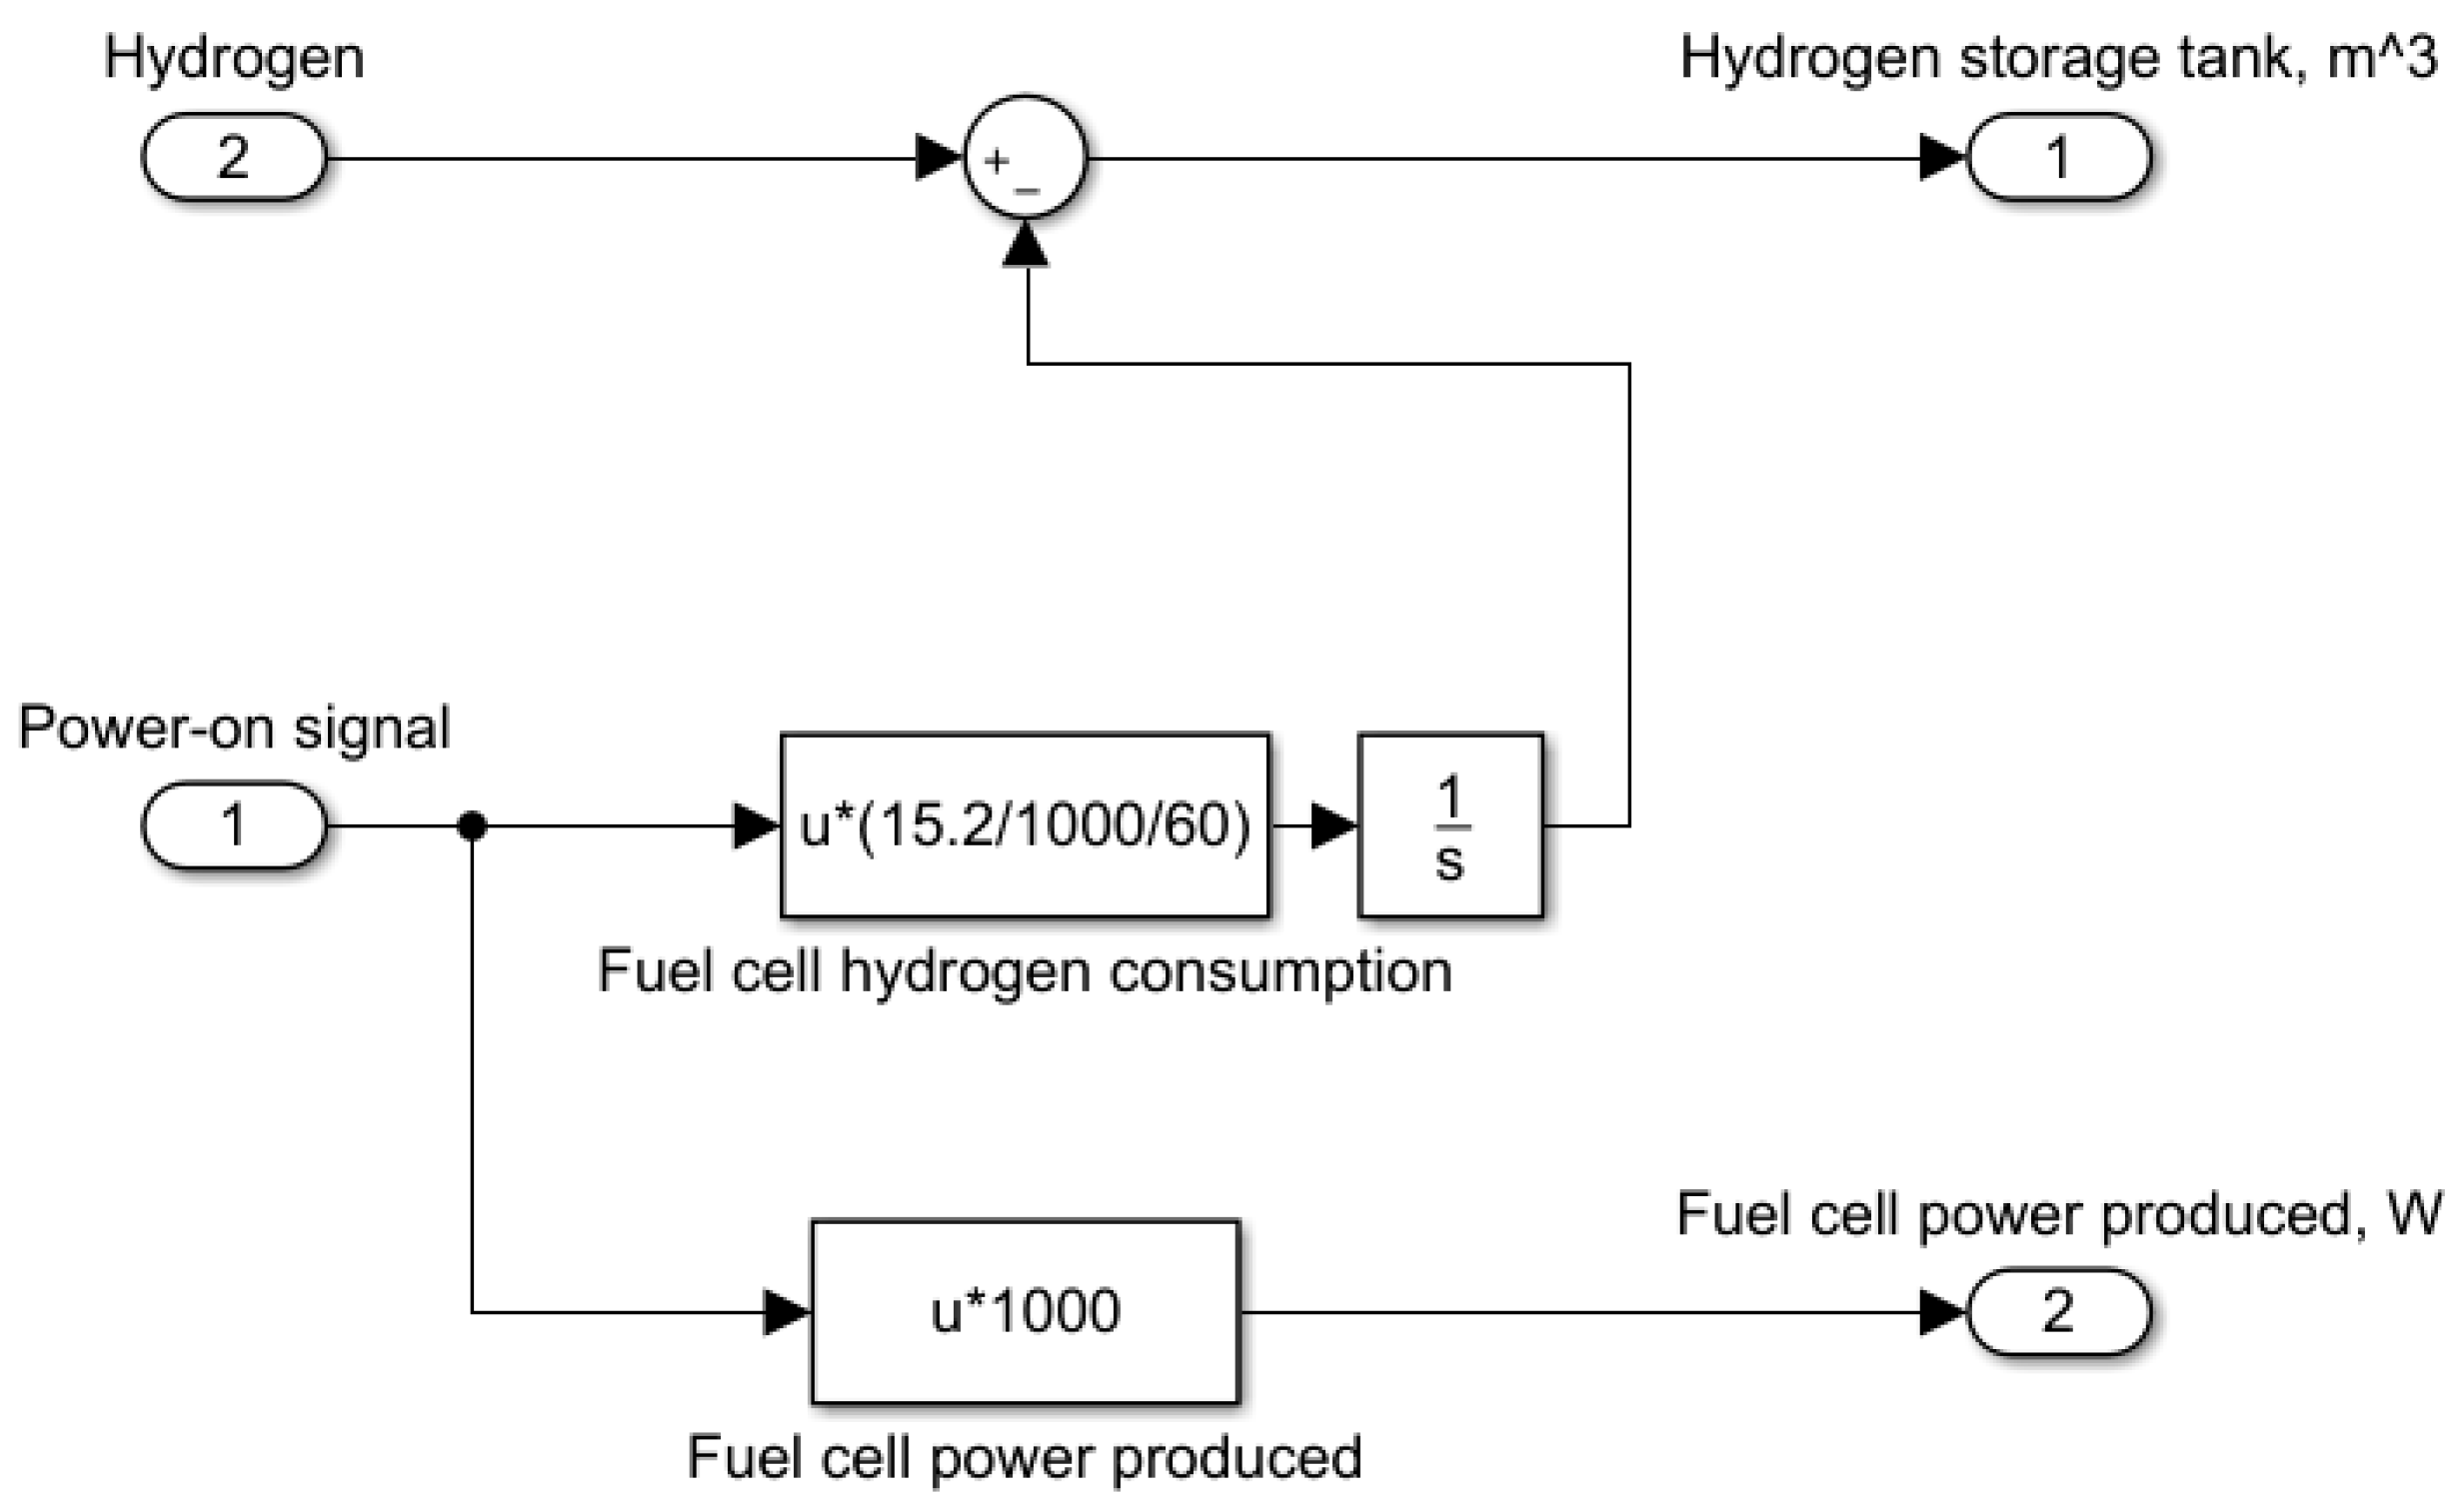
2.2.4. Fuel Cell
2.2.5. Hydrogen Storage System
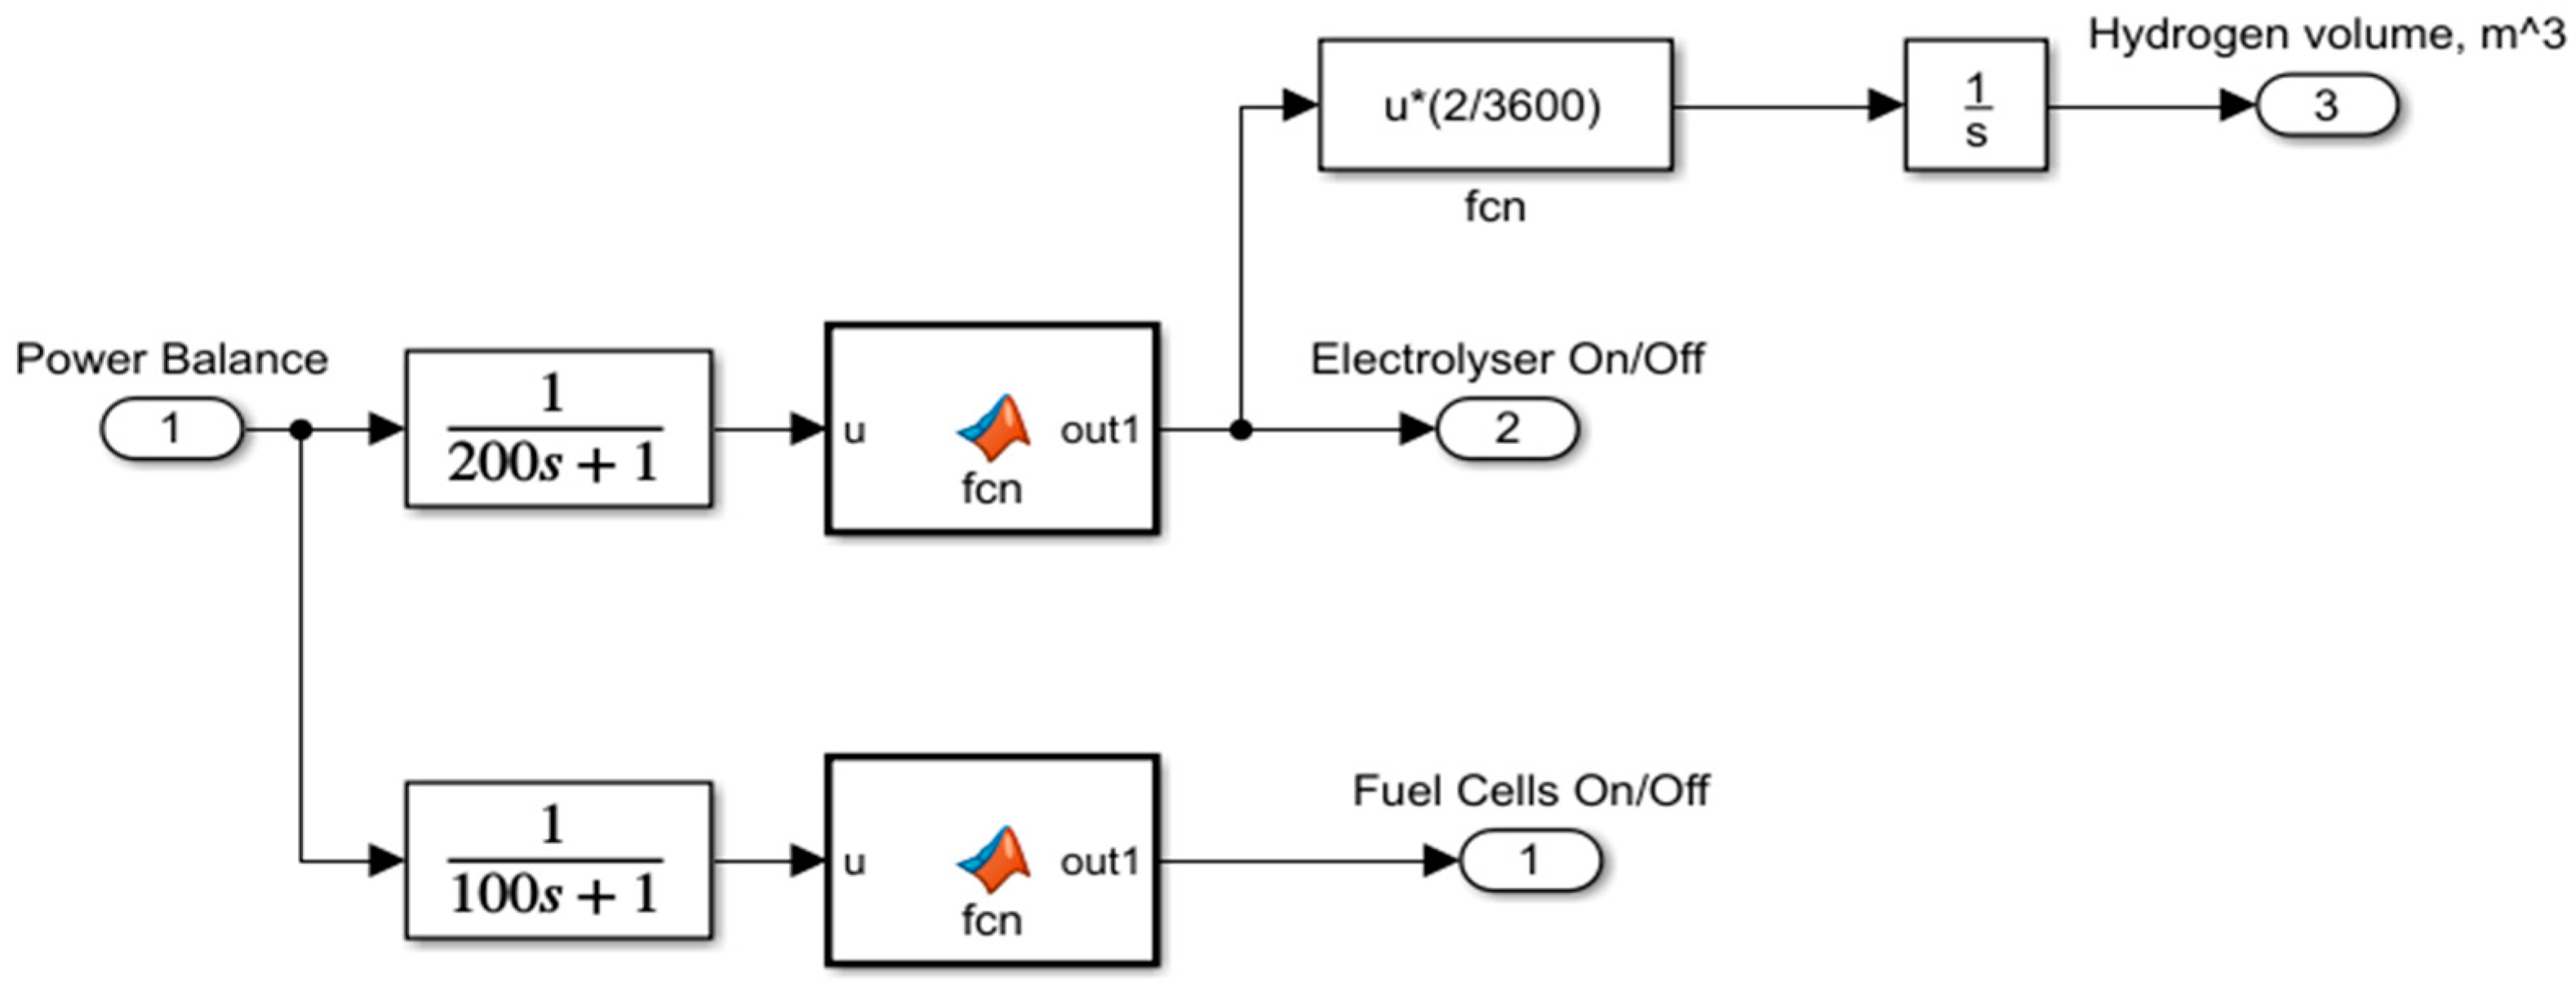
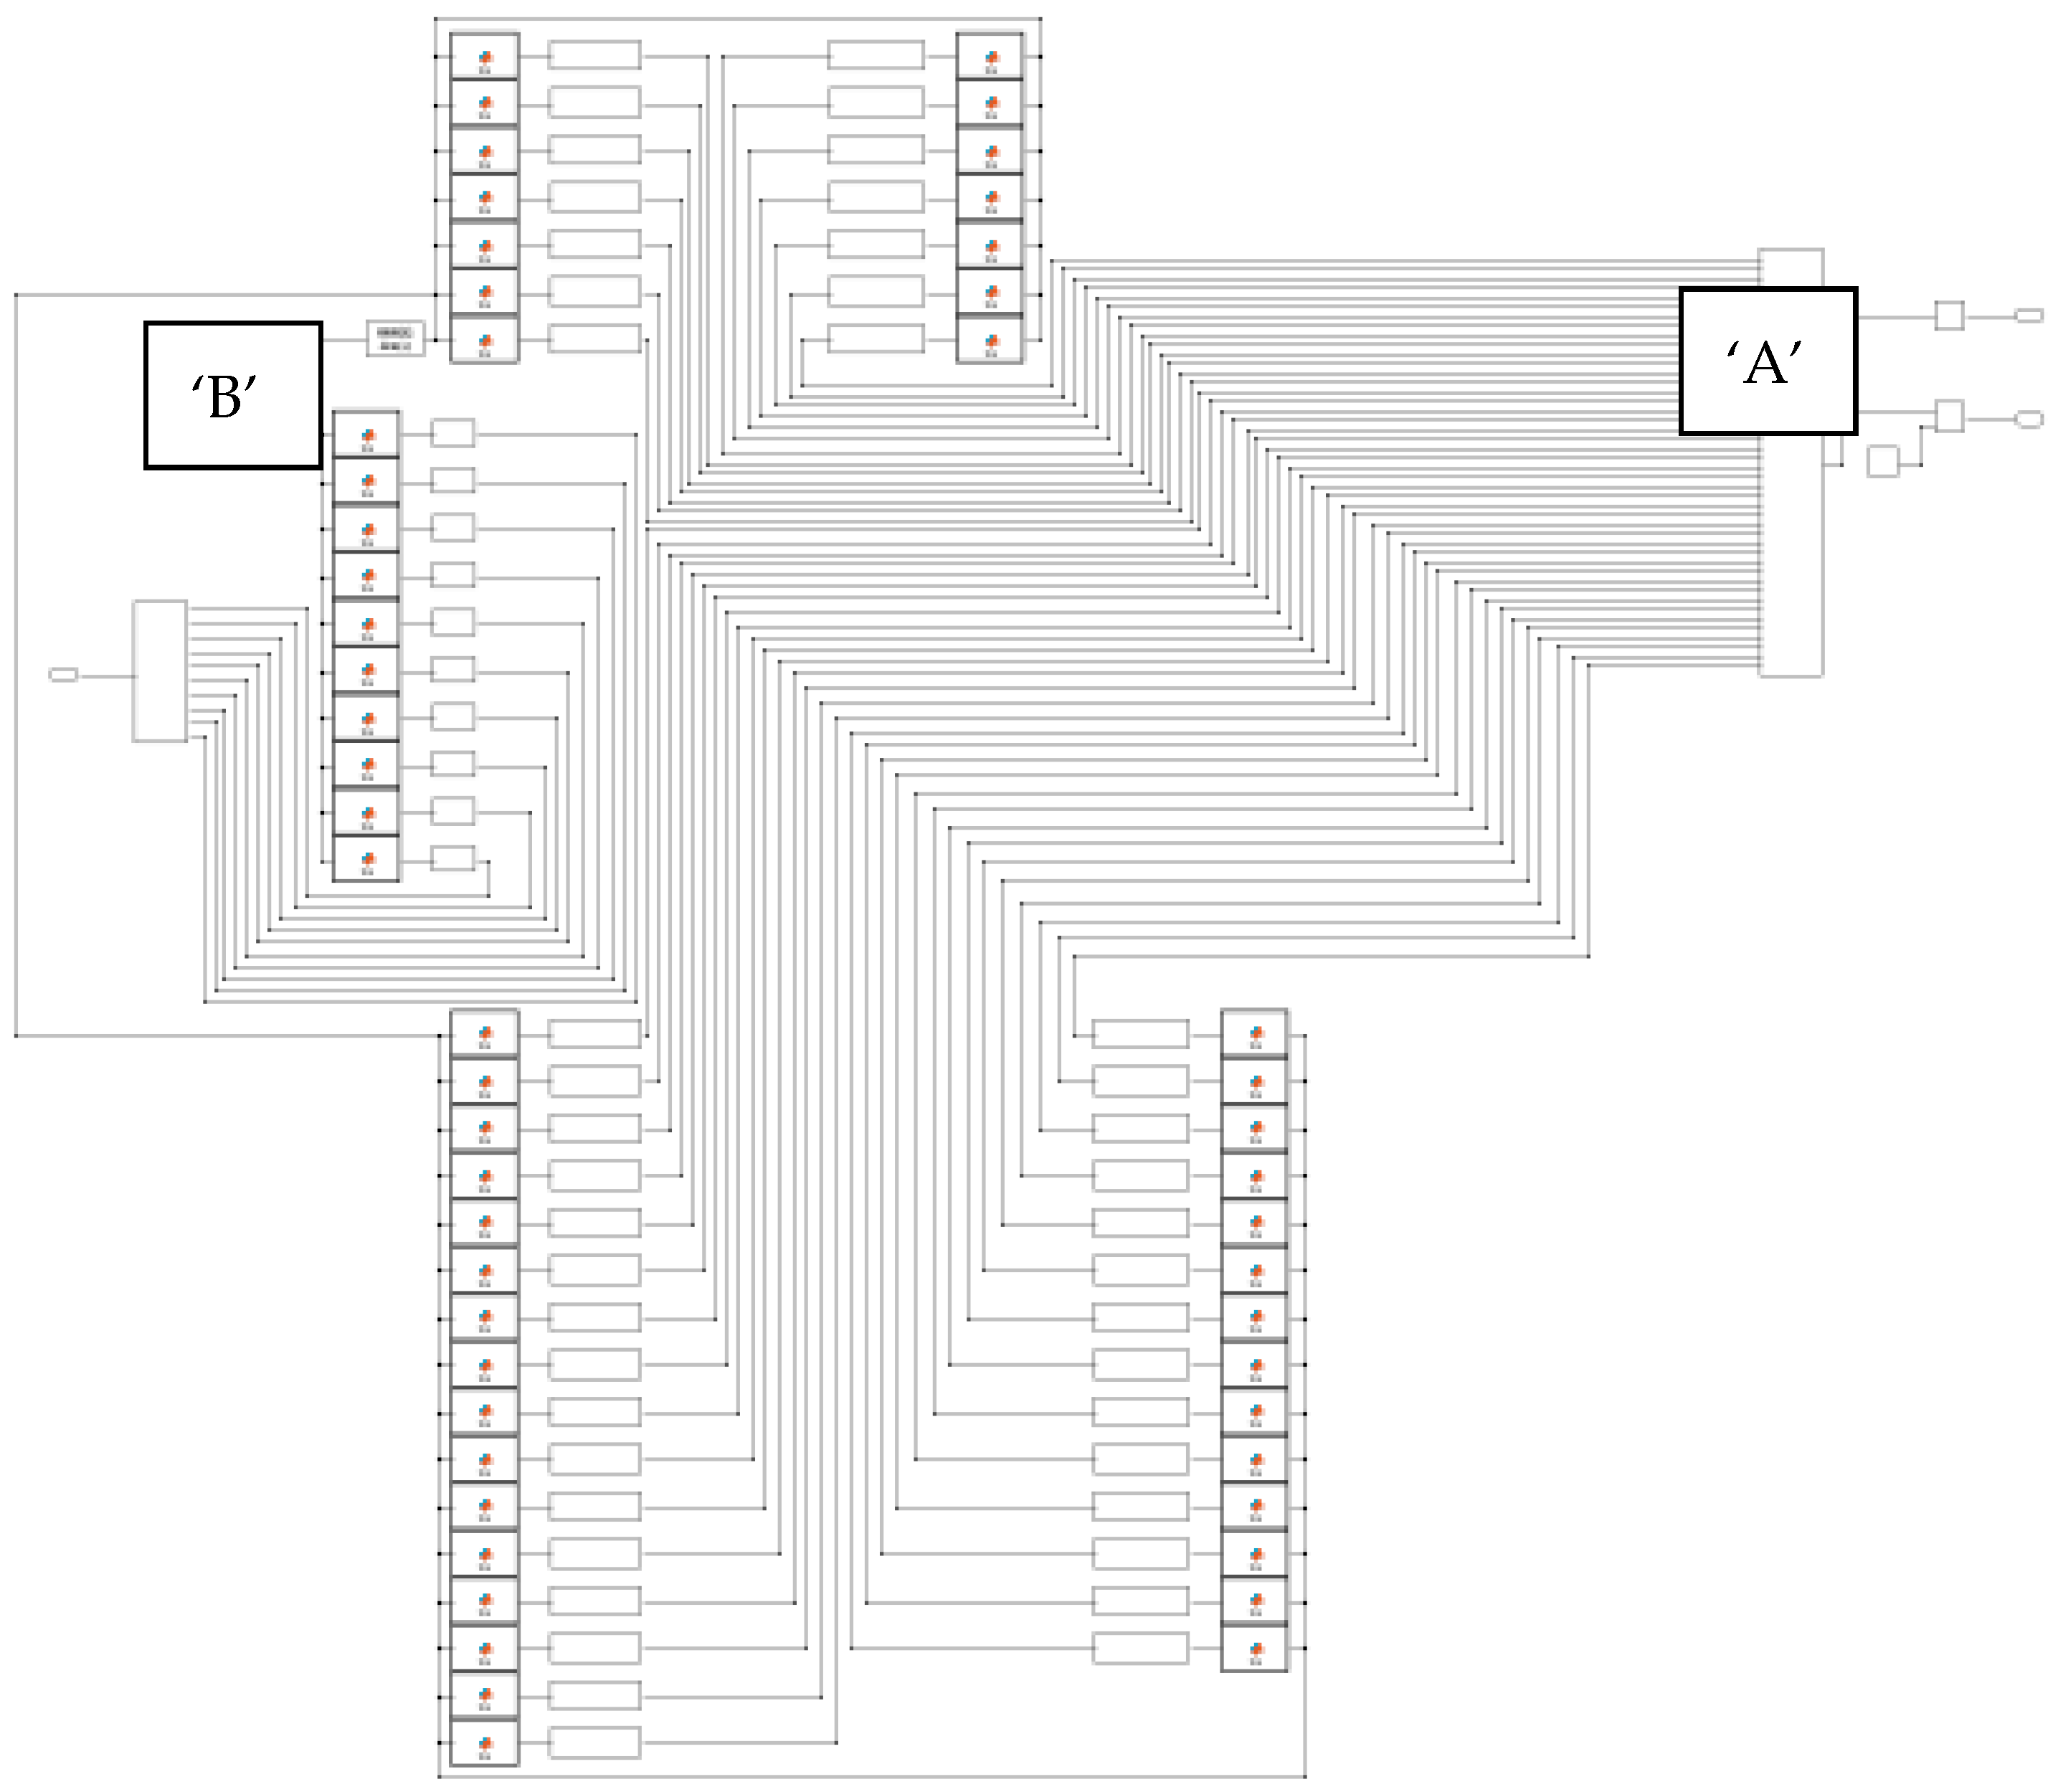
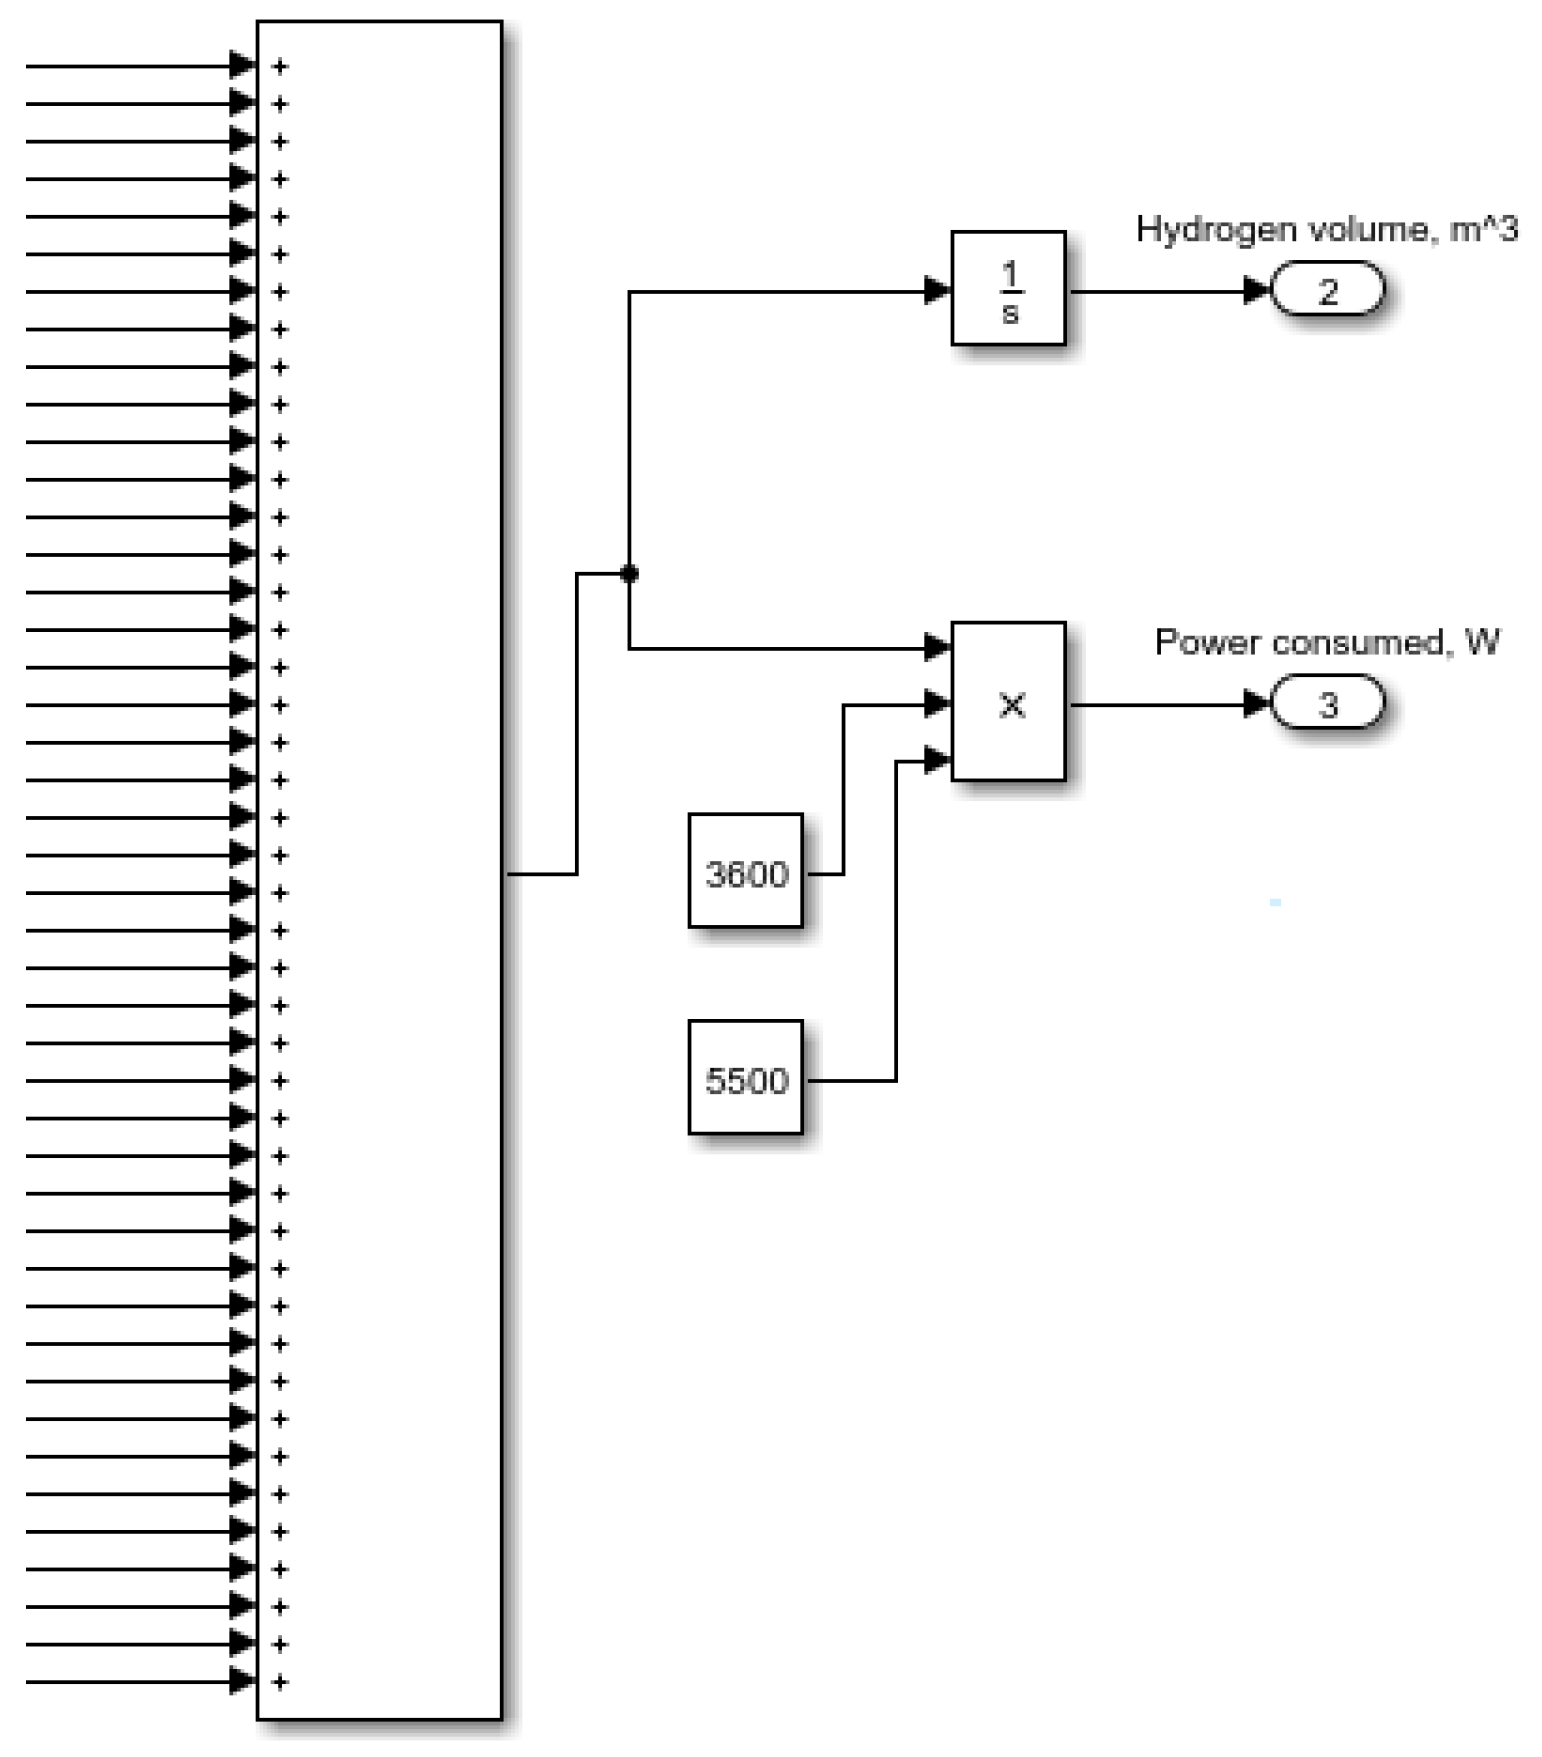
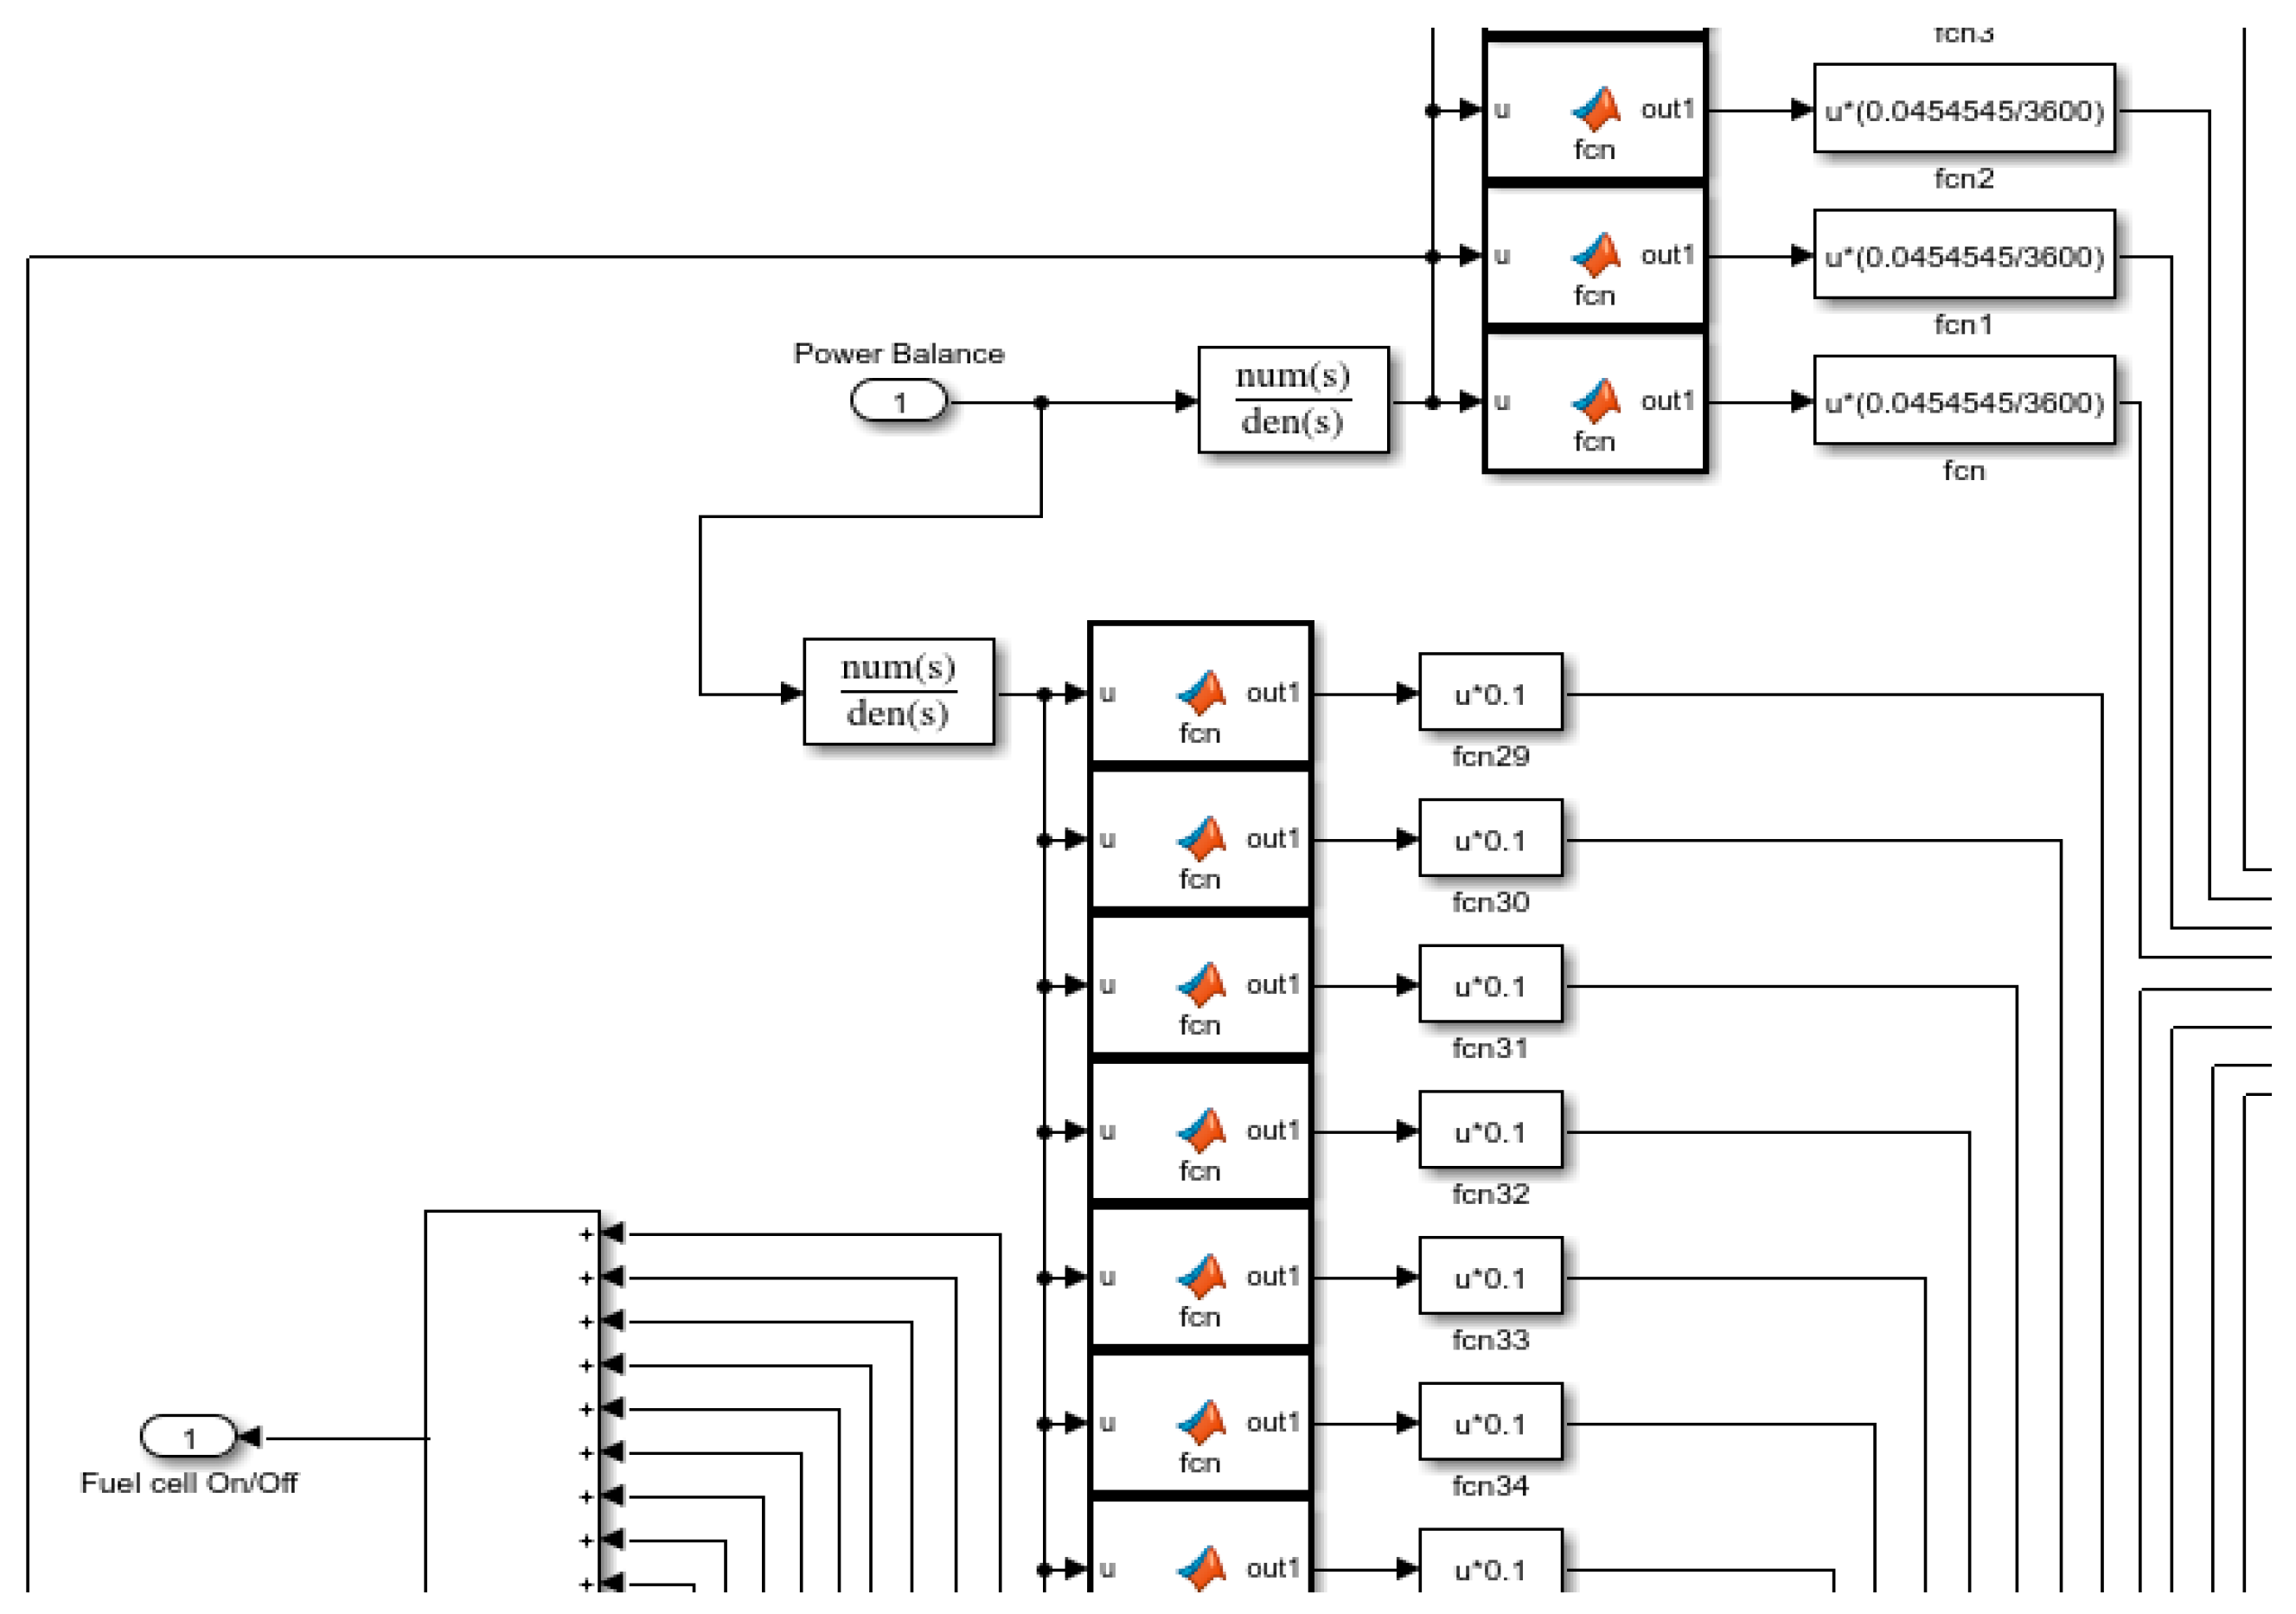
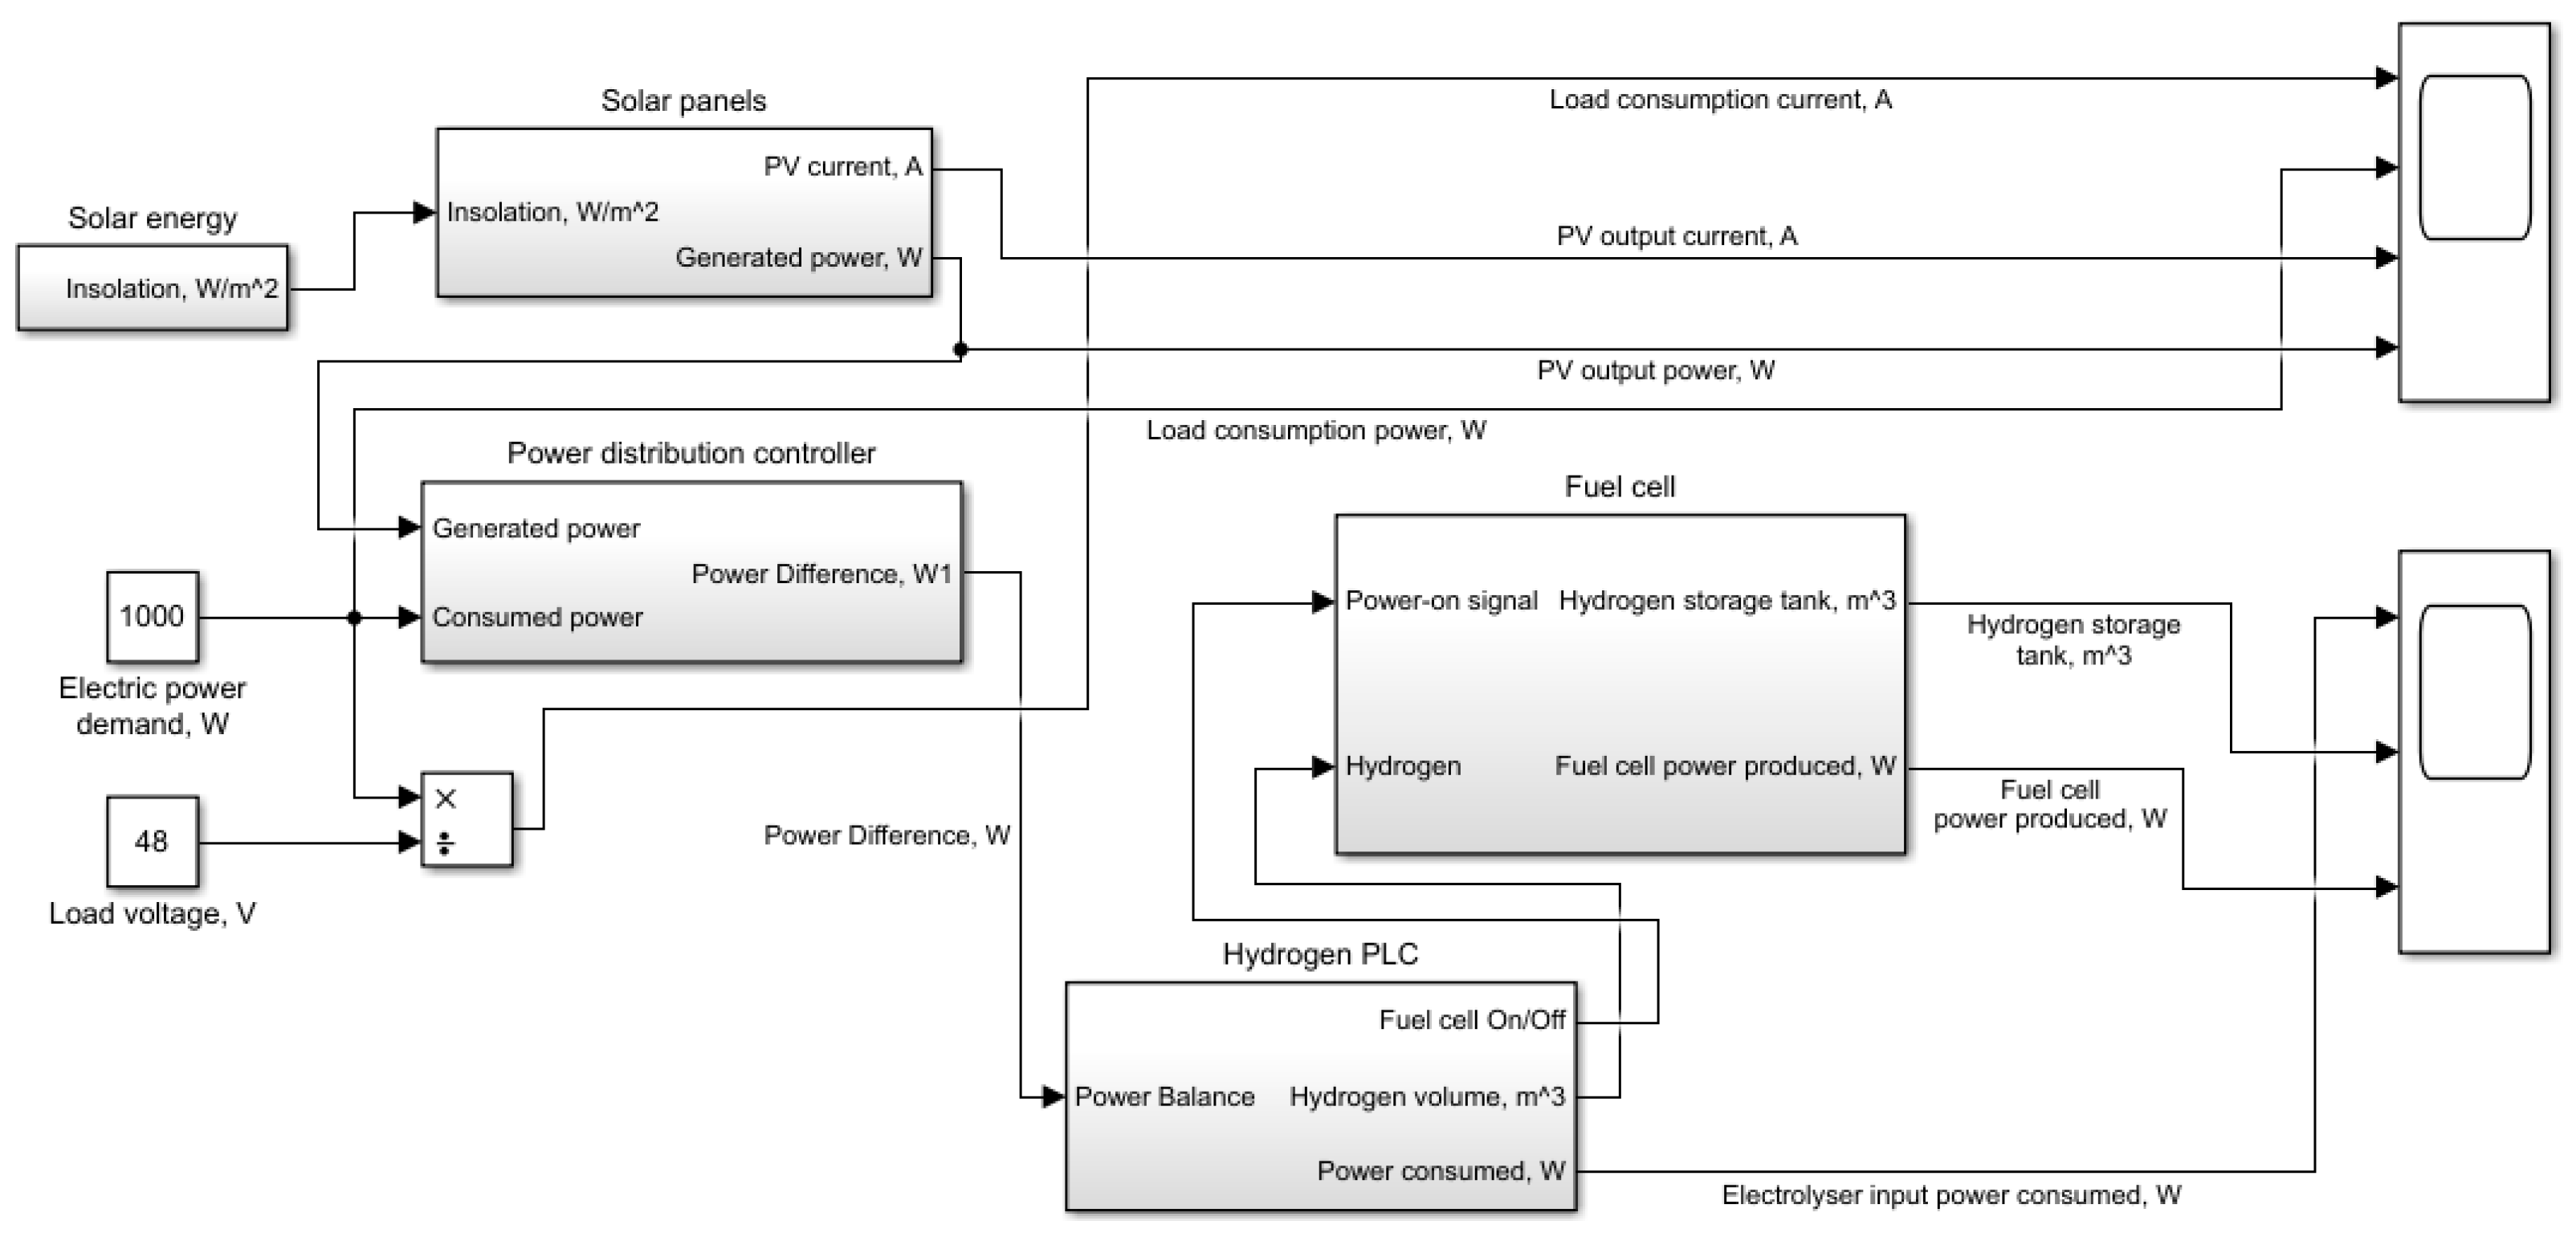
2.2.6. Final Photovoltaic Powered Hydrogen Simulink Model
2.2.7. Implementation and Safety
3. Processing Data
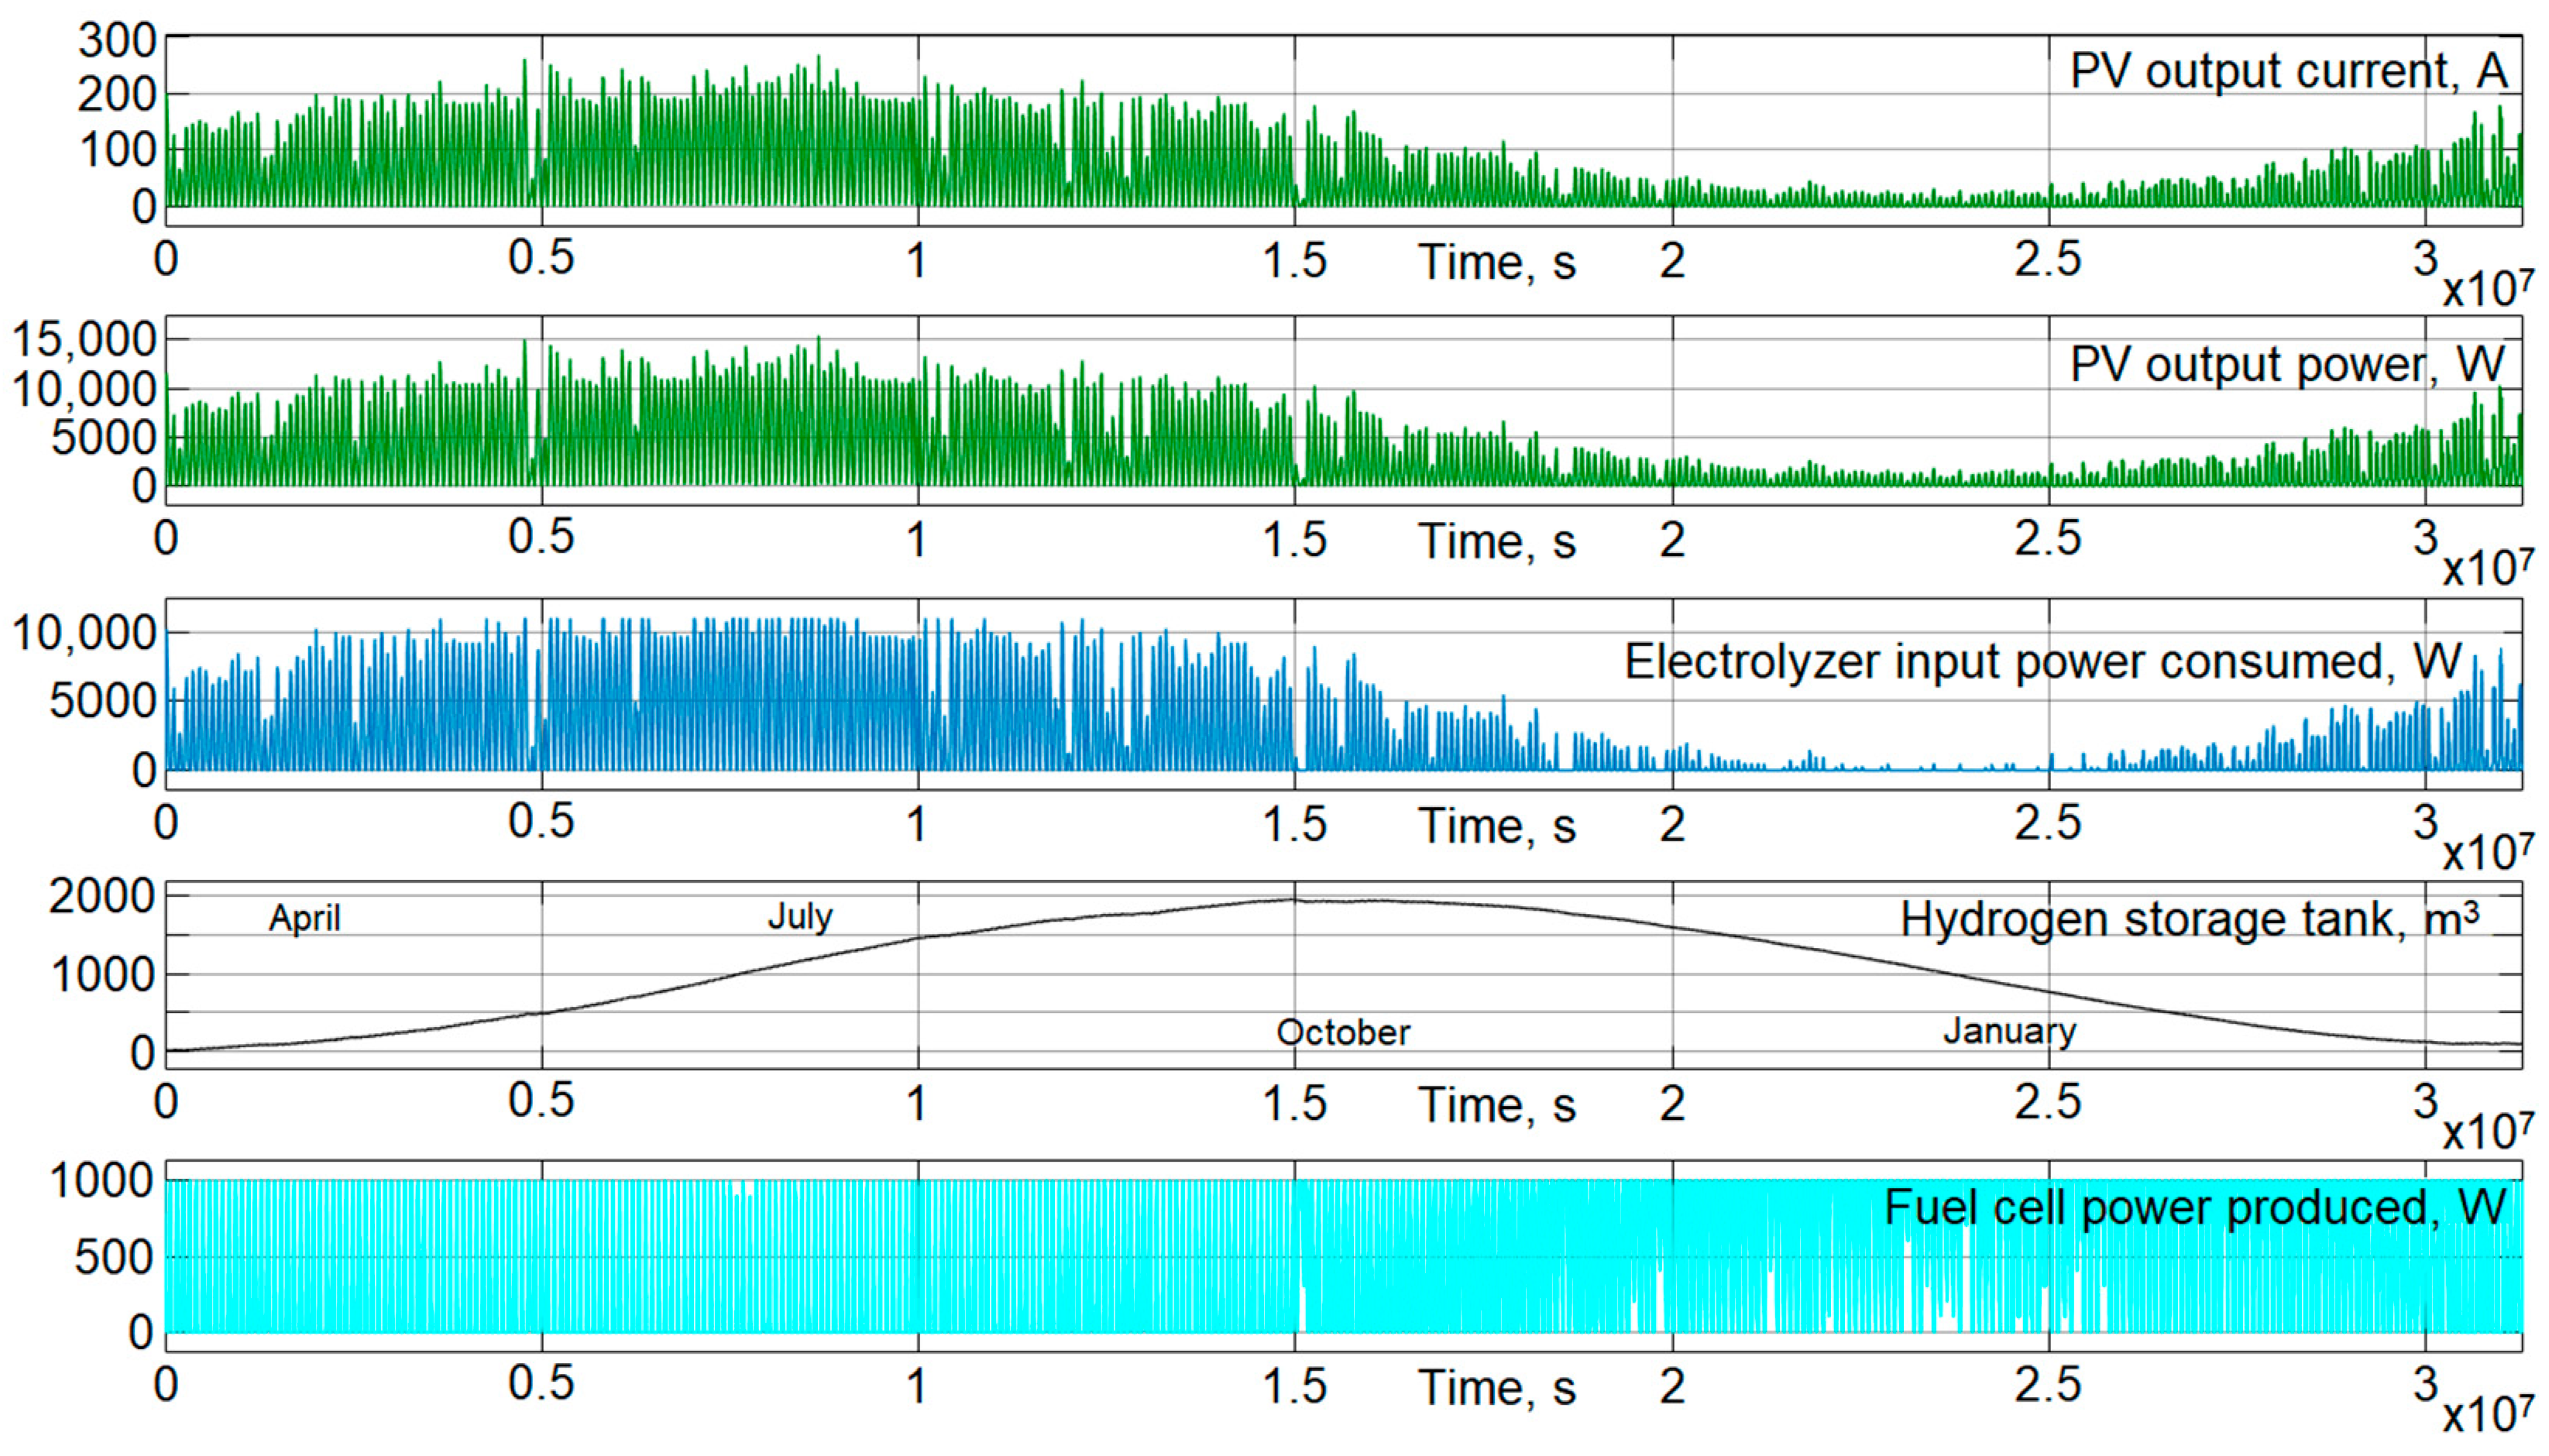
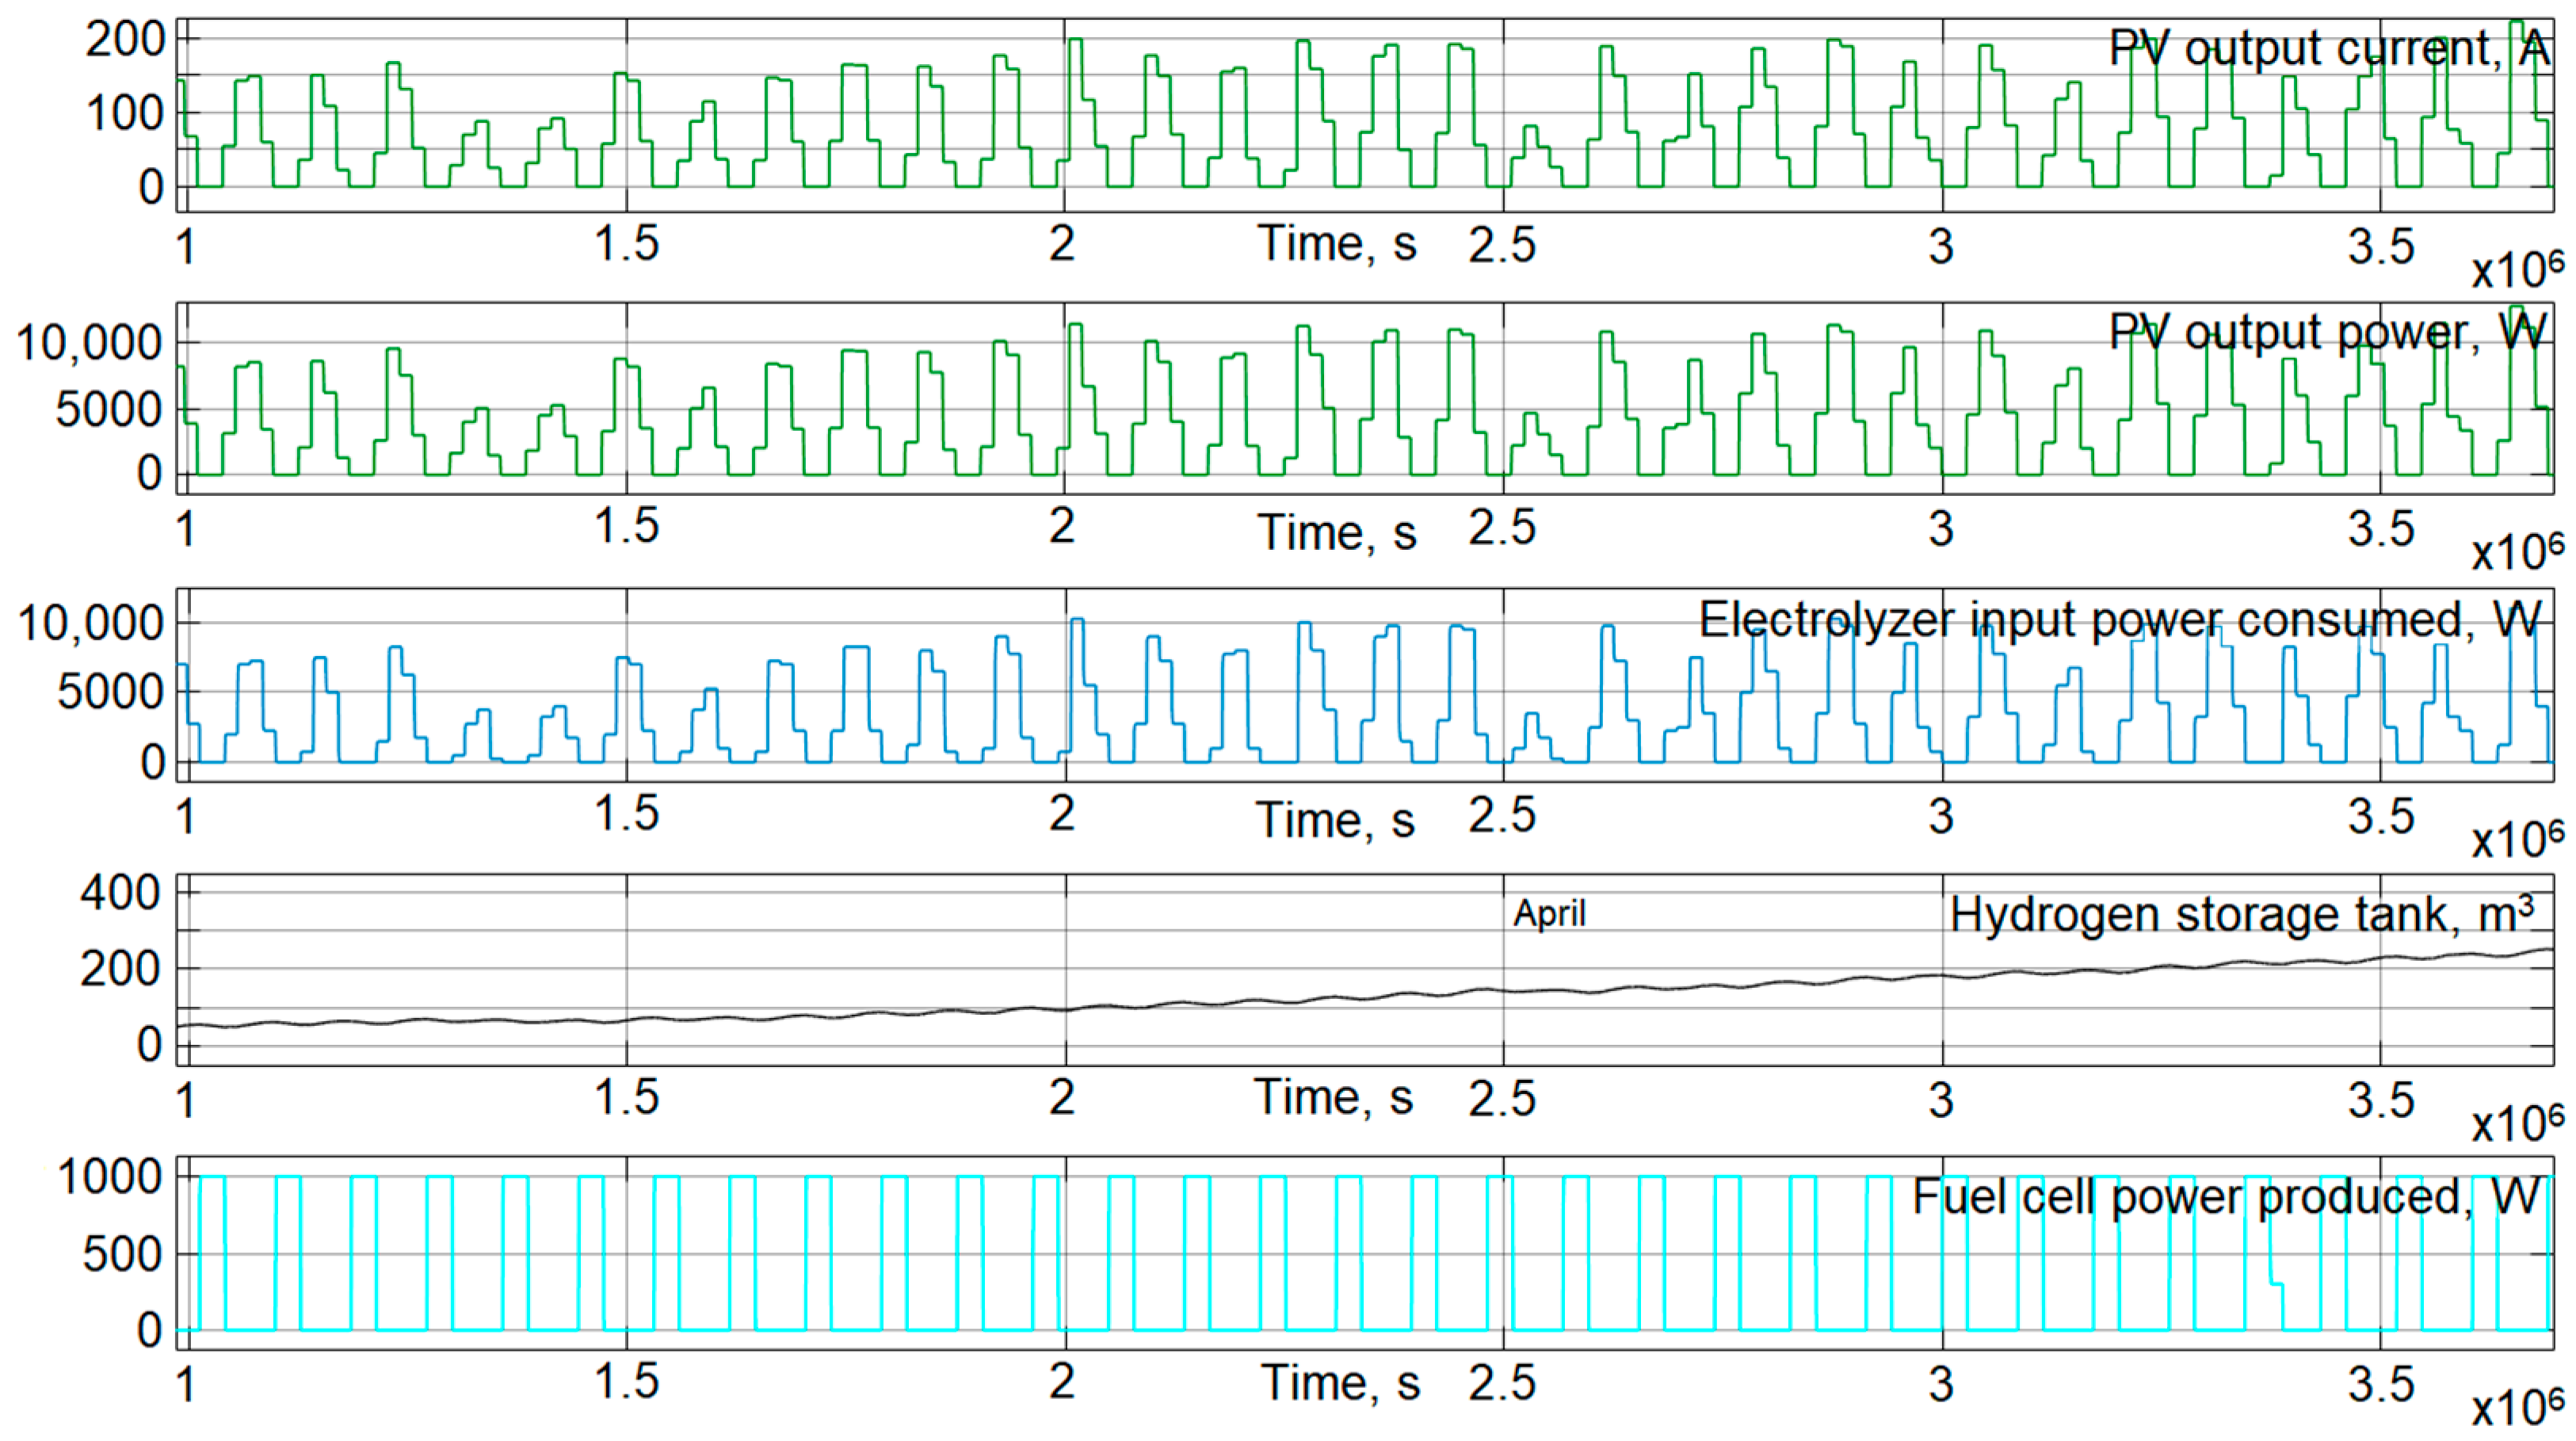
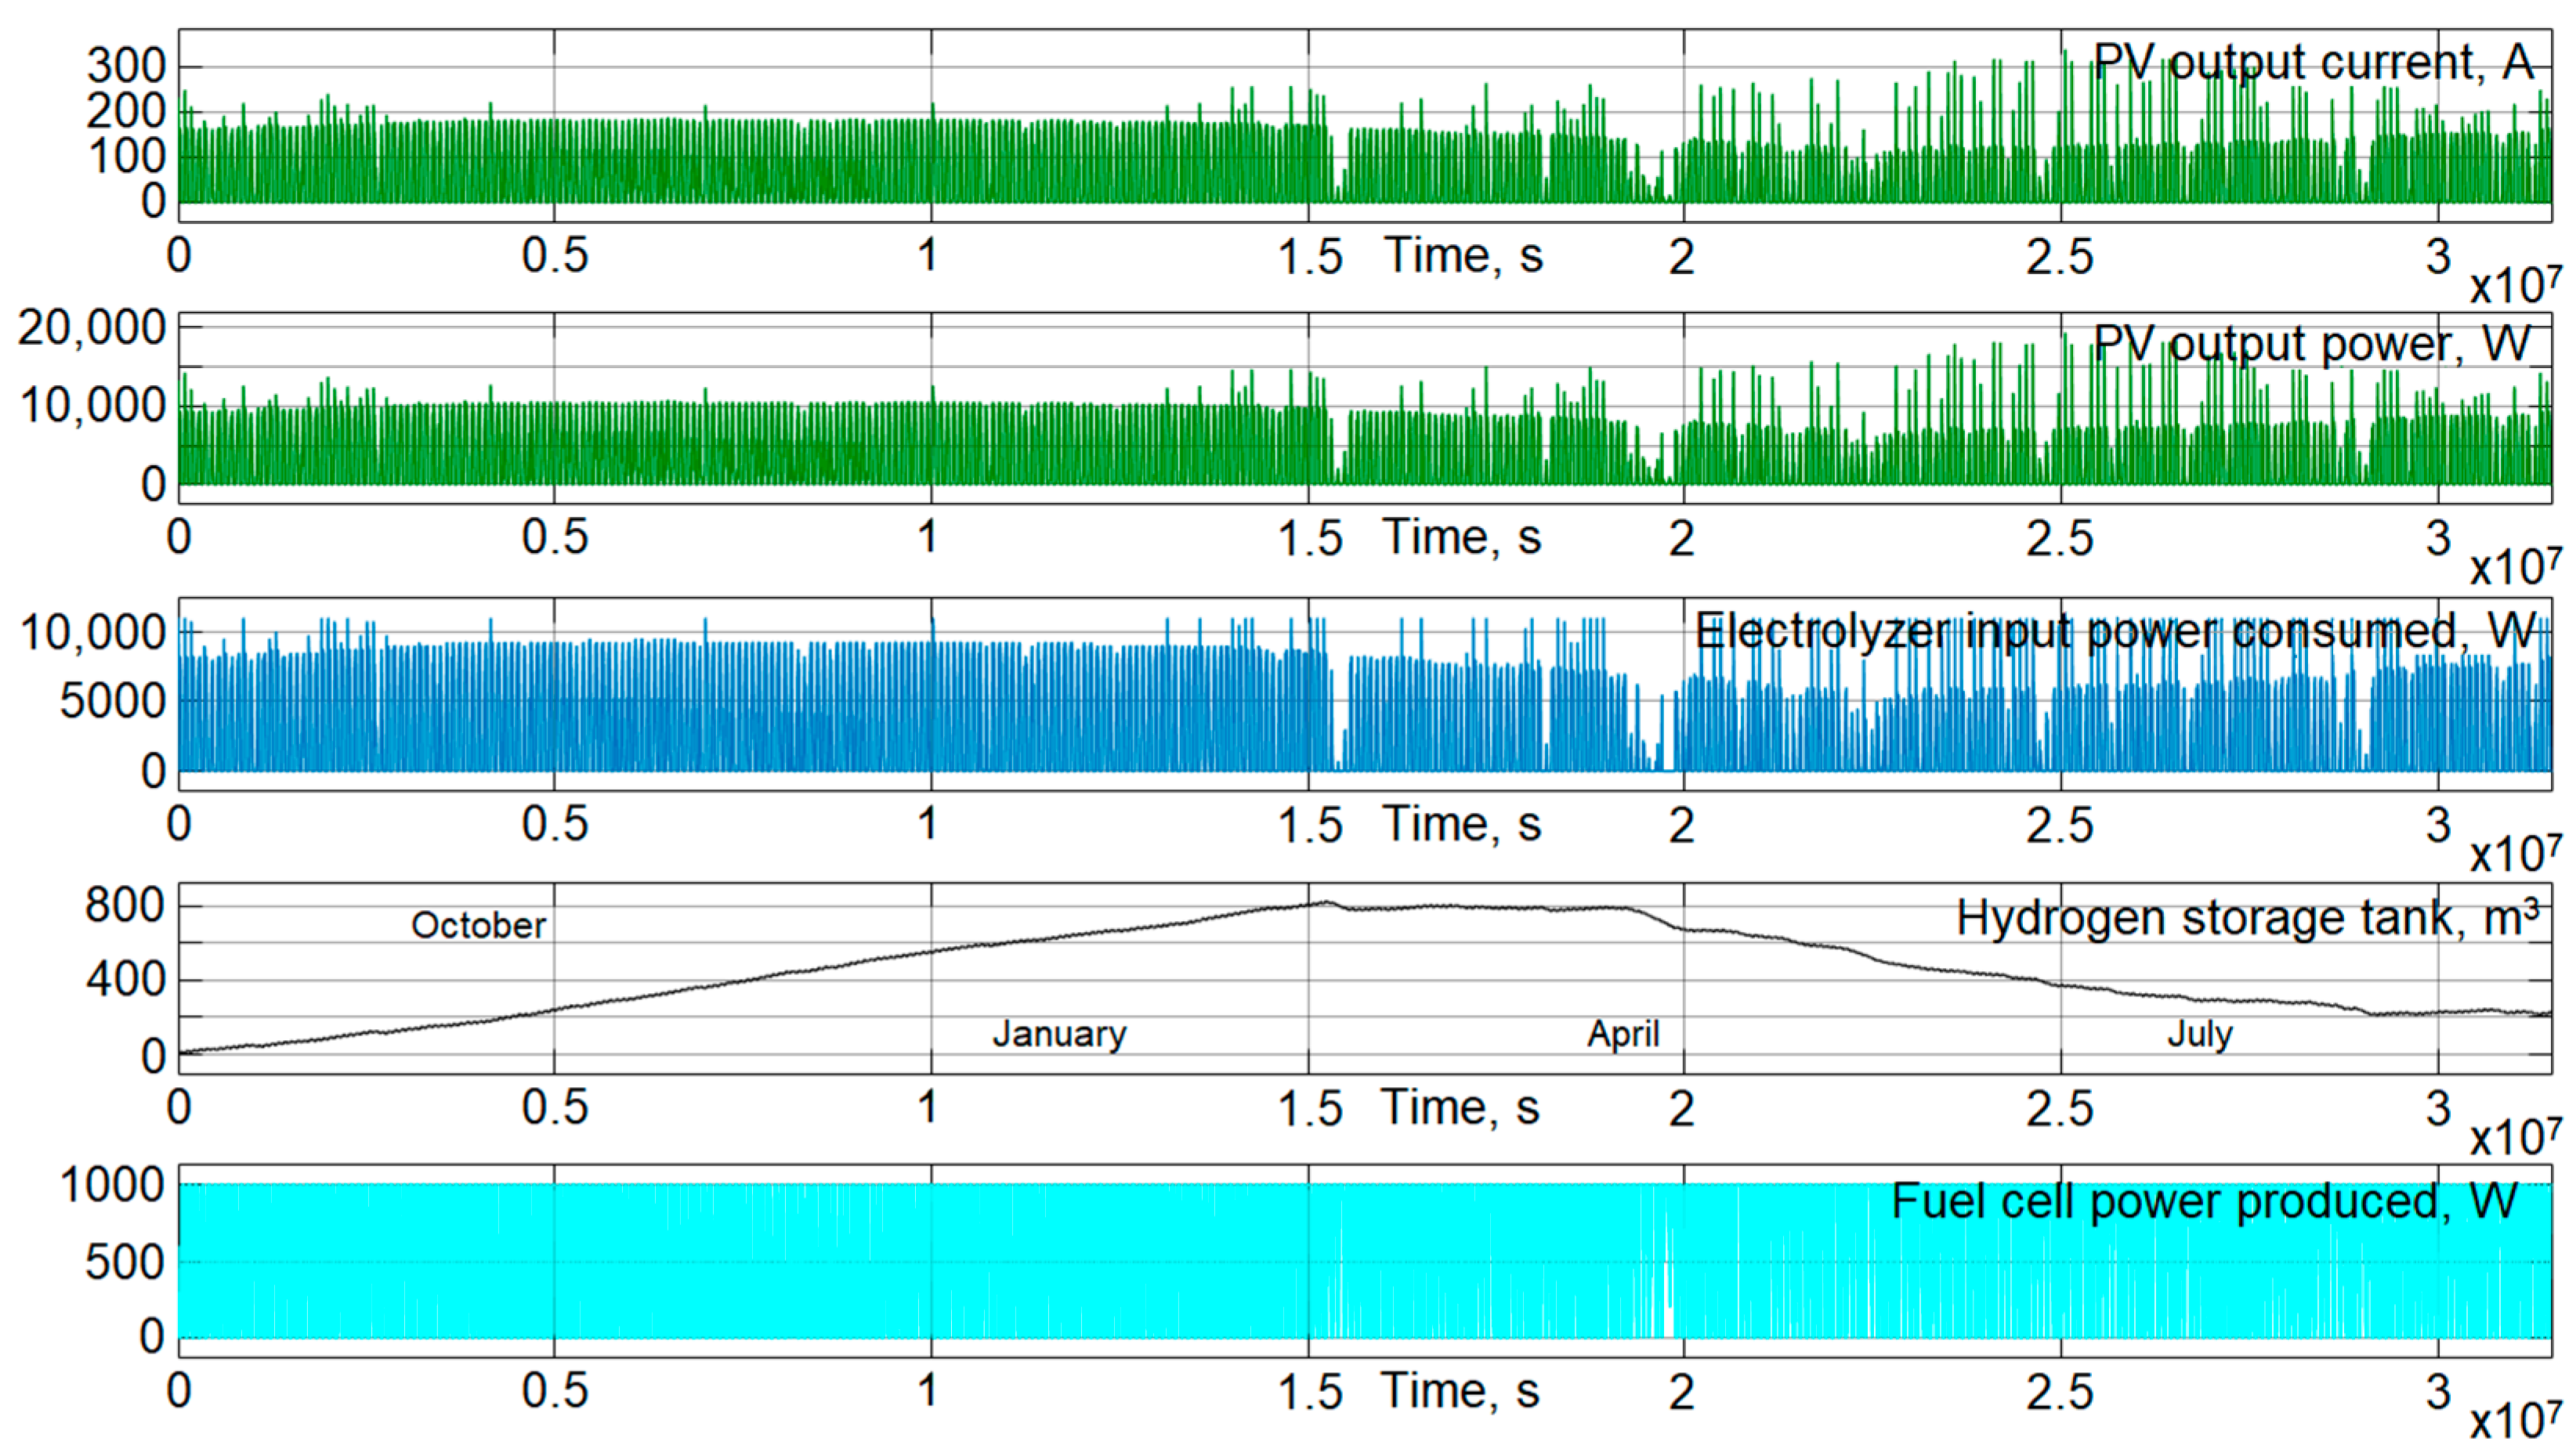
3.1. Simulation Results (Russia)
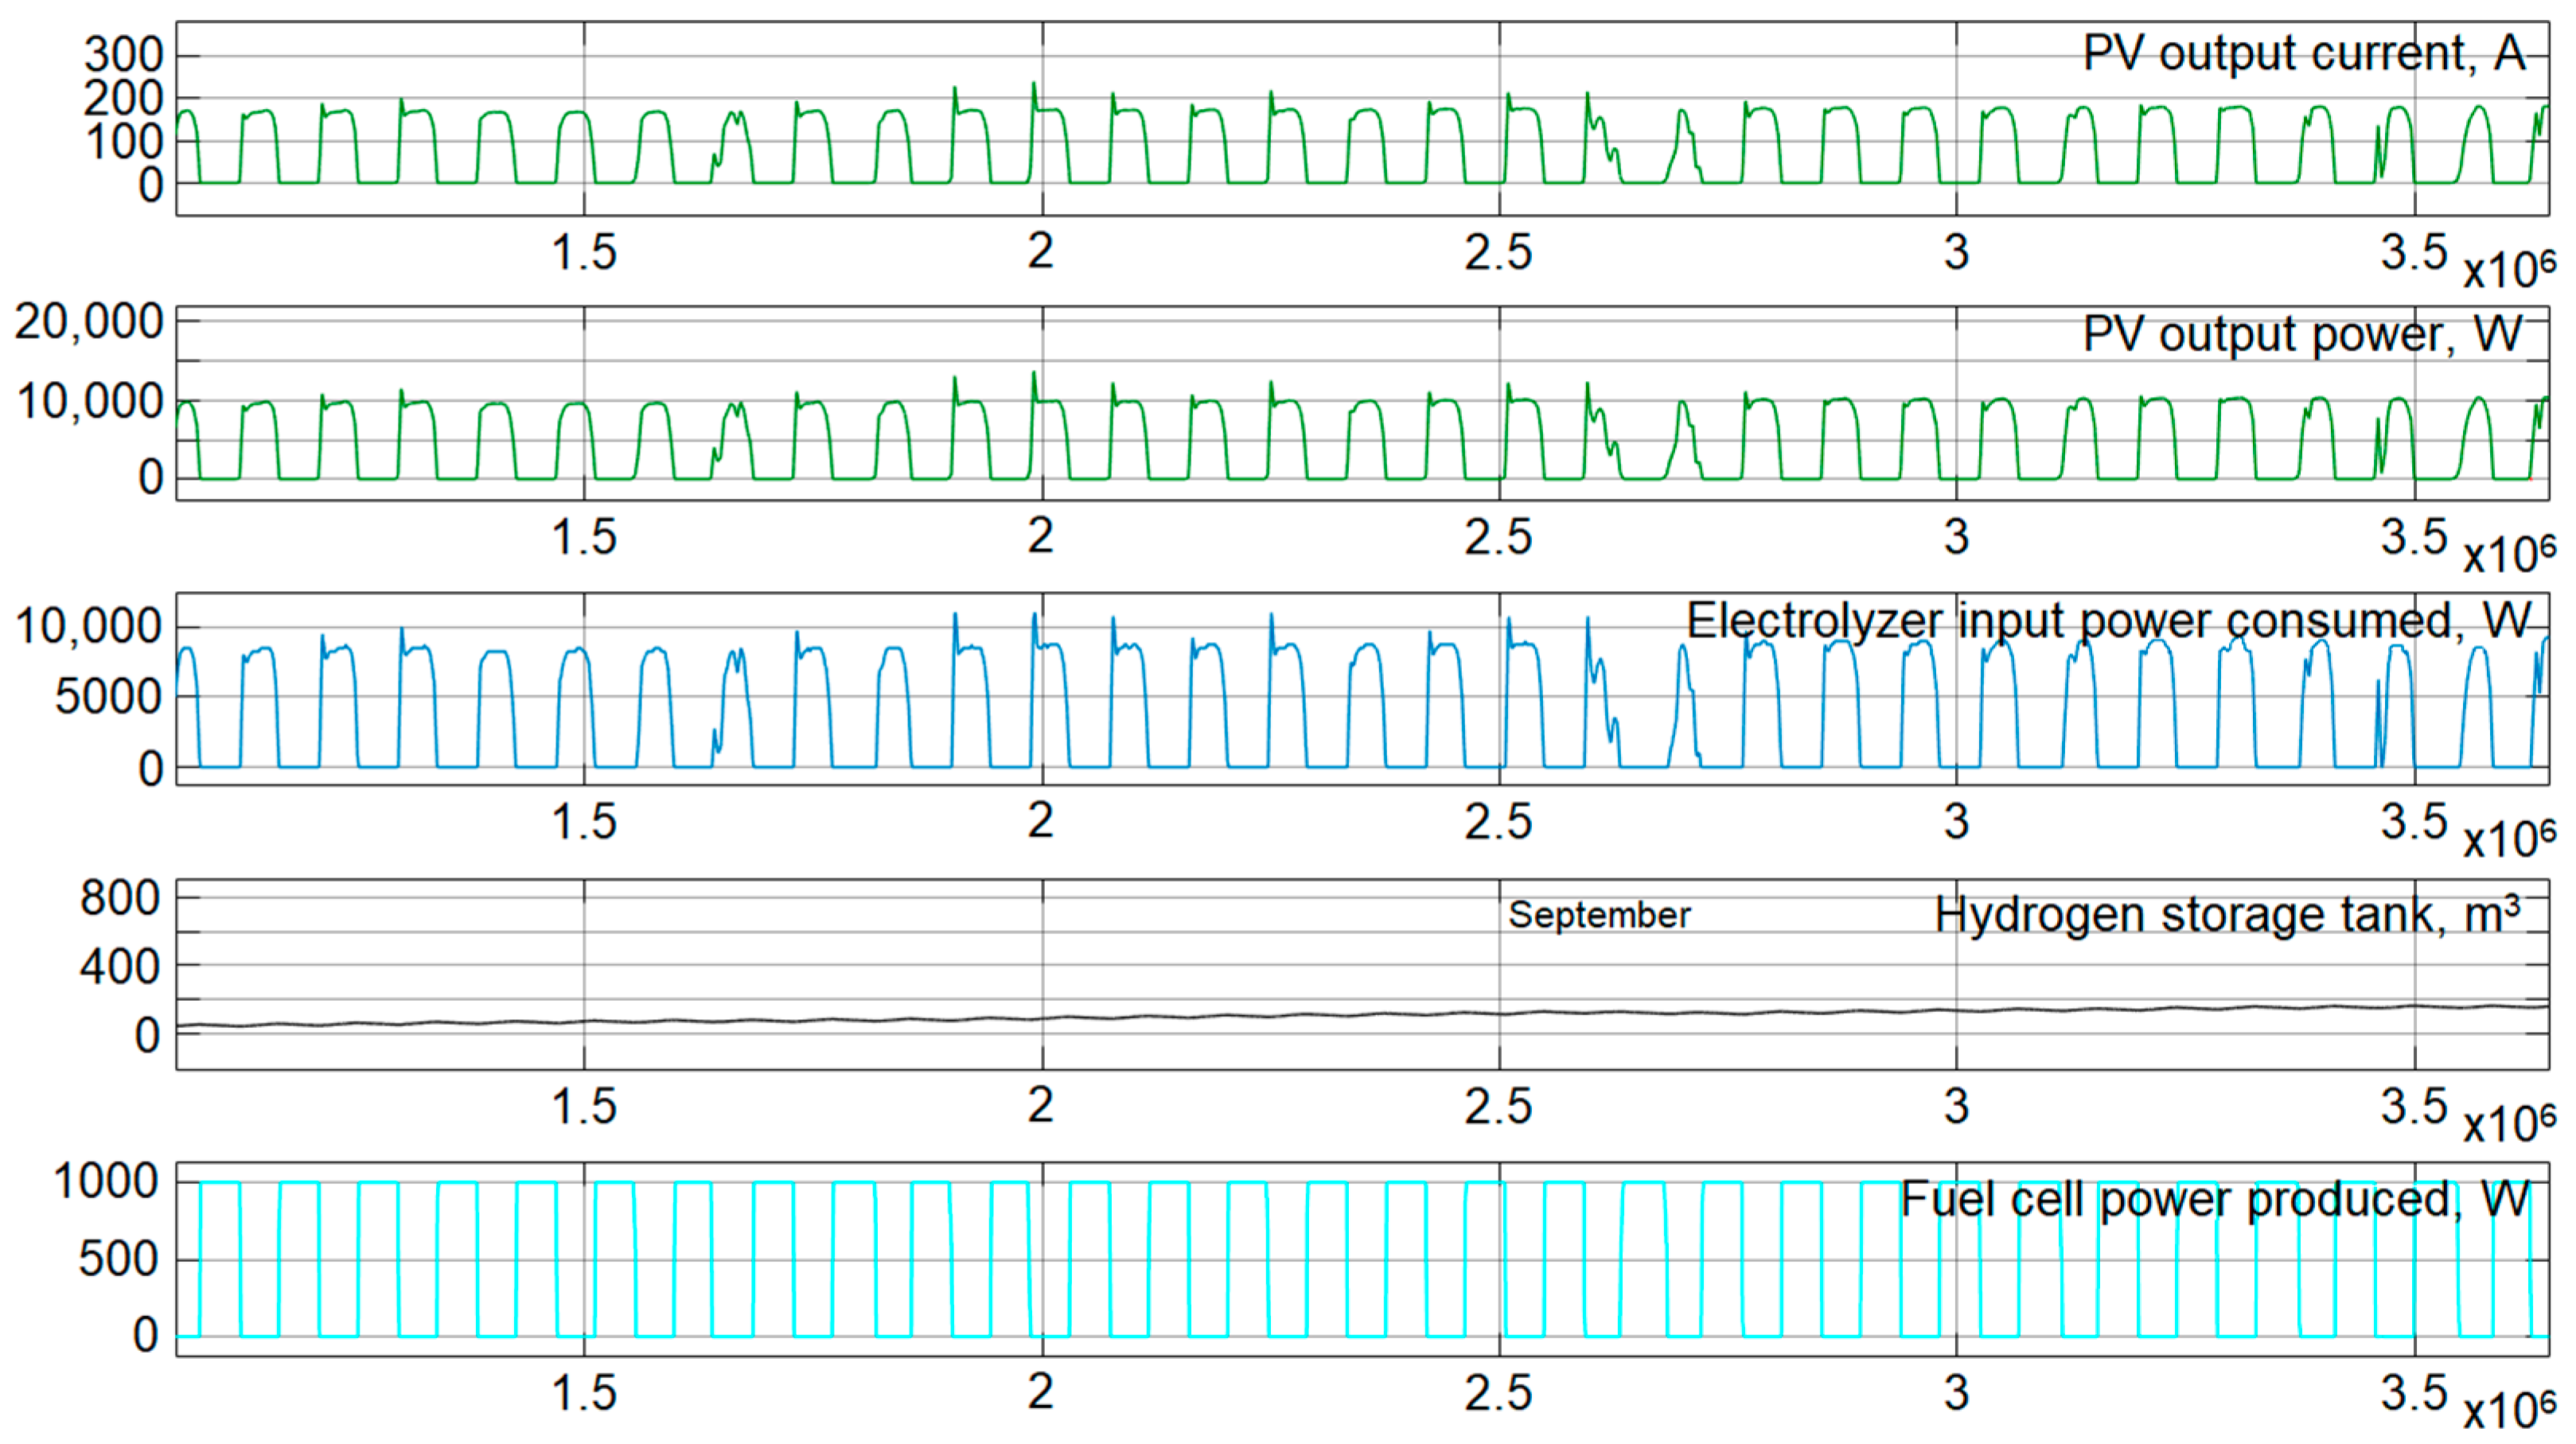
3.2. Simulation Results (India)
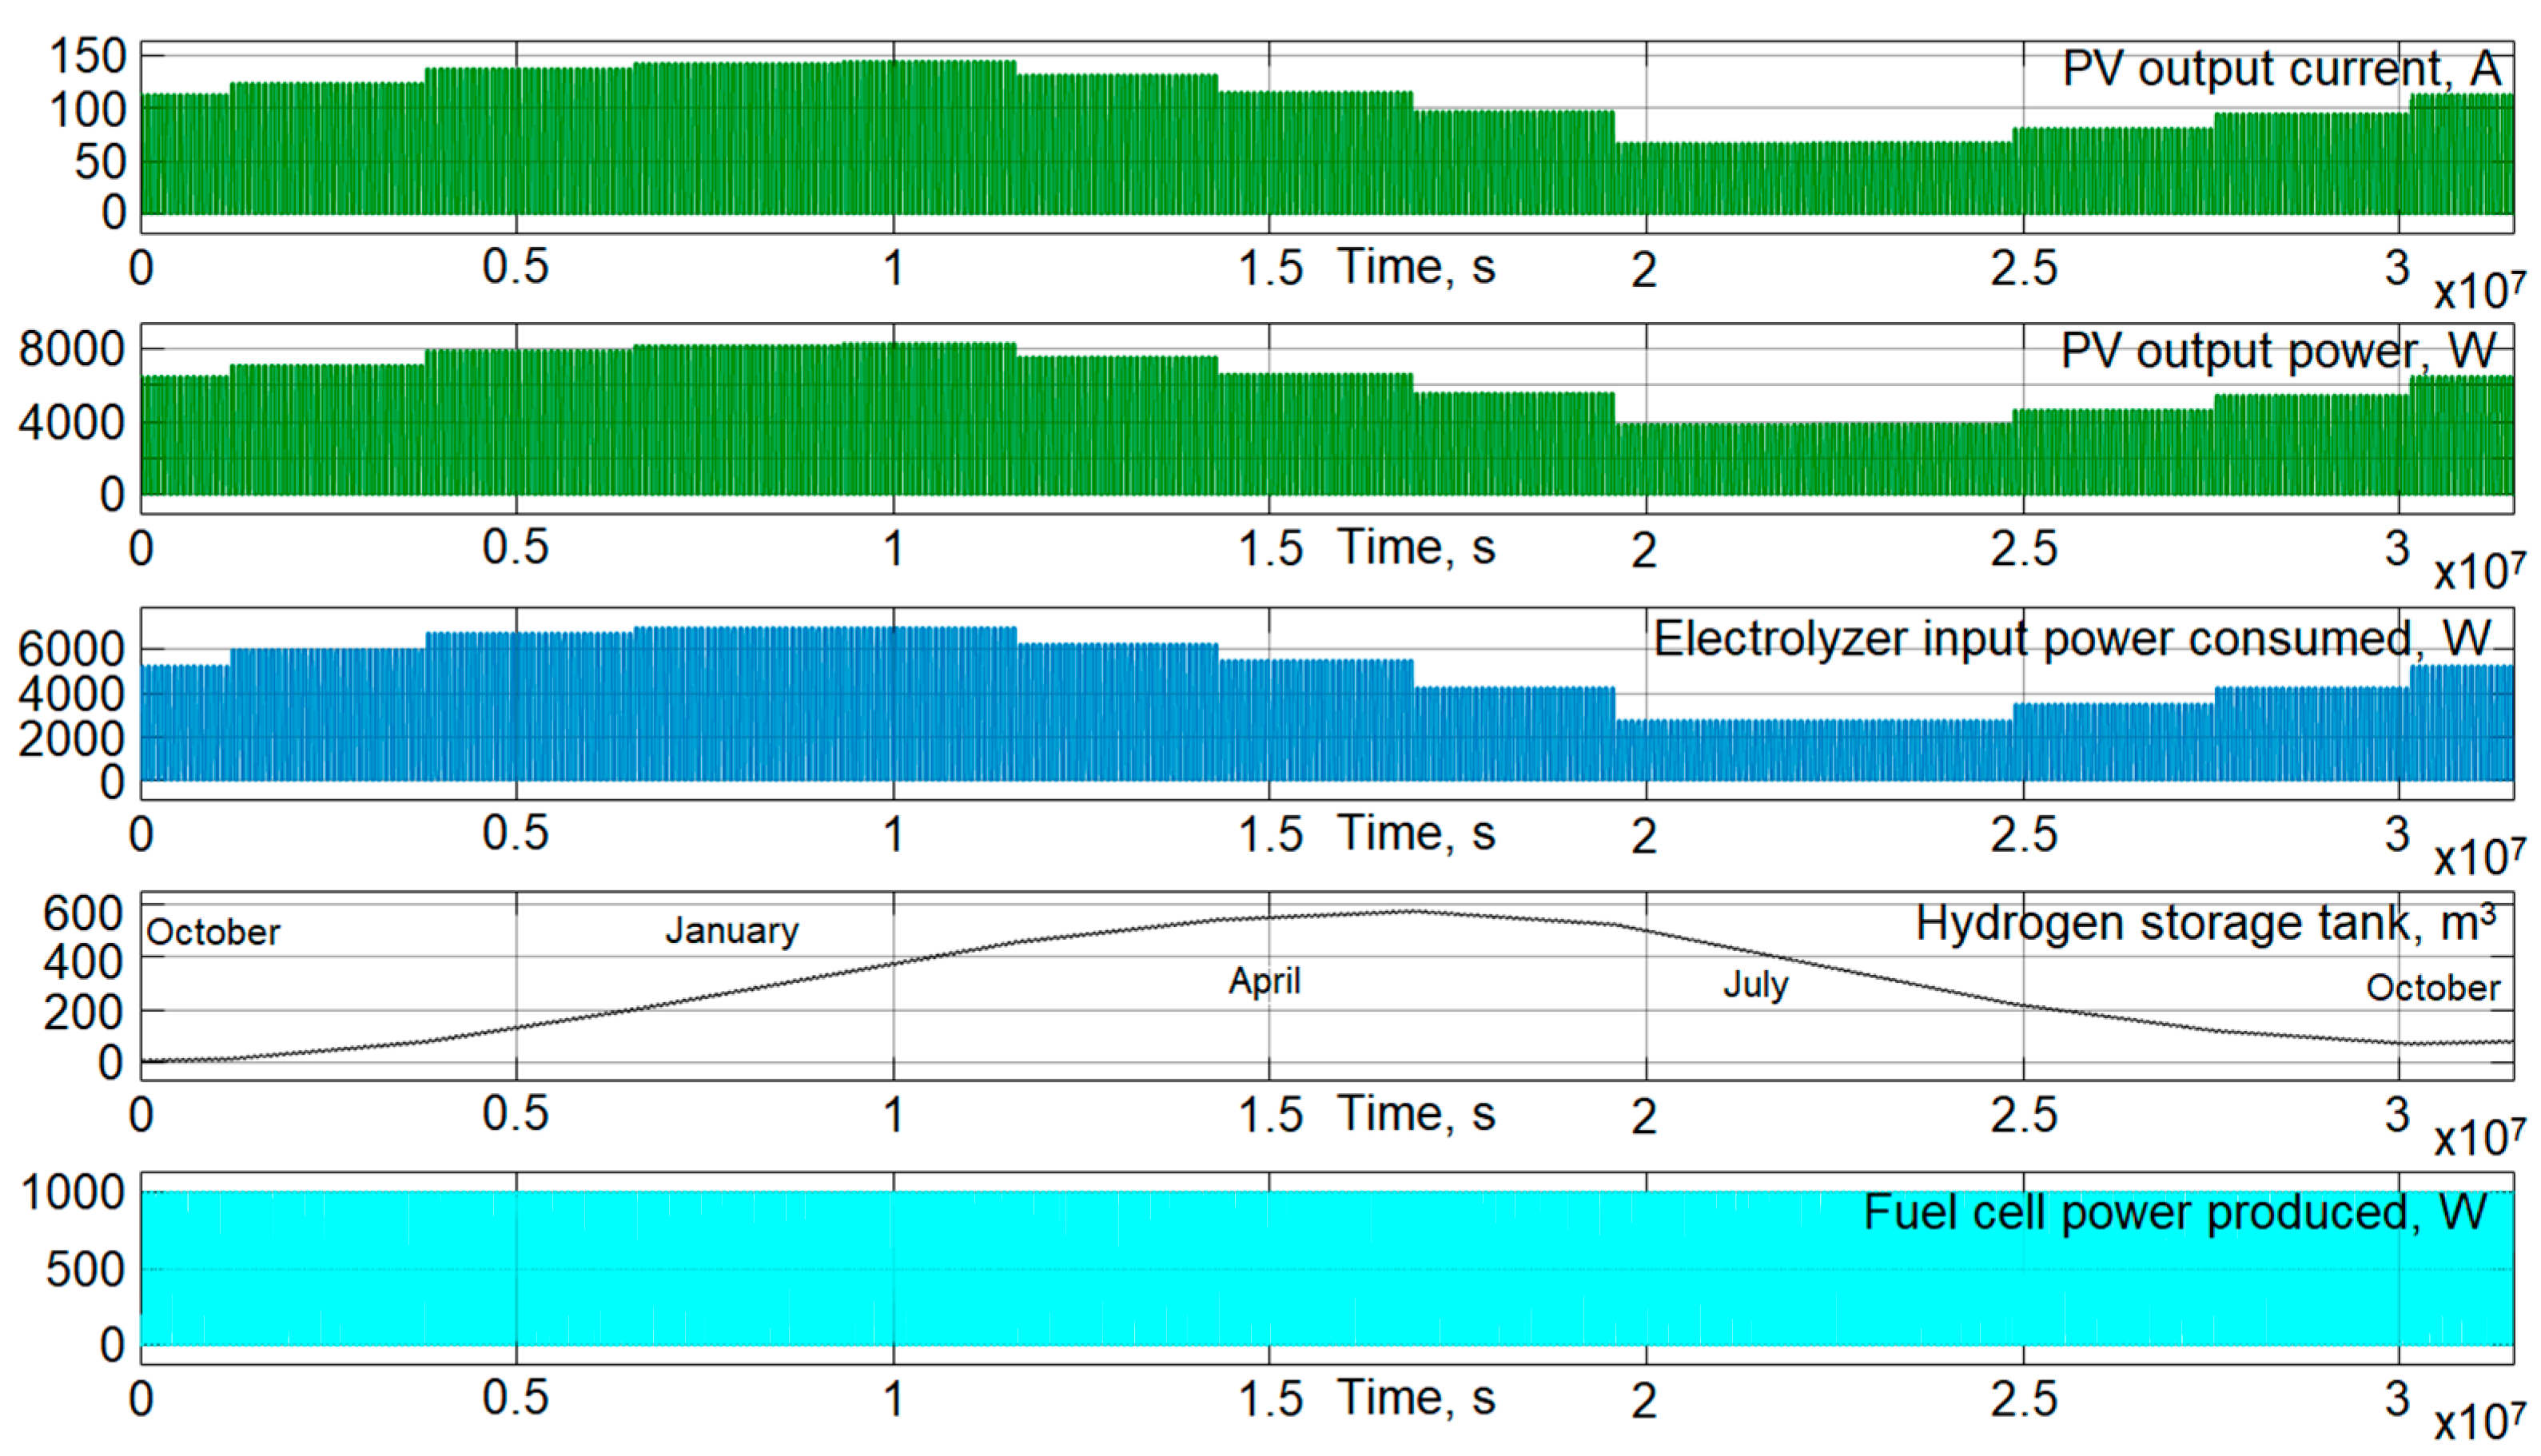
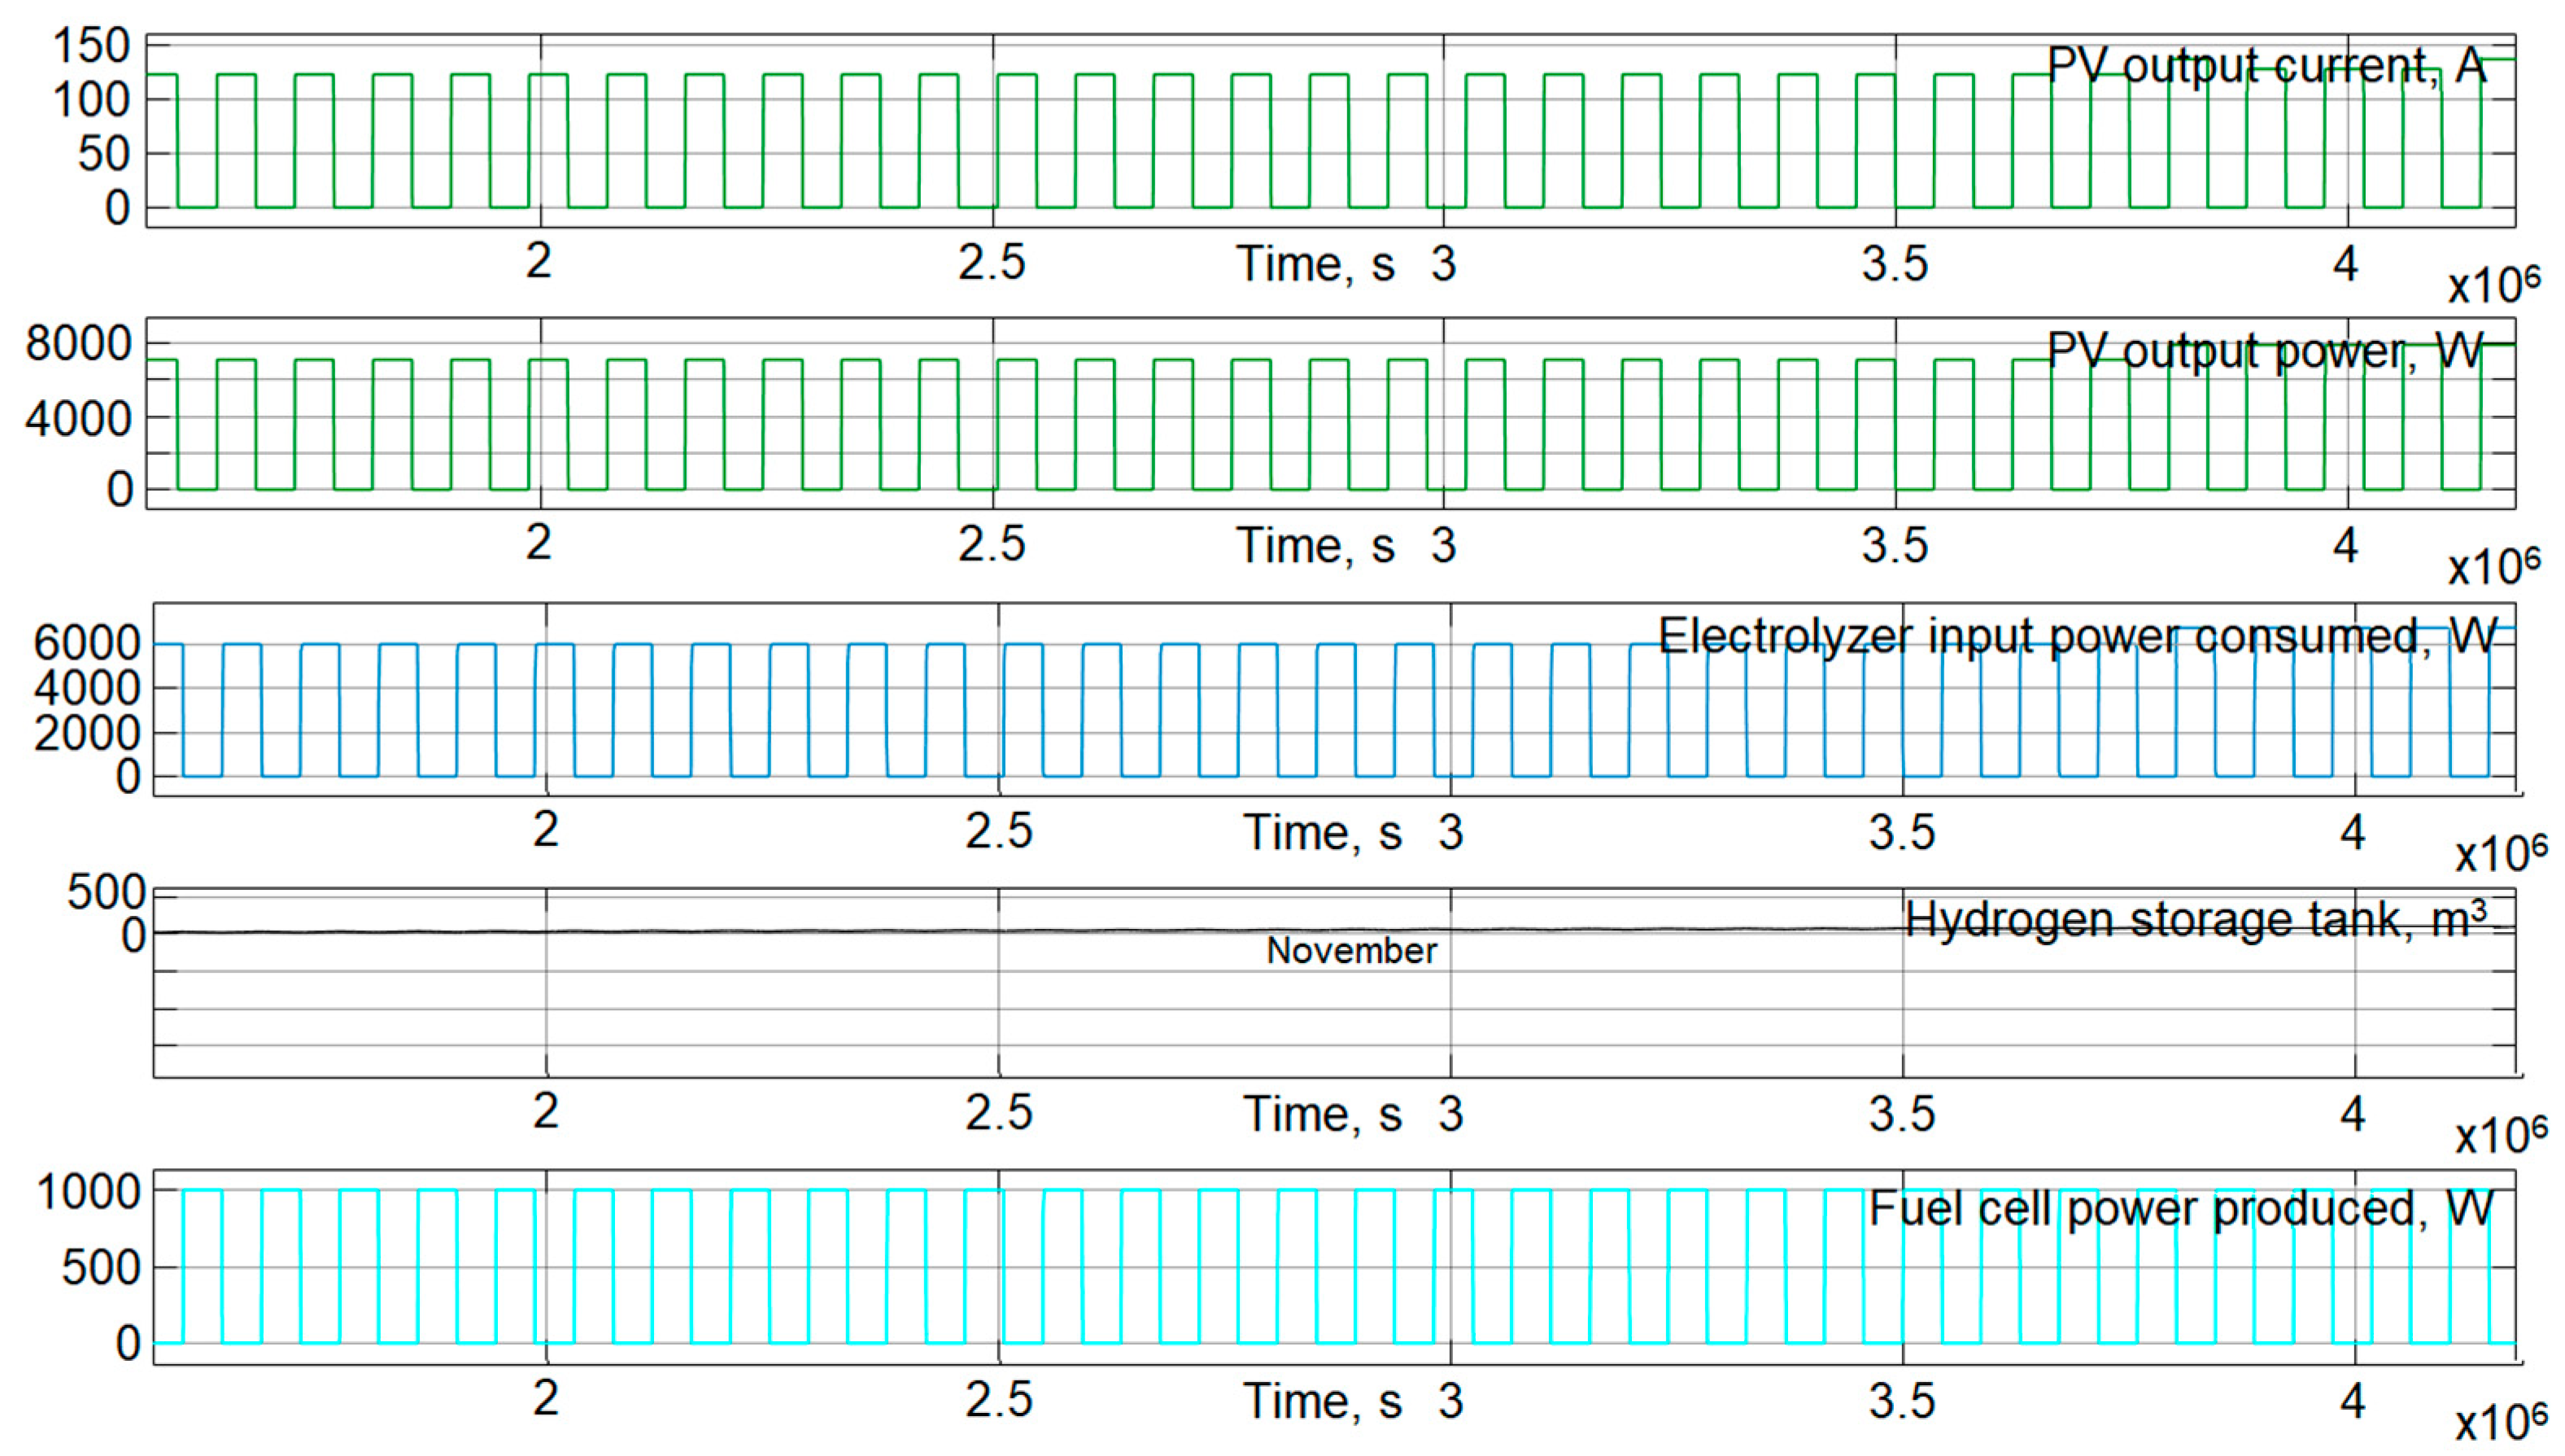
3.3. Simulation Results (Australia)
4. Results
4.1. Results of Simulation
- -
- The solar-powered hydrogen uninterrupted power plant in Australia requires 1.5 times fewer solar modules (23 pcs) for supplying the same 1 kW power consumer than it would require for Russia (35 pcs).
- -
- The hydrogen storage tank for Russia is almost twice as large as that for Australia and three times more than that for India, owing to more constant insolation in Manipal.
- -
- The electrolyzer power consumption also differs from location to location and reflects the time of its operation. In Russia, it works less; however, more solar modules should be used to drive it.
4.2. Results of Optimizing
5. Conclusions
Author Contributions
Funding
Acknowledgments
Conflicts of Interest
References
- Ramyashree, M.S.; Priya, S.S.; Freudenberg, N.C.; Sudhakar, K.; Tahir, M. Metal-organic framework-based photocatalysts for carbon dioxide reduction to methanol: A review on progress and application. J. CO2 Util 2020, 43, 101374. [Google Scholar]
- Gamil, M.M.; Sugimura, M.; Nakadomari, A.; Senjyu, T.; Howlader, H.O.R.; Takahashi, H.; Hemeida, A.M. Optimal Sizing of a Real Remote Japanese Microgrid with Sea Water Electrolysis Plant Under Time-Based Demand Response Programs. Energies 2020, 13, 3666. [Google Scholar] [CrossRef]
- Saiprasad, N.; Kalam, A.; Zayegh, A. Triple Bottom Line Analysis and Optimum Sizing of Renewable Energy Using Improved Hybrid Optimization Employing the Genetic Algorithm: A Case Study from India. Energies 2019, 12, 349. [Google Scholar] [CrossRef] [Green Version]
- Variar, A.G.; Ramyashree, M.S.; Ail, V.U.; Priya, S.S.; Sudhakar, K.; Tahir, M. Influence of various operational parameters in enhancing photocatalytic reduction efficiency of carbon dioxide in a photoreactor: A Review. J. Ind. Eng. Chem. 2021. [Google Scholar] [CrossRef]
- Our World in Data. Fossil Fuels, (n.d.). Available online: https://ourworldindata.org/fossil-fuels (accessed on 25 April 2021).
- Oil Reserves. BP. 2021, (n.d.). Available online: https://www.bp.com/en/global/corporate/energy-economics/statistical-review-of-world-energy/oil.html (accessed on 25 April 2021).
- Martins, F.; Felgueiras, C.; Smitkova, M.; Caetano, N. Analysis of Fossil Fuel Energy Consumption and Environmental Impacts in European Countries. Energies 2019, 12, 964. [Google Scholar] [CrossRef] [Green Version]
- China, D. Fueling the Future of Mobility Hydrogen and fuel cell solutions for transportation. Financ. Advis. 2020, 1. Available online: https://www2.deloitte.com/content/dam/Deloitte/cn/Documents/finance/deloitte-cn-fueling-the-future-of-mobility-en-200101.pdf (accessed on 7 January 2021).
- Gurtner, B. The Financial and Economic Crisis and Developing Countries. Int. Dev. Policy, Rev. Int. Polit. Développement 2010, 1, 189–213. [Google Scholar] [CrossRef]
- BP Energy Outlook. Edition The Energy Outlook Explores the Forces Shaping the Global Energy Transition Out to 2040 and the Key Uncertainties Surrounding That; BP Energy Outlook, London, United Kingdom.: 2019. Available online: www.bp.com (accessed on 25 April 2021).
- Bethoux, O. Hydrogen Fuel Cell Road Vehicles and Their Infrastructure: An Option towards an Environmentally Friendly Energy Transition. Energies 2020, 13, 6132. [Google Scholar] [CrossRef]
- Felseghi, R.-A.; Carcadea, E.; Raboaca, M.S.; Trufin, C.N.; Filote, C. Hydrogen Fuel Cell Technology for the Sustainable Future of Stationary Applications. Energies 2019, 12, 4593. [Google Scholar] [CrossRef] [Green Version]
- Rosen, M.A.; Koohi-Fayegh, S. The prospects for hydrogen as an energy carrier: An overview of hydrogen energy and hydrogen energy systems. Energy Ecol. Environ. 2016, 1, 10–29. [Google Scholar] [CrossRef] [Green Version]
- Azni, M.; Khalid, R.M. Hydrogen Fuel Cell Legal Framework in the United States, Germany, and South Korea—A Model for a Regulation in Malaysia. Sustainability 2021, 13, 2214. [Google Scholar] [CrossRef]
- Kwon, H.-I.; Cho, Y.-S.; Choi, S.-M. A Study on Optimal Power System Reinforcement Measures Following Renewable Energy Expansion. Energies 2020, 13, 5929. [Google Scholar] [CrossRef]
- Kumar, G.V.; Sarojini, R.K.; Palanisamy, K.; Padmanaban, S.; Holm-Nielsen, J.B. Large Scale Renewable Energy Integration: Issues and Solutions. Energies 2019, 12, 1996. [Google Scholar] [CrossRef] [Green Version]
- Jiménez-Buendía, F.; Villena-Ruiz, R.; Honrubia-Escribano, A.; Molina-García, Á.; Gómez-Lázaro, E. Submission of a WECC DFIG Wind Turbine Model to Spanish Operation Procedure 12.3. Energies 2019, 12, 3749. [Google Scholar] [CrossRef] [Green Version]
- Méndez, C.; Bicer, Y. Qatar’s Wind Energy Potential with Associated Financial and Environmental Benefits for the Natural Gas Industry. Energies 2019, 12, 3329. [Google Scholar] [CrossRef] [Green Version]
- Francis, A.; Priya, S.S.; Kumar, S.H.; Sudhakar, K.; Tahir, M. A review on recent developments in solar photoreactors for carbon dioxide conversion to fuels. J. CO2 Util 2021, 47, 101515. [Google Scholar] [CrossRef]
- Daraei, M.; Campana, P.E.; Thorin, E. Power-to-hydrogen storage integrated with rooftop photovoltaic systems and combined heat and power plants. Appl. Energy 2020, 276, 115499. [Google Scholar] [CrossRef]
- Hofmann, F.; Schlott, M.; Kies, A.; Stöcker, H. Flow Allocation in Meshed AC-DC Electricity Grids. Energies 2020, 13, 1233. [Google Scholar] [CrossRef] [Green Version]
- Al Wahedi, A.; Bicer, Y. A Case Study in Qatar for Optimal Energy Management of an Autonomous Electric Vehicle Fast Charging Station with Multiple Renewable Energy and Storage Systems. Energies 2020, 13, 5095. [Google Scholar] [CrossRef]
- Bizon, N.; Stan, V.A.; Cormos, A.C. Stan Optimization of the Fuel Cell Renewable Hybrid Power System using the Control Mode of the Required Load Power on the DC Bus. Energies 2019, 12, 1889. [Google Scholar] [CrossRef] [Green Version]
- Bajan, B.; Łukasiewicz, J.; Poczta-Wajda, A.; Poczta, W. Edible Energy Production and Energy Return on Investment—Long-Term Analysis of Global Changes. Energies 2021, 14, 1011. [Google Scholar] [CrossRef]
- Morenov, V.; Leusheva, E.; Buslaev, G.; Gudmestad, O.T. System of Comprehensive Energy-Efficient Utilization of Associated Petroleum Gas with Reduced Carbon Footprint in the Field Conditions. Energies 2020, 13, 4921. [Google Scholar] [CrossRef]
- Pijarski, P.; Kacejko, P. Voltage Optimization in MV Network with Distributed Generation Using Power Consumption Control in Electrolysis Installations. Energies 2021, 14, 993. [Google Scholar] [CrossRef]
- Węcel, D.; Jurczyk, M.; Uchman, W.; Skorek-Osikowska, A. Investigation on System for Renewable Electricity Storage in Small Scale Integrating Photovoltaics, Batteries, and Hydrogen Generator. Energies 2020, 13, 6039. [Google Scholar] [CrossRef]
- Ostadi, M.; Paso, K.G.; Rodriguez-Fabia, S.; Øi, L.E.; Manenti, F.; Hillestad, M. Process Integration of Green Hydrogen: Decarbonization of Chemical Industries. Energies 2020, 13, 4859. [Google Scholar] [CrossRef]
- Szima, S.; Cormos, C.-C. CO2 Utilization Technologies: A Techno-Economic Analysis for Synthetic Natural Gas Production. Energies 2021, 14, 1258. [Google Scholar] [CrossRef]
- Qyyum, M.A.; Chaniago, Y.D.; Ali, W.; Saulat, H.; Lee, M. Membrane-Assisted Removal of Hydrogen and Nitrogen from Synthetic Natural Gas for Energy-Efficient Liquefaction. Energies 2020, 13, 5023. [Google Scholar] [CrossRef]
- Lahnaoui, A.; Wulf, C.; Dalmazzone, D. Optimization of Hydrogen Cost and Transport Technology in France and Germany for Various Production and Demand Scenarios. Energies 2021, 14, 744. [Google Scholar] [CrossRef]
- Hinokuma, T.; Farzaneh, H.; Shaqour, A. Techno-Economic Analysis of a Fuzzy Logic Control Based Hybrid Renewable Energy System to Power a University Campus in Japan. Energies 2021, 14, 1960. [Google Scholar] [CrossRef]
- Mun, H.; Moon, B.; Park, S.; Yoon, Y. A Study on the Economic Feasibility of Stand-Alone Microgrid for Carbon-Free Island in Korea. Energies 2021, 14, 1913. [Google Scholar] [CrossRef]
- Abas, N.; Kalair, A.; Khan, N. Review of fossil fuels and future energy technologies. Futures 2015, 69, 31–49. [Google Scholar] [CrossRef]
- Gül, M.; Akyüz, E. Hydrogen Generation from a Small-Scale Solar Photovoltaic Thermal (PV/T) Electrolyzer System: Numerical Model and Experimental Verification. Energies 2020, 13. [Google Scholar] [CrossRef]
- Choi, H.-U.; Choi, K.-H. Performance Evaluation of PV/T Air Collector Having a Single-Pass Double-Flow Air Channel and Non-Uniform Cross-Section Transverse Rib. Energies 2020, 13, 2203. [Google Scholar] [CrossRef]
- Kim, J.-H.; Ahn, J.-G.; Kim, J.-T. Demonstration of the Performance of an Air-Type Photovoltaic Thermal (PVT) System Coupled with a Heat-Recovery Ventilator. Energies 2016, 9, 728. [Google Scholar] [CrossRef] [Green Version]
- Calise, F.; Figaj, R.D.; Vanoli, L. Experimental and Numerical Analyses of a Flat Plate Photovoltaic/Thermal Solar Collector. Energies 2017, 10, 491. [Google Scholar] [CrossRef] [Green Version]
- Yi, T.; Tong, L.; Qiu, M.; Liu, J. Analysis of Driving Factors of Photovoltaic Power Generation Efficiency: A Case Study in China. Energies 2019, 12, 355. [Google Scholar] [CrossRef] [Green Version]
- Nespoli, A.; Ogliari, E.; Leva, S.; Pavan, A.M.; Mellit, A.; Lughi, V.; Dolara, A. Day-Ahead Photovoltaic Forecasting: A Comparison of the Most Effective Techniques. Energies 2019, 12, 1621. [Google Scholar] [CrossRef] [Green Version]
- Li, W.; Ren, H.; Chen, P.; Wang, Y.; Qi, H. Key Operational Issues on the Integration of Large-Scale Solar Power Generation—A Literature Review. Energies 2020, 13, 5951. [Google Scholar] [CrossRef]
- Dolara, A.; Grimaccia, F.; Leva, S.; Mussetta, M.; Ogliari, E. A Physical Hybrid Artificial Neural Network for Short Term Forecasting of PV Plant Power Output. Energies 2015, 8, 1138–1153. [Google Scholar] [CrossRef] [Green Version]
- Massucco, S.; Mosaico, G.; Saviozzi, M.; Silvestro, F. A Hybrid Technique for Day-Ahead PV Generation Forecasting Using Clear-Sky Models or Ensemble of Artificial Neural Networks According to a Decision Tree Approach. Energies 2019, 12, 1298. [Google Scholar] [CrossRef] [Green Version]
- Al-Dahidi, S.; Ayadi, O.; Adeeb, J.; Alrbai, M.; Qawasmeh, B.R. Extreme Learning Machines for Solar Photovoltaic Power Predictions. Energies 2018, 11, 2725. [Google Scholar] [CrossRef] [Green Version]
- Liu, W.; Liu, C.; Lin, Y.; Ma, L.; Xiong, F.; Li, J. Ultra-Short-Term Forecast of Photovoltaic Output Power under Fog and Haze Weather. Energies 2018, 11, 528. [Google Scholar] [CrossRef] [Green Version]
- Lee, D.; Kim, K. Recurrent Neural Network-Based Hourly Prediction of Photovoltaic Power Output Using Meteorological Information. Energies 2019, 12, 215. [Google Scholar] [CrossRef] [Green Version]
- Machlev, R.; Batushansky, Z.; Soni, S.; Chadliev, V.; Belikov, J.; Levron, Y. Verification of Utility-Scale Solar Photovoltaic Plant Models for Dynamic Studies of Transmission Networks. Energies 2020, 13, 3191. [Google Scholar] [CrossRef]
- Schouten, B. Thermal efficiency Improvement of Closed Hydrogen and Oxygen Fuelled Combined Cycle Power Plants with the Application of Solid Oxide Fuel Cells Using an Exergy Analysis Method. Master’s Thesis, Delft University of Technology, Delft, The Netherlands, 9 April 2020. [Google Scholar]
- Tables of Monthly and Annual Amounts of Total Solar Radiation. Russian Region., NASA. (n.d.). Available online: https://www.solarhome.ru/basics/solar/radiation.htm (accessed on 9 April 2021).
- Photovoltaic Geographical Information System, Eur. Comm. (n.d.). Available online: https://re.jrc.ec.europa.eu/pvg_tools/en/tools.html (accessed on 9 April 2021).
- Pombeiro, H.; Silva, C.S. Analyzing Residential Electricity Consumption Patterns Based on Consumer’s Segmentation. 2012. Available online: http://ceur-ws.org/Vol-923/paper05.pdf (accessed on 25 April 2021).
- Hobby, J.D.; Tucci, G.H. Analysis of the residential, commercial and industrial electricity consumption. In Proceedings of the 2011 IEEE PES Innovative Smart Grid Technologies, Perth, WA, Australia, 13–16 November 2011; pp. 1–7. [Google Scholar] [CrossRef]
- Parameters of Solar Module, (n.d.). Available online: https://www.hevelsolar.com/catalog/solnechnye-moduli/ (accessed on 9 April 2021).
- VOLTIANA Electrolyzer. Technical Documentation. H2Nitidor Company, (n.d.). Available online: www.h2nitidor.com (accessed on 5 March 2021).
- Ultra-light Fuel Stack AEROSTAK Horizon, (n.d.). Available online: http://new.novatorlab.ru/ru/katalog/promyshlennost/toplivnye-elementy/ultralegkij-toplivnyj-stek-aerostaks-horizon-1000-vt (accessed on 5 March 2021).
- Table: Hydrogen Density at Different Temperatures and Pressures, Hydrog. Tools. (n.d.). Available online: https://h2tools.org/hyarc/hydrogen-data/hydrogen-density-different-temperatures-and-pressures (accessed on 25 April 2021).
- Solomin, E.; Kirpichnikova, I.; Amerkhanov, R.; Korobatov, D.; Lutovats, M.; Martyanov, A. Wind-hydrogen standalone uninterrupted power supply plant for all-climate application. Int. J. Hydrogen Energy 2019, 44, 3433–3449. [Google Scholar] [CrossRef]
- Shet, S.P.; Priya, S.S.; Sudhakar, K.; Tahir, M. A review on current trends in potential use of metal-organic framework for hydrogen storage. Int. J. Hydrogen Energy 2021, 46, 11782–11803. [Google Scholar] [CrossRef]


| Parameter | Value | Unit |
|---|---|---|
| Maximum power | 360 | W |
| Dimensions of solar panel | 1996 × 1002 × 30 | mm |
| Output operating voltage | 50 | V |
| Nominal voltage Unom | 43.3 | V |
| Current in nominal point Imnp | 8.32 | A |
| Current of short circuit Isc | 8.85 | A |
| Voltage of open circuit Uoc | 52.1 | V |
| Voltage temperature coefficient tU | −0.239 | %/°C |
| Current temperature coefficient tI | 0.035 | %/°C |
| Number of cells in module | 6 × 12 = 72 | pcs. |
| Parameter | Value | Unit |
|---|---|---|
| Capacity, as hydrogen (ref. dry gas) | 360 | Nm3/h |
| Current stack | 40–200 | A |
| Voltage stack at 80 °C | 48 | VDC |
| Power consumption electric | 11 | kW |
| Parameter | Value | Unit |
|---|---|---|
| Number of fuel cells | 65 | pcs |
| Rated power (and max) | 1000 (1300) | W |
| Reagents | hydrogen and air | |
| Operating temperature | 1–35 | °C |
| Maximum temperature | 65 | °C |
| Working pressure of hydrogen | 0.5–0.7 | Bar |
| Flow rate of hydrogen: maximum | 15.2 | L/min |
| Hydrogen purity requirement | 99.999 | % |
| Selected Location | Number of Solar Modules in an Array, pcs | Volume of Hydrogen Storage Tank, m3 | Total Energy Consumer by Electrolyzer per Year, kW∙h |
|---|---|---|---|
| Chelyabinsk, Russia | 35 | 2000 | 68 × 106 |
| Manipal, India | 32 | 600 | 90 × 106 |
| Gnaraloo, Australia | 23 | 800 | 80 × 106 |
Publisher’s Note: MDPI stays neutral with regard to jurisdictional claims in published maps and institutional affiliations. |
© 2021 by the authors. Licensee MDPI, Basel, Switzerland. This article is an open access article distributed under the terms and conditions of the Creative Commons Attribution (CC BY) license (https://creativecommons.org/licenses/by/4.0/).
Share and Cite
Solomin, E.; Selvanathan, S.P.; Kumarasamy, S.; Kovalyov, A.; Maddappa Srinivasa, R. The Comparison of Solar-Powered Hydrogen Closed-Cycle System Capacities for Selected Locations. Energies 2021, 14, 2722. https://doi.org/10.3390/en14092722
Solomin E, Selvanathan SP, Kumarasamy S, Kovalyov A, Maddappa Srinivasa R. The Comparison of Solar-Powered Hydrogen Closed-Cycle System Capacities for Selected Locations. Energies. 2021; 14(9):2722. https://doi.org/10.3390/en14092722
Chicago/Turabian StyleSolomin, Evgeny, Shanmuga Priya Selvanathan, Sudhakar Kumarasamy, Anton Kovalyov, and Ramyashree Maddappa Srinivasa. 2021. "The Comparison of Solar-Powered Hydrogen Closed-Cycle System Capacities for Selected Locations" Energies 14, no. 9: 2722. https://doi.org/10.3390/en14092722