
Developing Digital Economy and Society in the Light of the Issue of Digital Convergence of the Markets in the European Union Countries

 ,
,  ,
,
Abstract
:1. Introduction
2. The European Union’s Digital Economy and Society and Digital Convergence
- -
- The transition of electric power supply systems to the Industrial Internet of Things concept (using a network of sensors to monitor energy demand, manage its transmission and storage);
- -
- Using Artificial Intelligence to optimize energy transmission and distribution;
- -
- Management of energy resources and logistics using e.g., blockchain, which in turn increases the potential of operational efficiency in the activities of energy companies;
- -
- Monitoring of changes in demand with the use of smart grids and models of responding to changes in this area, which allows not only monitoring but also an autonomous response to these changes through appropriate energy distribution;
- -
- Creating the so-called Virtual Power Plants, i.e., systems integrating various energy sources for the purposes of distribution management and demand production control;
- -
- Creating energy management systems by consumers and prosumers to optimize energy production and consumption, along with the analysis and offer of optimal energy use from various sources. For the purposes of such a system, the so-called smart meters or IoT devices at the consumer (mobile reporting applications). The use of such systems also has an educational value, related to the increase in environmental awareness of users;
- -
- The use of digital modeling to design both new energy networks, as well as to improve the existing ones. The use of this tool will have a direct impact on the operational efficiency of economic entities from the energy sector, as it will allow for faster data analysis (compared to existing solutions) on the basis of real energy networks to prepare new investments, including reducing the costs of designing new installations;
- -
- The use of blockchain, i.e., security and automation of transactions within the energy network, e.g., when selling micro-amounts of energy between prosumers;
- -
- building systems in the form of the so-called “digital twins”. A digital replica of a physical object works in real-time with this object, making decisions regarding, for example, optimization of the operation and maintenance of physical fixed assets, production systems and processes in energy, design, organizing information, estimating project profitability, improving update processes, etc.
- Smart, knowledge-based and innovation-based development;
- Sustainable development (efficient use of resources, more environmentally friendly while increasing competitiveness);
- Inclusive development (social, territorial cohesion, with a high level of employment of the population of EU countries).
- The creation of the Digital Single Market;
- Improving the framework conditions for interoperability between information and communication technology products and services;
- Increase trust in the Internet and the security of its operations;
- Ensuring access to a much faster Internet;
- An increase in research and development expenditure;
- Developing digital literal use and inclusion skills;
- The use of information and communication technologies to address the challenges facing society, such as climate change, rising medical costs and an aging population.
- Ensuring easier access for consumers and businesses to digital goods and services across Europe;
- Creating an appropriate and level playing field enabling digital networks and innovative services to flourish;
- Maximizing the growth potential of the digital economy.
- The horizontal dimension of economy-wide actions, including the regulation of universal law, solutions and universal capabilities [67];
- Motivational dimension, related to the mental approach of society to modern technologies and means of communication;
- The material dimension relating to society’s access to these tools, resources, etc;
- The personal dimension, concerning the ability of members of the public to acquire, maintain and upgrade acquired capacities;
- The dimension of the use of technology and the social impact achieved.
- Willingness to develop on the resource and skills side, which are necessary for its occurrence;
- An increase, expressed in the availability and use of the necessary tools, techniques, methods, functions, etc. on the road to digital development;
- Impact–economic impact and effects obtained.
- -
- The convergence of networks;
- -
- The convergence of terminals;
- -
- The convergence of services;
- -
- The convergence of rhetoric;
- -
- The convergence of markets;
- -
- The convergence of regulatory regimes.
3. Materials and Methods
4. The Digital Economy and Society in the Countries of the European Union in 2015 and 2020. Convergence or Digital Diversity? Results of Empirical Studies
- In 2015, the lowest rate recorded for Greece was 67.16% of the EU-28 average and the highest for Denmark was 146.44%;
- In 2020, the lowest rate recorded for Bulgaria was 69.25% of the EU-28 average and the highest for Finland was 137.42%.
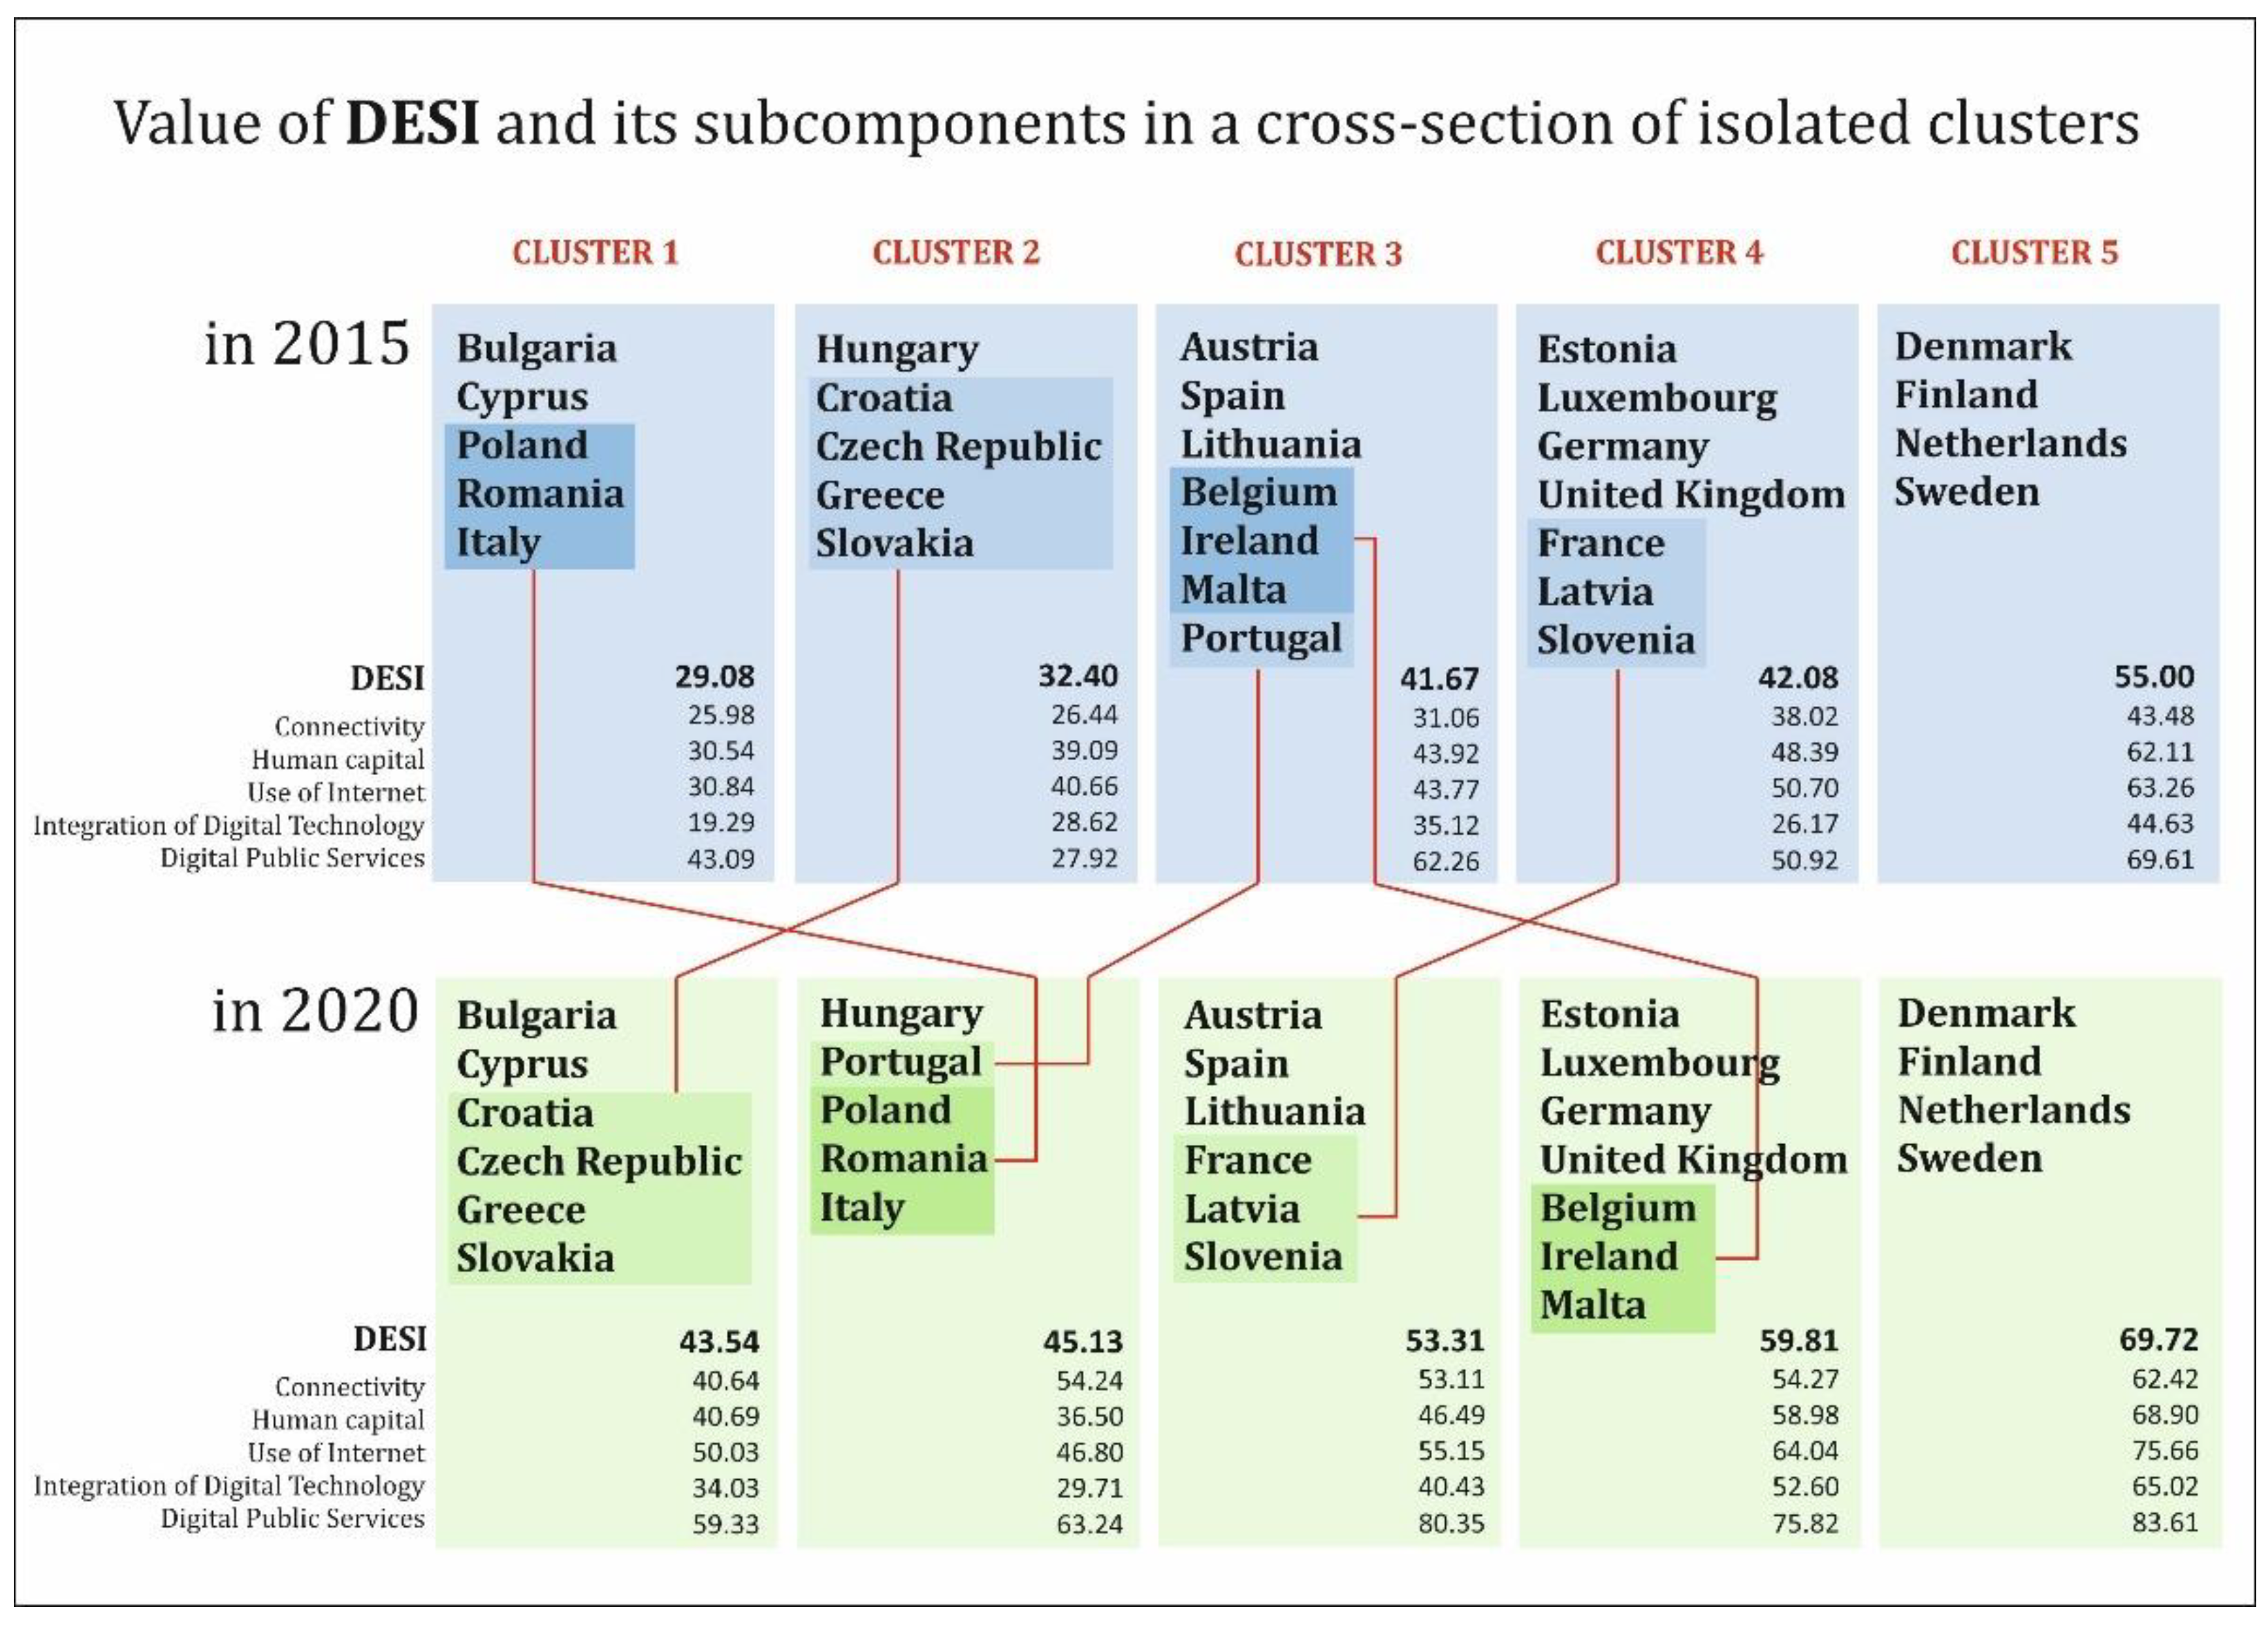
- For Cluster 1 in 2015, the DESI was 29.08 points and in 2020 it was 43.54 points, an increase of 49.74%. The achieved indicator values for Cluster 1 were below the UNION average;
- For Cluster 2 in 2015, DESI was 32.40 points and in 2020 45.13 points, an increase of 39.32%. The DESI values obtained for this cluster were below the Union average;
- For Cluster 3 in 2015, DESI was 41.67 points, then increased to 53.31 in 2020, i.e., by 27.92%, and its values in both 2015 and 2020 were above the Union average;
- For Cluster 4 in 2015, DESI accounted for 42.08 points, after which it increased to 59.81 in 2020, i.e., by 42.13%, and its values in both 2015 and 2020 were above the Union average;
- For Cluster 5 in 2015, DESI was 55.00 points, then increased to 69.72 in 2020, i.e., by 26.76%, and its values were both above the EU average in 2015 and 2020.
- In 2015, the country with the lowest rate in Cyprus accounted for 56.0% of the EU-28 average and Latvia’s highest-rate country accounted for 146.2%;
- Greece had the lowest score in 2020 (66.7% of the EU-28 average), while Denmark had the best result (131.5% of the EU-28 average).
- In 2015, the average indicator for Cluster 1 and Cluster 2 was below the EU-28 average, Cluster 3 was very close to Cluster 3, while Clusters 4 and 5 were above the EU-28 average;
- In 2015, almost all countries in Cluster 1 and Cluster 2 (with the exception of Romania in Cluster 1 and the Czech Republic in Cluster 2) had a connectivity ratio below the EU-28 average. In the third cluster, they were three out of four countries (Austria, Ireland, Portugal) and in the Cluster 4 there was one country (France);
- In 2020, the average connectivity value for the first cluster was below the EU-28 average, while in the remaining clusters it was higher than the EU-28 average;
- In 2020, in Cluster 1, all countries did not reach the EU average, Cluster 2 below average had one country (Italy), in Cluster 3–three countries (Austria, France and Lithuania) and in Cluster 4 there were another two (Ireland and the United Kingdom).
- In 2015, the country with the lowest rate in this area, Romania, accounted for 62.4% of the EU-28 average, while Finland’s highest-rate country accounted for 164.1%;
- Italy had the lowest score in 2020 (65.8% of the EU-28 average), while Finland had the best result (159.1% of the EU-28 average), of which it can be concluded that only a slight reduction in polarization in the area of human capital is noticeable in relative (percentage) terms, as the range between the lowest and highest rates in relation to the EU-28 average decreased from 101.7 percentage points in 2015 to 93.3 percentage points in 2020. The ratio of the performance of the countries in the extreme places in the ranking of this indicator has also changed only slightly. In 2015, the ratio of the best performance in the area of human capital of Finland to the lowest rate in Romania was 2.6, while in 2020 the ratio for the highest in the area of human capital of Finland and Italy was 2.4.
- In 2015, the average indicator for the Human Capital component of Cluster 1 and 2 countries was below the EU average, Cluster 3 was almost at the EU average, while Clusters 4 and 5 were above the EU average;
- Almost all the countries included in Clusters 1 and 2 (with the exception of the Czech Republic in Cluster 2) had a sub-indicator value in this area below the EU average. In the third Cluster, this included three of the seven countries (Spain, Lithuania, Portugal) and in Cluster four there were two countries (Latvia and Slovenia);
- In 2020, the average value of Human Capital in Clusters 1, 2 and 3 was below the EU average, with lower values than the EU average for all countries in these Clusters except Austria in Cluster 3;
- In 2020, in Clusters 4 and 5, the average value of the indicator in the cluster, as well as the values of indicators for all countries in these clusters, were higher than the EU-28 average.
- In 2015, the average rate for the Use of Internet component of Cluster 1, 2 and 3 countries was below the EU average, while Clusters 4 and 5 were above that average;
- Almost all the countries included in Cluster 1 and Cluster 2 (with the exception of Hungary in Cluster 2 and Belgium, Lithuania and Malta in Cluster 3) had a sub-indicator value in this area below the EU average. In Cluster 4, they were two of the seven countries (France, Slovenia);
- In 2020, the average use of Internet value in Clusters 1, 2 and 3 was below the EU average, with lower values than the EU average for all countries in these clusters except Spain in Cluster 3;
- In 2020, in Clusters 4 and 5, the average value of the indicator in the cluster, as well as the values of indicators for all countries in these clusters, were higher than the EU-28 average.
- In 2015, the average value of this indicator for Cluster countries 1, 2 and 4 was below the EU average, while for Clusters 3 and 5 it was above that average. It is, therefore, worth noting that the countries of the fourth cluster were characterized by relatively poor performance in this area compared to the EU average;
- Almost all countries in Cluster 1 and Cluster 2 (with the exception of Croatia and the Czech Republic in Cluster 2) had sub-index value in this area below the EU average. In the third cluster, it was only Austria, and in the fourth cluster as many as six out of seven countries (the exception was the United Kingdom);
- In 2020, the average value of indicators for this component in Clusters 1, 2 and 3 was below the EU average, with lower values than the EU average for all countries in these clusters except Croatia and the Czech Republic in Cluster 1 and France and Lithuania in Cluster 3;
- In 2020, in Clusters 4 and 5, the average value of the indicator in the cluster, as well as the values of indicators for countries in these clusters, were higher than the EU-28 average, with the exception of Estonia, Luxembourg and Germany in Cluster 4.
- E-government users;
- Partially completed forms;
- Comprehensive online services, including business services;
- The advancement of open data as a condition for greater participation of citizens in such services, as well as the basis for the development of new ICT solutions;
- E-Health.
- In 2015, the lowest rate recorded for Greece was 41.07% of the EU-28 average and the highest for Estonia was 153.93%;
- In 2020, the lowest rate recorded for Romania was 67.23% of the EU-28 average and the highest for Estonia was 124.08%. This clearly attests to the decreasing spread of performance between EU countries in relation to the average (from 112.86 pps in 2015 to 56.84 pps in 2020), which promotes their convergence. The positive convergence process is also confirmed by the improvement in the relationship between the performance of the countries with the highest and lowest rates, as it has decreased from 3.74 in 2015 to 1.85 in 2020. However, it is still substantially high.
- For Cluster 1 in 2015, the rate was 43.09 points, 59.33 in 2020, an increase of 37.7%. However, the achieved indicator values for Cluster 1 were below the UNION average;
- For Cluster 2 in 2015, the DPS was 27.92 points and in 2020 it was 63.24 points, an increase of 126.5%. Despite such significant pro-growth developments, the DPS achieved for this cluster was below the Union average;
- For Cluster 3 in 2015, the DPS was 62.26 points, then increased to 80.35 in 2020, i.e., by 29.0%, and its values in both 2015 and 2020 were above the Union average;
- For Cluster 4 in 2015, the DPS accounted for 50.92 points, after which it increased to 75.82 in 2020, i.e., by 48.9%, and its values in both 2015 and 2020 were above the Union average;
- For Cluster 5 in 2015, the DPS was 69.61 points, then increased to 83.61 in 2020, i.e., by 20.1%, and its values were both above the EU average in 2015 and 2020.
5. Discussion of Findings
- Cluster 1: Bulgaria, Cyprus;
- Cluster 2: Hungary;
- Cluster 3: Austria, Spain, Lithuania;
- Cluster 4: Germany, Estonia, Luxembourg, the United Kingdom;
- Cluster 5: Denmark, Finland, the Netherlands and Sweden;
- from Cluster 1 to Cluster 2: Italy, Poland, Romania;
- from Cluster 3 to Cluster 4: Belgium, Ireland, Malta;
- from Cluster 4 to Cluster 3: France, Latvia, Slovenia;
- from Cluster 3 to Cluster 2: Portugal;
- from Cluster 2 to Cluster 1: The Czech Republic, Greece, Croatia, Slovakia.
6. Conclusions
Author Contributions
Funding
Institutional Review Board Statement
Informed Consent Statement
Data Availability Statement
Conflicts of Interest
Appendix A

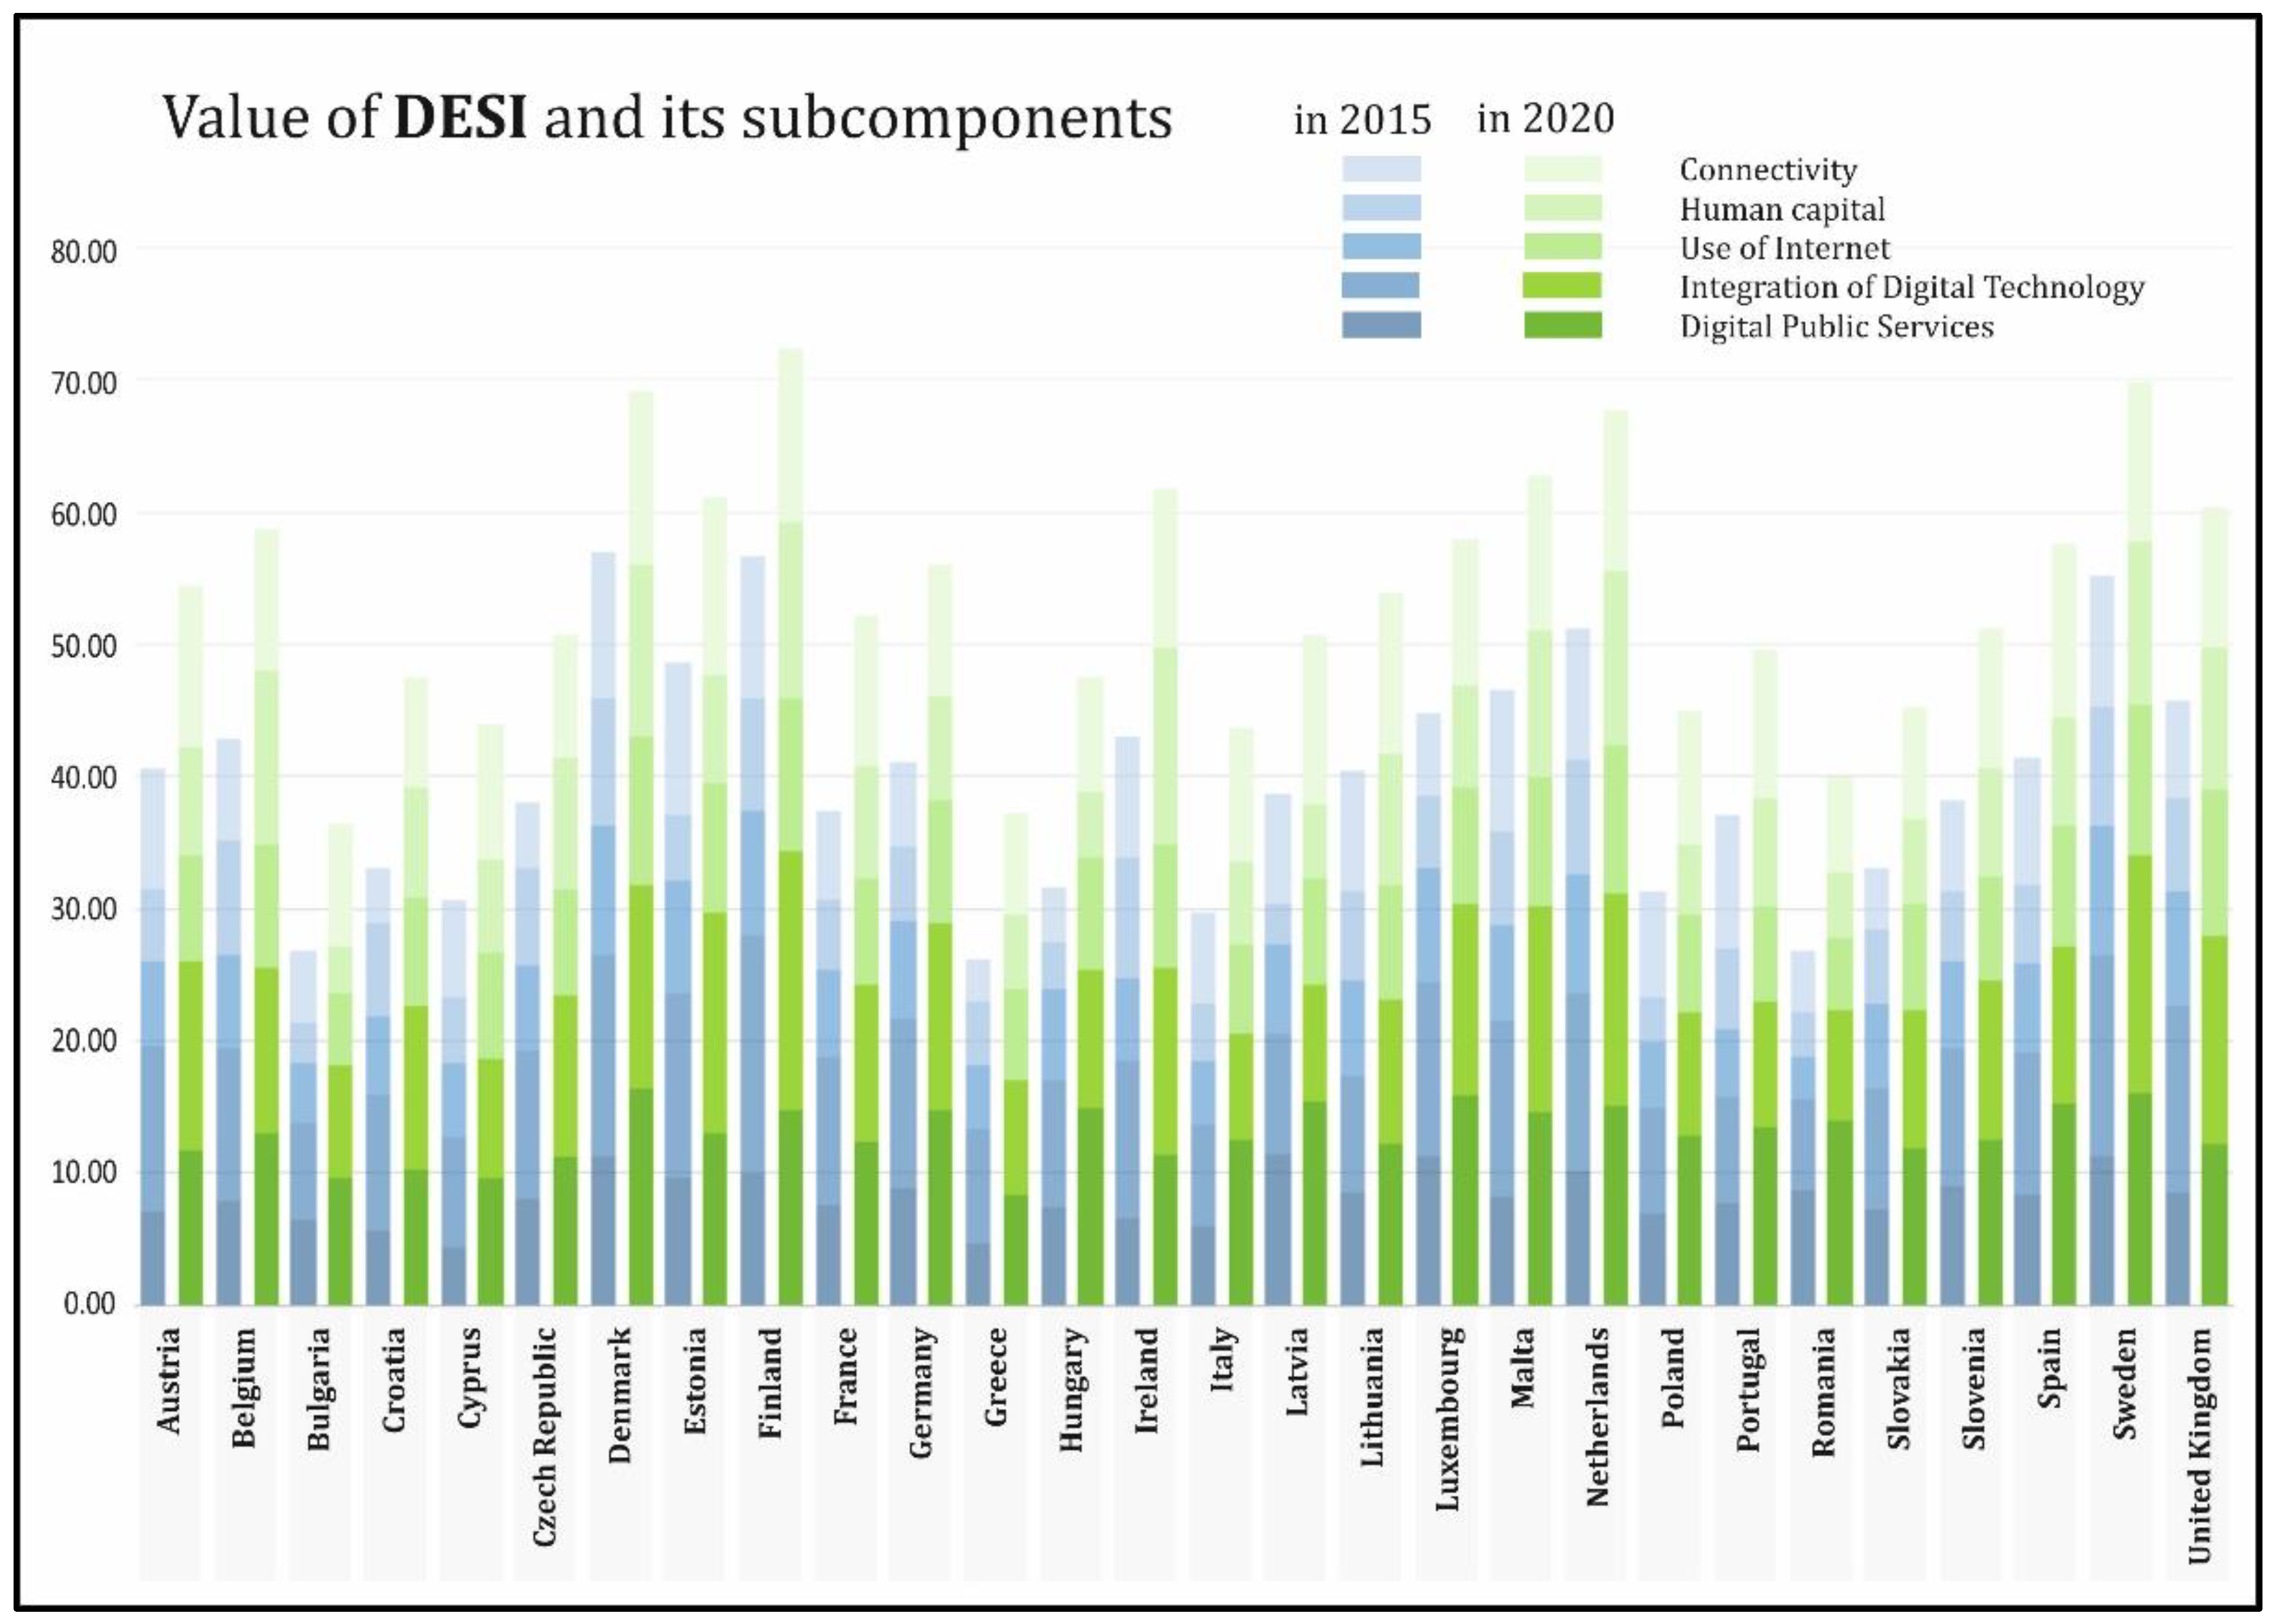
| Country | DESI | Connectivity | Human Capital | Use of Internet Services | Integration of Digital Technology | Digital Public Services |
|---|---|---|---|---|---|---|
| Austria | 40,54 | 28,26 | 50,19 | 42,20 | 28,02 | 59,93 |
| Belgium | 42,82 | 31,44 | 46,38 | 47,19 | 42,84 | 51,46 |
| Bulgaria | 26,81 | 26,10 | 29,18 | 29,51 | 15,28 | 36,73 |
| Croatia | 33,00 | 22,60 | 41,00 | 39,20 | 35,74 | 27,14 |
| Cyprus | 30,65 | 17,44 | 33,55 | 37,48 | 25,00 | 48,52 |
| Czech Republic | 38,10 | 32,38 | 44,86 | 42,60 | 37,20 | 33,04 |
| Denmark | 56,98 | 45,11 | 60,63 | 65,31 | 47,96 | 74,38 |
| Estonia | 48,69 | 38,69 | 55,89 | 56,73 | 24,71 | 77,29 |
| Finland | 56,67 | 39,64 | 72,21 | 63,11 | 42,13 | 72,12 |
| France | 37,46 | 30,63 | 44,26 | 44,57 | 25,91 | 45,80 |
| Germany | 41,08 | 35,70 | 51,26 | 48,66 | 28,48 | 42,31 |
| Greece | 26,13 | 18,93 | 34,21 | 32,67 | 24,27 | 20,62 |
| Hungary | 31,69 | 29,40 | 38,44 | 46,03 | 17,95 | 28,21 |
| Ireland | 43,07 | 26,29 | 47,46 | 41,49 | 46,29 | 61,01 |
| Italy | 29,75 | 23,58 | 30,81 | 32,08 | 22,18 | 46,04 |
| Latvia | 38,62 | 45,52 | 36,73 | 45,04 | 15,53 | 54,64 |
| Lithuania | 40,37 | 34,33 | 34,94 | 48,15 | 33,68 | 60,65 |
| Luxembourg | 44,77 | 45,10 | 52,57 | 58,22 | 26,90 | 41,58 |
| Malta | 46,49 | 32,73 | 53,36 | 47,70 | 35,65 | 71,20 |
| Netherlands | 51,23 | 40,37 | 54,33 | 59,55 | 43,38 | 66,31 |
| Poland | 31,31 | 27,84 | 31,68 | 33,42 | 17,27 | 53,06 |
| Portugal | 37,08 | 30,85 | 31,91 | 34,87 | 30,12 | 67,55 |
| Romania | 26,87 | 34,94 | 27,47 | 21,71 | 16,73 | 31,11 |
| Slovenia | 38,23 | 36,28 | 41,66 | 43,41 | 26,67 | 46,02 |
| Slovakia | 33,06 | 28,88 | 36,97 | 42,78 | 27,95 | 30,60 |
| Spain | 41,36 | 33,54 | 43,20 | 44,77 | 29,27 | 64,06 |
| Sweden | 55,13 | 44,80 | 61,26 | 65,07 | 45,05 | 65,64 |
| United Kingdom | 45,70 | 34,23 | 56,35 | 58,25 | 35,00 | 48,80 |
| EU-28 | 38,91 | 31,13 | 43,99 | 45,01 | 29,22 | 50,21 |
| Country | DESI | Connectivity | Human Capital | Use of Internet Services | Integration of Digital Technology | Digital Public Services |
|---|---|---|---|---|---|---|
| Austria | 54,31 | 47,15 | 56,73 | 54,02 | 40,58 | 80,84 |
| Belgium | 58,71 | 52,03 | 50,39 | 61,16 | 65,87 | 71,73 |
| Bulgaria | 36,44 | 38,50 | 33,92 | 36,65 | 17,86 | 61,76 |
| Croatia | 47,56 | 41,15 | 49,15 | 55,48 | 41,47 | 55,75 |
| Cyprus | 43,98 | 38,46 | 35,80 | 54,48 | 34,48 | 68,96 |
| Czech Republic | 50,78 | 44,88 | 48,64 | 54,14 | 49,59 | 62,38 |
| Denmark | 69,15 | 65,82 | 61,28 | 75,15 | 65,15 | 87,13 |
| Estonia | 61,07 | 51,86 | 66,66 | 65,42 | 41,15 | 89,33 |
| Finland | 72,31 | 59,17 | 78,44 | 76,34 | 67,05 | 86,99 |
| France | 52,19 | 49,84 | 47,43 | 53,06 | 42,05 | 76,71 |
| Germany | 56,05 | 59,40 | 56,42 | 61,57 | 39,53 | 66,37 |
| Greece | 37,32 | 33,37 | 34,79 | 46,09 | 28,20 | 51,50 |
| Hungary | 47,52 | 59,79 | 41,84 | 55,90 | 25,31 | 57,77 |
| Ireland | 61,79 | 45,69 | 56,40 | 62,09 | 74,32 | 80,63 |
| Italy | 43,65 | 49,99 | 32,46 | 44,48 | 31,23 | 67,48 |
| Latvia | 50,71 | 61,76 | 35,02 | 53,98 | 28,31 | 85,06 |
| Lithuania | 53,89 | 48,88 | 43,83 | 57,32 | 49,47 | 81,45 |
| Luxembourg | 57,92 | 63,35 | 58,22 | 58,85 | 38,21 | 73,74 |
| Malta | 62,70 | 58,72 | 61,76 | 65,90 | 54,90 | 78,13 |
| Netherlands | 67,69 | 60,32 | 64,16 | 75,20 | 65,75 | 80,96 |
| Poland | 44,96 | 51,34 | 37,27 | 49,64 | 26,24 | 67,41 |
| Portugal | 49,58 | 53,92 | 37,77 | 48,09 | 40,87 | 75,12 |
| Romania | 39,97 | 56,19 | 33,16 | 35,89 | 24,93 | 48,41 |
| Slovenia | 51,20 | 50,23 | 48,35 | 51,71 | 40,95 | 70,75 |
| Slovakia | 45,18 | 47,46 | 41,81 | 53,36 | 32,57 | 55,61 |
| Spain | 57,54 | 60,79 | 47,56 | 60,78 | 41,22 | 87,28 |
| Sweden | 69,74 | 64,37 | 71,72 | 75,95 | 62,13 | 79,34 |
| United Kingdom | 60,41 | 48,82 | 63,00 | 73,31 | 54,19 | 70,77 |
| EU-28 | 52,62 | 50,06 | 49,29 | 58,03 | 41,37 | 72,00 |
References
- Iersel, J.P. Europe 2020 and the future of the European Union. Dans Eur. Format. 2011, 4, 147–168. [Google Scholar] [CrossRef]
- Martens, W. Europe 2020 and beyond. Eur. View 2010, 9, 1–3. [Google Scholar] [CrossRef]
- Hoedl, E. Europe 2020 strategy and European recovery. Probl. Sust. Dev. 2011, 6, 11–18. [Google Scholar]
- Lundvall, B.A.; Lorenz, E. From the Lisbon strategy to Europe 2020. In Towards Social Investment Welfare State? Ideas, Policies and Challenges; Morel, N., Palier, B., Palme, J., Eds.; Policy Press: Bristol, UK, 2016; pp. 333–352. [Google Scholar]
- Siuta-Tokarska, B.; Their, A.; Żmija, K. Procesy i Problemy w Realizacji Zrównoważonego i Trwałego Rozwoju w Polsce. Kontekst mikroekonomiczny (Processes and Problems in the Implementation of Sustainable Development in Poland. Microeconomic Context); PWN: Warszawa, Poland, 2019; pp. 11–28. [Google Scholar]
- Portillo, A.F.; Gonzalez, M.A.; Mogollon, R.H. Impact of ICT development on economic growth. A study of OECD European union countries. Technol. Soc. 2020, 63. [Google Scholar] [CrossRef]
- Das, A.; Khan, S.M. Effects of ICT development on economic growth in emerging Asian countries. In ICT in Developing Countries. Research, Practices and Policy Implications; Day, B., Sorour, K., Filieri, R., Eds.; Palgrave Macmillan: London, UK, 2016; pp. 141–159. [Google Scholar]
- Day, B.; Ali, F. A critical review of the ICT for development research. In ICT in Developing Countries. Research, Practices and Policy Implications; Day, B., Sorour, K., Filieri, R., Eds.; Palgrave Macmillan: London, UK, 2016; pp. 3–23. [Google Scholar]
- Vicente, M.R.; Gil-de-Bernabe, F. Assessing the broadband gap: From the penetration divide to the quality divide. Technol. Forecast. Soc. Chang. 2010, 77, 816–822. [Google Scholar] [CrossRef]
- Vicente, M.R.; Lopez, A.J. A multidimensional analysis of the disability digital divide: Some evidence for internet use. Inf. Soc. Int. J. 2010, 26, 48–64. [Google Scholar] [CrossRef]
- Cilan, A.; Bolat, B.A.; Coskun, E. Analyzing digital divide within and between member and candidate countries of European Union. Gov. Inf. Q. 2009, 26, 98–105. [Google Scholar] [CrossRef]
- Drożdż, W.; Miśkiewicz, R.; Pokrzywniak, J.; Elżanowski, F. Urban. Electromobility in the Context of Industry 4.0; Wydawnictwo Adam Marszałek: Toruń, Poland, 2019. [Google Scholar]
- Selvin, N.; Facer, K. Beyond the Digital Divide: Rethinking Digital Inclusion for the 21st Century; Futurelab: Bristol, UK, 2007; p. 40. [Google Scholar]
- Valenduc, G.; Vendramin, P. Work in the Digital Economy: Sorting the Old from the New; ETUI aisbl: Brussels, Belgium, 2016. [Google Scholar]
- Servoz, M. AI. The Future of Work? Work of the Future! On How Artificial Intelligence, Robotics and Automation Are Transforming Jobs and the Economy in Europe; European Commission: Brussels, Belgium, 2019. [Google Scholar]
- Brynjolfsson, E.; McAfee, A. Machine, Platform, Crowd: Harnessing Our Digital Future; W.W. Norton & Company: New York, NY, USA, 2017. [Google Scholar]
- Brooks, S.; Donovan, P.; Rumble, C. Developing nations. The digital divide and research databases. Ser. Rev. 2005, 31, 270–278. [Google Scholar] [CrossRef]
- Qiang, C.Z.; Rossotto, C.M. Information and Communications for Development 2009: Extending Reach and Increasing Impact; World Bank: Washington, DC, USA, 2009; pp. 35–50. [Google Scholar]
- Koutroumpis, P. The economic impact of broadband on growth: A simultaneous approach. Telecommun. Policy 2009, 33, 471–485. [Google Scholar] [CrossRef]
- Czernich, N.; Falck, O.; Kretschmer, T.; Woessmann, L. Broadband infrastructure and economic growth. Econ. J. 2011, 121, 505–532. [Google Scholar] [CrossRef]
- Kongaut, C.; Bohlin, E. Impact of broadband speed on economic outputs: An empirical study of OECD countries. In Proceedings of the 25th European Regional Conference of the International Telecommunications Society (ITS), Brussels, Belgium, 22–25 June 2014. [Google Scholar]
- Van Dijk, J.; Hacker, K. The digital divide as a complex and dynamic phenomenon. Inform. Soc. 2003, 19, 315–326. [Google Scholar] [CrossRef]
- Cruz-Jesus, F.; Oliveira, T.; Bacao, F. Digital divide across the European Union. Inf. Manag. 2012, 4, 278–291. [Google Scholar] [CrossRef]
- Fors, M.; Moreno, A. The benefits and obstacles of implementing ICT strategies for development from a bottom-up approach. Aslib Proc. 2002, 54, 198–206. [Google Scholar] [CrossRef]
- Kuriyan, R.; Ray, I.; Toyama, K. Information communication technologies for development: The bottom of the pyramid model in practice. Inf. Soc. 2008, 24, 1–12. [Google Scholar] [CrossRef]
- Mariscal, J. Digital divide in a developing country. Telecommun. Policy 2005, 29, 409–428. [Google Scholar] [CrossRef]
- Parmar, V.; Keyson, D.; de Bont, C. International federation for information processing shaping social belief: A community sensitive health information system for rural India. In Home Informatics and Telematics: ICTs for the Next Billion; Venkatesh, A., Gonzalves, T., Monk, A., Buckner, K., Eds.; Springer: Boston, MA, USA, 2007; pp. 133–144. [Google Scholar]
- Donner, J. Research approaches to mobile use in the developing world: A review of the literature. In Proceedings of the International Conference on Mobile Communication and Asian Modernities, Hong Kong, China, 7–8 June 2005. [Google Scholar]
- Rashid, A.T.; Elder, L. Mobile phones and development: An analysis of IDRC—Upported projects. Electron. J. Inf. Syst. Dev. Ctries. 2009, 36, 1–16. [Google Scholar] [CrossRef]
- Thapa, D.; Sæbø, Ø. Exploring the link between ICT and development in the context of developing countries: A literature review. Electron. J. Inf. Syst. Dev. Ctries. 2014, 64, 1–15. [Google Scholar] [CrossRef] [Green Version]
- Van Dijk, J.A.G.M. The Evolution of the Digital Divide. The Digital Divide Turns to Inequality of Skills and Usage, Digital Enlightenment Yearbook; IOS Press: Amsterdam, The Netherlands, 2012; pp. 57–78. [Google Scholar]
- Jabłoński, A.; Jabłoński, M. Social perspectives in digital business models of railway enterprises. Energies 2020, 13, 6445. [Google Scholar] [CrossRef]
- Pelau, C.; Acatrinei, C. The paradox of energy consumption decrease in the transition period towards a digital society. Energies 2019, 12, 1428. [Google Scholar] [CrossRef] [Green Version]
- Chen, S.; Zhou, M. Evolving container to Unikernel for edge computing and applications in process industry. Processes 2021, 9, 351. [Google Scholar] [CrossRef]
- Kling, R.; Lamb, R. IT and organizational change in digital economies. In Understanding the Digital Economy; Brynjolfsson, E., Kahin, B., Eds.; MIT Press: Cambridge, MA, USA, 2000; pp. 295–324. [Google Scholar]
- Dahlman, C.; Mealy, S.; Wermelinger, M. Harnessing the Digital Economy for Developing Countries; OECD: Paris, France, 2016. [Google Scholar]
- Tapscott, D. The Digital Economy: Promise and Peril in the Age of Networked Intelligence; McGraw-Hill: New York, NY, USA, 1996. [Google Scholar]
- Lane, N. Advancing the digital economy into the 21st century. Inf. Syst. Front. 1999, 1, 317–320. [Google Scholar] [CrossRef]
- Brynjolfsson, E.; Kahin, B. (Eds.) Understanding the Digital Economy: Data, Tools, and Research; MIT Press: Cambridge, MA, USA, 2000. [Google Scholar]
- Mesenbourg, T.L. Measuring the Digital Economy; US Bureau of the Census: Suitland, MD, USA, 2001.
- Knickrehm, M.; Berthon, B.; Daugherty, P. Digital Disruption: The Growth Multiplier; Accenture: Dublin, Ireland, 2016. [Google Scholar]
- Domazet, I.; Zubović, J.; Lazić, M. Driving factors of Serbian competitiveness: Digital economy and ICT. Strateg. Manag. 2018, 23, 20–28. [Google Scholar] [CrossRef] [Green Version]
- Bukht, R.; Heeks, R. Defining, Conceptualising and Measuring the Digital Economy; University of Manchaster: Manchaster, UK, 2017; pp. 4–10. [Google Scholar]
- A Roadmap toward a Common Framework for Measuring the Digital Economy, Report for the G20 Digital Economy Task Force; OECD: Nejla Saula, Saudi Arabia, 2020.
- Preparing the Future of Work We Want: The Digital Economy and Labour Skills and Competences. In Proceedings of the 19th American Regional Meeting, Panama City, Panama, 2–5 October 2018; International Labour Organization: Geneva, Switzerland, 2018. Available online: https://www.ilo.org/wcmsp5/groups/public/---ed_norm/---relconf/documents/meetingdocument/wcms_644863.pdf (accessed on 5 January 2021).
- The Digital Economy for Structural Change and Equality; ECLAC: Santiago, Chile, 2013.
- Katzenbach, C.; Bächle, T.C. Defining concepts of the digital society. Internet Policy Rev. 2019, 8. [Google Scholar] [CrossRef] [Green Version]
- Isin, E.; Ruppert, E. Being Digital Citizens; Rowman & Littlefield Publishers: London, UK, 2015. [Google Scholar]
- Sandulescu Budea, A.M. An approximation in the study of communication research: Digital evolution and the study of this subject in spanish academic journals. In Improving University Reputation through Academic Digital Branding; Del Pino, A.D., Romero, N.L., Eds.; IGI Global: Hershey, PA, USA, 2021. [Google Scholar]
- Finos, R. 2016–2026 Worldwide Big Market Forecast, Wikibon 2016. Available online: https://wikibon.com/2016-2026-worldwide-big-data-market-forecast/ (accessed on 5 January 2021).
- Efimova, A.; Ruchkina, M.O.; Tereshina, O.Y. Transformation of the energy sector in conditions of digital economy. Light Eng. 2018, 26, 69–75. [Google Scholar]
- Vlasov, A.I.; Shakhnov, V.A.; Filin, S.S.; Krivoshein, A.I. Sustainable energy systems in the digital economy: Concept of smart machines. Entrep. Sustain. Issues 2019, 6, 1975–1986. [Google Scholar] [CrossRef]
- Avdeeva, E.; Davydova, T.; Belyantseva, O.; Makeeva, T. Factors of Sustainable Development of Energy Technologies in the Formation of Digital Economy. In Proceedings of the E3S Web Conference “Topical Problems of Green Architecture, Civil and Environmental Engineering” (TPACEE 2019), Moscow, Russia, 19–22 November 2019. [Google Scholar] [CrossRef]
- Morishita-Steffen, N.; Alberola, R.; Mougeot, B.; Vignali, E.; Wikström, C.; Montag, U.; Gastaud, E.; Lutz, B.; Hartmann, G.; Pfaffenbichler, F.X.; et al. Smarter together: Progressing smart data platforms in Lyon, Munich, and Vienna. Energies 2021, 14, 1075. [Google Scholar] [CrossRef]
- Borowski, F. Innovative Processes in Managing an Enterprise from the Energy and Food Sector in the Era of Industry 4.0. Processes 2021, 9, 381. [Google Scholar] [CrossRef]
- Balcerzak, A.P. Technological potential of European Economy. Proposition of measurement with application of multiple criteria decision analysis. Montenegrin J. Econ. 2016, 12, 7–17. [Google Scholar] [CrossRef]
- Stanickova, M. Can the implementation of the Europe 2020 Strategy goals be efficient? The challenge for achieving social equality in the European Union. Equilibr. Q. J. Econ. Econ. Policy 2017, 12, 383–398. [Google Scholar] [CrossRef] [Green Version]
- Europe 2020—A Strategy for Smart, Sustainable and Inclusive Growth; European Commission: Brussels, Belgium, 2010; p. 37.
- A Digital Agenda for Europe; European Commission: Brussels, Belgium, 2010.
- Francik, A.; Szczepańska-Woszczyna, K. Innowacje i Przedsiębiorczość—Ujęcie Makro- i Mikroekonomiczne (Innovation and Entrepreneurship—A Macro- and Micro-Economic Perspective); Wyższa Szkoła Biznesu w Dąbrowie Górniczej: Dąbrowa Górnicza, Poland, 2016. [Google Scholar]
- Borowiecki, R.; Olesiński, Z.; Rzepka, A.; Hys, K. Development of teal organisations in Economy 4.0. An empirical research. Eur. Res. Stud. J. 2021, 24, 117–129. [Google Scholar] [CrossRef]
- MEMO/10/200, Europejska Agencja Cyfrowa: Kluczowe Inicjatywy (European Digital Agenda: The Key Initiatives). Available online: https://ec.europa.eu/commission/presscorner/detail/pl/MEMO_10_200 (accessed on 1 February 2021).
- A Digital Single Market. Strategy for Europe; European Commission: Brussels, Belgium, 2015.
- Report on the Safety and Liability Implications of Artificial Intelligence, the Internet of Things and Robotics; European Commission: Brussels, Belgium, 2020.
- Europe’s Moment: Repair and Prepare for the Next Generation; European Commission: Brussels, Belgium, 2020.
- Beck, K.; Grodzicki, M. Konwergencja Realna i Synchronizacja Cykli Koniunkturalnych w Unii Europejskiej. Wymiar Strukturalny (Real Convergence and Synchronization of Business Cycles in the European Union. Structural Dimension); Wyd. Scholar: Warszawa, Poland, 2014; p. 10. [Google Scholar]
- Iosifidis, P. Digital convergence: Challenges for European regulation. J. Eur. Inst. Commun. Cult. 2002, 9, 27–47. [Google Scholar] [CrossRef]
- Kyriakidou, V.; Michalakelis, C.; Sphicopoulos, T. Digital divide gap convergence in Europe. Technol. Soc. 2011, 33, 265–270. [Google Scholar] [CrossRef]
- Hsu, W.C.H.J.; Tsai, M.H.; Tzeng, G.H. Exploring the best strategy plan for improving the digital converegence by using a hybrid MADM model. Technol. Econ. Dev. Econ. 2018, 24, 164–198. [Google Scholar] [CrossRef] [Green Version]
- Lindgren, S. Digital Media and Society; SAGE: London, UK, 2017. [Google Scholar]
- Papacharissi, Z.A. A Private Sphere. Democracy in a Digital Age; Polity Press: Cambridge, MA, USA, 2010. [Google Scholar]
- Fagerjord, A.; Storsul, T. Questioning convergence. In Ambivalence towards Convergence. Digitalization and Media Change; Storsul, T., Stuedahl, D., Eds.; Nordicom, University of Gothenburg: Gothenburg, Sweden, 2007; pp. 19–31. [Google Scholar]
- Baldwin, T.F.; Stevens McVoy, D.; Steinfield, C. Convergence: Integrating Media, Information and Communication; Sage: London, UK, 1996. [Google Scholar]
- Green Paper on Convergence of the Telecommunications, Media and Information Technology Sectors, and the Implications for Regulation–Towards an Information Society Approach; European Commission: Brussels, Belgium, 1997.
- Fagerjord, A. Reading-view(s)ing the Über-box: A critical view on a popular prediction. In Cybertext Yearbook 2001; Eskelinen, M., Koskimaa, R., Eds.; Publications of the Research Centre for Contemporary Culture, University of Jyväskylä: Jyväskylä, Finland, 2002. [Google Scholar]
- Jenkins, H. Convergence Culture: Where Old and New Media Collide; MIT Press: Cambridge, MA, USA, 2006. [Google Scholar]
- Beyer, Y.; Enli, G.; Maasø, A.; Ytreberg, E. Small talk makes a big difference: Recent developments in interactive SMS-based TV. Television New Media 2007, 3. [Google Scholar] [CrossRef]
- Picard, R. The Economics of Financing of Media Companies; Fortham University Press: New York, NY, USA, 2002. [Google Scholar]
- Hoskins, C.; McFaiden, S.; Finn, A. Media Economics: Applying Economics to New and Traditional Media; Sage: London, UK, 2004. [Google Scholar]
- Østergaard, B.S. Convergence: Legislative dilemmas. In Media Policy. Convergence, Concentration and Commerce; McQuail, D., Siune, K., Eds.; Sage: London, UK, 1998. [Google Scholar]
- Cuilenburg, J.; Slaa, P. From media policy towards a national communications policy: Broadening the scope. Eur. J. Commun. 1993, 8, 149–176. [Google Scholar] [CrossRef]
- Skogerbø, E. Konvergens Mellom Telekommunikasjon og Kringkasting. Kulturogmediepolitiske Utfordringer; TemaNord, Nordic Council of Ministers: Copenhagen, Denmark, 1997; p. 560. [Google Scholar]
- Noveck, B.S. Thinking analogue about digital television? Bringing European content regulation into the information age. In Convergence in European Digital TV Regulation; Marsden, C., Verhulst, S., Eds.; Blackstone Press Limited: London, UK, 1999. [Google Scholar]
- Mitrovic, D. Measuring the efficiency of digital converegence. Econ. Lett. 2020, 188, 1–3. [Google Scholar] [CrossRef]
- Laitsou, E.; Kargas, A.; Varoutas, D. Digital competitiveness in the European Union era: The Greek case. Economies 2020, 8, 85. [Google Scholar] [CrossRef]
- Kotarba, M. Measuring digitalization—Key metrics. Found. Manag. 2017, 9, 123–138. [Google Scholar] [CrossRef] [Green Version]
- Chaaben, N.; Faysal, M. Digital economic and social evolution of Tunisia. In Proceedings of the Management International Conference, Venice, Italy, 24–27 May 2017; pp. 393–404. [Google Scholar]
- Ziemkiewicz, B.; Pietrzak, M. Digital economy in the old European Union Member States. In Proceedings of the 18th International Scientific Conference Globalization and Its Socio-Economic Consequences, Rajecke Teplice, Slovakia, 10–11 October 2018; pp. 2437–2444. [Google Scholar]
- Digital Economy and Society Index (DESI) 2020, Methodological Note; European Commission: Brussels, Belgium, 2020; pp. 4–14.
- Vidruska, R. The Digital Economy & Society Index and Network Readiness Index: Performance of Latvia on European Union Arena. In Proceedings of the New Challenges of Economic and Business Development Conference, Riga, Latvia, 12–14 May 2016; University of Latvia: Riga, Latvia, 2016. Available online: https://www.academia.edu/27238130/The_Digital_Economy_and_Society_Index_and_Network_Readiness_Index_performance_of_Latvia_on_European_Union_arena (accessed on 23 March 2021).
- Nagy, S. Digital economy and society. A cross country comparison of Hungary and Ukraine. Вісник Націoнальнoгo Технічнoгo Університету “Харківський Пoлітехнічний Інститут” (Екoнoмічні Науки) 2017, 46, 174–179. [Google Scholar]
- Moroz, M. The level of development of the digital economy in Poland and selected european countries: A comparative analysis. Found. Manag. 2017, 9, 175–190. [Google Scholar] [CrossRef] [Green Version]
- Balacescu, A.; Babucea, A.G. Use of the internet by the Romanian citizens. An empirical study of digital gaps between regions. Analele Univ. Constantin Brâncu Târgu Jiu Ser. Econ. 2018, 1, 81–88. [Google Scholar]
- Cesnauske, J. Digital economy and society: Baltic states in the EU context. Econ. Cult. 2019, 16, 80–90. [Google Scholar] [CrossRef] [Green Version]
- Stavytskyy, A.; Kharlamova, G.; Stoica, E.A. The analysis of the digital economy and society index in the EU. Balt. J. Eur. Stud. 2019, 9, 245–261. [Google Scholar] [CrossRef] [Green Version]
- International Digital Economy and Society Index 2020; European Union: Brussels, Belgium, 2021; p. 6.
- Soszyńska, E. Konwergencja technologiczna a potencjał społeczno-technologiczny krajów Unii Europejskiej (Technological convergence and socio-technological potential of European Union countries). Metod. Ilościowe Bad. Ekon. (Quant. Methods Econ. Res.) 2012, 18, 191–201. [Google Scholar]
- Digital Economy and Society Index, Eurostat. Available online: https://digital-agenda-data.eu/datasets/desi/visualizations (accessed on 23 October 2020).
- Everitt, B.S.; Landau, S.; Leese, M. Cluster Analysis; Oxford University Press: London, UK, 2001. [Google Scholar]
- Ward, J.H., Jr. Hierarchical grouping to optimize an objective function. J. Am. Stat. Assoc. 1963, 58, 236–244. [Google Scholar] [CrossRef]
- Stanisz, A. Przystępny kurs Statystyki z Zastosowaniem STATISTICA PL na Przykładach z Medycyny. Tom 3 pt.: Analizy Wielowymiarowe (An Accessible Course in Statistics Using STATISTICA PL with Examples from Medicine. Volume 3: Multivariate Analyses); StatSoft Polska Sp. z o.o.: Kraków, Poland, 2007. [Google Scholar]
- Kaufman, L.; Rousseeuw, P.J. Finding Groups in Data: An Introduction to Cluster Analysis; Wiley: New York, NY, USA, 1990. [Google Scholar]
- Bánhidi, Z.; Dobos, I.; Nemeslaki, A. What the overall digital economy and society index reveals: A statistical analysis of the DESI EU28 dimensions. Reg. Stat. 2020, 10, 42–62. [Google Scholar] [CrossRef]
- Castells, M.; Himanen, P. The Information Society and the Welfare State: The Finnish Model; Oxford University Press: New York, NY, USA, 2002. [Google Scholar]
- Grigorescu, A.; Pelinescu, E.; Ion, A.E.; Dutcas, M.F. Human capital in digital economy: An empirical analysis of central and eastern European countries from the European Union. Sustainability 2021, 13, 2020. [Google Scholar] [CrossRef]
- Simicevic, V.; Zoroja, J.; Pejic Bach, M. Cluster analysis of interent usage in European countries. In Proceedings of the Annals of DAAAM for 2012 & Proceedings of the 23rd International DAAAM Symposium “Intelligent Manufacturing & Automation”, Zadar, Croatia, 24–27 October 2012; Katalinic, B., Ed.; DAAAM International: Vienna, Austria, 2012; Volume 23, No.1. pp. 525–528. [Google Scholar]
- Şchiopu, R. Business digitization in the European Union. Proc. Int. Conf. Bus. Excell. 2020, 14, 385–397. [Google Scholar] [CrossRef]


| Share in Relation to the EU-28 Average of the Lowest and the Highest Score of the Countries That Year | Included: | Difference [P.P.] | Degree of Recorded Differences in DESI Components in the Analyzed Periods | The Assessment of Changes in the Context of Implementing Convergence Processes in a Given Area | ||
|---|---|---|---|---|---|---|
| Lowest Values [%] | Highest Values [%] | |||||
| Connectivity | 2015 | 56.0 | 146.2 | 90.2 | degree 3 | + |
| 2020 | 66.7 | 131.5 | 64.8 | |||
| Human Capital | 2015 | 62.4 | 164.1 | 101.7 | degree 1 | + |
| 2020 | 65.8 | 159.1 | 93.3 | |||
| Use of Internet Services | 2015 | 48.2 | 145.1 | 96.9 | degree 4 | + |
| 2020 | 61.9 | 131.6 | 69.7 | |||
| Integration of Digital Technology | 2015 | 52.3 | 164.1 | 111.8 | degree 2 | - |
| 2020 | 43.2 | 179.6 | 136.4 | |||
| Digital public services | 2015 | 41.0 | 153.9 | 112.9 | degree 5 | + |
| 2020 | 67.3 | 124.1 | 56.8 | |||
| DESI | 2015 | 67.2 | 146.4 | 79.2 | − | + |
| 2020 | 69.3 | 137.4 | 68.1 | |||
| Cluster Number | DESI | Connectivity | Human Capital | Use of Internet Services | Integration of Digital Technology | Digital Public Services |
|---|---|---|---|---|---|---|
| 1 | 149.74 | 156.41 | 133.23 | 162.23 | 176.41 | 137.68 |
| 2 | 139.32 | 205.16 | 93.36 | 115.11 | 103.81 | 226.47 |
| 3 | 127.92 | 170.98 | 105.84 | 126.00 | 115.10 | 129.04 |
| 4 | 142.13 | 142.73 | 121.88 | 126.33 | 200.96 | 148.89 |
| 5 | 126.76 | 146.94 | 110.94 | 119.61 | 145.67 | 120.10 |
| Average EU-28 | 135.23 | 160.81 | 112.04 | 128.92 | 141.57 | 143.39 |
Publisher’s Note: MDPI stays neutral with regard to jurisdictional claims in published maps and institutional affiliations. |
© 2021 by the authors. Licensee MDPI, Basel, Switzerland. This article is an open access article distributed under the terms and conditions of the Creative Commons Attribution (CC BY) license (https://creativecommons.org/licenses/by/4.0/).
Share and Cite
Borowiecki, R.; Siuta-Tokarska, B.; Maroń, J.; Suder, M.; Thier, A.; Żmija, K. Developing Digital Economy and Society in the Light of the Issue of Digital Convergence of the Markets in the European Union Countries. Energies 2021, 14, 2717. https://doi.org/10.3390/en14092717
Borowiecki R, Siuta-Tokarska B, Maroń J, Suder M, Thier A, Żmija K. Developing Digital Economy and Society in the Light of the Issue of Digital Convergence of the Markets in the European Union Countries. Energies. 2021; 14(9):2717. https://doi.org/10.3390/en14092717
Chicago/Turabian StyleBorowiecki, Ryszard, Barbara Siuta-Tokarska, Jolanta Maroń, Marcin Suder, Agnieszka Thier, and Katarzyna Żmija. 2021. "Developing Digital Economy and Society in the Light of the Issue of Digital Convergence of the Markets in the European Union Countries" Energies 14, no. 9: 2717. https://doi.org/10.3390/en14092717