Article

A Novel Surface Parameterization Method for Optimizing Radial Impeller Design in Fuel Cell System

1
School of Mechanical Engineering, University of Science and Technology Beijing, Beijing 100083, China
2
School of Mechanical Engineering & Automation, Beihang University, Beijing 100091, China
3
Key Laboratory of Light-Duty Gas-Turbine, Institute of Engineering Thermophysics, Chinese Academy of Sciences, Beijing 100190, China
4
School of Aeronautics and Astronautics, University of Chinese Academy of Sciences, Beijing 100049, China
*
Author to whom correspondence should be addressed.
Energies 2021, 14(9), 2716; https://doi.org/10.3390/en14092716
Submission received: 7 April 2021 / Revised: 3 May 2021 / Accepted: 7 May 2021 / Published: 10 May 2021
(This article belongs to the Special Issue Electric Propulsion and Energy Generation Systems)

Abstract

:
The aerodynamic performance improvement of radial impellers is of positive significance to improve the overall performance of hydrogen fuel cell systems (FCS). Our team proposes a multi-degree-of-freedom (MDOF) surface parameterization method for the global automatic optimization of radial impeller aerodynamics. The MDOF surface parameterization is characterized by fewer variables, construction ease, smoothness, good flexibility, and blade strength maintenance. In this paper, a radial impeller for a 100-kW fuel cell stack is optimized, showing the isentropic efficiency increase of 0.7%, the flow rate increase of 3.77%, and the total pressure ratio increase of 0.37%. The results revealed that the performance of the optimized radial impeller significantly improved, verifying the validity and reliability of the proposed novel design optimization method and providing technical support and methodological research of radial impeller aerodynamic optimization for hydrogen FCS.

1. Introduction

Thanks to the advantages of fast energy replenishment, low emission, smooth operation, and high energy conversion efficiency, vehicular hydrogen fuel cell systems are being developed in various countries [1,2,3], despite their main drawback of high costs affecting their practical application. A hydrogen-based proton exchange membrane (PEM) FCS consists of a fuel cell stack, air supply system, hydrogen storage, thermal management system, and water management system [4], as shown in Figure 1. An electric motor drives an air compressor to pressurize and humidify the filtered air that is then provided to the fuel cell reactor where hydrogen and oxygen (in the pressurized) air undergo a chemical reaction that outputs electrical energy to supply the motor and air compressor. The exclusive compressors used in FCSs form one of the core components of the air supply system [5] and account for up to 16.89% of the entire cost—the second-highest total cost of the FCS next to the cost of fuel stack [4,6]. Importantly, the aerodynamic performance of the compressors directly determines the comprehensive performance of the FCS [7], which in turn has an impact on the overall performance and cost of the vehicle.
The most commonly used compressors in vehicular hydrogen fuel cells (HFC) are the screw, scroll, slide, roots, and radial compressors. They each have unique advantages [8,9]. For the screw, radial, and roots compressors, a large flow rate, for instance, more than 90 g/s, is easy to achieve. Of these, high pressure can be easily realized for the screw and radial-type compressors [10]. The scroll, screw, and slide compressors are all in the type of positive displacement [10,11,12,13,14,15], which can boost the pressure through the shrinkage of inner chambers. In contrast, radial compressors inhale the gas and elevate the kinetic energy through a rotating impeller at high speed to boost the pressure of air. Eaton [16] improved the R340 TVS series of roots compressors by a P-Series Roots positive displacement design and shifted the peak efficiency suit to an 80 kW PEM stack. Yuehua Li [17] highlights screw and radial compressors as a good choice for FCSs due to their relatively low weight and high pressure. Of these, radial compressors are recognized for their high reliability and efficiency, especially those equipped with air bearings, which promotes pressure, rotating speed, and efficiency significantly.
Table 1 [4,13] is a compilation of data obtained from the US Department of Energy (DOE) comparing the performance of different types of compressors used in fuel cell vehicles (FCVs). Here, it is revealed that radial compressors have obvious advantages among them. As a result, the use of high-speed radial compressors as vehicular gas supply devices has become an international trend.
Since the application of fuel cells in vehicles is still in the exploratory phase from theory to practice, it is of great significance to improve the aerodynamic performance of radial compressors for FCSs, which has emerged as a crucial topic in this field.
The radial compressor required for FCVs has characteristics of a small flow rate and high total pressure ratio (up to 2.0–4.0) in a single stage, which has a narrow working area and tends to work along the surge boundary. By properly increasing the gas supply flow rate and gas supply pressure [3,4,18], both the power density and efficiency of the FCS can be improved, as well as reduce the cost of the whole vehicle. Excessive gas supply pressures, however, can increase the power consumption and lower the output efficiency of the FCS. According to current research [19], the FCSs consumption can be further reduced via isentropic efficiency promotion, which can be realized through the optimal design of the radial impeller or blade.
In the past 40 years, in the three-dimensional (3D) field, optimization of the blade design has focused mainly on two aspects: the optimization algorithm and the parametric optimization method. In terms of optimization algorithms, it has gone through the process from local optimization [20] to global optimization. Omidi et al. [21] used a hybrid method, comprising a genetic algorithm and a simulation package to realize the global optimization, simulate the function of a radial com impeller pressor, and evaluate the effects of losses in the impeller. In terms of the parametric optimization, blade parameterization methods are mainly divided into two categories: one is to fix the shape of each section and only change the position of the stacking line; the other is to reshape the geometry of each section, i.e., deform the pressure and suction surfaces, or directly change the mid-arc and thickness distribution [22,23]. Hehn et al. [24] used three independently designed camber curves instead of ruled surfaces to optimize the blade geometry and aerodynamic analysis, which required 156 optimization variables. The combined geometric and aerodynamic analysis revealed that a forward-swept leading edge and a concave suction side at the tip of the leading edge are effective design features for reducing the shock wave strength and blade shape of the optimized compressor impeller and enable favorable impeller outlet flow. Hildebrandt et al. [25] used 545 geometry parameters with the help of 3D-CFD and statistical correlations based on the linear Pearson and the ranked Spearman coefficients to evaluate the numerical aerodynamic analysis for the pressure slope optimization of a radial compressor impeller. Li et al. [26] presented a 3-D multi-objective aerodynamic optimization method by integrating a self-adaptive, multi-objective differential evolutionary algorithm, 3-D blade parameterization method, and RANS. Control points on blade hub and shroud contours were selected as design variables. The total pressure ratio and isentropic efficiency were increased by 1.26% and 3.06%, respectively. Liu et al. [27] redesigned a transonic radial compressor impeller by a multi-point, multi-objective optimization method. Camber curves of the blades and profiles at the tip and root sections of both main and splitter blades were parametrized. A genetic algorithm was used as the optimization method. The overall performances of baseline and optimum impellers were compared. Improvements in the total pressure ratio (by 5.3%) and isentropic efficiency (by 1.9%) were captured. Khalil Ekradi and Ali Madadi [28] present a procedure for three-dimensional optimization of a transonic radial compressor impeller with splitter blades by integrating a 3D blade parameterization method, a genetic algorithm (GA), an artificial neural network, and a CFD solver. The isentropic efficiency is increased by 0.97% at the design point, and the total pressure ratio and mass flow rate are increased by 0.74% and 0.65%, respectively. These methods can alter the shape of the blade surface and achieve good design optimization results for the radial impeller. Still, the author believes they cannot be considered surface optimization methods due to the control variables based on curves rather than surfaces. In such methods, surface generation is dependent on the skinning process built into the mesh generation software, causing many design optimization variable problems and low optimization efficiency, or the surface is an inflexibility ruled blade.
Burguburu [29] first proposed a semi-blade Bezier surface parameterization method that works with fewer control parameters and can attain high efficiency, surface smoothness, and better intuition, thus providing a new parameterization direction in the design optimization of axial flow compressor impeller. Cheng [30] applied this method to optimize a single row rotor and single-stage transonic axial compressor impeller and achieved ideal optimization results. Huang et al. [31] developed and proposed a full-blade surface parameterization method of an axial flow compressor impeller to compensate for the low degree of freedom of the semi-blade surface parameterization reformulation. The essence of these surface parameterization methods is to modify the original blade surface by the superposition of Bezier surfaces, which has a good construction convenience. However, the spatial morphology of radial compressor impeller blades with non-ruled surfaces is more distorted (greater inclination of the impeller inlet) compared with the shape of axial compressor blades. Furthermore, the flow inside of a turbomachine is viscous and compressible. These characters together with the complicated geometry of blades complicate the flow study. Therefore, the application of traditional parameterization methods based on surface superposition on radial compressor impeller blades is difficult.
In this paper, an improved MDOF surface parameterization method for the radial impeller is proposed and an effective automated aerodynamic optimization system for radial impeller blades is developed. The main blade and a splitter blade of the radial impeller blade are parametrically reshaped using the MDOF surface parameterization method, and the global optimization is carried out by using MIGA and the 3D CFD solver to explore the optimization performance after using the new approaches for the vehicle-mounted radial impeller, which is completely different from traditional parameterization methods.

2. MDOF Surface Parameterization Method for Radial Impeller Blades

Although computing power has developed rapidly in recent years, the current computing power is still not sufficient for many engineering applications in optimization. The “curse-of-dimensionality” problem is very difficult in the design optimization process that has to be solved due to the lack of computational power. In the design optimization of blades using the traditional parametric approach [22,23,24,25], the number of design variables increases geometrically with the number of blade rows, and the design space increases exponentially, making it difficult to obtain an optimized solution within a limited engineering time frame.
In recent years, Huang [31] proposed a full-blade surface parameterization method, which considers the pressure and suction surface of the original blade as a whole, and then the variable value of each point on a Bezier surface is superimposed on the circumferential direction of the corresponding point of the original blade to form a new blade. Although this method can achieve the purpose of dimensionality reduction, it is not flexible to modify blade shape, and the blade optimization can often lead to blade thinning or even deformation to weak-strength blades. In particular, the surface superposition direction of the full-blade surface parameterization is circumferential, and the blade inclination at the inlet of the radial impeller is relatively large, so the modified impeller is easily unable to intersect with the casing line, thus making mesh generation and flow field calculation impossible.
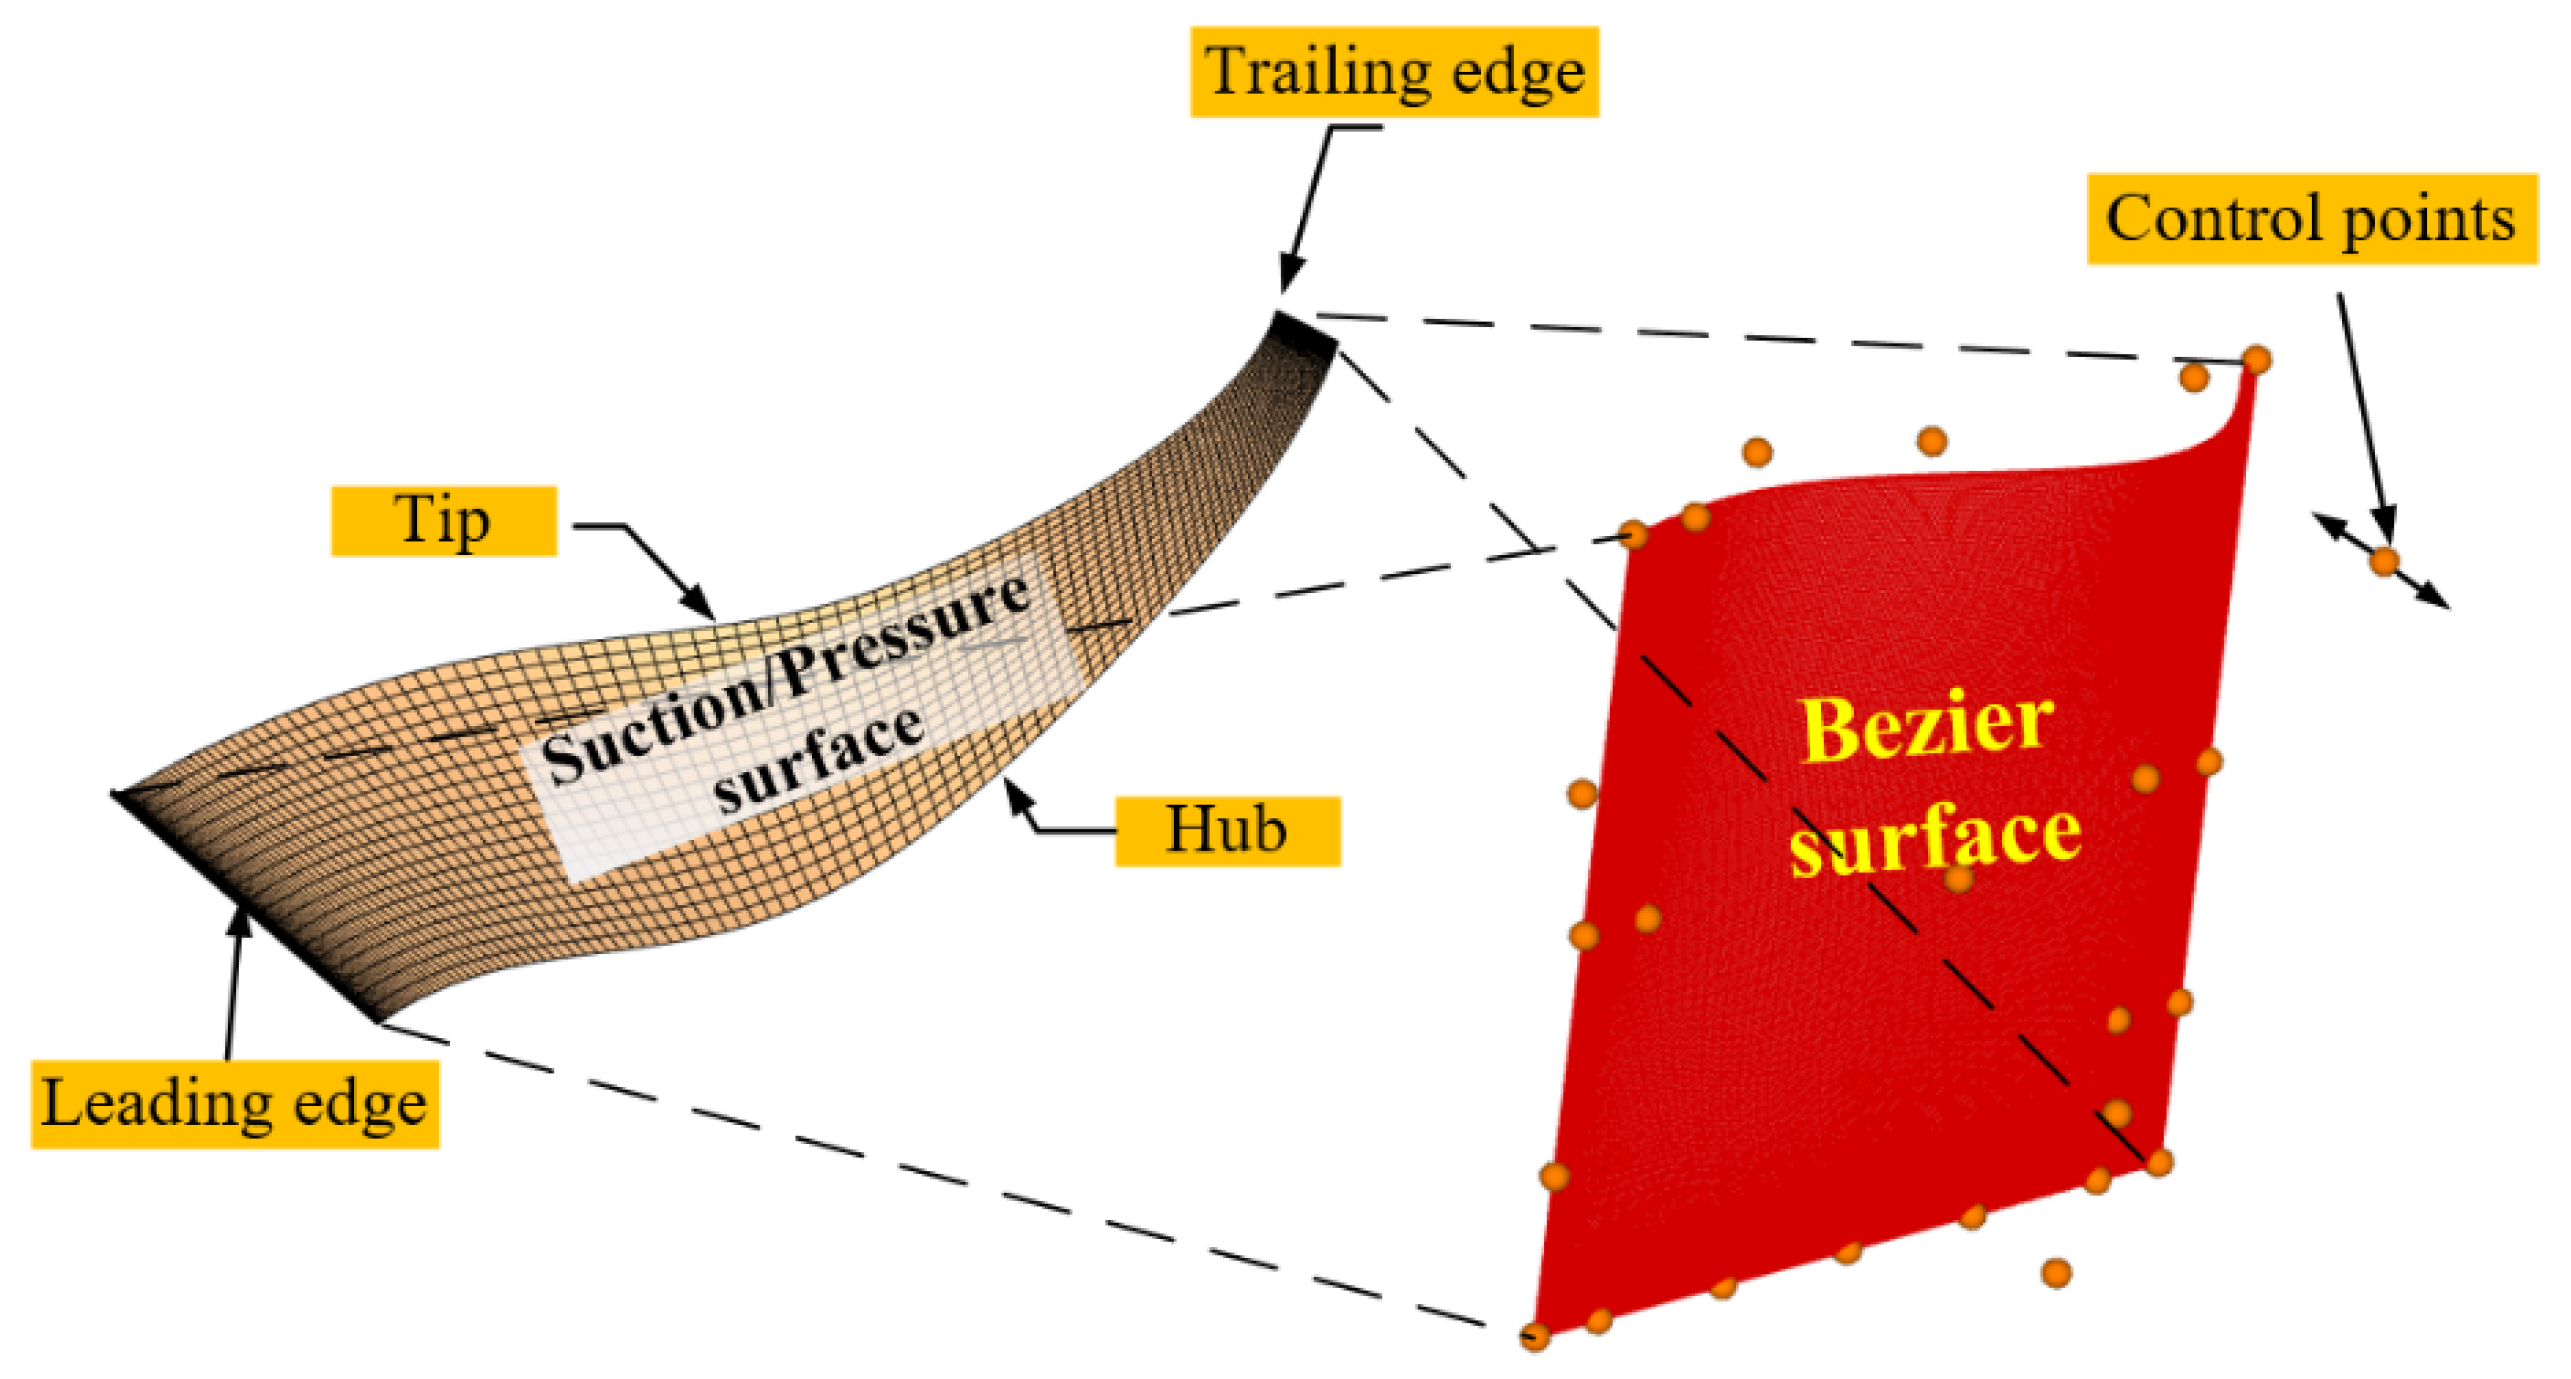
In order to remedy this deficiency, this paper proposes the MDOF surface parameterization method, shown in Figure 2, which is a parametric mapping and dimensionality reduction method that includes the following characteristics: firstly, it does well in maintaining the low-dimensional characteristics of the surface parameterization; secondly, it improves the flexibility and smoothness of the pressure and suction surface reshaping; thirdly, it maintains the blade thickness and mechanical strength in the process of optimization; finally, it superimposes Bezier surfaces on the suction and pressure surfaces of the original blade along their normal direction, respectively, and utilize the change in optimization variables in a one-dimensional direction to realize the 3D geometric deformation of blade profiles. The high order continuity of the Bezier surface [32] can ensure that the surface smoothness of the optimized blade is not lower than that of the original blade, thus reducing the flow loss caused by the surface roughness and improving the quality and efficiency during blade manufacturing and processing [33,34,35,36].
In this paper, the fixed geometric parameters include the hub geometry data, inlet diameter, outlet diameter, blade axial length, blade radial height, and blade thickness. The variable geometry is the full 3D deformation of the main blade and splitter blade by the MDOF method. The process of the MDOF surface parameterization method is shown in Figure 3, which can be described by the following steps:
  • Determination of the leading edge (L.E.) and trailing edge (T.E.) points of the blade by the monotonicity of transverse coordinates of the blade;
  • Encrypting the points of each cross-section by means of lateral interpolation;
  • Parameterizing the chord length of each section of the original blade. Since the Bezier surface is a unit mapping surface in the computational domain, to make each point of the original blade correspond to the Bezier surface it is necessary to parameterize the chord length of each section of the original blade. The parameterization method is expressed by Equations (1) and (2):
    ξ i , j = c = 1 i l c L j
    η i , j = r = 1 j l r L i
    where ξ i , j and η i , j are the horizontal and vertical coordinates of the chord length parameterized, respectively, I ∈ (1, Np) and Np refers to the number of points of each radial section, j ∈ (1, Ns) and Ns refers to the total number of radial sections, lc refers to the length of the cth segment of the chord length of the jth section in the radial direction, Lj is the sum of the chord lengths of the jth section in the radial direction, lr refers to the length of the rth segment of the radial length of the ith section in chord direction, and Li is the sum of the radial lengths of the segments of the ith section in chord direction.
  • Generating the Bezier surface where the Bezier surface is defined by Equations (3)–(7).
    S ¯ = k = 0 n { l = 0 m P k , l N l m ( v ) } N k n ( u )
    N l m ( v ) = C l m v l ( 1 v ) m l
    N k n ( u ) = C k n u k ( 1 u ) n k
    C l m = { m ! ( m l ) ! l ! i f   0 l m 0 i f   n o t
    C k n = { n ! ( n k ) ! k ! i f   0 k n 0 i f   n o t
    In Equation (3), S ¯ is the coordinate value of each point on the Bezier surface where S ¯ = ( S x , S y , S z ) , S x = ξ i , j , S y = η i , j ), P k , l are the control vertexes of the Bezier surface, for which there are a total of (m + 1) × (n + 1) control vertexes as variables, N k n ( u ) and N l m ( v ) are Bernstein basis functions calculated from Equations (4) and (5) (where v and u are two independent variables of the Bezier surface varying in the range [0,1]), C l m is calculated by Equation (6), and C k n is calculated by Equation (7);
  • Setting the variable value of the control vertexes of the Bezier surface and then calculating the variable value of each point on the Bezier surface and the original blade surface;
  • Calculating the unit normal vector of each point on the original blade surface;
  • Superimposing the optimized variable, SZ, on the normal direction of the pressure surface, with the magnitude and direction change in the suction surface consistent with the pressure surface to finally generate a new blade as shown in Figure 2.
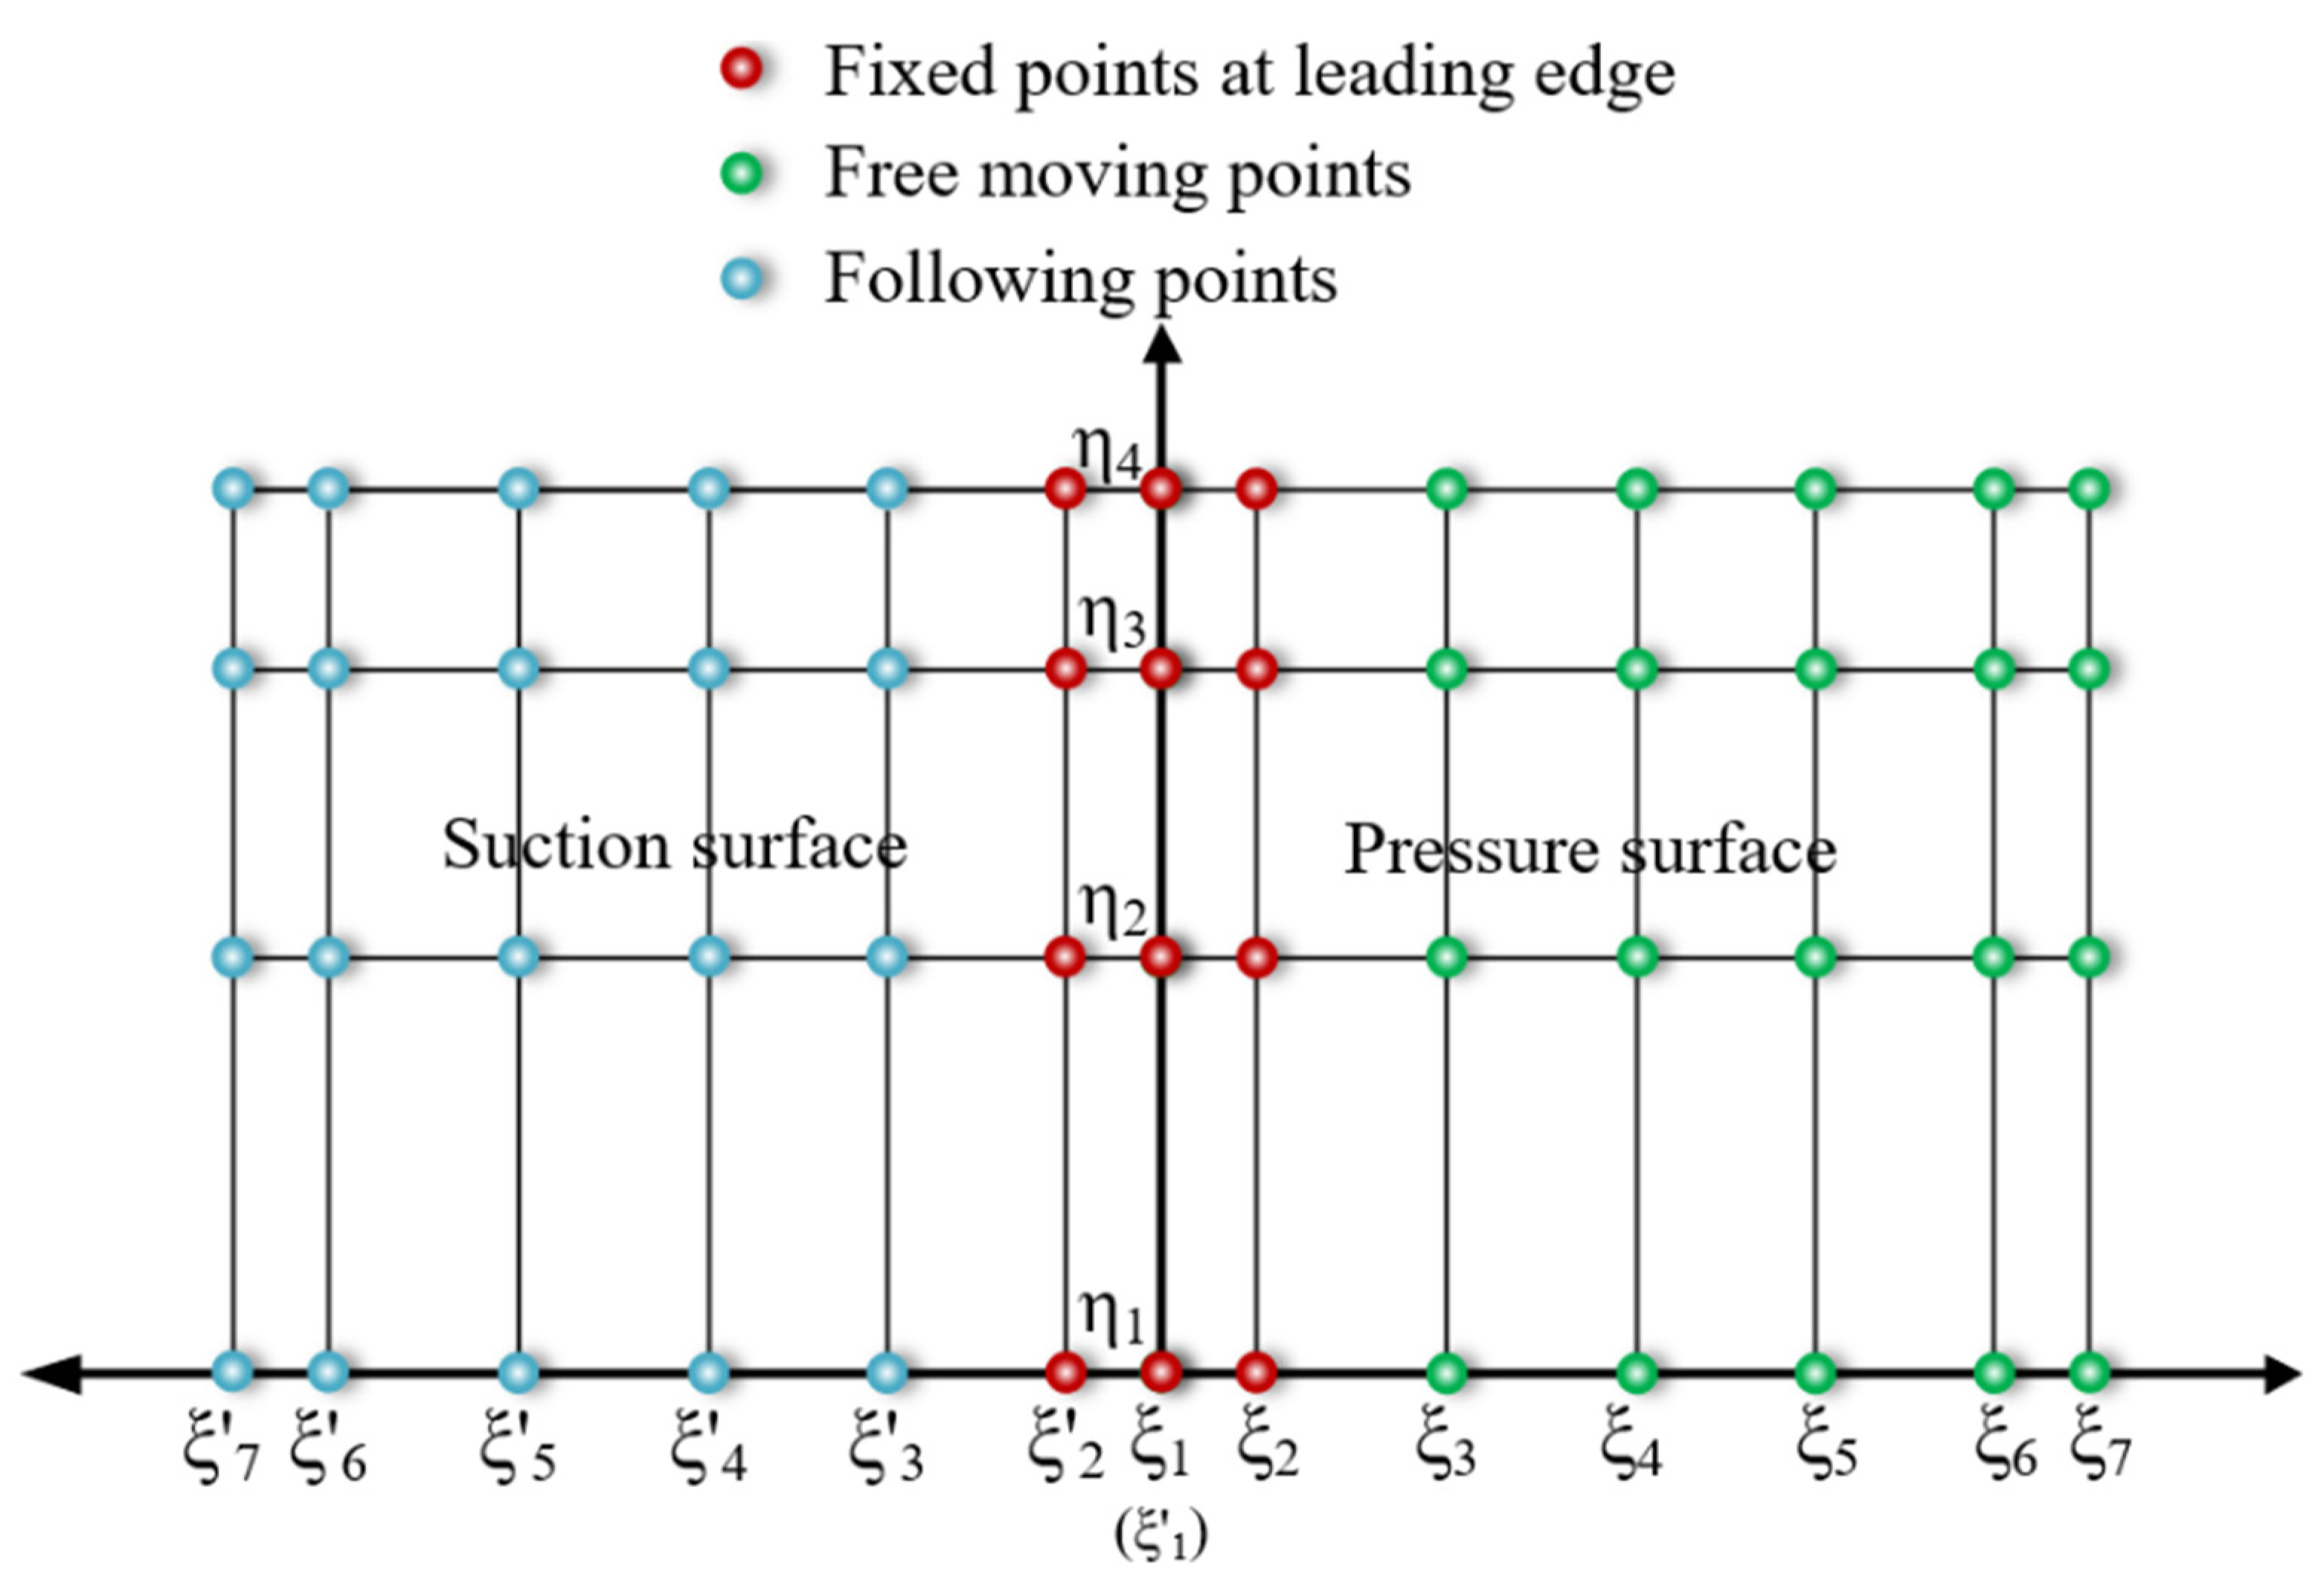
Figure 4 shows the distribution of control vertexes for the MDOF surface parameterization method. The suction and pressure surfaces have the same number of control vertexes and distribution positions, i.e., ξ = ξ with m + 1 points in the ξ direction and n + 1 points in the η direction. The number of distribution points in the ξ and η directions should be moderate. Excessive points will lead to an increase in the dimensionality of the optimization variables and mutual interference of different control vertexes on the aerodynamic performance due to the global support characteristic of the Bezier surface, which will reduce the optimization efficiency. In contrast, few points will result in insufficient optimization space and lead to poor optimization results.
The position of the red points of the leading edge of the pressure and suction surfaces are fixed to ensure first-order continuity of the leading-edge connection. The pressure surface control vertexes (green) are free moving points and the suction surface control vertexes (blue) follow the moving points. In order to ensure the mechanical strength of the blade and prevent it from being thinner or of wrong geometry, the following constraint is implemented in the optimization process: the variable value of the points on the suction surface must be consistent with the pressure surface, which enables a significant reduction in the number of optimization variables whilst maintaining relatively good flexibility in the modification.
Compared with traditional parameterization methods [22,23,24,25,26,27,28,29,30,31], which, for a single blade, can require hundreds of variables and full 3D optimization surfaces that are difficult to construct, the number of variables in the MDOF surface parameterization method is effectively reduced to 20, which successfully achieves dimensionality reduction in the parameterization method and easy construction of the surface. At the same time, the method can achieve better flexibility of reshaping, it takes into account the changes in pressure surface and suction surface, maintains the smoothness of the blade profile, increases the design optimization space, and provides a parametric basis for the flexible design of radial compressor impeller blades.

3. Global Aerodynamic Optimization of Radial Compressor Impeller

3.1. Optimization Object

In this paper, a single-stage high-speed radial compressor in FCVs with a rated output power of 100 kW is used as the optimization object. The 3D structure is shown in Figure 5 and aerodynamic performance is shown in Figure 6 and Table 2.

3.2. Numerical Methods and Validation

The capability of the CFD widely used for investigating the internal flow of radial compressor impeller has been reported previously [37,38,39]. The EURANUS solver in NUMECA Fine/Turbo software package is used to solve the 3D steady Reynolds averaged Navier–Stokes equations. The S–A model with good robustness is adopted for the turbulence model, and the fourth-order explicit Runge–Kutta model is used for the time marching. The finite volume central difference scheme with second- and fourth-order artificial viscous terms is used to control the pseudo-numerical oscillation in space discretization. The convergence is accelerated by using multigrid, local time step, and implicit residual.
The mesh is generated using the Autogrid5 module in NUMECA software. The mesh details are shown in Figure 7 where HOH topology is used for the blade surface mesh, 4OH topology is used for the tip and hub gap meshes, and the thickness of the first mesh layer near the wall is 1 × 10 6 m to ensure Y + 1 . The same mesh settings are used for all cases in the sample space during optimization to ensure comparable results.
In order to ensure the mesh quality during the flow field calculation, the mesh irrelevance of the single channel of the main blade and the splitter blade are verified at the same time. The mesh division numbers are 0.64 million, 0.85 million, 1.03 million, and 1.25 million, respectively, and their aerodynamic performances are shown in Figure 8. The results show that when the mesh number reaches 1.03 million, the mesh independence requirement can be satisfied, so the subsequent optimization process selects 1.03 million as the set of mesh templates for calculation.
The fluid medium of the radial impeller (the research object) is compressible air. The boundary conditions for numerical calculations are set as follows: the total inlet temperature and total pressure of the compressor are 293 K and 101,325 Pa, respectively, the inlet direction is axial, and the outlet is given as the average static pressure. The calculation advances from the blockage point to the near-surge point by gradually increasing the back-pressure, and the previous convergence point of the first divergence point is the near-surge point. The blade surface and end wall are set to no-slip conditions.
In this paper, the Krain impeller (i.e., a high-performance radial impeller designed, manufactured, and tested by the Krain team) was used as a reference to verify the validity of the numerical simulation [40,41]. The detailed geometric and experimental data allows many researchers to use it as an arithmetic example for numerical verification and design reference. Figure 9 provides a comparison of the numerical simulation and experimental data.
From Figure 9, it can be seen that the numerical calculation of the isentropic efficiency and the test data are close, with the overall value of the total pressure ratio being higher than the reference value (a relative error of 15%). The numerical results are consistent with those of Krain [42] and other researchers [28,43,44,45]. The error may be due to the following three reasons:
  • The CFD calculation gives the outlet pressure as the average static pressure, while the outlet during the test measurement is not the average static pressure;
  • Although Krain had published the impeller data and the experimental results, the experiments gave the whole-stage performance curve of the compressor. Since the geometric data of the vaneless diffuser used in the experiments were not published publicly, the vaneless diffuser used in the numerical simulations in this paper is not consistent with the diffuser used in the published experiments;
  • Deviation from the test in the blade inlet rounding treatment.
Some deviations exist between the numerical simulation and experimental results. Still, the two are in good agreement concerning the trend of the performance curve. In general, the numerical method could provide an accurate qualitative analysis of aerodynamic performance variations before and after impeller optimization [45]. Moreover, similar numerical experimental validation of fuel cell radial compressor impeller was published by a collaborative team [46].

3.3. Optimization Process

From the above MDOF surface parameterization method, it can be seen that the optimization scheme of the vehicle-mounted high-speed radial compressor impeller adopts two 6 × 3 order Bezier surfaces to parameterize the main blade and splitter blade profiles as shown in Figure 4. Each surface is set with seven control vertexes in the ξ direction (0, 0.1, 0.3, 0.5, 0.7, 0.9, 1.0) and four points in the η direction (0, 0.4, 0.7, 1.0). In order to ensure the first-order continuity at the leading edge, ξ1 and ξ2 need to be kept inactive. At the same time, to ensure the physical significance of the blade geometry and ensure the blade thickness does not become thinner during the optimization process, the variations in the control vertexes in the suction surface need to be consistent with variations in the corresponding control vertexes in the pressure surface. Ultimately, a pair of main blade and splitter blade shape optimizations only requires 2 × 4 × 5 = 40 optimization variables. If, however, the control vertexes are not limited, it requires 2 × 13 × 4 = 104 optimization variables. This shows that, although the constraints on the simultaneous changes in the suction and pressure surfaces reduce the design space, it ensures the physical significance of the blade geometry and greatly improves the time efficiency of the optimization search. As the distance between the adjacent main blades near the leading and trailing edges is relatively long, the splitter blade is centered in between, reducing the adjacent distance and causing the corresponding change range to become smaller (ξ6). By trial and error, the variable ranges for control vertexes are set as shown in Table 3 and Table 4.
MIGA [47] is the most popular and widely used evolutionary algorithm, which simulates the selection, crossover, mutation, and genetic evolution process of biological populations, and is a global optimization algorithm. Due to its good robustness and adaptability, it is widely used in machine learning, engineering optimization, and other fields. In this paper, MIGA is adopted for numerical optimization, which adds many islands on the basis of the genetic algorithm. Because each individual can migrate among these islands, this algorithm can effectively reduce the number of generations. The parameters are set as shown in Table 5.
Generally, FCS operates at 2 to 4 atm [3,4,8,10] and the power consumption by the motor and compressor can be as high as 25% of the FCS total electrical output. Because of the maximum power consumption at full load operation, the maximum rotational speed (100 krpm) is selected as the design working condition. Moreover, for the radial compressor of FCS with a narrow range of operating conditions, the isentropic efficiency of the off-design point is positively related to the isentropic efficiency of the design point. This means that the performance of the off-design points cannot be sacrificed when the performance of the design point is improved [48]. In addition, both flow rate and total pressure ratio increases are favorable for FCS cost reduction. In order to improve the optimization efficiency, the single design point (chosen to be near the maximum efficiency) optimization method is adopted. The isentropic efficiency maximization is set as the optimization objective, with the mass flow rate and total pressure ratio as strong constraints, requiring them not to decrease. The mathematical expressions are as follows:
Objective function:
max f = effd
Constraint function:
mass ≥ massd_ori
TPR ≥ TPRd_ori
x i L x i x i U
where effd is the isentropic efficiency at the design point, massd_Ori is the original mass flow rate at the design point, mass is the mass flow rate at the design point of the new blade, TPRd_Ori is the total pressure ratio at the design point of the original blade, TPR is the total pressure ratio at the design point of the new blade, x i is the design variable, x i L is the lower limit of the variable, and x i U is the upper limit of the variable.
The optimization process is shown in Figure 10. Firstly, the variation amount of the control vertexes of the Bezier surface is read-in and the variation amount of the corresponding original blade is calculated. The new blade geometry data are then formed by surface superposition. Secondly, the flow field calculation is carried out to obtain the aerodynamic performance of the new blade. If the aerodynamic performance does not meet the requirements, the new variations in the control vertexes are given by the MIGA until convergence or exit of the cycle when the upper limit of the number of iterations is reached. The new geometric blade with the best performance is then the output.

3.4. Optimization Results and Analysis

3.4.1. Comparison of Blade Geometry

Figure 11 shows the comparison of blade geometry before and after optimization, Figure 12 shows the comparison of Bezier surface change contour before and after optimization, and Figure 13 shows the comparison of geometry at the hub, middle section, and tip of the main and splitter blades before and after optimization.
As for the main blade along in the span-wise direction, the deformation at the hub bending to the pressure surface is the largest, while the middle section is essentially unchanged, and the tip of the blade deformation bending to the suction surface is smaller. Along the chord length direction, the deformation at the leading edge is basically unchanged, while the deformation at the middle section bending to the pressure surface is the largest (occurring mainly at the hub), and the deformation at the trailing edge bending to the suction surface is smaller (occurring mainly at the tip). Therefore, the change in the main blade causes the largest deformation at the middle of the hub bending to the pressure surface, which gradually transits to a small deformation at the middle of the tip bending to the suction surface.
As for the splitter blade along the spanwise direction, the deformation at the hub and middle sections bending to the pressure surface are both small, while the deformation at the tip bending to the suction surface is the largest. Along the chord length direction, the leading edge is unchanged, while the deformation at the middle section bending to the suction surface is the largest (occurring mainly at the tip), and the deformation at the trailing edge bending to the suction surface is small (occurring mainly at the hub). Therefore, the change in the splitter blade causes small deformation at the middle of the hub bending to the pressure surface, which gradually transits to the largest at the middle of the tip bending to the suction surface.
To sum up, the optimized flow channel area between the suction surface of the main blade and the pressure surface of the splitter blade becomes wider, while the flow channel area between the suction surface of the splitter blade and the pressure surface of the main blade becomes narrower. The geometrical changes of the blade shape and flow channel area inevitably leads to changes in the flow field structure.

3.4.2. Comparison of Performance before and after Optimization

Table 6 shows the performance comparison of radial compressor impeller at the design point before and after optimization. The flow rate of the optimized blade is increased by 3.77% at the design point, the total pressure ratio is increased by 0.37%, the isentropic efficiency is increased by 0.7%, and the comprehensive surge margin is increased by 2.7%, indicating that the aerodynamic performance of the compressor has been significantly improved.
Figure 14 shows the comparison of compressor characteristic lines before and after optimization at the design speed. In the full flow rate range, the isentropic efficiency characteristic line of the optimized compressor blade shifts upward as a whole with the total pressure ratio basically unchanged in the flow rate range of 0.15 kg/s to 0.17 kg/s and higher outside of this range. Therefore, it can be concluded that the optimized blade improves the aerodynamic performance significantly in the full flow rate range.
Figure 15 shows a comparison of the aerodynamic performance at different conditions before and after optimization. The performance of the full-power condition is improved without sacrificing the performance of the off-design condition. At 60% and 80% of full-power conditions, the performance is also improved to a certain extent, which can achieve the purpose of this experiment. These results further verify that there is a positive correlation between the design point and the off-design efficiency of the fuel cell radial compressor.

3.4.3. Flow field Analysis

Figure 16 shows the comparison of the entropy contour of the meridional surface before and after optimization. After optimization, the low entropy region at the tip of the inlet blade is increased, indicating that the backflow phenomenon at the corner of the inlet is weakened, which is conducive to improving the flow field downstream, and increases the low entropy region at the hub of the outlet thereby reducing losses. Figure 17 shows the entropy contour of the S3 cross-section, from which it can be seen that the high entropy region at the inlet A of I channel is significantly reduced after optimization. The entropy of the B and C regions are slightly increased, and the high entropy regions at D and E of the II channels are significantly reduced. After optimization, the inlet loss of the I channel is reduced due to better matching with the inlet incidence angle, and the loss at the tip of the II channel is reduced due to the geometric changes in the splitter blade tip that leads to the reduction in the channel expansion angle and the corresponding reduction in the static pressure expansion loss.
Figure 18 shows the isentropic efficiency distribution of the downstream outlet along the span-wise direction before and after optimization, which indicates that the efficiency improvement mainly arises from the two regions (0.05, 0.2, and 0.7, 0.85) in the span-wise direction. Figure 19 shows the distribution of the total pressure ratio at the downstream exit of the impeller along the span-wise direction before and after optimization. The trade-off between the total pressure ratio and efficiency in the high-efficiency region and the efficiency is usually improved at the cost of lowering the total pressure ratio [43]. Although the total pressure ratio at the hub is reduced after optimization, the inverse pressure gradient in the flow path is also reduced, which improves the efficiency of the automotive low-flow impeller. From Figure 11, Figure 12 and Figure 13, it can be seen that the back curved angle of the optimized splitter blade is increased, while the flange work and the load at the hub of the blade are both decreased, accounting for the efficiency improvement and reduction in total pressure at the blade hub. Figure 20 shows the entropy contour of the S3 cross-section at the downstream outlet of the flow channel, showing the area of entropy reduction (in the dashed box) concentrated in the regions 0.05, 0.2, and 0.7, 0.85. The main reason for the improved efficiency after optimization is the subsequent optimization of the flow field structure due to the blade geometric deformation, explained in further detail later.
From Figure 18, it can be seen that the most significant efficiency improvement is roughly in the area of 10% and 80% in the span-wise direction. As such, the blade-to-blade (B2B) surfaces of these two sections of the impeller are selected for flow-field analysis.
Figure 21 shows the relative Mach number contour on the B2B surface at 10% height of the impeller blade, and Figure 22 shows the static pressure distribution at 10% height of the blade. It is clear that the relative Mach number in the five areas of A, B, C, D, and E in the optimized blade channel increases while the low-speed area decreases, which is conducive to reducing the backflow loss. After optimization, the static pressure load along the surface of the main blade and splitter blade is significantly reduced while the rising slope becomes gentler, which can effectively reduce the low-speed area in the flow channel and delay the separation position. Figure 23 is a comparison of the entropy contour of B2B at 10% height of the blade, from which it is shown that the entropy values of regions G1 and G2 at the downstream exit of the suction surface of the optimized splitter blade are reduced, while the entropy values of the F region at the downstream exit of the pressure surface of the splitter blade are slightly increased. This is consistent with the entropy distribution at 10% radial region shown in Figure 20. After optimization, the pressure surface of the main blade is close to the suction surface of the splitter blade and the blade channel expansion angle is reduced, effectively reducing the loss caused by the inverse pressure gradient in the channel. The pressure surface of the splitter blade is far from the suction surface of the main blade, which increases the secondary flow loss caused by the lateral migration of the boundary layer, though the loss is relatively smaller and does not affect the overall efficiency improvement. Therefore, the efficiency improvement of the B2B flow surface at 10% height of the blade mainly depends on the reduction in the low-speed backflow area in the blade channel, the reduction in the diffusion loss caused by the main blade pressure surface being close to the suction surface of splitter blade, as well as the increase in the back curved angle of the splitter blade.
Figure 24 shows the relative Mach number cloud of the B2B surface at 80% height of the blade, and Figure 25 shows the static pressure distribution at 80% height of the blade. After optimization, the positive incidence angle is reduced, the matching of air-flow is improved, and the high-value area and maximum value of the relative Mach number at the leading edge of the suction surface are both reduced such that the shock wave loss at the inlet is reduced. This can be verified from area A in Figure 17 and the entropy contour of the inlet before and after optimization in Figure 16. The static pressure at the suction surface of the optimized splitter blade rises more slowly and bears less load, which can effectively reduce the low-speed area in the channel and delay separation position, thus reducing the flow loss at the outlet. Figure 26 shows the entropy contour of the B2B surface at 80% height of the blade. After optimization, the high entropy area in the H1 and H2 regions at the downstream exit of the suction surface of the splitter blade is reduced, which is consistent with the entropy distribution of regions D and E in Figure 17 and the region at 80% height at the exit shown in Figure 20. Furthermore, the suction surface of the splitter blade is close to the pressure surface of the main blade, which effectively reduces the losses caused by the inverse pressure gradient in the channel and the secondary flow caused by the lateral migration of the boundary layer. Therefore, the efficiency improvement of the B2B flow surface at 80% height mainly relies on the reduction in inlet positive incidence angle, the matching improvement of the airflow angle, and the reduction in transverse secondary flow loss and pressure expansion loss brought by the suction surface of the splitter blade close to the pressure surface of the main blade.

4. Conclusions

This study was conducted to solve the black-box problem in the parameter optimization of radial impeller aerodynamic. MDOF surface parameterization, MIGA, and CFD flow field analysis are combined to construct an automated optimization system for optimizing the performance of radial impeller used in vehicular HFCs. The optimization objective was to maximize the radial impeller aerodynamic efficiency, with no reduction in the flow rate and total pressure ratio as the constraints. The conclusions of the experiment are as follows:
  • After optimization, in the hub region of the radial impeller blade, the pressure surface of the main blade bends toward the suction surface of the splitter blade, whilst in the tip region of the blade, the suction surface of the splitter blade bends toward the pressure surface of the main blade. The relative Mach number in the blade channel increases, the static pressure load on the blade surface decreases, and the rising slope of static pressure becomes slower. In 0.05, 0.2, and 0.7, 0.85, the variation range along the span-wise direction and the efficiency improvement of the impeller are most obvious. The efficiency improvement at the design point is mainly due to (i) reduction in the low-speed zone in the blade channel at the hub, (ii) the increase in the back curved angle at the hub of the splitter blade, (iii) the reduction in the inlet positive incidence angle at the tip of the blade, and (iv) the reduction in secondary flow loss and pressure expansion loss brought by the pressure surface of the main blade near the suction surface of the splitter blade;
  • The MDOF surface parameterization method has the advantages of remarkable low-dimensional characteristics, better flexibility of modification, surface smoothness, and ease of construction. The number of design variables can be controlled to be no more than 40 for two blade rows in the optimization process, which successfully achieves the purpose of dimensionality reduction in the parameterization method. At the same time, due to the simultaneous change in the suction and pressure surfaces, the blade thickness and strength can be better maintained and the generation of wrong blades can be avoided;
  • A global optimization-seeking method based on MDF surface parameterization can be successfully used for the aerodynamic optimization of vehicular HFCs radial impeller blades. The optimized design operation performance is greatly improved, and verifying that the design operation is optimized without sacrificing the performance of the off-design operation. The proposed novel method provides technical support and a way of theoretical exploration for exploring the aerodynamic optimization of the radial compressor for vehicular HFCs.

Author Contributions

Conceptualization, J.L.; Data curation, W.L., J.L., P.F. and J.C.; Formal analysis, W.L., J.L. and J.C.; Funding acquisition, W.L. and J.C.; Investigation, W.L. and J.C.; Methodology, W.L., J.L. and J.C.; Project administration, W.L. and J.L.; Resources, W.L. and J.L.; Software, J.L. and J.C.; Supervision, W.L.; Validation, P.F.; Writing–original draft, W.L. and J.L.; Writing–review & editing, J.L. and J.C. All authors have read and agreed to the published version of the manuscript.

Funding

This research received no external funding.

Institutional Review Board Statement

Not applicable.

Informed Consent Statement

Not applicable.

Data Availability Statement

Not applicable.

Conflicts of Interest

The authors declare no conflict of interest.

Nomenclature

Abbreviations
MDOFmulti-degree-of-freedom
PEMproton exchange membrane
FCSfuel cell systems
FCVsfuel cell vehicles
L.E.leading edge
OriOriginal
CFDComputational Fluid Dynamics
MIGAmulti-island genetic algorithm
HFChydrogen fuel cells
3Dthree-dimensional
T.E.trailing edge
OptOptimized
DOEDepartment of Energy
Symbol
PsTotal pressure at the surge point
MsMass flow at the surge point
d_oridesign point original
massmass flow
η i , j vertical coordinates of the chord length parameterized
1, Np number of points of each radial section
lclength of the cth segment of the chord length of the jth section in the radial direction
Ljthe sum of the chord lengths of the jth section in the radial direction
S ¯ = ( S x , S y , S z ) the coordinate value of each point on the Bezier surface es
v , u independent variables of the Bezier surface
rpmrevolutions Per Minute
PdTotal pressure at design point
MdMass flow at design point
effEfficiency
TRPtotal pressure ratio
ξ i , j horizontal coordinates of the chord length parameterized
1, Nstotal number of radial sections
lrlength of the rth segment of the radial length of the ith section in chord direction
Lisum of the radial lengths of the segments of the ith section in chord direction
P k , l the control vertexes of the Bezier surface for which there are a total
N k n ( u ) , N l m ( v ) Bernstein basis functions

References

  1. Kendall, M. Fuel cell development for New Energy Vehicles (NEVs) and clean air in China. Prog. Nat. Sci. Mater. Int. 2018, 28, 113–120. [Google Scholar] [CrossRef]
  2. Turkmen, A.C.; Solmaz, S.; Celik, C. Analysis of fuel cell vehicles with advisor software. Renew. Sustain. Energy Rev. 2016, 70, 1066–1071. [Google Scholar] [CrossRef]
  3. Kast, J.; Vijayagopal, R.; Gangloff, J.J., Jr.; Marcinkoski, J. Clean commercial transportation: Medium and heavy duty fuel cell electric trucks. Int. J. Hydrogen Energy 2016. [Google Scholar] [CrossRef] [Green Version]
  4. Wan, Y.; Guan, J.P.; Xu, S.C. Improved empirical parameters design method for centrifugal compressor in PEM fuel cell vehicle application. Int. J. Hydrogen Energy 2016, 42, 5590–5605. [Google Scholar] [CrossRef]
  5. Ahluwalia, R.K.; Wang, X.; Kwon, J.; Rousseau, A.; Kalinoski, J.; James, B.; Marcinkoski, J. Performance and cost of automotive fuel cell systems with ultra-low platinum loadings. J. Power Sources 2011, 196, 4619–4630. [Google Scholar] [CrossRef]
  6. Deng, Z.; Chen, Q.; Zhang, L.; Fu, Z. Data driven NARMAX modeling for PEMFC air compressor. Int. J. Hydrogen Energy 2020, 45. [Google Scholar] [CrossRef]
  7. Blunier, B.; Miraoui, A. Proton exchange membrane fuel cell air management in automotive applications. J. Energy Resour. Technol. 2010, 7, 1571–1574. [Google Scholar] [CrossRef]
  8. Wan, Y.; Xu, S.; Ni, H. Air compressors for fuel cell vehicles: An systematic review. SAE Int. J. Altern. Powertrains 2015, 4, 115–122. [Google Scholar] [CrossRef]
  9. Ren, T.; Feng, M. Anti-shock characteristics of water lubricated bearing for fuel cell vehicle air compressor. Tribol. Int. 2017, 107, 56–64. [Google Scholar] [CrossRef]
  10. Wang, G.; Yu, Y.; Liu, H.; Gong, C.; Wen, S.; Wang, X.; Tu, Z. Progress on design and development of polymer electrolyte membrane fuel cell systems for vehicle applications: A review. Fuel Process. Technol. 2018, 179, 203–228. [Google Scholar] [CrossRef]
  11. Hu, B.; Di, W.; Wang, R.Z. Water vapor compression and its various applications. Renew Sustain. Energy Rev. 2018, 98, 92–107. [Google Scholar] [CrossRef]
  12. Stosic, N.; Smith, I.K.; Kovacevic, A.; Mujic, E. Geometry of screw compressor rotors and their tools. J. Zhejiang Univ. Sci. 2011, 12, 310–326. [Google Scholar] [CrossRef]
  13. Ha, K.; Lee, C.H.; Kim, C.M.; Kim, S.H.; Ahn, B.K. A study on the characteristics of an oil- free centrifugal compressor for fuel cell vehicles. SAE Int. J. Altern. Powertrains 2016, 5. [Google Scholar] [CrossRef]
  14. Emhardt, S.; Tian, G.; Chew, J. A review of scroll expander geometrics and their performance. Appl. Therm. Eng. 2018, 141, 1020–1034. [Google Scholar] [CrossRef]
  15. Duprez, M.; Dumont, E.; Frere, M. Modeling of scroll compressors-Improvements. Int. J. Refrig. 2010, 33, 721–728. [Google Scholar] [CrossRef]
  16. Stretch, D.; Wright, B.; Fortini, M.; Fink, N.; Ramadan, B.; Eybergen, W. Roots air management system with integrated expander. Mech. Eng. Present. Conf. Mater. 2016. [Google Scholar] [CrossRef] [Green Version]
  17. Li, Y.; Pei, P.; Ma, Z.; Ren, P.; Huang, H. Analysis of air compression, progress of compressor and control for optimal energy efficiency in proton exchange membrane fuel cell. Renew. Sustain. Energy Rev. 2020, 133, 110304. [Google Scholar] [CrossRef]
  18. Venturi, M.; Sang, J.; Knoop, A.; Hornburg, G. Air supply system for automotive fuel cell application. SAE Tech. Pap. 2012. [Google Scholar] [CrossRef]
  19. Meroni, A.; Zühlsdorf, B.; Elmegaard, B.; Haglind, F. Design of centrifugal compressors for heat pump systems. Appl. Energy 2018, 232, 139–156. [Google Scholar] [CrossRef]
  20. Sanger, N.L. The use of optimization techniques to design-controlled diffusion compressor blading. J. Eng. Power 1982, 105, 256–264. [Google Scholar] [CrossRef] [Green Version]
  21. Omidi, M.; Liu, S.J.; Mohtaram, S.; Lu, H.T.; Zhang, H.C. Improving centrifugal compressor performance by optimizing the design of impellers using genetic algorithm and computational fluid dynamics methods. Sustainability. 2019, 11, 5409. [Google Scholar] [CrossRef] [Green Version]
  22. Schlaps, R.C.; Shahpar, S.; Gummer, V. Automatic three-dimensional optimization of a modern tandem compressor vane. In Proceedings of the ASME Turbo Expo 2014: Turbine Technical Conference and Exposition, Düsseldorf, Germany, 16–20 June 2014. [Google Scholar]
  23. Saeil, L.; Sun, C.; Changsoo, J. Multidisciplinary design optimization of axial flow compressor with double step optimiza tion. In Proceedings of the 53rd AIAA/ASME/ASCE/AHS/ASC Structures, Structural Dynamics and Materials Conference 20th AIAA/ASME/AHS Adaptive Structures Conference 14th AIAA, Honolulu, HI, USA, 23–26 April 2012. [Google Scholar]
  24. Hehn, A.; Mosdzien, M.; Grates, D.; Jeschke, P. Aerodynamic optimization of a transonic centrifugal compressor by using arbitrary blade surfaces. J. Turbomach. 2018, 140. [Google Scholar] [CrossRef]
  25. Hildebrandt, A.; Ceyrowsky, T. One-dimensional and three-dimensional design strategies for pressure slope optimization of high-flow transonic centrifugal compressor impellers. J. Turbomach. 2019, 141. [Google Scholar] [CrossRef]
  26. Li, X.; Liu, Z.; Lin, Y. Multipoint and multiobjective optimization of a centrifugalcompressor impeller based on genetic algorithm. Math. Probl. Eng. 2017, 2017, 6263274. [Google Scholar] [CrossRef] [Green Version]
  27. Li, X.; Zhao, Y.; Liu, Z.; Chen, H. The optimization of a centrifugal impeller based on a new multi-objective evolutionary strategy. In Proceedings of the ASME Turbo Expo 2016 Power for Land, Sea and Air, Seoul, Korea, 13–17 June 2016. [Google Scholar]
  28. Ekradi, K.; Madadi, A. Performance improvement of a transonic centrifugal compressor impeller with splitter blade by three-dimensional optimization. Energy 2020. [Google Scholar] [CrossRef]
  29. Stéphane, B.; Arnaud, l.P. Improved aerodynamic design of turbomachinery bladings by numerical optimization. Aerosp. Sci. Technol. 2003, 32, 277–287. [Google Scholar] [CrossRef]
  30. Cheng, J.; Chen, J.; Xiang, H. A surface parametric control and global optimization method for axial flow compressor blades. Chin. J. Aeronaut. 2019, 32, 1618–1634. [Google Scholar] [CrossRef]
  31. Huang, S.; Cheng, J.; Yang, C.; Zhou, C.; Lu, X. Optimization design of a 2.5 stage highly loaded axial compressor with a bezier surface modeling method. Appl. Sci. 2020, 10, 3860. [Google Scholar] [CrossRef]
  32. Zhang, X.; Qiang, X.; Teng, J.; Yu, W. A new curvature-controlled stacking-line method for optimization design of compressor cascade considering surface smoothness. J. Aerosp. Eng. 2020, 234, 1061–1074. [Google Scholar] [CrossRef]
  33. Fan, W.; Ji, J.; Wu, P.; Wu, D.; Chen, H. Modeling and simulation of trajectory smoothing and feedrate scheduling for vibration-damping CNC machining. Simul. Model. Pract. Theory 2020, 99, 102028. [Google Scholar] [CrossRef]
  34. Fan, W.; Lee, C.H.; Chen, J.H. A realtime curvature smooth interpolation scheme and motion planning for CNC machining of short line segments. Int. J. Mach. Tools Manuf. 2015, 96. [Google Scholar] [CrossRef]
  35. Bi, Q.Z.; Shi, J.; Wang, Y.H. Analytical curvature continuous dual-Bézier corner transition for five-axis linear tool path. Int. J. Mach. Tools Manuf. 2015, 91, 96–108. [Google Scholar] [CrossRef]
  36. Sencer, B.; Ishizaki, K.; Shamoto, E. A curvature optimal sharp corner smoothing algorithm for high-speed feed motion generation of NC systems along linear tool paths. Int. J. Adv. Manuf. Technol. 2015, 76, 1977–1992. [Google Scholar] [CrossRef]
  37. Mojaddam, M.; Hajilouy-Benisi, A.; Moussavi-Torshizi, S.A.; Movahhedy, M.R.; Durali, M. Experimental and numerical investigations of radial flow compressor component losses. J. Mech. Sci. Technol. 2014, 28, 2189–2196. [Google Scholar] [CrossRef]
  38. Mojaddam, M.; Hajilouy-Benisi, A. Experimental and numerical flow field investigation through two types of radial flow compressor volutes. Exp. Therm. Fluid Sci. 2016, 78, 137–146. [Google Scholar] [CrossRef]
  39. Mojaddam, M.; Hajilouy-Benisi, A.; Movahhedy, M.R. Experimental and numerical investigation of radial flow compressor volute shape effects in characteristics and circumferential pressure non-uniformity. Sci. Iran. 2013, 20, 1753–1764. [Google Scholar]
  40. Krain, H.; Hoffmann, B.; Pak, H. Aerodynamics of a centrifugal compressor impeller with transonic inlet conditions. In Proceedings of the ASME 1995 International Gas Turbine and Aeroengine Congress and Exposition, Houston, TX, USA, 5–8 June 1995. [Google Scholar]
  41. Eisenlohr, G.; Krain, H.; Richter, F.A.; Tiede, V. Investigations of the flow through a high pressure ratio centrifugal impeller. In Proceedings of the ASME Turbo Expo 2002: Power for Land, Sea, and Air, Amsterdam, The Netherlands, 3–6 June 2002. [Google Scholar]
  42. Krain, H. Analysis of Transonic Flow Fields inside a High Pressure Ratio Centrifugal Compressor at Design and off Design Conditions; ASME: Indianapolis, IN, USA, 1999. [Google Scholar]
  43. Guo, Z.; Song, L.; Zhou, Z.; Li, J.; Feng, Z. Multi-objective aerodynamic optimization design and data mining of a high pressure ratio centrifugal impeller. J. Eng. Gas Turbines Power 2015, 137, 092602. [Google Scholar] [CrossRef]
  44. Guo, Z.; Zhou, Z.; Song, L.; Li, J.; Feng, Z. Aerodynamic analysis and multiobjective optimization. Ocean Eng. 2014, 68, 1–13. [Google Scholar]
  45. Kang, S. Numerical Investigation of a High Speed Centrifugal Compressor Impeller. ASME Turbo Expo. Power Land Sea Air 2005, 4, 1678–1682. [Google Scholar]
  46. Zhang, Y.; Xu, S.; Wan, Y. Performance improvement of centrifugal compressors for fuel cell vehicles using the aerodynamic optimization and data mining methods. Int. J. Hydrogen Energy 2020, 45, 11276–11286. [Google Scholar] [CrossRef]
  47. Ma, F.; Han, L.; Zhou, Y.; Chen, S.; Pu, Y. Multi-island genetic algorithm and kriging model-based design of vehicle product comprising multi-material. IEEE Access 2018, 6, 53397–53408. [Google Scholar] [CrossRef]
  48. Wan, Y.; Xu, S.C.; Zhang, L. Multi-operating condition optimal design of centrifugal impeller for fuel cell vehicle application based on parameterization of impeller profile. J. Tongji Univ. 2017, 45, 98–108. [Google Scholar]
Figure 1. Schematic diagram of hydrogen FCS.
Energies 14 02716 g001
Figure 2. Schematic diagram of the MDOF surface parameterization method.
Energies 14 02716 g002
Figure 3. Flow chart of the MDOF surface parameterization method.
Energies 14 02716 g003
Figure 4. Distribution of the parameterized control vertexes.
Energies 14 02716 g004
Figure 5. Three-dimensional structure of the original impeller.
Energies 14 02716 g005
Figure 6. Aerodynamic performance curve at different conditions.
Energies 14 02716 g006
Figure 7. Grid topology of the radial compressor impeller.
Energies 14 02716 g007
Figure 8. Grid independence verification.
Energies 14 02716 g008
Figure 9. Numerical simulation and experimental data comparison: (a) Relative flow-efficiency; (b) Relative flow-pressure ratio graph.
Energies 14 02716 g009
Figure 10. Optimization process.
Energies 14 02716 g010
Figure 11. Comparison of impeller blade geometry before and after optimization.
Energies 14 02716 g011
Figure 12. Comparison of Bezier surface deformation contour before and after optimization.
Energies 14 02716 g012
Figure 13. Comparison of hub, middle and tip geometry before and after optimization.
Energies 14 02716 g013
Figure 14. Comparison of characteristic lines before and after optimization at design speed.
Energies 14 02716 g014
Figure 15. Aerodynamic performance curve at different conditions before and after optimization.
Energies 14 02716 g015
Figure 16. Comparison of the entropy contour of the meridional surface before and after optimization.
Energies 14 02716 g016
Figure 17. Entropy contour of S3 cross-section before and after optimization.
Energies 14 02716 g017aEnergies 14 02716 g017b
Figure 18. Span-wise isentropic efficiency.
Energies 14 02716 g018
Figure 19. Span-wise Total pressure ratio.
Energies 14 02716 g019
Figure 20. Comparison of entropy contour of the S3 cross-section at the downstream outlet at the design point between (a) before and (b) after optimization.
Energies 14 02716 g020
Figure 21. Comparison of Relative Mach number contour of the B2B surface at 10% height before and after optimization.
Energies 14 02716 g021
Figure 22. Comparison of the static pressure distribution of the B2B surface at 10% height before and after optimization.
Energies 14 02716 g022
Figure 23. Comparison of the entropy contour of B2B surface at 10% height before and after optimization.
Energies 14 02716 g023
Figure 24. Comparison of the relative Mach number contour of the B2B surface at 80% height before and after optimization.
Energies 14 02716 g024
Figure 25. Comparison of the static pressure curve of the B2B surface at 80% height before and after optimization.
Energies 14 02716 g025
Figure 26. Comparison of the entropy contour of the B2B surface at 80% height before and after optimization.
Energies 14 02716 g026
Table 1. Performance comparison of different types of compressors.
ScrollScrewVariable Delivery PistonRootsRadial
FCS Net Power (kW)5080508080
Net input power (kW) at full flow5.2 (with expander)9.1 (with expander)5.4 (with expander)15.5 (with expander)15.7 (with expander)
Input power vs. FCS Net power (%)10.4 (with expander)11.4 (with expander)10.8 (with expander)19.4 (with expander)19.6 (with expander)
Pressure ratio at full load3.22.93.22.52.5
Mass flow at full load (g/s)7690–100769292
Weight (kg)36 a39 c27 b23.522b
Volume (liters)27 a52 c48–65 b1215 b
a: Without motor and controller; b: With motor and controller; c: Including noise cover, intercooler mufflers.
Table 2. Aerodynamic and geometric parameters of the radial compressor.
ParameterValue
Rated output power of FCS (kw)100
Rotation speed (rpm.)60–100 k
Total pressure ratio1.4–2.7
Design point Rotation speed (rpm)100 k
Design point Mass flow (kg/s)0.118
Design point Total pressure ratio 2.7
Design point Isentropic efficiency 83.5%
Non-dimensional speed coefficient0.577
Blade numbers16 (8 + 8)
Blade thickness(mm)1
Relative tip clearance2%
Radial exit angle (°)85
Table 3. Range of variation in each control vertex for main blade.
Main Blade/mm ξ 3 ξ 4 ξ 5 ξ 6 ξ 7
η1[−2.0, 0.5][−2.0, 0.5][−2.0, 0.5][−1.0, 0.5][−0.5, 0.5]
η2[−2.0, 2.0][−2.0, 2.0][−2.0, 2.0][−1.0, 1.0][−0.5, 0.5]
η3[−2.0, 2.0][−2.0, 2.0][−2.0, 2.0][−1.0, 1.0][−0.5, 0.5]
η4[−0.3, 2.0][−0.3, 2.0][−0.3, 2.0][−0.3, 1.0][−0.5, 0.5]
Table 4. Range of variation in each control vertex for splitter blade.
Splitter Blade/mm ξ 3 ξ 4 ξ 5 ξ 6 ξ 7
η1[−2.0, 0.5][−2.0, 0.5][−2.0, 0.5][−1.0, 0.5][−0.5, 0.5]
η2[−2.0, 2.0][−2.0, 2.0][−2.0, 2.0][−1.0, 1.0][−0.5, 0.5]
η3[−2.0, 2.0][−2.0, 2.0][−2.0, 2.0][−1.0, 1.0][−0.5, 0.5]
η4[−0.3, 2.0][−0.3, 2.0][−0.3, 2.0][−0.3, 1.0][−0.5, 0.5]
Table 5. Parameter settings of MIGA.
OptionValue
Sub-Population Size10
Number of Islands10
Number of Generations20
Rate of Crossover0.98
Rate of Mutation0.01
Rate of Migration0.01
Interval of Migration5
Table 6. Comparison of the performance at the design point before and after optimization.
Mass Flow (g/s)Total Pressure RatioIsentropic EfficiencyComprehensive Surge Margin 1
Original118.332.7083.5%12.4%
Optimization122.972.7184.2%15.7%
Relative change+3.77%+0.37%+0.7%+2.7%
1 Comprehensive   surge   margin = ( P s M d P d M s - 1 ) × 100 % . Ps: Total pressure at the surge point; Pd: Total pressure at design point; Ms: Mass flow at the surge point; Md: Mass flow at design point.
Publisher’s Note: MDPI stays neutral with regard to jurisdictional claims in published maps and institutional affiliations.

