Article

Implementation of Climate/Energy Targets of the Europe 2020 Strategy by the EU Member States

by
Barbara Kryk
and
Małgorzata Klaudia Guzowska
*
Institute of Economics and Finance, University of Szczecin, Mickiewicza 64, 71-101 Szczecin, Poland
*
Author to whom correspondence should be addressed.
Energies 2021, 14(9), 2711; https://doi.org/10.3390/en14092711
Submission received: 1 April 2021 / Revised: 28 April 2021 / Accepted: 4 May 2021 / Published: 9 May 2021
(This article belongs to the Collection Feature Papers in Energy, Environment and Well-Being)

Abstract

:
The most important goals on the Europe 2020 Strategy contained were the climate/energy goals, which determine the achievement of other targets of the strategy. The aim of the article is to evaluate the implementation of the climate/energy targets of the Europe 2020 Strategy by the EU Member States in 2010 and 2019 and to compare the results achieved by them. To measure them, a basic set of indicators was used for this purpose, which the authors supplemented with additional indicators. The evaluation was done using the taxonomic and zero-unitarization method. They made it possible to integrate all indicators. Moreover, the added value in relation to other studies is: the use of individual indicators, instead of general ones obtaining additional information about the internal structure and nature of the implementation of multidimensional groups of targets and focusing solely on the achievement of climate/energy targets. The achieved results not only reflect the progress of the Member States in achieving the climate/energy targets and the differences in the level of achieving objectives between countries, but they are also discussion on future strategic objectives, their indicators and necessary directions for a further community climate/energy policy.

1. Introduction

Global climate change is one of the fundamental problems of our time. Generally speaking, it is caused by substances and processes influencing the Earth’s energy balance. These factors are both natural and anthropogenic [1]. The main cause of anthropogenic climate change is the increased scale of the greenhouse effect triggered by men and occurring due to greenhouse gases of natural and anthropological origin. Particularly dangerous gases of anthropological origin, the emissions of which must be significantly reduced, are defined in the Kyoto Protocol [2] and the Montreal Protocol [3]. The most harmful greenhouse gas is CO2. Anthropogenic CO2 emissions origin from three main areas of activity: combustion of coal, oil and gas (mainly by energy, industry and transport), various technological processes and changes in land use.
A significant reduction of greenhouse gas emissions, especially carbon dioxide and methane, is a necessary measure to curb climate change [4]. This means a significant reduction in fossil fuels, which are responsible for nearly two-thirds of global greenhouse gas emissions [5]. Fossil fuels constitute a non-renewable resource and are depleted quickly. The beneficial consequences of ceasing to use fossil fuels towards alternative energy sources, will be the reduction of air pollution, reduction of external costs related to fuel extraction and building future-oriented, innovative sectors of the economy [6].
The analysis of the costs of inhibiting climate change carried out by W. Nordhaus [7] proves that:
(1)
Climate change can be kept in a safe place. If the world takes intensive and effective action towards this goal, with the universal participation of all countries, it is possible to achieve the target set at the COP15 climate summit in Copenhagen (2009) [8], which was to limit the growth of the global temperature to 2 °C.
(2)
Achieving the goal requires concerted international cooperation and the effectiveness of actions taken. The imperative of international cooperation means that most countries should join common efforts relatively quickly.
(3)
The effectiveness of climate projects requires not only the universal participation of all countries, but also mutual concern for the reduction of costs incurred. An effective climate program cannot have excessively differentiated mitigation costs across sectors and countries.
This means that solving the significant problem of climate change depends on the close, real and effective cooperation of all states. Meeting this condition turned out to be most difficult, as evidenced by the unfulfilled climate and energy targets set in previous international agreements. The greatest commitment to their implementation is shown by the EU, which has reduced greenhouse gas emissions to the greatest extent and started the transformation towards a zero-emission economy. The EU has consistently taken steps obliging its members to take appropriate actions in this regard. This has been expressed in the Europe 2020 Strategy, in force from 2010 to 2020. Europe 2020 Strategy is the completed European Union (EU) ten-year program of socio-economic development covering economic, social and environmental goals. One of its three main priorities was sustainable development: supporting a more resource-efficient, greener and more competitive economy [9]. The overriding goal, a of this priority was the following package of climate/energy targets (referred to as 3x20):
  • Reduction of CO2 emissions by at least 20% compared to the level as of 1990 or, if conditions permit, by up to 30%.
  • Increasing the share of renewable energy sources (RES) in total energy consumption to 20%.
  • Increasing the efficiency of energy use by 20%.
Their implementation is very important, both for the EU and the whole world. They condition the achievement of other targets of the strategy (including providing people with an adequate level and quality of life through, among others, healthy living conditions or reducing energy poverty). To measure them, a set of synthetic indicators (4) has been established, which make it possible to compare achievements at the national, community and international level. In 2015—after the United Nations announced the 2030 Agenda, which the EU actively participated in developing, adequately to its goal No. 7—the list of indicators was extended to 8. This goal corresponds to the EU energy and climate policy [10], therefore it has adopted indicators for monitoring its results to measure the climate/energy objectives of the Europe 2020 Strategy. Due to the expiry of the Europe 2020 Strategy, it is necessary to verify whether the EU has fulfilled the adopted obligations. Hence the purpose of the article is to assess the implementation of the goals set in the climate/energy targets of the Europe 2020 Strategy by the EU Member States in 2010 and 2019, as well as to compare the results achieved by them. Additionally, the article attempts to answer 3 research questions:
  • Have climate/energy targets been achieved?
  • How do the EU-28 countries differ in terms of their level of achievement?
  • Are there significant differences in the level of achieving the climate/energy targets among countries?
For the purposes of the article, the taxonomic research with application of zero-unitarization method has been used, which allows for a synthetic assessment of EU countries according to the level of implementation of the climate/energy target package. The Europe 2020 strategy (3x20) and an analysis of changes in achievements for each of the three groups of goals in the package. This method allows to integrate the indicators used to report on the goal of the 7th Agenda 2030 and indicators additionally selected for this analysis by the authors—which is an extension of the previously used set of variables serving this purpose. It should be noted that literature on the subject, as well as the EU documents assess the target implementation:
  • Usually comprehensively for all its purposes [11,12,13,14,15], rarely for selected groups [16].
  • Only based on main indicators [17,18].
  • In most cases based on time series/percentage analysis [17,19,20].
  • Through development scenarios [21,22,23] or qualitative analysis of the solutions used [24,25].
The added value of the article, in addition to the extensive set of measurement indicators, is: focusing only on the implementation of climate/energy targets of Europe 2020, obtaining additional information about the internal structure and nature of implementing multidimensional goals, the use of individual, not total indicators, which better show the achievement of the main objective.
The rest of the article is organized as follows: a synthetic presentation of the EU’s commitment to the implementation of the climate/energy targets of the Europe 2020 Strategy and beyond 2020, literature review, description of the research methodology, presentation of the results of two research stages in 28 EU states. The first stage assesses the Member States’ implementation of the climate/energy target package of the Europe 2020 Strategy using a synthetic measure (SM). The SM indicates the achievements of countries in implementing all of the climate/energy targets of the Europe 2020 Strategy. However, it does not show the degree of achieving individual goals from the 3x20 package. Therefore, the second stage of the research estimates the separate synthetic measures of achieving the three goals. This allowed to identify differences in the level of their implementation by individual countries and to determine which area negatively/positively influenced the final results. The achieved results reflect not only the progress of the Member States in meeting the climate and energy targets, but also the discussion on future strategic goals and their indicators. The article ends with a summary containing conclusions from the analysis, answers to the questions posed and recommendations/suggestions for further actions/research directions.

2. Review of Documents and Literature

2.1. Review of Documents

The European Union stands out with its high commitment and experience in combating climate change and ensuring sustainable energy, both at the international and intra-Community level. Since its founding in 1993, EU representatives and institutions have taken various initiatives/actions that prioritize climate challenges. They are adequate to the arrangements at the international level. Figure 1 presents the calendar of the most important EU initiatives in the studied area against the background of global actions.
The Europe 2020 Strategy adopted the climate/energy targets package (the so-called 3x20) until 2020:
  • Reduction of CO2 emissions by at least 20% compared to the level as of 1990 (or, if possible, by as much as 30%).
  • Increasing the share of renewable energy sources (RES) in total energy consumption to 20%.
  • Increasing the efficiency of energy use by 20%.
This package was integral with the leading initiative “Resource-efficient Europe”. The purpose of the document was to help decouple economic growth from the use of resources, support the shift towards a low carbon economy, increase the use of renewable energy sources, modernise our transport sector and promote energy efficiency. In addition to these regulations, other initiatives had also been adopted, including reforming the European emissions trading system or implementing emission reduction commitments in sectors non-ETS, strengthening the combat against global warming.
In 2015, the EU’s progress in meeting climate/energy targets was significantly more advanced in comparison to other countries. Nevertheless, during the COP 21 conference (2015) in Paris, it turned out that it is insufficient in relation to the existing climate situation. It was indicated that it was necessary to intensify actions in this area not only within the EU, but also by other countries in the world [26]. The Paris Agreement was adopted at COP 21 [27], which was a milestone in the multilateral process of climate change. 196 countries have signed the Agreement, committing to limit global warming in the 21st century to levels well below 2 °C in relation to the levels from the pre-industrial era and to continue efforts to keep temperature increases below 1.5 °C. In addition, the purpose of the agreement is to increase the ability of countries to cope with the effects of climate change. These commitments mean that the shared global goal is now to become carbon neutral by 2050. New to the agreement to enhance the global response to climate change is the establishment of binding commitments by all Parties to prepare, deliver and maintain a nationally determined contribution (NDC) and to apply national measures in order to achieve them. It also orders that the Parties will provide precise information on the achievement of the objectives every five years.
The EU is fully committed to implement the Paris Agreement and its long-term goals. Five years upon its signing, it is becoming a leader in fulfilling its obligations [28]. It urges not only its members, but also other countries to rapidly raise the level of global ambition in connection with the need to reduce greenhouse gases by 80% compared to 1990 in three decades. The EU’s response to climate/energy challenges is the largest regulatory package in the history of the Community, “Clean Energy for all Europeans”, the so-called “Winter Package” (2016, details agreed in 2018) [29]. It introduces the legal framework of the five dimensions of the Energy Union that the Community is striving to achieve. Namely: increasing energy efficiency, building a single internal energy market, decarbonisation, increasing energy security and greater innovation and competitiveness of the European energy sector. One of the main aims of the winter package is to integrate energy and climate policies more closely, enabling the achievement of climate goals through energy policy measures. It consists of eight legal acts which the Member States have two years to implement. Only the new features introduced by the package concerning strictly climate goals have been listed below.
One of the most strategic changes resulting from the package is harmonizing planning and coordination of the implementation of national energy policies at the EU level. This is to ensure the implementation of the EU’s RES and energy efficiency targets for 2030, greater efficiency in reducing CO2 emissions (a reduction of 40% compared to the level in 1990), increasing competition in the energy market and thus limiting the increasing energy prices for consumers in the EU. The changes will result from new EU instruments and competences, such as: integrated 10-year national energy and climate plans, participation of the European Commission in national planning (open method of Coordination), control of the preparation and implementation of plans, European semester, monitoring in the climate policy. These instruments, for the first time, gave the EU the opportunity to compile and compare the national energy and climate policies of its members. This will allow the European Commission to identify not only the leaders, but also the countries that are doing the worst. This will be possible, i.e., thanks to the possibility of “blaming and shaming”, reconciliation of duties, sanctions. The plans are open and prepared according to a single scheme, which ensures their consistency and comparability. The first forecasts in the context of the national energy and climate plans and the monitoring mechanism have already been assessed by the European Commission. As a result, for some members goals have been set that were not ambitious enough (e.g., Poland) and it was recommended to revise the plans [26,30]. Thus, a tightening of management in the studied area can be observed [24].
The package provides for a number of regulations supporting the integration of RES in the energy system so that they can develop faster than before. This is necessary because it has been established that in 2030 the share of energy from renewable sources in the EU in the final gross energy consumption is to be at least 32%. For the first time, a target for the heating and cooling sector has been introduced—to increase the share of renewable energy sources by about 1.3 pp. annually. Even though the package did not adopt mandatory national targets, it created EU mechanisms and tools to ensure their effective implementation as national contributions. They concern both the power and heating sectors. They include: the process of preparing and updating the assumptions in national energy and climate plans, access paths (the so-called trajectories) to the RES target in 2021–2030, assessment of progress in its implementation every 2 years, the EU RES financing mechanism. In addition, it is planned:
  • To open national RES support systems for participants in cross-border countries with direct network connections.
  • To create the Union Renewable Development Platform (URDP), which will expand the possibilities of trading RES shares between Member States (e.g., statistical transfers, joint projects or support systems).
  • Priority disposal of small RES units has been left to units with an installed electric power below 400 kW. Larger entities may receive this privilege from the state.
  • To strengthen the position of consumers on the energy market.
  • Actions of new entities defined as “renewable energy communities” [31].
The new regulations offer interesting opportunities for countries that have not achieved their 2020 national target. They have, thus, gained time until the end of 2021 to take effective countermeasures. If appropriate effects of their actions are not achieved, they will be able, for example, to use statistical transfers as part of the new EU platform for renewable energy development. As the transfers are expensive, they will determine the development of cheaper RES and accelerate the achievement of the EU target.
In terms of energy efficiency, a higher target of 32.5% has been set than before, with the possibility of increasing it further in 2023 after prior assessment. This is an EU-wide binding target. In addition, Member States are required to deliver cumulative end-use energy savings corresponding to annual new savings of at least 0.8% of final energy consumption in 2021–2030. Mechanisms have been established as part of the Energy Union governance system to ensure the achievement of the energy efficiency target through national contributions from EU members. These mechanisms include: the process of preparing, assessing and updating national plans, trajectories leading to the achievement of the EU target, progress reports every two years as well as national and community policies and measures (including EU and national support systems, simplification of administrative procedures, country recommendations issued under the European Semester, commitments under the Paris Agreement). Their introduction means that, as in the case of renewable energy sources, the implementation of the target will be more controlled. This is to serve better effectiveness of the target fulfilment by all EU Member States [25,32]. Strengthened control and support for efficiency growth are in line with the “energy efficiency first” principle, which is a priority for the entire Winter Package. Therefore, it should not be surprising that a similar approach has been reflected in the mechanisms of the EU financial support for the energy transformation necessary to achieve climate neutrality. Hence, the electricity and heat sectors will receive greater support for investments related to energy efficiency [31,33].
To sum up, the Clean Energy package has started the implementation of the established energy union, which is the next stage in reforming the Community’s climate and energy policy. The package clearly indicates the directions and methods of transformation—the priority is RES and energy efficiency. Its assumptions have been reflected in the economic, regional and financial policy of the EU, which will facilitate the transformation. They have also been transposed into subsequent new EU documents, including Long-term low greenhouse gas emission development strategy of the European Union and its Member States [34], A Clean Planet for all—A European strategic long-term vision for a prosperous, modern, competitive and climate neutral economy [35].
In 2018, the Progress Global Strategy Group of Friends was assessed during the Global Diplomacy Week. It turned out that the targets adopted in the Clean Energy package to reduce greenhouse gas emissions by 2030 (40%) and 2050 (60%) are insufficient. Between 1990 and 2018, the EU reduced its greenhouse gas emissions by 23%, while the economy grew by 61%. Therefore, additional measures are required to achieve climate neutrality (each sector will have to contribute to the reduction of CO2). Despite the introduction of a comprehensive policy framework for reducing greenhouse gas emissions and commencing the modernization and transformation of the economy for this purpose, the EU was expected to raise the reduction targets [26]. Therefore, in 2019, the European Commission presented a new document “European Green Deal” (EGD) with higher targets for reducing CO2 emissions. It is a set of 50 actions for the next five years across all sectors in order to prepare the EU economy for climate neutrality in 2050 [36,37]. The Green Deal is Europe’s new growth strategy aiming at transforming the EU into a fair and prosperous society. It combines policy strategies to combat climate change, protect and restore biodiversity, eliminate pollution, transition to a circular economy and ensure that no one is left behind in the green transition [26]. According to the Report of the International Energy Agency (IEA) [19], the EGD provides the perfect framework to stimulate short- and long-term efforts towards a clean, resilient, sustainable and equitable recovery of the EU economy. The EGD has the potential to accelerate investments and the technological advances needed for long-term decarbonisation. Moreover, the EGD is an opportunity for greater coherence of EU policies. Complementary to the EGD is the proposal for a regulation on European climate law, adopted by the European Commission on 4 March 2020. [38]. It proposes that the EU’s greenhouse gas emission reduction target for 2030 should be increased to at least 55% and up to 80% in 2050 compared to the levels as of 1990 (including emissions and removals). The European Parliament endorsed the EU’s goal of net-zero greenhouse gas emissions by 2050 in its resolution of 14 March 2019 on climate change [38].
The presented (and only the selected) initiatives and documents of the EU concerning the objectives and the climate/energy policy reflect the EU’s enormous legislative, management and political efforts aimed at commencing the implementation of the goals set for the next decades after the Europe 2020 Strategy. Therefore, it is important to evaluate the existing climate/energy targets to determine the baseline for future action.

2.2. Review of Literature

The huge role of the Europe 2020 Strategy has determined the appearance of a large number of publications on its implementation, including scientific reports (incl. the ones of the European Commission and various institutions), studies of the European Statistical Office and Statistical Offices of the Member States.
The implementation of the Europe 2020 strategy and its impact on the development and competitiveness of the EU Member States and EU as a whole has been the research topic of a large number of authors.
Most publications present empirical studies of the progress made by the Member States in implementing the strategy, presenting results from a different perspective:
  • By analysis of the diversity between old and new member states [39].
  • By analysis Europe 2020 strategy for smart, sustainable and inclusive growth [40].
  • By calculating the distance from EU 2020 strategy targets [41].
  • By ranking and classification of EU countries regarding their levels of implementation of the Europe 2020 strategy [42].
  • By analysis of the macroeconomic effects of the Europe 2020 strategy [43,44].
  • By analysis of the smart rural development [45].
  • By measuring Central and Eastern Europe’s socio-economic development [46].
  • By institutional analysis of the Europe 2020 strategy [47].
  • By analysis of the economic performance and competitiveness of the EU members [48,49,50,51].
Part of the publications concerns the assessment of the implementation of strategic goals in selected countries (e.g., [52]) or in a group of countries against the background of the EU (e.g., [53]). Few publications focus strictly on energy/climate goals [25,54,55,56,57,58,59].
In the literature, as well as in EU documents, the achievement of the strategy’s objectives is evaluated:
  • Through scenario analysis [21,22,23,43].
  • Qualitative analysis of the solutions used [24,25].
  • Panel analysis [48].
  • By means of unidimensional and multidimensional indices specially constructed for this purpose [39,41,42,46,47,50,54].
  • By means of performance/efficiency measures, e.g., DEA (Data Envelopment Analysis) [60,61].
None of them used complementary indicators to assess the implementation of the Strategy’s energy/climate, which is an additional argument in favour of such an action.
The article uses the taxonomic research with application of zero-unitarization method which makes it possible to synthetically assess EU member states according to the implementation of the climate/energy targets (the so called 3x20) of the Europe 2020 Strategy and an analysis of changes in achievements for the three groups of targets over time. This method allows the integration of basic indicators for reporting climate/energy goals with additional indicators selected by the authors for this analysis. The additional indicators come from the set of indicators used to monitor the implementation of the 2030 Agenda target.
This is an extension of the previously used set of variables serving this purpose.

3. Materials and Methods

The main thrust of methods of determining synthetic variables is the transition from multi-dimensional system of features to one-dimensional system through aggregation of variables which may be based on model or non-model formulas. The replacement of multi-elemental set of features by one synthetic variable allows for prioritizing analysed objects by the value of aggregated variable and conducting comparative analyses both in time and space, maintaining the substantive comprehensiveness of studies [62].
Used in this paper the zero -unitarization method is one of the methods of normalization of diagnostic features [39,63,64,65,66]. The zero -unitarization method allows to obtain multi-criteria evaluations of the researched phenomenon, so it enables to carry out comparison between the objects. Additionally, this method allows to normalized diagnostic features transformed by means of this method contain their values in the range of [0,1].
The method was chosen because it is characterized by relatively high efficiency in organizing and sharing objects. The additional advantage of the method is its simplicity and the lack of methodological controversies for its application [65,66].
The analysis is based on the normalization with a constant reference point for the whole period of the analysis (the years 2010 and 2019) which gives the possibility of dynamic analysis and enables comparing the values of the synthetic index for analysed years. In addition, this approach allows the introduction of new reference values for selected variables. In particular, that during the period under review most countries, especially in the case of Headline target 3, had reached the target values before the end of the period under review.
The constant reference point gives the range of normalised variables described with Equation (1) [66].
R ( X j t ) = max i t x i j t min i t i j t
The method used allows not only to create rankings of countries and evaluation of the implementation of the headline indicators but also evaluated at two analytic levels the fulfilment of the energy/climate aims of Europe 2020.
Using those properties in the paper: first, the overall evaluation with one synthetic measure for all the three energy/climate aims of the Europe 2020 strategy was estimated. Then the countries were evaluated in terms of the separate energy/climate aims of the strategy.
Additionally, zero -unitarization method allows a group of results into four classes—countries with: (a) very high; (b) high; (c) medium and (d) the low level of achievement of the goals of the Europe 2020 strategy related to energy and climate. In the research, the data from Eurostat for the period of 2010 and 2019 (2018 in some cases) was used. The fulfilment of headline targets in the paper is monitored with the following specific diagnostic criteria presented in Table 1.
Among the selected variables, 6 ( x 8 t , x 9 t ,   x 12 t , x 13 t , x 14 t , x 15 t ), were considered to be stimulants characteristics having a positive influence on the measure, whereas 9 ( x 1 t , x 2 t , x 3 t ,   x 4 t , x 5 t , x 6 t ,   x 7 t , x 10 t , x 11 t ) were regarded as destimulants reducing the synthetic measure of the fulfillment of social goals.
In order to bring the variables to comparability, they were normalized by means of the min-max normalization. [64,65]:
z i j t = x i j t min i t { x i j t } max i t { x i j t } min i t { x i j t }
( i = 1 , 2 ,   , n ) ;   ( j = 1 , 2 , , m ) ; ( t = 1 , 2 , , l ) ; z i j [ 0 , 1 ]
z i j t = max i t { x i j t } x i j t max i t { x i j t } min i t { x i j t }
( i = 1 , 2 ,   , n ) ;   ( j = 1 , 2 , , m ) ; ( t = 1 , 2 , , l ) ; z i j [ 0 , 1 ]
where: z i j t is the normalized value of the j-th variable in the i-th country on year t. x i j t is the initial value of the j-th variable in the i-th country on year t.
The stimulants were normalized with the Formula (2) and the destimulants with the Formula (3).
Assessment of the variable that characterizes the objects—a synthetic measure S M i t —was obtained with the Formula (4).
S M i t = 1 m j = 1 m z i j t
( i = 1 , 2 ,   , n ) ;   ( j = 1 , 2 , , m ) ; ( t = 1 , 2 , , l ) ; z i j [ 0 , 1 ] ; S M i [ 0 , 1 ]
The synthetic measure enables to divide the set of countries into four groups:
  • Group I—the countries with very high level of synthetic measure of fulfillment aims of the Strategy, where ( S M i t S M i t ¯ + S ( S M i t ) )
  • Group II—the countries with a high level of synthetic measure of fulfillment aims of the Strategy, where ( S M i t ¯ S M i t < S M i t ¯ + S ( S M i t ) ) ,
  • Group III—the countries with an average level of synthetic measure of fulfillment aims of the Strategy, where ( S M i t ¯ S ( S M i t ) S M i t < S M i t ¯ ) ,
  • Group IV —the Countries with a low level of synthetic measure of fulfillment aims of the Strategy, where ( S M i t < S M i t ¯ S ( S M i t ) ) ,
where
S M i t ¯ —arithmetic mean of a synthetic measures S M i t
S ( S M i t ) —standard deviation of a synthetic measure S M i t .

4. Results

In the first stage of the research assessed the implementation by EU Member States of the climate/energy targets package of the Europe 2020 strategy was assessed using the synthetic measure (SM). It was calculated by extending the set of indicators provided for this. Based on this synthetic measure of development the countries were grouped into the four categories. The result of the empirical research is presented in Table 2 and in Figure 2.
In the second stage of the research the synthetic measures for reaching the separate three targets were estimated. The results are presented in Figure 3, Figure 4 and Figure 5.
The amount of the synthetic measure of the achievement of the climate/energy target package reflects the changes that have taken place over 9 years, both in groups of countries according to the level of achievement and their position in the ranking. In 2019, the number of countries with very high level of synthetic measure of fulfilment aims of the strategy was one less than in 2010. PT left the group, with achievements lower than in the base year. Three countries remained in the group: SE (moved from position 4 to 1 due to the largest change in SM among 28 countries), DK (remained in position 2) and RO (remained in position 3). RO is the only country among the new EU members in this group. In comparison, RO had the highest rate of changes in the implementation of climate/energy targets, which proves its effort in the studied area.
In 2019, the countries with a high level of synthetic measure of fulfilment aims of the Strategy group increased from 9 to 13. Three countries, MT, FI and SI, previously belonging to groups III and IV, were promoted to the group. The fourth country is PT, which moved from group I. Among these countries, MT and FI had the largest achievements in meeting the targets. The achievements of other countries in this group were lower than in 2010. Four countries moved to lower positions (IT, AT, ES, GR) and five were promoted to higher positions (LV, HR, IE, UK, FR). A spectacular achievement was recorded by LV—promotion from position 12 to 4.
In 2019, the number of countries with an average level of synthetic measure of fulfilment aims of the strategy was one less than in 2010. There are seven existing members (SK, HU, LT, DE, CZ, BG, PL), EE and NL have joined in. Almost all countries, except EE, had a lower level of the SM index, which means lower achievements compared to the base year.
In the countries with a low level of synthetic measure of the fulfilment of the Strategy group, their number decreased from 6 to 3. In 2019, BE (promoted from 27th to 26th position) and LU (last place) remained in the group. CY joined Group IV, ranking from 21st place to 27th.
The analysis shows that in 2019, two countries—CY and PT—were placed lower in the ranking, and additionally, in the groups of countries with a lower level of implementation of climate/energy targets. This was due to the slower pace of their changes compared to the countries that are leaders in the studied area. This does not mean that there is no progress. Both countries showed positive changes in the absolute values of almost all analysed variables. There were 11 countries lower in the rankings, but in the same groups. All of them had a lower value of the SM index, which is alarming from the point of view of achieving strategic goals. EE, FI, MT, NL and SI entered the higher positions in the ranking and joined the higher groups. These countries reported a faster pace of implementing climate/energy targets than others, which determined its greater achievements. It is, therefore, worth checking whether the lower achievements in 2019 result from the countries’ achievement of their goals or insufficient actions in the area of climate/energy?
During the analysed period, virtually all countries observed an increase in the level of climate/energy target implementation, and while for some countries it was relatively smaller (e.g., LU, LT, HR, PT, PL, BE, SK, CZ), for others it was large (e.g., FI, EE, LV, SE, RO). In 2019, LU, CY, BE, LT, PL, SK, ES, SI, HU and CZ were the furthest away from the model. Whereas, 5 of them are new Member States from the Central and Eastern Bloc (LT, PL, SK, HU, CZ) where the energy sector is mostly based on fossil fuels that generate CO2. They are struggling to transform into a low carbon economy, which is delaying the achievement of EU targets. Some countries have certain climate/energy targets fulfilled (e.g., BE, LU), therefore their efforts to implement them are smaller. This negatively affects the value of the SM index. In turn, ES is still struggling with the effects of the economic crisis of 2008–2012 and social problems, which reduces expenditure on the energy transition and has a negative impact on achievements in the area of climate and energy.
DK, RO, LV and HR were the closest to the model (SE), i.e., the implementation of climate/energy targets. In 2019, these countries (next to SE) had the highest value of the SM index compared to other countries.
The SM indicates the achievements of countries in implementing all of the climate/energy targets of the Europe 2020 Strategy. However, it does not show the degree of achieving individual goals from the 3x20 package. Therefore, during the second stage of the research, synthetic measures of achieving the individual three goals of package were estimated (Figure 3, Figure 4 and Figure 5). This allowed to identify differences in the level of their implementation by individual countries and to determine which area negatively/positively influenced the final results.
At the beginning of 2019, MT, DK, RO and SE were the closest to achieving the headline target 1 and had the highest level of almost all indicators used to measure this target. CY, LU, PL and IE were the furthest from the model/goal achievement, with a small level of changes in the variables measuring a given goal. Two countries, PL and IE, observed increased, rather than decreased, values of two significant variables (the greenhouse gas emissions tonnes per capita and the greenhouse gas emissions intensity of energy consumption indicators) that determine the achievement of the goal. In the case of PL, it was the result of not only the advantage of coal in the energy mix, the defence of national interests, but also the unfavourable change in the regulations on renewable energy, which favoured the maintenance of coal as the basis of the energy sector. In the case of IE, on the contrary, the lack of decarbonisation of difficult sectors, e.g., (fossil fuels, dairy farming and road transport), placed emissions per capita in the third place among all Member States. Relatively recently, IE has declared that it wants to become the “world leader in climate action”. So far, there has been a discrepancy between the declared intention and reality [67]. CY and LU, on the other hand, reduced their greenhouse gas emissions, however insufficiently to meet the target. LU, despite the threat of not meeting the target, has achieved significant progress in reducing emissions compared to 2010. In 9 years, MT, SE, FI, DK, UK, GR, BG, LV reported the greatest achievements in meeting the target thanks to consistency in implementing the climate and energy policy. The following had little success in achieving Objective 1: HR, PT, HU and the already mentioned PL.
To sum up, during the analysed period, all countries showed progress in achieving the headline target 1. Unfortunately, the different pace of fulfilling the obligations, resulting from the current energy/fuel mix economy, national interests and unfavourable economic conditions, prevent some countries from achieving Objective 1 on time.
In 2019, IE, RO, UK and DK were the closest to achieving the headline target 2. During the observed period, the final energy consumption in households per capita and final energy consumption tonnes of oil equivalent per capita indicators have decreased. In the case of RO, the values of both indicators increased. This may be related to the fact that as a new member state, RO uses EU funds to a large extent in the social area, which has a positive effect on the income/economic condition of households. The result is reducing the risk of social and energy poverty and an increase in energy demand. These two variables also increased in FI and LU which were the furthest from the model. FI and LU were the furthest from the model. In their case, the level of SM was adversely affected by the value of the Final energy consumption in households’ per capita indicator—the highest in comparison to other countries. During 9 years, IE, LU and ES had the largest achievements in meeting the target. Especially thanks to the significant reduction of final energy consumption in households per capita, energy productivity, energy productivity purchasing power standard (PPS) per kilogram of oil equivalent and energy dependence by-product. The remaining variables had an insignificant impact on their results. It should be noted that among them, IE had the best achievements. The lowest achievements in headline target 2 were reported by SK, GR, LT, MT and CZ. The best results among them were achieved by CZ and SK, and the worst by GR (there is an ongoing internal economic crisis and no funds for the implementation of climate/energy commitments.). The remaining countries showed a slight change in the level of the variables studied.
In general, the achievements of countries in the implementation of headline target 2 during the analysed period were different. Importantly, energy productivity has increased in all countries (Euro per kilogram of oil equivalent—KGOE and energy productivity purchasing power standard (PPS) per kilogram of oil Equivalent). In almost all countries (except for FI, GR, LT) the population unable to keep home adequately warm by poverty status (% of the population) indicator had decreased. This means reducing energy exclusion, increasing people’s income and raising living standards. Which in turn contributes to reducing social exclusion.
In 2019, SE had the largest achievements of headline target 3. Thus, the performed analysis made it a model for other countries, a kind of confirmation that the climate/energy target 3 can be achieved. SE has achieved its target long ago and with a surplus. In 2019, its share of renewable energy in gross final energy consumption by sector exceeded 56% against the required 20% in 2020. That is why Figure 5 is so unusual, it seems as if most member states were far from achieving Objective 3, whereas, the truth is indeed the opposite. In 2019, 11 more countries achieved this goal. Namely: AT, BG, HR, DR, EE, FI, LV, LT, PT, RO and SI. It should be added that during the analysed period, these countries have reported an increase of three additional sector indices (in transport, electricity, heating and cooling) used to calculate the synthetic index, which is favourable.
BE, LU, MT and NL were the furthest from the model and target. These countries have reported the main indicator level below 10%, which means that they will not meet the 3rd target. In other countries, the level of this indicator ranged from 12% (IE) to 19.6%. GR, ES, IT, DE and FR had a chance to achieve the target in 2020.

5. Conclusions

Based on the research, the following conclusions have been drawn:
  • Analysis of the synthetic measure (SM) for 2010 and 2019 showed that: 13 countries ranked lower in position, of which 11 remained in their category (AT, IT, ES, GR, SK, HU, DE, CZ, BG, LT, PL) and 2 moved to a lower category (CY, PT). This means being further away from achieving the target. Only 3 countries maintained their positions in the same category: DK, RO—close to achieving their goals, LU—at risk of not achieving them. On the other hand, over 12 countries were placed higher in the ranking, 8 of which remained in their category (SE, HU, PT, LV, HR, ES, BG), and 4 moved to the higher category (EE, FI, MT, NL, SI). These countries have come closer to meeting the targets. The closest to achieving the goals was SE and the mentioned DK, RO. BE, CY and LU were the most distant from meeting the set targets.
  • When comparing the achievements in implementing the three objectives of the 3x20 package, it can be seen that Objectives 3 and 1 have been achieved to the greatest extent, and Objective 2 to the least. Insufficient achievement of Objective 2 has forced Member States to step up efforts to increase energy efficiency. (Similar conclusions were also presented in the following papers [68,69,70].
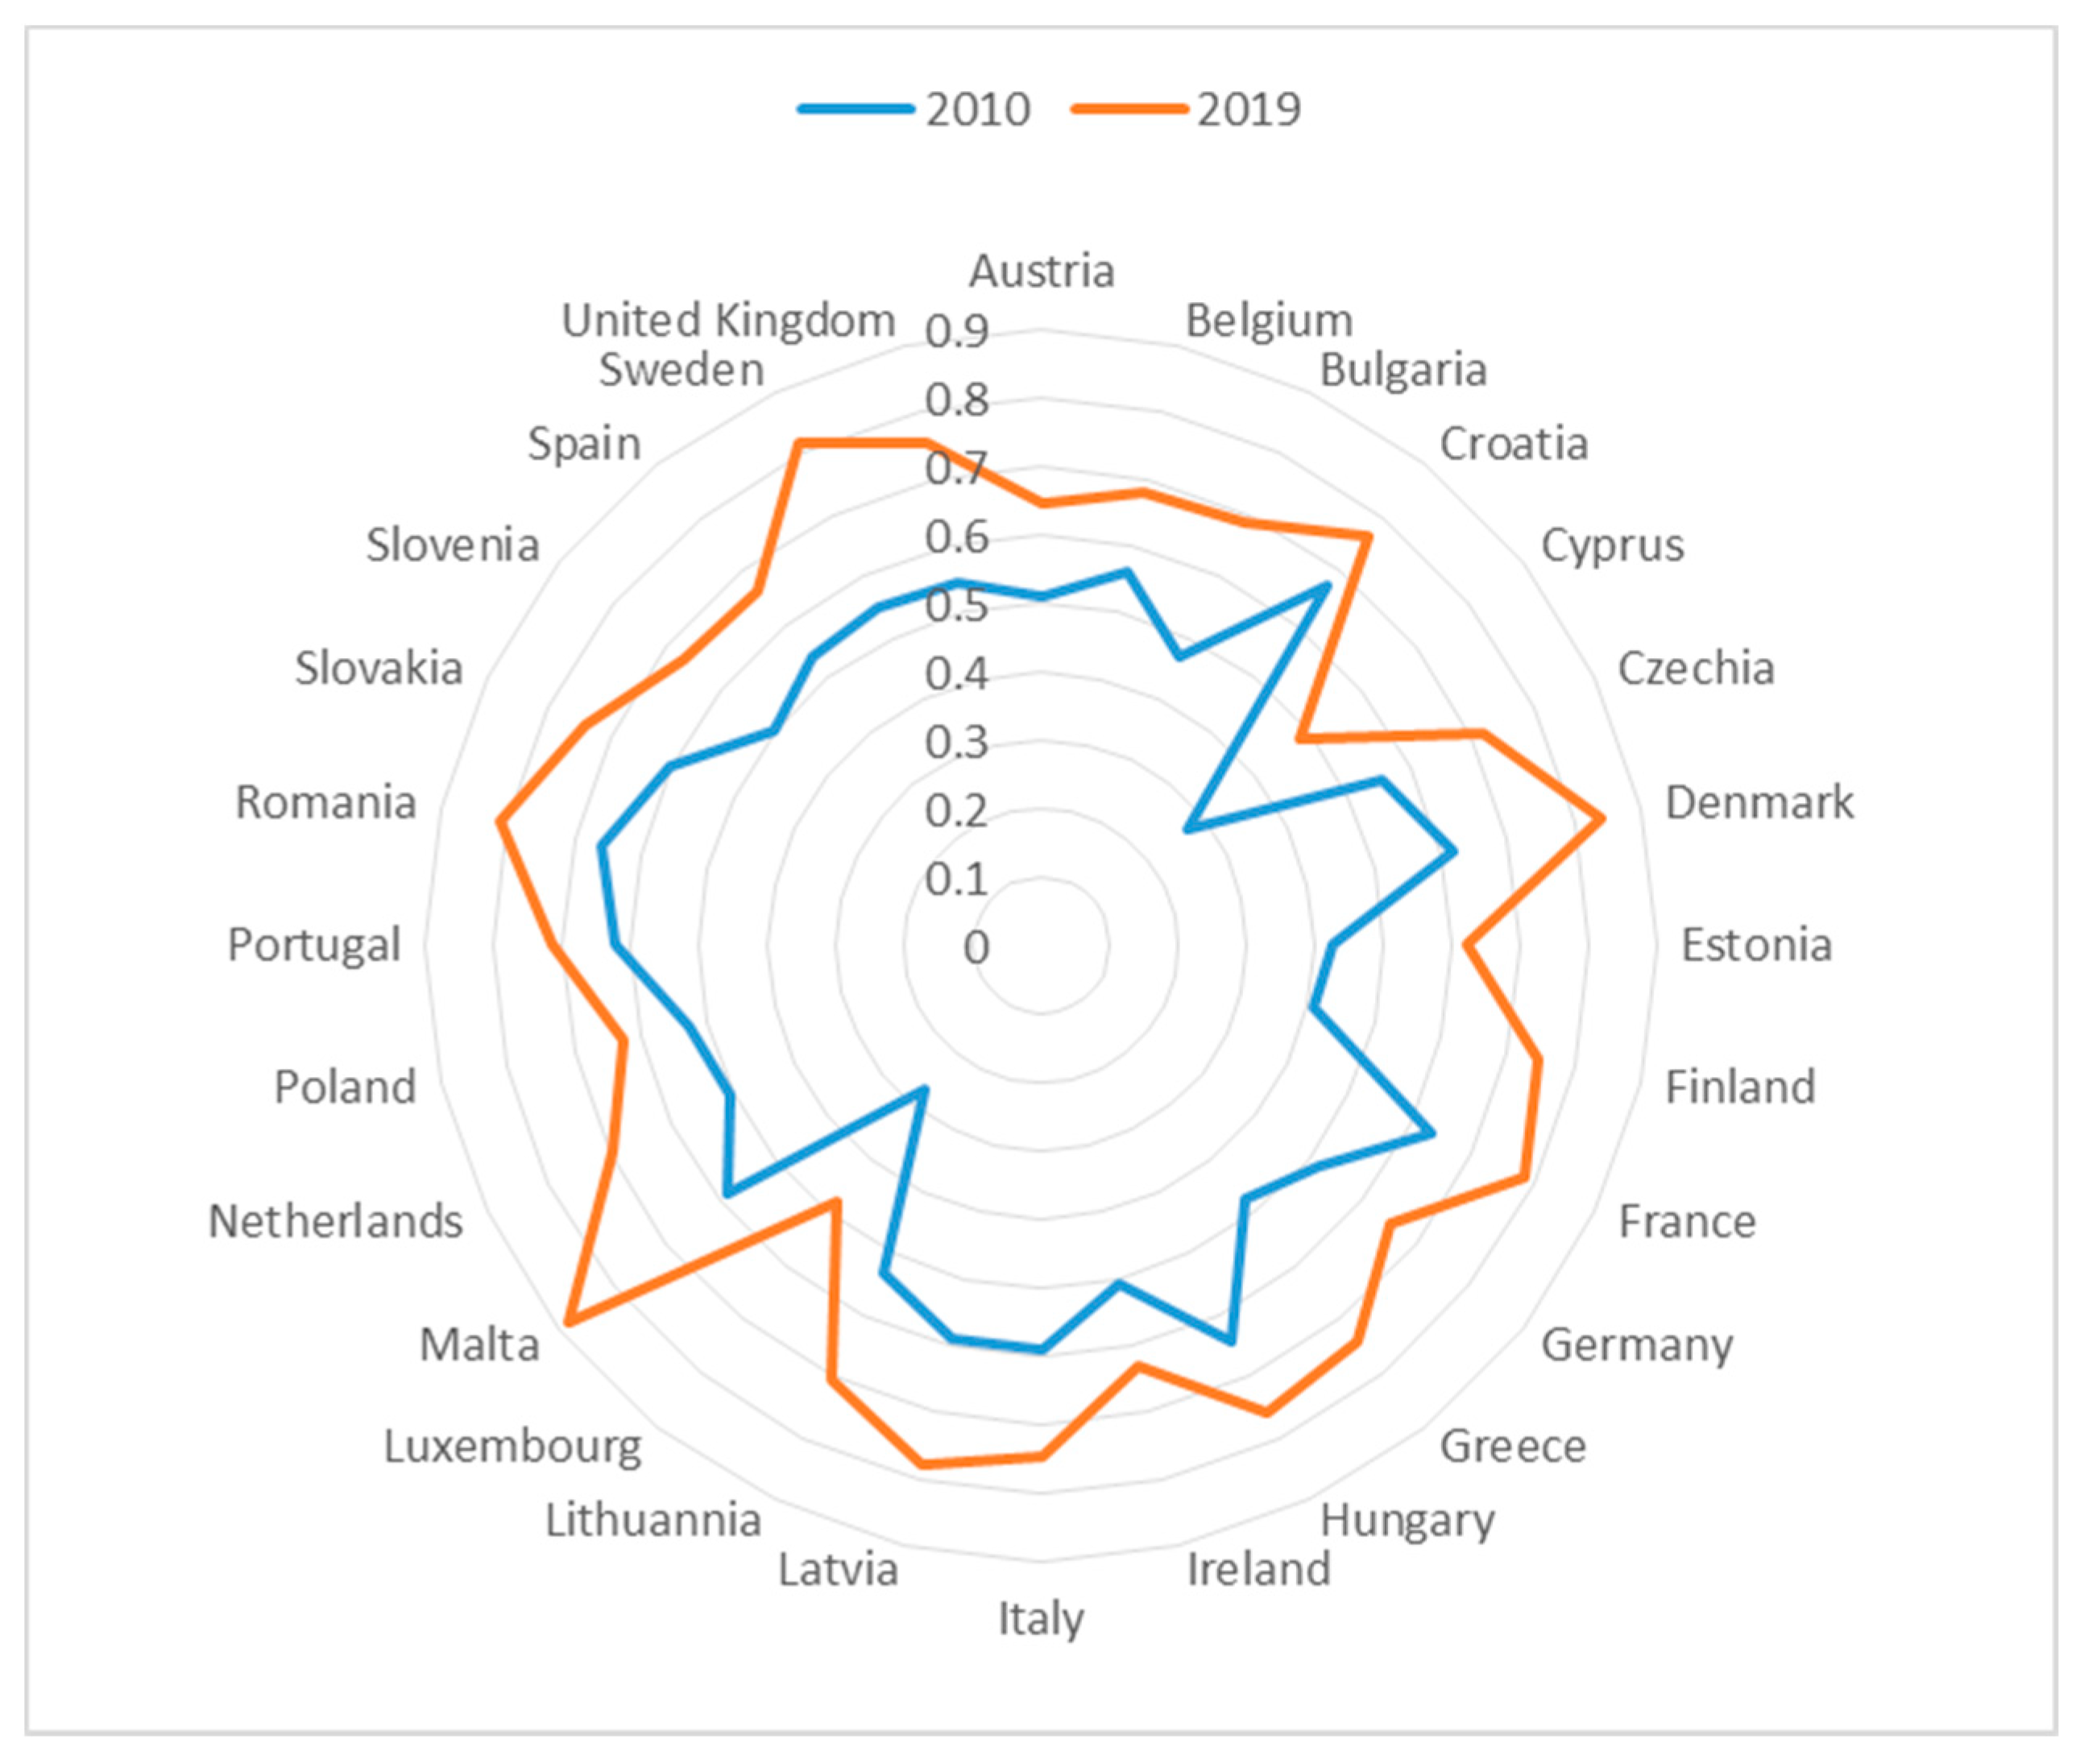
  • At the beginning of 2019, MT, DK, RO and SE were the closest to achieving the headline target 1. Whereas the furthest were CY, LU, PL and IE. A recent report by the European Commission proves that the EU has already achieved its 20% greenhouse gas emissions reduction target with a surplus by 2020, compared to the levels as of 1990. Total EU27 greenhouse gas emissions have been at their lowest levels since 1990. It’s been significantly decreased mainly due to emissions related to the energy supply. This has been reflected in a strong decline of emissions resulting from actions covered by the EU Emissions Trading System (EU ETS), while emissions from actions not covered by the EU ETS for several years have remained broadly unchanged. [26].
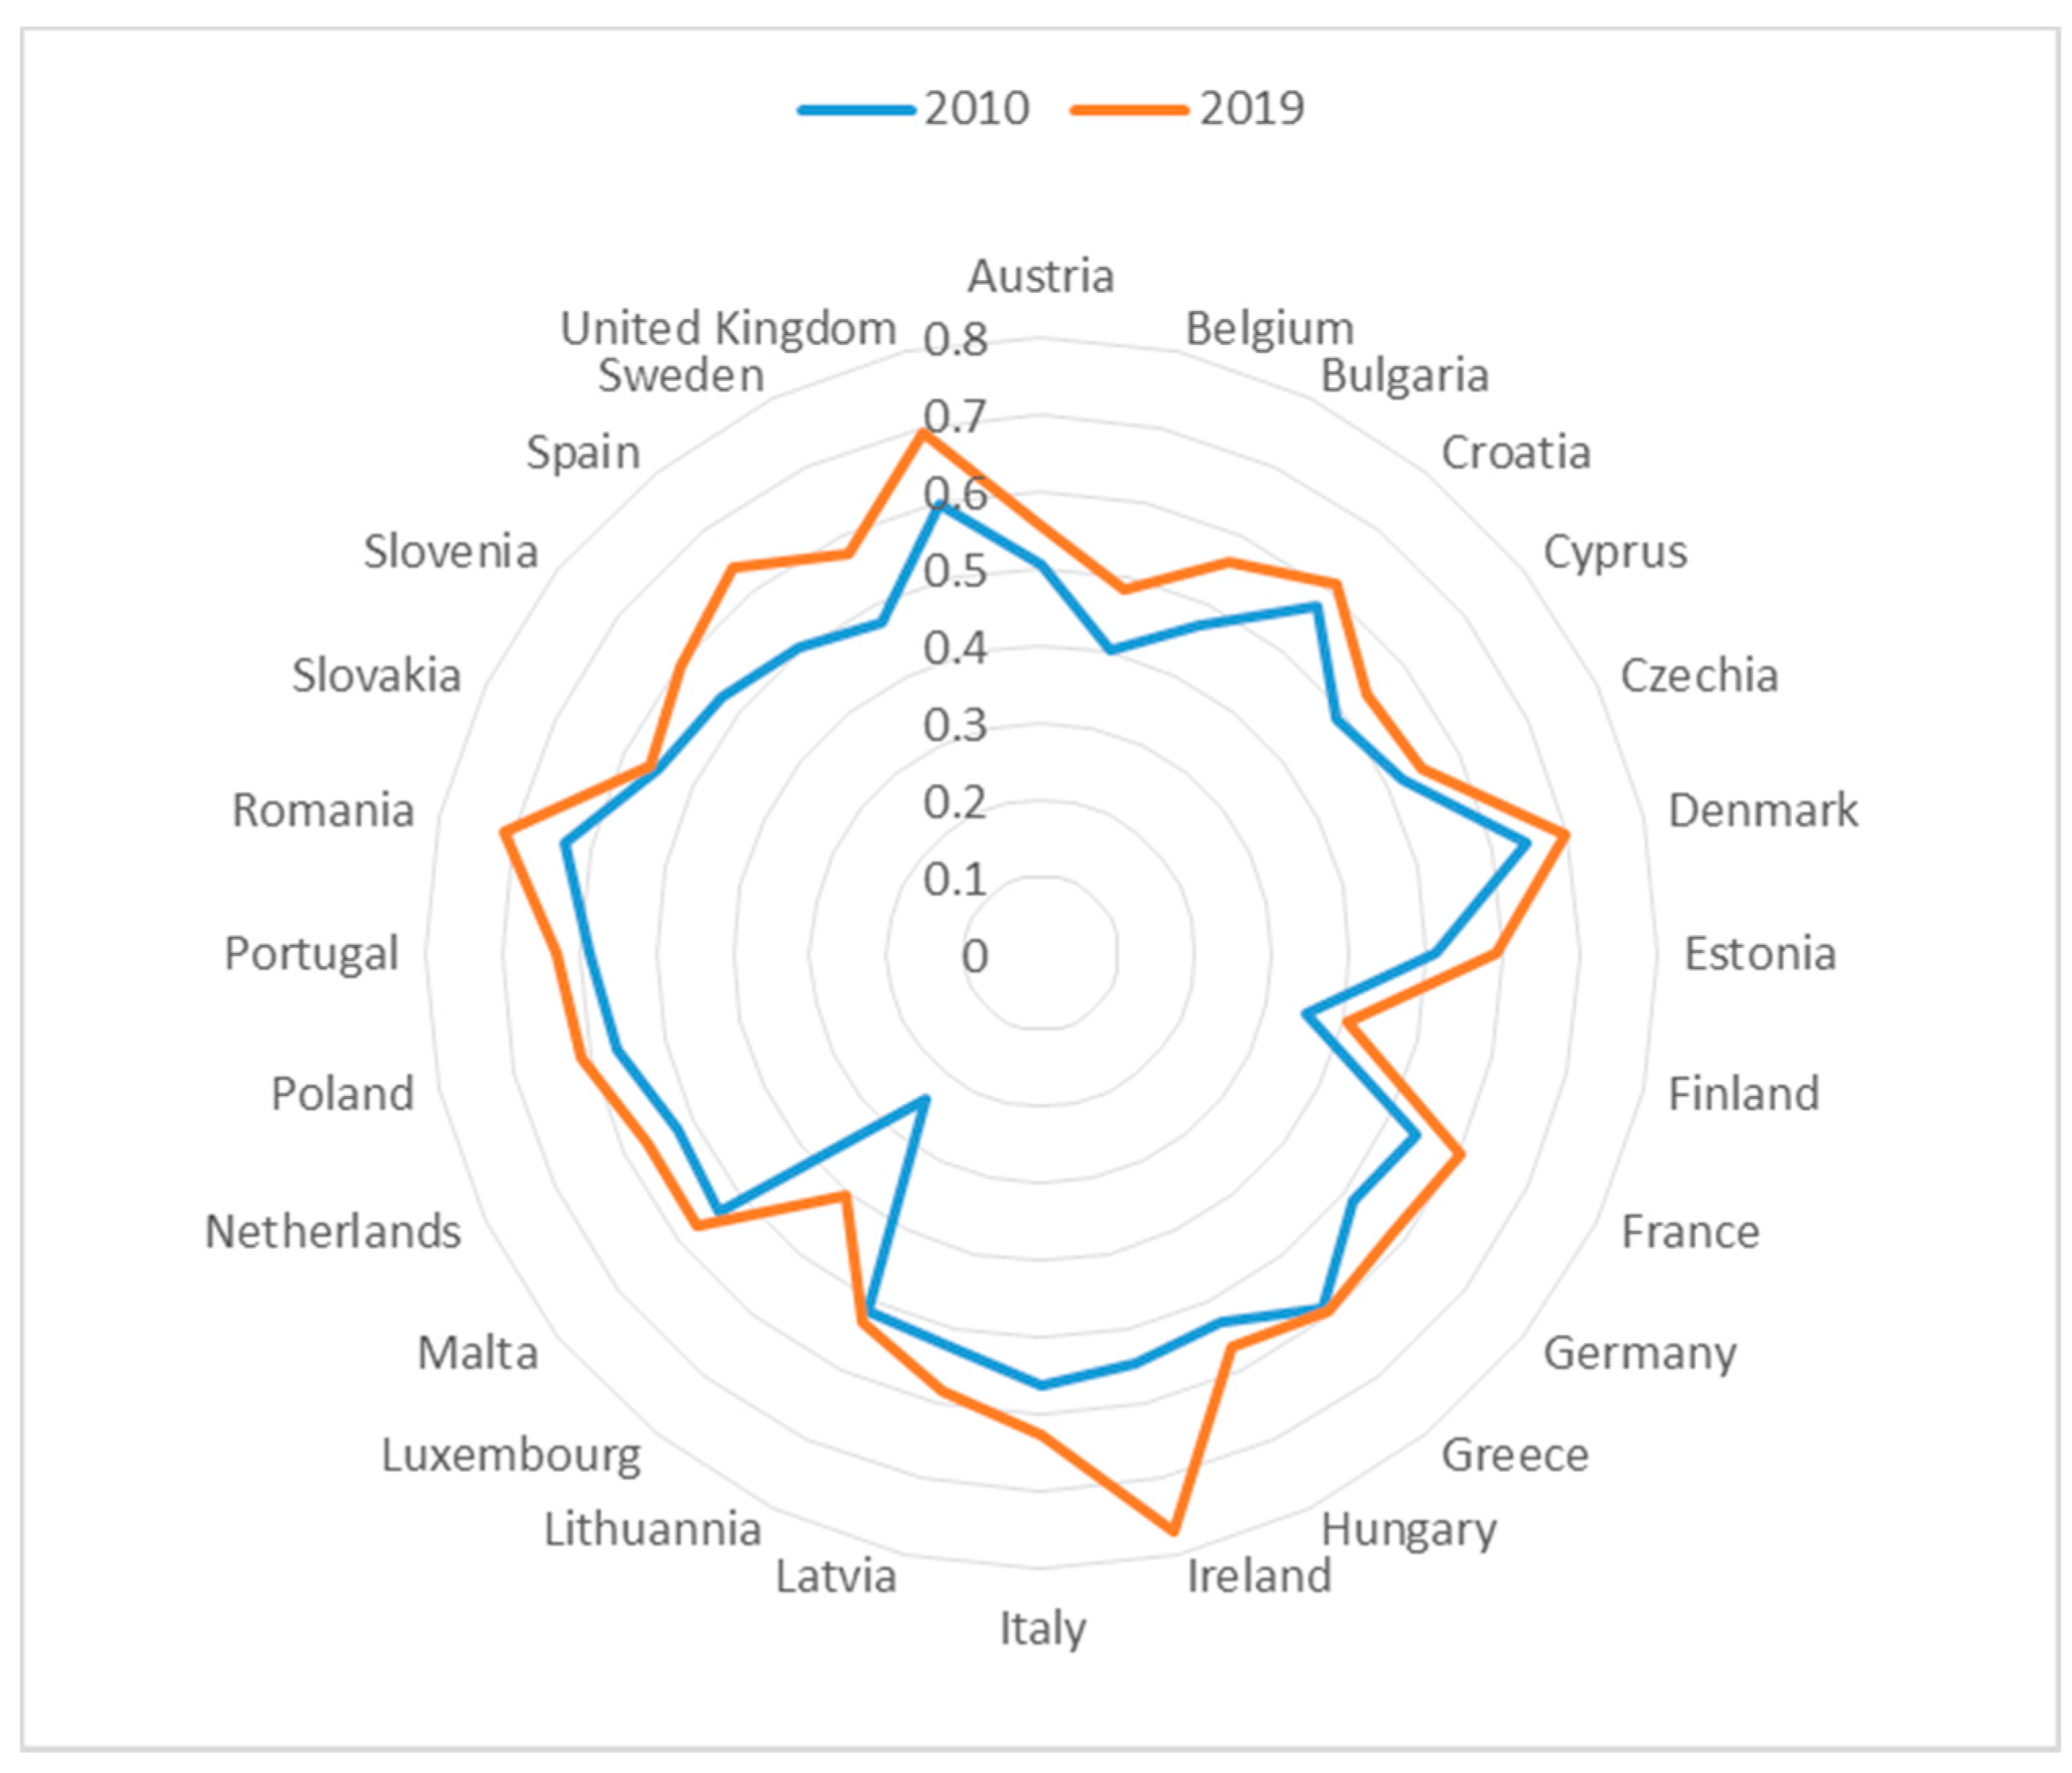
  • In 2019, IE, RO, UK and DK were the closest to the headline target 2 achievement, and FI and LU were the furthest. The achievements of other countries were varied. The target has not been achieved. Overall, energy productivity has increased in all countries, but not sufficiently. The key role of energy efficiency in achieving all climate/energy targets has, therefore, been recognized, and the “energy efficiency first” principle has been introduced in the strategic documents [71]. The leading initiative ‘Renovation’ serves to increase energy efficiency. It aims at improving energy and resource efficiency of public and private buildings, and to stimulate digital growth with home automation and smart metering, which will also help overcome the COVID-19 crisis.
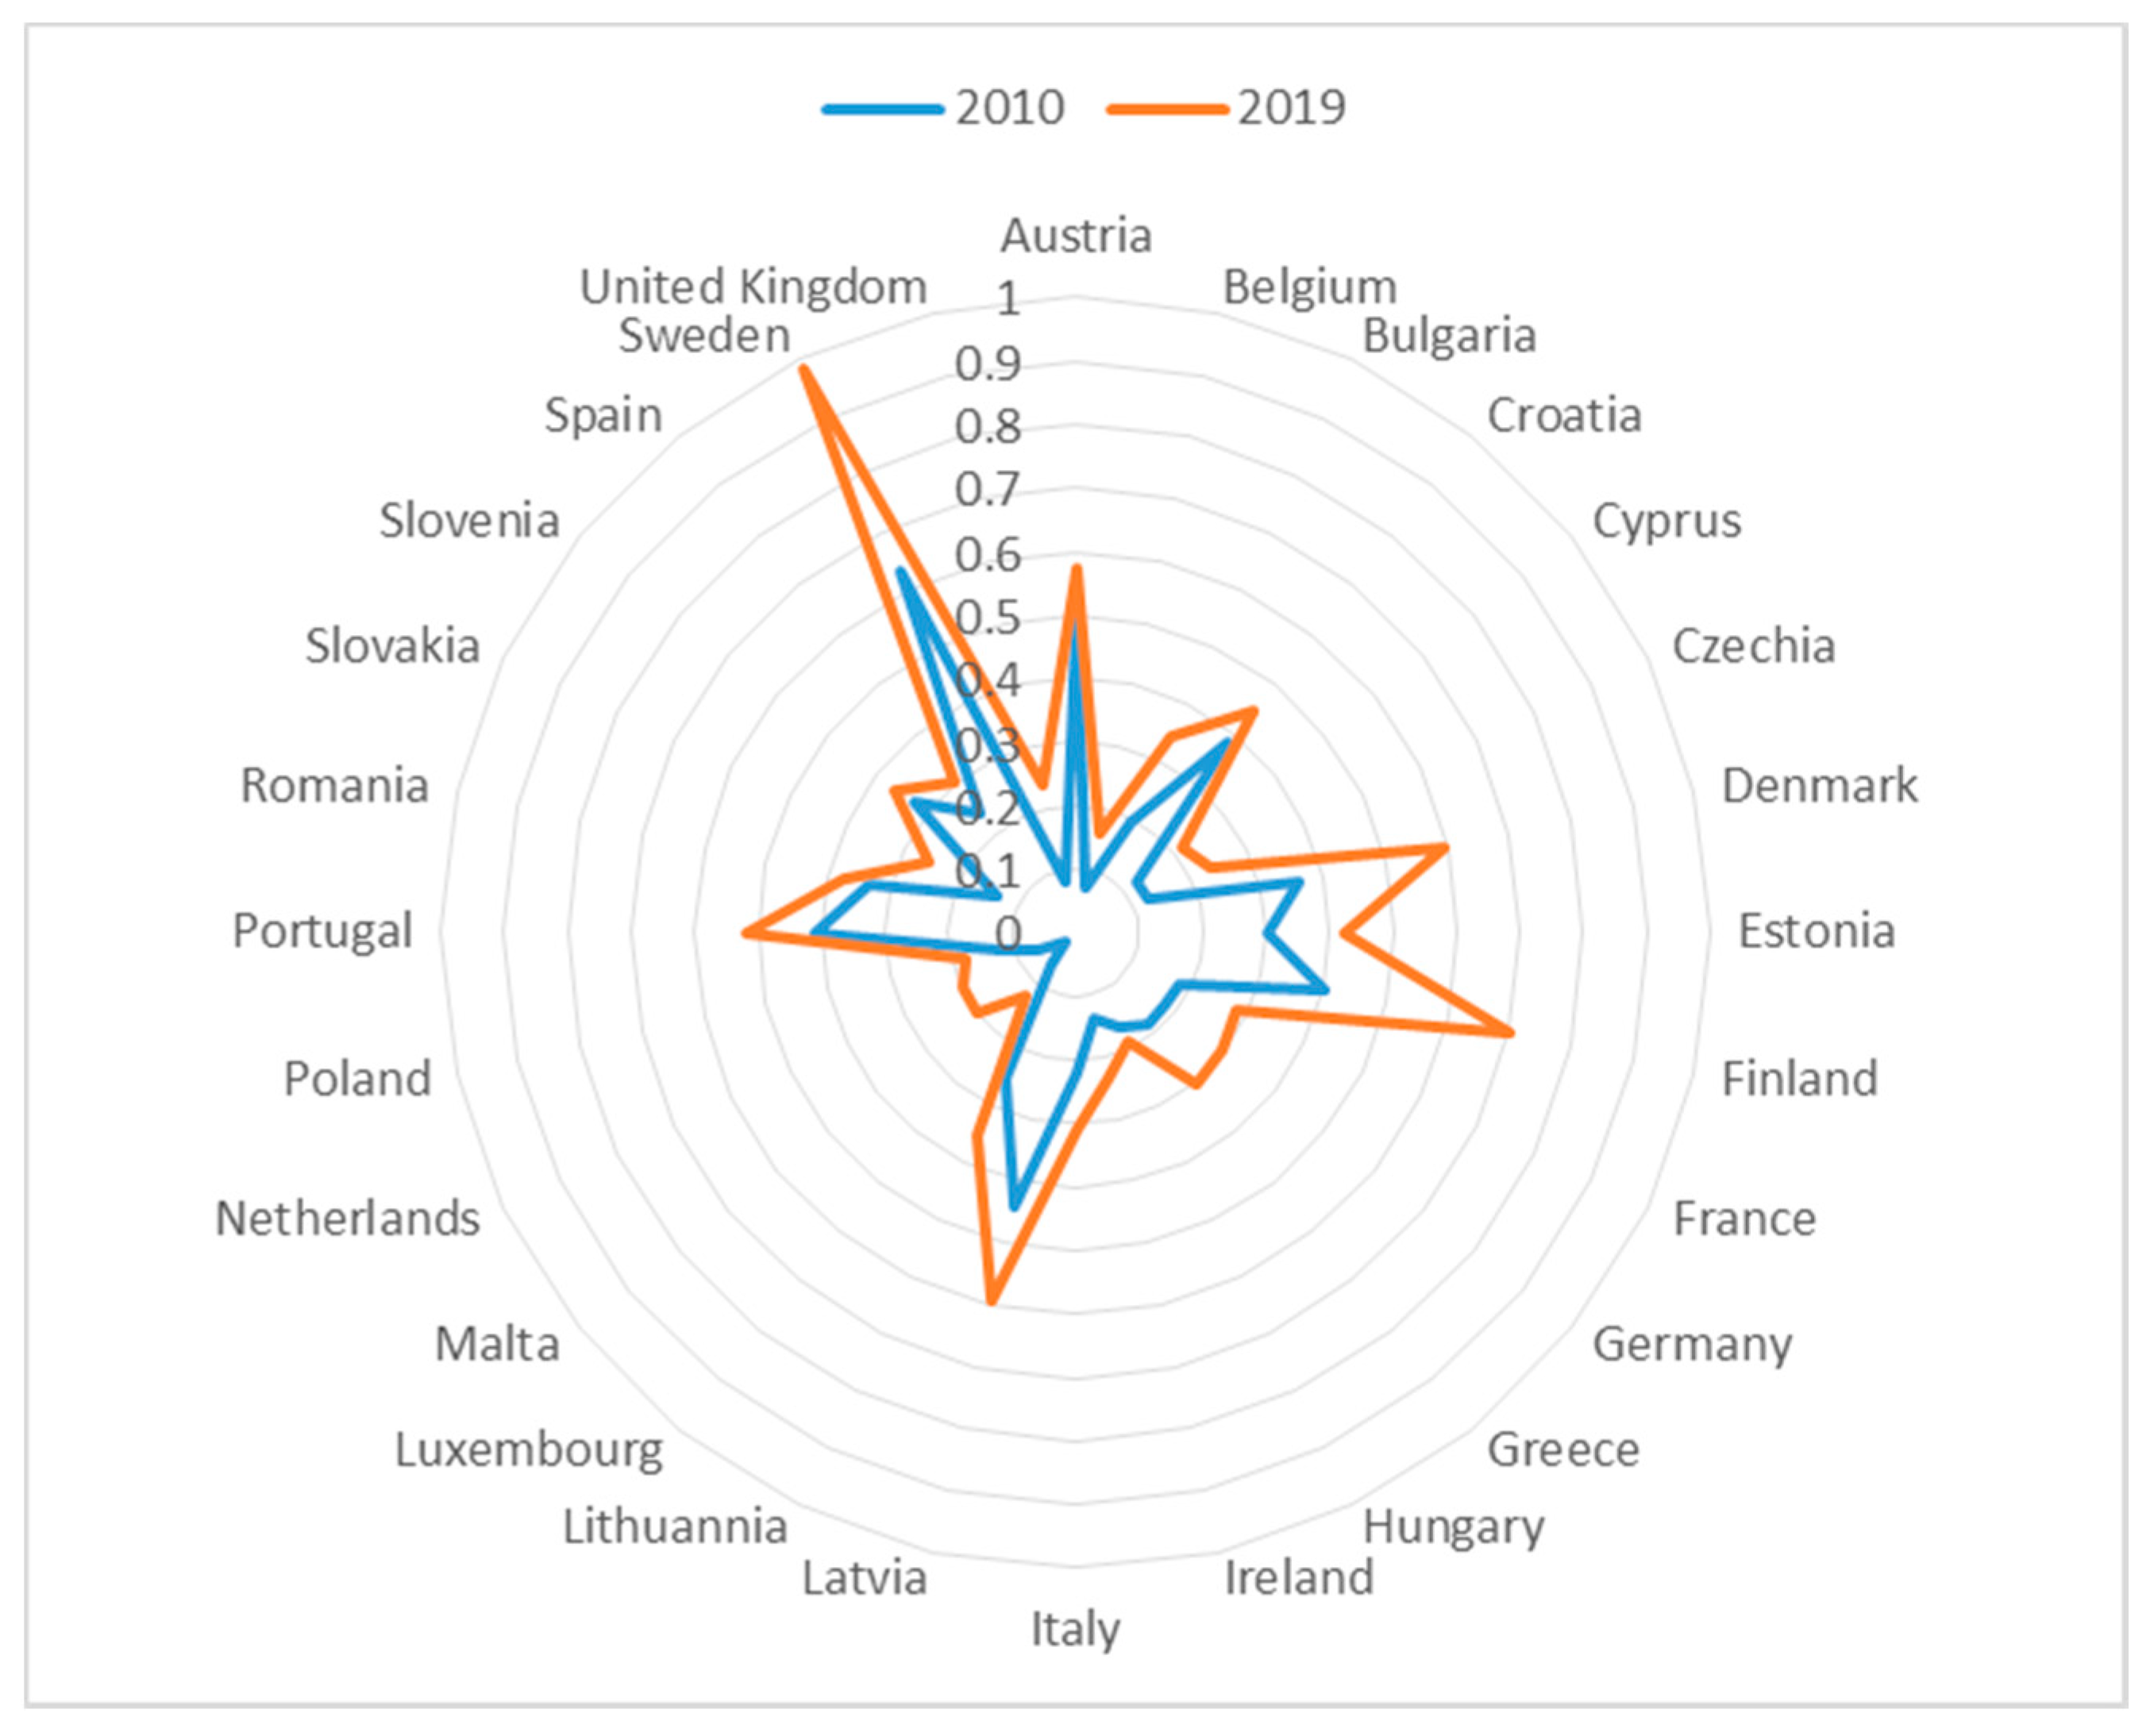
  • In 2019, 12 countries (SE, AT, BG, HR, DR, EE, FI, LV, LT, PT, RO, SI) achieved goal 3, 5 were close (GR, ES, IT, DE, FR), and 11 were at risk of not achieving it. On an EU scale, the share of renewable energy sources in total energy consumption was 18.9% and the EC report predicted that in 2020 it will reach 22.8%–23.1% [72]. The EU level, thus, the target will be met. It is currently known that most Member States will achieve their targets, with only 5 at risk of not achieving it. Member States are, therefore, encouraged to explore all possible use of cooperation mechanisms, including statistical transfers, to ensure the achievement of the binding national targets for 2020. The Commission stands ready to support this process, as well as the dialogue between Member States to conclude statistical agreements. In order to help achieve national contributions, an EU Renewable Energy Financing Mechanism has been agreed, allowing Member States to invest in renewable energy projects in return for a statistical attribution to a participating Member State.
  • Summing up, although the EU has already made significant progress in the implementation of climate/energy targets compared to other countries (it is a kind of leader in this area), achieving energy neutrality in 2050 requires a huge effort and appropriate management. It is difficult for decision-makers to influence national energy mixes with limited competences. Hence, the EU is increasingly turning to soft management methods with innovative “harder” elements [25] or harder soft management in the short term [32]. The inflexibility of the current regulatory framework can lead to ineffective and disproportionate regulation [73], which will hamper the achievement of the intended objectives.
This article presents only one option for assessing the implementation of the climate/energy targets of the Europe 2020 Strategy, but it would be interesting to examine the results taking into account new ways of mobilization to achieve them, or in relation to the financial outlays incurred (cost-effectiveness study).

Author Contributions

Conceptualization: B.K. and M.K.G.; Methodology: M.K.G.; validation: M.K.G.; formal analysis: B.K. and M.K.G.; resources: B.K.; writing: B.K.; writing—review and editing: B.K. and M.K.G.; visualization: M.K.G.; project administration: B.K. All authors have read and agreed to the published version of the manuscript.

Funding

The project is financed within the framework of the program of the Minister of Science and Higher Education under the name “Regional Excellence Initiative” in the years 2019–2022, project number 001/RID/2018/19, the amount of financing PLN 10,684,000.00.

Institutional Review Board Statement

Not applicable.

Informed Consent Statement

Not applicable.

Data Availability Statement

Not applicable.

Conflicts of Interest

The authors declare no conflict of interest.

References

  1. Stocker, T.F.; Qin, D.; Plattner, G.K.; Tignor, M.M.; Allen, S.K.; Boschung, J.; Midgley, P.M. Climate Change 2013: The Physical Science Basis. Contribution of Working Group I to the Fifth Assessment Report of IPCC the Intergovernmental Panel on Climate Change. Cambridge University Press: Cambridge, UK, 2014; pp. 11–14. [Google Scholar]
  2. UNFCCC, Kyoto Protocol to the United Nations Framework Convention on Climate Change; United Nations: New York, NY, USA, 1998.
  3. UNEP. Montreal Protocol on Substances that Deplete the Ozone Layer; 1522 UNTS 3; 26 ILM 1550; United Nations: New York, NY, USA, 1987. [Google Scholar]
  4. Dovi, V.; Battaglini, A. Energy Policy and Climate Change: A Multidisciplinary Approach to a Global Problem. Energies 2015, 8, 13473–13480. [Google Scholar] [CrossRef] [Green Version]
  5. Nordhaus, W. Climate Change: The Ultimate Challenge for Economics. Am. Econ. Rev. 2019, 109, 1991–2014. [Google Scholar] [CrossRef]
  6. Adamczewski, T.; Kassenberg, A.; Popkiewicz, M. Friendly Development of Poland. People—Economy—Environment; Substantive report; Institute for Sustainable Development: Warsaw, Poland, 2017; pp. 49–54. (In Polish) [Google Scholar]
  7. Nordhaus, W.D. The Climate Casino; Yale University Press: London, UK, 2013. [Google Scholar]
  8. UNFCCC, U.N. Framework Convention on Climate Change; United Nations: New York, NY, USA, 2009. [Google Scholar]
  9. European Commission. Europe 2020: A Strategy for Smart, Sustainable and Inclusive Growth; European Commission: Brussels, Belgium, 2010. [Google Scholar]
  10. Gregersen, C.; Mackie, J.; Torres, C. Implementation of the 2030 Agenda in the European Union: Constructing an EU approach to Policy Coherence for Sustainable Development. Eur. Center Policy Dev. Manag. 2016, 197, 41. [Google Scholar]
  11. Pasimeni, P. The Europe 2020 Index. Soc. Indic. Res. 2013, 110, 613–635. [Google Scholar] [CrossRef]
  12. Rappai, G. Europe En Route to 2020: A New Way of Evaluating the Overall Fulfillment of the Europe 2020 Strategic Goals. Soc. Indic. Res. 2016, 12, 77–93. [Google Scholar] [CrossRef]
  13. Kasprzyk, B.; Fura, B.; Wojanr, J. Measurement of the Implementation of Key Areas of the Europe 2020 Strategy in the EU-28 Countries. Econ. Stud. Sci. 2016, 276, 59–170. (In Polish) [Google Scholar]
  14. Gatto, A.; Drago, C. A Taxonomy of Energy Resilience. Energy Policy 2020, 136, 111007. [Google Scholar] [CrossRef]
  15. Kryk, B. Measuring the Provision of Access to Sustainable Energy in the EU as a New Task of Modern Economics in Line with Agenda 2030. In Experimental and Quantitative Methods in Contemporary Economics; Springer: Cham, Switzerland, 2020; pp. 323–334. [Google Scholar]
  16. Guzowska, M.K.; Kryk, B. Implementation of the Social Goals of the Europe 2020 Strategy by EU Member States. Eur. Res. Stud. 2020, 23, 1213–1229. [Google Scholar]
  17. European Commission, Eurostat. EU SDG Indicator set 2021. In Result of the Review in Preparation of the 2021 Edition of the EU SDG Monitoring Report, Final Version of 15/01/2021; Directorate E: Sectoral and Regional Statistics; Eurostat: Luxembourg, 2021. [Google Scholar]
  18. Galeotti, M.; Salini, S.; Verdolini, E. Measuring Environmental Policy Stringency: Approaches, Validity, and Impact on Environmental Innovation and Energy Efficiency. Energy Policy 2020, 136, 111052. [Google Scholar] [CrossRef]
  19. IEA. Energy Policy Review; European Commission: Paris, France, 2020. [Google Scholar]
  20. Kryk, B. Providing Sustainable Energy in Poland in Comparison to the European Union in Light of the Seventh Goal of the 2030 Agenda. Ekon. Sr. 2019, 1, 22–36. [Google Scholar]
  21. Nordhaus, W. Integrated Assessment Models of Climate Change. NBER Rep. 2017, 3, 16–20. [Google Scholar]
  22. Capros, P.; Kannavou, M.; Evangelopoulou, S.; Petropoulos, A.; Siskos, P.; Tasios, N.; Zazias, G.; DeVita, A. Outlook of the EU Energy System up to 2050: The Case of Scenarios Prepared for European Commission`s “Clean Energy for All Europeans” Package Using the PRIMES Model. Energy Strategy Rev. 2018, 22, 255–263. [Google Scholar] [CrossRef]
  23. Fotiou, T.; de Vita, A.; Capros, P. Economic-Engineering Modelling of the Buildings Sector to Study the Transition towards Deep Decarbonisation in the EU. Energies 2019, 12, 2745. [Google Scholar] [CrossRef] [Green Version]
  24. Knodt, M.; Schoenefeld, J.J. Harder Soft Governance in European Climate and Energy Policy: Exploring a New Trend in Public Policy. J. Environ. Policy Plan. 2020, 22, 761–773. [Google Scholar] [CrossRef]
  25. Ringel, M.; Knodt, M. The governance of the European Energy Union: Efficiency, Effectiveness and Acceptance of the Winter Package 2016. Energy Policy 2018, 112, 209–220. [Google Scholar] [CrossRef]
  26. European Commission. Report on the State of the Energy Union Pursuant to Regulation (EU) 2018/1999 on Governance of the Energy Union and Climate Action; Final report, COM(2020) 950 final; Publisher European Commission: Brussels, Belgium, 14 October 2020. [Google Scholar]
  27. Adoption of the Paris Agreement, Framework Convention on Climate Change; United Nations FCCC Int. FCCC/CP/2015/L.9; United Nations: Paris, France, 12 December 2015.
  28. Perzyński, M. Porozumienie Paryskie Kończy Pięć Lat. Oto Jego Wzloty I Upadki. 2020. Available online: https://biznesalert.pl/porozumienie-paryskie-2015-podsumowanie-cop21-polityka-klimatyczna/ (accessed on 20 March 2021). (In Polish).
  29. European Commission. Clean Energy for all Europeans; Publications Office of the European Union: Luxembourg, 2019. [Google Scholar]
  30. European Commission. Kick-Starting the Journey towards a Climate-Neutral Europe by 2050; EU Climate Action Progress Report; European Commission: Brussels, Belgium, November 2020. [Google Scholar]
  31. Wróbel, P. Small steps to Big changes. The impact of the Clean Energy for All Europeans package on energy. Energy Forum: Warsaw, Poland, 2019; pp. 5–26. (In Polish) [Google Scholar]
  32. Schoenefeld, J.; Jordan, A.J. Towards harder soft governance? Monitoring climate policy in the EU. J. Environ. Policy Plan. 2020, 22, 774–786. [Google Scholar]
  33. Sobolewski, M. Clean Energy for All Europeans—A New Initiative in the Field of EU Energy Policy. Studia BAS 2017, 3, 115–135. (In Polish) [Google Scholar]
  34. Long-Term Low Greenhouse Gas Emission Development Strategy of the European Union and Its Member States—Submission to the UNFCCC on Behalf of the European Union and Its Member States; 5 March 2020 (OR. en) 6612/20; Council of the European Union: Brussels, Belgium, 2020.
  35. A Clean Planet for all A European Strategic Long-Term Vision for a Prosperous, Modern, Competitive and Climate Neutral Economy; COM (2018) 773 final; European Commission: Brussels, Belgium, 2018.
  36. Resolution European Parliament of 15 January 2020 on the European Green Deal (2019/2956 (RSP); European Parliament: Strasbourg, France, 2020.
  37. Petri, F. Revisiting EU Climate and Energy Diplomacy: A Starting Point for Green Deal Diplomacy? Eur. Policy Brief. 2020, 65, 1–9. [Google Scholar]
  38. Resolution European Parliament Resolution of 14 March 2019 on Climate Change—A European Strategic Long-Term Vision for a Prosperous, Modern, Competitive and Climate Neutral Economy in Accordance with the Paris Agreement (2019/2582(RSP)); European Parliament: Strasbourg, France, 2019.
  39. Balcerzak, A.P. Europe 2020 Strategy and Structural Diversity Between Old and New Member States. Application of Zero-Unitarizatin Method for Dynamic Analysis in the Years 2004–2013. Econ. Sociol. 2015, 8, 190. [Google Scholar] [CrossRef] [PubMed]
  40. Bere, R.C.; Bucerzan, I. Cluster Analysis on Cohesion Policy Towards Europe 2020 Strategy for Smart, Sustainable and Inclusive Growth. Rom. Stat. Rev. 2015, 63, 95–111. [Google Scholar]
  41. Çolak, M.S.; Ege, A. An Assessment of EU 2020 Strategy: Too Far to Reach? Soc. Indic. Res. 2013, 110, 659–680. [Google Scholar] [CrossRef]
  42. Fura, B.; Wojnar, J.; Kasprzyk, B. Ranking and Classification of EU Countries Regarding their Levels of Implementation of the Europe 2020 Strategy. J. Clean. Prod. 2017, 165, 968–979. [Google Scholar] [CrossRef]
  43. Hobza, A.; Mourre, G. Quantifying the Potential Macroeconomic Effects of the Europe 2020 Strategy: Stylised Scenarios. Directorate General Economic and Financial Affairs (DG ECFIN); European Commission: Brussels, Belgium, 2010. [Google Scholar]
  44. Kėdaitienė, A.; Kėdaitis, V. Macroeconomic Effects of the Europe 2020 Strategy. Soc. Tyrim. 2012, 4, 5–19. [Google Scholar]
  45. Naldi, L.; Nilsson, P.; Westlund, H.; Wixe, S. What Is Smart Rural Development? J. Rural. Stud. 2015, 40, 90–101. [Google Scholar] [CrossRef]
  46. Paprotny, D. Measuring Central and Eastern Europe’s Socio-Economic Development Using Time Lags. Soc. Indic. Res. 2016, 127, 939–957. [Google Scholar] [CrossRef] [Green Version]
  47. Pasimeni, F.; Pasimeni, P. An Institutional Analysis of the Europe 2020 Strategy. Soc. Indic. Res. 2016, 127, 1021–1038. [Google Scholar] [CrossRef]
  48. Radulescu, M.; Fedajev, A.; Sinisi, C.I.; Popescu, C.; Iacob, S.E. Europe 2020 Implementation as Driver of Economic Performance and Competitiveness. Panel analysis of CEE countries. Sustainability 2018, 10, 566. [Google Scholar] [CrossRef] [Green Version]
  49. Stec, M.; Grzebyk, M. The Implementation of the Strategy Europe 2020 Objectives in European Union Countries: The Concept Analysis and Statistical Evaluation. Qual. Quant. 2018, 52, 119–133. [Google Scholar] [CrossRef] [Green Version]
  50. Szymańska, A.; Zalewska, E. Towards the Goals of the Europe 2020 Strategy: Convergence or Divergence of the European Union Countries? Comp. Econ. Res. 2018, 21, 67–82. [Google Scholar] [CrossRef] [Green Version]
  51. Walheer, B. Decomposing the Europe 2020 Index. Soc. Indic. Res. 2018, 140, 875–905. [Google Scholar] [CrossRef]
  52. Bonsinetto, F.; Falco, E. Analysing Italian Regional Patterns in Green Economy and Climate Change. Can Italy Leverage on Europe 2020 Strategy to Face Sustainable Growth Challenges? J. Urban. Reg. Anal. 2013, 5, 123. [Google Scholar] [CrossRef]
  53. Banelienė, R. Evaluation of the Efficiency of Economic Policy under the Europe-2020 Strategy in Small European Union Countries. Ekonomika 2013, 92, 7–19. [Google Scholar] [CrossRef] [Green Version]
  54. Becker, W.; Norlén, H.; Dijkstra, L.; Athanasoglou, S. Wrapping Up the Europe 2020 Strategy: A Multidimensional Indicator Analysis. Environ. Sustain. Indic. 2020, 8, 100075. [Google Scholar] [CrossRef]
  55. Duran, J.; Golušin, M.; Munitlak, I.O.; Jovanović, L.; Andrejević, A. Renewable Energy and Socio-Economic Development in the European Union. Probl. Ekorozw. 2013, 8, 105–114. [Google Scholar]
  56. Klessmann, C.; Held, A.; Rathmann, M.; Ragwitz, M. Status and Perspectives of Renewable Energy Policy and Deployment in the European Union—What Is Needed to Reach the 2020 Targets? Energy Policy 2011, 39, 7637–7657. [Google Scholar] [CrossRef]
  57. Liobikienė, G.; Butkus, M. The European Union Possibilities to Achieve Targets of Europe 2020 and Paris Agreement Climate Policy. Renew. Energy 2017, 106, 298–309. [Google Scholar] [CrossRef]
  58. Nagy, K.; Körmendi, K. Use of Renewable Energy Sources in Light of the “New Energy Strategy for Europe 2011–2020”. Appl. Energy 2012, 96, 393–399. [Google Scholar] [CrossRef]
  59. Szulecki, K. European Energy Governance and Decarbonization Policy: Learning from the 2020 Strategy. Clim. Policy 2016, 16, 543–547. [Google Scholar] [CrossRef]
  60. Staníčková, M. Can the Implementation of the Europe 2020 Strategy Goals Be Efficient? The Challenge for Achieving Social Equality in the European Union. Equilib. Q. J. Econ. Econ. Policy 2017, 12, 383–398. [Google Scholar]
  61. Yotova, L.; Stefanova, K. Efficiency of Tertiary Education Expenditure in CEE Countries: Data Envelopment Analysis. Econ. Altern. J. 2017, 25, 352–364. [Google Scholar]
  62. Hellwig, Z. Application of the Taxonomic Method to the Countries Typology According to Their Level of Development and the Structure of Resources and Qualified Staff. Przegląd Stat. 1968, 4, 307–326. [Google Scholar]
  63. Bąk, I.; Cheba, K.; Szczecińska, B. The Statistical Analysis of Road Traffic in Cities of Poland. Transp. Res. Procedia 2019, 39, 14–23. [Google Scholar] [CrossRef]
  64. Kukula, K.; Bogocz, D. Zero Unitarization Method and Its Application in Ranking Research in Agriculture. Econ. Reg. Stud. 2014, 7, 5–13. [Google Scholar]
  65. Kukuła, K. The Method of Zero Unitarization in the Background of Chosen Normalization Methods. Acta Sci. Acad. Ostroviensis 1999, 4, 5–31. [Google Scholar]
  66. Zadrąg, R.; Kniaziewicz, T. Utilization of the Zero Unitarization Method for the Building of a Ranking for Diagnostic Marine Engine Parameters. Combust. Engines 2017, 171, 44–50. [Google Scholar] [CrossRef]
  67. Gabbatiss, J. In-depth Q & A: Why Ireland Is ‘Nowhere Near’ Meeting Its Climate-Change Goals. Available online: https://www.carbonbrief.org/bonn-climate-talks-key-outcomes-from-june-2019-un-climate-conference (accessed on 22 February 2021).
  68. Sobczyk, W.; Sobczyk, E.J. Varying the Energy Mix in the EU-28 and in Poland as a Step towards Sustainable Development. Energies 2021, 14, 1502. [Google Scholar] [CrossRef]
  69. Brożyna, J.; Strielkowski, W.; Formina, A.; Nikitina, N. Renewable Energy and EU 2020 Target for Energy Efficiency in the Czech Republic and Slovakia. Energies 2020, 13, 965. [Google Scholar] [CrossRef] [Green Version]
  70. Zangheri, P.; Economidou, M.; Labanca, N. Progress in the Implementation of the EU Energy Efficiency Directive through the Lens of the National Annual Reports. Energies 2019, 12, 1107. [Google Scholar] [CrossRef] [Green Version]
  71. Thema, J.; Suerkemper, F.; Couder, J.; Mzavanadze, N.; Chatterjee, S.; Teubler, J.; Thomas, S.; Ürge-Vorsatz, D.; Bo Hansen, M.; Bouzarovski, S.; et al. The Multiple Benefits of the 2030 EU Energy Effiency Potential. Energies 2019, 12, 2798. [Google Scholar] [CrossRef] [Green Version]
  72. Renewable Energy Progress Report; Final report, COM(2020) 952 final; European Commission: Brussels, Belgium, 2020.
  73. Vitéz, B.; Lavrijssen, S. The Energy Transition: Democracy, Justice and Good Regulation of the Heat Market. Energies 2020, 13, 1088. [Google Scholar] [CrossRef] [Green Version]
Figure 1. Timeline of EU initiatives /documents in the field of climate change and energy. Source: own study based on EU documents.
Energies 14 02711 g001
Figure 2. The average level of the set fulfilment climate/energy targets of Euro 2020 strategy in case of the EU28 in the years 2010 and 2019.
Energies 14 02711 g002
Figure 3. The average level of fulfilment of headline target 1 of Europa 2020 Strategy (20% reduction in greenhouse gas emissions compared to 1990, as much as 30% possible) in case of the EU28 in the years 2010 and 2019.
Energies 14 02711 g003
Figure 4. The average level of fulfilment of headline target 2 of Europa 2020 Strategy (Increasing energy efficiency by 20%) in case of the EU28 in the years 2010 and 2019.
Energies 14 02711 g004
Figure 5. The average level of fulfilment of headline target 3 of Europa 2020 Strategy (Increasing the share of renewable energy sources in total energy consumption to 20 %.) in case of the EU28 in the years 2010 and 2019.
Energies 14 02711 g005
Table 1. Set of variables.
Designation of VariableName of VariableCharacter of Variable
Headline target 1. 20% reduction in greenhouse gas emissions compared to 1990, as much as 30% possible) in case of the EU28 in the years 2010 and 2019
x 1 t Greenhouse gas emissions (in CO2 equivalent) 1990 r = 100.destimulant 1
x 2 t Greenhouse gas emissions tonnes per capita—indicator adopted by the authorsdestimulant
x 3 t Greenhouse gas emissions intensity of energy consumption.destimulant
x 4 t Average CO2 emissions per km from new passenger cars (g CO2 per km)—indicator adopted by the authorsdestimulant
Headline target 2. Increasing energy efficiency by 20%
x 5 t Primary energy consumption tonnes of oil equivalent per capita (TOE/per capita).destimulant
x 6 t Primary energy consumption tonnes of oil equivalent per capita (TOE/per capita)—indicator adopted by the authorsdestimulant
x 7 t Final energy consumption in households per capita (kg of oil equivalent).destimulant
x 8 t Energy productivity (Euro per kilogram of oil equivalent—KGOE).stimulant 2
x 9 t Energy productivity purchasing power standard (PPS) per kilogram of oil equivalent—indicator adopted by the authorsstimulant
x 10 t Population unable to keep home adequately warm by poverty status (% of the population).destimulant
x 11 t Energy dependence by-product (% of imports in total energy consumption).destimulant
Headline target 3. Increasing the share of renewable energy sources in total energy consumption to 20 %
x 12 t Share of renewable energy in gross final energy consumption by sector (%).stimulant
x 13 t Renewable energy sources in transport—indicator adopted by the authors (%).stimulant
x 14 t Renewable energy sources in electricity—indicator adopted by the authors (%).stimulant
x 15 t Renewable energy sources in heating and cooling—indicator adopted by the authors (%).stimulant
1 In case of negative character of variable (destimulants) X j s for every two values x i , j s , x k , j s that refer to objects O i , O k the relation x i , j s < x k , j s O i O k is fulfilled, where means that object O k is preferred to O i . In that case minimum value of variable is preferred. 2 In case of benefit variables (stimulants) X j s for every two values x i , j s , x k , j s that refer to objects O i , O k , the relation x i , j s > x k , j s O i O k , is fulfilled, where means that object O i is preferred to O k . In that case a maximum value of variable is preferred.
Table 2. The result of multivariate analysis of the set fulfilment of the assumed package of climate/energy targets Europe 2020 strategy in the years 2010 and 2019 1,2.
20102019
No.Co.SMNo.Co.SM
I—Countries with Very High Level of Synthetic Measure of Fulfillment Aims of the Strategy
1Portugal (PT)0.7424861Sweden0.709857
2Denmark (DK)0.7016432Denmark0.681427
3Romania (RO)0.6553063Romania0.601015
4Sweden (SE)0.639199
II—Countries with a High Level of Synthetic Measure of Fulfillment Aims of the Strategy
5Italy (IT)0.6331144Latvia0.57608
6Austria (AT)0.6271945Portugal0.569369
7Croatia (HR)0.6088146Croatia0.562657
8Spain (ES)0.5932927Ireland0.532374
9Ireland (IE)0.5854228UK0.52752
10UK (UK)0.5827379Malta0.523469
11Greece (GR)0.57095310Austria0.521677
12Latvia (LV)0.56819811France0.515358
13France (FR)0.56809812Finland0.514158
13Italy0.513276
14Spain0.497715
15Slovenia0.494183
16Greece0.493617
III—Countries with an Average Level of Synthetic Measure of Fulfillment Aims of the Strategy
14Slovenia (SI)0.53831917Estonia0.475449
15Slovakia (SK)0.53482418Slovakia0.452848
16Hungary (HU)0.53231019Hungary0.446346
17Lithuannia (LT)0.52888120Germany0.445326
18Germany (DE)0.51163621Netherlands0.444384
19Czechia (CZ)0.50955922Czechia0.440135
20Malta (MT)0.5068823Bulgaria0.432048
21Cyprus (CY)0.48667824Lithuannia0.425966
22Bulgaria (BG)0.48181525Poland0.422964
23Poland (PL)0.465848
IV—Countries with a Low Level of Synthetic Measure of Fulfillment Aims of the Strategy
24Netherlands (NL)0.45701726Belgium0.373153
25Estonia (EE)0.44254227Cyprus0.335906
26Finland (FI)0.43347728Luxembourg0.222652
27Belgium (BE)0.381499
28Luxembourg(LU)0.279308
1 For Croatia, for variable x4, due to lack of data in 2010, data from 2013 were used. 2 For variables x1, x2 and x4 due to lack of data for 2019, data for 2018 were used.
Publisher’s Note: MDPI stays neutral with regard to jurisdictional claims in published maps and institutional affiliations.

